


Abstract
In China’s Huaibei Plain, summer soybean and maize compete for land due to highly overlapping growing seasons. This study employs the DSSAT model under full irrigation to assess crop climatic adaptability and sowing date optimization across a baseline (2001–2020) and two future emission scenarios (SSP2-4.5 and SSP5-8.5, 2031–2050) under 13 sowing-date treatments, with 10 June as the conventional sowing date for both crops. Results indicate that future summer growing seasons will become warmer and wetter overall. Relative to the baseline, conventional sowing under future climates leads to shortened growth periods and synchronous yield declines, with maize suffering substantially larger yield losses than soybean. Sowing date optimization effectively mitigates these climate-induced yield losses, with recommended adjustments of advancing soybean by 10–15 days and delaying maize by 20 days. Following optimization, maize yield surpasses the baseline by 8.2% under SSP2-4.5 and recovers to near-baseline levels under SSP5-8.5, while soybean yield remains comparable to the baseline under SSP2-4.5 and slightly below it under SSP5-8.5. Maize maintains clear advantages in grain yield and net return, whereas soybean has higher irrigation water economic efficiency, defined as the irrigated–rainfed net return difference per unit irrigation water. Under these simulated full-irrigation conditions, we suggest maintaining a maize-dominant pattern with moderate soybean allocation and optimized sowing dates for both crops as a scenario-based reference for enhancing regional climate adaptability.
1. Introduction
The Huaibei Plain is a core grain-producing area in China’s Huang-Huai-Hai region. Summer soybean and maize are the predominant grain crops in this region, with largely overlapping growing seasons spanning from mid-June to late September [1]. Currently, the region maintains a maize-dominant summer cropping pattern, where maize occupies the majority of arable land as the staple grain, while soybean serves as a supplementary crop for production diversification and rotation [2]. Given the direct competition between these two crops for limited arable land, farmers must make annual planting decisions during the summer season, which directly determine the regional cropping structure. Over the past five decades, the Huaibei Plain has experienced significant warming at a rate of approximately 0.20–0.25 °C per decade, whereas precipitation exhibits a weak and spatially heterogeneous trend with pronounced seasonal and interannual variability [3,4,5]. Consequently, the stress imposed by climate change on regional agricultural production has become increasingly pronounced [6,7].
Globally, the negative impacts of climate change on crop production have been extensively documented [8]. However, owing to fundamental differences in photosynthetic carbon assimilation pathways between maize and soybean, the direction and magnitude of climate change impacts on these two crops may diverge substantially. As a C3 crop, soybean exhibits marked increases in net photosynthetic rate and water use efficiency under elevated atmospheric CO2 concentrations [9,10]. In contrast, maize is a C4 crop with a CO2-concentrating mechanism in its mesophyll cells, rendering it relatively insensitive to rising CO2 levels [11]. Meanwhile, the CO2 fertilization benefit for C3 crops is substantially attenuated under high-temperature conditions, because heat stress intensifies photorespiration and thereby offsets the positive effects of elevated CO2 [12]. Although C4 crops possess a more efficient photosynthetic system and generally show greater heat tolerance during vegetative growth, their reproductive stage is often the most heat-sensitive period, particularly around anthesis, pollination, and fertilization [13,14,15]. This asymmetry in physiological responses implies that neither crop holds an absolute advantage in overall adaptive capacity to climate change, making it an urgent scientific question to determine whether summer soybean or summer maize will be more advantageous under future climates.
A rigorous assessment of the adaptive capacity of these two crops to future climates requires comparison of their yield potentials under defined management conditions. Sowing date is a key controllable variable governing the realization of crop yield potential, and adjusting sowing date is one of the most practical and effective strategies for approaching that potential [16]. Optimizing sowing timing aligns critical developmental stages with the temporal distribution of regional hydrothermal resources, thereby mitigating adverse conditions and enhancing yield formation [17,18]. This approach is now widely recognized as a key agronomic adaptation measure for coping with climate change [19]. In the Huaibei region, however, existing studies have predominantly focused on the climate response of individual crops, leaving a notable gap in comparative research between soybean and maize [20,21,22]. Even among the limited comparative studies that have incorporated sowing date treatments, few have compared the two crops in terms of their sowing-date-optimized yields under defined management conditions, resulting in a lack of systematic consideration of the regulatory potential offered by sowing date optimization.
Process-based crop models provide an effective means to address the aforementioned scientific questions [23]. The Decision Support System for Agrotechnology Transfer (DSSAT) is one of the most widely used crop modeling systems worldwide, as it comprehensively simulates the interactions among climate, soil, field management, and cultivar characteristics, offering distinct advantages for quantitative assessments of climate change impacts [24,25]. A key strength of DSSAT lies in its ability to simulate the regulatory effects of changes in atmospheric CO2 concentration on crop physiological processes, making it particularly suitable for evaluating the differential responses of C3 and C4 crops under future elevated CO2 scenarios [25]. Specifically, the CERES-Maize and CROPGRO-Soybean modules within DSSAT have been thoroughly parameterized and calibrated for the physiological and developmental traits of maize and soybean, respectively [24]. Numerous studies have employed DSSAT to investigate the responses of soybean and maize to future climate change under varying sowing dates [26,27]. Moreover, the applicability of this model for simulating summer soybean and summer maize growth in the study area has been confirmed, providing a robust methodological foundation for the present research [28,29].
To address the aforementioned research gaps, this study employs the CERES-Maize and CROPGRO-Soybean modules of the DSSAT model, with the Huaibei Plain as the study region. Multiple climate scenarios and sowing date treatments were designed to simulate phenological development, yield formation, and water consumption dynamics for both crops. The novelty of this study lies in a comparative assessment of summer soybean and summer maize under crop-specific sowing-date optimization, while jointly considering yield, water use, and economic outcomes. We test two hypotheses: (i) soybean will exhibit greater yield stability under future climate owing to its C3 response to elevated CO2 and (ii) maize will achieve stronger yield recovery through sowing-date adjustment because its reproductive period can be shifted away from peak heat stress. The analysis first compares the yield responses of the two crops to future climate change under conventional sowing dates. We then conduct multi-sowing-date simulations to evaluate each crop’s yield potential, water use efficiency, and economic returns under future climate scenarios. Building on these analyses, we clarify the comparative advantages of summer soybean and summer maize under future climatic conditions and provide a scenario-based reference for crop and sowing-date adaptation under simulated full-irrigation conditions rather than a general farm-level recommendation.
2. Materials and Methods
2.1. Study Area
The Huaibei Plain is located in northern Anhui Province, China (114°55′–118°10′ E, 32°25′–34°35′ N). It lies within a warm temperate semi-humid monsoon climate zone and occupies a transitional belt between northern and southern climates. The region has a long-term mean annual temperature of 15 °C, with annual precipitation ranging from 770 to 950 mm, of which 60–70% occurs during June–September [30]. The combination of light, heat, and water resources is favorable for the growth of summer soybean and summer maize. The predominant soil types are fluvo-aquic soil and lime concretion black soil. Lime concretion black soil is widely distributed in Anhui Province, accounting for 62% of the total area of similar soils in China [31], and serves as the dominant agricultural soil across the plain. The dominant cropping system is a winter wheat–summer soybean/summer maize double-cropping rotation. Traditionally, summer maize is sown in early June and summer soybean in early to mid-June; consequently, the growing seasons of these two crops largely overlap, spanning from mid-June to late September. Precipitation during the summer crop-growing season is concentrated, and natural rainfall generally meets crop water requirements, resulting in limited irrigation demand. For this study, the Xinmaqiao Agricultural Water Comprehensive Experimental Station (117°22′ E, 33°09′ N; Guzhen County, Bengbu City, Anhui Province) was selected as the representative study site. Long-term meteorological observations at this site record a mean annual precipitation of 910 mm, a mean pan evaporation of 916 mm, an annual mean temperature of 15.0 °C, a mean annual sunshine duration of 1850 h, and a mean relative humidity of 73%. The soil at the site is typical lime concretion black soil [28]. These conditions are consistent with the overall climatic characteristics of the Huaibei Plain, confirming the strong regional representativeness of the station.
2.2. Calibration and Validation of the DSSAT Model
2.2.1. Brief Description of the DSSAT Model
This study employed the DSSAT (version 4.8) crop modeling system. DSSAT integrates climate–soil–management–cultivar interactions to simulate crop phenological development, photosynthetic production, dry matter accumulation and partitioning, and yield formation at a daily time step, making it one of the most widely used crop simulation systems globally [24]. Within this framework, the CERES-Maize and CROPGRO-Soybean modules were used to simulate maize and soybean growth, respectively [28,29]. The CERES-Maize module is specifically designed for maize and captures the combined effects of cultivar traits, environmental conditions, and management practices—including sowing date, planting density, fertilization, and irrigation—on crop development and yield. It calculates dry matter accumulation using a canopy-scale radiation use efficiency approach, divides the growth cycle into vegetative, ear differentiation, anthesis, and grain-filling stages and determines developmental rates based on cultivar-specific genetic parameters and environmental drivers. The CROPGRO-Soybean module, originally derived from SOYGRO and subsequently refined, simulates soybean responses to temperature, water availability, photoperiod, and elevated CO2 concentrations. It employs a leaf-level photosynthesis framework and partitions assimilates to roots, stems, leaves, and grains via dynamic allocation coefficients, with phenology jointly regulated by genetic parameters and photo-thermal factors. DSSAT requires three categories of input data: daily weather (maximum and minimum temperatures, solar radiation, and precipitation), soil profile properties (texture, bulk density, organic carbon, and pH by layer), and field management records (sowing date, planting density, irrigation, and fertilization schedules). Regarding CO2 effects, DSSAT incorporates CO2 response functions for photosynthesis and stomatal conductance in both modules, allowing elevated CO2 to enhance carbon assimilation and reduce transpiration, with stronger effects typically simulated for C3 crops than for C4 crops. More details of DSSAT have been described by Boote et al. [32] and Jones et al. [24]. In summary, these physiological mechanisms render DSSAT suitable for quantifying the differential responses of maize and soybean to climate change and sowing date adjustments.
2.2.2. Model Calibration and Validation
In this study, the CERES-Maize and CROPGRO-Soybean modules within DSSAT were used to simulate the growth processes of summer maize and summer soybean in the study area. The two evaluated cultivars were Zea mays cv. Longping 206 (maize) and Glycine max cv. Zhonghuang 13 (soybean), both of which are widely adopted in local production across the Huaibei Plain. The field experiments used for model calibration and validation were conducted by Wei et al. [28,29] in 2016 and 2017 at the Xinmaqiao Agricultural Water Comprehensive Experimental Station described above (Figure 1). The experiments were conducted on lime concretion black soil, with a field capacity of 0.38 cm3 cm−3, wilting point of 0.12 cm3 cm−3, and bulk density of 1.36 g cm−3 in the 0–50 cm soil layer. In 2016, full irrigation was maintained throughout the entire growing season for model calibration, whereas rainfed conditions were imposed in 2017 for independent validation. The measured variables included daily soil water content (monitored at 10 cm intervals in the 0–40 cm soil profile), key phenological dates (anthesis and physiological maturity), aboveground dry matter biomass at harvest, and final grain yield. Detailed experimental design, field management, and measurement protocols are documented in Wei et al. [28,29].
Figure 1.
Location map of the study area and the representative experimental station in the Huaibei Plain, China.
All input datasets were formatted according to DSSAT requirements prior to model execution. Meteorological data, including daily maximum temperature, minimum temperature, precipitation, and solar radiation, were obtained from the automatic weather station at the experimental site. Soil physical and chemical properties for each layer (texture, bulk density, organic carbon content, pH, field capacity, and wilting point) were derived from pre-experimental soil sampling and laboratory analysis. Field management practices were recorded in detail based on actual plot operations. For summer maize, the final plant stand was 48,000 plants ha−1 after thinning (one seedling per hill), with a row spacing of 50 cm and a sowing depth of 5 cm. For summer soybean, sowing dates were 14 June 2016 and 9 June 2017; the final plant density was maintained at 300,000 plants ha−1 after thinning (one seedling per hill), with a row spacing of 40 cm, and sowing depth of 5 cm.
For both crop modules, parameter calibration was performed by Wei et al. [28,29] using the Generalized Likelihood Uncertainty Estimation (GLUE) algorithm implemented in DSSAT [33], with 10,000 iterations to ensure convergence of the posterior parameter distributions. For the CERES-Maize module, six cultivar-specific genetic parameters were optimized (parameter descriptions and calibrated values are provided in Table S1). The 2016 dataset was used for calibration, with anthesis date, maturity date, grain yield, and harvest dry matter as fitting targets, while the 2017 dataset served as an independent validation set. The calibrated cultivar coefficients were evaluated against both phenology and yield in the 2017 validation year. The same GLUE procedure was applied to the CROPGRO-Soybean module to optimize 12 cultivar genetic parameters (Table S1).
The previously calibrated and locally validated DSSAT cultivar parameters of Wei et al. [28,29], derived from one experimental station and two growing seasons, were adopted directly for the present scenario analysis without recalibration; complete calibration protocols and cultivar genetic coefficients are documented in those studies. Accordingly, the scenario results are interpreted as conditional relative responses under these calibrated coefficients rather than as spatially transferable absolute forecasts. Model performance was assessed using the average absolute relative error (ARE) and relative root mean square error (RRMSE), with lower values indicating better agreement, as follows: for CERES-Maize, simulated phenological stages (anthesis and physiological maturity) deviated from observations by no more than 4 days; grain yield simulation achieved an ARE of 2.54% for calibration and 1.90% for validation, with RRMSE values of 3.85% and 2.17%, respectively; aboveground dry matter at harvest had ARE values of 7.50% (calibration) and 5.01% (validation) and RRMSE values of 6.29% and 3.85%; and soil water content returned RRMSE ranges of 8.68–9.47% for the 0–20 cm layer and 8.84–9.76% for the 20–40 cm layer. For CROPGRO-Soybean, phenological prediction errors were likewise within 4 days, with average ARE values of 6.40%, 7.60%, and 6.90% for grain yield, aboveground biomass, and soil water content (0–40 cm), respectively. Across all variables, simulated daily dynamics aligned closely with field observations, and all accuracy metrics met commonly used criteria for good model performance (RRMSE < 10%), confirming that both calibrated modules perform reliably under the agro-climatic conditions of the Huaibei Plain and are suitable for subsequent scenario analyses.
It should be noted that this validation, including final grain yield, is based on one representative station, two dominant cultivars, and two growing seasons; it therefore supports site-representative, management-specific estimates rather than absolute field forecasts across the entire plain. Future projections also involve uncertainties arising from climate-model structure and internal variability, emission/CO2 pathways, crop-model parameters, and soil/management assumptions. These uncertainties are represented by the five-GCM ISIMIP3b ensemble with reported standard deviations, two SSPs, GLUE-based calibration, and the fixed full-irrigation/non-limiting-nutrient setting, respectively; thus, results should be interpreted as conditional, scenario-based estimates of relative responses and sowing-date effects rather than deterministic forecasts.
2.3. Scenario Simulation Setup
2.3.1. Data Sources for Scenario Simulations
Three categories of input data are required for the scenario simulations, including meteorological data, soil profile data and field management data.
- (1)
- Meteorological Data
This study employed two meteorological datasets to drive the DSSAT model: historical in situ observations for the baseline period and future climate projections. Both datasets include daily maximum temperature (Tmax), minimum temperature (Tmin), precipitation (Pre), and solar radiation (SR). Atmospheric CO2 concentration, which exerts a well-documented fertilization effect on crop growth and grain yield [34,35], was incorporated as an additional forcing variable matched to each climate scenario.
Historical daily meteorological data for the 20-year baseline period (2001–2020) were obtained from the Bengbu station, representative of the study area, through the China Meteorological Data Service Center (http://data.cma.cn, accessed on 5 January 2026). Since SR is not directly observed at this station, it was estimated from sunshine duration using the Angstrom formula described in FAO-56 [36]. Annual observed CO2 concentrations for the same baseline period were sourced from the NOAA Global Monitoring Laboratory (https://gml.noaa.gov/ccgg/trends/data.html, accessed on 7 January 2026).
Future climate projections for 2031–2050 were derived from the ISIMIP3b dataset (https://data.isimip.org/search/tree/ISIMIP3b/, accessed on 12 January 2026) [37], which provides bias-adjusted and statistically downscaled daily outputs from CMIP6 global climate models at 0.5° × 0.5° resolution for 1960–2099 [38]. This dataset has been widely validated in crop-climate impact assessments [39,40]. In this study, outputs from five GCMs (Table 1) were selected under two shared socioeconomic pathways: SSP2-4.5, representing an intermediate development trajectory with moderate radiative forcing and socioeconomic conditions consistent with historical trends; and SSP5-8.5, depicting a high-emission pathway driven by fossil-fuel-intensive growth, posing high mitigation but low adaptation challenges. To align gridded ISIMIP3b meteorological data with the study site, inverse distance weighting was first applied for spatial downscaling [41], followed by quantile mapping bias correction using observed data from 1981–2020 as the reference baseline to ensure consistency between historical and future periods [38]. Corresponding future CO2 concentrations were set in alignment with these scenarios, drawing on values from the CMIP6 standard scenario forcing reported by Li et al. [42]. All annual CO2 series—both historical and future—were linearly interpolated to daily resolution to match the DSSAT simulation time step. Furthermore, a uniform CO2 concentration series was applied across all GCM forcings under the same SSP scenario to disentangle the independent effects of regional climatic changes and the CO2 fertilization effect on crop growth.
Table 1.
General information of the used Global Climate Models (GCMs) integrated in the Inter-Sectoral Impact Model Intercomparison Project (ISIMIP3b).
- (2)
- Soil profile data
Soil properties for scenario simulations were set to lime concretion black soil, the dominant agricultural soil type in the Huaibei Plain and at the Xinmaqiao Experimental Station. The soil profile was configured as three layers (0–40 cm, 40–80 cm, and 80–120 cm), covering the full root zone of summer soybean and maize as well as the vertical range of soil water percolation. Key physical and hydraulic parameters of each layer, including bulk density, wilting point, field capacity, and saturated water content, are provided in Table 2. These parameters represent the typical layered profile of regional lime concretion black soil and have been widely used in crop growth and drought risk simulation studies in this region [31]. Note that they differ from the in-situ measured topsoil properties at the experimental station used for model calibration, which is consistent with conventions for regional-scale assessments.
Table 2.
Soil physical and hydraulic parameters for DSSAT simulation.
- (3)
- Cultivar genetic parameters
Cultivar-specific genetic parameters for the CERES-Maize and CROPGRO-Soybean modules were derived from the localized calibration described in Section 2.2. These parameters have been validated against field observations and were directly adopted for all scenario simulations, corresponding to the two local dominant cultivars described above.
- (4)
- Field management data
Field management parameters were derived from conventional irrigated high-yield cultivation practices for summer maize and soybean in the Huaibei Plain, covering planting specifications, typical local sowing dates and fertilization standards. Planting specifications were consistent with those used in the field experiments for model calibration. Typical local sowing dates for both summer crops fall around early to mid-June, and 10 June was uniformly adopted as the conventional sowing date in this study. Sowing date was set as the focal explanatory variable of this study, with detailed multi-gradient treatments presented in Section 2.3.2. Fertilization rates followed local standard nutrient input levels, which are detailed in Section 2.4 and applied in the subsequent cost–benefit analysis.
2.3.2. Scenario Design
A full factorial simulation design was adopted to quantify the impacts of climate change on the yield and water use of summer soybean and maize and to identify optimal sowing strategies under different production objectives. Crop species, climate scenario and sowing date were set as the three core independent variables, with soil properties and nutrient supply held constant across all treatments to avoid confounding effects. Two water regimes were configured for the simulations. The full irrigation regime, applied in all core analyses, followed standard DSSAT irrigation management protocols: total available water (TAW) was defined as the difference between field capacity and wilting point; actual available water (AAW) was calculated as the simulated soil water content minus wilting point; root zone depth was simulated dynamically, deepening progressively with crop root development throughout the growing season; and irrigation was triggered automatically when the AAW-to-TAW ratio within the simulated root zone fell below 55% and stopped once the root zone soil profile was replenished to 100% of TAW. A rainfed regime with no supplementary irrigation served as the baseline for calculating the marginal benefit of irrigation water and deriving water use efficiency indicators. This experimental setup ensured all core analyses were conducted under consistent fully irrigated conditions, thereby isolating the independent effects of temperature, CO2 concentration and sowing adjustment.
Three climate regimes were configured as follows: a historical baseline (2001–2020) run across all 13 sowing date treatments as reference and two 20-year future scenarios (2031–2050) under SSP2-4.5 and SSP5-8.5 pathways, covering the mid-to-high range of agricultural climate risk. Baseline simulations confirmed that maize yield was maximized at the conventional date (10 June), whereas soybean exhibited a broad optimum, with a 5-day earlier sowing (5 June) and the conventional date (10 June) producing nearly identical yields (Table S3); accordingly, 10 June was retained as the baseline reference for all subsequent climate-change comparisons. Sowing treatments were anchored to the local conventional date of 10 June for both crops, representative of local farming practices. Thirteen sowing dates at 5-day intervals were set for each crop, spanning 30 days before to 30 days after the conventional date (i.e., from 11 May to 10 July). This 5-day resolution captures the parabolic yield–sowing date relationship while maintaining computational efficiency. The optimal sowing date was defined as the date with the highest simulated mean yield or net return across the five GCMs, and neighboring 5-day treatments with similar performance were used to delineate an approximate optimal window. Sowing shifts are expressed relative to the conventional date, with negative values indicating earlier sowing and positive values for delayed sowing. All simulations used local dominant cultivars (Longping 206 maize, Zhonghuang 13 soybean) at standard planting densities, with non-limiting nutrient supply across all treatments. Soil parameters for lime concretion black soil were adopted from Table 2.
In total, 286 full-irrigation simulation combinations were designed for the core analysis: 26 for the historical baseline (2 crops × 13 sowing dates) and 260 for future scenarios (2 crops × 2 SSPs × 13 sowing dates × 5 GCMs). Supporting rainfed simulations were run in parallel for water use efficiency calculation; corresponding rain-fed yield results are summarized in Table S2 (Supplementary Materials).
2.3.3. Model Execution
All simulations were performed using the CERES-Maize and CROPGRO-Soybean modules embedded in the DSSAT model, corresponding to summer maize and soybean, respectively. Each simulation was driven by daily meteorological data at a daily time step, continuously simulating crop phenological development, photosynthetic production, dry matter accumulation and partitioning, and grain yield formation. Both the historical baseline (2001–2020) and future periods (2031–2050) were run over the full 20-year time series.
For future scenarios, each of the five GCMs was run independently. Key output variables included phenological dates, grain yield, growing-season potential evapotranspiration (ET), and irrigation amount. The irrigation amount was a direct model output, representing the total supplementary water automatically applied to maintain non-water-limited soil conditions throughout the growing season. Potential evapotranspiration in this study refers to the maximum crop evapotranspiration under sufficient soil water supply, directly simulated by the DSSAT model under full-irrigation conditions. Ensemble means and standard deviations across the five GCMs were calculated to quantify uncertainty arising from climate model projections, with each GCM given equal weight. Statistical comparisons were based on the 20-year annual simulation outputs for each GCM. Unless otherwise stated, the GCM was treated as the statistical unit (n = 5), with each GCM’s 20-year mean serving as one observation; years within a GCM were not treated as independent replicates, thereby avoiding inflation of the effective sample size. The standard deviation across GCM means was used consistently as the uncertainty measure for both yield and optimal sowing date results and is reported alongside the main means in the text.
2.4. Economic Benefit Accounting and Irrigation Water Use Efficiency Calculation
2.4.1. Economic Benefit Accounting
Net economic returns were calculated for both fully irrigated and rainfed production scenarios, following standard high-yield cultivation practices for summer soybean and maize in the Huaibei Plain. All price benchmarks were based on average 2025 regional market levels, with all monetary values expressed in Chinese yuan (CNY). Calculations were performed on a per-hectare basis and included grain output value, irrigation cost (exclusive to the irrigated scenario), and fertilization cost, to derive the net economic return for each production regime.
- (1)
- Grain output value
Grain output value was computed as the product of per-unit-area grain yield and the corresponding market purchase price. The prices were set at 4.24 CNY kg−1 for soybean and 2.22 CNY kg−1 for maize, based on the 2025 full-year average official statistics released by the National Food and Strategic Reserves Administration (NFSRA) of China (https://www.lswz.gov.cn/html/zmhd/lysj/lsjg.shtml, accessed on 2 May 2026).
- (2)
- Irrigation cost
The cumulative irrigation depth IR (mm) simulated by DSSAT under the fully irrigated treatment was first converted from water depth to volumetric units. The conversion follows
where IRvol is the volumetric irrigation amount per hectare (m3 ha−1) and 1 mm of irrigation depth corresponds to 10 m3 of water per hectare. The irrigation cost was then calculated as:
where Cir is the irrigation cost per hectare (CNY ha−1), and 0.4 CNY m−3 is the unit comprehensive irrigation water price. This value conforms to the terminal agricultural irrigation water price benchmark for grain production areas in northern Anhui, as stipulated in the agricultural water pricing policy issued by the Anhui Provincial Development and Reform Commission and the Department of Water Resources. It covers the full cost of irrigation service delivery, including pumping energy consumption, water conveyance losses, and allocated labor and facility operation and maintenance costs.
IRvol = 10 × IR
Cir = 0.4 × IRvol
- (3)
- Fertilization cost
Fertilization costs were quantified according to locally validated nutrient management regimes for each crop. Fertilizer unit prices were set to the 2025 annual average retail values for Anhui Province, calculated from the weekly fertilizer retail price monitoring data officially released by the Anhui Provincial Development and Reform Commission (https://fzggw.ah.gov.cn/ywdt/ztzl/jgjc/jcsj/index.html, accessed on 10 May 2026).
For summer maize, a two-stage fertilization regime (basal NPK compound fertilizer + nitrogen top-dressing at the big bell stage) was implemented, targeting a yield of 7500–8500 kg ha−1. Total nutrient application rates were 195 kg N ha−1, 75 kg P2O5 ha−1, and 75 kg K2O ha−1. Basal fertilization consisted of 500 kg ha−1 of 15-15-15 NPK compound fertilizer, at a unit price of 2.80 CNY kg−1, resulting in a basal fertilizer cost of 1400 CNY ha−1. At the big bell stage, 261 kg ha−1 of urea (≥46% N) was top-dressed to satisfy peak nitrogen demand during reproductive growth, at a unit price of 2.20 CNY kg−1, incurring a top-dressing cost of 574 CNY ha−1. The total fertilization cost for summer maize amounted to 1974 CNY ha−1.
For summer soybean, a strategy of controlled N input and enhanced P and K supply was adopted to leverage the biological nitrogen fixation capacity of root nodules, with a target yield of 3000–3500 kg ha−1. Total nutrient inputs were 75 kg N ha−1, 85 kg P2O5 ha−1, and 85 kg K2O ha−1. Basal application included 500 kg ha−1 of 15-15-15 NPK compound fertilizer, costing 1400 CNY ha−1 at the aforementioned uniform unit price. A supplementary top-dressing of phosphorus and potassium fertilizers, without nitrogen, was applied at the early anthesis stage to support anthesis and pod development, supplying approximately 10 kg P2O5 ha−1 and 10 kg K2O ha−1, with a total cost of approximately 150 CNY ha−1 calculated based on the prevailing market prices from the same official source. The total fertilization cost for summer soybean was approximately 1550 CNY ha−1.
- (4)
- Net return
Net return per unit area was calculated as grain output value minus irrigation cost and fertilization cost:
where Rir and Rrf represent net economic return per hectare under fully irrigated and rainfed conditions respectively, Yir and Yrf represent grain yield per hectare under the corresponding water regimes, Py is the market price of grain, Cir is the irrigation cost per hectare applicable only to the irrigated scenario, and Cfer is the fertilization cost per hectare consistent across both water regimes.
Rir = Yir × Py − Cir − Cfer
Rrf = Yrf × Py − Cfer
Fixed field inputs including seeds, pesticides, and machinery operations were not included in the differential accounting. These costs are independent of climate scenario and sowing date within each crop, but they differ between crops; therefore, the soybean versus maize comparison of net returns is an indicative comparison based on grain output value, irrigation cost, and fertilization cost, rather than a full farm profitability analysis. It should also be noted that the irrigation cost used here represents a variable water charge and excludes capital investment in irrigation equipment such as pumps, pipelines, and application devices. Given the small simulated irrigation requirements, equipment utilization would be low; therefore, the net-return and irrigation water economic efficiency results are not intended as an economic justification for new irrigation investment, but as a fully irrigation scenario for isolating climate and sowing-date effects.
2.4.2. Calculation of Irrigation Water-Use Efficiency Metrics
Irrigation water productivity (IWP) and irrigation water economic efficiency (IWE) were used to quantify the production return per unit of supplementary irrigation water input. Note that these are marginal efficiency indicators benchmarked against rain-fed production (calculated as the difference between irrigated and rain-fed treatments), not gross efficiency ratios of total yield to total irrigation water. Full rain-fed grain yield data across all sowing dates and climate scenarios used for efficiency calculation are listed in Table S2 (Supplementary Materials). In essence, both indicators reflect the marginal benefit of irrigation relative to rain-fed production, calculated using the yield and net return difference between irrigated and rain-fed scenarios divided by the irrigation water volume.
where IWP and IWE are expressed in kg m−3 and CNY m−3, respectively; Yir, Yrf, Rir, Rrf, and IRvol are as defined in Section 2.4.1.
3. Results
3.1. Changes in Growing-Season Climate Under Future Scenarios
Relative to the 2001–2020 historical baseline, the summer crop growing season (June–September) in the Huaibei Plain exhibited consistent warming, increased precipitation and significantly intensified extreme heat stress under both the SSP2-4.5 and SSP5-8.5 scenarios during 2031–2050 (Figure 2). All climatic variables showed clear emission-dependent patterns, with consistently larger changes under the higher-emission SSP5-8.5 scenario.
Figure 2.
Growing-season and monthly mean minimum temperature (Tmin; (a,e)), mean maximum temperature (Tmax; (b,f)), precipitation (Pre; (c,g)), and days with daily maximum temperature ≥ 35 °C (HD35; (d,h)) under the historical baseline and future climate scenarios.
For temperature, the growing-season average minimum temperature rose from a baseline 22.25 °C to 23.62 °C under SSP2-4.5 and 23.89 °C under SSP5-8.5, corresponding to increases of 1.37 °C and 1.64 °C. The average maximum temperature increased by 1.29 °C and 1.45 °C relative to the baseline of 30.24 °C, respectively. Warming occurred across all four months, with the greatest temperature rise observed in September. Total growing-season precipitation increased from 635.93 mm at baseline to 671.08 mm (+5.53%) under SSP2-4.5 and 707.04 mm (+11.18%) under SSP5-8.5. Precipitation increments were mainly concentrated in July and August, while September showed divergent trends between scenarios: a 5.05 mm decrease under SSP2-4.5 and a 15.45 mm increase under SSP5-8.5. Notably, the number of days with daily maximum temperature ≥ 35 °C increased far more sharply than mean temperature. It rose from 13.1 d at baseline to 23.21 d (+77.2%) under SSP2-4.5 and 27.24 d (+107.9%) under SSP5-8.5. July accounted for the largest share of high-temperature days, followed by August and June, with fewer than 1 d recorded in September across all scenarios.
3.2. Crop Responses to Climate Change Under Conventional Sowing Dates
3.2.1. Phenology and Growth Duration
Under conventional sowing dates, both soybean and maize showed earlier phenological events and shortened growth durations under both future climate scenarios, with larger magnitudes under the higher-emission SSP5-8.5 scenario (Table 3). For soybean, the anthesis date (day of year, DOY) was 204.7 at the historical baseline. Under the SSP2-4.5 and SSP5-8.5 scenarios, anthesis occurred 0.2 d and 0.9 d earlier, at DOY 204.5 and 203.8, respectively. The maturity date advanced from the baseline of DOY 257.3 by 0.7 d under SSP2-4.5 and 2.2 d under SSP5-8.5. Accordingly, total growth duration decreased by 0.7 d (SSP2-4.5) and 2.2 d (SSP5-8.5) relative to the baseline of 97.3 d. The reproductive growth period (anthesis to maturity) was shortened by 0.5 d and 1.3 d, respectively, accounting for the majority of the total growth duration reduction.
Table 3.
Phenological changes in summer soybean and summer maize in the Huaibei Plain under future climate scenarios.
For maize, the baseline anthesis date was DOY 210.8. It advanced by 1.0 d under SSP2-4.5 and 2.1 d under SSP5-8.5. The maturity date was 5.3 d and 6.8 d earlier than the baseline of DOY 266.4 under the two scenarios, respectively. Total growth duration declined by 5.3 d and 6.8 d from the baseline of 106.4 d, while the reproductive period was shortened by 4.3 d and 4.7 d, respectively. Across both scenarios, maize exhibited greater phenological advancement and larger total growth duration reduction than soybean. For both crops, the reproductive growth period was shortened more markedly than the vegetative growth period, and the magnitude of all phenological shifts and growth duration reductions increased with rising emission intensity.
3.2.2. Evapotranspiration and Irrigation Amount
Under conventional sowing dates, both summer soybean and maize exhibited increased ET but decreased irrigation amounts under both the SSP2-4.5 and SSP5-8.5 future climate scenarios, with larger absolute changes consistently occurring under the higher-emission SSP5-8.5 scenario (Figure 3). For soybean, baseline potential ET was 286.6 mm; it rose by 29.8 mm under SSP2-4.5 and 34.2 mm under SSP5-8.5. By contrast, irrigation amount declined from the baseline of 42.7 mm to 40.1 mm (SSP2-4.5) and 38.4 mm (SSP5-8.5), representing reductions of 2.6 mm and 4.3 mm, respectively. For maize, baseline potential ET reached 365.1 mm, increasing by 32.4 mm (SSP2-4.5) and 36.3 mm (SSP5-8.5). The irrigation amount fell from 70.6 mm at baseline to 47.2 mm and 43.4 mm across the two scenarios, equivalent to decreases of 23.4 mm and 27.2 mm, respectively. Across both scenarios, maize consistently maintained higher absolute potential ET and irrigation volume than soybean and showed larger magnitudes of both ET increase and irrigation reduction.
Figure 3.
Potential evapotranspiration (ET; (a)) and irrigation amount (b) of summer soybean and maize under conventional sowing dates across different climate scenarios. Note: Potential evapotranspiration and irrigation amount are direct outputs from DSSAT model simulations under the full-irrigation regime. Error bars represent the standard deviations (SD) across the five GCM ensemble members.
3.2.3. Yield and Net Economic Returns
Under conventional sowing dates, both grain yield and net economic returns of summer soybean and maize declined under the two future climate scenarios, with the magnitude of losses escalating with emission intensity and maize exhibiting substantially larger yield reductions than soybean (Table 4). For soybean, relative to the baseline yield of 3131 kg ha−1, grain yield decreased by 59 kg ha−1 (1.87%) under SSP2-4.5 and by 140 kg ha−1 (4.46%) under SSP5-8.5. Correspondingly, net economic returns fell by 237 CNY ha−1 and 574 CNY ha−1, respectively, from the baseline of 11,554 CNY ha−1. For maize, baseline grain yield stood at 7682 kg ha−1; it declined by 709 kg ha−1 (9.24%) under SSP2-4.5 and 832 kg ha−1 (10.83%) under SSP5-8.5. Net economic returns decreased by 1482 CNY ha−1 and 1739 CNY ha−1 across the two scenarios compared with the baseline value of 14,798 CNY ha−1. Across both scenarios, maize consistently maintained higher absolute yield and net economic returns than soybean. However, maize suffered larger yield losses and steeper declines in net returns with rising emission intensity, narrowing the maize-soybean net return gap relative to the historical baseline, although the gap under SSP5-8.5 was slightly wider than under SSP2-4.5.
Table 4.
Yield, net income, irrigation water productivity (IWP) and irrigation water economic efficiency (IWE) of summer soybean and summer maize in the Huaibei Plain under historical and future climate scenarios.
3.2.4. Irrigation Water Productivity and Economic Efficiency
Under conventional sowing dates, IWP and IWE of summer soybean and maize exhibited divergent response patterns under the SSP2-4.5 and SSP5-8.5 future climate scenarios, with maize experiencing steeper IWP declines relative to the historical baseline than soybean (Table 4). For soybean, IWP slightly increased by 0.01 kg m−3 to 1.81 kg m−3 under SSP2-4.5 from the baseline of 1.8 kg m−3, and IWE rose by 0.07 CNY m−3 to 7.28 CNY m−3 from 7.21 CNY m−3. Under the higher-emission SSP5-8.5, both metrics declined: IWP fell to 1.53 kg m−3 (−0.27 kg m−3) and IWE dropped to 6.07 CNY m−3 (−1.14 CNY m−3). For maize, both IWP and IWE decreased markedly relative to the historical baseline under both scenarios. Baseline IWP was 1.03 kg m−3; it fell to 0.45 kg m−3 under SSP2-4.5 (−0.58 kg m−3) and 0.60 kg m−3 under SSP5-8.5 (−0.43 kg m−3). Baseline IWE was 1.90 CNY m−3, declining by 1.29 CNY m−3 to 0.61 CNY m−3 under SSP2-4.5 and by 0.96 CNY m−3 to 0.94 CNY m−3 under SSP5-8.5. The higher maize IWP and IWE under SSP5-8.5 than under SSP2-4.5 reflect the marginal nature of these indicators—i.e., a larger irrigated–rainfed difference combined with a lower irrigation amount—rather than higher absolute yield or net return. Across all scenarios, soybean consistently outperformed maize in both efficiency metrics, with a particularly wide gap in economic output per unit irrigation water. The larger IWP declines for maize and the higher absolute efficiency levels of soybean indicate stronger climatic stability in soybean’s economic returns from agricultural water use.
3.3. Regulating Effects of Sowing Date Adjustment on Crop Performance
3.3.1. Responses of Phenology and Growth Duration to Sowing Date Adjustment
Sowing date adjustments systematically altered the phenological timing and growth duration of both summer soybean and maize under the two future climate scenarios (Table 5, Figure 4). Earlier sowing advanced anthesis and maturity, whereas delayed sowing postponed both. For soybean, early sowing extended the whole growth period (WGP) and reproductive growth period (RGP), while late sowing shortened both. Relative to the historical baseline conventional sowing, 20-day earlier sowing advanced anthesis by 16.6–16.9 d and maturity by 10.3–11.4 d, increasing WGP by 8.6–9.7 d and RGP by 5.5–6.3 d; a 20-day delay reduced WGP by 14.3–16.6 d and RGP by 7.3–7.7 d. For maize, vegetative duration generally shortened after approximately 15 d. RGP contracted under early sowing but increased under delayed sowing up to 20 d. Relative to historical baseline conventional sowing, 20-day earlier sowing reduced WGP by 7.8–9.2 d, mainly through RGP contraction (−8.3 to −8.7 d). A 20-day delay increased WGP by 3.0–3.5 d and RGP by 7.7 d relative to same-scenario conventional sowing, although WGP remained 1.8–3.8 d below the historical baseline. This delay postponed anthesis by 15.3–15.8 d and maturity by 23.0–23.5 d, shifting the reproductive phase away from the July–August heat peak. Overall, soybean WGP was more responsive to sowing shifts than maize, while maize showed stronger RGP compensation under late sowing. Phenological shifts were generally larger under SSP5-8.5 for early sowing, but not for delayed sowing; under delayed sowing, some shifts were even smaller under SSP5-8.5, indicating that the effect of warming on phenology depends on sowing direction.
Table 5.
Phenological changes in summer soybean and maize in response to sowing date adjustments under future climate scenarios.
Figure 4.
Responses of whole-growth-period (WGP) and reproductive-growth-period (RGP) duration changes in summer soybean (a,b) and maize (c,d) to sowing-date adjustments under SSP2-4.5 (a,c) and SSP5-8.5 (b,d) scenarios. Note: Negative values on the x-axis indicate earlier sowing relative to the local conventional sowing date (10 June), while positive values indicate delayed sowing. All y-axis values represent changes relative to the conventional sowing date under the historical baseline (2001–2020), and are ensemble means across five global climate models (GCMs). WGP, from sowing to physiological maturity; RGP, from anthesis to physiological maturity.
3.3.2. Responses of Evapotranspiration and Irrigation Amounts to Sowing Date Adjustment
Sowing date adjustments systematically altered ET and irrigation amounts for both soybean and maize under the two future climate scenarios (Figure 5). Both water use variables declined continuously with delayed sowing, with change magnitudes proportional to the sowing date offset. Larger absolute ET shifts generally occurred under the higher-emission SSP5-8.5 scenario than under SSP2-4.5 at identical sowing offsets. All changes in this subsection are benchmarked against the conventional sowing date of the historical baseline. Under SSP2-4.5, 20-day earlier sowing increased potential ET by 71.5 mm and irrigation by 6.0 mm, while 20-day delayed sowing reduced ET by 28.4 mm and irrigation by 14.3 mm. Under SSP5-8.5, the corresponding changes were +77.8 mm and +2.5 mm for early sowing and −28.3 mm and −12.9 mm for delayed sowing. On average, each 5-day sowing delay from conventional to 20-day late sowing reduced soybean irrigation by approximately 3 mm. Maize water use showed greater sensitivity to sowing shifts than soybean. Relative to the historical baseline under SSP2-4.5, 20-day earlier sowing raised ET by 51.6 mm but reduced irrigation by 4.4 mm, while a 20-day delay decreased ET by 15.6 mm and irrigation by 37.9 mm. Within the same SSP2-4.5 scenario, irrigation decreased by an average of 3.6 mm per 5-day delay from the conventional sowing date to the 20-day delayed sowing date. Under SSP5-8.5, 20-day early sowing increased ET by 58.5 mm and decreased irrigation by 20.7 mm relative to the historical baseline, while a 20-day delay reduced ET by 17.0 mm and irrigation by 39.0 mm. Across all scenarios, maize consistently had higher potential ET and irrigation volume than soybean and exhibited larger absolute irrigation changes in response to equivalent sowing adjustments, indicating a more pronounced water-saving effect of delayed sowing for maize.
Figure 5.
Responses of potential evapotranspiration (ET; (a,b)) and irrigation amount (I; (c,d)) of summer soybean (a,c) and maize (b,d) to sowing-date adjustments under SSP2-4.5 and SSP5-8.5 scenarios.
3.3.3. Responses of Yield and Net Economic Returns to Sowing Date Adjustment
Grain yield of both soybean and maize followed a quadratic rise-then-fall trend across the sowing date gradient under both the SSP2-4.5 and SSP5-8.5 scenarios, with sharply divergent optimal sowing directions relative to the conventional date (Figure 6). Yield gains from sowing optimization were far larger for maize than for soybean, and optimal timing shifted moderately with rising emission intensity. Under SSP2-4.5, soybean yield peaked at 3140 kg ha−1 with 15-day earlier sowing, 2.2% higher than conventional sowing under the same scenario and slightly above the historical baseline. Maize reached a maximum yield of 8309 kg ha−1 at 20-day delayed sowing, 19.2% higher than conventional sowing under the same scenario and 8.2% above the baseline.
Figure 6.
Responses of grain yield (a,b) and net economic returns (c,d) of summer soybean (a,c) and maize (b,d) to sowing-date adjustments under SSP2-4.5 and SSP5-8.5 scenarios. Note: Negative values on the x-axis indicate earlier sowing relative to the local conventional sowing date (10 June), while positive values indicate delayed sowing. Solid dots represent ensemble means across five global climate models (GCMs).
Under SSP5-8.5, the optimal sowing date for soybean advanced by 10 days relative to the conventional date, reaching a peak yield of 3105 kg ha−1 which was 3.8% higher than that under conventional sowing in the same scenario but 0.8% below the historical baseline. For maize, the optimal 20-day delay remained stable, delivering a peak yield of 7746 kg ha−1, 13.1% higher than conventional sowing under the same scenario and slightly above the baseline. Yield declined continuously as sowing date deviated from the optimum. Net returns mirrored the yield response and peaked at the same optimal sowing dates. Maximum net returns reached 11,576 CNY ha−1 for soybean (15-day early) and 16,343 CNY ha−1 for maize (20-day late) under SSP2-4.5, with corresponding values of 11,444 CNY ha−1 (10-day early) and 15,096 CNY ha−1 (20-day late), respectively, under SSP5-8.5. Relative to the historical baseline (11,554 and 14,798 CNY ha−1), optimized soybean changed by −110 to 22 CNY ha−1, whereas optimized maize exceeded the baseline by 298–1545 CNY ha−1. Across all treatments and scenarios, maize consistently held a substantial absolute yield advantage and showed greater sensitivity to sowing adjustments with a wider yield range. Rainfed simulations showed the same optimal sowing directions (Supplementary Table S2), confirming that these directions were not an artifact of irrigation. Across the five GCMs, the yield gain at the optimal date relative to the conventional date was consistent in sign for both crops and scenarios, whereas the difference between neighboring treatments around the optimum was smaller than the inter-GCM standard deviation (Figure 6); therefore, the recommended adjustments can be interpreted as approximate optimal windows rather than single exact dates.
3.3.4. Responses of Irrigation Water Productivity and Economic Efficiency to Sowing Date Adjustment
Sowing date adjustments exerted systematic regulatory effects on both IWP and IWE for summer soybean and maize under both future climate scenarios (Figure 7). The underlying rain-fed yield data (Table S2, Supplementary Materials), which formed the calculation baseline for these marginal efficiency indicators, showed that rainfed yields of both crops followed a similar quadratic response to sowing date as fully irrigated yields, but at lower absolute levels. Under conventional sowing relative to the historical baseline, rain-fed soybean yield changed by −0.76% under SSP2-4.5 and +1.75% under SSP5-8.5, whereas rainfed maize yield decreased by 2.78% and 5.23% under the two scenarios. This differential yield stability under water-limited conditions provides a quantitative basis for soybean’s comparative advantage in IWE.
Figure 7.
Responses of irrigation water productivity (IWP; (a,b)) and irrigation water economic efficiency (IWE; (c,d)) of summer soybean and maize to sowing date adjustments under SSP2-4.5 (a,c) and SSP5-8.5 (b,d) scenarios. Note: All values are ensemble means across five global climate models (GCMs). Blue symbols and lines represent soybean, and red symbols and lines represent maize. Solid lines indicate 4th-order fitting curves, with all coefficients of determination (R2) greater than 0.92. Error bars denote the corresponding standard deviations. Negative values on the x-axis indicate earlier sowing relative to the conventional sowing date, while positive values indicate delayed sowing.
Delayed sowing consistently improved both metrics relative to conventional sowing, with enhancement magnitudes increasing with emission intensity. Marked interspecific differences existed in absolute efficiency levels, variation patterns, and baseline recovery capacity. For soybean, IWP rose continuously with delayed sowing across both scenarios. Under SSP2-4.5, conventional-sowing IWP was nearly identical to the historical baseline, and a 20-day delay increased it by 40.0% to 2.52 kg m−3. Under SSP5-8.5, conventional-sowing IWP fell the below baseline, but a 20-day delay restored and exceeded the baseline levels. Maize IWP showed a V-shaped pattern, with the minimum at conventional sowing; a 20-day delay lifted it above the baseline under both scenarios, with a larger relative gain under SSP2-4.5. IWE variation patterns were consistent with IWP for both crops, and soybean consistently outperformed maize in IWE. Overall, soybean had smaller efficiency losses at conventional sowing and stronger baseline recovery capacity, while maize showed larger relative improvement but lower absolute efficiency. Higher emission intensity amplified the water-saving and efficiency-enhancing potential of sowing optimization.
3.4. Comprehensive Comparison of Soybean and Maize Under Maximum Return Objectives
Across the historical baseline and the two future climate scenarios, summer maize consistently achieved higher maximum net returns than soybean, with the relative return gap first widening, then narrowing as emission intensity increased (Table 6). Optimal sowing adjustments for maximum returns followed completely opposite directions between the two crops. Soybean required earlier sowing relative to the conventional date, by 15 days under SSP2-4.5 and 10 days under SSP5-8.5, indicating a gradual postponement of the optimal timing with rising emission intensity. In contrast, maize maintained a stable 20-day sowing delay across both emission scenarios, with no shift in adjustment direction as emissions increased. Maize held a prominent absolute yield advantage at optimal sowing dates, reaching 2.49 to 2.65 times that of soybean. In terms of water use performance at their respective yield-optimal sowing dates, maize had lower irrigation requirements and higher irrigation water productivity, whereas soybean outperformed maize in irrigation water economic efficiency by 24.8% under SSP2-4.5 and 59.9% under SSP5-8.5, retaining this comparative advantage even under the intensified climate stress of the SSP5-8.5 scenario.
Table 6.
Comprehensive comparison of soybean and maize at the sowing dates maximizing simulated net return under different climate scenarios.
4. Discussion
As previously mentioned, summer soybean and maize compete for arable land in the Huaibei Plain, and their divergent responses to climate change directly affect regional cropping structure adjustment. Building on the simulation results above, we further discuss the underlying mechanisms and practical implications of sowing date optimization.
4.1. Divergent Crop Responses to Climate Change Under Conventional Sowing
Under conventional sowing (10 June), future climatic conditions across all scenarios consistently advanced phenological development, shortened the total growth duration, and reduced grain yields for both summer soybean and maize in the study area, with yield losses intensifying as emission intensity increased. However, maize showed greater vulnerability than soybean, with yield losses 2–5 times those of soybean (Table 4). This divergence may be associated with three interconnected factors related to phenology, CO2 response, and heat stress.
Rising temperatures accelerated thermal time accumulation, advancing all phenological stages in accordance with general principles of crop development [43]. For both crops, reproductive stages shortened more markedly than vegetative stages (Table 3), consistent with the higher temperature sensitivity of reproductive development [44]. Notably, the total growth duration reduction for maize was 3.1–7.6 times that for soybean under conventional sowing across the two scenarios, with the reproductive phase contracting by 4.3–4.7 days in maize versus only 0.5–1.3 days in soybean (Table 3). This asymmetric shortening of the growth period may be an important contributing factor to the simulated difference in yield response between the two crops, as it potentially reduces the time available for photosynthetic carbon assimilation and dry matter accumulation [43]. Consistent with this interpretation, the simulated outputs across all sowing treatments showed a positive association between reproductive growth duration and grain yield for both crops (R2 = 0.66 for soybean and 0.93 for maize), indicating that treatments with longer reproductive phases generally produced higher yields. Beyond phenological compression, this divergent yield response is also consistent with the distinct CO2 fertilization effects of C3 and C4 crops. Soybean yield losses remained below 5%, possibly buffered by elevated CO2, which enhances net photosynthesis in C3 crops by suppressing photorespiration [9,10]. In contrast, C4 maize, possessing a CO2-concentrating mechanism, is generally less responsive to elevated CO2 [11] and, in this simulation, suffered yield losses of 9.24–10.83% across the two SSP scenarios (Table 4). However, this CO2-driven advantage may be partially offset under stronger warming, as indicated by the amplification of soybean yield loss from 1.87% under SSP2-4.5 to 4.46% under SSP5-8.5, consistent with the possibility that extreme heat progressively attenuates CO2 fertilization benefits [12,45]. Direct reproductive heat stress may further exacerbate maize’s yield vulnerability. The frequency of days with maximum temperatures of 35 °C or above surged by 77.2%−107.9%, peaking in July and August (Figure 2). This period largely coincides with the anthesis and grain-filling stages of conventionally sown maize (Table 3). While temperatures above 35 °C are known to induce pollen sterility and kernel abortion in maize under field conditions [46,47], soybean possesses a higher reproductive thermal threshold and compensatory pod-set capacity [48]. It should be noted that CERES-Maize does not explicitly simulate these reproductive heat processes; its simulated yield response to warming is mediated mainly through a temperature-dependent reduction in the relative grain-filling rate (RGFIL) and a shortened grain-filling period [32]. The more severe yield penalties simulated for maize are therefore consistent with but not a direct process-based representation of this field-scale heat stress mechanism.
Regarding hydrological responses, irrigation requirements decreased for both crops despite elevated potential ET (Figure 3). This indicates that projected precipitation increases outweighed the rise in evaporative demand. The larger reduction in maize irrigation demand may reflect a stronger compensatory effect of increased rainfall against its higher baseline water requirement [30], with irrigation reductions of 23.4–27.2 mm for maize versus only 2.6–4.3 mm for soybean (Figure 3).
4.2. Regulatory Effects and Mechanisms of Sowing Date Adjustment
Adjusting sowing timing represents a practical, low-cost agronomic strategy to align crop phenology with regional hydrothermal regimes [17,18]. Our simulations reveal diametrically opposite optimal sowing directions for the two crops: soybean achieves maximum yield with 10–15 days earlier sowing, while maize peaks at a 20 days delayed sowing (Figure 6). Delayed sowing generally enhanced IWP and IWE for both crops (Figure 7) but created a yield–water use efficiency trade-off for soybean (i.e., higher water efficiency comes at the cost of partial yield loss relative to its yield optimum), whereas maize realized simultaneous improvements in yield and water use efficiency at its optimal sowing date.
For soybean, earlier sowing within the optimal window extended WGP and particularly RGP (Figure 4). A 20-day earlier sowing increased WGP by 8.6–9.7 d and RGP by 5.5–6.3 d relative to historical baseline conventional sowing, likely increasing the period for photosynthetic assimilate accumulation and contributing to higher yield. The extended growing window may also allow greater expression of CO2 fertilization benefits for this C3 crop [10,34], consistent with reported yield gains from early sowing for heat-tolerant soybean cultivars in the Huanghuaihai farming region [18]. While early sowing maximizes grain yield, delayed sowing generates advantages in water use efficiency. The optimal soybean sowing date therefore depends on the management goal: earlier sowing favors yield maximization, whereas later sowing favors irrigation-water efficiency. Across the sowing gradient, each 5-day delay reduced soybean irrigation water use by roughly 3 mm on average, with a slightly larger reduction under SSP2-4.5 (Figure 5), while grain yield declined at a proportionally slower rate. This mismatch between the magnitude of irrigation reduction and yield loss explains why later sowing increased IWP and IWE in the simulations, suggesting that delayed sowing may be a viable option in irrigation-water-limited systems even with a partial yield penalty, consistent with soybean responses under deficit irrigation in Australia [49].
For maize, the 20-day delay postponed anthesis by 15.3–15.8 d and maturity by 23.0–23.5 d relative to same-scenario conventional sowing (Figure 4), shifting the reproductive phase away from the July–August heat peak (Figure 2) and likely reducing exposure of the most heat-sensitive stage to damaging temperatures above 35 °C [46,47]. Simulated anthesis–maturity days with Tmax reaching 35 °C or higher averaged approximately 8–12 d under conventional sowing versus 6–8 d under 20-day delayed sowing, a conservative reduction of about 2–4 d consistent with reduced reproductive heat exposure. In addition, delayed grain filling under milder conditions may also mitigate heat-induced forced maturity. Despite a shortened vegetative phase, WGP at +20 d was 3.0–3.5 d longer than same-scenario conventional sowing, although it remained 1.8–3.8 d shorter than historical baseline conventional sowing (Figure 4). Relative to conventional sowing within the same future scenario, this 20-day delay increased maize yield by 13.1–19.2%, which corresponds to a yield level 0.8–8.2% above the historical baseline, while reducing irrigation by 14.5 mm under SSP2-4.5 and 11.8 mm under SSP5-8.5 relative to same-scenario conventional sowing; relative to historical baseline conventional sowing, the reductions were 37.9 mm and 39.0 mm, respectively (Figure 5). This aligns with regional studies identifying reproductive-stage heat avoidance as a key mechanism for maize yield gains from delayed sowing [17,50,51] and generates synergistic improvements in both yield and water use efficiency.
The two crops differ in how their optimal sowing adjustments respond to rising emission intensity. Notably, the optimal sowing date for soybean shifts slightly later under SSP5-8.5, with the magnitude of early sowing reduced from 15 days to 10 days (Table 6, Figure 6), likely due to increasing heat penalties from very early sowing under more severe warming (Figure 2), consistent with findings that excessively early sowing increases soybean exposure to reproductive-stage heat stress [18]. In contrast, the 20-day sowing delay for maize remains optimal across both scenarios (Table 6, Figure 6), suggesting that reproductive heat stress remains a major yield-limiting factor for maize under both emission levels.
4.3. Comparative Advantages and Implications for Regional Cropping Adaptation
Based on simulation results at the sowing dates that maximize net return for each crop across the two future emission scenarios (Table 6), a multi-dimensional evaluation covering yield, economic return, and water use efficiency reveals distinct comparative advantages for summer soybean and maize, rather than one crop being universally superior across all metrics. These differentiated advantages provide a scientific basis for adjusting regional cropping systems to cope with future climate change.
From a production and economic perspective, maize maintains a clear and consistent advantage in absolute yield and net return under the price and partial-cost assumptions of this study (Table 6). Since seed, pesticide, and machinery costs were excluded and differ between crops, the soybean–maize net return comparison should be viewed as an indicative partial-cost comparison rather than a full farm profitability analysis. Sowing date optimization effectively mitigates climate-induced yield losses for both crops in the simulations, with markedly different recovery capacities: optimized maize yield exceeds the historical baseline by 8.2% under SSP2-4.5 and recovers to near-baseline levels under SSP5-8.5, while optimized soybean yield remains comparable to the baseline under SSP2-4.5 and falls slightly below it under SSP5-8.5 (Figure 6). In terms of net returns, optimized maize is 41.2% higher than soybean under SSP2-4.5 and 31.9% higher under SSP5-8.5 (Table 6). The return gap widens under moderate warming and narrows under high-emission scenarios, associated with the stronger yield gain of maize under moderate warming and amplified heat damage under high-emission conditions. This aligns with long-standing regional assessments identifying maize as the dominant high-yielding summer crop in the Huang-Huai-Hai Plain [52,53]. From a water resource perspective, soybean outperforms maize in IWE across all scenarios, while its conventional-sowing advantage in IWP diminishes and reverses at yield-optimal sowing dates (Figure 7). Under conventional sowing, soybean IWE is 3–12 times that of maize (Table 4); after optimization, soybean IWE remains 24.8% higher under SSP2-4.5 and 59.9% higher under SSP5-8.5 (Table 6). Given that a considerable proportion of farmland in the Huaibei Plain is located in marginal irrigation zones with unstable water supply [30], the higher simulated IWE of soybean indicates that soybean may deliver greater marginal economic return per unit of supplementary irrigation water when prioritizing the economic efficiency of irrigation water under the price assumptions of this study. This water-efficiency-oriented perspective complements the conventional yield-focused evaluation framework for cropping systems. In rainfed conditions (Table S2, Supplementary Materials), soybean shows smaller yield changes under future climate change (within ±2%, with a 1.75% increase under SSP5-8.5) versus 2.8–5.2% yield losses for maize, indicating better climatic yield stability. This further supports its suitability as a supplementary crop in marginal irrigation zones.
Building on these results, we cautiously propose differentiated sowing and cropping strategies under the assumptions of this study: maintaining a maize-dominated cropping pattern with 20-day delayed sowing in well-irrigated core areas to safeguard overall grain production, and appropriately expanding soybean as a supplementary crop with 10–15 days earlier sowing in marginal irrigation zones where irrigation water economic efficiency, risk diversification, or high-value grain production are prioritized. These simulated optima provide a biophysical reference; their operational feasibility depends on the preceding wheat harvest, as discussed in Section 4.4. These targeted strategies can help improve regional resource use efficiency and enhance the climate resilience of the summer cropping system.
4.4. Limitations and Future Research
The interpretation of our findings should be contextualized within several methodological constraints. First, the simulation framework was parameterized using data from a single representative experimental station characteristic of the lime concretion black soil zone, with cultivar coefficients calibrated in 2016 and validated in 2017. While this design ensures internal consistency and supports site-representative relative comparisons, it limits absolute spatial extrapolation across the broader Huaibei Plain, where heterogeneity in climate gradients, edaphic properties, and farm management practices may be substantial. Accordingly, the scenario results are interpreted as conditional relative responses under the tested cultivars and management assumptions, rather than as spatially transferable absolute forecasts. Second, the core simulations were conducted under fully irrigated conditions to isolate the effects of temperature and elevated CO2. Rainfed yield data across all sowing date treatments and climate scenarios are provided in Table S2 (Supplementary Materials) as a baseline reference for water-limited conditions. However, given that a considerable proportion of regional farmland relies on rainfed or deficit irrigation regimes, the efficacy of sowing date adjustments and the relative performance ranking of the two crops under water-limited conditions may diverge from the patterns observed under non-limiting water supply. Third, the proposed sowing shifts should be interpreted within the winter wheat–summer crop double-cropping system. Relative to the 10 June conventional date, sowing maize 20 days later (around 30 June) is largely compatible with the post-wheat sowing window in the Huaibei Plain, although late wheat harvest may compress the maize season and require maturity adjustment. Sowing of soybean 10 to 15 days earlier (late May to early June) may precede or coincide with wheat harvest and therefore cannot be directly implemented as post-harvest drilling without earlier wheat harvest, early-maturing cultivars, no-till relay intercropping, or staged sowing. The optimized dates are therefore conditional: later maize sowing is broadly feasible after wheat harvest, whereas earlier soybean sowing depends on wheat harvest timing and crop-system coordination. Future work should integrate whole-rotation analysis, multi-site rainfed/deficit-irrigation modeling, and explicit testing of longer-duration cultivars as a complement to sowing-date adjustment. Although not simulated here because all runs used the same calibrated cultivars, longer-maturity cultivars could extend the growth period and partly offset climate-induced shortening, provided that maize anthesis and grain filling do not shift further into the July–August heat peak and that maturity of both crops remains compatible with winter wheat sowing; this should be tested by varying cultivar thermal-time and photoperiod parameters, alone and combined with the sowing-date windows identified here.
5. Conclusions
This study assessed the climatic adaptability and sowing date optimization of summer soybean and maize in the Huaibei Plain. Under conventional sowing dates, future climate change is projected to shorten crop growth periods and reduce both grain yield and economic returns for the two crops. Summer maize showed greater vulnerability, with yield losses ranging from 9.24% to 10.83%, 2 to 5 times the loss range of 1.87% to 4.46% for soybean, and all losses intensify as emission levels rise. Within the simulation scenarios in this study, sowing date optimization can mitigate these climate-induced yield losses, but the two crops require opposite adjustment strategies. Soybean achieves its maximum simulated yield with 10 to 15 days earlier sowing, and the optimal timing shifts slightly later under higher emission scenarios, while maize consistently reaches its maximum yield with a 20-day sowing delay. After optimization, maize yield exceeds the historical baseline by 8.2% under SSP2-4.5 and recovers to near-baseline levels under SSP5-8.5, whereas soybean yield stays roughly comparable to the baseline under SSP2-4.5 and slightly lower under SSP5-8.5. The two crops present differentiated comparative advantages at yield-optimal sowing dates. Maize holds a leading position in total yield and net economic return, while soybean outperforms in irrigation water economic efficiency. Under the experimental assumptions of this study, delayed sowing improves water use efficiency for both crops, yet this comes at the cost of partial yield reduction for soybean, whereas maize realizes synergistic improvements in both yield and water use efficiency at the optimal 20-day delay. Based on these findings, we recommend crop-specific sowing strategies as model-based adaptation options under the tested climate, cultivar, and irrigation assumptions: maintaining maize-dominated production with targeted sowing optimization in well-irrigated core areas where absolute economic return and grain security are prioritized while considering supplementary soybean in areas where irrigation water economic efficiency, risk diversification, or high-value grain production is prioritized, which may help improve resource use efficiency and enhance the climate adaptability of the local summer cropping system.
Supplementary Materials
The following supporting information can be downloaded at https://www.mdpi.com/article/10.3390/agronomy16212084/s1, Table S1: Cultivar-specific genetic parameters of maize (cv. Longping 206) and soybean (cv. Zhonghuang 13) calibrated for the CERES-Maize and CROPGRO-Soybean models; Table S2: Rain-fed grain yield of summer soybean and summer maize under different sowing date adjustments across climate scenarios; Table S3. Simulated grain yield of summer soybean and maize at 13 sowing dates under the historical baseline (2001–2020).
Author Contributions
Conceptualization, S.Z. and S.J.; methodology, S.Z.; software, S.Z. and W.D.; validation, S.Z.; formal analysis, S.Z.; investigation, S.Z. and H.Y.; resources, S.Z. and W.D.; data curation, W.D.; writing—original draft preparation, S.Z.; writing—review and editing, S.Z.; visualization, S.Q.; supervision, S.Q.; project administration, H.Y.; funding acquisition, S.Z., S.Q. and S.J. All authors have read and agreed to the published version of the manuscript.
Funding
This work was financially supported by the National Natural Science Foundation of China (Grant No. 52509046; 51409002), the Anhui Provincial Natural Science Foundation (Grant No. 2508085QE207), the Young Science and Technology Talent Cultivation Program of Hubei Province (Grant No. 2026DJA081), and the self-dependent Research and Development plan of Anhui and Huaihe River Institute of Hydraulic Research (Grant No. KJGG202503).
Data Availability Statement
The original contributions presented in this study are included in the article. Further inquiries can be directed to the corresponding author.
Acknowledgments
The authors express their gratitude to Yanqi Wei for her dedicated work on field trials and localized calibration of the DSSAT model in the Huaibei Plain. Her prior research laid the essential methodological groundwork for this study.
Conflicts of Interest
The authors declare no conflicts of interest.
References
- Li, S.; Liu, Y.; Li, J.; Zhang, X. Reconstruction of the evolution of cropping pattern in the North China Plain since the Qing Dynasty and driver analysis. Acta Geogr. Sin. 2024, 79, 765–778, (In Chinese with English abstract). [Google Scholar] [CrossRef]
- Yang, S.; Zhao, Y.; Xu, Y.; Cui, J.; Li, T.; Hu, Y.; Qian, X.; Li, Z.; Sui, P.; Chen, Y. Yield performance response to field configuration of maize and soybean intercropping in China: A meta-analysis. Field Crops Res. 2024, 306, 109235. [Google Scholar] [CrossRef] [Scilit]
- Yuan, X.T.; Xu, G.W.; Xu, G.L. Analysis of Temperature Trends and Spatial Variability in Huaibei Plain. Appl. Mech. Mater. 2012, 204–208, 2813–2816. [Google Scholar] [CrossRef] [Scilit]
- Xu, D.; Liu, D.; Yan, Z.; Ren, S.; Xu, Q. Spatiotemporal Variation Characteristics of Precipitation in the Huaihe River Basin, China, as a Result of Climate Change. Water 2023, 15, 181. [Google Scholar] [CrossRef] [Scilit]
- Chen, S.; Huang, B.; Yuan, F.; Berndtsson, R.; Qiu, J.; Chen, X.; Hao, Z. Spatiotemporal Changes in Precipitation and Temperature in the Huaibei Plain and the Relation between Local Precipitation and Global Teleconnection Patterns. J. Hydrol. Eng. 2019, 24, 05019019. [Google Scholar] [CrossRef] [Scilit]
- Yao, Y.; Xu, Y.; Ma, X.Q. Influence of precipitation change on climatic potential productivity of major crops in the Huaihe River Basin. Resour. Sci. 2017, 39, 490–500, (In Chinese with English abstract). [Google Scholar] [CrossRef] [Scilit][Green Version]
- Jin, N.; Guo, L. The Impact of Extreme Temperatures on Grain Production in the Huaihe River Basin. Acad. J. Manag. Soc. Sci. 2023, 3, 64–69. [Google Scholar] [CrossRef] [Scilit]
- Rezaei, E.E.; Webber, H.; Asseng, S.; Boote, K.; Durand, J.L.; Ewert, F.; Martre, P.; MacCarthy, D.S. Climate change impacts on crop yields. Nat. Rev. Earth Environ. 2023, 4, 831–846. [Google Scholar] [CrossRef] [Scilit]
- Ellsworth, D.S.; Reich, P.B.; Naumburg, E.; Koch, G.W.; Kubiske, M.E.; Smith, S.D. Photosynthesis, carboxylation and leaf nitrogen responses of 16 species to elevated pCO2 across four free-air CO2 enrichment experiments in forest, grassland and desert. Glob. Change Biol. 2004, 10, 2121–2138. [Google Scholar] [CrossRef] [Scilit]
- Ainsworth, E.A.; Rogers, A. The response of photosynthesis and stomatal conductance to rising [CO2]: Mechanisms and environmental interactions. Plant Cell Environ. 2007, 30, 258–270. [Google Scholar] [CrossRef] [Scilit]
- Hussain, M.Z.; VanLoocke, A.; Siebers, M.H.; Ruiz-Vera, U.M.; Cody Markelz, R.J.; Leakey, A.D.B.; Ort, D.R.; Bernacchi, C.J. Future carbon dioxide concentration decreases canopy evapotranspiration and soil water depletion by field-grown maize. Glob. Change Biol. 2013, 19, 1572–1584. [Google Scholar] [CrossRef] [Scilit]
- Bishop, K.A.; Leakey, A.D.B.; Ainsworth, E.A. How seasonal temperature or water inputs affect the relative response of C3 crops to elevated [CO2]: A global analysis of open top chamber and free air CO2 enrichment studies. Food Energy Secur. 2014, 3, 33–45. [Google Scholar] [CrossRef] [Scilit]
- Lohani, N.; Singh, M.B.; Bhalla, P.L. High temperature susceptibility of sexual reproduction in crop plants. J. Exp. Bot. 2020, 71, 555–568. [Google Scholar] [CrossRef] [Scilit]
- Zhang, P.; Sharwood, R.E.; Carroll, A.; Estavillo, G.M.; Caemmerer, S.V.; Furbank, R.T. Systems analysis of long-term heat stress responses in the C4 grass Setaria viridis. Plant Cell 2025, 37, koaf005. [Google Scholar] [CrossRef] [Scilit]
- Chavan, S.R.N.; Mandalapu, H.D.; Reddy, C. Heat Stress Physiology in C4 Crop Plants: Molecular Mechanisms, Omics Approaches and Strategies for Enhanced Thermotolerance. Int. J. Plant Soil Sci. 2025, 37, 78–90. [Google Scholar] [CrossRef] [Scilit]
- Dadrasi, A.; Soltani, E.; Makowski, D.; Lamichhane, J.R. Does shifting from normal to early or late sowing dates provide yield benefits? A global meta-analysis. Field Crops Res. 2024, 318, 109600. [Google Scholar] [CrossRef] [Scilit]
- Guo, D.; Chen, C.; Li, X.; Wang, R.; Ding, Z.; Ma, W.; Wang, X.; Li, C.; Zhao, M.; Li, M.; et al. Adjusting sowing date improves the photosynthetic capacity and grain yield by optimizing temperature condition around flowering of summer maize in the North China Plain. Front. Plant Sci. 2022, 13, 934618. [Google Scholar] [CrossRef] [Scilit]
- Zheng, H.; Zhang, L.; Sun, H.; Zheng, A.; Harrison, M.T.; Li, W.; Zou, J.; Zhang, D.; Chen, F.; Yin, X. Optimal sowing time to adapt soybean production to global warming with different cultivars in the Huanghuaihai Farming Region of China. Field Crops Res. 2024, 312, 109386. [Google Scholar] [CrossRef] [Scilit]
- Xu, Q.; Liang, H.; Wei, Z.; Zhang, Y.; Lu, X.; Li, F.; Wei, N.; Zhang, S.; Yuan, H.; Liu, S.; et al. Assessing Climate Change Impacts on Crop Yields and Exploring Adaptation Strategies in Northeast China. Earth’s Future 2024, 12, e2023EF004063. [Google Scholar] [CrossRef] [Scilit]
- Wei, Y.; Jin, J.; Li, H.; Zhou, Y.; Cui, Y.; Commey, N.A.; Zhang, Y.; Jiang, S. Assessment of Agricultural Drought Vulnerability Based on Crop Growth Stages: A Case Study of Huaibei Plain, China. Int. J. Disaster Risk Sci. 2023, 14, 209–222. [Google Scholar] [CrossRef] [Scilit]
- Pu, L.; Ma, M. Spatial–Temporal Heterogeneity Responses of Three Major Crop Yields to Climate Change in China During 2000–2018. Land 2026, 15, 584. [Google Scholar] [CrossRef] [Scilit]
- Liu, S.; Mo, X.; Lin, Z.; Xu, Y.; Ji, J.; Wen, G.; Richey, J. Crop yield responses to climate change in the Huang-Huai-Hai Plain of China. Agric. Water Manag. 2010, 97, 1195–1209. [Google Scholar] [CrossRef] [Scilit]
- Timlin, D.; Paff, K.; Han, E. The role of crop simulation modeling in assessing potential climate change impacts. Agrosyst. Geosci. Environ. 2024, 7, e20453. [Google Scholar] [CrossRef] [Scilit]
- Jones, J.W.; Hoogenboom, G.; Porter, C.H.; Boote, K.J.; Batchelor, W.D.; Hunt, L.A.; Wilkens, P.W.; Singh, U.; Gijsman, A.J.; Ritchie, J.T. The DSSAT cropping system model. Eur. J. Agron. 2003, 18, 235–265. [Google Scholar] [CrossRef] [Scilit]
- Hoogenboom, G.; Porter, C.H.; Boote, K.J.; Shelia, V.; Wilkens, P.W.; Singh, U.; White, J.W.; Asseng, S.; Lizaso, J.I.; Moreno, L.P.; et al. The DSSAT crop modeling ecosystem. In Advances in Crop Modeling for a Sustainable Agriculture; Boote, K.J., Ed.; Burleigh Dodds Science Publishing: Cambridge, UK, 2019; pp. 173–216. [Google Scholar] [CrossRef] [Scilit]
- Li, Y.; Chang, J.; Gao, X.; Zhang, L.; Wang, L.; Ren, C. A Case Study on the Impacts of Future Climate Change on Soybean Yield and Countermeasures in Fujin City of Heilongjiang Province, China. Front. Agron. 2024, 6, 1257830. [Google Scholar] [CrossRef] [Scilit]
- Saddique, Q.; Cai, H.; Xu, J.; Ajaz, A.; He, J.; Yu, Q.; Wang, Y.; Chen, H.; Khan, M.I.; Liu, D.L.; et al. Analyzing Adaptation Strategies for Maize Production under Future Climate Change in Guanzhong Plain, China. Mitig. Adapt. Strateg. Glob. Change 2020, 25, 1523–1543. [Google Scholar] [CrossRef] [Scilit]
- Wei, Y.; Jin, J.; Jiang, S.; Ning, S.; Cui, Y.; Zhou, Y. Simulated Assessment of Summer Maize Drought Loss Sensitivity in Huaibei Plain, China. Agronomy 2019, 9, 78. [Google Scholar] [CrossRef] [Scilit]
- Wei, Y.; Jin, J.; Cui, Y.; Ning, S.; Zhou, Y.; Liu, Y.; Zhang, B.; Chen, H.; Wang, G. Quantitative Assessment of Soybean Drought Risk in Bengbu City Based on Disaster Loss Risk Curve and DSSAT. Int. J. Disaster Risk Reduct. 2021, 56, 102126. [Google Scholar] [CrossRef] [Scilit]
- Xiao, R.; Zhu, Y.; Lv, H.; Liang, C.; Pei, K.; Li, Y.; Li, Y. Spatiotemporal Patterns and Driving Factors of Meteorological and Agricultural Droughts during Winter Wheat-Summer Maize Growth Period in the Huaibei Plain. J. Irrig. Drain. Eng. 2026, 45, 71–81, (In Chinese with English abstract). [Google Scholar] [CrossRef]
- Cui, Y.; Tang, H.; Jin, J.; Zhou, Y.; Jiang, S.; Chen, M. System Structure–Based Drought Disaster Risk Assessment Using Remote Sensing and Field Experiment Data. Remote Sens. 2022, 14, 5700. [Google Scholar] [CrossRef] [Scilit]
- Boote, K.J.; Hoogenboom, G.; Porter, C.H.; Pavan, W.; Shelia, V.; Singh, U.; White, J.W.; Asseng, S.; Lizaso, J.I.; Moreno, L.P.; et al. The Decision Support System for Agrotechnology Transfer (DSSAT) Crop Modeling Ecosystem: Evolution and Advances. In Current Crop Models: State-of-the-Art and Future Developments; Hoogenboom, G., Ed.; Burleigh Dodds Science Publishing: Cambridge, UK, 2025; pp. 3–63. [Google Scholar] [CrossRef] [Scilit]
- He, J.; Dukes, M.D.; Jones, J.W.; Graham, W.D.; Judge, J. Applying GLUE for Estimating CERES-Maize Genetic and Soil Parameters for Sweet Corn Production. Trans. ASABE 2009, 52, 1907–1921. [Google Scholar] [CrossRef] [Scilit]
- Ainsworth, E.A.; Davey, P.A.; Bernacchi, C.J.; Dermody, O.C.; Heaton, E.A.; Moore, D.J.; Morgan, P.B.; Naidu, S.L.; Yoo-Ra, H.; Zhu, X.; et al. A Meta-Analysis of Elevated [CO2] Effects on Soybean (Glycine max) Physiology, Growth and Yield. Glob. Change Biol. 2002, 8, 695–709. [Google Scholar] [CrossRef] [Scilit]
- Leakey, A.D.B.; Uribelarrea, M.; Ainsworth, E.A.; Naidu, S.L.; Rogers, A.; Ort, D.R.; Long, S.P. Photosynthesis, Productivity, and Yield of Maize Are Not Affected by Open-Air Elevation of CO2 Concentration in the Absence of Drought. Plant Physiol. 2006, 140, 779–790. [Google Scholar] [CrossRef] [Scilit]
- Allen, R.G.; Pereira, L.S.; Raes, D.; Smith, M. Crop Evapotranspiration: Guidelines for Computing Crop Water Requirements; FAO Irrigation and Drainage Paper 56; Food and Agriculture Organization of the United Nations: Rome, Italy, 1998; Available online: https://www.fao.org/4/X0490E/x0490e00.htm (accessed on 1 June 2026).
- Büchner, M.; Reyer, C. ISIMIP3b Atmospheric Composition Input Data; Version 1.1; ISIMIP Repository: Potsdam, Germany, 2022. [Google Scholar] [CrossRef]
- Lange, S. Trend-preserving bias adjustment and statistical downscaling with ISIMIP3BASD (v1.0). Geosci. Model Dev. 2019, 12, 3055–3070. [Google Scholar] [CrossRef] [Scilit]
- He, S.; Chen, K.; Liu, Z.; Deng, L. Exploring the impacts of climate change and human activities on future runoff variations at the seasonal scale. J. Hydrol. 2023, 619, 129382. [Google Scholar] [CrossRef] [Scilit]
- Jägermeyr, J.; Müller, C.; Ruane, A.C.; Elliott, J.; Balkovic, J.; Castillo, O.; Faye, B.; Foster, I.; Folberth, C.; Franke, J.A.; et al. Climate Impacts on Global Agriculture Emerge Earlier in New Generation of Climate and Crop Models. Nat. Food 2021, 2, 873–885. [Google Scholar] [CrossRef] [Scilit]
- Liu, D.L.; Zuo, H. Statistical downscaling of daily climate variables for climate change impact assessment over New South Wales, Australia. Clim. Change 2012, 115, 629–666. [Google Scholar] [CrossRef] [Scilit]
- Li, Z.; Liu, Y.; Nie, T.; Xiao, X.; Guo, H.; Wang, T.; Han, Y. Projected Changes in Yield and Water Use Efficiency of Cold-Region Rice and the Role of CO2 Under Climate Change. Plants 2026, 15, 1625. [Google Scholar] [CrossRef] [Scilit]
- Sánchez, B.; Rasmussen, A.; Porter, J.R. Temperatures and the growth and development of maize and rice: A review. Glob. Change Biol. 2014, 20, 408–417. [Google Scholar] [CrossRef] [Scilit]
- Liu, H.; Lu, C.; Wang, S.; Ren, F.; Wang, H. Climate warming extends growing season but not reproductive phase of terrestrial plants. Glob. Ecol. Biogeogr. 2021, 30, 950–960. [Google Scholar] [CrossRef] [Scilit]
- Jin, Z.; Zhuang, Q.; Wang, J.; Archontoulis, S.V.; Zobel, Z.; Kotamarthi, V.R. The combined and separate impacts of climate extremes on the current and future US rainfed maize and soybean production under elevated CO2. Glob. Change Biol. 2017, 23, 2687–2704. [Google Scholar] [CrossRef] [Scilit]
- Wang, Y.; Tao, H.; Tian, B.; Sheng, D.; Xu, C.; Zhou, H.; Huang, S.; Wang, P. Flowering Dynamics, Pollen, and Pistil Contribution to Grain Yield in Response to High Temperature during Maize Flowering. Environ. Exp. Bot. 2019, 158, 80–88. [Google Scholar] [CrossRef] [Scilit]
- Lv, X.; Yao, Q.; Mao, F.; Liu, M.; Wang, Y.; Wang, X.; Gao, Y.; Wang, Y.; Liao, S.; Wang, P.; et al. Heat Stress and Sexual Reproduction in Maize: Unveiling the Most Pivotal Factors and the Greatest Opportunities. J. Exp. Bot. 2024, 75, 4219–4243. [Google Scholar] [CrossRef] [Scilit]
- Siebers, M.H.; Yendrek, C.R.; Drag, D.; Locke, A.M.; Rios Acosta, L.; Leakey, A.D.B.; Ainsworth, E.A.; Bernacchi, C.J.; Ort, D.R. Heat waves imposed during early pod development in soybean (Glycine max) cause significant yield loss despite a rapid recovery from oxidative stress. Glob. Change Biol. 2015, 21, 3114–3125. [Google Scholar] [CrossRef] [Scilit]
- Zeleke, K.; Nendel, C. Yield response and water productivity of soybean (Glycine max L.) to deficit irrigation and sowing time in south-eastern Australia. Agric. Water Manag. 2024, 296, 108815. [Google Scholar] [CrossRef] [Scilit]
- Dong, X.; Guan, L.; Zhang, P.; Liu, X.; Li, S.; Fu, Z.; Tang, L.; Qi, Z.; Qiu, Z.; Jin, C.; et al. Responses of maize with different growth periods to heat stress around flowering and early grain filling. Agric. For. Meteorol. 2021, 303, 108378. [Google Scholar] [CrossRef] [Scilit]
- Lu, H.; Xue, J.; Guo, D. Efficacy of planting date adjustment as a cultivation strategy to cope with drought stress and increase rainfed maize yield and water-use efficiency. Agric. Water Manag. 2016, 179, 227–235. [Google Scholar] [CrossRef] [Scilit]
- Zhai, L.; Zhang, L.; Yao, H.; Zheng, M.; Ming, B.; Xie, R.; Zhang, J.; Jia, X.; Ji, J. The Optimal Cultivar × Sowing Date × Plant Density for Grain Yield and Resource Use Efficiency of Summer Maize in the Northern Huang–Huai–Hai Plain of China. Agriculture 2022, 12, 7. [Google Scholar] [CrossRef] [Scilit]
- Wang, L.; Liao, S.; Huang, S.; Ming, B.; Meng, Q.; Wang, P. Increasing concurrent drought and heat during the summer maize season in Huang–Huai–Hai Plain, China. Int. J. Climatol. 2018, 38, 3177–3190. [Google Scholar] [CrossRef] [Scilit]
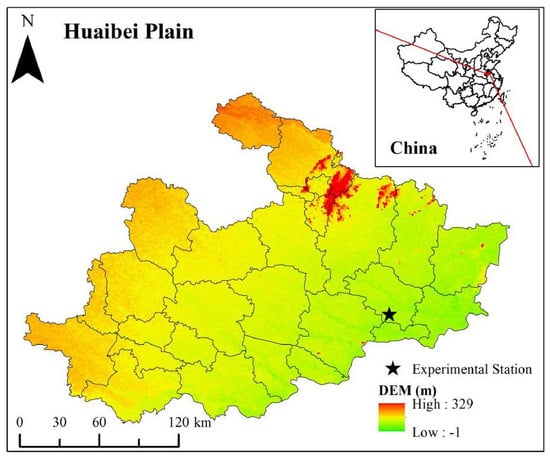
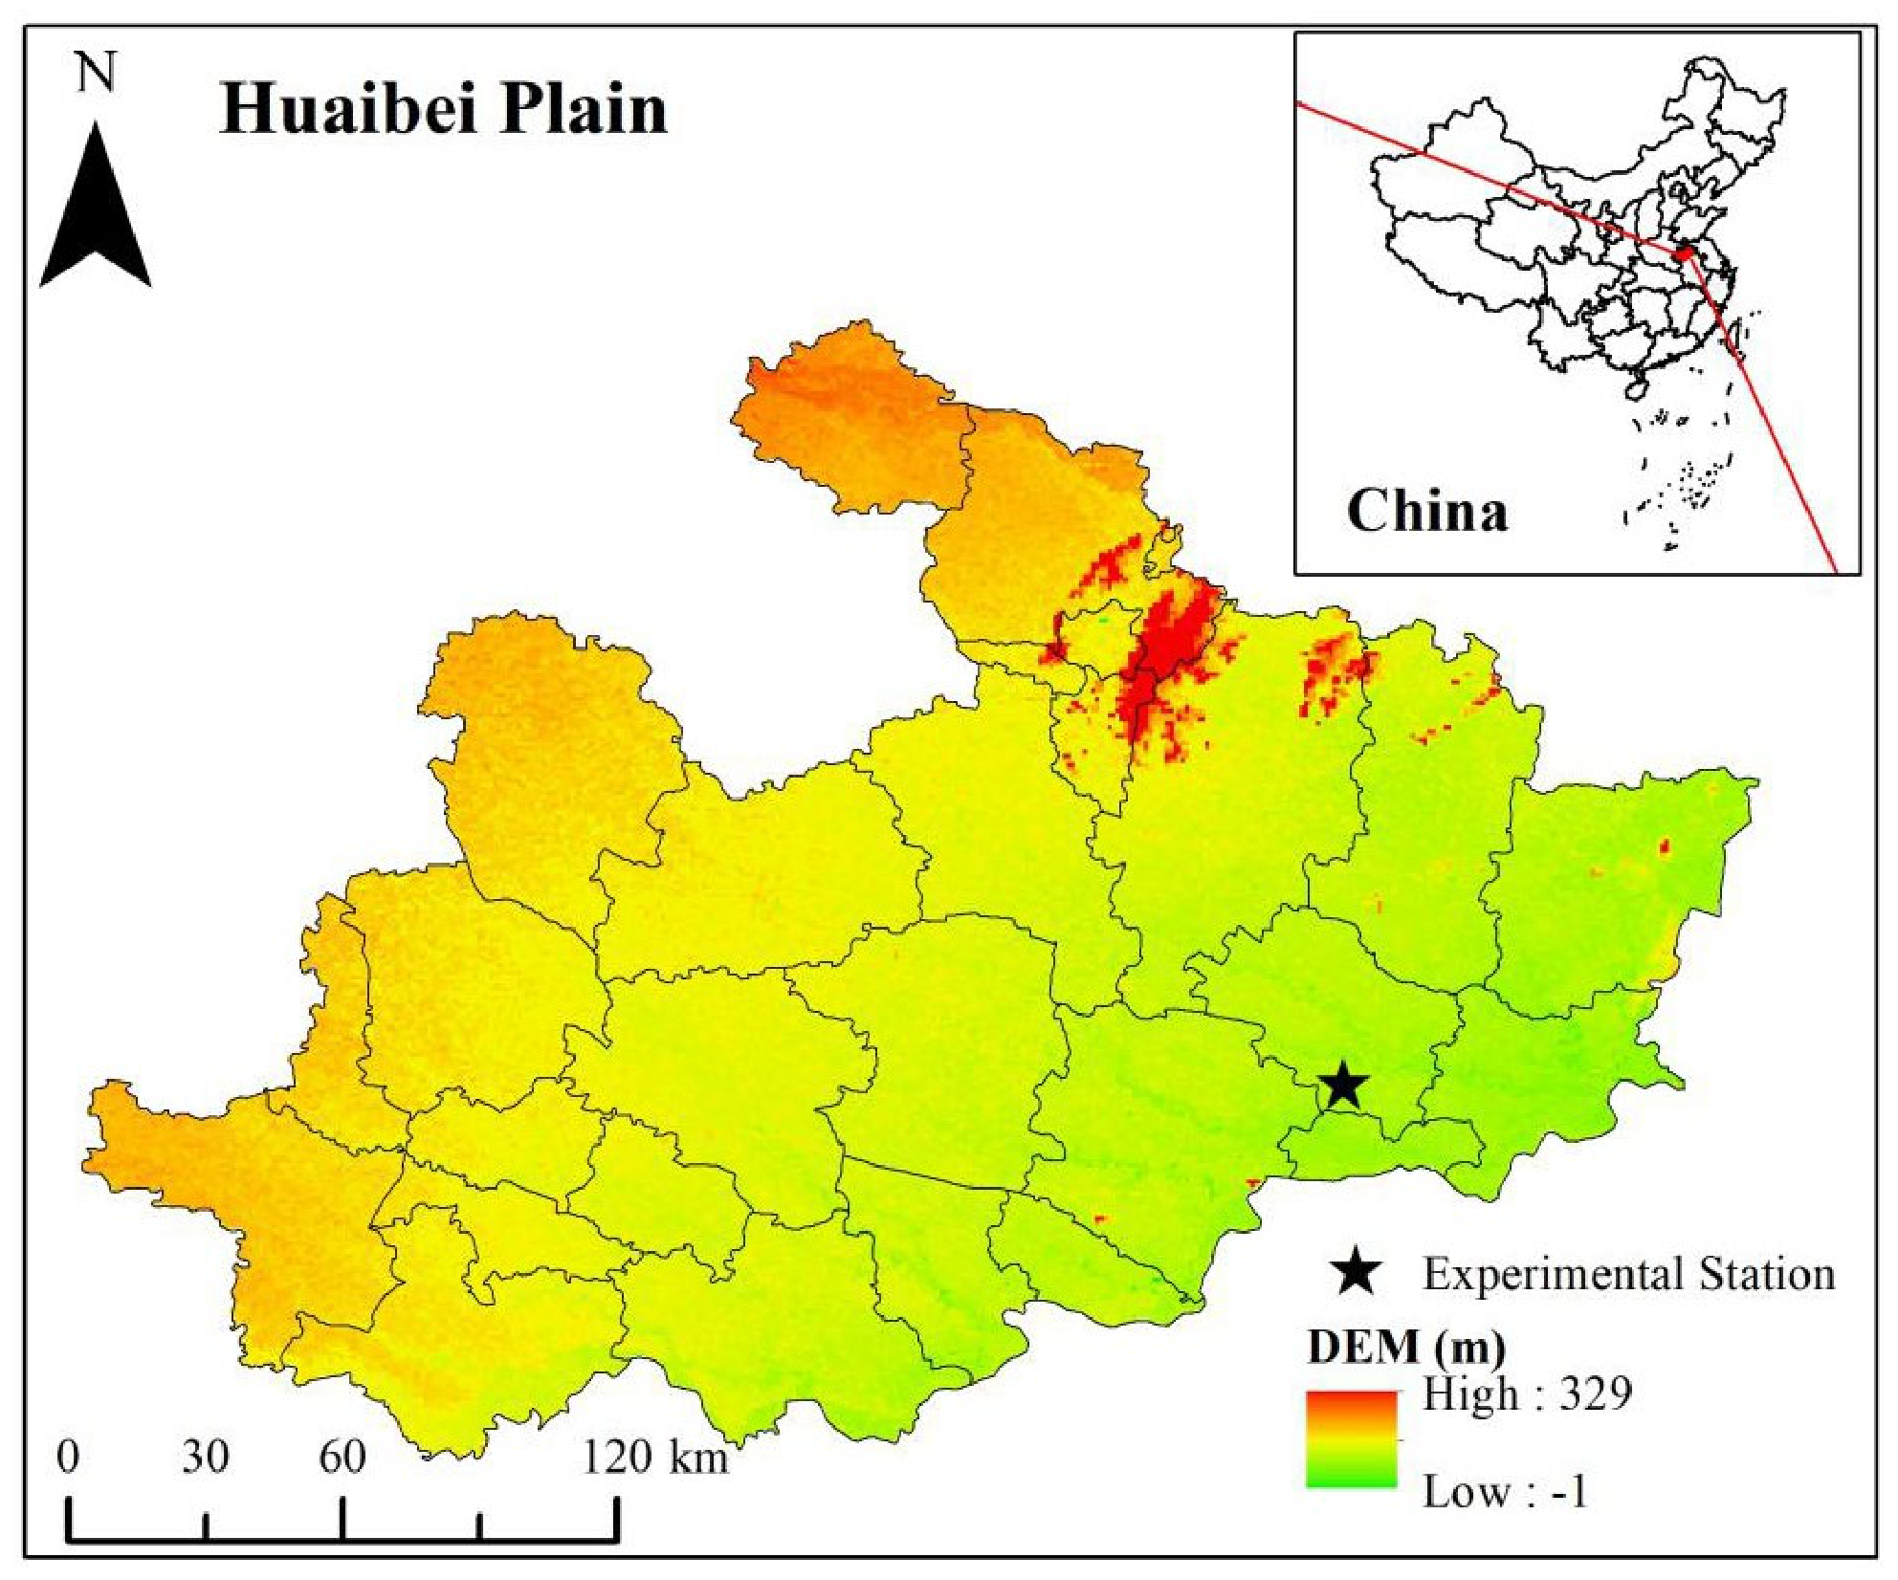
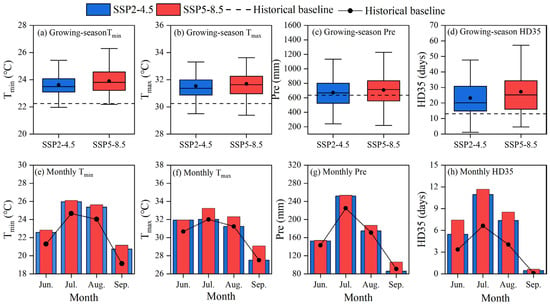
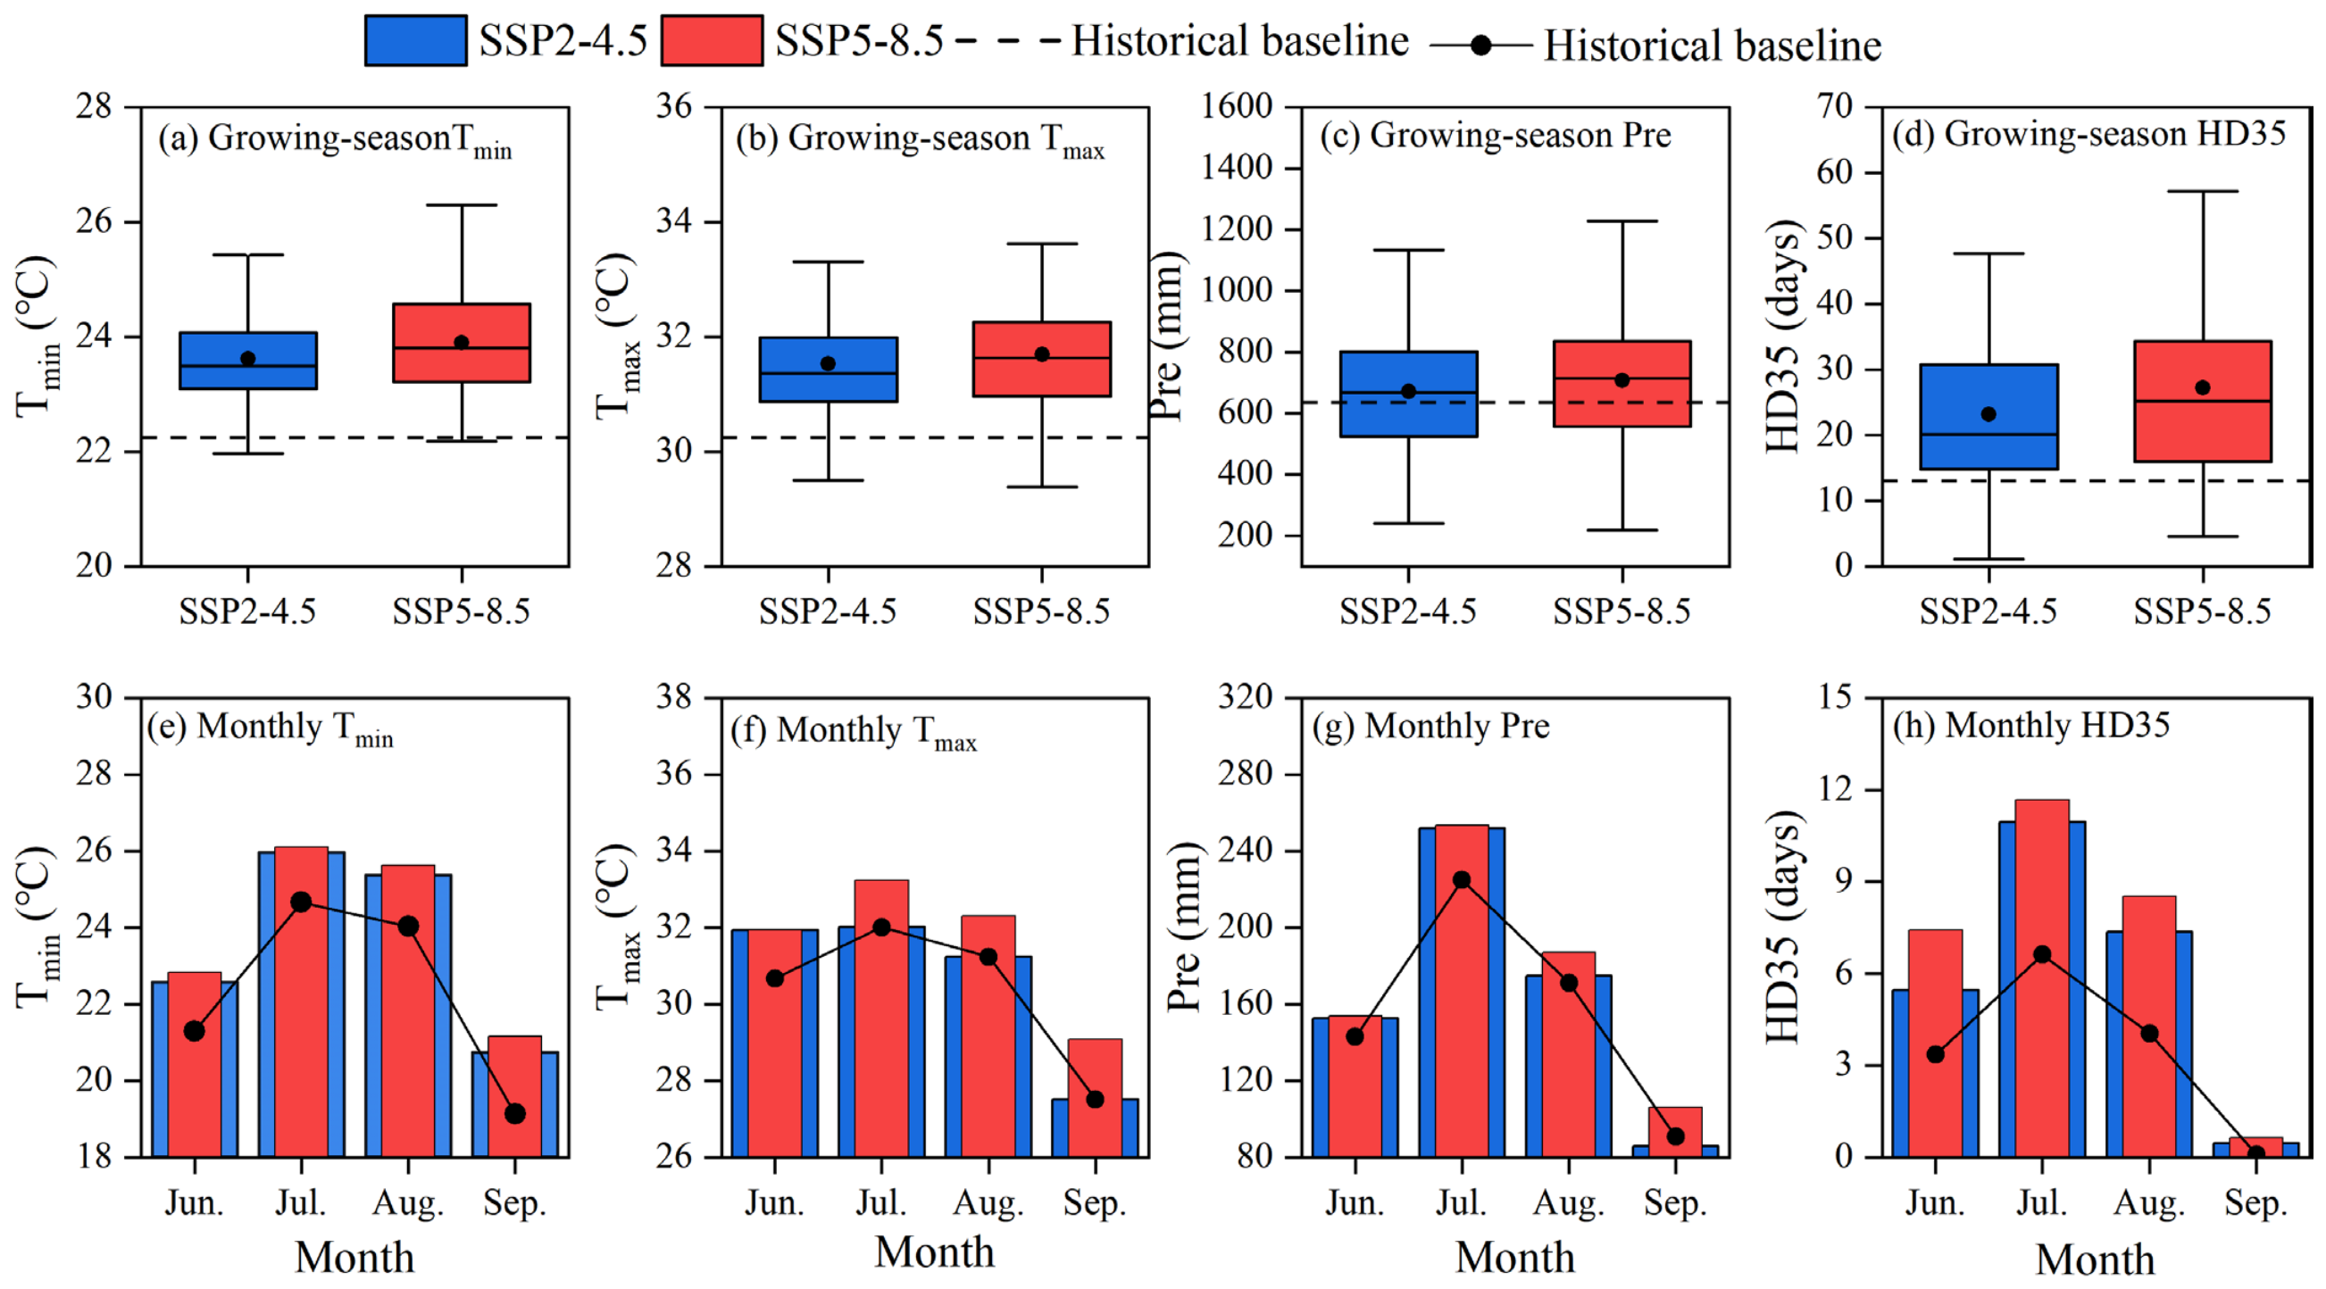
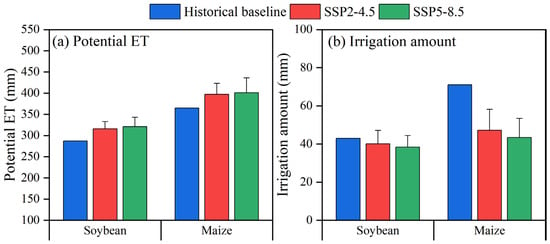
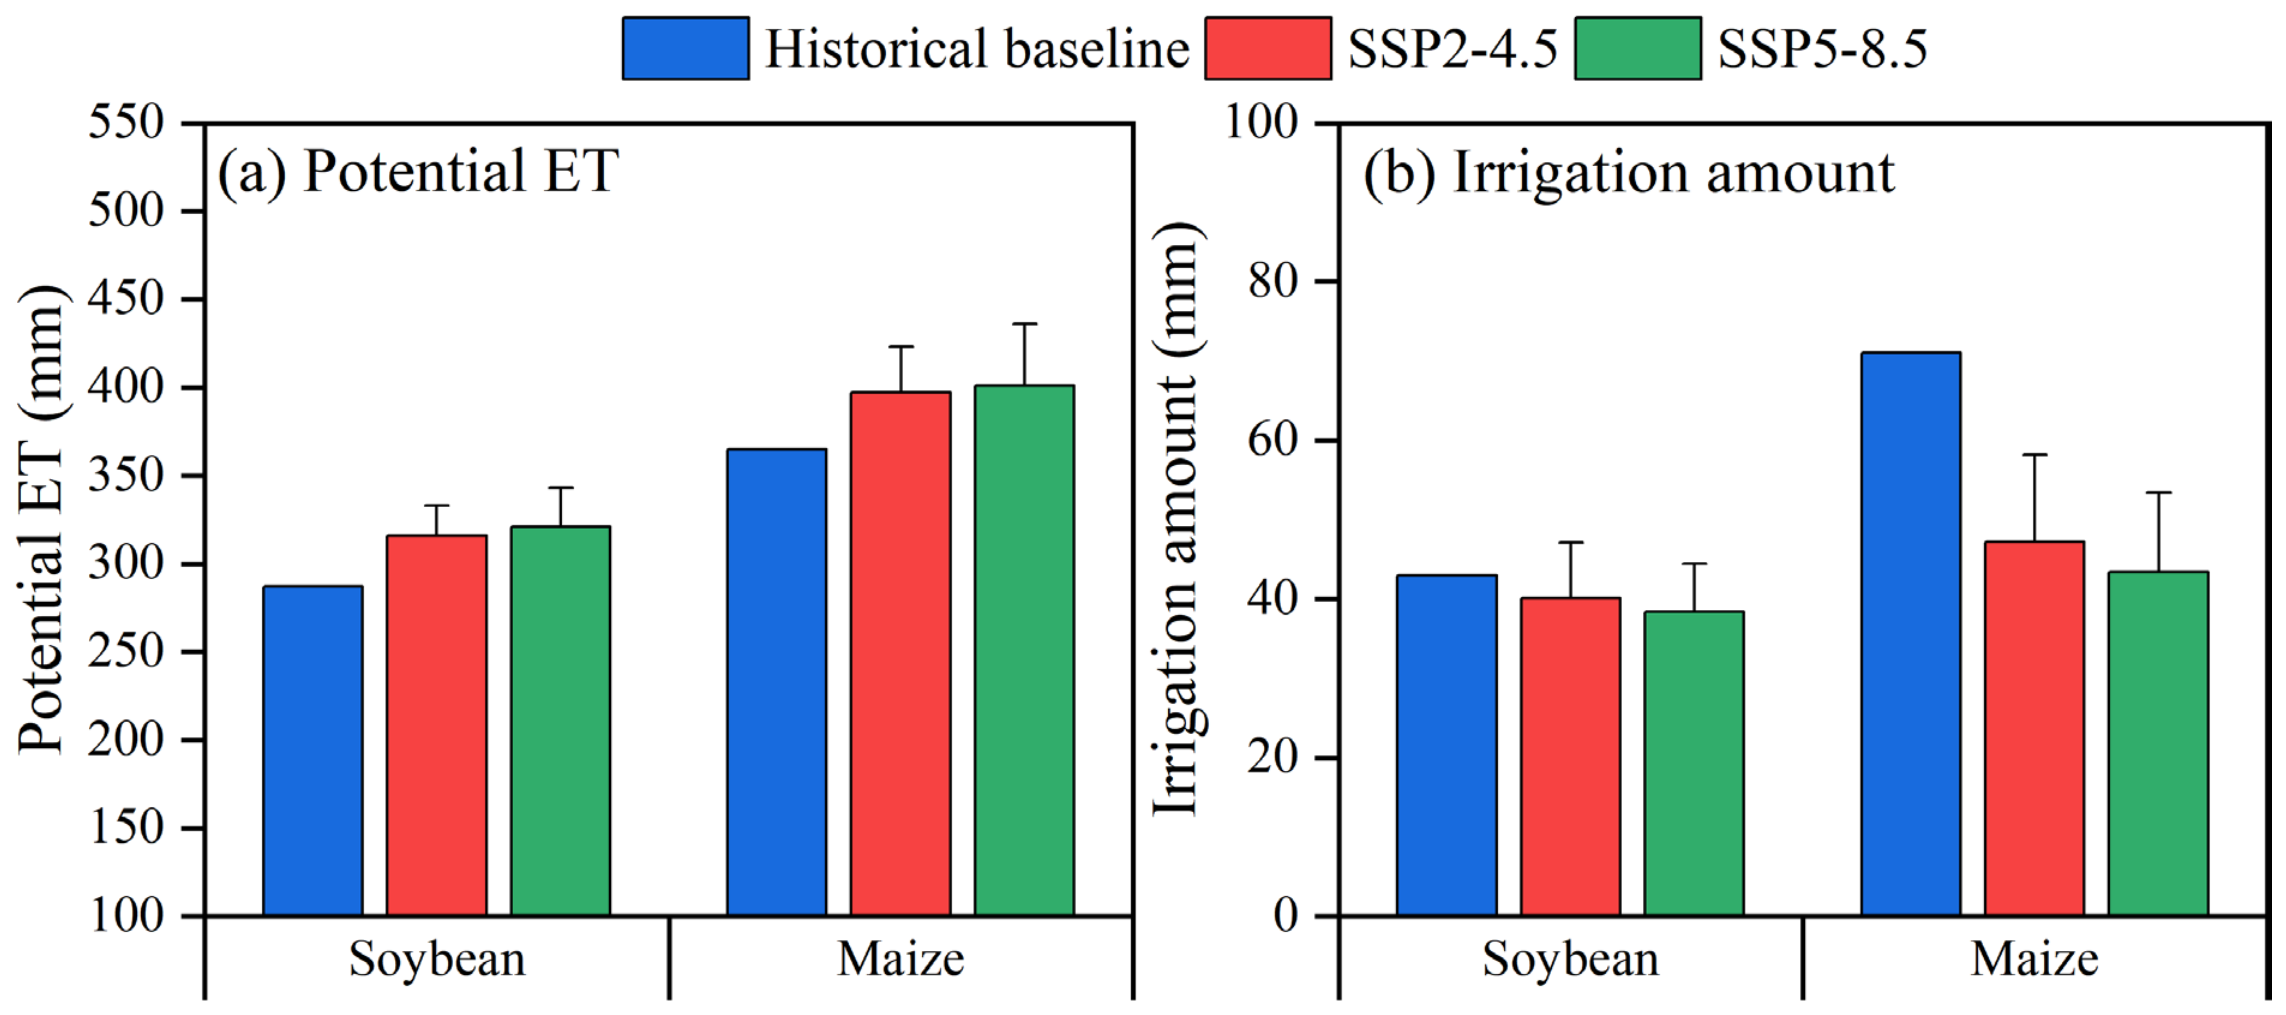
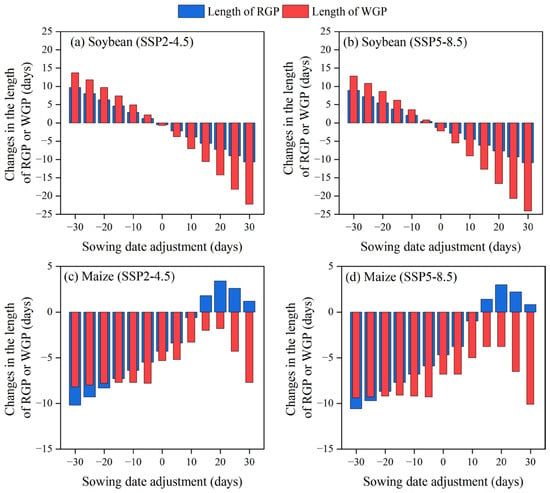
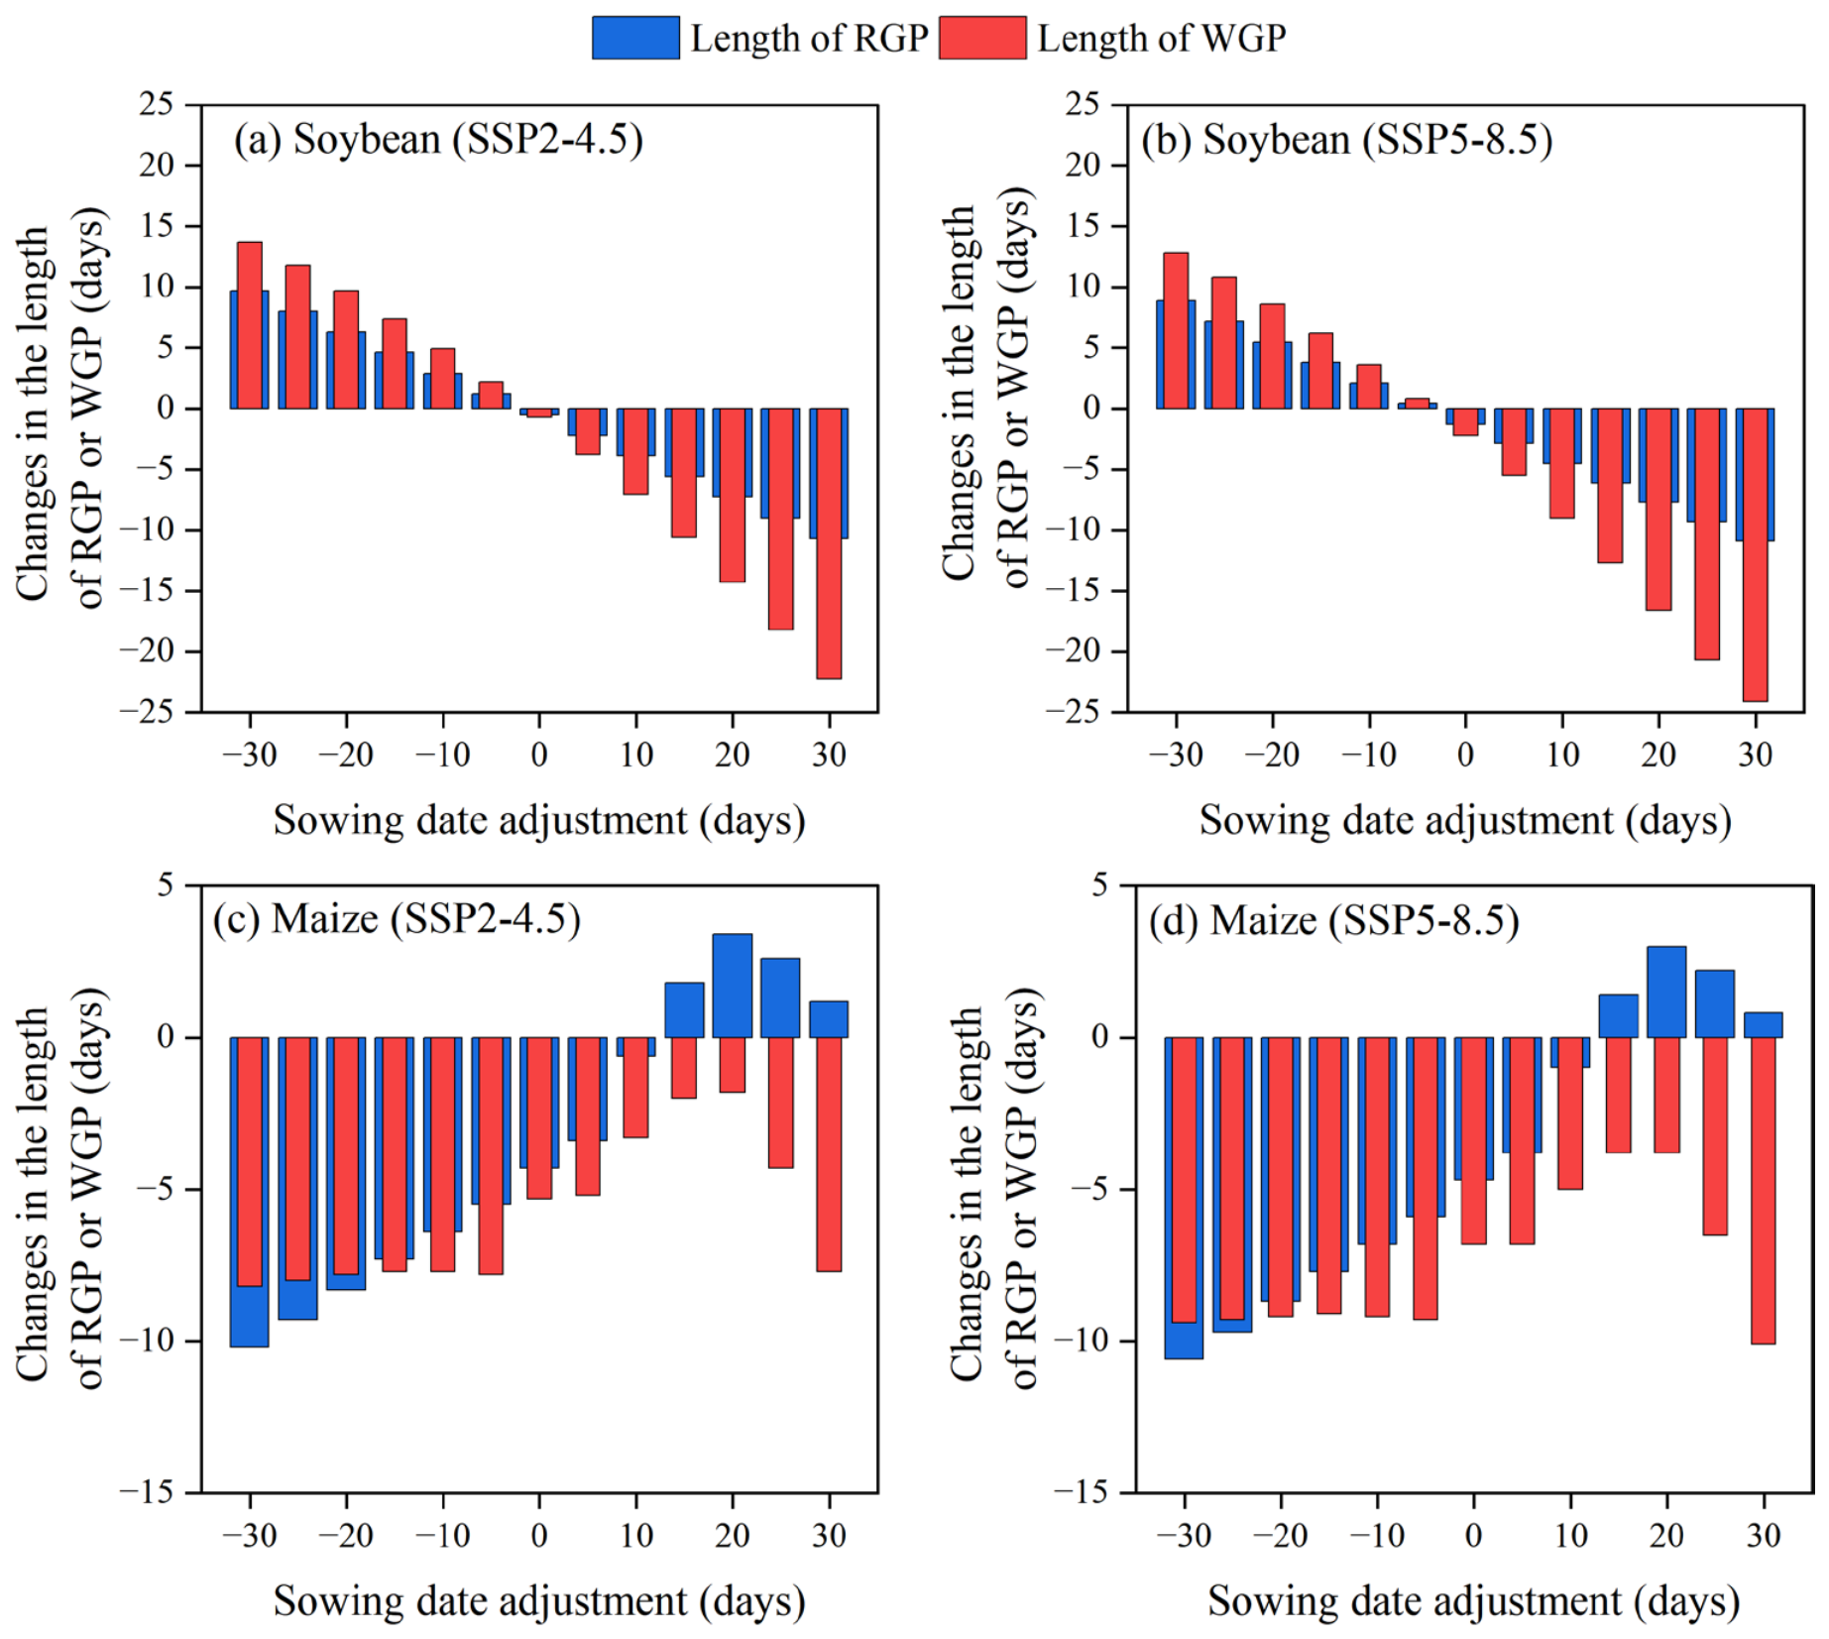
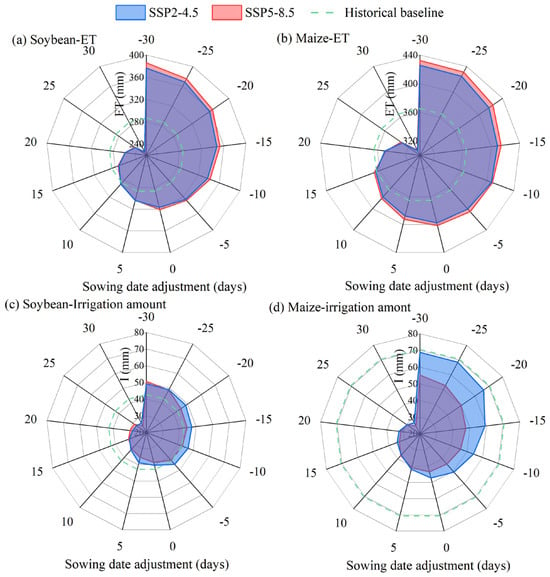
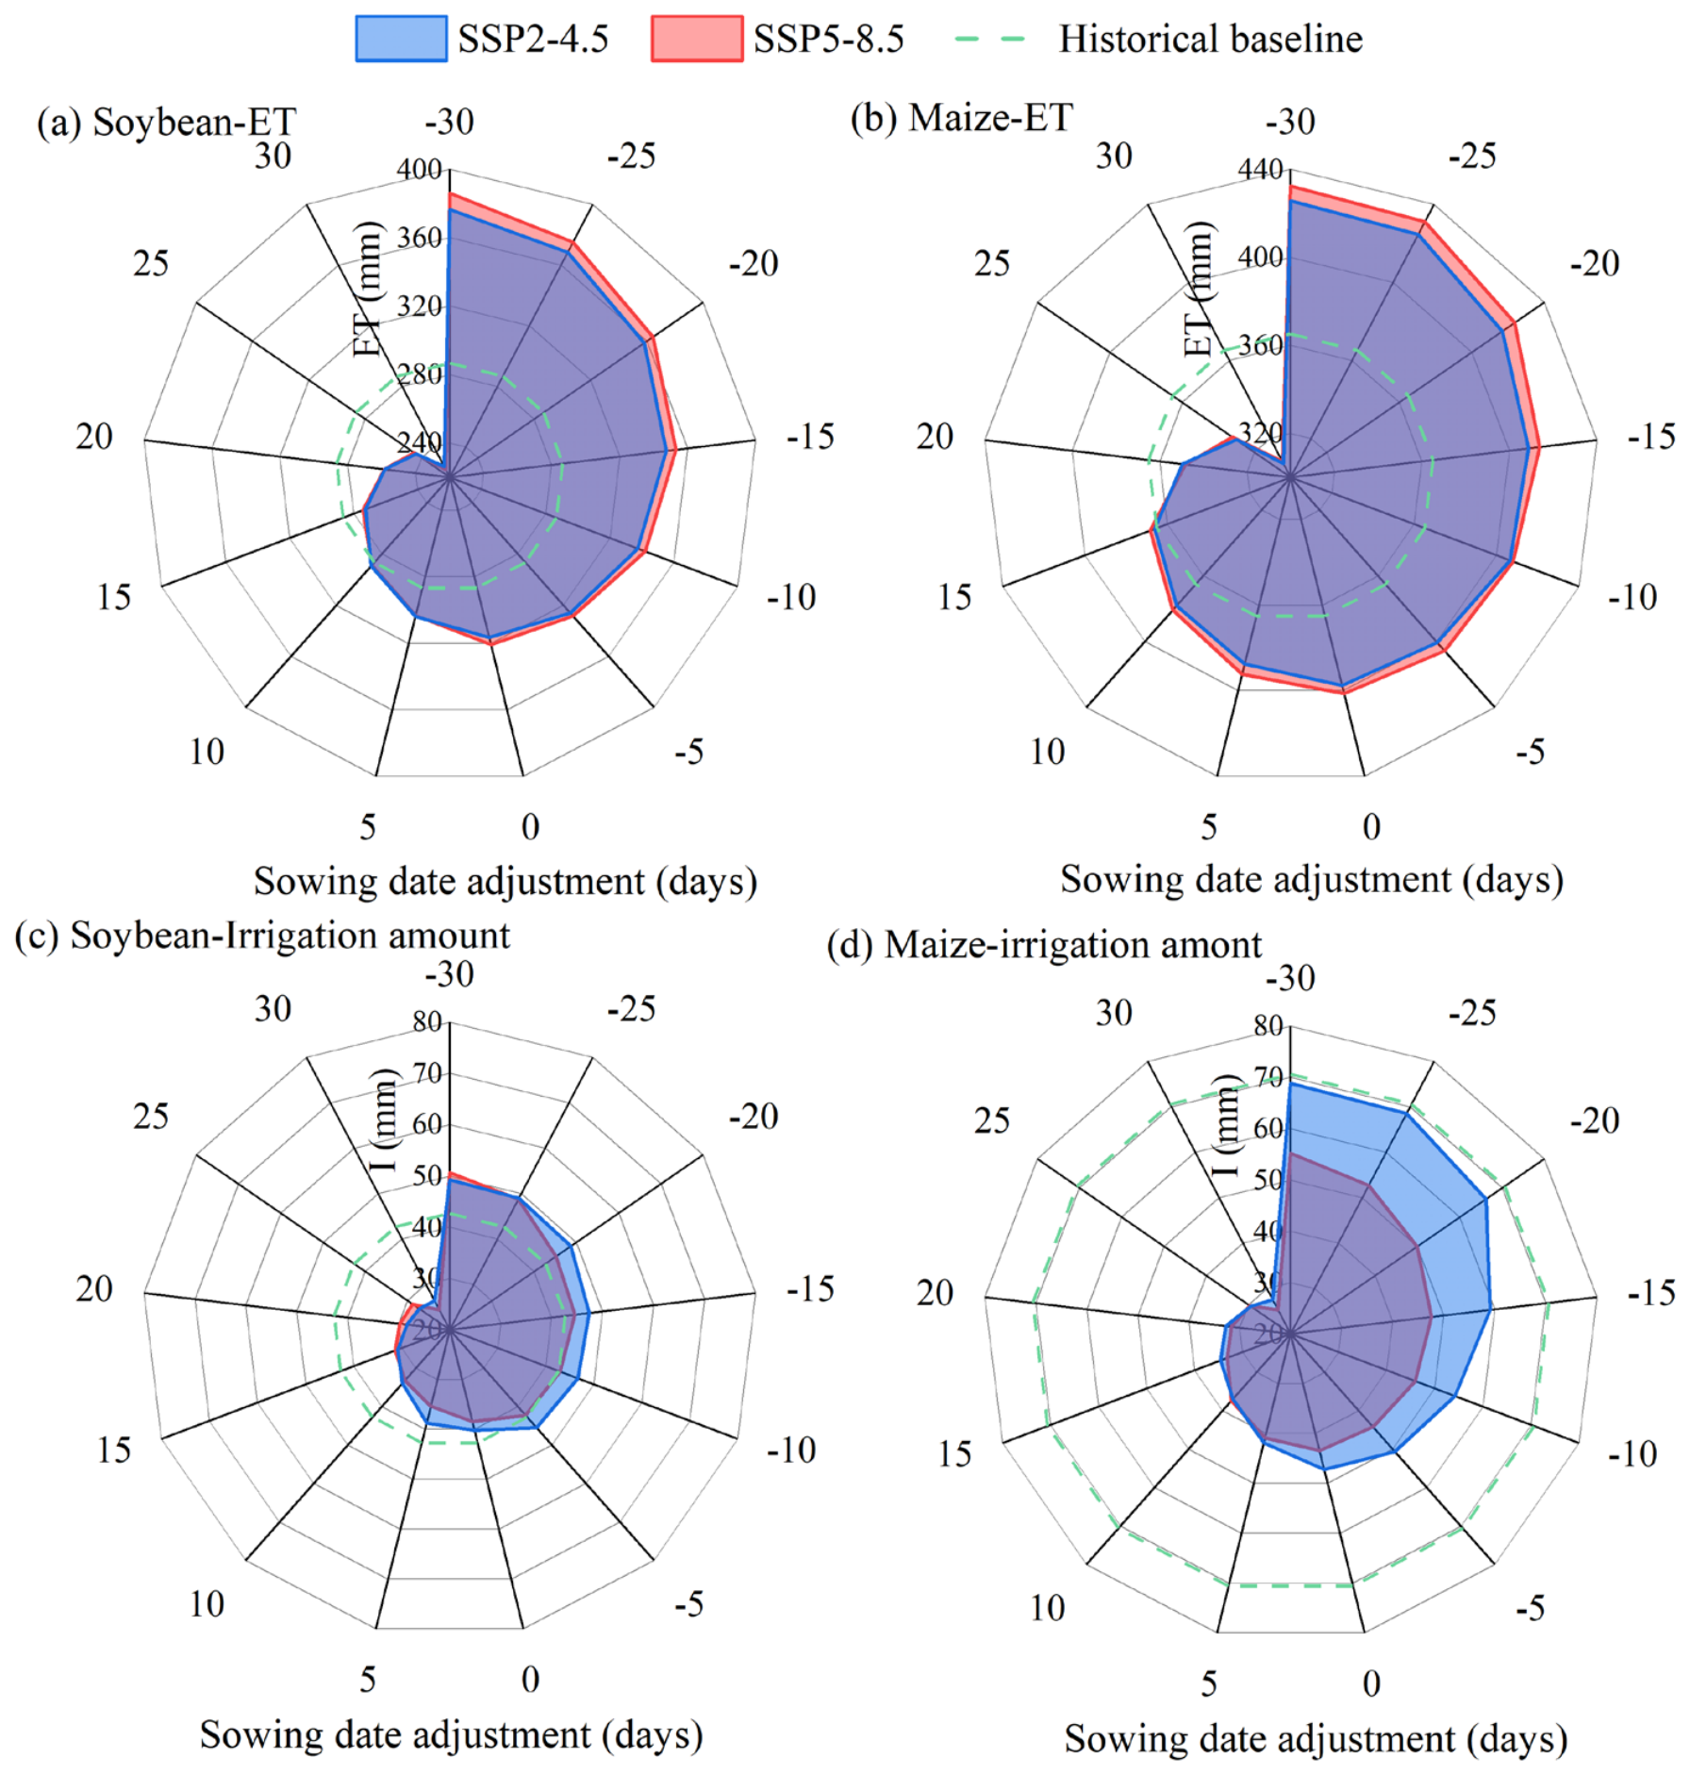
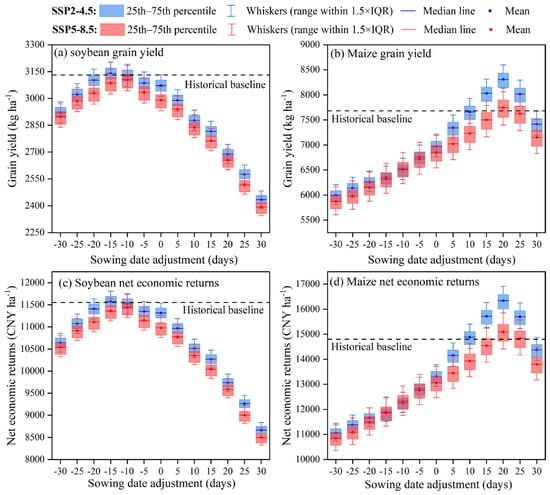
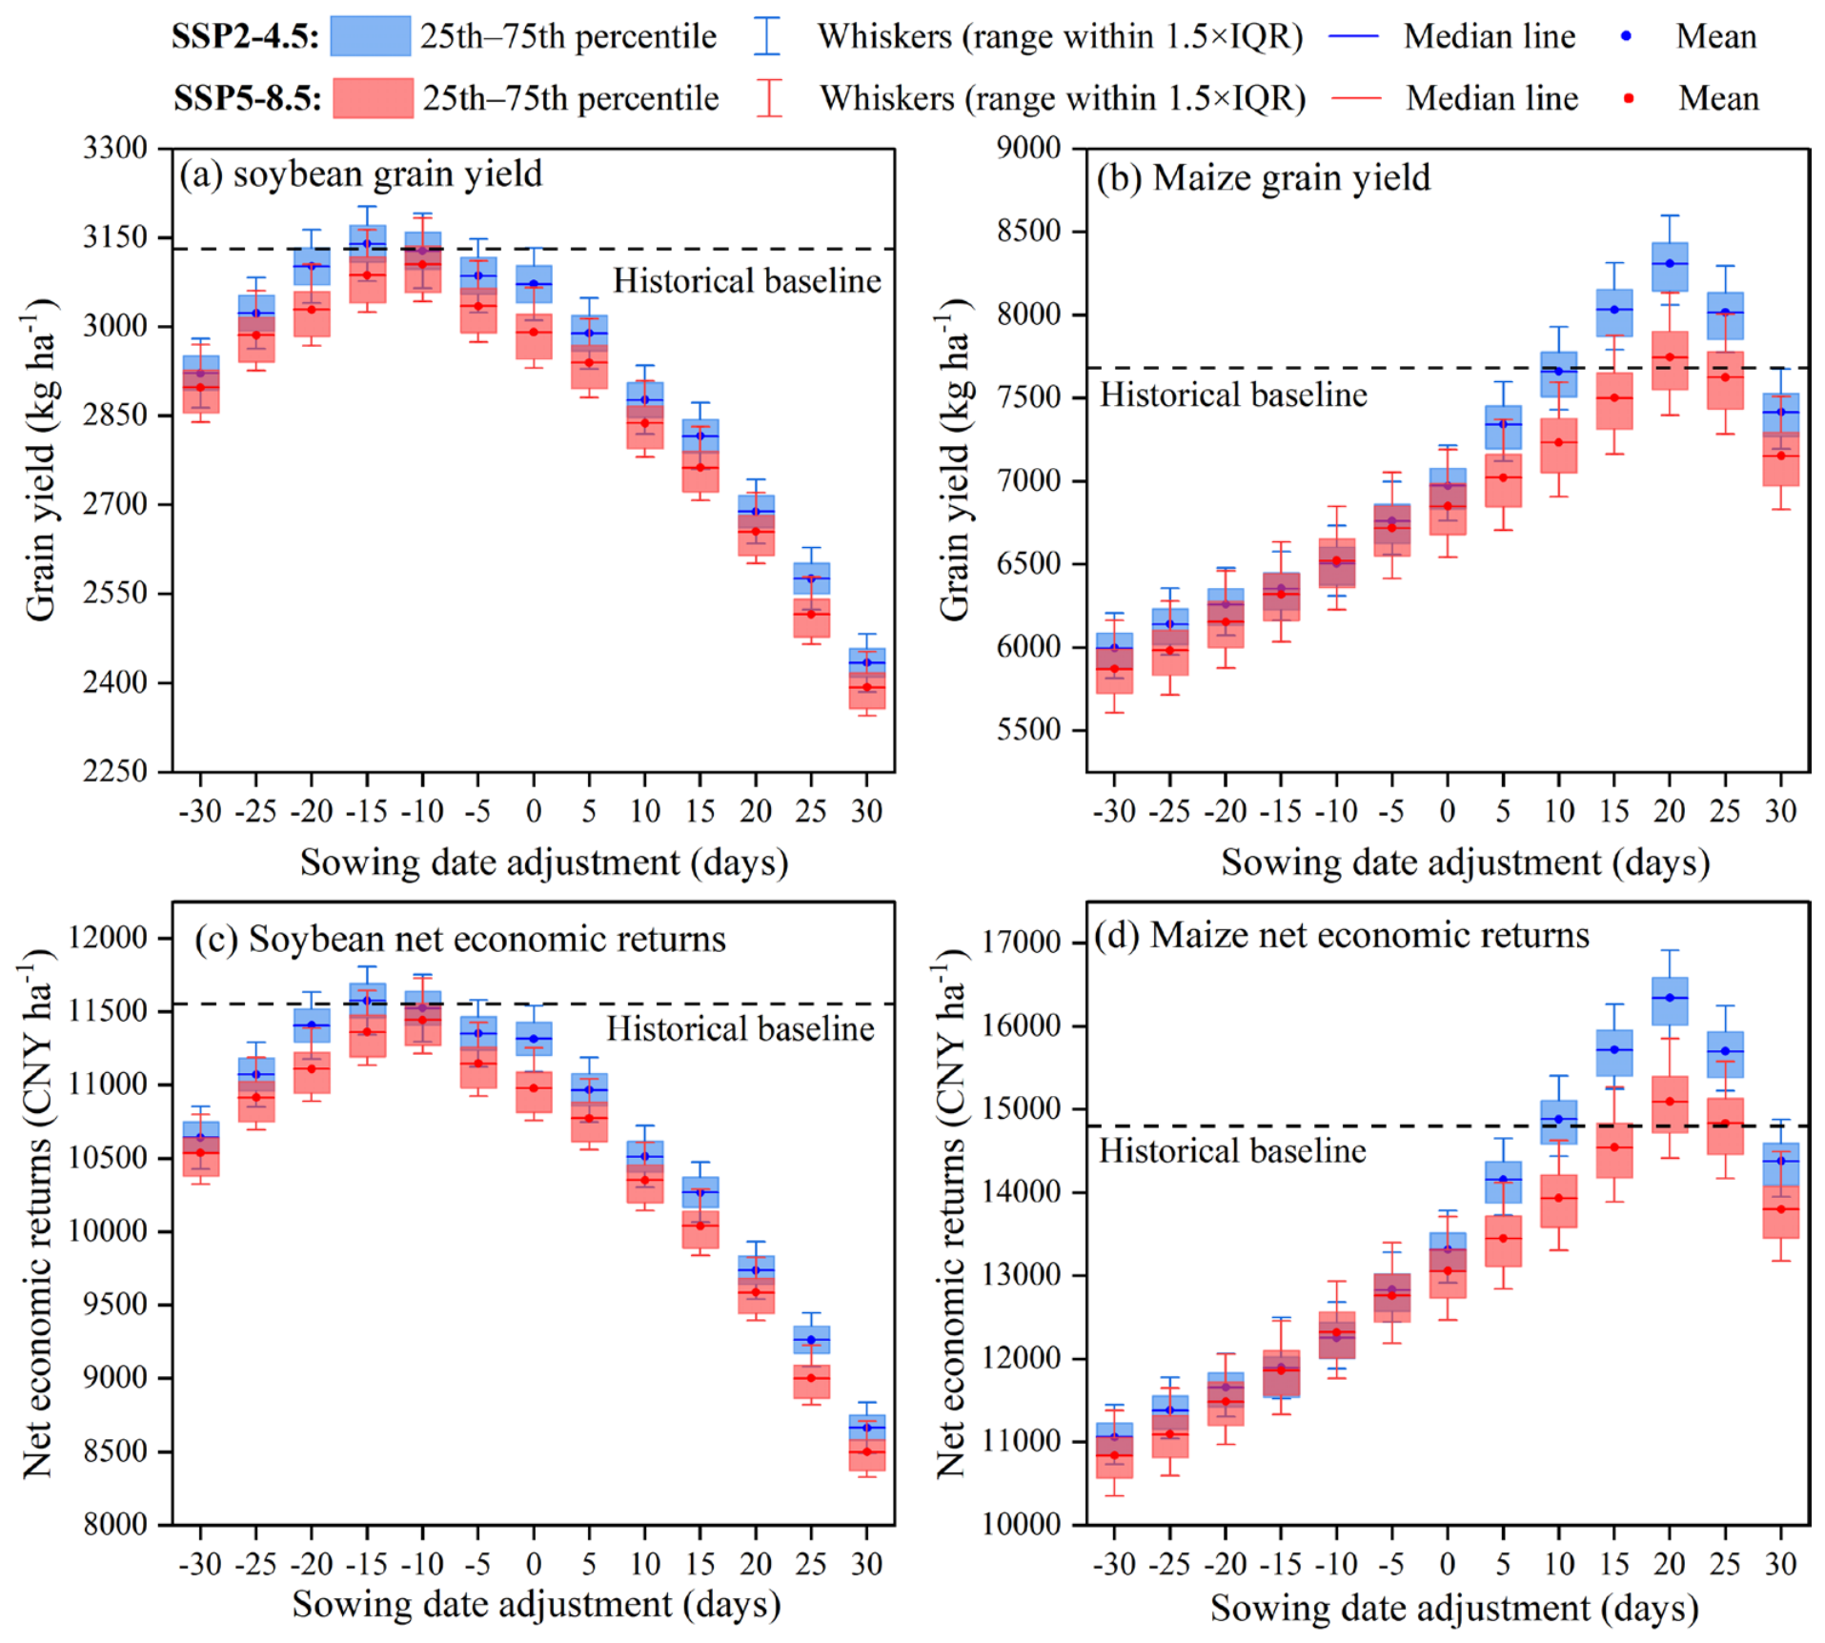
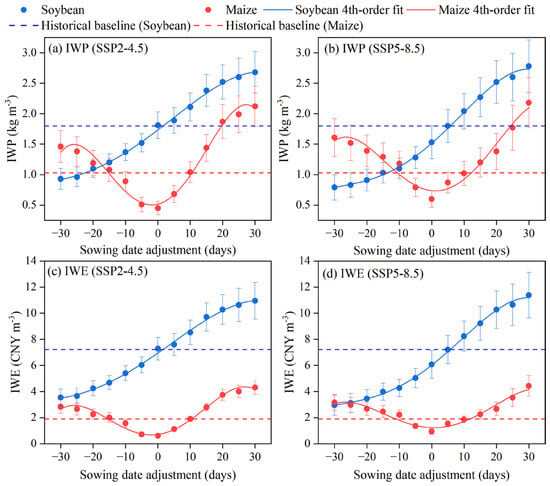
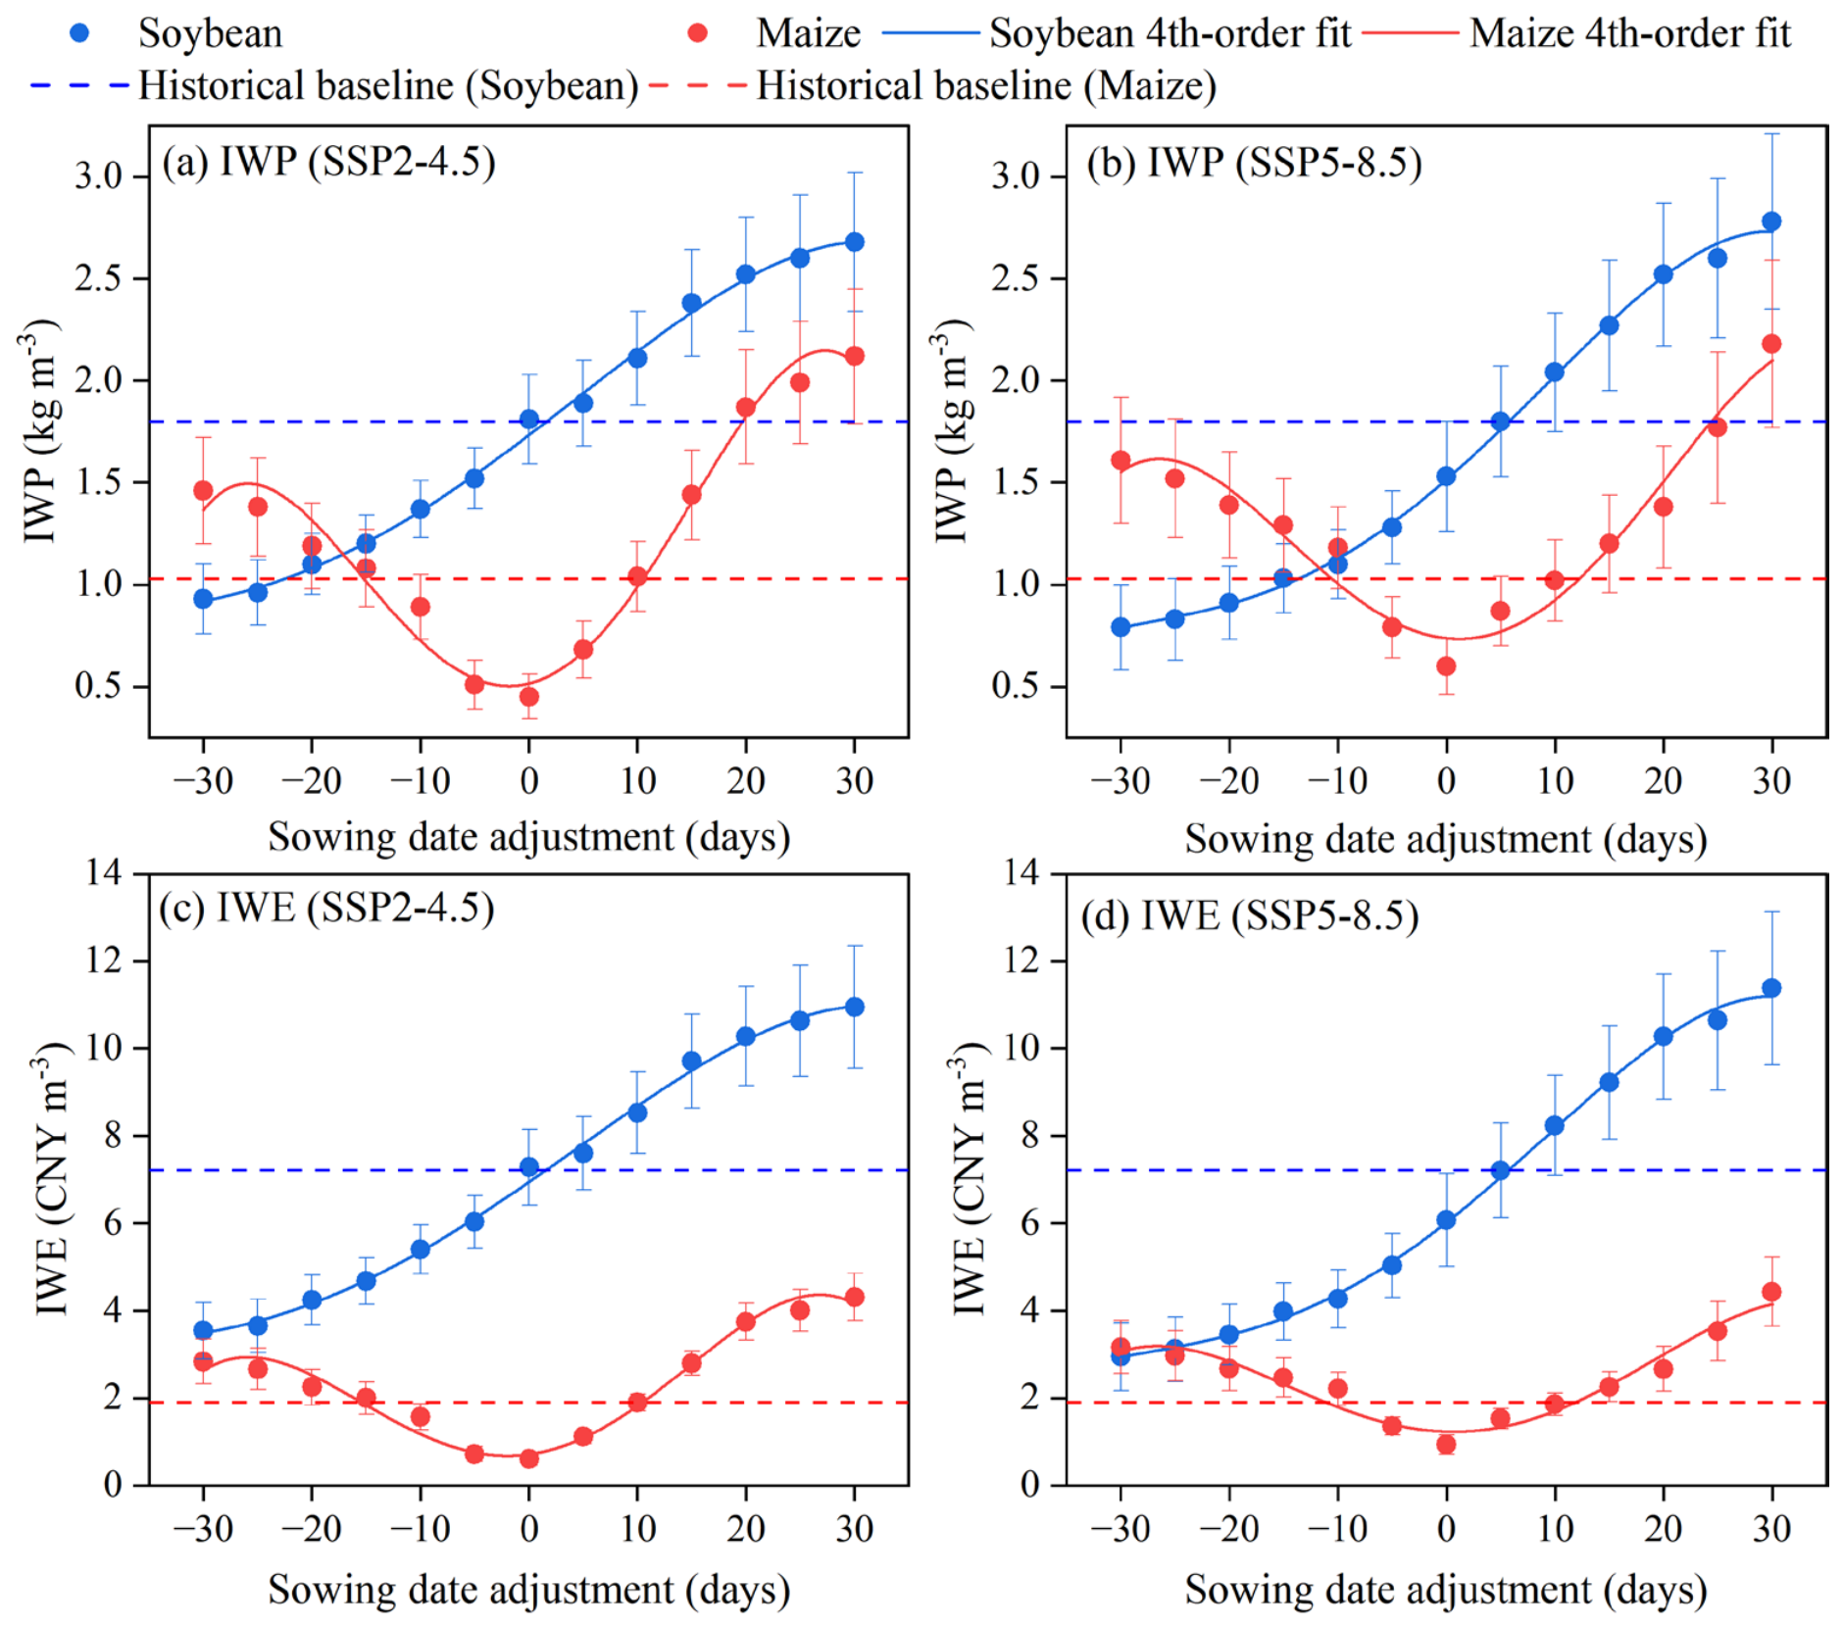

Disclaimer/Publisher’s Note: The statements, opinions and data contained in all publications are solely those of the individual author(s) and contributor(s) and not of MDPI and/or the editor(s). MDPI and/or the editor(s) disclaim responsibility for any injury to people or property resulting from any ideas, methods, instructions or products referred to in the content. |
© 2026 by the authors. Licensee MDPI, Basel, Switzerland. This article is an open access article distributed under the terms and conditions of the Creative Commons Attribution (CC BY) license.