


Abstract
Nitrogen loss during manure composting reduces the fertilizer value of the final product and increases its environmental burden. This study evaluated whether semi-permeable membrane covering could reduce gaseous emissions and promote mineral-N retention during the co-composting of swine manure and spent mushroom substrate. Conventional aerobic composting (AC) and semi-permeable membrane-covered aerobic composting (MCAC) were conducted for 35 d. Compared with AC, MCAC reduced the estimated cumulative emissions of NH3, N2O, and CH4 by 53.1%, 34.1%, and 45.7%, respectively, and lowered the estimated direct global warming potential of direct CH4 and N2O emissions by 37.5%. On day 35, MCAC had higher NH4+-N (530.5 vs. 172.0 mg kg−1) and NO3−-N concentrations (80.1 vs. 42.6 mg kg−1) than AC. Total nitrogen concentration decreased by 14.98% in MCAC and 17.82% in AC from day 1 to day 35. Composting stage explained 33.95% of bacterial community variation, versus 5.71% for membrane covering. Metagenomic nitrogen-cycling profiles varied mainly over time, with higher ammonia-oxidation potential in MCAC on day 10. Profiles covaried mainly with moisture and inorganic nitrogen. Overall, semi-permeable membrane covering maintained thermophilic composting while reducing gaseous emissions. The lower NH3 and N2O emissions, together with the higher final NH4+-N and NO3−-N concentrations, indicate reduced gaseous N release and greater mineral-N retention under MCAC.
1. Introduction
Livestock manure contains substantial amounts of organic matter and plant nutrients, but its improper storage and disposal can cause nutrient loss and environmental pollution. Aerobic composting is widely used to convert manure into a more stable organic fertilizer while reducing waste volume and inactivating pathogens [1]. Nitrogen conservation remains a major concern during this process [2]. The mineralization of proteins, urea, and other organic N compounds produces NH4+-N, part of which is subsequently lost through NH3 volatilization or microbial nitrification and denitrification [3,4]. NH3 is generally the main route of gaseous N loss from manure composting, whereas N2O contributes both to N loss and to the climate impact of the process [5,6]. Effective composting management should therefore limit gaseous emissions without impairing organic-matter decomposition and thermophilic sanitation.
Semi-permeable membrane-covered composting combines forced aeration with a waterproof and gas-permeable cover. The membrane separates the pile from the external environment while allowing heat, water vapor, and gases to pass through at different rates. Previous studies have shown that membrane covering can alter pile temperature and moisture [7,8,9], reduce gaseous emissions [10,11,12,13], and affect bacterial succession [7,8]. However, the magnitude and direction of these responses vary with the feedstock, membrane properties, aeration regime, and pile scale [14,15,16]. Reductions in NH3 and N2O have been reported in several membrane-covered systems, but greater NH3 release and contrasting CH4 responses have also been observed [13,14,15]. These findings support membrane covering as a practical emission-control measure, but they also show that its performance must be evaluated together with the composting conditions and N-transformation pattern.
Changes in inorganic N during composting result from several linked microbial processes. Ammonification and urea hydrolysis replenish the NH4+ pool, nitrification converts reduced N to oxidized forms, and denitrification can release NO, N2O, or N2 under oxygen-limited conditions [17,18,19,20,21]. Assimilatory nitrate reduction and dissimilatory nitrate reduction to ammonium provide additional routes by which oxidized N is incorporated into biomass or returned to NH4+ [17,20,21]. The genes involved in these transformations are distributed among different microbial groups and can respond to the marked changes in temperature, moisture, pH, carbon availability, and inorganic N that occur as composting proceeds [9,22,23]. Curated databases such as NCycDB allow these genes to be profiled from shotgun metagenomic sequences [24]. Such profiles indicate the genetic potential of the community rather than gene expression or the actual rate of an N-transformation pathway.
Swine manure has previously been co-composted with spent mushroom substrate to improve lignocellulose degradation and composting performance [25]. Earlier membrane-covered composting studies characterized bacterial succession using 16S rRNA sequencing, inferred metabolic functions from 16S-based predictions, or quantified a limited number of N-cycling marker genes [7,8,9,10,13,16,22,26]. These approaches established that membrane covering can influence microbial succession and selected genes associated with methane production, nitrification, and denitrification. However, direct shotgun-metagenomic characterization of a broader N-cycling gene repertoire remains limited for membrane-covered swine-manure/spent-mushroom-substrate composting. Shotgun metagenomic profiling against NCycDB makes it possible to compare multiple N-cycling steps with mineral-N dynamics, gaseous emissions, and changing compost properties within the same experiment. This framework can determine whether membrane-associated differences extend across the N-cycling network or are confined to particular functional steps and composting stages, while recognizing that metagenomic abundance represents functional potential rather than pathway activity.
Therefore, this study compared conventional aerobic composting (AC) with semi-permeable membrane-covered aerobic composting (MCAC) using swine manure and spent mushroom substrate. The objectives were to: (1) characterize changes in temperature, moisture, pH, TC, TN, NH4+-N, and NO3−-N; (2) quantify NH3, CH4, and N2O emissions and the direct GWP derived from CH4 and N2O; (3) determine changes in bacterial diversity and community composition; and (4) evaluate the temporal patterns of N-cycling functional potential and their associations with compost properties. We hypothesized that membrane covering would reduce net gaseous release and maintain higher mineral-N concentrations in the final compost, and examined whether these responses were accompanied by changes in physicochemical conditions and microbial N-cycling potential.
2. Materials and Methods
2.1. Semi-Permeable Membrane and Composting Materials
The semi-permeable membrane used in this study was purchased from Beijing VOTO Biotech Group Co., Ltd. (Beijing, China). The membrane consisted of three layers: an expanded polytetrafluoroethylene (e-PTFE) middle layer with a nominal pore size of 0.2 μm, sandwiched between inner and outer polyester-fiber layers with UV- and corrosion-resistant properties. Fresh swine manure and spent mushroom substrate, used as the principal composting feedstocks, were obtained from Shanwei Xinminsheng Leisure Agriculture Co., Ltd. (Shanwei, Guangdong, China) and Guangzhou Nongpu Agricultural Development Co., Ltd. (Guangzhou, Guangdong, China), respectively.
2.2. Aerobic Composting Design
Fresh swine manure and spent mushroom substrate were thoroughly mixed at a 1:1 mass ratio (w/w), and the moisture content was adjusted to approximately 60%. The physicochemical characteristics of the raw materials and the common initial composting mixture used for both treatments are shown in Table 1. The feedstock values were obtained from replicate subsamples collected before mixing, whereas the initial-mixture values were determined from day-0 composite samples collected from the prepared piles. Each composting pile contained approximately 700 kg of fresh material and was formed into a windrow measuring 1.8 m × 1.0 m × 0.6 m (length × width × height). Two treatments were established: conventional aerobic composting without membrane covering (AC) and semi-permeable membrane-covered aerobic composting (MCAC). After pile construction, the six piles were randomly assigned to the two treatments, with three replicate piles per treatment (n = 3). The piles were operated as static forced-aeration windrows and were not turned during the 35-day composting period, consistent with related membrane-covered composting systems coupled with forced intermittent aeration [12]. Air was supplied through perforated pipes installed beneath each pile at a rate of 0.30 L kg−1 dry matter min−1 for 30 min every 4 h. Composting was conducted for 35 d.
Table 1.
Selected physicochemical characteristics of the raw materials and initial composting mixture.
Values are presented as means ± SD. The feedstock values were determined from three replicate subsamples of each feedstock collected before mixing (n = 3), whereas the initial-mixture values were determined from day-0 composite samples collected from the prepared composting piles (n = 6). TC and TN were measured directly and are expressed on a dry-weight basis rather than calculated from the 1:1 wet-weight mixing ratio. The C/N ratio was calculated separately for each replicate as TC/TN before summarization. TC, total carbon; TN, total nitrogen.
2.3. Sample Collection and Analysis
The composting temperature was continuously monitored using automatic temperature recorders positioned in the upper, middle, and lower layers of each pile, and the mean of the three measurements was used as the pile temperature. More than 1 kg of compost was collected from each pile on days 1, 3, 10, 20, and 35. At each sampling time, subsamples of approximately equal mass were collected from the upper, middle, and lower layers of the same pile and thoroughly mixed to form one composite sample. Each composite sample was divided into three portions: one was stored at 4 °C for the determination of moisture, pH, NH4+-N, and NO3−-N; one was air-dried and ground for TC and TN analyses; and the remaining portion was stored at −80 °C for DNA extraction.
Moisture content was determined by oven-drying at 105 °C to a constant weight. The pH was measured in a 1:10 (w/v) fresh compost-to-deionized water suspension using a PB-10 pH meter (Sartorius, Gottingen, Germany). NH4+-N and NO3−-N were extracted from fresh compost with 2 mol L−1 KCl at a solid-to-solution ratio of 1:10 (w/v) by shaking at 180 r min−1 for 30 min and quantified using a Futura continuous-flow analyzer (AMS Alliance, Frépillon, France). TC was determined using an enviro TOC carbon/nitrogen analyzer (Elementar Analysensysteme GmbH, Frankfurt, Germany), and TN was measured by the Kjeldahl method after H2SO4–H2O2 digestion. The germination index (GI) of the final compost was determined using cucumber seeds based on seed germination and root length tests [25]. GI was calculated relative to the deionized-water control as follows: GI (%) = [(seed germination percentage in the compost extract × mean root length in the compost extract)/(seed germination percentage in the deionized-water control × mean root length in the deionized-water control)] × 100.
Gaseous emissions of NH3, CH4, and N2O were measured from each pile on days 1, 3, 10, 20, and 35 using a rectangular static chamber measuring 0.25 m × 0.25 m × 0.50 m (length × width × height), with a basal area of 0.0625 m2 and an internal volume of 0.03125 m3. These sampling dates were selected to cover the principal periods of the composting process, with days 1 and 3 representing the early thermophilic period, day 10 the peak thermophilic period, day 20 the late thermophilic period, and day 35 the cooling/maturation period. The chamber was placed at the center of the upper surface of each pile. Because all piles were constructed to the same nominal dimensions (1.8 m × 1.0 m × 0.6 m), the chamber position and sampled surface area were kept consistent across replicate piles and treatments. The resulting fluxes represent area-normalized emissions from the sampled central upper surface and were not extrapolated to whole-pile emission totals. The top of the chamber was equipped with a thermometer port to monitor the air temperature inside the chamber during enclosure. For CH4 and N2O sampling, the chamber was sealed and the headspace gas was thoroughly mixed using an internal fan. Gas samples were collected at 0, 10, 20, and 30 min after chamber closure and analyzed within 48 h using an Agilent 7890A gas chromatograph (Agilent Technologies, Santa Clara, CA, USA). CH4 was quantified using a flame-ionization detector (FID), whereas N2O was quantified using an electron-capture detector (ECD). Calibration curves were established using standard gas mixtures before sample analysis. For MCAC, the chamber was sealed directly onto the membrane surface; therefore, the measured flux represented gas released after passing through the semi-permeable membrane.
CH4 and N2O fluxes were calculated from the linear increase in gas concentration within the chamber following static-chamber procedures applied in composting and related gas-emission studies [12,27]:
where F is the gas flux (mg m−2 h−1); ρ is the gas density under standard conditions (0.716 kg m−3 for CH4 and 1.965 kg m−3 for N2O); V is the chamber volume (m3); dc/dt is the linear change in gas concentration with time (ppm h−1); T is the chamber air temperature during sampling (°C); and A is the basal area of the chamber (m2). Concentration–time regressions were accepted when R2 ≥ 0.99.
The estimated cumulative emission was calculated separately for each replicate pile and gas over the complete 35-day composting period. The fluxes measured on days 1, 3, 10, 20, and 35 were assigned to the preceding intervals D0–D1, D1–D3, D3–D10, D10–D20, and D20–D35, with interval weights of 1, 2, 7, 10, and 15 days, respectively. The interval-weighted mean flux was calculated as:
where FTW is the interval-weighted mean flux (mg m−2 h−1), and F1, F3, F10, F20, and F35 are the fluxes measured on days 1, 3, 10, 20, and 35, respectively. Because the interval weights sum to the complete 35-day composting period, the estimated cumulative emission was calculated as:
where E35 is the estimated cumulative emission over 35 d (g m−2), and 24 converts the hourly flux to a daily basis, and 1000 converts milligrams to grams. Fluxes were expressed per unit chamber basal area, and the estimated cumulative emissions were not scaled to the entire pile surface [8,12,28].
FTW = (1F1 + 2F3 + 7F10 + 10F20 + 15F35) / 35
E35 = FTW × 35 × 24 ÷ 1000
The combined 100-year global warming potential of direct CH4 and N2O emissions was calculated using GWP100 factors of 27 for non-fossil CH4 and 273 for N2O, as reported in Chapter 7 of the IPCC Sixth Assessment Report [29]:
where E(CH4) and E(N2O) are expressed as g m−2 and GWP is reported as g CO2-eq m−2.
GWP = 27E(CH4) + 273E(N2O)
For NH3 determination, 20 mL of 2% boric acid was placed in the chamber to absorb NH3 during a 2 h enclosure period. The trapped NH3 was quantified on the day of sampling by H2SO4 titration using acid concentrations of 0.05 mol L−1 during the high-emission period and 0.01 mol L−1 during the low-emission period. The NH3 concentration in the chamber was calculated from the acid consumption, and the area-based flux was calculated as FNH3 = CNH3V/(AΔt), where CNH3 is the chamber NH3 concentration (mg m−3), V is the chamber volume (m3), A is the chamber basal area (m2), and Δt is the 2 h enclosure period. The estimated cumulative NH3 emission was calculated using the same complete day-0 to day-35 interval-weighting procedure described in Equations (2) and (3).
2.4. Metagenomic Sequencing and Bioinformatic Analysis
Total microbial DNA was extracted from each composite compost sample using a PowerSoil DNA Isolation Kit (QIAGEN, Hilden, Germany) according to the manufacturer’s instructions. DNA integrity was examined by 1% agarose-gel electrophoresis, and DNA purity and concentration were assessed using a NanoDrop 2000 spectrophotometer (Thermo Fisher Scientific, Waltham, MA, USA). Qualified DNA was used to construct PCR-free metagenomic libraries with the MGI Easy PCR-Free DNA Library Prep Set. Sequencing was performed by BGI-Shenzhen/China National GeneBank (Shenzhen, China) on the BGISEQ-500 platform, generating 100 bp paired-end reads with approximately 20 Gb of raw sequencing data per sample.
Raw reads were processed using Trimmomatic v0.39 to remove adapter sequences and low-quality reads [30]. Reads with a mean quality score below Q20 or a length shorter than 50 bp were discarded. Taxonomic classification of the clean reads was performed using Kraken2 v2.1.2 against the locally installed MiniKraken2_v2_8GB database, and taxon abundances were re-estimated using Bracken v2.7 [31,32]. Bracken relative abundances were used for community analysis. The 10 phyla and 20 genera with the highest mean relative abundance across all samples were retained for the phylum-level community profile and genus-level heatmap, respectively; the remaining phyla were grouped as Others. Shannon diversity was calculated to describe alpha diversity, while Bray–Curtis dissimilarities were used for principal-coordinate analysis (PCoA) and PERMANOVA.
Nitrogen-cycling genes were annotated against NCycDB using DIAMOND BLASTX (version 2.1.9) [24,33]. Quality-filtered metagenomic reads were aligned against NCycDB with an E-value cutoff of 1 × 10⁻⁵. For each query read, the alignment with the highest bit score among the hits meeting the filtering criteria was retained. NCycDB-assigned read counts were summed at the gene level and normalized within each sample as counts per million NCycDB-assigned reads (CPM). Based on established descriptions of microbial N transformation [17,18,19,20,21], a manually curated catalog of 41 genes and enzyme subunits was assigned to seven broad N-cycling processes. Of these, 29 genes with non-zero assignments were aggregated into 14 functionally distinct steps for quantitative analysis. The sample-level CPM-normalized abundances of the 29 detected N-cycling genes are provided in Table S1, and their mapping to the 14 functional steps and seven broad N-cycling processes is provided in Table S2.
Step-level CPM values were transformed as ln(CPM + 1) and standardized within each functional step for visualization. The resulting z scores describe relative changes within a functional step and were not used to compare absolute abundance among different functional steps. These profiles were interpreted as the genetic potential for N cycling rather than direct evidence of gene expression or metabolic activity.
2.5. Statistical Analysis
All statistical analyses were performed in R version 4.5.2. Data are presented as means ± standard deviations (SD). Differences between AC and MCAC at each sampling date or endpoint were evaluated by one-way analysis of variance (ANOVA), with statistical significance set at p < 0.05. Repeated measurements were analyzed using linear mixed-effects models with treatment, sampling day, and their interaction as fixed effects and pile as a random effect. These models were fitted using the “lme4” (version 2.0-1), “lmerTest” (version 3.2-1), and “nlme” packages (version 3.1-168). The relative abundances of dominant phyla and genera and the CPM-normalized abundances of N-cycling functional steps were compared between treatments at each sampling date by one-way ANOVA. For the 20 dominant genera, p values were adjusted within each sampling date using the Benjamini–Hochberg method. For the 14 N-cycling functional steps, BH adjustment was applied across steps within each sampling date and separately for each term of the longitudinal models. Bacterial community composition was evaluated by PERMANOVA based on Bray–Curtis dissimilarities using the “vegan” package (version 2.7-3). To account for repeated sampling from the same piles, the treatment effect was tested by exact permutation of treatment labels among the six independent piles, comprising 20 possible allocations, whereas composting stage and the treatment × stage interaction were tested using 4999 cyclic and mirrored within-pile permutations generated with the “permute” package (version 0.9-10). Relationships among physicochemical variables were examined by Spearman correlation analysis, while associations between N-cycling functional profiles and physicochemical properties were evaluated by pile-restricted Mantel tests with 4999 permutations using the “vegan” and “permute” packages [34]. Figures were generated using “ggplot2” (version 4.0.2) and assembled using “patchwork” (version 1.3.2) and “cowplot” (version 1.2.0).
3. Results
3.1. Changes in Physicochemical Properties During Composting
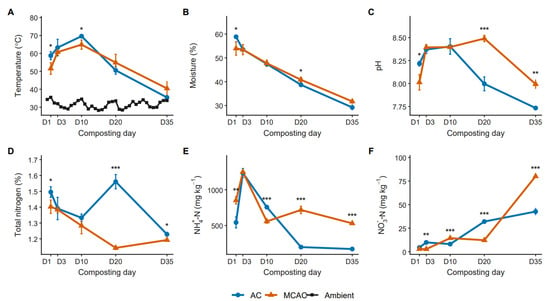
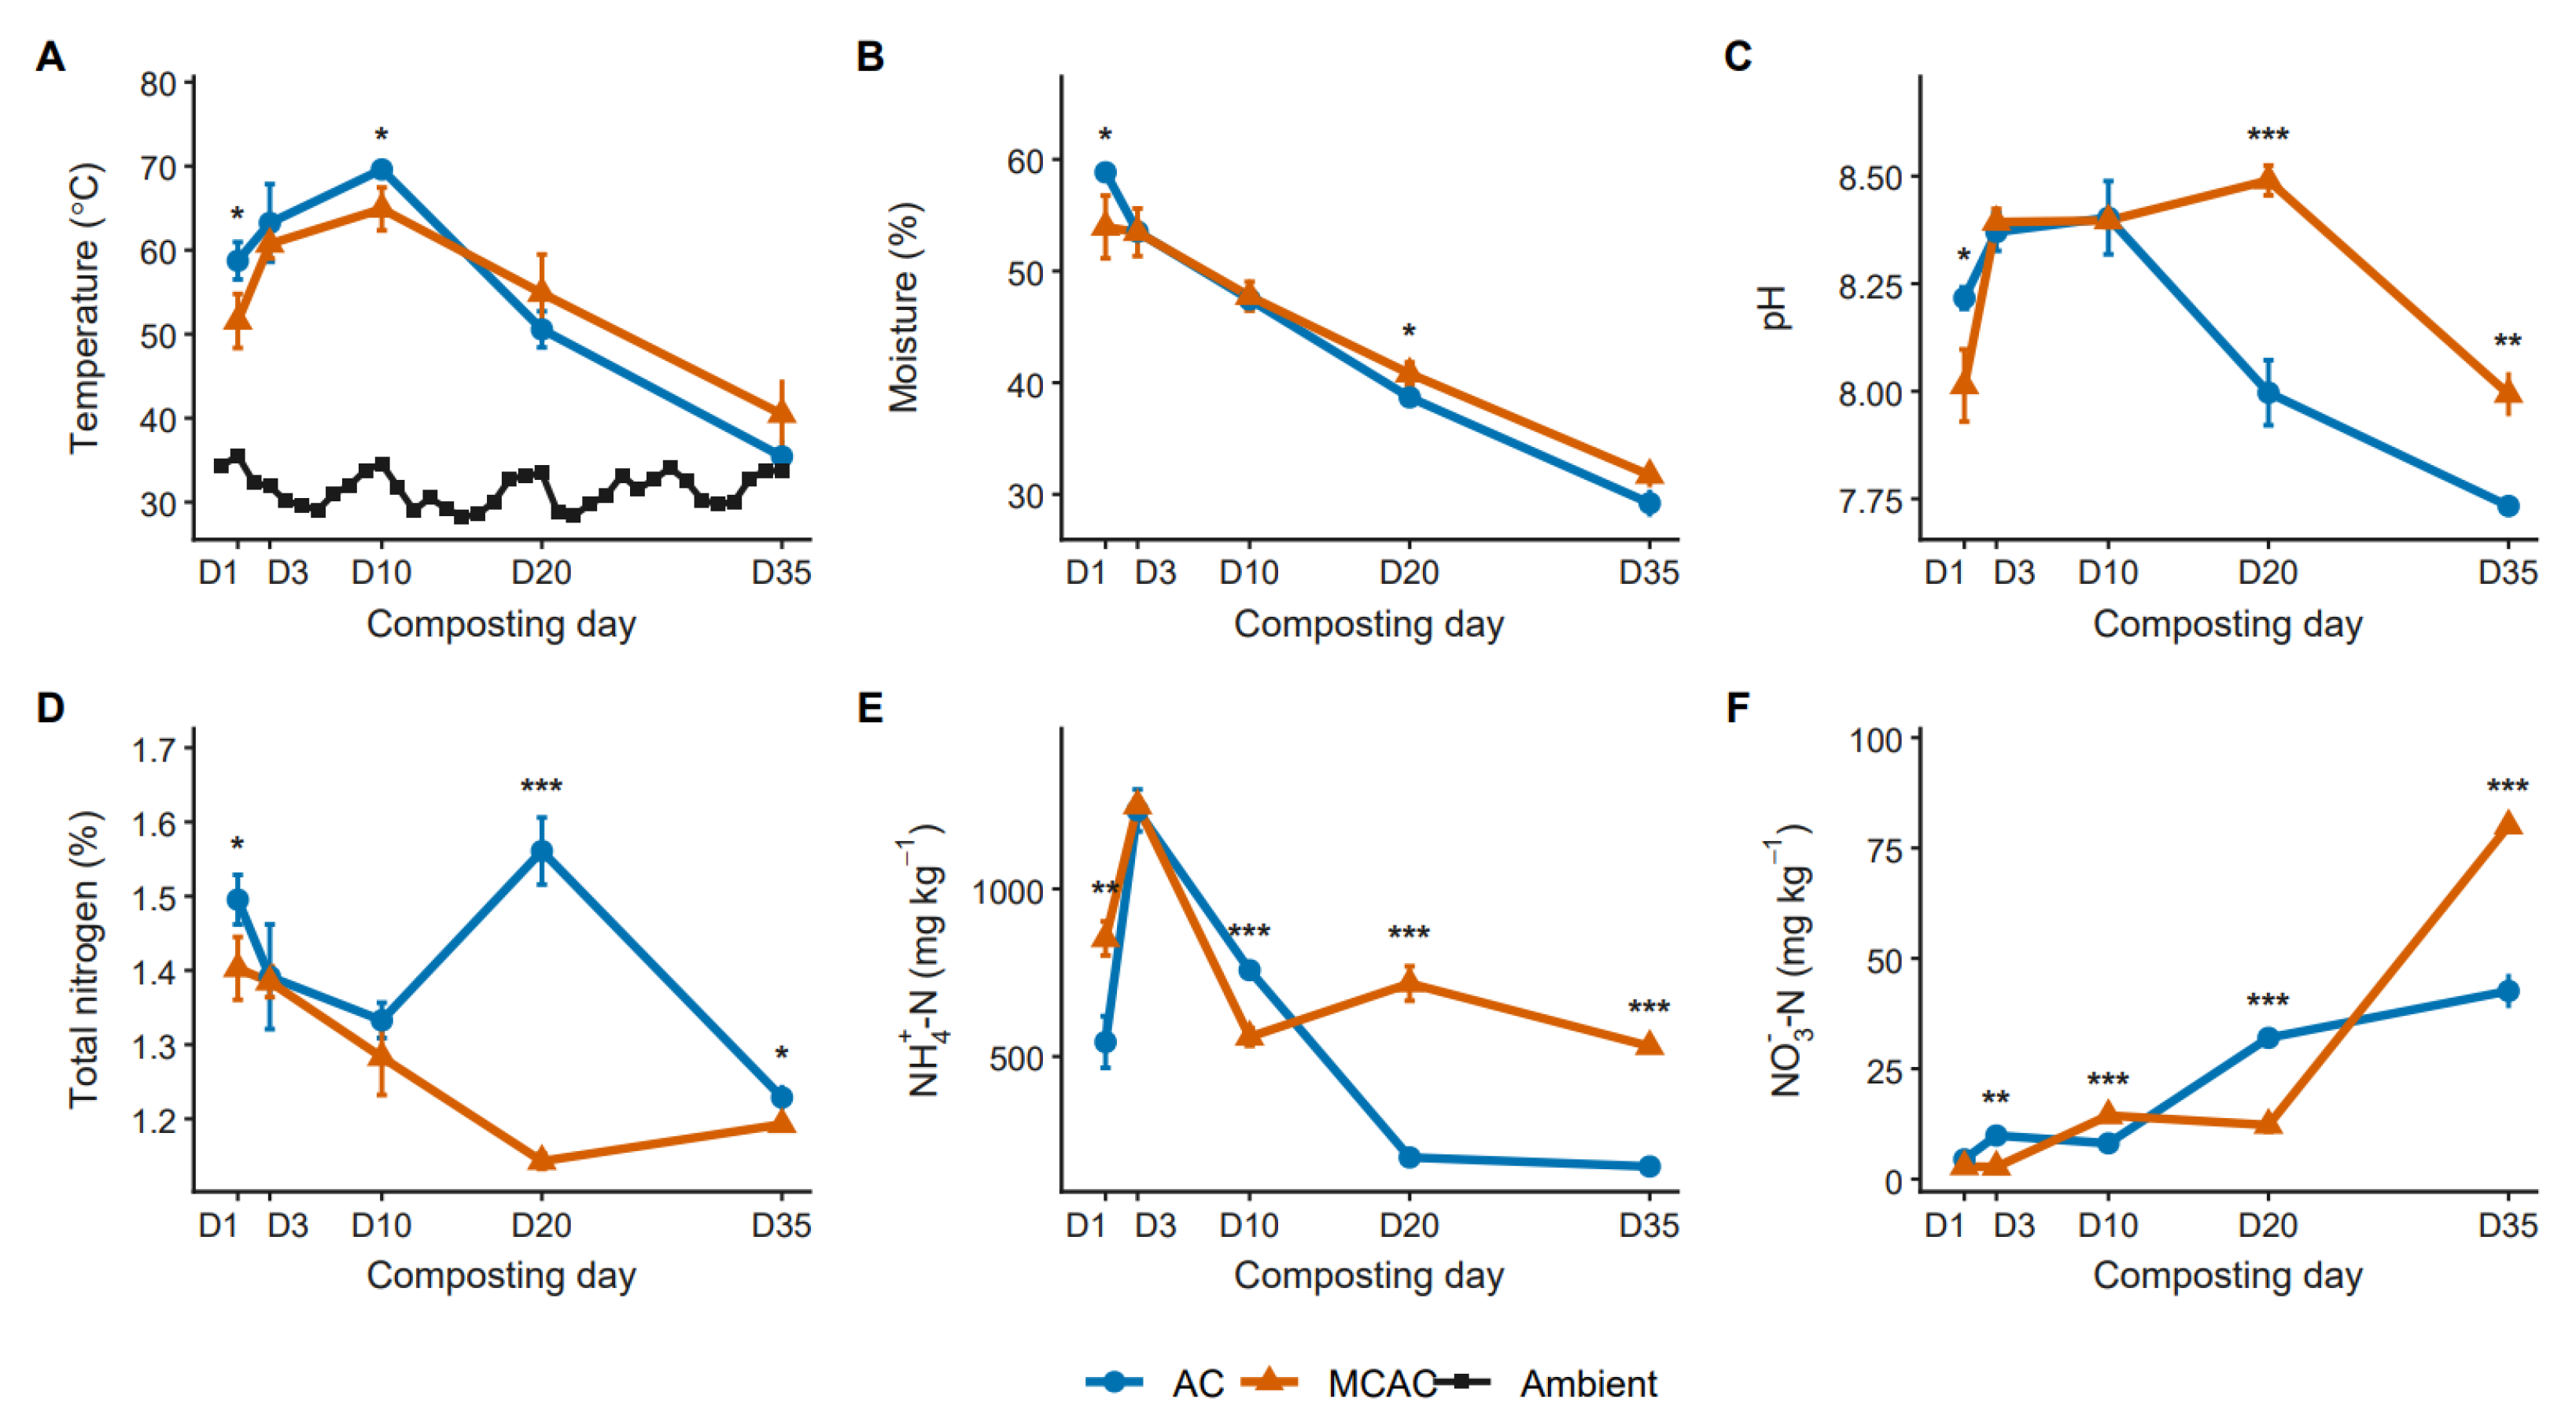
Both treatments entered the thermophilic phase rapidly, with pile temperatures exceeding 50 °C on day 1 and reaching their highest observed values on day 10 (Figure 1A). The temperatures recorded on day 10 were 69.6 °C for AC and 64.9 °C for MCAC. AC was warmer than MCAC on days 1 and 10, whereas no treatment difference was detected on days 20 or 35. Throughout the experiment, pile temperatures remained above the corresponding ambient temperature. The significant treatment × day interaction reflected the stage-specific temperature response to membrane covering (Figure S1).
Figure 1.
Changes in physicochemical properties during conventional aerobic composting (AC) and semi-permeable membrane-covered aerobic composting (MCAC): (A) pile and ambient temperatures, (B) moisture content, (C) pH, (D) total nitrogen (TN), (E) NH4+-N, and (F) NO3−-N. Treatment points and error bars represent means ± SD of three replicate piles, and treatment means are connected by solid lines. In panel A, the black solid line with square symbols shows the daily ambient temperature for reference. Asterisks indicate significant differences between AC and MCAC at the same sampling date based on one-way ANOVA (*, **, and *** indicate p < 0.05, p < 0.01, and p < 0.001, respectively); ambient temperature was not included in these comparisons. The complete longitudinal mixed-effects model results for the seven physicochemical variables are summarized in Figure S1.
Moisture content declined steadily from 58.8% to 29.2% in AC and from 53.9% to 31.7% in MCAC between days 1 and 35 (Figure 1B). AC had a higher moisture content on day 1, while MCAC retained more moisture on day 20; the two treatments did not differ at the end of composting. The pH increased during the early stage and then decreased in both treatments (Figure 1C). It was higher in AC on day 1 (8.22 versus 8.01) but higher in MCAC on days 20 and 35.
TN concentrations followed different temporal patterns in the two treatments (Figure 1D). In AC, TN decreased from 1.50% on day 1 to 1.33% on day 10, increased to 1.56% on day 20, and then declined to 1.23% on day 35. In MCAC, TN decreased from 1.40% on day 1 to 1.14% on day 20 and recovered slightly to 1.19% at the end of composting. TN was higher in AC on days 1, 20, and 35, whereas no difference was observed on days 3 or 10. From day 1 to day 35, mean TN concentration decreased by 17.82% in AC and 14.98% in MCAC.
NH4+-N increased sharply during the early stage and reached 1234.0 mg kg−1 in AC and 1248.2 mg kg−1 in MCAC on day 3 (Figure 1E). The concentrations subsequently declined in AC, whereas MCAC showed a secondary increase on day 20 after the initial decline. The two treatments did not differ at the day-3 maximum. However, NH4+-N was higher in MCAC on days 1, 20, and 35 and higher in AC on day 10. By day 35, the concentrations were 172.0 mg kg−1 in AC and 530.5 mg kg−1 in MCAC. NO3−-N remained low during the early stage and accumulated as composting progressed (Figure 1F). It was higher in AC on days 3 and 20 and higher in MCAC on days 10 and 35, while no significant difference was detected on day 1. Final NO3−-N concentrations were 42.6 mg kg−1 in AC and 80.1 mg kg−1 in MCAC.
TC decreased from 31.13% to 24.50% in AC and from 32.84% to 28.36% in MCAC between days 1 and 35 (Figure S2A). MCAC maintained higher mean TC concentrations throughout the measured period, with significant differences on days 3 and 10. At the end of composting, the GI values were 98.65% in AC and 91.36% in MCAC (Figure S2B). Both means exceeded 70%, and no significant difference was detected between treatments.
3.2. Gaseous Emissions and Global Warming Potential
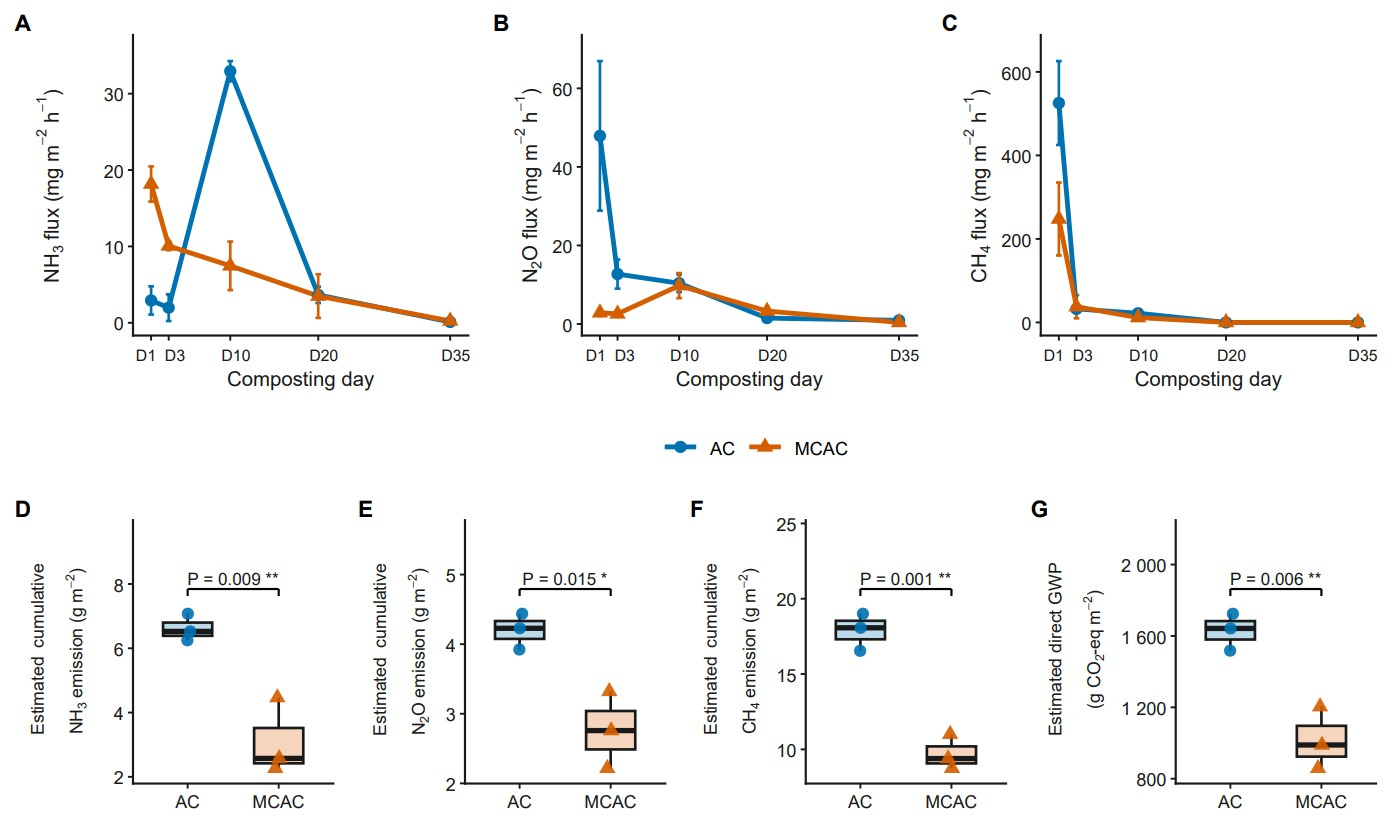
NH3 flux showed contrasting temporal patterns between AC and MCAC (Figure 2A). In MCAC, NH3 flux was highest on day 1 (18.17 mg m−2 h−1) and then decreased continuously as composting proceeded. In contrast, NH3 flux in AC was relatively low on days 1 and 3, followed by a pronounced peak of 32.94 mg m−2 h−1 on day 10. At this peak, the mean flux in AC was 4.4 times that from MCAC. Fluxes from both treatments subsequently declined and were low by day 35. Despite the higher NH3 flux from MCAC during the first two sampling dates, its estimated cumulative emission over 35 days was 3.10 g m−2, compared with 6.62 g m−2 in AC (Figure 2D). Overall, membrane covering significantly reduced the estimated cumulative NH3 emission by 53.1%.
Figure 2.
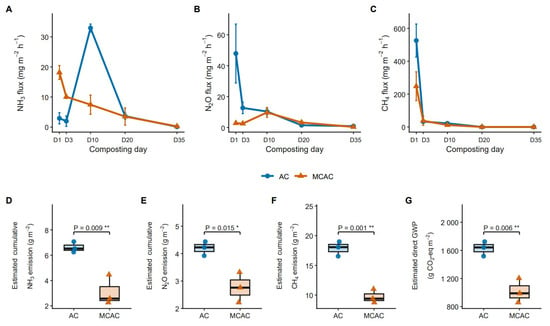
Gaseous emissions during conventional aerobic composting (AC) and semi-permeable membrane-covered aerobic composting (MCAC). Temporal fluxes of (A) NH3, (B) N2O, and (C) CH4; estimated cumulative emissions of (D) NH3, (E) N2O, and (F) CH4 over 35 d; and (G) the estimated direct global warming potential (GWP) derived from direct CH4 and N2O emissions. In panels (A–C), points and error bars represent means ± SD of three replicate piles, and treatment means are connected by solid lines. The lines connect the five observed sampling dates and do not represent continuous monitoring. In panels (D–G), boxes show the median and interquartile range, whiskers extend to values within 1.5 times the interquartile range, and overlaid points show all three replicate piles. p values were obtained by one-way ANOVA using the three replicate piles per treatment; * and ** indicate p < 0.05 and p < 0.01, respectively. Cumulative emissions were estimated over D0–D35 by assigning the fluxes measured on days 1, 3, 10, 20, and 35 to the preceding intervals of 1, 2, 7, 10, and 15 days, respectively, as described in Section 2.3. GWP was calculated using 100-year characterization factors of 27 for non-fossil CH4 and 273 for N2O and is expressed as g CO2-eq m−2.
The highest N2O flux occurred in AC on day 1, reaching 47.90 mg m−2 h−1, after which it decreased rapidly (Figure 2B). By comparison, N2O flux in MCAC remained at approximately 2.58–2.87 mg m−2 h−1 during the first 3 days and reached its highest value on day 10 (9.77 mg m−2 h−1). On day 20, the mean N2O flux in MCAC was slightly higher than that in AC, although fluxes in both treatments were substantially below the initial AC peak. The estimated cumulative N2O emission was 4.20 g m−2 in AC and 2.77 g m−2 in MCAC (Figure 2E), representing a significant reduction of 34.1% under membrane covering.
CH4 emission was concentrated at the beginning of composting in both treatments (Figure 2C). On day 1, CH4 flux was 525.41 mg m−2 h−1 in AC and 247.69 mg m−2 h−1 in MCAC, representing a 52.9% lower mean flux in MCAC. The flux decreased sharply in both treatments by day 3 and remained low on day 10; the MCAC value on day 10 was less than half that of AC. By day 20, CH4 flux had decreased to zero in both treatments and remained at this level on day 35. Consistent with this pattern, the estimated cumulative CH4 emission decreased from 17.87 g m−2 in AC to 9.71 g m−2 in MCAC (Figure 2F), corresponding to a significant reduction of 45.7%.
The reductions in CH4 and N2O emissions were also reflected in their direct greenhouse-gas contribution (Figure 2G). The estimated direct GWP derived from CH4 and N2O was 1628.1 g CO2-eq m−2 in AC and 1017.2 g CO2-eq m−2 in MCAC. Thus, MCAC significantly reduced the estimated direct GWP by 37.5%.
3.3. Bacterial Community Composition and Succession
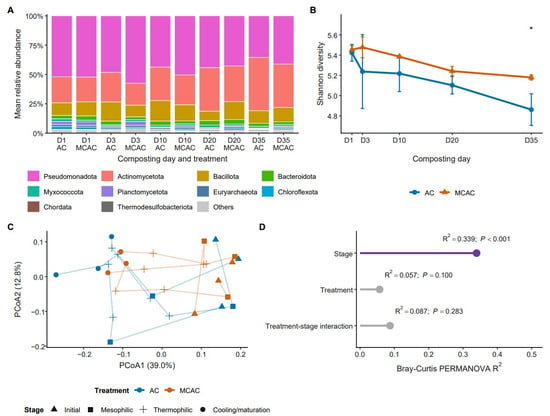
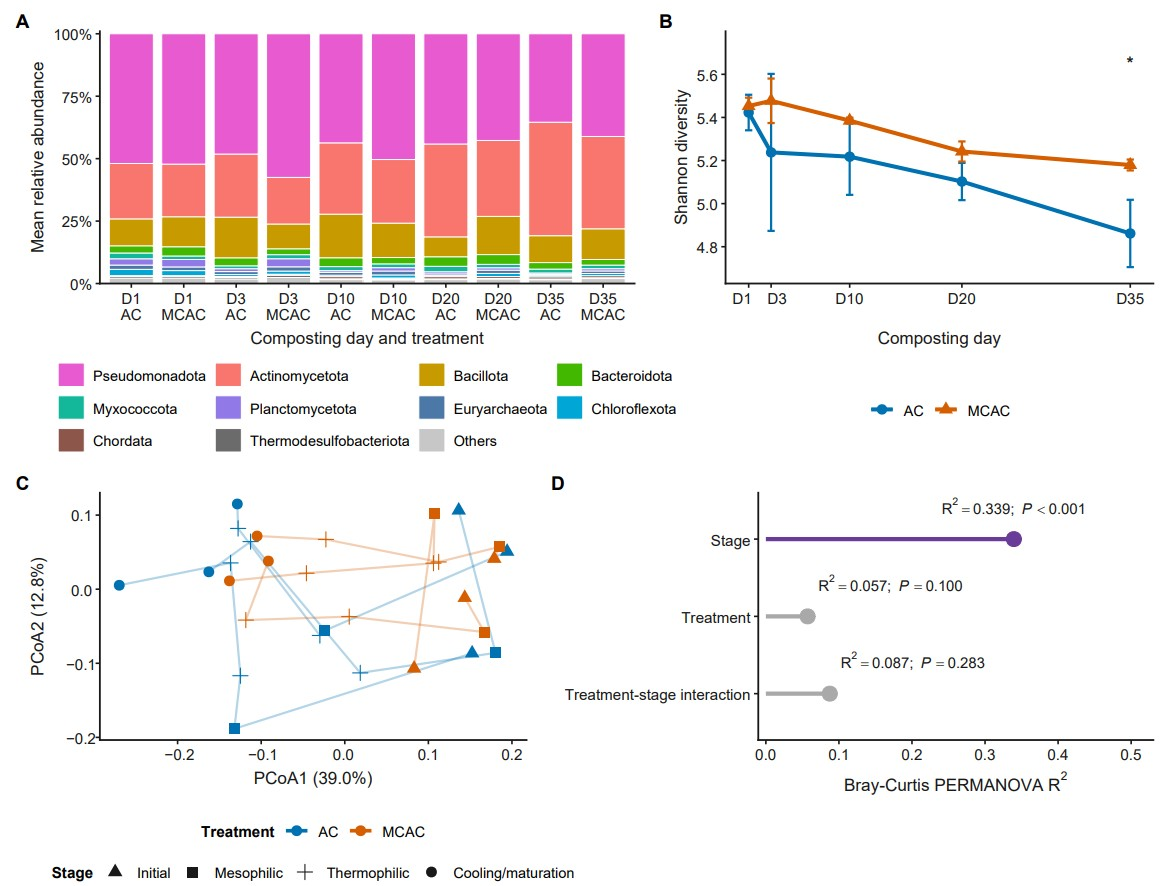
Pseudomonadota and Actinomycetota were the predominant bacterial phyla, but their relative abundances changed in opposite directions during composting (Figure 3A). Pseudomonadota accounted for 51.9% and 52.2% of the communities in AC and MCAC, respectively, on day 1 and decreased to 35.4% and 41.1% by day 35. In contrast, Actinomycetota increased from 22.3% to 45.5% in AC and from 21.1% to 37.0% in MCAC. Bacillota represented 8.0–17.5% of the AC community and 9.9–15.3% of the MCAC community, while the remaining dominant phyla occurred at lower abundances. Significant treatment differences were confined mainly to the intermediate stages. Bacteroidota was more abundant in AC on day 3 (3.20% versus 2.32%), Pseudomonadota was more abundant in MCAC on day 10 (50.4% versus 43.7%), and on day 20 Actinomycetota was more abundant in AC (37.3% versus 30.4%), whereas Chloroflexota was more abundant in MCAC (1.27% versus 0.45%).
Figure 3.
Bacterial community composition and succession during conventional aerobic composting (AC) and semi-permeable membrane-covered aerobic composting (MCAC). (A) Mean relative abundance of the ten most abundant phyla across all samples, with the remaining phyla grouped as Others. (B) Shannon diversity presented as means ± SD of three replicate piles per treatment. Both treatment trajectories are shown as solid lines, and * indicates p < 0.05 according to the per-date one-way ANOVA. (C) Principal-coordinate analysis (PCoA) based on genus-level Bray–Curtis dissimilarities. Colors indicate treatments, symbols indicate composting stages, and faint lines connect repeated observations from the same pile. (D) PERMANOVA effect sizes (R2) and p values for composting stage, treatment, and their interaction; purple indicates the significant stage effect, whereas gray indicates nonsignificant effects. Samples were collected from three replicate piles per treatment at each sampling date.
At the genus level, 11 treatment differences were detected among the 20 dominant genera, most of which occurred on days 10 and 20 (Figure S3). On day 10, Mesorhizobium was more abundant in MCAC than in AC (3.21% versus 2.01%). On day 20, MCAC contained more Bacillus (1.36% versus 0.40%) but less Nonomuraea (1.06% versus 2.13%) and Streptomyces (7.29% versus 8.49%). These four comparisons remained significant after the within-date BH adjustment, whereas the other seven date-specific differences did not. None of the dominant genera differed consistently between treatments throughout the composting period.
Shannon diversity decreased over time in both treatments (Figure 3B). The index declined from 5.423 to 4.862 in AC and from 5.453 to 5.179 in MCAC between days 1 and 35. Composting day had a significant effect on Shannon diversity, whereas neither the overall treatment effect nor the treatment × day interaction was significant. The two treatments differed only on day 35, when Shannon diversity was higher in MCAC.
The PCoA revealed a clear temporal succession of the bacterial community (Figure 3C). The first two axes explained 39.0% and 12.8% of the total variation, respectively. Day-1 samples were located mainly on the positive side of PCoA1, day-20 and day-35 samples occurred mainly on the negative side, and day-3 and day-10 samples occupied intermediate positions. PERMANOVA showed that composting stage explained 33.95% of the variation in bacterial community composition and was significant (p < 0.001), whereas treatment explained 5.71% and was not significant (p = 0.100; Figure 3D). The treatment × stage interaction was also not significant (R2 = 8.75%, p = 0.283). These results identify temporal succession as the predominant source of community variation.
3.4. Temporal Changes in Nitrogen-Cycling Functional Potential
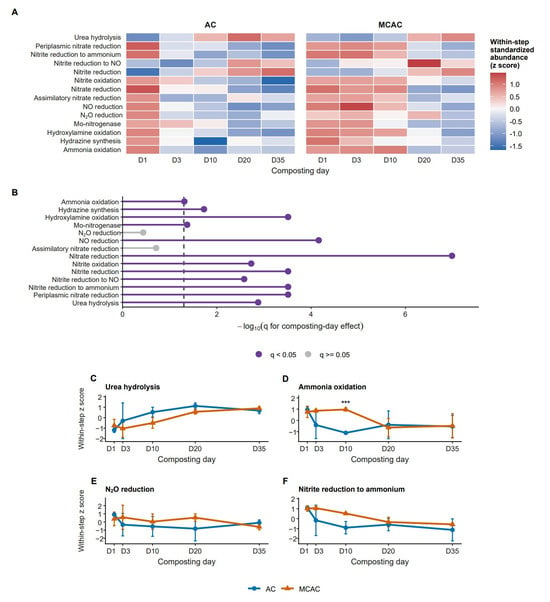
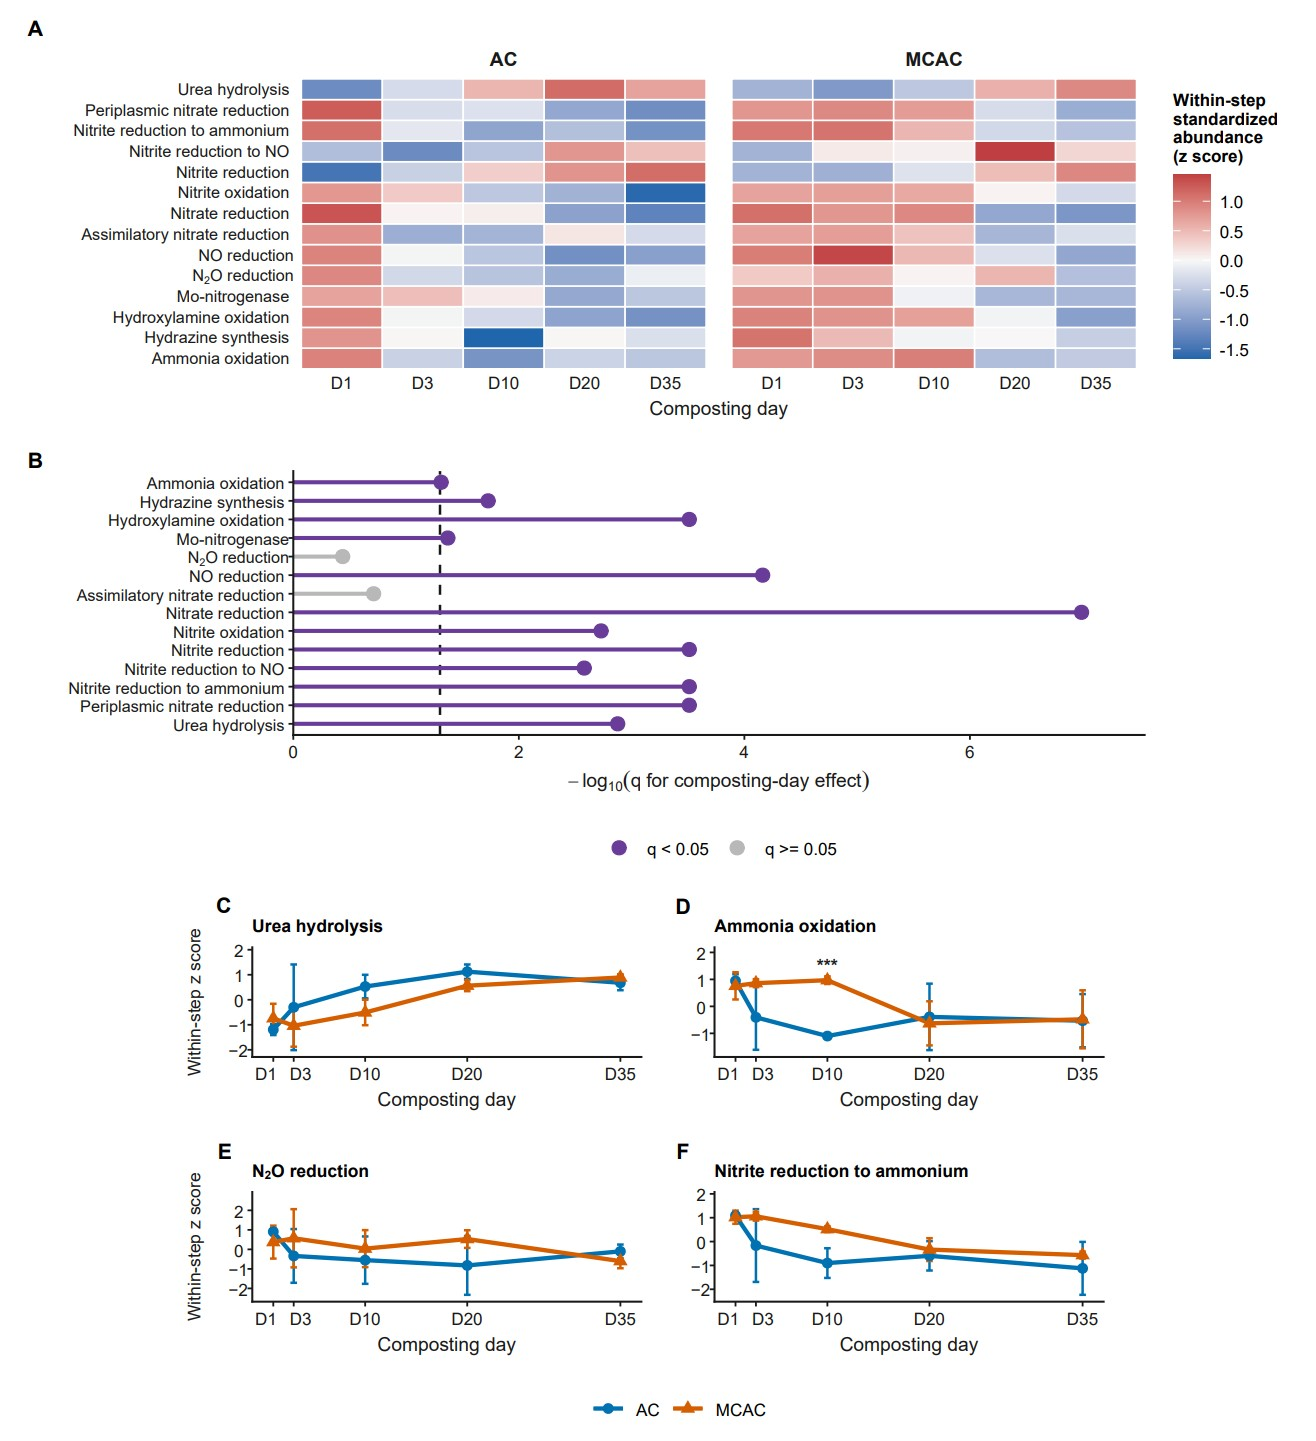
The 14 detected functional steps covered seven broad N-cycling processes and showed distinct temporal patterns during composting (Figure 4A). Within individual functional steps, nitrogen fixation, ammonia and hydroxylamine oxidation, nitrite oxidation, nitrate and periplasmic nitrate reduction, NO and N2O reduction, DNRA, and hydrazine synthesis generally showed higher standardized values during early composting and declined thereafter. Urea-hydrolysis potential increased during the cooling and maturation stages, whereas nitrite reduction to NO was relatively low during the early stage and increased later in both treatments. Differences between the treatment means were most apparent before day 20 and diminished during days 20–35. The heatmap therefore describes temporal and treatment-related variation within each functional step rather than abundance differences among steps.
Figure 4.
Temporal changes in N-cycling functional potential during conventional aerobic composting (AC) and semi-permeable membrane-covered aerobic composting (MCAC). A manually curated catalog of 41 genes and enzyme subunits was assigned to seven broad N-cycling processes; 29 genes with non-zero assignments in the NCycDB-assigned gene matrix were aggregated into 14 functional steps. In panels (A,B), Mo-nitrogenase represents the nitrogen-fixation step. (A) Heatmap of the 14 functional steps. Values are treatment means of ln(CPM + 1) abundances standardized within each functional step. The colors show relative changes within a functional step and should not be used to compare absolute abundance among different steps. (B) Strength of the longitudinal composting-day effect, expressed as −log10(q), where q is the BH-adjusted p value across the 14 functional steps. The dashed vertical line denotes q = 0.05. (C–F) Within-step standardized temporal profiles of urea hydrolysis, ammonia oxidation, N2O reduction, and nitrite reduction to ammonium, respectively. Points and solid lines show treatment means, and error bars show SD (n = 3 replicate piles). Asterisks indicate AC–MCAC differences that remained significant after BH adjustment across the 14 functional steps within the corresponding sampling date (*** indicate q < 0.001). The profiles represent genetic functional potential rather than gene expression or metabolic activity.
After BH adjustment, 12 of the 14 functional steps showed significant composting-day effects (Figure 4B). Nitrate reduction exhibited the strongest temporal response, followed by NO reduction, nitrite reduction to ammonium, assimilatory nitrite reduction, periplasmic nitrate reduction, and hydroxylamine oxidation. Nitrogen fixation, nitrite oxidation, and hydrazine synthesis also changed significantly over time. Assimilatory nitrate reduction and N2O reduction were the only steps without a significant composting-day effect. No functional step showed a significant overall treatment or treatment × day effect.
Differences between the treatment mean profiles were most evident during the early and thermophilic stages. On day 3, MCAC showed a higher mean standardized value for nitrate reduction. On day 10, the corresponding means were higher for ammonia oxidation, assimilatory nitrate reduction, NO reduction, and nitrite reduction to ammonium. Among these comparisons, only ammonia oxidation on day 10 remained significant after BH adjustment (Figure 4A,D).
The within-step standardized profiles of the four representative functional steps showed distinct temporal patterns (Figure 4C–F). Urea-hydrolysis potential increased in both treatments as composting proceeded (Figure 4C). Ammonia-oxidation potential declined sharply in AC after day 1 but remained relatively high in MCAC through day 10; the treatment difference on day 10 remained significant after BH adjustment (Figure 4D). N2O-reduction potential varied considerably among replicate piles and showed no clear treatment separation (Figure 4E). Nitrite reduction to ammonium decreased rapidly in AC during early composting, whereas the mean standardized values remained higher in MCAC through day 10; thereafter, the two treatments followed similar downward trends (Figure 4F). These profiles describe genetic potential for N transformation rather than gene expression or measured process rates.
3.5. Associations Between Nitrogen-Cycling Functional Potential and Compost Properties
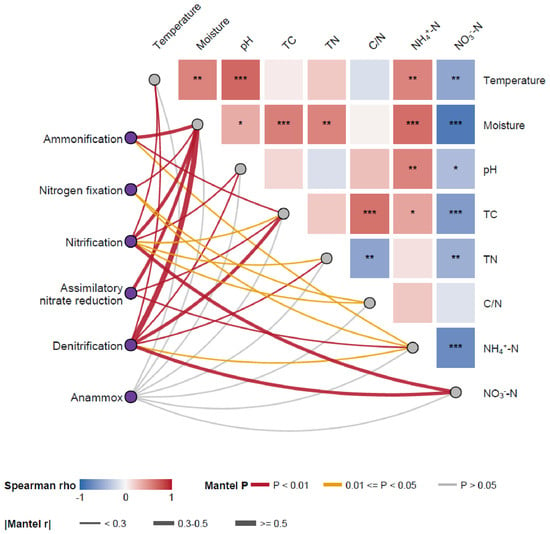
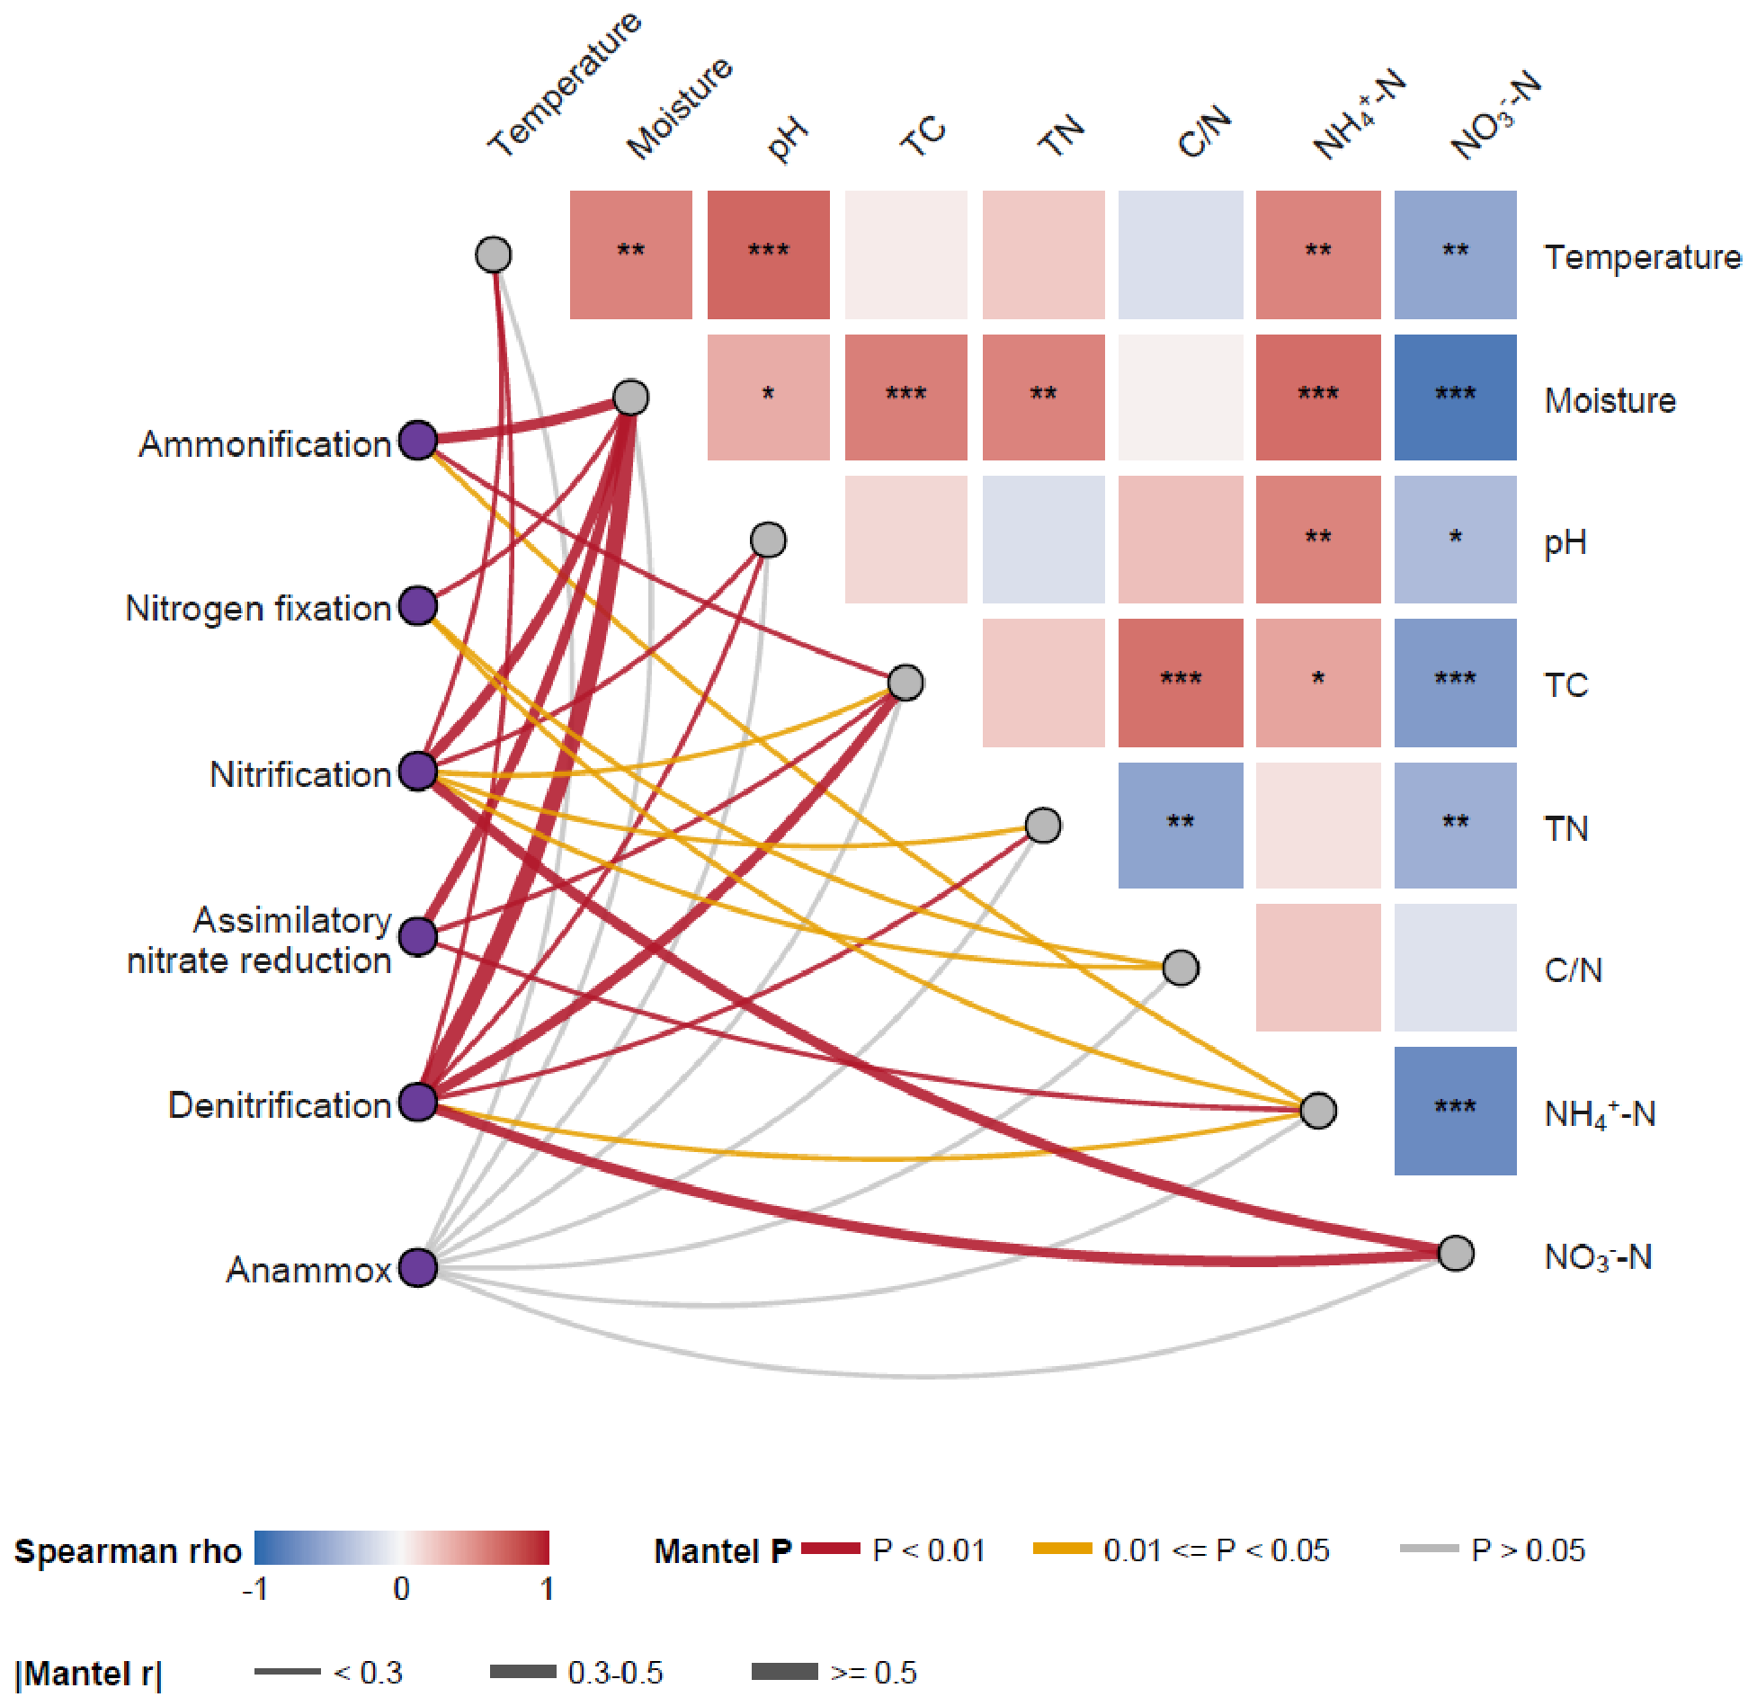
The physicochemical variables were closely correlated during composting (Figure 5). Temperature, moisture, and pH were positively correlated with NH4+-N and negatively correlated with NO3−-N. The strongest correlations were observed between moisture and NO3−-N (Spearman’s ρ = −0.852) and between NH4+-N and NO3−-N (ρ = −0.726). Moisture was also positively correlated with TC and TN, whereas TC and TN were negatively correlated with NO3−-N.
Figure 5.
Associations between N-cycling functional potential and physicochemical properties during swine manure composting. Tiles show pairwise Spearman correlations among physicochemical variables; *, **, and *** indicate p < 0.05, p < 0.01, and p < 0.001, respectively. Curves show pile-restricted Mantel associations based on 4999 permutations. Red and orange curves indicate p < 0.01 and 0.01 ≤ p < 0.05, respectively, whereas thin grey curves show non-significant anammox associations. Curve width is proportional to |Mantel r|. Process profiles were constructed from ln(CPM + 1)-transformed abundances of detected NCycDB genes. DNRA was not displayed because only one variable marker gene was available. TC, total carbon; TN, total nitrogen; C/N, carbon-to-nitrogen ratio; DNRA, dissimilatory nitrate reduction to ammonium. The relationships represent association rather than causation.
Among the N-cycling processes, denitrification displayed the widest range of significant associations with compost properties. Its multigene profile was associated with temperature, moisture, pH, TC, TN, NH4+-N, and NO3−-N (Mantel r = 0.192–0.575), with the largest coefficient observed for moisture. The nitrification profile was associated with temperature, moisture, pH, TC, TN, C/N, and NO3−-N (Mantel r = 0.153–0.312); moisture and NO3−-N yielded the largest coefficients within this group.
Ammonification was associated with moisture, TC, and NH4+-N (Mantel r = 0.181–0.306), nitrogen fixation with moisture, C/N, and NH4+-N (Mantel r = 0.178–0.239), and assimilatory nitrate reduction with moisture, TC, and NH4+-N (Mantel r = 0.214–0.332). No significant association was detected for anammox. DNRA was not included in the process-level Mantel analysis because only one variable marker gene was available for constructing its process profile. Overall, the N-cycling profiles covaried most consistently with moisture, carbon status, and inorganic N during composting; these relationships represent associations in functional potential rather than evidence of pathway activity or causal regulation.
4. Discussion
4.1. Effects of Membrane Covering on the Composting Process and Gaseous Emissions
Both AC and MCAC showed the rapid heating, thermophilic, and cooling phases characteristic of aerobic composting (Figure 1A). Although AC was warmer on days 1 and 10, the treatment effect over the complete composting period was not significant. Previous studies have likewise shown that the thermal response to membrane covering varies with feedstock, membrane properties, aeration regime, and pile scale [7,8,9,12]. Under the conditions used here, the membrane modified pile temperature at particular stages but did not prevent the compost from entering the thermophilic phase.
The clearest effect of membrane covering was the reduction in gaseous N loss. Estimated cumulative NH3 and N2O emissions were 53.1% and 34.1% lower in MCAC than in AC, respectively (Figure 2D,E). During composting, NH3 formation is closely related to organic-N mineralization and the equilibrium between NH4+ and NH3, which is favored by high temperature and alkaline conditions [3,4]. Although MCAC produced higher NH3 fluxes on days 1 and 3, the pronounced day-10 peak observed in AC was absent under the membrane. The reduction in the estimated cumulative NH3 emission was therefore mainly associated with the thermophilic stage. Lower NH3 emissions have also been reported with membrane covering, but other experiments found greater NH3 release despite lower total N loss [13,14]. Membrane-transport experiments further showed that condensed water and deposits on the membrane surface can reduce gas permeability and promote gas retention [35]. Because condensation, membrane permeability, and the pressure difference across the membrane were not measured here, this remains a possible explanation for the lower net NH3 release rather than a mechanism demonstrated by the present experiment.
The highest N2O and CH4 fluxes occurred at the beginning of composting, particularly in AC (Figure 2B,C). Rapid degradation of readily available organic matter increases oxygen demand and can create oxygen-limited microsites favorable for methanogenesis [10,36], while spatially heterogeneous aeration may permit nitrification- and denitrification-related N2O production [23]. The lower day-1 fluxes in MCAC indicate lower net gas release at the membrane surface, but the measurements do not distinguish changes in gas production or consumption within the pile from transfer through the membrane. Previous studies that measured the environment beneath functional membranes associated lower N2O emissions with changes in aeration and carbon utilization [26,37]. Because oxygen concentration and pressure beneath the membrane were not measured here, these processes remain possible explanations rather than demonstrated causes of the observed flux differences.
The estimated GWP derived from direct CH4 and N2O emissions was 37.5% lower in MCAC (Figure 2G). Reductions in these gases have also been reported in membrane-covered hyperthermophilic and biochar-comparison experiments [16,38], although a thermophilic-stage study of two membrane materials found contrasting CH4 responses across the covers [15]. Thus, the present results support a reduction in direct greenhouse-gas emissions under the operating conditions tested, rather than a uniform response across all covered systems. This estimate does not include energy use, membrane manufacture, transportation, or emissions after compost application and therefore should not be interpreted as a life-cycle carbon footprint [39].
4.2. Nitrogen Transformation and Mineral-N Retention During Composting
The rapid accumulation of NH4+-N during the early stage reflects the mineralization of readily degradable organic N (Figure 1E). Its subsequent decrease may result from NH3 volatilization, microbial assimilation, and oxidation to NO2− and NO3− [3,4,9,22]. Although the two treatments reached similar NH4+-N concentrations on day 3, their later trajectories differed. NH4+-N continued to decrease in AC, whereas MCAC maintained a higher NH4+-N concentration during cooling and maturation. By day 35, the NH4+-N concentration in MCAC was approximately threefold that in AC. The higher late-stage NH4+-N concentration in MCAC coincided with the absence of the marked day-10 peak in net NH3 release. Higher final NH4+-N and lower external NH3 emissions were also observed during membrane-covered biogas-residue composting [40], although the feedstock and membrane differed from those used here.
NO3−-N remained low during the thermophilic stage and accumulated as the piles cooled (Figure 1F). High temperatures and high NH4+-N concentrations can suppress ammonia- and nitrite-oxidizing microorganisms, whereas the cooling and maturation stages are generally more favorable for nitrification and nitrate accumulation [9,22]. The final NO3−-N concentration was 87.8% higher in MCAC than in AC. The higher final concentrations of both NH4+-N and NO3−-N indicate greater mineral-N retention in the finished compost on a concentration basis, with nitrate accumulation consistent with continued late-stage nitrification. Although late-stage pH was also higher in MCAC, NH3 flux remained low, suggesting that pH alone did not determine the emission pattern. Reduced NH3 loss under FeSO4 amendment has been linked to pH control [41], but the present combination of higher pH and low NH3 flux points to additional controls on gas release in the covered piles.
Mean TN concentration decreased by 17.82% in AC and 14.98% in MCAC between days 1 and 35. Although the final TN concentration remained higher in AC, the smaller decline in MCAC, together with its lower NH3 and N2O emissions and higher final mineral-N concentrations, supports improved mineral-N retention under membrane covering. Together with previous reports of reduced gaseous N loss and altered N distribution under membrane covering [14,37], these changes indicate greater mineral-N retention under MCAC. Because final pile dry mass was not measured, whole-pile N recovery and a complete N mass balance could not be determined.
4.3. Response of Bacterial Community Succession to Membrane Covering
Composting stage explained 33.95% of the variation in bacterial community composition and was the only significant overall effect, whereas treatment explained 5.71% (Figure 3C,D). Pseudomonadota predominated at the beginning of composting and declined thereafter, whereas Actinomycetota increased during cooling and maturation. Similar stage-dependent successions have been reported in membrane-covered composting and other composting systems [7,8,42]. Changes in temperature, moisture, and substrate availability favor different bacterial groups as readily degradable substrates are depleted and more resistant organic matter becomes increasingly important. Associations between bacterial succession and compost temperature, pH, and N properties have also been observed during studies of dissolved organic matter [43], supporting composting stage as the main context for interpreting the community shifts here.
The influence of membrane covering was concentrated in the thermophilic and early cooling stages. MCAC contained more Pseudomonadota on day 10 and more Chloroflexota on day 20, whereas Actinomycetota was more abundant in AC on day 20. Differences among the dominant genera were similarly concentrated on days 10 and 20, when Mesorhizobium and Bacillus were enriched in MCAC and Nonomuraea and Streptomyces were more abundant in AC. Earlier membrane-covering studies also found treatment-related shifts in bacterial composition [7,8,13]. In the present experiment, these taxonomic differences occurred during the same period in which mineral-N concentrations and gaseous emissions diverged most clearly between treatments.
Shannon diversity declined during composting and differed between treatments only on day 35 (Figure 3B). The absence of significant overall treatment and treatment × day effects indicates that membrane covering did not cause a sustained change in bacterial diversity. Its community-level influence was expressed mainly through shifts in the relative abundance of particular taxa. Because taxa at the phylum or genus level may contain organisms with contrasting metabolic traits, these abundance patterns alone cannot establish their roles in N transformation.
4.4. Changes in Nitrogen-Cycling Functional Potential
The N-cycling profiles changed primarily with composting time. Twelve of the 14 functional steps showed significant day effects after BH adjustment, whereas no step showed a significant overall treatment or treatment × day effect (Figure 4A,B). Within individual functional steps, ammonia oxidation, nitrate reduction, denitrification, DNRA, and anammox-related hydrazine synthesis generally showed higher standardized values during early composting and declined thereafter, while urea-hydrolysis potential increased during the later stage. This predominance of temporal variation agrees with reports that N transformation and related functional genes vary markedly among composting stages [9,22,23], as substrate availability and the physicochemical environment change [17,18,20,21].
Previous membrane-covered composting studies have mainly evaluated selected functional genes by qPCR or inferred metabolic functions from 16S rRNA profiles [9,10,16,22,26]. By directly annotating shotgun metagenomic reads against NCycDB, the present study extended the comparison to 29 detected genes representing 14 N-cycling functional steps. The principal additional finding was not a uniform shift in N-cycling potential under membrane covering, but the predominance of composting-stage effects together with a localized difference in ammonia-oxidation potential on day 10. This temporal pattern provides a more resolved context for interpreting the accompanying changes in mineral N and gaseous emissions.
Date-specific treatment differences were limited after BH adjustment, with only ammonia-oxidation potential remaining higher in MCAC on day 10 (Figure 4D). This difference coincided with the higher NO3−-N concentration in MCAC at the same stage. N2O-reduction potential showed no clear treatment separation, indicating that the lower N2O emission under MCAC cannot be attributed solely to an increase in N2O-reduction potential. Another membrane-covered study reported lower N2O emissions together with decreases in both N2O-production and reduction gene abundances [26], while metagenome-resolved analyses have identified distinct microbial sources and sinks of N2O during composting [23]. The balance among these functions, rather than the abundance of a single marker, is consequently important when interpreting N2O release.
Denitrification and nitrification profiles were associated with most of the measured compost properties (Figure 5). Moisture showed the strongest association with denitrification, whereas nitrification covaried most closely with moisture and NO3−-N. These relationships are consistent with the sensitivity of microbial N transformation to water status, oxygen diffusion, carbon supply, and inorganic-N availability [3,9,23,26]. Ammonification, nitrogen fixation, and assimilatory nitrate reduction were associated with fewer environmental variables, and no significant association was detected for anammox. DNRA was retained in the step-level analysis but omitted from the process-level Mantel network because only one variable marker gene was available to construct its process profile.
Treatment-related changes in N-cycling potential were transient and occurred when the two composting systems also differed most clearly in NH4+-N, NO3−-N, NH3, and N2O. This temporal correspondence was consistent with the contrasting N-transformation patterns observed in AC and MCAC. However, the Mantel associations also reflect the common progression of composting stage, and metagenomic abundance indicates functional potential rather than gene expression or pathway rate. Metagenomic and metatranscriptomic comparisons have shown the value of examining community composition together with expressed functions [42], while a kaolin-amended swine-manure study combined metagenome-resolved analysis with functional-gene transcription measurements [44]. Such measurements, together with enzyme activities or isotope-based N fluxes, would help establish which of the potential transformations identified here are active during composting.
4.5. Agronomic Implications and Limitations
Semi-permeable membrane covering reduced gaseous N loss without disrupting the thermophilic progression of swine manure composting. The higher final NH4+-N and NO3−-N concentrations indicate improved mineral-N retention in the organic fertilizer product on a concentration basis. Reducing NH3 limits reactive-N loss, while reducing N2O decreases both N loss and direct climate impact [2,5,6]. Together with the lower CH4- and N2O-derived GWP, these findings show that MCAC reduced gaseous emissions while maintaining higher mineral-N concentrations in the final compost. Final GI values exceeded 80% in both treatments (Figure S2B), indicating low phytotoxicity in the seed test. GI is commonly used alongside other indicators to assess compost maturity [1,45], but it does not by itself establish fertilizer performance. The fertilizer value and crop availability associated with the higher mineral-N concentrations under MCAC should be assessed in plant-growth or field experiments.
The five gas-sampling dates covered the early thermophilic (days 1 and 3), peak thermophilic (day 10), late thermophilic (day 20), and cooling/maturation (day 35) periods of the composting process. The resulting 35-day cumulative emissions were estimated by assigning each measured flux to its preceding sampling interval and should be interpreted as area-normalized estimates obtained using a standardized chamber position. This design enabled consistent comparison between treatments, although short-lived emission peaks between sampling dates and spatial variation across the pile surface may not have been fully captured. Interpretation of N conservation was based on the measured changes in N forms and gaseous emissions rather than a complete whole-pile balance, while the metagenomic profiles were used to assess functional potential rather than pathway activity. Without under-membrane oxygen and pressure measurements, the relative contributions of membrane transfer and changes in microbial gas production and consumption could not be resolved. Future studies combining denser temporal and spatial gas measurements with final-mass and under-membrane monitoring across different feedstocks, pile scales, aeration regimes, and membrane properties would help define the reproducibility and applicable range of the observed effects.
5. Conclusions
Semi-permeable membrane covering maintained thermophilic composting while reducing the estimated cumulative emissions of NH3, N2O, and CH4 by 53.1%, 34.1%, and 45.7%, respectively. The estimated direct GWP derived from direct CH4 and N2O emissions was reduced by 37.5%. MCAC also retained higher NH4+-N and NO3−-N concentrations at the end of composting, while TN concentration decreased by 14.98% in MCAC compared with 17.82% in AC from day 1 to day 35. Together, these results show that membrane covering reduced gaseous N loss and improved mineral-N retention on a concentration basis under the conditions of this experiment.
Bacterial community composition and N-cycling functional potential changed mainly with composting stage, while the effects of membrane covering were concentrated in particular taxa, functional steps, and sampling periods. Among the N-cycling functional steps, MCAC showed higher ammonia-oxidation potential than AC on day 10. Nitrification and denitrification profiles also covaried closely with moisture and inorganic N. These metagenomic patterns are consistent with the observed changes in N transformation but represent functional potential rather than pathway activity. Semi-permeable membrane covering therefore offers a practical approach to reducing gaseous N loss and direct greenhouse-gas emissions while maintaining higher mineral-N concentrations in the final compost. Its performance and the processes responsible for the lower membrane-surface gas release should be further evaluated across different feedstocks and operating conditions.
Supplementary Materials
The following supporting information can be downloaded at https://www.mdpi.com/article/10.3390/agronomy16202060/s1, Table S1A: Mean CPM-normalized abundances of the 29 detected nitrogen-cycling genes during AC and MCAC; Table S1B: Sample-level CPM-normalized abundances of the 29 detected nitrogen-cycling genes; Table S2: Mapping of the 29 detected N-cycling genes and enzyme subunits to 14 functional steps and seven broad N-cycling processes; Figure S1: Experiment-wide effects of treatment, composting day, and their interaction on physicochemical properties; Figure S2: Supplementary indicators of physicochemical change and compost maturity during AC and MCAC; Figure S3: Succession of the top 20 abundant genera during AC and MCAC.
Author Contributions
Y.L. (Yusheng Lu): Conceptualization, data curation, methodology, validation, investigation, software, visualization, formal analysis, writing—original draft, writing—review and editing. Y.L. (Yaying Li) and X.L.: Conceptualization, formal analysis, data curation, investigation. C.S.: Conceptualization, formal analysis, data curation, investigation, writing—review and editing. H.W. and R.X.: Data curation, visualization. D.W., K.X. and H.P.: Supervision, resources. C.Z.: Data curation, validation, investigation. K.Z.: Supervision, resources. W.L. and L.S.: Data curation, validation, investigation. D.D.: Supervision, resources. W.G. and Z.T.: Conceptualization, project administration, resources, formal analysis, funding acquisition, writing—review and editing, supervision. All authors have read and agreed to the published version of the manuscript.
Funding
This work was supported financially by the Low carbon agriculture and carbon neutralization Research Center (XT202220 and XT202223), The National Key Technology Research and Development Program of China (2023YFD1702200), Modern Agricultural Industrial Technology System of Guangdong Province (2026CXTD17), Guangdong Basic and Applied Basic Research Foundation (2023A1515110310), Science and Technology Planning Project of Guangdong Province (2025B1212070002 and 2021B1212050020), Guangzhou Science and Technology Plan Project (2025B03J0098).
Data Availability Statement
The raw shotgun metagenomic sequencing reads and associated sample metadata are available through the NCBI Sequence Read Archive under BioProject accession PRJNA1542513 (<https://www.ncbi.nlm.nih.gov/bioproject/?term=PRJNA1542513 (accessed on 15 October 2026)>). The processed CPM-normalized abundance matrix and the gene-to-step/process mapping are provided in the Supplementary Materials.
Conflicts of Interest
The authors declare no conflicts of interest.
Abbreviations
The following abbreviations are used in this manuscript:
| AC | Aerobic Composting |
| MCAC | Membrane-Covered Aerobic Composting |
| TC | Total Carbon |
| TN | Total Nitrogen |
| GI | Germination index |
References
- Bernal, M.P.; Alburquerque, J.A.; Moral, R. Composting of animal manures and chemical criteria for compost maturity assessment. A review. Bioresour. Technol. 2009, 100, 5444–5453. [Google Scholar] [CrossRef] [Scilit] [PubMed]
- Chen, J.; Jin, C.; Sun, S.; Yang, D.; He, Y.; Gan, P.; Nalume, W.G.; Ma, Y.; He, W.; Li, G. Recognizing the challenges of composting: Critical strategies for control, recycling, and valorization of nitrogen loss. Resour. Conserv. Recycl. 2023, 198, 107172. [Google Scholar] [CrossRef] [Scilit]
- Jiang, T.; Schuchardt, F.; Li, G.; Guo, R.; Zhao, Y. Effect of C/N ratio, aeration rate and moisture content on ammonia and greenhouse gas emission during the composting. J. Environ. Sci. 2011, 23, 1754–1760. [Google Scholar] [CrossRef] [Scilit] [PubMed]
- Pagans, E.; Barrena, R.; Font, X.; Sánchez, A. Ammonia emissions from the composting of different organic wastes. Dependency on process temperature. Chemosphere 2006, 62, 1534–1542. [Google Scholar] [CrossRef] [Scilit] [PubMed]
- Nordahl, S.L.; Preble, C.V.; Kirchstetter, T.W.; Scown, C.D. Greenhouse Gas and Air Pollutant Emissions from Composting. Environ. Sci. Technol. 2023, 57, 2235–2247. [Google Scholar] [CrossRef] [Scilit] [PubMed]
- Liu, Y.; Tang, R.; Li, L.; Zheng, G.; Wang, J.; Wang, G.; Bao, Z.; Yin, Z.; Li, G.; Yuan, J. A global meta-analysis of greenhouse gas emissions and carbon and nitrogen losses during livestock manure composting: Influencing factors and mitigation strategies. Sci. Total Environ. 2023, 885, 163900. [Google Scholar] [CrossRef] [Scilit] [PubMed]
- Ma, S.; Fang, C.; Sun, X.; Han, L.; He, X.; Huang, G. Bacterial community succession during pig manure and wheat straw aerobic composting covered with a semi-permeable membrane under slight positive pressure. Bioresour. Technol. 2018, 259, 221–227. [Google Scholar] [CrossRef] [Scilit] [PubMed]
- Ma, S.; Xiong, J.; Wu, X.; Liu, H.; Han, L.; Huang, G. Effects of the functional membrane covering on the gas emissions and bacterial community during aerobic composting. Bioresour. Technol. 2021, 340, 125660. [Google Scholar] [CrossRef] [Scilit] [PubMed]
- Xiong, J.; Su, Y.; He, X.; Han, L.; Guo, J.; Qiao, W.; Huang, G. Effects of functional-membrane covering technique on nitrogen succession during aerobic composting: Metabolic pathways, functional enzymes, and functional genes. Bioresour. Technol. 2022, 354, 127205. [Google Scholar] [CrossRef] [Scilit] [PubMed]
- Ma, S.; Sun, X.; Fang, C.; He, X.; Han, L.; Huang, G. Exploring the mechanisms of decreased methane during pig manure and wheat straw aerobic composting covered with a semi-permeable membrane. Waste Manag. 2018, 78, 393–400. [Google Scholar] [CrossRef] [Scilit] [PubMed]
- Sun, X.; Ma, S.; Han, L.; Li, R.; Schlick, U.; Chen, P.; Huang, G. The effect of a semi-permeable membrane-covered composting system on greenhouse gas and ammonia emissions in the Tibetan Plateau. J. Clean. Prod. 2018, 204, 778–787. [Google Scholar] [CrossRef] [Scilit]
- Fang, C.; Yin, H.; Han, L.; Ma, S.; He, X.; Huang, G. Effects of semi-permeable membrane covering coupled with intermittent aeration on gas emissions during aerobic composting from the solid fraction of dairy manure at industrial scale. Waste Manag. 2021, 131, 1–9. [Google Scholar] [CrossRef] [Scilit] [PubMed]
- Yang, Y.; Chen, W.; Liu, G.; Cui, B.; Zhang, L.; Wuyun, D.; Wang, Q.; Wang, G.; Li, G.; Yuan, J. Effect of a semi-permeable membrane covered composting on greenhouse gas emissions and bacterial community succession: A comparative study with biomass materials covering. J. Clean. Prod. 2024, 434, 140146. [Google Scholar] [CrossRef] [Scilit]
- Xiong, J.; Zhuo, Q.; Su, Y.; Qu, H.; He, X.; Han, L.; Huang, G. Nitrogen evolution during membrane-covered aerobic composting: Interconversion between nitrogen forms and migration pathways. J. Environ. Manag. 2023, 345, 118727. [Google Scholar] [CrossRef] [Scilit] [PubMed]
- Varga, Z.I.; Shahzad, S.; Ramay, M.W.; Damak, M.; Gulyás, M.; Béres, A.; Gyuricza, C.; Székács, A.; Aleksza, L. Ammonia and Greenhouse Gas Emissions from Organic Manure Composting: The Effect of Membrane Cover. Agronomy 2024, 14, 1471. [Google Scholar] [CrossRef] [Scilit]
- Xiong, J.; Ma, S.; Wu, X.; Fang, C.; Huang, G. Effects of biochar addition and semi-permeable membrane covering on aerobic composting: Insights into carbon–nitrogen transformations and bacterial community and function succession. Environ. Technol. Innov. 2026, 41, 104824. [Google Scholar] [CrossRef] [Scilit]
- Kuypers, M.M.M.; Marchant, H.K.; Kartal, B. The microbial nitrogen-cycling network. Nat. Rev. Microbiol. 2018, 16, 263–276. [Google Scholar] [CrossRef] [Scilit] [PubMed]
- Zumft, W.G. Cell biology and molecular basis of denitrification. Microbiol. Mol. Biol. Rev. 1997, 61, 533–616. [Google Scholar] [CrossRef] [Scilit] [PubMed]
- Philippot, L.; Hallin, S.; Schloter, M. Ecology of Denitrifying Prokaryotes in Agricultural Soil. Adv. Agron. 2007, 96, 249–305. [Google Scholar] [CrossRef] [Scilit]
- Kraft, B.; Strous, M.; Tegetmeyer, H.E. Microbial nitrate respiration—Genes, enzymes and environmental distribution. J. Biotechnol. 2011, 155, 104–117. [Google Scholar] [CrossRef] [Scilit] [PubMed]
- Simon, J.; Klotz, M.G. Diversity and evolution of bioenergetic systems involved in microbial nitrogen compound transformations. Biochim. Biophys. Acta Bioenerg. 2013, 1827, 114–135. [Google Scholar] [CrossRef] [Scilit] [PubMed]
- Xiong, J.; Ma, S.; He, X.; Han, L.; Huang, G. Nitrogen transformation and dynamic changes in related functional genes during functional-membrane covered aerobic composting. Bioresour. Technol. 2021, 332, 125087. [Google Scholar] [CrossRef] [Scilit] [PubMed]
- Xu, Z.; Gao, X.; Li, G.; Nghiem, L.D.; Luo, W.; Zhang, F. Microbial Sources and Sinks of Nitrous Oxide during Organic Waste Composting. Environ. Sci. Technol. 2024, 58, 7367–7379. [Google Scholar] [CrossRef] [Scilit] [PubMed]
- Tu, Q.; Lin, L.; Cheng, L.; Deng, Y.; He, Z. NCycDB: A curated integrative database for fast and accurate metagenomic profiling of nitrogen cycling genes. Bioinformatics 2019, 35, 1040–1048. [Google Scholar] [CrossRef] [Scilit] [PubMed]
- Hu, T.; Wang, X.; Zhen, L.; Gu, J.; Zhang, K.; Wang, Q.; Ma, J.; Peng, H.; Lei, L.; Zhao, W. Effects of inoculating with lignocellulose-degrading consortium on cellulose-degrading genes and fungal community during co-composting of spent mushroom substrate with swine manure. Bioresour. Technol. 2019, 291, 121876. [Google Scholar] [CrossRef] [Scilit] [PubMed]
- Xiong, J.; Qu, H.; Harty, M.; Lin, S.; Huang, G. Membrane-covered aerobic composting mitigated nitrous oxide emission through improved micro-aerobic state and enhanced carbon source utilization. Bioresour. Technol. 2025, 420, 132127. [Google Scholar] [CrossRef] [Scilit] [PubMed]
- Zheng, J.; Lu, Y.; Xu, P.; Xie, K.; Zhou, C.; Li, Y.; Geng, H.; Wang, Q.; Gu, W. Insights into the Driving Factors of Methane Emission from Double-Season Rice Field Under Different Fertilization Practices in South China. Agronomy 2024, 14, 2767. [Google Scholar] [CrossRef] [Scilit]
- Amlinger, F.; Peyr, S.; Cuhls, C. Green house gas emissions from composting and mechanical biological treatment. Waste Manag. Res. 2008, 26, 47–60. [Google Scholar] [CrossRef] [Scilit] [PubMed]
- IPCC. Climate Change 2021: The Physical Science Basis. Contribution of Working Group I to the Sixth Assessment Report of the Intergovernmental Panel on Climate Change; Masson-Delmotte, V., Zhai, P., Pirani, A., Connors, S.L., Péan, C., Berger, S., Caud, N., Chen, Y., Goldfarb, L., Gomis, M.I., et al., Eds.; Cambridge University Press: Cambridge, UK; New York, NY, USA, 2021. [Google Scholar]
- Bolger, A.M.; Lohse, M.; Usadel, B. Trimmomatic: A flexible trimmer for Illumina sequence data. Bioinformatics 2014, 30, 2114–2120. [Google Scholar] [CrossRef] [Scilit] [PubMed]
- Wood, D.E.; Lu, J.; Langmead, B. Improved metagenomic analysis with Kraken 2. Genome Biol. 2019, 20, 257. [Google Scholar] [CrossRef] [Scilit] [PubMed]
- Lu, J.; Breitwieser, F.P.; Thielen, P.; Salzberg, S.L. Bracken: Estimating species abundance in metagenomics data. PeerJ Comput. Sci. 2017, 3, e104. [Google Scholar] [CrossRef] [Scilit] [PubMed]
- Buchfink, B.; Reuter, K.; Drost, H.G. Sensitive protein alignments at tree-of-life scale using DIAMOND. Nat. Methods 2021, 18, 366–368. [Google Scholar] [CrossRef] [Scilit] [PubMed]
- Oksanen, J.; Blanchet, F.G.; Kindt, R.; Legendre, P.; Minchin, P.R.; O’hara, R.B.; Simpson, G.L.; Solymos, P.; Stevens, M.H.H.; Wagner, H.; et al. Package ‘vegan’. Community Ecol. Package Version 2013, 2, 1–295. [Google Scholar]
- An, G.; Li, W.; Gao, X.; Luo, Y.; Xu, Z.; Li, G.; Luo, W.; Nghiem, L.D. Membrane coverage to retain gas emission during organic waste composting: Performance and moisture impacts. J. Membr. Sci. 2025, 722, 123841. [Google Scholar] [CrossRef] [Scilit]
- Zeng, J.; Yin, H.; Shen, X.; Liu, N.; Ge, J.; Han, L.; Huang, G. Effect of aeration interval on oxygen consumption and GHG emission during pig manure composting. Bioresour. Technol. 2018, 250, 214–220. [Google Scholar] [CrossRef] [Scilit] [PubMed]
- Xiong, J.; Su, Y.; Qu, H.; Han, L.; He, X.; Guo, J.; Huang, G. Effects of micro-positive pressure environment on nitrogen conservation and humification enhancement during functional membrane-covered aerobic composting. Sci. Total Environ. 2023, 864, 161065. [Google Scholar] [CrossRef] [Scilit] [PubMed]
- Sun, B.; Bai, Z.; Li, Y.; Li, R.; Song, M.; Xu, S.; Zhang, H.; Zhuang, X. Emission mitigation of CH4 and N2O during semi-permeable membrane covered hyperthermophilic aerobic composting of livestock manure. J. Clean. Prod. 2022, 379, 134850. [Google Scholar] [CrossRef] [Scilit]
- Hou, Y.; Velthof, G.L.; Oenema, O. Mitigation of ammonia, nitrous oxide and methane emissions from manure management chains: A meta-analysis and integrated assessment. Glob. Change Biol. 2015, 21, 1293–1312. [Google Scholar] [CrossRef] [Scilit] [PubMed]
- Li, Y.; Liu, Y.; Yong, X.; Wu, X.; Jia, H.; Wong, J.W.C.; Wu, H.; Zhou, J. Odor emission and microbial community succession during biogas residue composting covered with a molecular membrane. Bioresour. Technol. 2020, 297, 122518. [Google Scholar] [CrossRef] [Scilit] [PubMed]
- Mei, J.; Ji, K.; Su, L.; Wu, M.; Zhou, X.; Duan, E. Effects of FeSO4 dosage on nitrogen loss and humification during the composting of cow dung and corn straw. Bioresour. Technol. 2021, 341, 125867. [Google Scholar] [CrossRef] [Scilit] [PubMed]
- Antunes, L.P.; Martins, L.F.; Pereira, R.V.; Thomas, A.M.; Barbosa, D.; Lemos, L.N.; Silva, G.M.M.; Moura, L.M.S.; Epamino, G.W.C.; Digiampietri, L.A.; et al. Microbial community structure and dynamics in thermophilic composting viewed through metagenomics and metatranscriptomics. Sci. Rep. 2016, 6, 38915. [Google Scholar] [CrossRef] [Scilit] [PubMed]
- Jiang, Z.; Lu, Y.; Xu, J.; Li, M.; Shan, G.; Li, Q. Exploring the characteristics of dissolved organic matter and succession of bacterial community during composting. Bioresour. Technol. 2019, 292, 121942. [Google Scholar] [CrossRef] [Scilit] [PubMed]
- Li, H.; Zhao, Z.; Shi, M.; Luo, B.; Wang, G.; Wang, X.; Gu, J.; Song, Z.; Sun, Y.; Zhang, L.; et al. Metagenomic binning analyses of swine manure composting reveal mechanism of nitrogen cycle amendment using kaolin. Bioresour. Technol. 2024, 393, 130156. [Google Scholar] [CrossRef] [Scilit] [PubMed]
- Ji, Z.; Zhang, L.; Liu, Y.; Li, X.; Li, Z. Evaluation of composting parameters, technologies and maturity indexes for aerobic manure composting: A meta-analysis. Sci. Total Environ. 2023, 886, 163929. [Google Scholar] [CrossRef] [Scilit] [PubMed]

Disclaimer/Publisher’s Note: The statements, opinions and data contained in all publications are solely those of the individual author(s) and contributor(s) and not of MDPI and/or the editor(s). MDPI and/or the editor(s) disclaim responsibility for any injury to people or property resulting from any ideas, methods, instructions or products referred to in the content. |
© 2026 by the authors. Licensee MDPI, Basel, Switzerland. This article is an open access article distributed under the terms and conditions of the Creative Commons Attribution (CC BY) license.