


Abstract
Accurate postharvest quality assessment of specialty grains remains challenging due to complex quality variations and the limited deployment of multimodal sensing systems. RGB imaging provides efficient external phenotypic information, whereas visible–near-infrared (VNIR) sensing provides complementary wavelength-dependent reflectance information. However, the high cost and complexity of spectral acquisition restrict the practical application of multimodal models. This study proposes an RGB–VNIR cross-modal decision residual distillation framework for non-destructive quality recognition of Canadian wild rice kernels. The proposed Decision Spectral Residual Extractor (DSRE) models VNIR information as decision-level residual knowledge relative to RGB predictions, while the Cross-modal Residual Reliability Adaptation (CRRA) selectively transfers transferable spectral knowledge according to residual utility and recoverability. Experiments on eight quality categories of Canadian wild rice kernels demonstrated the effectiveness of the proposed framework. On the paired RGB–VNIR test set (n = 384), the DSRE-based multimodal teacher achieved 97.40% Accuracy, compared with 94.53% for the CRRA RGB-only student on the same samples, confirming the complementary contribution of VNIR information. In a separate evaluation on the held-out RGB-only test set (n = 1570), the CRRA student achieved 98.60% Accuracy and 98.62% Macro-F1, indicating effective multimodal knowledge transfer without VNIR acquisition during inference. The proposed framework establishes practical multimodal learning with a unimodal deployment paradigm, providing a promising solution for cost-effective and non-destructive quality evaluation of specialty grains.
1. Introduction
Canadian wild rice (Zizania palustris) is a distinctive specialty grain with unique nutritional characteristics and considerable commercial value, showing promising applications in health-oriented foods and premium grain markets [1,2]. Compared with conventional cereals, wild rice kernels possess distinctive morphological structures and sensory attributes, and their commercial quality is determined not only by nutritional composition and flavor characteristics but also by kernel integrity, coloration, maturity, and appearance uniformity. For wild rice products primarily marketed as whole kernels, maintaining consistent kernel quality is essential for processing suitability and market acceptance. Therefore, accurate characterization of different kernel quality conditions is important for improving postharvest quality management and promoting the standardized utilization of Canadian wild rice. However, the kernel quality of wild rice can be substantially affected by multiple postharvest processes, resulting in considerable within-batch variability [3]. Mechanical stress and environmental changes during harvesting, drying, dehulling, transportation, and storage may induce kernel breakage, surface damage, variations in dehulling status, discoloration, and insect-related defects [4]. The combined effects of these factors lead to diverse quality conditions within the same batch, increasing the difficulty of product grading and batch consistency control. Moreover, different kernel conditions may further influence processing performance, commercial grading, and storage stability. Therefore, fine-grained identification of postharvest kernel quality conditions is essential for improving quality control efficiency in wild rice production [5]. Currently, agricultural kernel quality assessment mainly relies on manual visual grading and physicochemical measurements. Manual grading enables rapid evaluation based on visible characteristics such as color, integrity, and apparent defects; however, its reliability is affected by operator experience, illumination conditions, and defect visibility, particularly for kernels with subtle discoloration, localized damage, or similar external appearances. Although physicochemical analyses provide detailed compositional and quality-related information, they generally require sample preparation, specialized equipment, and time-consuming procedures, limiting their application in large-scale rapid screening. Furthermore, kernel quality is multidimensional, and a single evaluation strategy may not consistently capture differences in appearance and structural integrity across kernels. Therefore, the development of rapid, objective, and non-destructive approaches for multidimensional quality assessment is critical for intelligent grading and postharvest management of wild rice [6,7].
From the perspective of grain quality development and phenotypic manifestation, different quality conditions in this study are primarily reflected by visible and structural attributes, including color, morphology, size, surface condition, and structural integrity. Grain color, morphology, size, and surface texture can reflect external appearance characteristics and certain visible defects, whereas VNIR sensing may provide complementary spectral information potentially associated with compositional and structural differences among samples. Previous studies have demonstrated that machine vision can utilize image-derived features, such as color, morphology, and texture, for seed cultivar identification and external quality evaluation of agricultural products. Jin et al. [8] utilized RGB images with deep learning methods to automatically identify different rice cultivars, highlighting the potential of visual phenotypic information for grain classification. Rajalakshmi et al. [9] proposed a Vision Transformer-based rice seed recognition model and showed that advanced visual architectures can effectively capture fine-grained variations among seed categories. Akbarpour et al. [10] and Tu et al. [11] explored RGB-based approaches for maize seed classification, respectively, by extracting visible phenotypic characteristics, including color, morphology, and texture features. Dreier et al. [12] combined near-infrared hyperspectral imaging with deep convolutional neural networks for bulk grain classification, demonstrating that spectral information provides complementary features for characterizing differences among agricultural samples. Yu et al. [13] proposed a Transformer-based hyperspectral classification framework that improved the discrimination of complex agricultural objects by modeling relationships among different spectral bands. However, a single sensing modality generally captures only partial characteristics of grain quality and may fail to represent complex quality variations, motivating the integration of complementary visual and spectral information [14].
Consequently, multisource sensing and data fusion have increasingly been explored for intelligent identification and quality evaluation of agricultural products. Since agricultural product quality can be reflected by multiple characteristics, including external appearance, structural properties, and complementary sensor responses, a single sensing modality may be insufficient to fully capture quality-related differences. By integrating information from multiple sensors, multimodal approaches combine visible phenotypic characteristics with wavelength-dependent spectral responses, potentially improving classification performance and robustness. In recent years, multimodal fusion techniques have been increasingly explored for seed classification, quality evaluation, and intelligent agricultural sorting. For maize seed identification and sorting, previous studies have developed spectral–spatial and RGB–spectral fusion strategies to jointly exploit visual phenotypic information and spectral characteristics, demonstrating the effectiveness of heterogeneous feature integration [15,16,17]. Yang et al. [18] further combined RGB images with hyperspectral information for sorghum seed variety identification, where the integration of spatial and spectral features improved the discrimination capability among different varieties. Bai et al. [19] combined machine vision with hyperspectral imaging for wheat kernel quality assessment and showed that multimodal information could provide complementary representations of kernel quality variations. Xie et al. [20] integrated machine vision, hyperspectral imaging, and electronic-nose sensing to develop a three-modal fusion framework for maize seed vigor grading, demonstrating the potential of multi-source information fusion for complex agricultural quality assessment. Beyond direct fusion, cross-modal distillation has been used to transfer information from auxiliary modalities to models that operate on RGB images at inference, as demonstrated by modality hallucination [21] and multimodal teacher–student learning [22]. Recent work has also considered prediction alignment when selecting knowledge for transfer across modalities [23].
However, the application of multisource sensing for kernel-scale postharvest quality assessment of Canadian wild rice remains insufficiently explored. The eight quality categories investigated in this study were predefined according to the original dataset annotation criteria. Therefore, RGB–VNIR integration enables characterization of kernels from both phenotypic and spectral perspectives, which is particularly suitable for Canadian wild rice with diverse morphological characteristics and heterogeneous postharvest defects. Although multisource sensing has shown potential for agricultural product classification, vigor evaluation, and quality assessment, most existing studies have focused on cultivar discrimination or individual quality attributes. Fine-grained recognition of multiple postharvest conditions within heterogeneous Canadian wild rice batches remains insufficiently explored. Systematic single-kernel RGB–VNIR characterization for distinguishing healthy, discolored, damaged, insect-affected, and differently dehulled kernels is still limited, restricting the application of multisource sensing in wild rice grading and quality management.
To address this gap, this study developed a cross-modal framework based on paired RGB–VNIR data for rapid, non-destructive recognition of Canadian wild rice kernel quality conditions. DSRE represents the incremental contribution of VNIR information relative to RGB predictions as a decision residual, while CRRA selectively transfers this residual knowledge to an RGB-only student according to its classification utility and recoverability from RGB features. The framework aims to improve discrimination among the quality categories while requiring only RGB images at inference, providing a more practical approach to postharvest grading and quality control of specialty grains.
2. Material and Methods
2.1. Dataset Description and Quality Categories
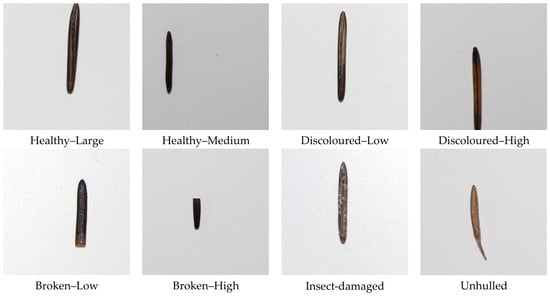
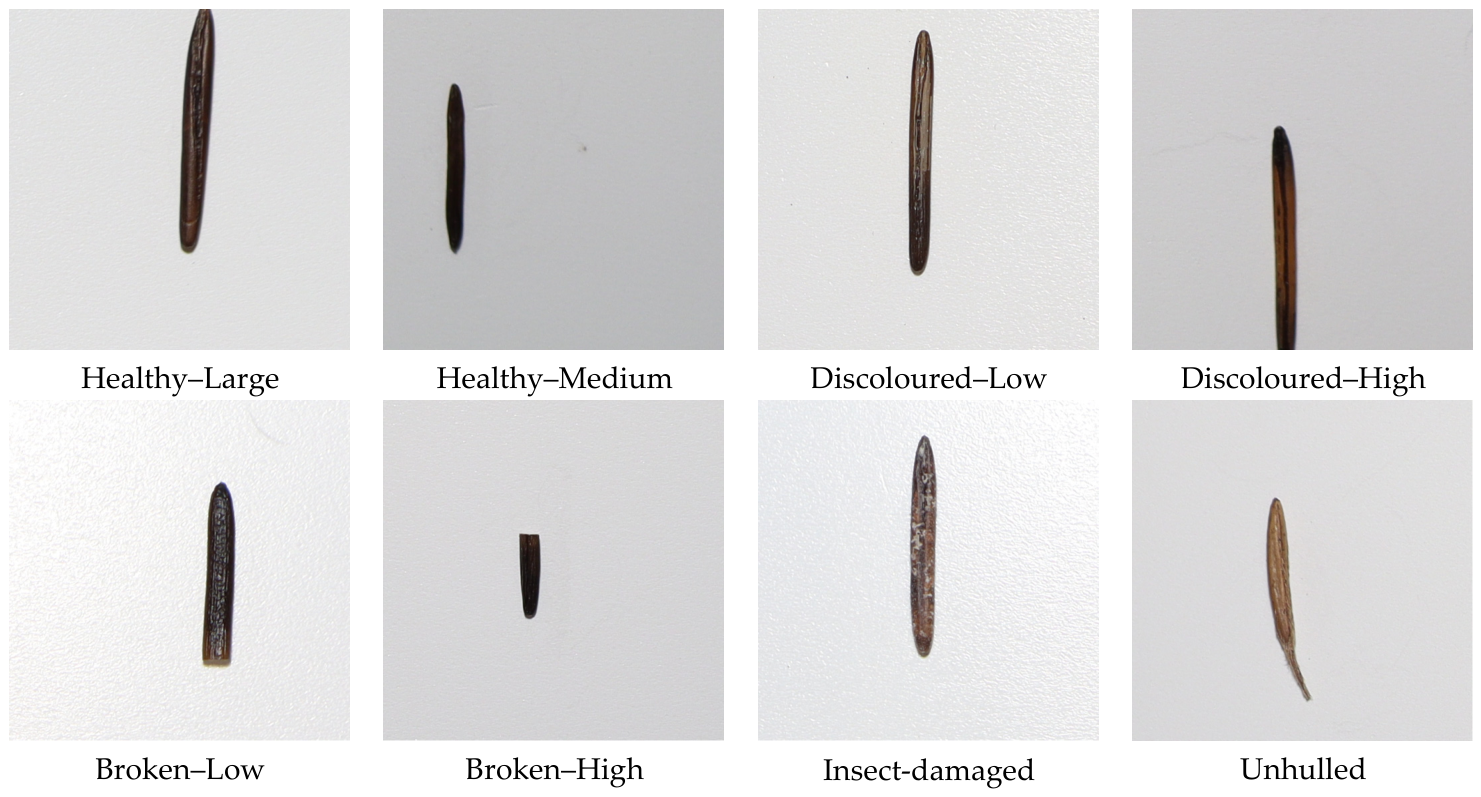
A publicly available RGB–VNIR multimodal dataset of Canadian wild rice (Zizania palustris) was used in this study. The dataset contains paired RGB and visible–near-infrared (VNIR) data at the individual-kernel level, with both modalities corresponding to the same kernel. A total of 2048 paired samples were included and evenly distributed across eight quality categories, with 256 samples in each category [24]. According to the original dataset description, the eight predefined categories were Healthy–Large, Healthy–Medium, Discoloured–Low, Discoloured–High, Broken–Low, Broken–High, Insect-damaged, and Unhulled, covering variations in kernel size, discoloration severity, structural integrity, insect-related damage, and hull-retention status. Representative RGB images of the eight categories are shown in Figure 1, and the corresponding category definitions and sample distributions are summarized in Table 1.
Figure 1.
Representative RGB images of the eight Canadian wild rice kernel quality categories.
Table 1.
Quality categories and classification criteria of Canadian wild rice kernels.
2.2. RGB and VNIR Data Acquisition and Description
This design ensured that the visual and spectral information represented the same physical sample. According to the dataset creators, RGB images were acquired using a Canon EOS R100 digital camera (Canon Inc., Tokyo, Japan) system under controlled imaging conditions. During image acquisition, individual kernels were arranged separately to avoid overlapping and were captured against a uniform background. The acquired RGB images provided high-resolution visual representations of kernel appearance, including morphological characteristics, surface color variation, texture information, and visible structural abnormalities. These characteristics reflect external phenotypic differences among kernels with different quality conditions.
VNIR hyperspectral data were collected using a Specim FX push-broom hyperspectral imaging system (Specim, Spectral Imaging Ltd., Oulu, Finland). The system acquired continuous spectral reflectance information in the visible and near-infrared wavelength regions, providing multidimensional spectral responses for individual kernels. RGB images capture visible kernel features such as size, color, shape, and surface defects, whereas VNIR measurements provide complementary wavelength-dependent reflectance patterns for classifying the eight kernel quality categories. In the original dataset, raw hyperspectral measurements were converted into reflectance values using standard dark and white reference correction procedures to compensate for sensor response and illumination variations. The original data contained 224 spectral bands spanning 397.66–1003.81 nm. The dataset creators converted the raw measurements to reflectance using dark and white reference correction and trimmed the spectra to the sensor’s effective operating range of 400–1000 nm, removing three edge bands at 397.66, 1000.99, and 1003.81 nm. The processed per-kernel spectra contained 221 bands spanning 400.28–998.17 nm, all of which were used as VNIR inputs in this study. After acquisition, RGB images and VNIR spectral data were paired according to individual kernel identifiers, resulting in a one-to-one correspondence between visual and spectral modalities. The resulting paired RGB–VNIR dataset provides a comprehensive representation of Canadian wild rice kernels by integrating external appearance information and wavelength-dependent spectral responses, which supports subsequent multimodal quality classification analysis [24].
2.3. Average Reflectivity
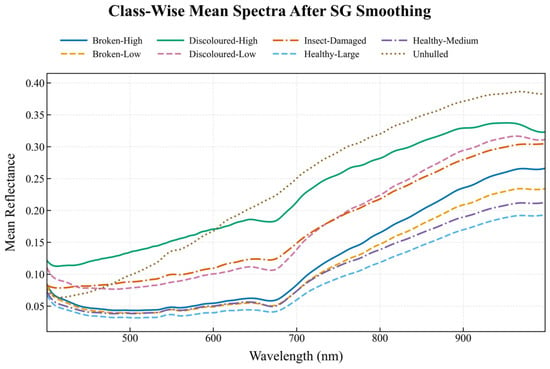
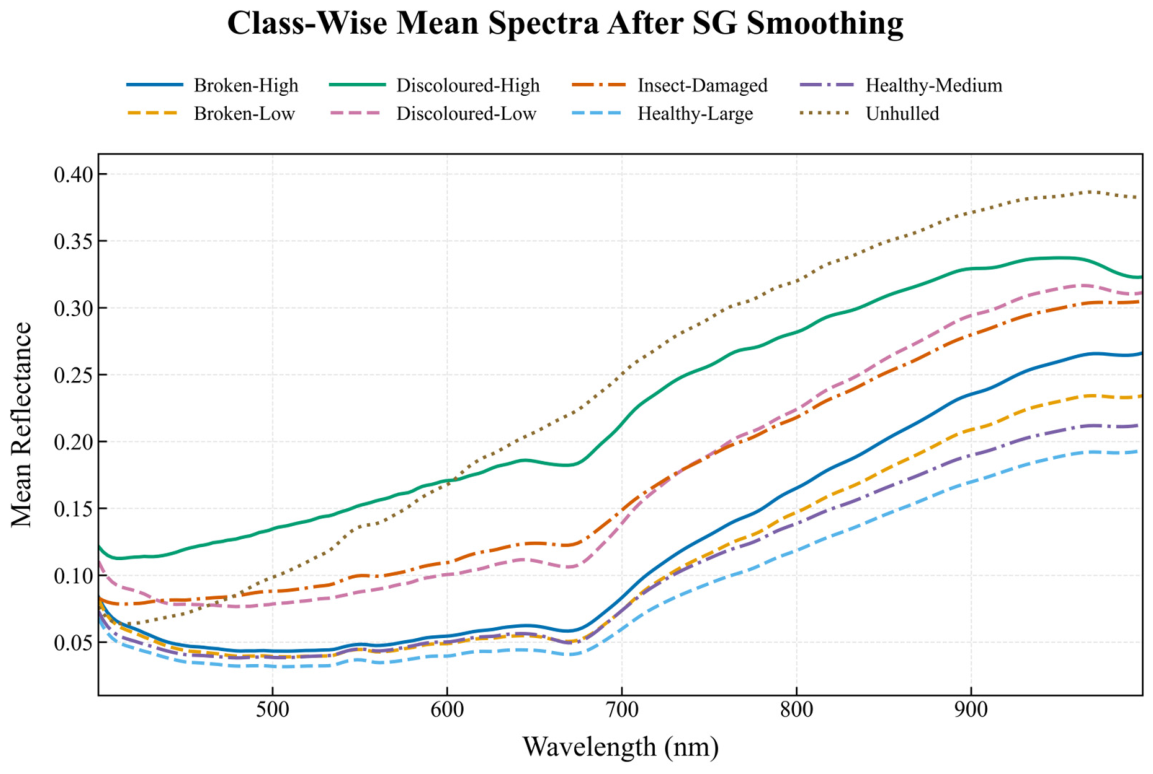
As shown in Figure 2, the mean spectra of the eight quality categories, smoothed using a Savitzky–Golay filter with an 11-band window and a third-order polynomial, exhibited distinct wavelength-dependent patterns. After smoothing, local fluctuations were reduced while the overall spectral characteristics were retained. In the shorter-wavelength region, most categories showed relatively small differences in reflectance, although Discoloured–High maintained a comparatively stronger response. A clear transition occurred around 680–700 nm, followed by a rapid increase in reflectance toward the near-infrared region. The spectral separation among categories became more evident at longer wavelengths. Unhulled and Discoloured–High generally occupied the upper reflectance range, whereas Healthy–Medium and Healthy–Large showed weaker responses. Broken–High and Broken–Low exhibited intermediate spectral characteristics, while Discoloured–Low and Insect-Damaged followed similar trends in the near-infrared region. Overall, the smoothed spectra indicate that the spectral differences among quality categories are more pronounced at longer wavelengths.
Figure 2.
Mean VNIR reflectance spectra of different Canadian wild rice quality categories.
2.4. Dataset Partitioning
The complete paired RGB–VNIR dataset consisted of 2048 samples from eight classes, with 256 samples per class. Following the predefined group-based partitioning strategy, 384 samples (48 samples per class) were assigned to the locked paired test set (TP), while the remaining 1664 samples (208 samples per class) were used as the paired development set. To prevent information leakage, samples originating from the same acquisition batch were assigned exclusively to either the training or test subset.
The paired development set was further evaluated using stratified group five-fold cross-validation with a fixed random seed of 42. Stratification preserved the class distribution across folds, whereas group constraints ensured that samples from the same acquisition batch were not distributed between training and validation folds. In each iteration, four folds were used for model training, and the remaining fold was used for validation. The five validation folds contained 336, 336, 336, 336, and 320 samples, while the corresponding training folds contained 1328, 1328, and 1344 samples, respectively (Table 2). The slight variation in fold sizes resulted from maintaining acquisition-group integrity. After completing all five iterations, every development sample obtained one out-of-fold (OOF) prediction. These OOF predictions were subsequently used for DSRE residual evaluation, recoverability estimation, and CRRA target construction.
Table 2.
Five-fold partitioning of the paired development set.
The RGB image pool contained 16,000 images, with 2000 per class, and was used for RGB model development and RGB-only deployment evaluation. It was initially divided into 12,800 training images, 1600 validation images, and 1600 candidate test images. The RGB training and validation sets were used for visual model fitting and selection; final CRRA student refitting also used the paired development images. To screen for duplicates, the contents of the original image files were compared within the RGB pool and against the paired RGB images. Identical files were kept within one RGB partition, and files matching paired images were removed from the RGB pool: 198 from training, 24 from validation, and 30 from the candidate test set. The resulting subsets contained 12,602 training images, 1576 validation images, and 1570 locked RGB-only test images (170 insect-damaged images and 200 images in each of the remaining seven categories). Table 3 summarizes the composition and purpose of each subset.
Table 3.
Dataset subsets and their primary purposes.
2.5. Comparative Experimental Design
2.5.1. Overall Framework
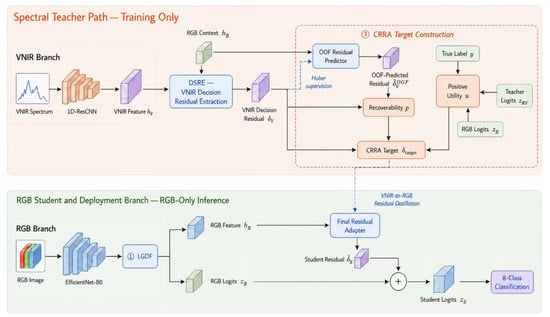
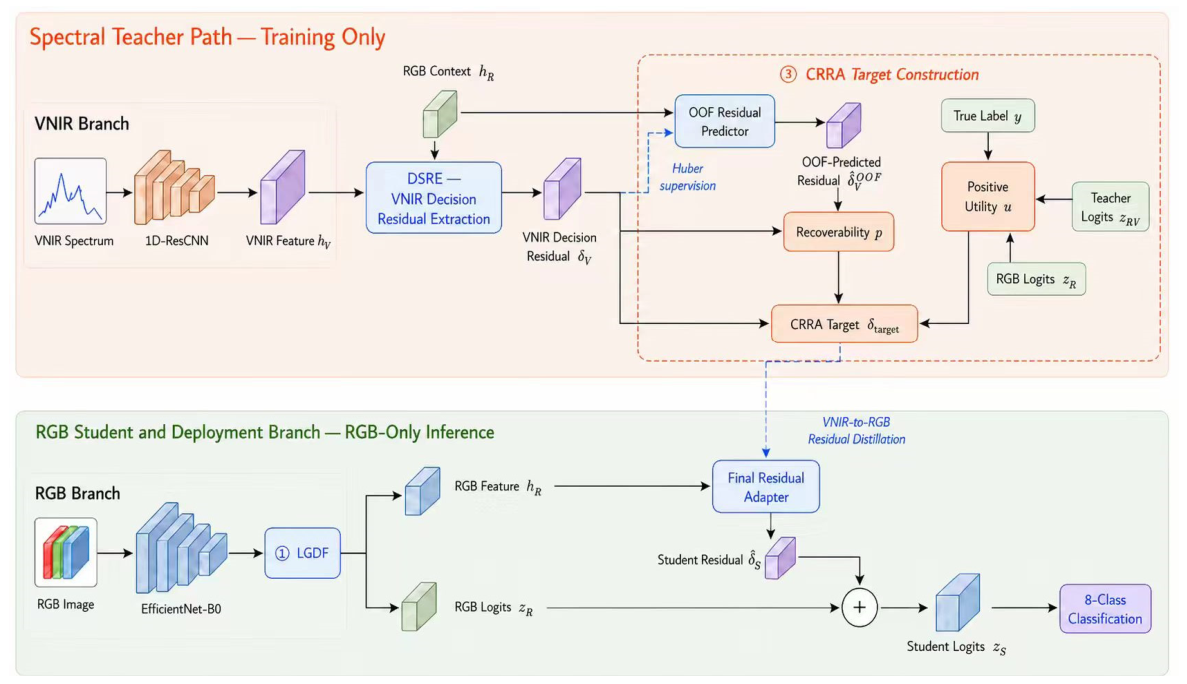
As shown in Figure 3, this study proposes an RGB–VNIR cross-modal decision residual distillation framework for Canadian wild rice quality classification. The overall model comprises an RGB visual branch, a VNIR spectral branch, a multimodal teacher pathway, and an RGB student pathway. The RGB image is first processed by EfficientNet-B0 to extract multi-level visual representations, which are further integrated by LGDF to obtain the RGB feature representation and baseline classification output. In parallel, the VNIR spectrum is encoded by a 1D-ResCNN to derive discriminative spectral features that provide complementary information to the visual representation for teacher learning.
Figure 3.
Architecture of the proposed RGB–VNIR multimodal fusion framework for quality recognition.
Within the teacher pathway, the RGB and VNIR features are jointly fed into DSRE. Rather than directly using the fused representation to generate an independent multimodal prediction, DSRE is designed to learn the complementary decision residual introduced by VNIR information relative to the existing RGB decision. This residual is then added to the RGB baseline output to form the multimodal teacher prediction. In this manner, the spectral information contained in the teacher is explicitly represented as an incremental correction to the RGB decision, providing targeted supervision for subsequent cross-modal knowledge transfer. Because the spectral residuals may differ in both their classification utility and their recoverability from RGB information, CRRA further regulates the teacher residuals according to these two factors to construct transferable residual targets. These targets supervise the RGB residual adapter, enabling the student to predict the corresponding decision corrections directly from visual features. The predicted residual is finally combined with the RGB baseline logits to obtain the RGB-only prediction for the eight Canadian wild rice quality categories.
The complete training procedure was implemented in a stage-wise manner. First, the RGB baseline and LGDF-RGB branch were trained to establish the visual representation and baseline classification output, while the 1D-ResCNN was trained to obtain the VNIR spectral representation. Second, the trained LGDF-RGB branch was kept fixed as the RGB reference pathway, and the DSRE-based multimodal teacher was trained using paired RGB–VNIR samples to learn the VNIR-induced decision residual. Third, five-fold cross-validation was used to generate one out-of-fold (OOF) prediction for each sample in the paired development set. The resulting OOF predictions were used to obtain sample-wise teacher residuals for subsequent transfer learning rather than to update model parameters during OOF collection. Fourth, an RGB-based residual predictor was trained to estimate the teacher residual from visual features, and the discrepancy between the predicted and teacher residuals was used to quantify residual recoverability. In parallel, the classification contribution of the teacher residual was used to estimate its utility. Fifth, CRRA combined the recoverability and utility information to determine the reliability of each teacher residual and to construct the corresponding transferable residual target. During this target-construction stage, the trained teacher outputs were treated as fixed supervision. Finally, the teacher-derived targets were fixed and the RGB residual adapter was optimized to predict the transferable decision residual from RGB features alone, thereby producing the final RGB-only student model.
2.5.2. RGB and VNIR Encoders
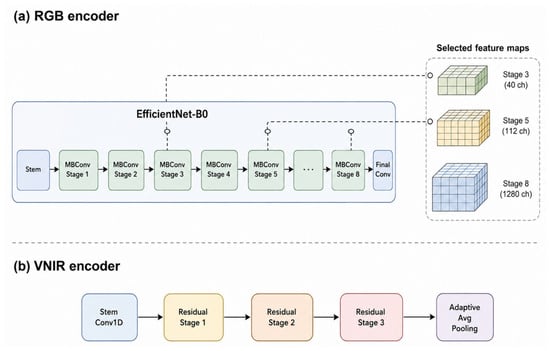
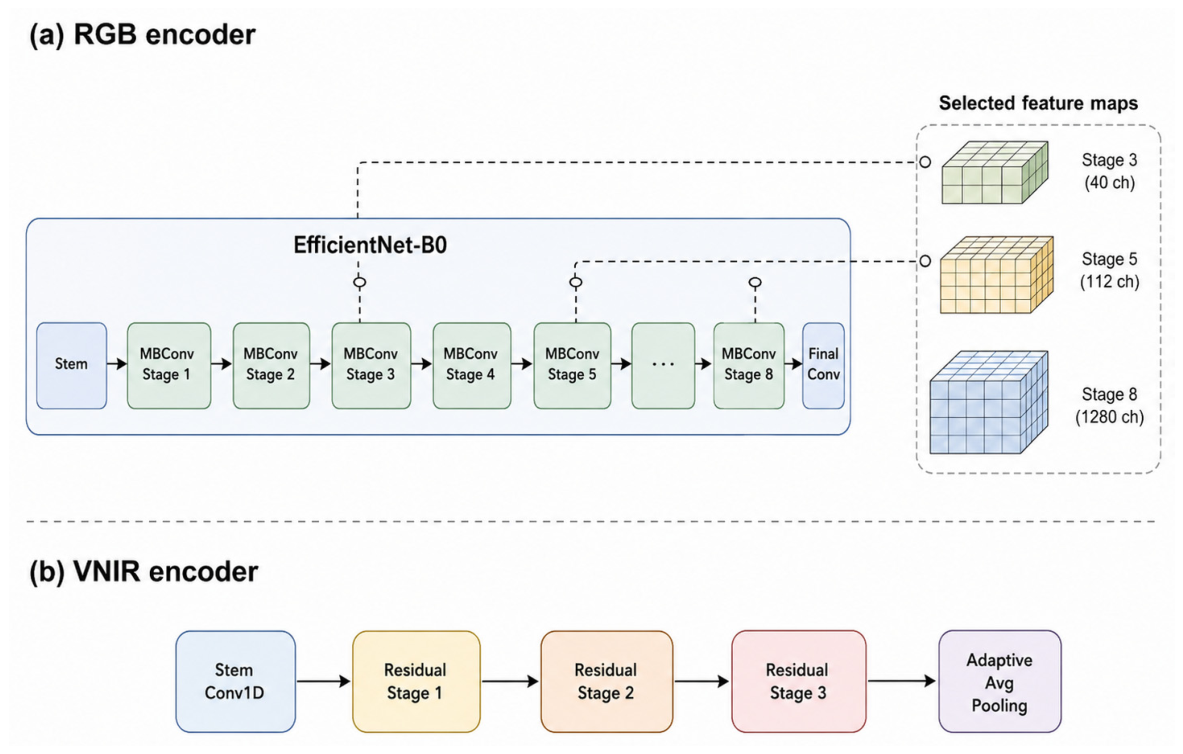
EfficientNet-B0 is adopted as the RGB encoder [25], as illustrated in Figure 4a. Its backbone is mainly composed of an initial convolutional stem, a sequence of mobile inverted bottleneck convolution (MBConv) blocks [26], and a final convolutional layer, forming a hierarchical feature extraction architecture. EfficientNet-B0 is selected because it provides a favorable balance between feature representation capability and computational efficiency. In particular, the MBConv-based architecture enables efficient feature extraction while progressively capturing visual information from fine-grained appearance patterns to higher-level semantic characteristics. This property is well suited to Canadian wild rice quality assessment, where discriminative information may arise from variations in color, texture, morphology, and surface defects. Moreover, its hierarchical representation provides complementary visual information at different network depths without introducing excessive computational complexity. In this study, representations from three different depths of EfficientNet-B0 are retained for visual feature extraction.
Figure 4.
Structures of the two modality-specific encoders: (a) RGB encoder based on EfficientNet-B0 and (b) VNIR encoder based on 1D-ResCNN.
For VNIR spectral representation [27], a lightweight 1D-ResCNN is employed [28,29], as shown in Figure 4b. The encoder consists of an initial one-dimensional convolutional layer followed by stacked residual convolutional blocks and global feature aggregation through adaptive average pooling. The use of one-dimensional convolution is particularly suitable for VNIR spectra because spectral measurements are sequential signals whose neighboring wavelengths exhibit strong correlations. It enables wavelength-dependent patterns to be extracted directly along the spectral dimension with relatively low computational cost. Meanwhile, residual connections facilitate information propagation and improve the stability of feature learning, allowing the network to capture increasingly discriminative spectral characteristics without requiring excessively deep architecture. Consequently, the 1D-ResCNN provides a compact and efficient representation of the VNIR reflectance information. The standard architectural configurations of EfficientNet-B0 and the residual convolutional blocks follow their original implementations; therefore, only the configurations and feature usages specific to the present framework are described here.
2.5.3. LGDF
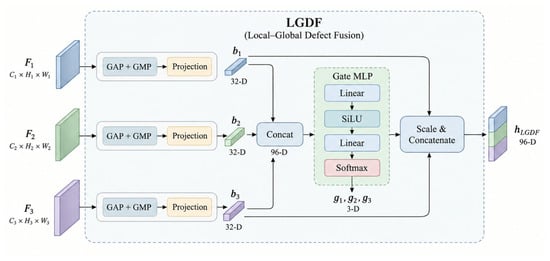
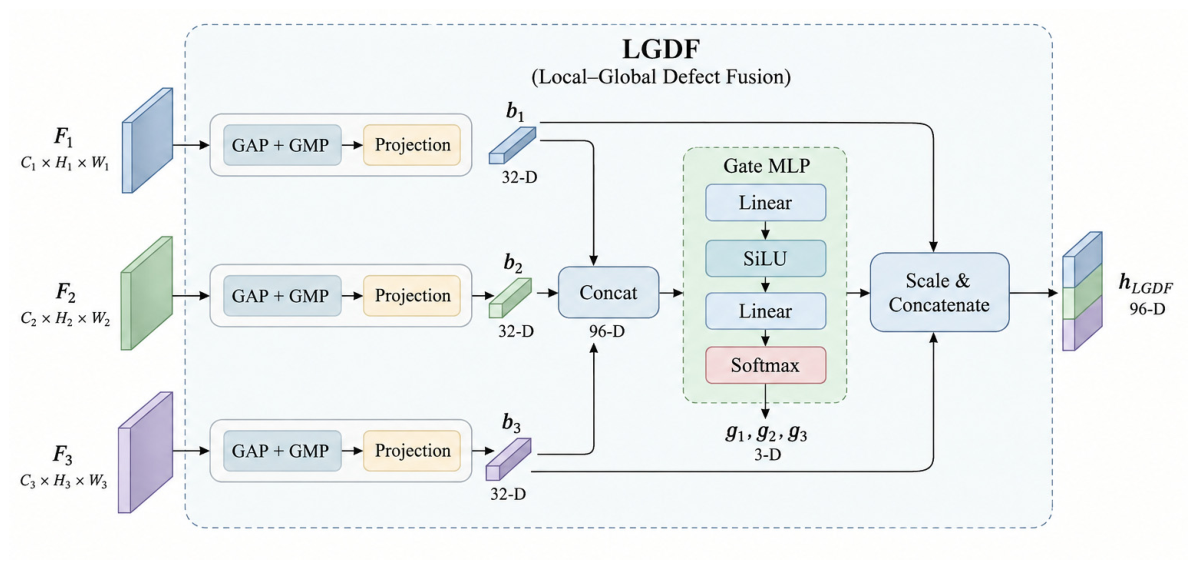
As shown in Figure 5, the LGDF module is designed to adaptively integrate RGB features from different hierarchical levels, thereby constructing a more robust and discriminative visual representation. The module takes three-scale feature maps, F1, F2, and F3, as inputs, which encode complementary information at different semantic levels. For each scale, global average pooling (GAP) and global max pooling (GMP) are performed in parallel, and the resulting pooled features are concatenated and projected into a 32-dimensional unified feature space. Details are provided in Equation (1).
where bi ∈ ℝ32 denotes the projected representation of the i-th feature level. The three branch features are then concatenated to form a 96-dimensional joint representation, and details are provided in Equation (2).
bi = Wi[GAP(Fi); GMP(Fi)] + ci, i ∈ {1,2,3},
b = [b1; b2; b3] ∈ ℝ96.
Figure 5.
Architecture of the LGDF visual branch and its key modules.
The joint representation is subsequently fed into a two-layer Gate MLP to generate the adaptive contribution of the three feature levels. Details are provided in Equation (3).
where g = [g1, g2, g3] represents the scale-adaptive weights and ϕ(⋅) denotes the activation function between the two linear layers. Each branch representation is then recalibrated using its corresponding gating weight, and the final LGDF representation is obtained as Equation (4).
g = Softmax(Wg2 ϕ(Wg1b + cg1) + cg2),
hLGDF = [g1b1; g2b2; g3b3] ∈ ℝ96.
By jointly exploiting GAP and GMP, the proposed module preserves complementary global phenotypic cues and salient local defect responses. Meanwhile, the sample-adaptive scale gating mechanism dynamically adjusts the contribution of multi-level features according to the visual characteristics of individual samples, thereby enhancing the representation of subtle quality differences in RGB images [30,31].
2.5.4. Decision Spectral Residual Extractor
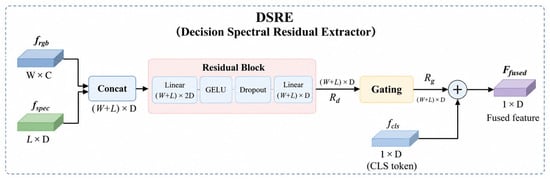
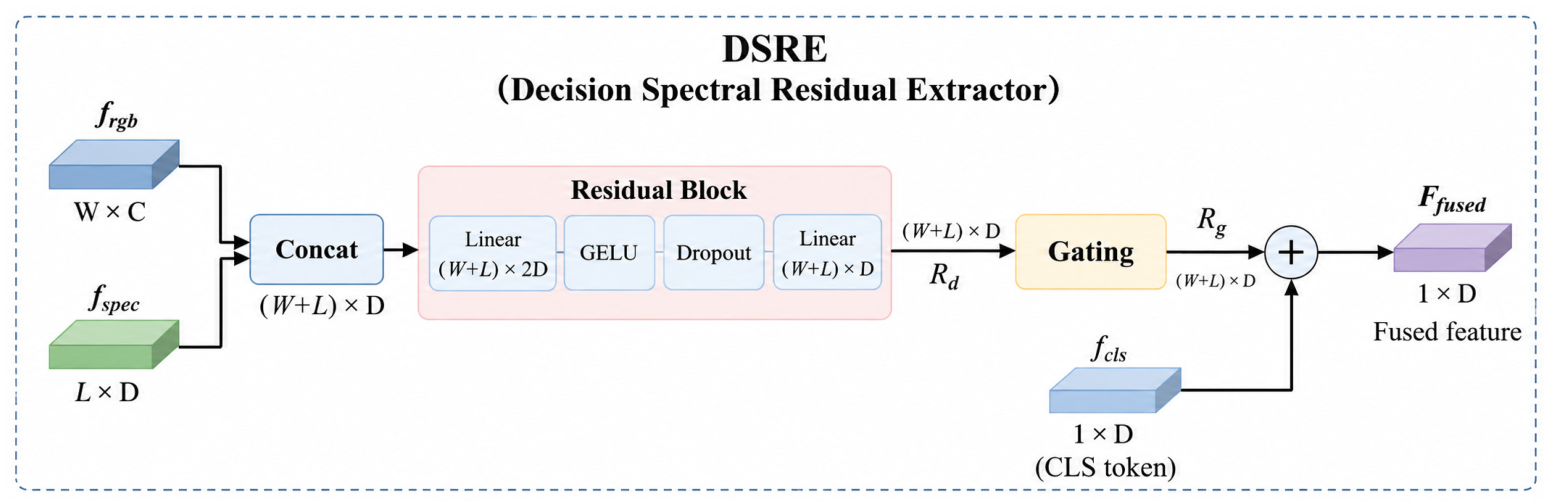
As shown in Figure 6, the Decision Spectral Residual Extractor (DSRE) is designed to explicitly model the complementary decision information introduced by VNIR spectra relative to the RGB baseline. Given the RGB representation hr and the spectral representation hv, the two features are concatenated to form a joint cross-modal representation, which is subsequently processed by a lightweight residual head to generate an eight-dimensional raw decision residual. Rather than directly producing an independent multimodal prediction, DSRE treats the RGB output zr as the reference decision and learns only the additional correction contributed by the spectral modality [32].
Figure 6.
Structure of the proposed Decision Spectral Residual Extractor (DSRE).
The raw residual is further centered along the class dimension to remove the common logit translation that does not affect the Softmax distribution, yielding the decision-relevant residual δ. The resulting residual is then added to the RGB baseline logits to obtain the teacher prediction. Details are provided in Equation (5).
zteacher = zr + δ
This residual formulation separates the RGB baseline decision from the complementary spectral contribution, thereby providing an explicit and compact representation of the VNIR-induced decision correction for subsequent cross-modal knowledge transfer. The proposed framework is optimized in a stage-wise manner rather than through a single combined loss. DSRE is trained with classification supervision, the RGB residual predictor is optimized using a Huber regression loss, and the final CRRA student uses classification supervision together with residual-target supervision. Conventional temperature-scaled logit distillation is used only in the corresponding KD ablation and is not included in the complete CRRA objective.
2.5.5. Cross-Modal Residual Reliability Adaptation
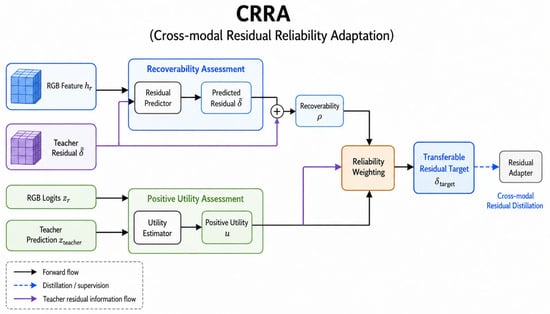
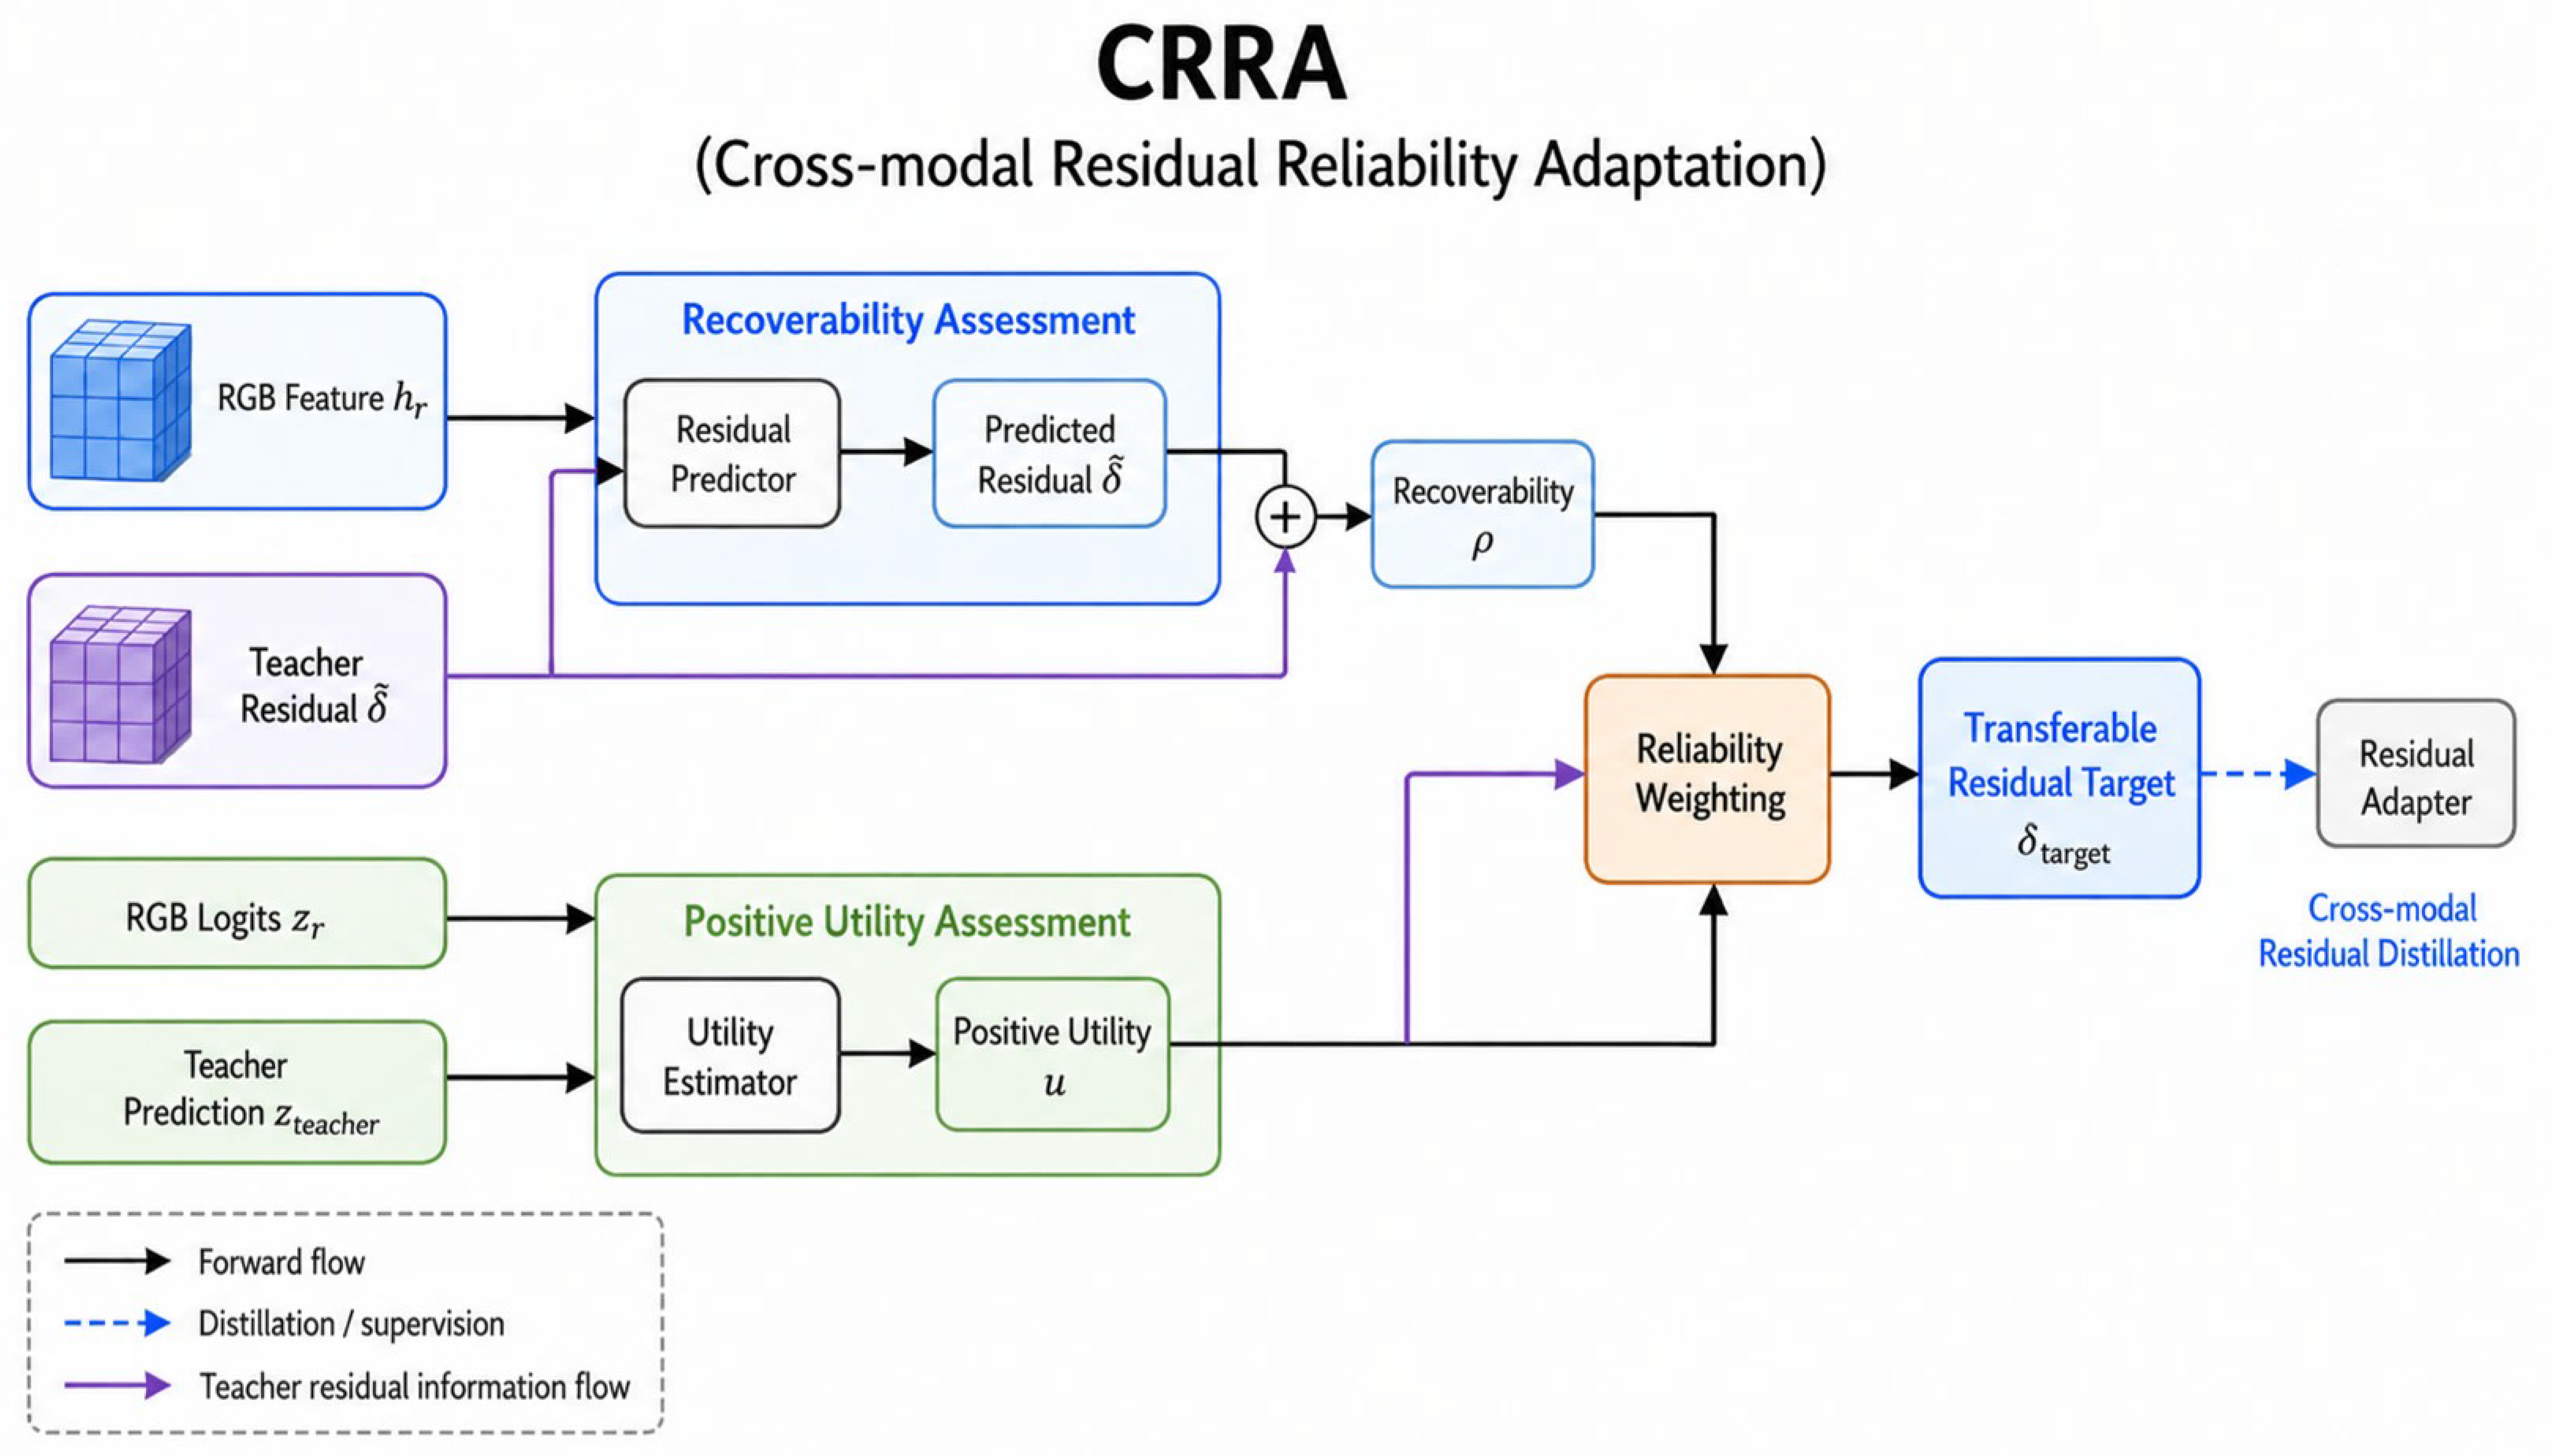
As shown in Figure 7, the Cross-modal Residual Reliability Adaptation (CRRA) mechanism is introduced to regulate the spectral decision residual generated by DSRE before transferring it to the RGB student. Since part of the VNIR-derived knowledge may either provide limited classification benefit or be difficult to infer from visual information, CRRA evaluates each teacher residual from two complementary perspectives: recoverability and positive utility. Specifically, an RGB-based residual predictor estimates from the visual representation hr,i, and its discrepancy from the teacher residual δi is used to quantify recoverability as Equation (6):
where ϵ = 0.001 is used for numerical stability. Meanwhile, the positive utility evaluates whether introducing the spectral residual improves the RGB baseline decision and is defined as Equation (7):
The recoverability and utility scores are then jointly incorporated into a residual reliability weight (Equation (8)):
where τu = 0.5 This value was predefined in the model configuration before the final evaluation and was kept fixed throughout the corresponding experiments rather than being adjusted according to the test results. The reliability weight adaptively modulates the original DSRE residual to construct the transferable target (Equation (9)):
Figure 7.
CRRA’s mechanism framework.
The resulting residual target is subsequently used to supervise the RGB residual adapter, enabling the student to focus on spectral decision corrections that are both beneficial to classification and recoverable from RGB information while reducing ineffective cross-modal supervision [33,34].
2.6. Evaluation Metrics
This study employs Accuracy, Balanced Accuracy, Macro-F1, Expected Calibration Error (ECE), the Confusion Matrix, Parameters, FLOPs, and 95% confidence intervals to evaluate model classification performance, calibration, and computational complexity. Details are provided in Equations (10) and (11).
Accuracy:
where yi represents the true label of the i-th sample, denotes the predicted label of the i-th sample, and I(⋅)represents the indicator function, which returns 1 when and 0 otherwise.
F1 Score:
Pairwise differences in Accuracy and Macro-F1 between CRRA and the capacity-matched student were estimated on the same test samples using 10,000 paired bootstrap resamples; 95% confidence intervals were obtained from the 2.5th and 97.5th percentiles.
Expected calibration error (ECE) measures the agreement between prediction confidence and empirical accuracy. Using the maximum Softmax probability as confidence, ECE was calculated over 15 equal-width bins in [0, 1] as the sample-weighted mean absolute difference between bin accuracy and mean confidence. Lower values indicate better calibration.
2.7. Experimental Setup and Pre-Training Protocol
For the 2048 paired samples, all model fitting and selection used development partitions; both locked test sets were held for final evaluation. Shared settings are listed below. Experiments used Python 3.8.20, PyTorch 2.2.2, CUDA 12.1, and an NVIDIA GeForce RTX 2080 Ti.
RGB training used random 224 × 224 crops (scale 0.85–1.00; ratio 3:4–4:3), horizontal/vertical flips (p = 0.5 each), a ±15° rotation, and color jitter (bright-ness/contrast/saturation/hue: 0.15/0.15/0.10/0.03). Validation/test images used 255-pixel short-edge resizing and 224 × 224 center crops; all RGB images used ImageNet normalization. The 221 VNIR bands were smoothed using a Savitzky–Golay filter.
Training had four stages: (1) Train EfficientNet-B0, LGDF, and classifier from scratch by cross-entropy; select the highest-validation-Macro-F1 RGB checkpoint. (2) Freeze RGB; train the VNIR encoder and DSRE head with CE(z_R + δ, y) + 0.20 CE(z_V, y). Five paired-development folds supply held-out logits, features, and centered residuals; select each fold’s lowest-validation-loss checkpoint. (3) Fit a residual predictor by Smooth L1 loss, selecting epochs by inner validation before outer-fold refitting. Held-out predictions yield ρ, u, w, and target wδ (Equations (6)–(9)). (4) Freeze RGB; update only the student residual adapter with cross-entropy on development RGB images plus paired-sample Smooth L1 loss to wδ. Final teacher and student refits used development data and validation-fixed epochs. KD comparators replaced residual loss with paired KL divergence or feature mean-squared error alongside cross-entropy; deployment uses RGB only. The key hyperparameter settings for model training and experimental comparisons are summarized in Table 4.
Table 4.
Hyperparameter Settings for Model Training and Experimental Comparisons.
3. Experiments and Analysis of Results
3.1. Single-Modal Baseline Performance
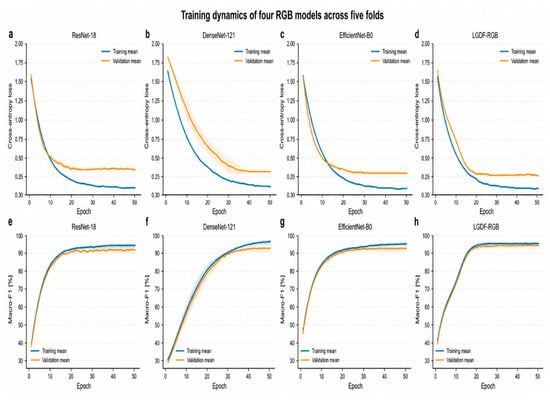
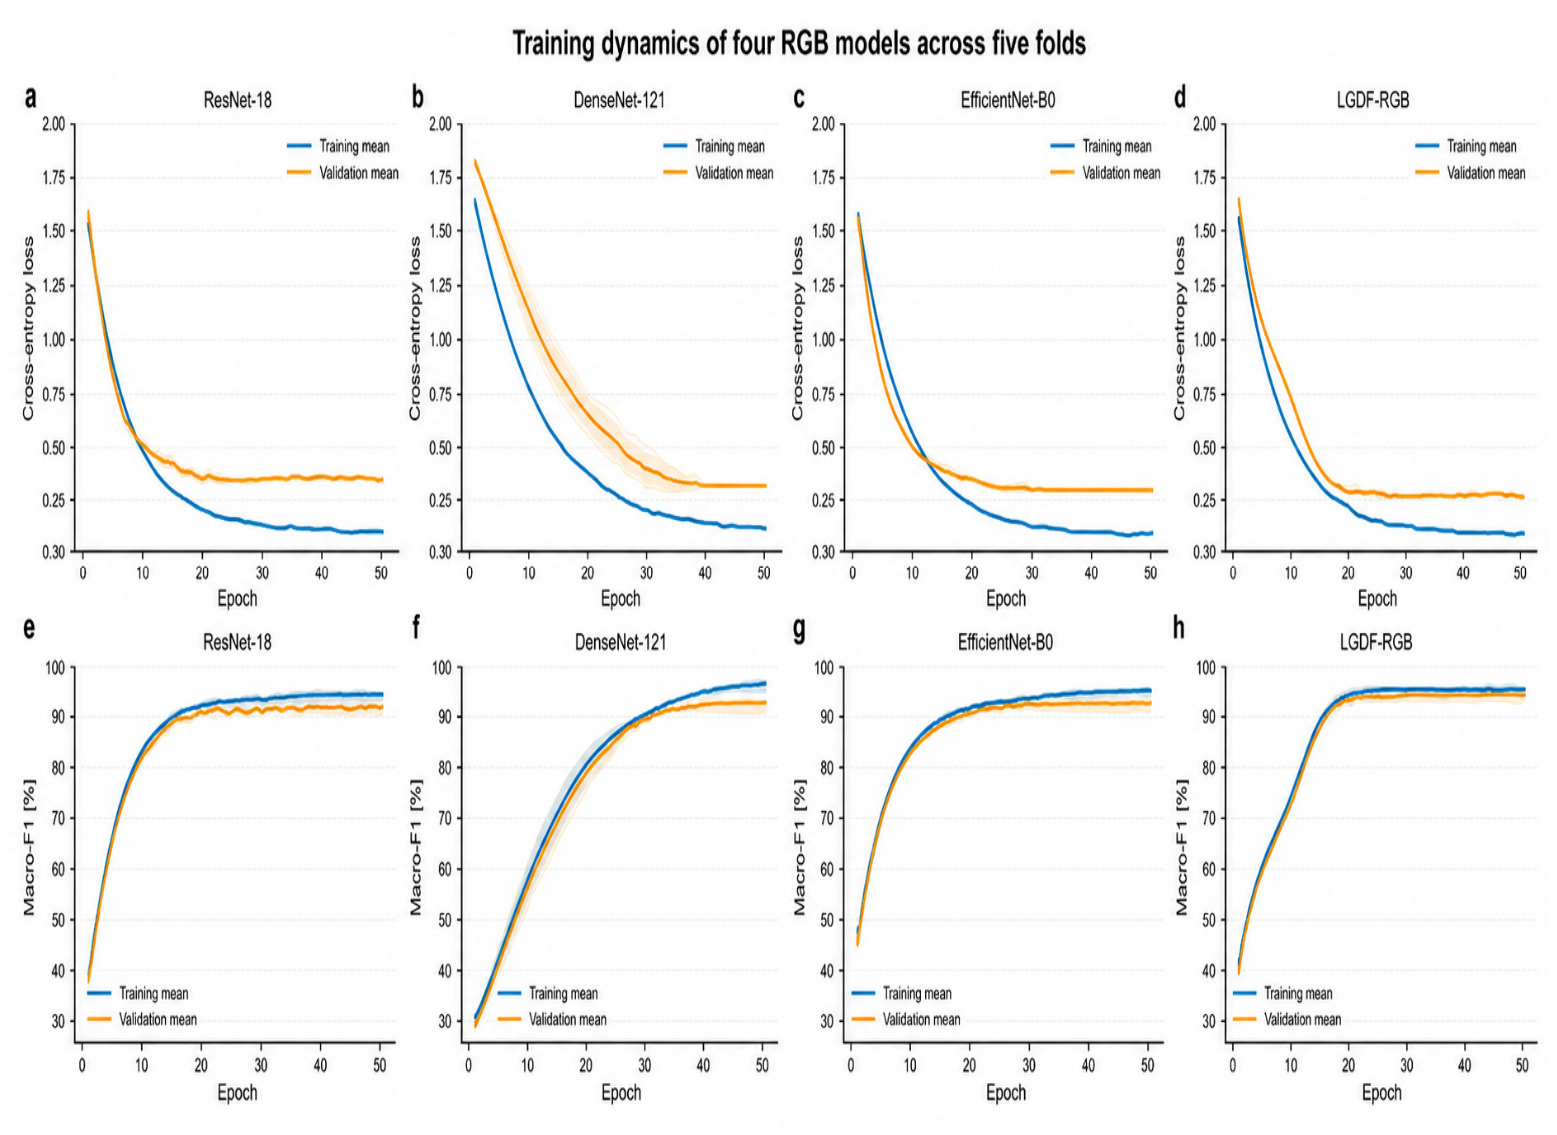
Figure 8 illustrates the training dynamics of four RGB models during five-fold cross-validation. All models showed decreasing cross-entropy loss and increasing Macro-F1 on the training and validation sets. EfficientNet-B0 recorded higher mean validation scores than ResNet-18 and DenseNet-121. Incorporating LGDF further increased the mean validation scores while maintaining stable convergence, suggesting a benefit from integrating visual features across network depths.
Figure 8.
Training dynamics of four RGB models during five-fold cross-validation. (a–d) Cross-entropy loss; (e–h) Macro-F1.
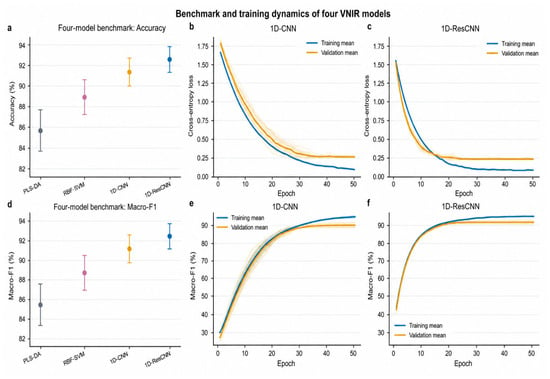
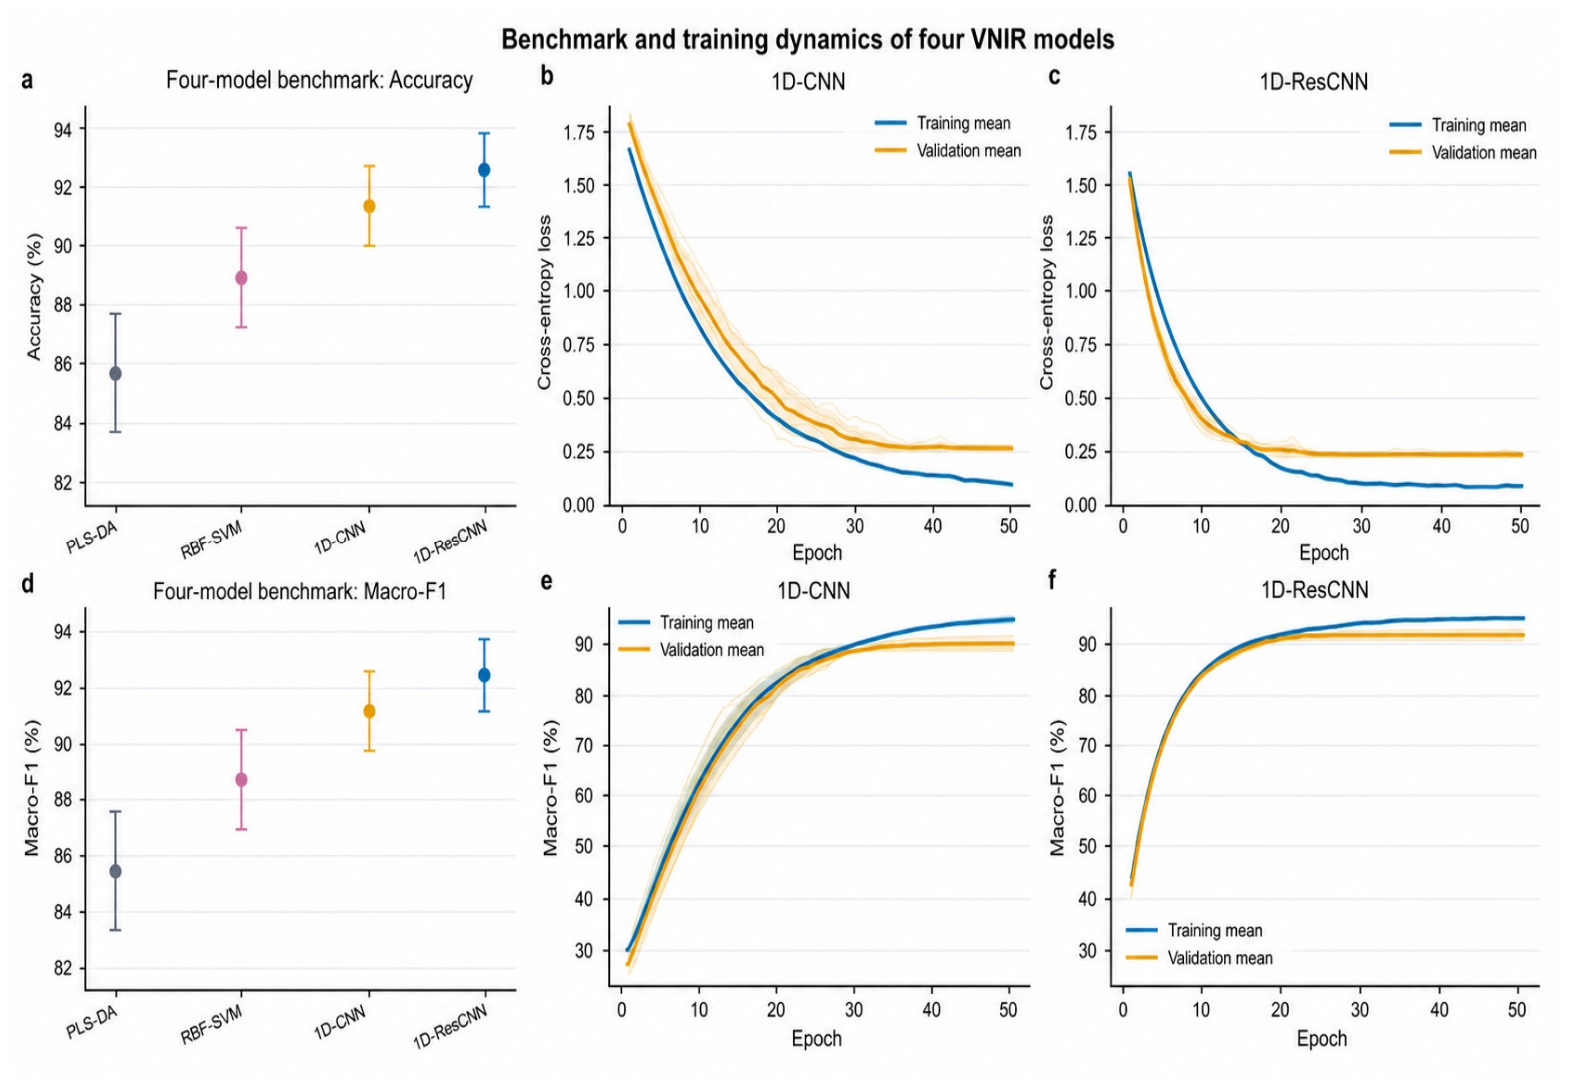
Figure 9 presents the benchmark performance and training dynamics of the VNIR models during five-fold cross-validation. Among the four evaluated models, 1D-ResCNN recorded the highest mean Accuracy and Macro-F1, followed by 1D-CNN, RBF-SVM, and PLS-DA. These results suggest that the learned spectral representations supported better classification performance than PLS-DA and RBF-SVM in this dataset. The training trajectories of 1D-CNN and 1D-ResCNN showed decreasing loss and increasing Macro-F1. Compared with 1D-CNN, 1D-ResCNN reached its validation plateau earlier and recorded higher mean validation scores, supporting its selection as the VNIR encoder for subsequent DSRE-based multimodal learning.
Figure 9.
Benchmark performance and training dynamics of VNIR models. (a,d) Benchmark results; (b,c,e,f) Training dynamics.
Table 5 summarizes the five-fold cross-validation results of the RGB and VNIR models. Among the RGB backbones, EfficientNet-B0 recorded the highest mean Accuracy and Macro-F1. LGDF-RGB recorded corresponding values of 91.74 ± 1.30% and 91.60 ± 1.35%, representing increases of 0.78 percentage points in both mean metrics. Among the VNIR models, 1D-ResCNN recorded the highest mean Accuracy and Macro-F1 and was selected as the spectral encoder for subsequent DSRE learning. Fold-wise Accuracy and Macro-F1 scores are provided in Supplementary Tables S1 and S2, respectively.
Table 5.
Five-fold cross-validation performance of RGB and VNIR unimodal models.
3.2. LGDF Module Evaluation and Component Ablation
The LGDF module was evaluated through component-wise ablation experiments using EfficientNet-B0 as the RGB backbone (Table 6). EfficientNet-B0 recorded mean Accuracy and Macro-F1 values of 90.96 ± 1.45% and 90.82 ± 1.51%, respectively. Full LGDF-RGB recorded corresponding values of 91.74 ± 1.30% and 91.60 ± 1.35%, representing increases of 0.78 percentage points in both mean metrics. The GAP-only and fixed-gating variants recorded lower mean scores than the full model, with Accuracy values of 90.42% and 90.68%, respectively. This pattern suggests that combining complementary pooling operations with sample-adaptive scale weighting contributes to the observed improvement in RGB classification. LGDF increased the parameter count from 4.01 M to 4.10 M and FLOPs from 0.39 G to 0.42 G, indicating a small additional computational cost relative to the backbone.
Table 6.
Ablation results of the LGDF module under five-fold cross-validation.
3.3. VNIR Decision Residual Analysis with DSRE
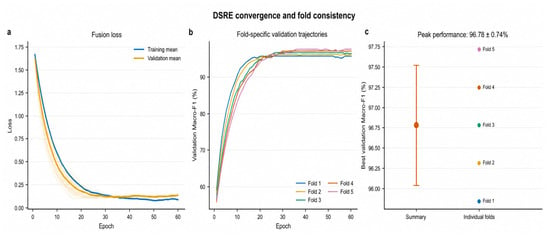
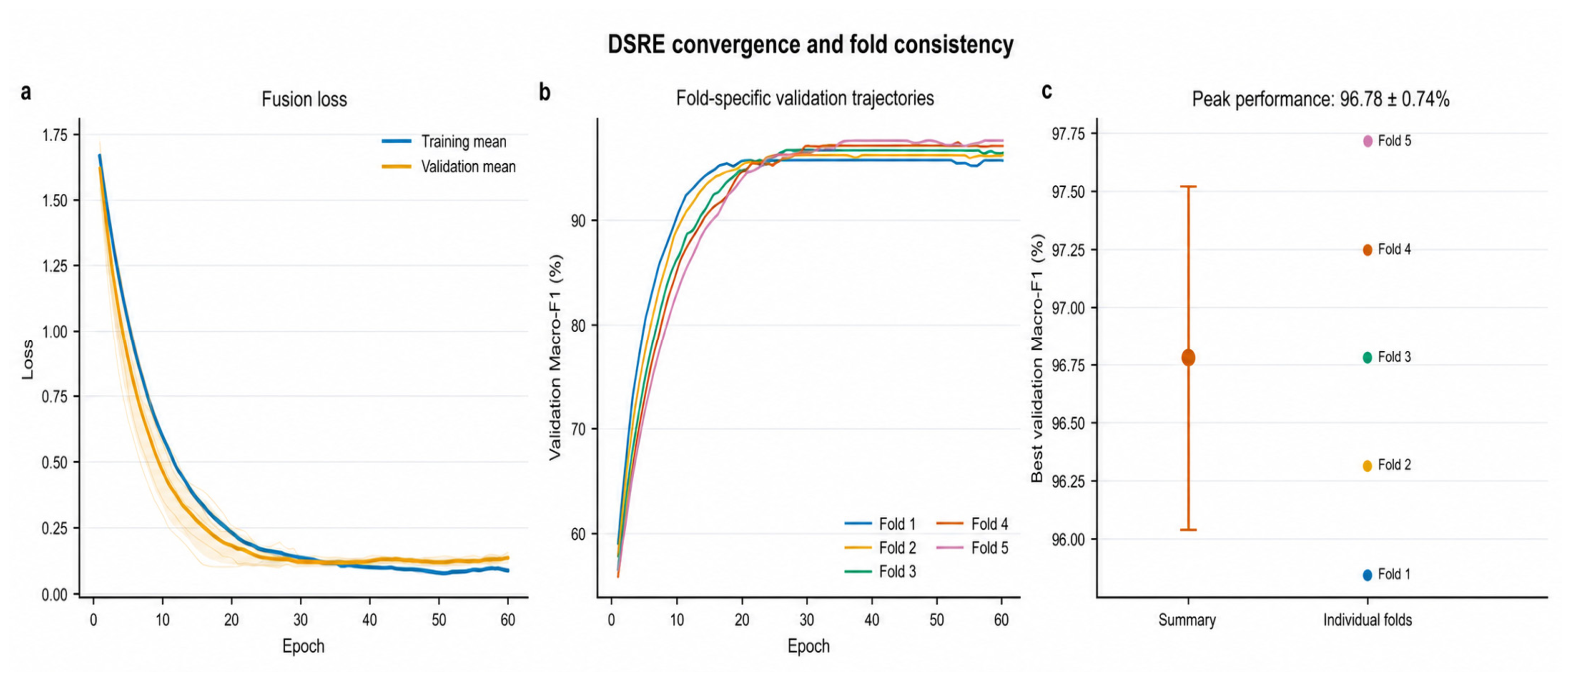
Figure 10 shows the convergence behavior and cross-fold consistency of the DSRE model during five-fold cross-validation. The fusion loss decreased rapidly during the early training stage and gradually converged, indicating stable optimization. The validation Macro-F1 trajectories across the five folds exhibited similar improvement trends and reached comparable performance levels. The peak validation Macro-F1 values showed limited variation among folds, with an overall value of 96.78 ± 0.74%, demonstrating consistent DSRE performance across different data splits.
Figure 10.
DSRE convergence and cross-fold consistency. (a) Training and validation fusion loss curves; (b) fold-specific validation Macro-F1 trajectories during five-fold cross-validation; (c) peak validation Macro-F1 scores for individual folds and their overall mean ± standard deviation.
Table 7 compares the frozen LGDF-RGB reference model, the capacity-matched classifier without VNIR input, and the DSRE multimodal teacher. LGDF-RGB and the capacity-matched classifier recorded mean Accuracy values of 91.74% and 92.12%, respectively, whereas DSRE recorded 96.85% Accuracy and 96.78% Macro-F1. The fold-wise comparison in Supplementary Table S3 showed higher DSRE scores than the capacity-matched classifier across all five folds, with mean differences of 4.73 ± 0.53 percentage points in Accuracy and 4.80 ± 0.54 percentage points in Macro-F1. These results suggest that VNIR provided complementary classification information within the DSRE framework.
Table 7.
Performance evaluation of DSRE-based VNIR decision residual learning.
3.4. Performance Evaluation of the CRRA RGB-Only Student Model
Table 8 summarizes the performance of different models on the paired locked test set (n = 384). EfficientNet-B0, LGDF-RGB, and the capacity-matched student achieved Accuracy values of 90.89%, 91.67%, and 92.19%, respectively. The CRRA RGB-only students further improved the Accuracy to 94.53% and Macro-F1 to 94.48%, outperforming the capacity-matched student and LGDF-RGB. The DSRE multimodal teacher achieved the highest performance by using both RGB and VNIR inputs, while CRRA recovered part of the multimodal advantage using only RGB input. In the paired RGB–VNIR test set, CRRA exceeded the capacity-matched student by 2.34 percentage points in Accuracy (paired bootstrap 95% CI: 1.04–3.65) and 2.44 percentage points in Macro-F1 (95% CI: 1.11–3.75).
Table 8.
Model performance on the paired locked test set (n = 384).
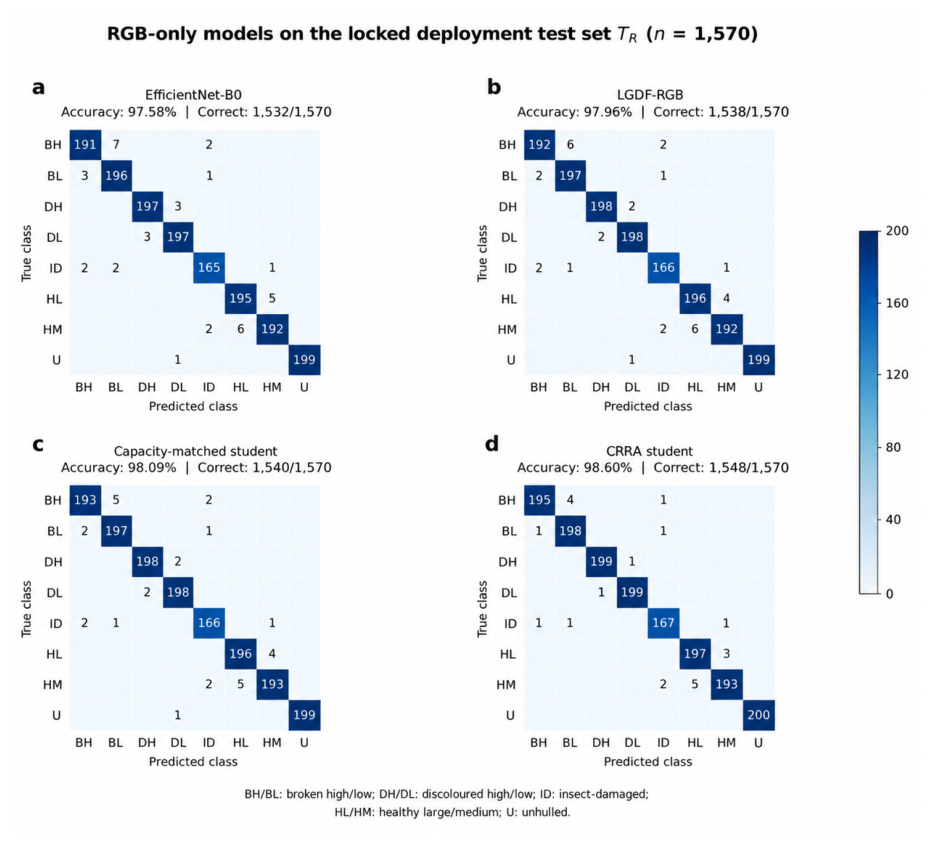
Table 9 summarizes the performance of RGB-only models on the locked test set (n = 1570). EfficientNet-B0, LGDF-RGB, and the capacity-matched student achieved Accuracy values of 97.58%, 97.96%, and 98.09%, respectively. The CRRA RGB-only student obtained the best performance, achieving 98.60% Accuracy and 98.62% Macro-F1, demonstrating the effectiveness of the proposed residual transfer strategy under RGB-only inference. On the separate held-out RGB-only test set, CRRA exceeded the capacity-matched student by 0.51 percentage points in Accuracy (paired bootstrap 95% CI: 0.19–0.89) and 0.50 percentage points in Macro-F1 (95% CI: 0.19–0.88).
Table 9.
Model performance on the RGB-only deployment locked test set (n = 1570).
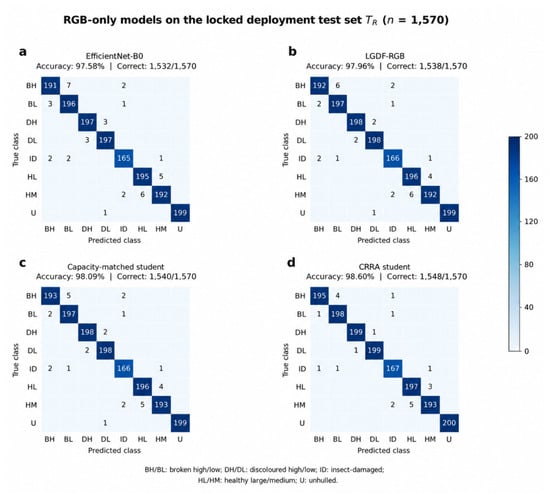
Figure 11 shows the confusion matrices of RGB-only models on the locked deployment test set (TR), n = 1570). After excluding 30 insect-damaged images that were identical to paired RGB images, the locked test set contained 170 insect-damaged samples and 200 samples in each of the remaining seven categories. All models exhibited strong diagonal dominance. Compared with the capacity-matched student, CRRA reduced the total number of misclassifications from 30 to 22. The bidirectional error counts between Healthy–Large and Healthy–Medium, Broken–High and Broken–Low, and Discoloured–High and Discoloured–Low decreased from 9 to 8, 7 to 5, and 4 to 2, respectively. Healthy–Large and Healthy–Medium remained the most frequently confused pair in CRRA, accounting for 8 of its 22 misclassifications.
Figure 11.
Confusion matrices of RGB-only models on the locked deployment test set. (a) EfficientNet-B0; (b) LGDF-RGB; (c) capacity-matched student; (d) CRRA student.
3.5. Ablation of Cross-Modal Distillation Strategies
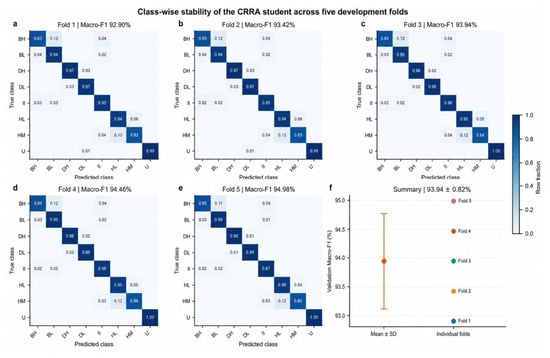
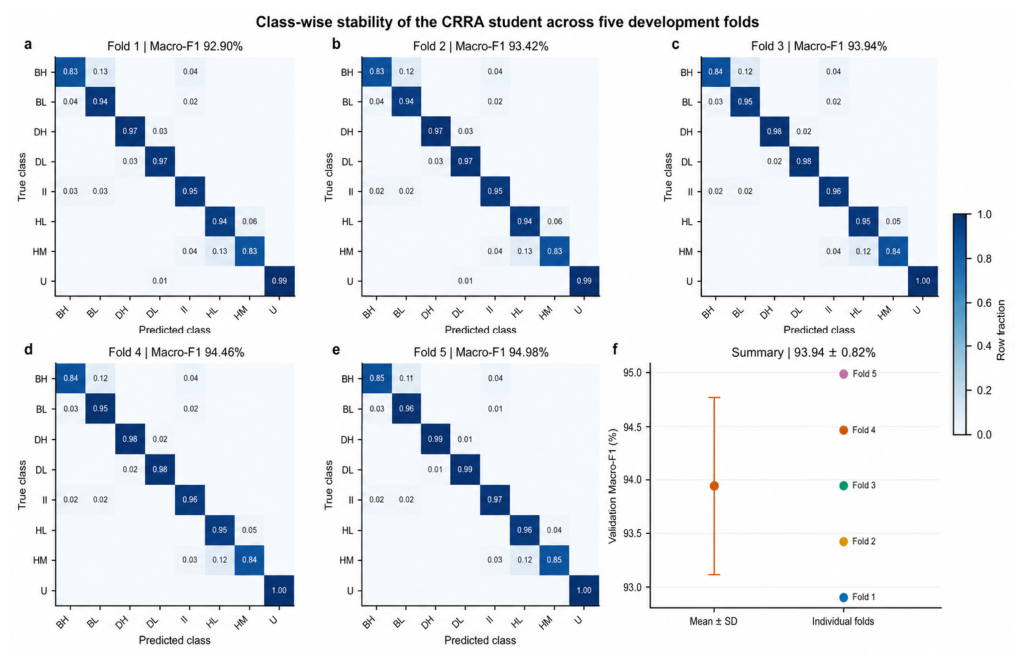
Figure 12 presents the class-wise stability analysis of the CRRA student across five-fold cross-validation. The confusion matrices of the five development folds show highly consistent classification patterns, with most classes achieving high diagonal values and limited misclassification among categories. The main confusion was observed between visually similar categories, particularly HL and HM, while other classes maintained strong discrimination performance. Across the five folds, the validation Macro-F1 values remained within a narrow range (92.90–94.98%), with an overall average of 93.94 ± 0.82%, indicating stable classification performance across different data splits.
Figure 12.
Class-wise stability of the CRRA student across five-fold cross-validation. (a–e) Confusion matrices; (f) macro-F1 distribution across folds.
Table 10 summarizes the ablation results of different cross-modal distillation strategies. The student model without distillation achieved an Accuracy of 92.10% and a Macro-F1 of 91.96%. Conventional logit- and feature-based distillation slightly improved the performance, whereas residual-based distillation achieved further gains, demonstrating the advantage of transferring VNIR-induced decision residuals rather than directly mimicking teacher outputs. By incorporating utility-based and recoverability-based residual selection, the performance was progressively improved, with the complete CRRA strategy achieving the best results (94.08% Accuracy and 93.94% Macro-F1). Meanwhile, CRRA also obtained the lowest loss and ECE, confirming the effectiveness of reliable residual selection for cross-modal knowledge transfer.
Table 10.
Ablation results of cross-modal distillation strategies under five-fold cross-validation.
3.6. Interpretability Analysis of RGB Spatial Responses and VNIR Spectral Contributions
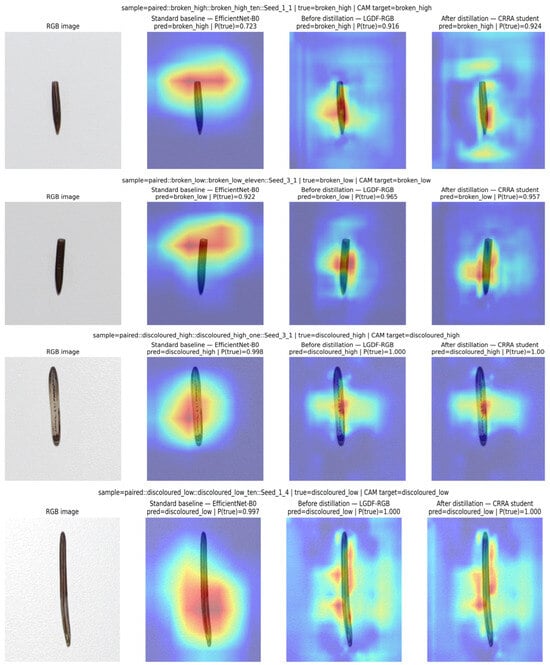
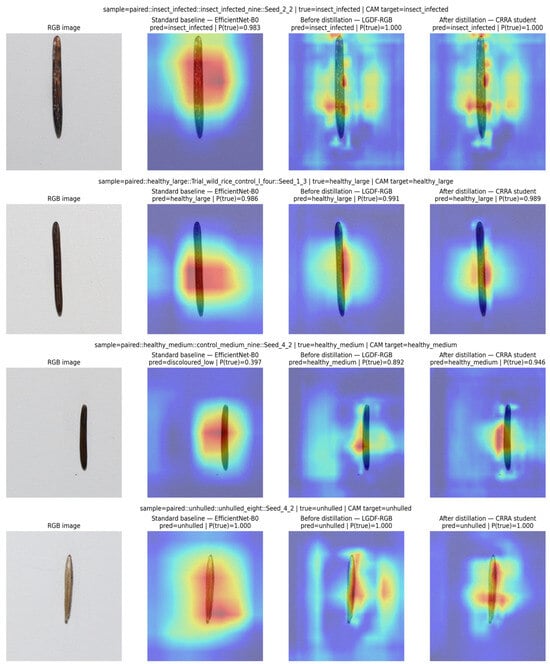
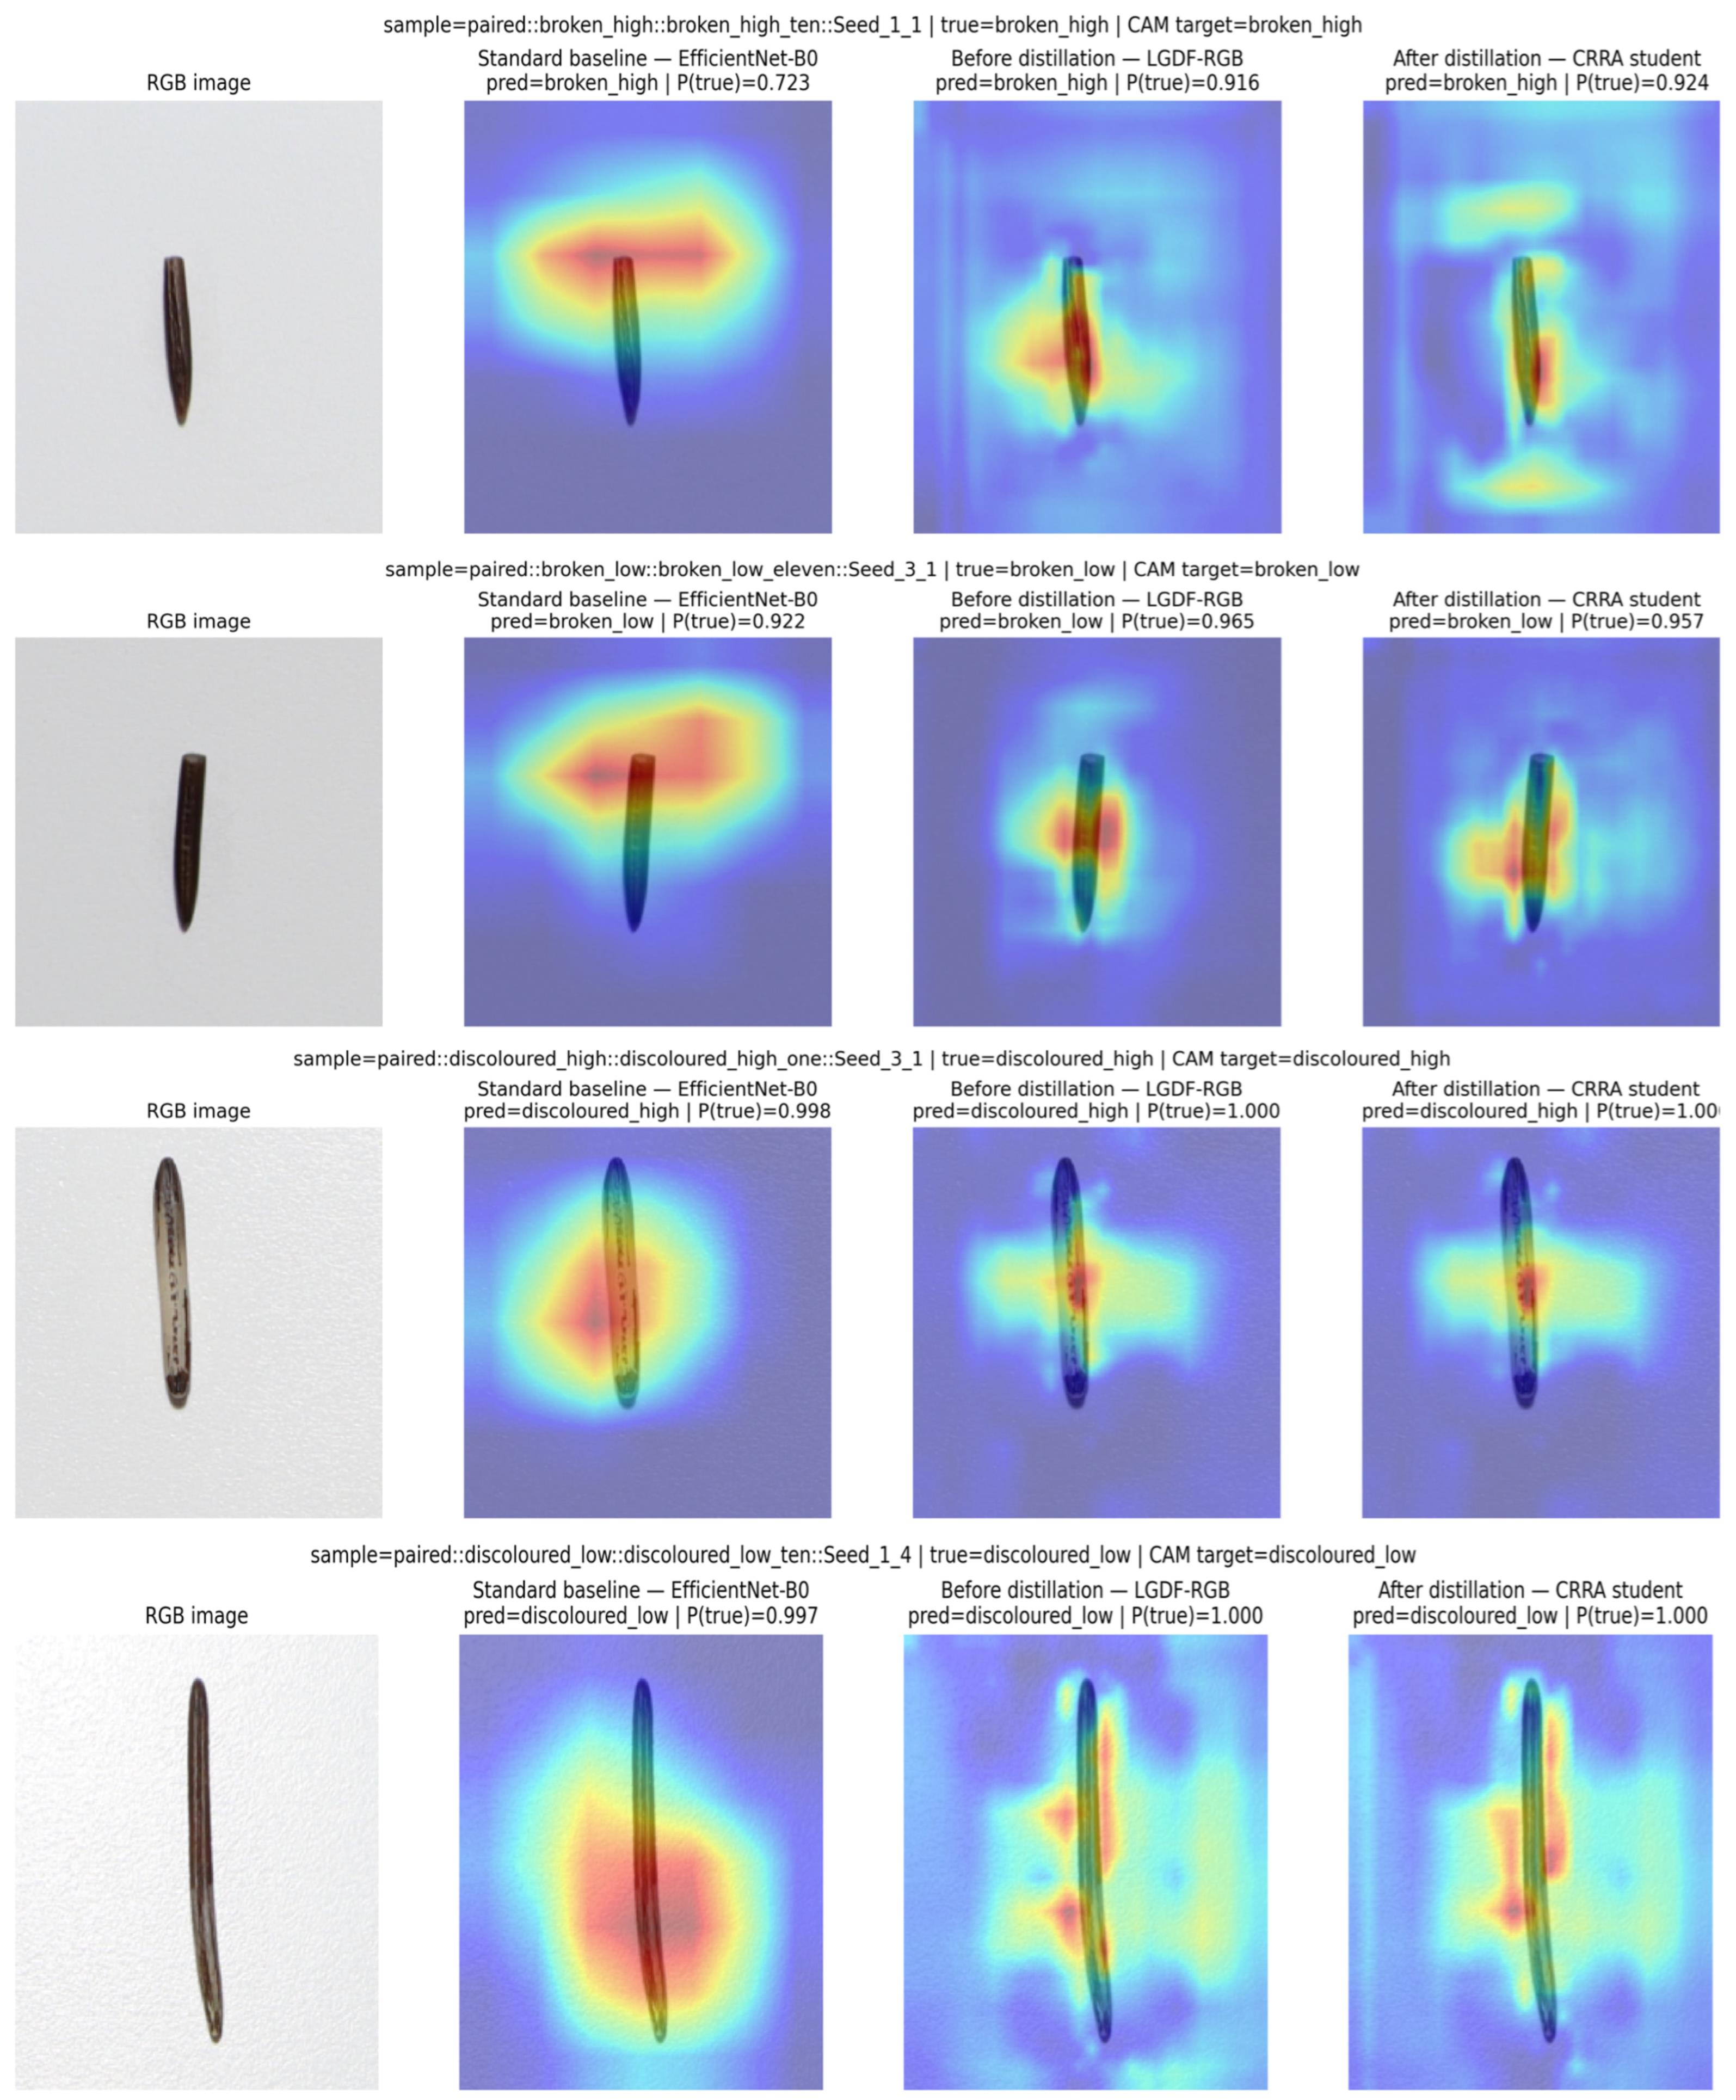
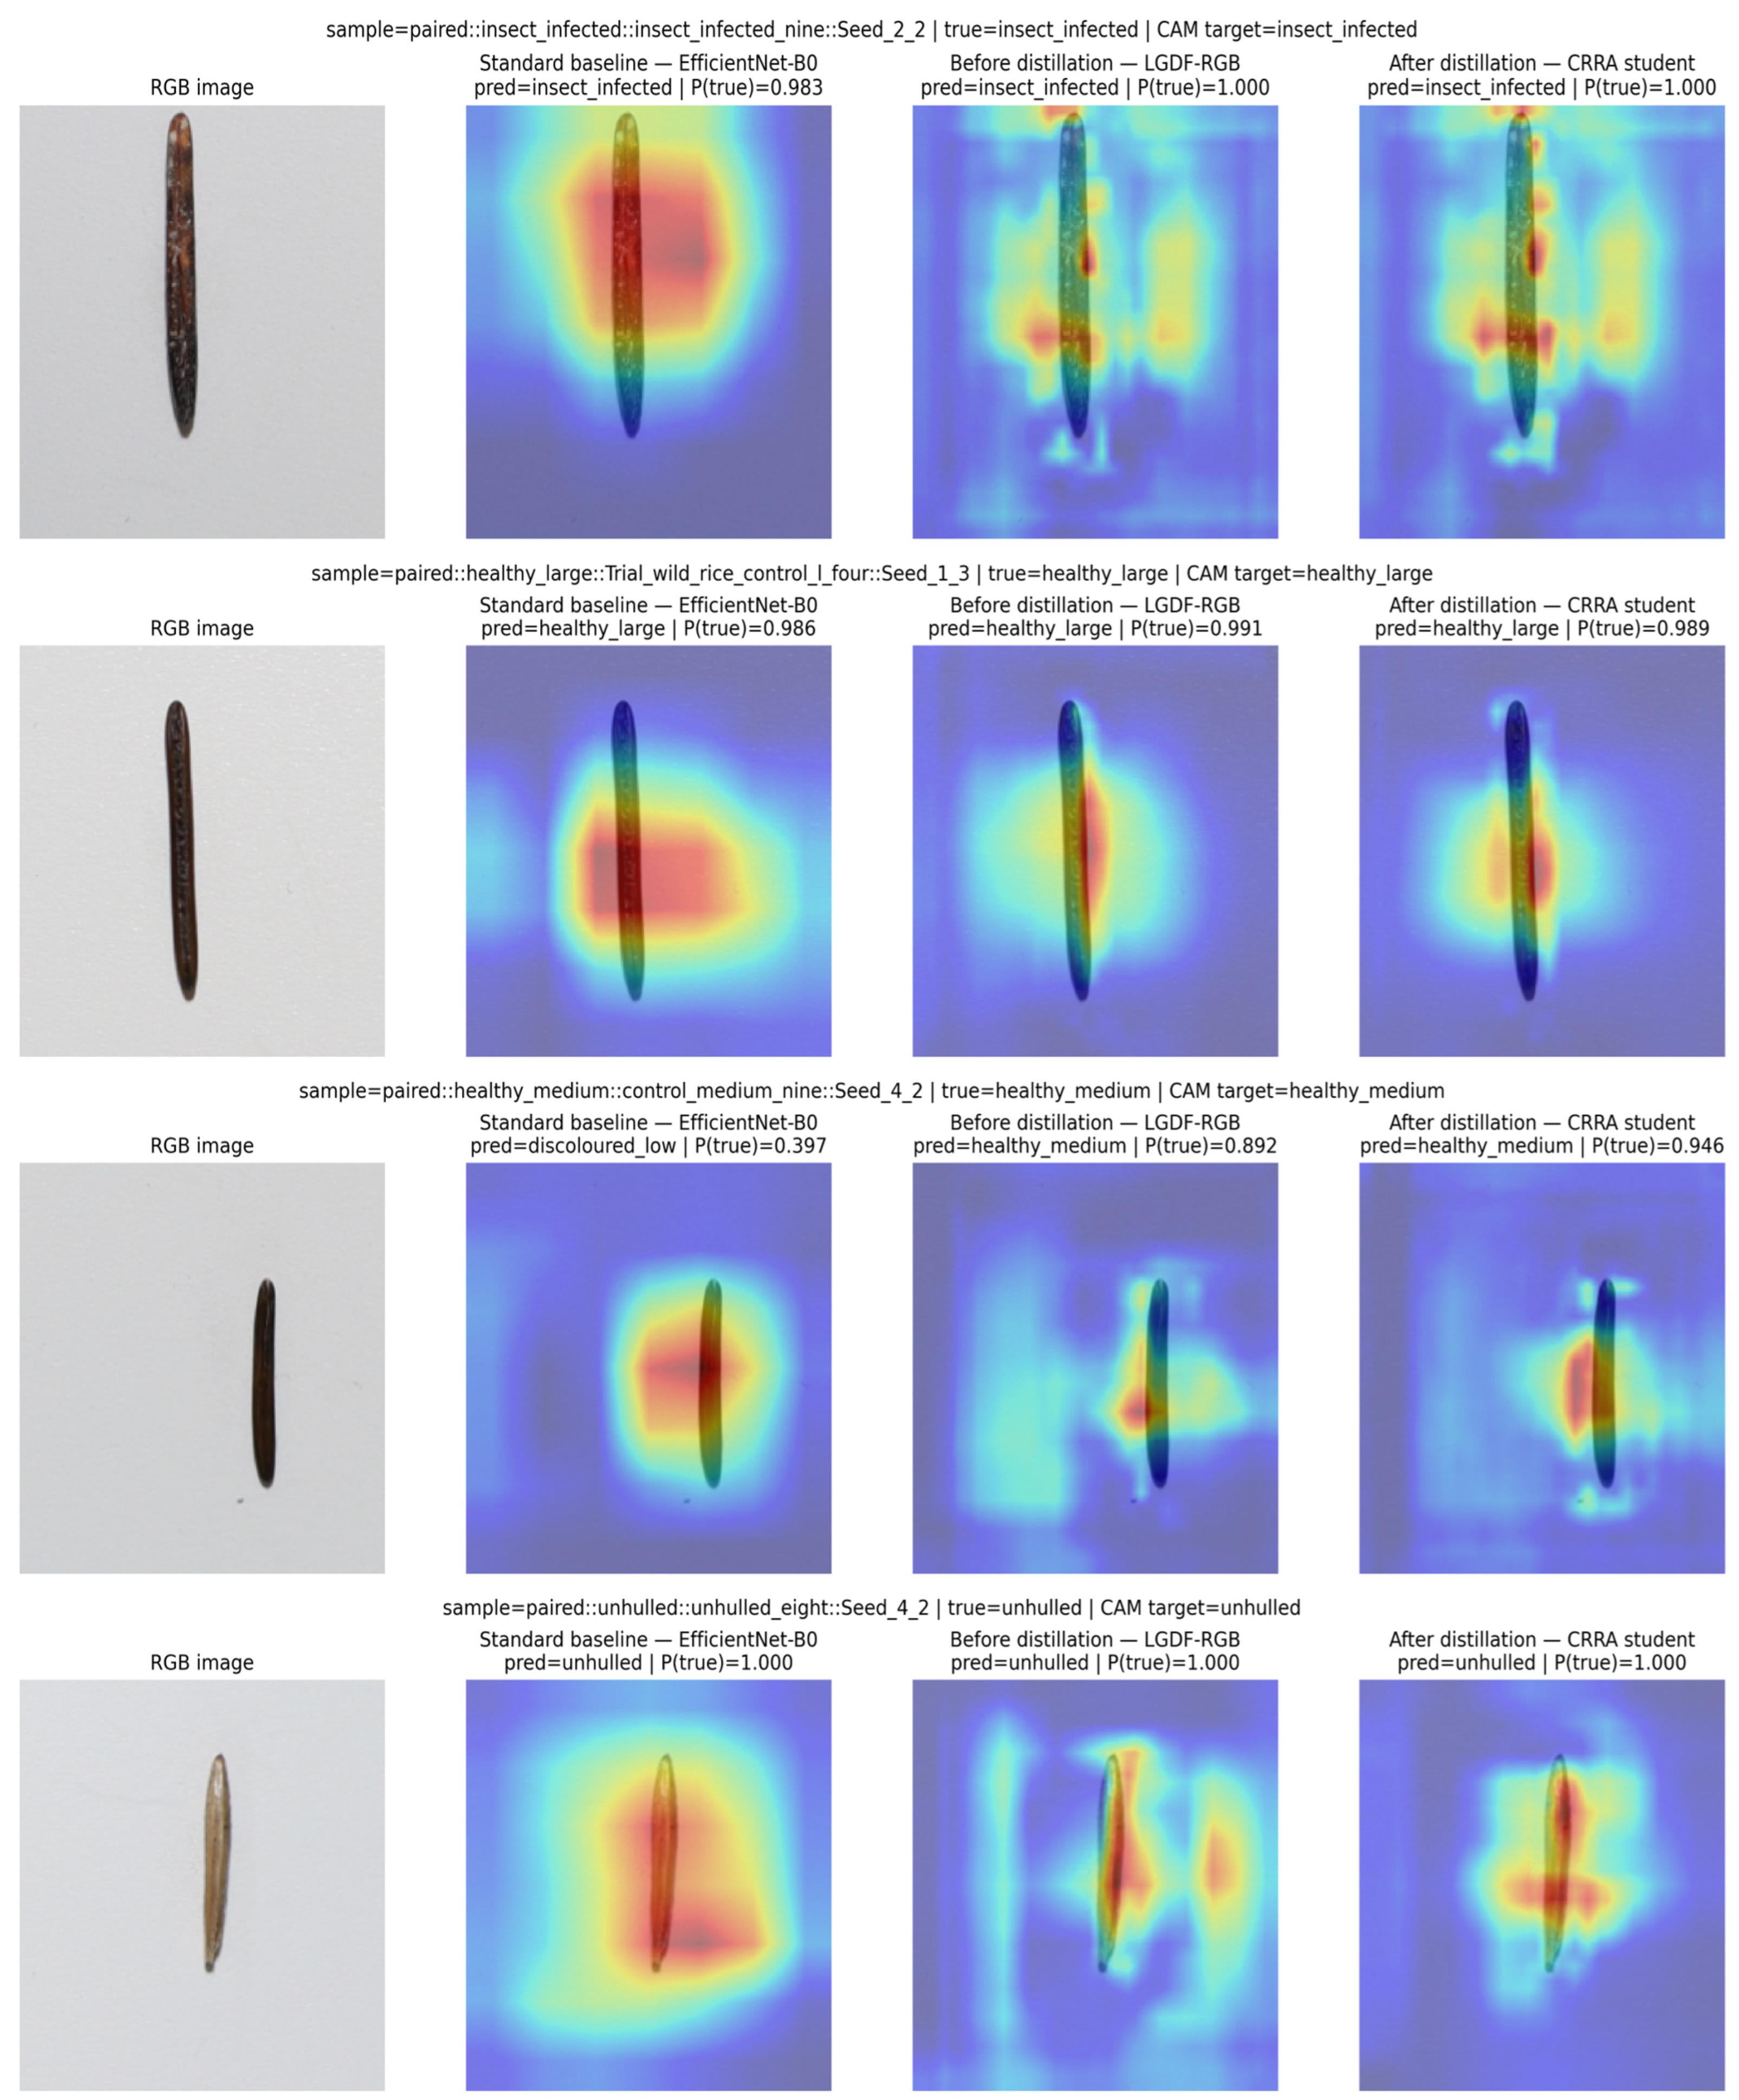
Class-level and sample-level analyses revealed performance differences among the models, but they could not identify which input features were associated with these differences. To further characterize the discriminative evidence underlying model predictions, interpretability analyses were conducted from both spatial and spectral perspectives. Grad-CAM++ was used to visualize class-related spatial responses of the RGB-based models [35], while SHAP was employed to quantify the relative contributions of VNIR wavelengths to the DSRE residual outputs [36]. These two analyses correspond to the RGB prediction pathway and the spectral teacher pathway used during training, providing complementary perspectives for understanding cross-modal residual distillation.
Figure 13 presents one illustrative test image from each class, selected according to class coverage and prediction outcomes. The examples include a healthy_medium sample misclassified by EfficientNet-B0 but correctly classified by LGDF-RGB and CRRA, and a broken_high sample correctly classified by all three models. For each image, the same true class was used as the Grad-CAM++ target across the three models. Grad-CAM++ maps were computed from the final convolutional feature layer of EfficientNet-B0 and the three feature levels used by LGDF in LGDF-RGB and CRRA. Each map was bilinearly resized to the input image size and min–max normalized to [0, 1] before visualization. The analysis was restricted to these selected cases. Class-related responses mainly covered the seed and its immediate surroundings, with differences in response extent and local activation peaks among models. For the healthy_medium example, EfficientNet-B0 predicted discoloured_low, with P(true) = 0.397. LGDF-RGB corrected the prediction and increased P(true) to 0.892, while CRRA further increased this probability to 0.946. For the broken_high example, all models were correct, with P(true) increasing from 0.723 to 0.916 and 0.924. In the displayed examples from the remaining classes, LGDF-RGB and CRRA also produced correct predictions. Across these cases, CRRA preserved seed-related responses while modifying their spatial distribution to different extents.
Figure 13.
Grad-CAM++ visualization of spatial discriminative responses across different RGB models. From left to right: the original RGB image and Grad-CAM++ results of the standard EfficientNet-B0, LGDF-RGB, and the CRRA student model.
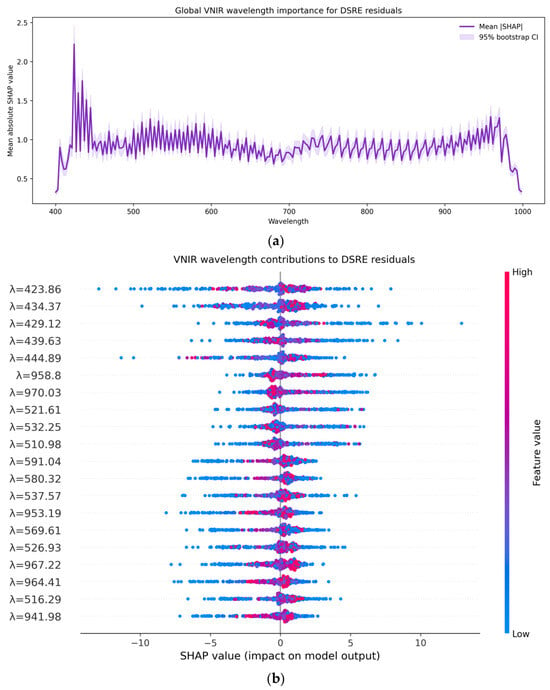
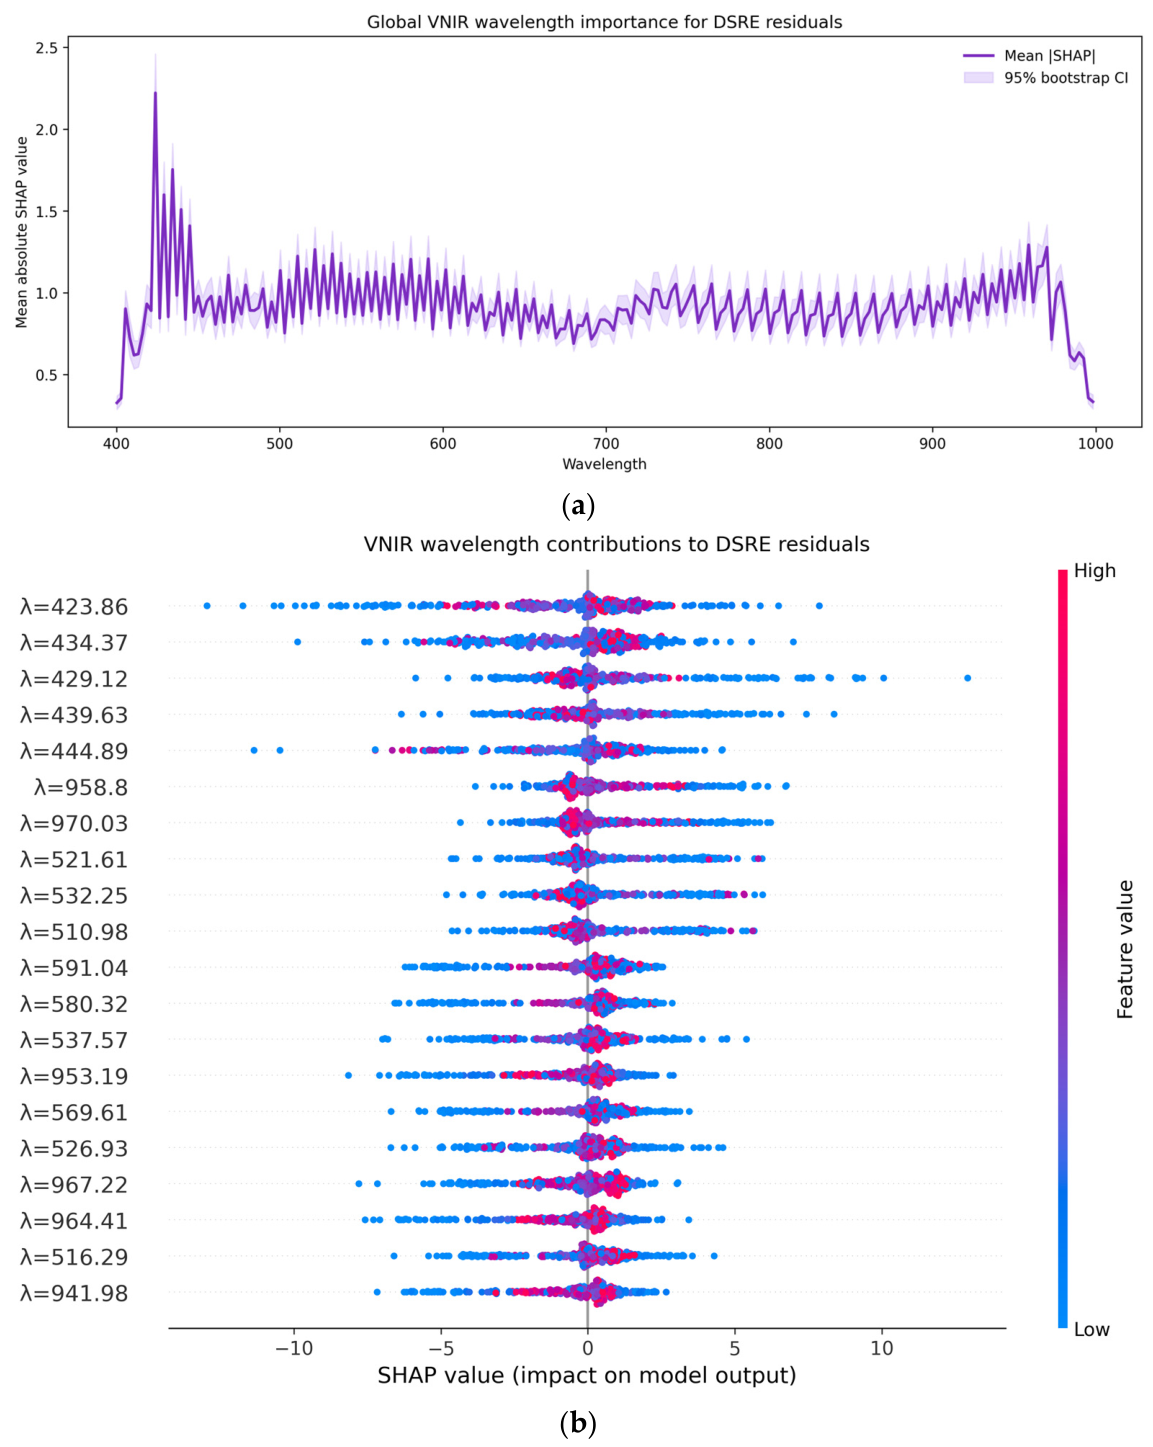
SHAP values were calculated using GradientExplainer for all 384 samples in the locked paired RGB–VNIR test set, with 48 samples per class. Spectra from the paired development set served as the background. For each sample, the RGB representation was fixed, and SHAP values were calculated for the true-class component of the eight-dimensional DSRE decision residual. Global wavelength importance was obtained by averaging the absolute SHAP values across the 384 test samples. SHAP analysis further revealed the spectral basis of the DSRE decision residuals. The global mean absolute SHAP values indicated relatively high contributions from wavelengths within approximately 420–445 nm and 940–970 nm, while several wavelengths in the 510–590 nm range also ranked among the most important features. The SHAP beeswarm plot showed that, at multiple key wavelengths, both high and low spectral values were distributed across positive and negative SHAP values. This pattern suggests that the relationship between spectral intensity and the residual output was not simply monotonic, but was jointly influenced by sample-specific conditions and interactions among spectral bands. Given the typically strong correlations among adjacent VNIR channels, the SHAP results were interpreted as indicating discriminative relevance at the spectral-region level rather than treating individual wavelengths as independent biochemical markers (Figure 14).
Figure 14.
Contributions of VNIR wavelengths to DSRE decision residuals. (a) Global mean absolute SHAP values for individual VNIR wavelengths, with shaded areas representing 95% bootstrap confidence intervals. (b) SHAP beeswarm plot for the top 20 ranked wavelengths. The horizontal axis indicates the direction and magnitude of the contribution of each wavelength to the DSRE residual output, while point color represents the normalized spectral value.
Overall, Grad-CAM++ characterized the spatial regions utilized by the final RGB models, whereas SHAP identified the wavelength information on which the spectral teacher relied when generating DSRE residuals during training. Together, these analyses provide complementary evidence from spatial and spectral perspectives, supporting the overall framework in which VNIR information contributes to the optimization algorithm of RGB-based decision making. Nevertheless, these interpretability results should be regarded as associative evidence and, on their own, cannot establish a causal mechanism of spectral knowledge transfer.
3.7. Robustness Analysis
To evaluate the robustness of the RGB-only student model under image perturbations, LGDF-RGB and CRRA were compared under brightness variation, Gaussian noise, Gaussian blur, and random occlusion conditions (Table 11). Perturbations were applied after image resizing and center cropping, before ImageNet normalization. Brightness was multiplied by a factor sampled uniformly from 0.8 to 1.2. Independent Gaussian noise with a standard deviation of 0.05 was added to each pixel and channel. Gaussian blur used a 9 × 9 kernel, with σ sampled uniformly from 1.0 to 2.0 pixels. Random occlusion covered a uniformly positioned 100 × 100-pixel square, approximately 20% of the 224 × 224 image, with black pixels. Pixel values were clipped to [0, 1] before normalization. Each condition was repeated five times with new perturbation draws and fixed model weights. Without perturbation, CRRA achieved a higher Accuracy than LGDF-RGB (98.60% vs. 97.96%). Under all perturbation conditions, CRRA consistently outperformed LGDF-RGB, maintaining accuracy improvements of 0.89–1.72 percentage points. Although different perturbations degraded the classification performance of both models, CRRA exhibited better performance preservation, particularly under Gaussian noise, Gaussian blur, and random occlusion. These results indicate that the proposed residual transfer strategy improves the robustness of RGB-only classification against common image quality degradations.
Table 11.
Robustness evaluation under different image perturbations.
4. Discussion
Unlike conventional RGB–spectral fusion approaches that directly combine heterogeneous features for final prediction, the proposed framework uses multimodal information in a different manner. Previous studies have demonstrated strong performance for image–spectral fusion in seed and grain classification, although their datasets, class definitions, and evaluation protocols differ substantially from those used in the present study. For example, MLD-Net achieved an Accuracy of 99.04 ± 0.27% on a 12-class corn seed dataset using five-fold cross-validation, while an RGB–hyperspectral fusion model for eight sorghum varieties achieved an Accuracy of 94.84%. In small-sample imperfect wheat kernel classification, Bai et al. reported an average Accuracy of 90.2% for their multimodal attention fusion model, whereas the three-modal maize seed-vigor framework of integrating hyperspectral imaging, machine vision, and electronic-nose information achieved an Accuracy of 99.6%. These values provide useful quantitative context, but they should not be interpreted as direct model-to-model comparisons because the crops, classification objectives, sample sizes, sensing configurations, and validation protocols are different.
The technical distinction of DSRE lies in how spectral information is represented and subsequently used. Most of the above multimodal approaches retain all sensing modalities during inference and improve prediction through feature- or decision-level fusion. In contrast, DSRE takes the RGB prediction as a reference and represents the contribution introduced by paired VNIR information as an incremental decision residual rather than as a complete independent multimodal representation. This formulation is particularly applicable when paired RGB–VNIR data are available during training, but RGB-only inference is desired. CRRA further addresses the fact that not every spectral residual is equally useful or recoverable from RGB information. Residuals that provide little classification benefit or cannot be reliably inferred from the visual representation receive lower transfer weights, whereas residuals that are both useful and recoverable provide stronger supervision to the RGB-only students.
The ablation experiments further separate the contribution of the distillation strategy from the general student architecture. Under the same cross-validation framework, the student without distillation achieved 92.10% Accuracy and 91.96% Macro-F1. Conventional logit and feature distillation increased Accuracy to 92.48% and 92.70%, respectively, whereas raw residual transfer achieved 93.02%. The complete CRRA strategy further increased Accuracy to 94.08% and Macro-F1 to 93.94%. Thus, CRRA provided an absolute Accuracy improvement of 1.98 percentage points over the non-distilled student, compared with improvements of 0.38 and 0.60 percentage points for conventional logit and feature distillation, respectively. CRRA also reduced ECE from 0.046 to 0.025. These controlled ablations indicate that the observed improvement cannot be attributed solely to the presence of RGB student architecture and support the contribution of residual-based and reliability-guided cross-modal supervision.
From an application perspective, the results demonstrate the deployment potential of multimodal training followed by RGB-only inference rather than validating a ready-to-deploy large-scale agricultural sorting system. The paired experiments show that complementary VNIR information can improve classification during multimodal learning, while CRRA enables part of this information to be transferred to a model that requires only RGB input during inference. However, the current RGB-only evaluation remains within the same overall public-data ecosystem and controlled acquisition conditions. Therefore, the present results do not establish robustness across production years, geographical regions, imaging devices, illumination environments, or industrial sorting lines. In addition, inference latency, throughput, hardware requirements, and economic cost were not systematically evaluated. These operational aspects should be assessed before practical large-scale deployment can be established.
The interpretability analyses should also be considered as supportive rather than causal evidence. Grad-CAM++ visualization shows the spatial regions associated with the predictions of the RGB models, whereas SHAP analysis identifies spectral variables associated with the VNIR residual predictions. The observed differences in attention patterns after CRRA training are therefore consistent with changes in the visual decision process, but they do not demonstrate that transferred spectral knowledge directly causes a specific spatial-attention change. Similarly, the spectral regions highlighted by SHAP indicate statistical associations with the learned residual predictions rather than direct physicochemical mechanisms. These analyses consequently provide complementary evidence for understanding the model decisions, but causal interpretation should be avoided.
Several limitations should therefore be considered when interpreting the high classification performance obtained in this study. First, the experiments were conducted using a single publicly available Canadian wild rice dataset with balanced predefined categories and relatively controlled imaging conditions, and external validation using independent production batches or industrial data streams was not available. Second, although direct overlapping samples were screened during construction of the RGB-only evaluation set, the available public-dataset information limits stronger conclusions regarding all possible relationships among multiple images, individual physical kernels, and acquisition batches in the larger RGB image pool. Third, the classification labels mainly represent visible or structural quality conditions, and no independent physicochemical reference measurements were available to validate specific compositional interpretations of the VNIR responses. Fourth, generalization across acquisition years, geographical locations, cameras, spectral devices, illumination conditions, and real sorting environments remains to be evaluated. Finally, the present study focuses on classification effectiveness and does not provide a systematic assessment of inference latency, throughput, hardware cost, or complete sensing-system cost. Future work should therefore incorporate externally collected samples, stronger physical unit and batch-level validation, physicochemical reference measurements where appropriate, and deployment-oriented efficiency and cost analyses.
5. Conclusions
This study proposed an RGB–VNIR cross-modal decision residual distillation framework for non-destructive quality classification of Canadian wild rice kernels. By modeling VNIR information as residual decision knowledge and introducing reliability-guided residual transfer, the proposed framework exploits multimodal information during training while enabling RGB-only inference. On the paired test set, the DSRE teacher achieved 97.40% Accuracy, and the CRRA student achieved 94.53% on the same samples, supporting the value of VNIR-guided learning. The CRRA student also achieved 98.60% Accuracy and 98.62% Macro-F1 on a separate held-out RGB-only test set, supporting the feasibility of RGB-only inference after multimodal training.
Overall, these results demonstrate the potential of a multimodal-training/unimodal-inference strategy under the evaluated dataset conditions. Further external validation and operational evaluation are required to assess its applicability in practical agricultural inspection scenarios.
Supplementary Materials
The following supporting information can be downloaded at https://www.mdpi.com/article/10.3390/agronomy16202044/s1, Table S1. Fold-wise Accuracy of RGB and VNIR models under five-fold cross-validation. Table S2. Fold-wise Macro-F1 of RGB and VNIR models under five-fold cross-validation. Table S3. Fold-wise comparison of LGDF-RGB, the capacity-matched classifier without VNIR input, and the DSRE multimodal teacher.
Author Contributions
Conceptualization, W.H. and S.S.; methodology, W.H. and G.W. (Guangpeng Wang); software, W.H.; validation, W.H. and G.W. (Guangpeng Wang); formal analysis, W.H. and G.W. (Guowei Wang); investigation, G.W. (Guangpeng Wang) and G.W. (Guowei Wang); resources, G.W. (Guowei Wang) and S.S.; data curation, W.H. and G.W. (Guowei Wang); visualization, W.H.; writing—original draft preparation, W.H.; writing—review and editing, G.W. (Guangpeng Wang), G.W. (Guowei Wang) and S.S.; supervision, S.S.; project administration, S.S.; funding acquisition, S.S. All authors have read and agreed to the published version of the manuscript.
Funding
This research was funded by the Natural Science Foundation of Jilin Province, grant number (20230101173JC).
Data Availability Statement
The original data presented in the study are openly available in Zenodo at https://doi.org/10.5281/zenodo.18346354 and https://doi.org/10.5281/zenodo.18358809.
Conflicts of Interest
The authors declare no conflict of interest.
References
- Yang, S.; Kaur, A.; Page, S.; Ai, Y.; Zamani, S.; Smith, M.; Chartrand, B.; Bhowmik, P.; Sharbel, T.F.; Vandenberg, A.; et al. A comparative nutrient analysis of multiple Saskatchewan wild rice (Zizania palustris L.) populations and commercially available grains. J. Agric. Food Res. 2025, 21, 101866. [Google Scholar] [CrossRef] [Scilit]
- Surendiran, G.; Alsaif, M.; Kapourchali, F.R.; Moghadasian, M.H. Nutritional constituents and health benefits of wild rice (Zizania spp.). Nutr. Rev. 2014, 72, 227–236. [Google Scholar] [CrossRef] [Scilit] [PubMed]
- An, D.; Zhang, L.; Liu, Z.; Liu, J.; Wei, Y. Advances in infrared spectroscopy and hyperspectral imaging combined with artificial intelligence for the detection of cereals quality. Crit. Rev. Food Sci. Nutr. 2023, 63, 9766–9796. [Google Scholar] [CrossRef] [Scilit]
- Patel, D.; Bhise, S.; Kapdi, S.; Bhatt, T. Non-destructive hyperspectral imaging technology to assess the quality and safety of food: A review. Food Prod. Process. Nutr. 2024, 6, 69. [Google Scholar] [CrossRef] [Scilit]
- Liang, Y.; Li, Z.; Shi, J.; Zhang, N.; Qin, Z.; Du, L.; Zhai, X.; Shen, T.; Zhang, R.; Zou, X.; et al. Advances in hyperspectral imaging technology for grain quality and safety detection: A review. Foods 2025, 14, 2977. [Google Scholar] [CrossRef] [Scilit] [PubMed]
- Sun, D.-W.; Pu, H.; Yu, J. Applications of hyperspectral imaging technology in the food industry. Nat. Rev. Electr. Eng. 2024, 1, 251–263. [Google Scholar] [CrossRef] [Scilit]
- Caporaso, N.; Whitworth, M.B.; Fisk, I.D. Near-Infrared spectroscopy and hyperspectral imaging for non-destructive quality assessment of cereal grains. Appl. Spectrosc. Rev. 2018, 53, 667–687. [Google Scholar] [CrossRef] [Scilit]
- Jin, C.; Zhou, X.; He, M.; Li, C.; Cai, Z.; Zhou, L.; Qi, H.; Zhang, C. A novel method combining deep learning with the Kennard–Stone algorithm for training dataset selection for image-based rice seed variety identification. J. Sci. Food Agric. 2024, 104, 8332–8342. [Google Scholar] [CrossRef] [Scilit] [PubMed]
- Rajalakshmi, R.; Faizal, S.; Sivasankaran, S.; Geetha, R. RiceSeedNet: Rice seed variety identification using deep neural network. J. Agric. Food Res. 2024, 16, 101062. [Google Scholar] [CrossRef] [Scilit]
- Akbarpour, O.; Akbari, S.; Fanourakis, D.; Taheri-Garavand, A. Deep learning-based seed variety classification: A case study in maize. BMC Plant Biol. 2025, 26, 105. [Google Scholar] [CrossRef] [Scilit] [PubMed]
- Tu, K.; Wen, S.; Cheng, Y.; Xu, Y.; Pan, T.; Hou, H.; Gu, R.; Wang, J.; Wang, F.; Sun, Q. A model for genuineness detection in genetically and phenotypically similar maize variety seeds based on hyperspectral imaging and machine learning. Plant Methods 2022, 18, 81. [Google Scholar] [CrossRef] [Scilit] [PubMed]
- Dreier, E.S.; Sorensen, K.M.; Lund-Hansen, T.; Jespersen, B.M.; Pedersen, K.S. Hyperspectral imaging for classification of bulk grain samples with deep convolutional neural networks. J. Near Infrared Spectrosc. 2022, 30, 107–121. [Google Scholar] [CrossRef] [Scilit]
- Yu, Y.; You, H.; Li, D.; Zhang, L.; Song, S.; Li, J. A transformer-based framework for high-resolution hyperspectral classification of ginseng. J. Food Compos. Anal. 2026, 157, 109391. [Google Scholar] [CrossRef] [Scilit]
- Sun, D.; Lan, W.; Tu, K.; Liu, J.; Pan, L. Defective wheat kernel classification using dual-range hyperspectral imaging and an interpretable spectral-spatial fusion convolutional neural network. Spectrochim. Acta Part A Mol. Biomol. Spectrosc. 2026, 363, 128424. [Google Scholar] [CrossRef] [Scilit] [PubMed]
- Zou, J.; You, H.; Wu, H.; Yin, H.; Wu, X.; Xu, K. MLD-net: Dynamic adaptive fusion of spectral and spatial data for corn seed sorting. Microchem. J. 2026, 229, 119361. [Google Scholar] [CrossRef] [Scilit]
- Bi, X.; Xie, H.; Lyu, Z.; You, H.; Li, C.; Wang, M.; Shi, W.; Bi, C.; Yu, H. Research on explainable classification and model updating of maize kernels from different years based on multimodal data-driven approaches. Microchem. J. 2025, 215, 114416. [Google Scholar] [CrossRef] [Scilit]
- Xie, H.; Ji, H.; Bi, X.; Wang, M.; Bi, C. Nondestructive identification of maize seed varieties using interpretable RGB-spectral fusion. J. Stored Prod. Res. 2026, 119, 103199. [Google Scholar] [CrossRef] [Scilit]
- Yang, X.; Chen, Y.; Song, S.; Zhang, Z. A sorghum seed variety identification method based on image–hyperspectral fusion and an improved deep residual convolutional network. Front. Plant Sci. 2025, 16, 1632698. [Google Scholar] [CrossRef] [Scilit] [PubMed]
- Bai, G.; Zhang, T.; Cai, L.; Liu, Z.; Zhou, Y.; Xu, Y.; Sun, T.; Zhou, L. Multimodal Fusion-Based Classification Method for Small-Sample Imperfect Wheat Kernels Using Hyperspectral Imaging. Food Control 2026, 185, 112034. [Google Scholar] [CrossRef] [Scilit]
- Xie, J.; Zheng, J.; Fu, J.; Huang, S.; Zhou, Y.; Luo, X.; Dai, D.; Mao, Y.; Han, Q. Research on multi modal corn seed vitality grading based on three branch cross attention fusion network. Spectrochim. Acta Part A Mol. Biomol. Spectrosc. 2026, 358, 127828. [Google Scholar] [CrossRef] [Scilit] [PubMed]
- Hoffman, J.; Gupta, S.; Darrell, T. Learning with side information through modality hallucination. In Proceedings of the IEEE Conference on Computer Vision and Pattern Recognition, Las Vegas, NV, USA, 27–30 June 2016; IEEE: New York, NY, USA, 2016; pp. 826–834. [Google Scholar]
- Dai, R.; Das, S.; Bremond, F. Learning an augmented rgb representation with cross-modal knowledge distillation for action detection. In Proceedings of the 2021 IEEE/CVF International Conference on Computer Vision (ICCV), Montreal, QC, Canada, 10–17 October 2021; IEEE: New York, NY, USA, 2021; pp. 13033–13044. [Google Scholar]
- Huo, F.; Xu, W.; Guo, J.; Wang, H.; Guo, S. C2kd: Bridging the modality gap for cross-modal knowledge distillation. In Proceedings of the 2024 IEEE/CVF Conference on Computer Vision and Pattern Recognition (CVPR), Seattle, WA, USA, 16–22 June 2024; IEEE: New York, NY, USA, 2024; pp. 16006–16015. [Google Scholar]
- Sikiru, Y.; Erkinbaev, C. A multimodal imaging dataset for quality grading of Canadian wild rice kernels using RGB and VNIR hyperspectral data. Data Brief 2026, 65, 112601. [Google Scholar] [CrossRef] [Scilit] [PubMed]
- Tan, M.; Le, Q. Efficientnet: Rethinking model scaling for convolutional neural networks. In Proceedings of the International Conference on Machine Learning, Long Beach, CA, USA, 9–15 June 2019; pp. 6105–6114. [Google Scholar]
- Hoang, V.-T.; Jo, K.-H. Practical analysis on architecture of EfficientNet. In Proceedings of the 2021 14th International Conference on Human System Interaction (HSI), Gdańsk, Poland, 8–10 July 2021; pp. 1–4. [Google Scholar]
- Jenal, A.; Bareth, G.; Bolten, A.; Kneer, C.; Weber, I.; Bongartz, J. Development of a VNIR/SWIR multispectral imaging system for vegetation monitoring with unmanned aerial vehicles. Sensors 2019, 19, 5507. [Google Scholar] [CrossRef] [Scilit] [PubMed]
- Bose, S.; Dey, A. Rescnn: An alternative implementation of convolutional neural networks. In Proceedings of the 2021 IEEE 8th Uttar Pradesh Section International Conference on Electrical, Electronics and Computer Engineering (UPCON), Dehradun, India, 11–13 November 2021; IEEE: New York, NY, USA, 2021; pp. 1–5. [Google Scholar]
- Sun, W.; Su, Y.; Wu, X.; Wu, X. A novel end-to-end 1D-ResCNN model to remove artifact from EEG signals. Neurocomputing 2020, 404, 108–121. [Google Scholar] [CrossRef] [Scilit]
- Lin, T.-Y.; Dollár, P.; Girshick, R.; He, K.; Hariharan, B.; Belongie, S. Feature pyramid networks for object detection. In Proceedings of the 2017 IEEE Conference on Computer Vision and Pattern Recognition (CVPR), Honolulu, HI, USA, 21–26 July 2017; IEEE: New York, NY, USA, 2017; pp. 936–944. [Google Scholar]
- Hu, J.; Shen, L.; Sun, G. Squeeze-and-excitation networks. In Proceedings of the IEEE Conference on Computer Vision and Pattern Recognition, Salt Lake City, UT, USA, 18–22 June 2018; IEEE: New York, NY, USA, 2018; pp. 7132–7141. [Google Scholar]
- Shafiq, M.; Gu, Z. Deep residual learning for image recognition: A survey. Appl. Sci. 2022, 12, 8972. [Google Scholar] [CrossRef] [Scilit]
- Hinton, G.; Vinyals, O.; Dean, J. Distilling the knowledge in a neural network. arXiv 2015, arXiv:1503.02531. [Google Scholar]
- Srivastava, R.K.; Greff, K.; Schmidhuber, J. Training very deep networks. In Advances in Neural Information Processing Systems 28; Curran Associates: Sydney, Australia, 2015. [Google Scholar]
- Chattopadhay, A.; Sarkar, A.; Howlader, P.; Balasubramanian, V.N. Grad-CAM++: Generalized gradient-based visual explanations for deep convolutional networks. In Proceedings of the 2018 IEEE Winter Conference on Applications of Computer Vision (WACV), Lake Tahoe, NV, USA, 12–15 March 2018; IEEE: New York, NY, USA, 2018; pp. 839–847. [Google Scholar]
- Ponce-Bobadilla, A.V.; Schmitt, V.; Maier, C.S.; Mensing, S.; Stodtmann, S. Practical guide to SHAP analysis: Explaining supervised machine learning model predictions in drug development. Clin. Transl. Sci. 2024, 17, e70056. [Google Scholar] [CrossRef] [Scilit] [PubMed]

Disclaimer/Publisher’s Note: The statements, opinions and data contained in all publications are solely those of the individual author(s) and contributor(s) and not of MDPI and/or the editor(s). MDPI and/or the editor(s) disclaim responsibility for any injury to people or property resulting from any ideas, methods, instructions or products referred to in the content. |
© 2026 by the authors. Licensee MDPI, Basel, Switzerland. This article is an open access article distributed under the terms and conditions of the Creative Commons Attribution (CC BY) license.