


Abstract
The effective development of coffee production depends directly on the ability to control phytopathogenic diseases, which reduce crop quality and productivity. Uniform pesticide application remains an operational challenge due to new formulations, reduced spray volumes, and structural characteristics of coffee plants. This study evaluated the efficiency of adjuvants associated with reduced spray volumes for controlling brown eye spot (Cercospora coffeicola) and coffee leaf rust (Hemileia vastatrix). A randomized complete block design with 11 treatments and five replicates was used. Spray volumes of 650, 333, and 250 L ha−1 were combined with vegetable oil (VO; 1 L ha−1), sodium lauryl ether sulfate plus a natural compound-based adjuvant (LESS; 0.35 L ha−1), or LESS combined with vegetable oil (0.5 L ha−1). An additional farm-standard treatment consisted of 800 L ha−1 with 1.0 L ha−1 VO. The experiment was conducted on the Icatu 42 cultivar, and spray deposition, droplet spectrum and disease control efficacy were evaluated. LESS increased droplet coverage, spreading, wetted area, and spray retention. Reduced vegetable oil rates associated with adjuvants improved spray application parameters and disease control. The 250 L ha−1 spray volume provided greater deposition throughout the canopy, while higher volumes increased runoff, soil losses and spray drift. The combination of LESS with 250 L ha−1 achieved the highest deposition efficiency and the greatest reduction in coffee leaf rust and brown eye spot incidence, whereas 333 L ha−1 + LESS provided the best control of brown eye spot. These results demonstrate that reduced spray volumes combined with high-performance adjuvants can optimize coffee disease management.
1. Introduction
Coffee production in Brazil in 2025 is projected at 51.8 million 60 kg bags, representing a 4.4% decrease compared to 2024, due to adverse climatic conditions associated with the biennial cycle [1]. Among the factors that limit coffee productivity, foliar fungal diseases stand out, particularly coffee leaf rust (Hemileia vastatrix Berk. and Broome (Pucciniales: Pucciniaceae)) brown eye spot (Cercospora coffeicola Berk. and M.A. Curtis (Capnodiales: Mycosphaerellaceae)) and Phoma leaf spot (Phoma sp.) [2,3]. Coffee leaf rust is the most important disease of the crop in Brazil, reducing both the production and the quality of coffee fruits marketed worldwide [4]. Brown eye spot, although less studied, causes premature defoliation and significant losses in nurseries and young plantations, and its importance has increased in areas of intensive management [5].
Effective disease management in coffee relies heavily on fungicide application. However, achieving uniform spray deposition in coffee canopies remains an operational challenge because of the dense, tree-like architecture, high leaf area index, and the presence of both surface-exposed and internally developing pathogens [6,7]. This scenario is further complicated by the increasing pressure to reduce spray volumes, water consumption and production costs, while maintaining biological efficacy [8]. This challenge can be mitigated by incorporating additional products into pesticide solutions, such as oils and adjuvants. Furthermore, vegetable oils are commonly used in Brazil in high concentrations during agricultural pesticide application, aiming to enhance the pesticide absorption effects in foliar penetration [9]. This practice has not yet been scientifically proven because vegetable oils can cause undesirable effects, such as low spray retention on leaves, drastic reductions in surface tension leading to reduced adhesion of spray droplets, and significant losses due to drift [10].
Agricultural Spray Adjuvants (ASA) can influence the spray deposition and retention of pesticide droplets on the plant surface and increase their effectiveness. When a droplet impacts a leaf surface, three outcomes are possible: adhesion, bounce, or shatter [11]. Adjuvants modify the physical and chemical properties of phytosanitary sprays, promoting better spray preparation and homogeneous droplet formation compared to vegetable oils, as they adequately reduce surface tension and the contact angle of droplets with the target surface [12]. A reduction in static surface tension by adjuvants may improve the adhesion, spreading, wetting, and penetration of pesticides, as well as increase the translocation of the active ingredients into the plant tissues [13].
Recent studies have demonstrated the importance of reducing spray volumes in coffee crops to optimize the application process and reduce phytosanitary management costs [14,15,16]. However, few studies have investigated whether combining adjuvants with reduced spray volumes can improve droplet deposition and spray distribution while maintaining or improving disease-control efficacy under field conditions [17].
Adjuvants in low-volume sprays are a well-known strategy for improving the physicochemical properties of mixtures, such as surface tension and spreadability, while mitigating evaporation losses [18]. However, most studies on adjuvants in coffee have focused on deposition only, without linking deposition gains to biological efficacy under field conditions [17]. Cação et al. [19] demonstrated that spray retention on coffee leaves depends on adjuvant type and concentration, but their study did not specifically evaluate reduced spray volumes under field conditions or establish whether improvements in deposition translate into disease-control efficacy. Moreover, the response of different biological targets to the same optimized spray has not been adequately compared. Thus, it remains unresolved whether adjuvant formulations applied at reduced spray volumes can maintain or improve deposition and canopy penetration while providing effective control of diseases with contrasting epidemiological characteristics—a surface-exposed pathogen such as H. vastatrix, and a pathogen with intra- and intercellular development such as C. coffeicola.
Based on this gap, we hypothesized that (H1) reduced spray volumes combined with an appropriate adjuvant can maintain or improve droplet deposition and canopy penetration; (H2) the adjuvant improves spray spreading, wetting and retention, increasing deposition uniformity; and (H3) improved application quality enhances disease-control efficacy, with different responses between H. vastatrix and C. coffeicola. Accordingly, application quality was evaluated based on deposition, droplet characteristics, and canopy distribution, whereas biological efficacy was assessed through disease progress and control. The added value of this study lies in combining a tractor-mounted air-assisted sprayer, reduced-volume applications with a LESS formulation, and two diseases with contrasting epidemiological characteristics, allowing the relationship between application quality and disease-control efficacy to be assessed under field conditions.
Therefore, this study evaluated the efficiency of adjuvants combined with reduced spray volumes in improving spray deposition and phytosanitary management in coffee plants under field conditions. Unlike previous studies that have focused primarily on spray depositions, this work investigates the relationship between optimized spray deposition promoted by specific adjuvants and phytosanitary efficacy against two distinct diseases. Specifically, the study aimed to: (i) compare the efficiency of treatments with different application volumes associated with adjuvants in relation to the conventional treatment; (ii) evaluate the effect of adjuvants on deposition parameters and the droplet spectrum at different spray volumes; (iii) determine the influence of spray volumes and adjuvants on spray distribution in different plant strata; (iv) compare the effectiveness of treatments in controlling brown eye spot (C. coffeicola) and rust (H. vastatrix); and (v) identify the optimal combination of adjuvant and spray volume to increase deposition efficiency and phytosanitary control.
2. Materials and Methods
2.1. Experimental Design
The experiment was conducted in March and April 2025 at Conquista Farm, located in Bonfinópolis de Minas, Minas Gerais, Brazil (16°20′21″ S 46°25′28″ W; average altitude 898 m). The trial was conducted with the Icatu 42 cultivar, 2.7 m tall, at the grain maturation stage. The experimental area comprised 55 plots (11 treatments × 5 blocks), totaling approximately 2035 m2 (0.2035 ha). Each plot consisted of two 10 m-long coffee rows spaced 1.85 m apart, corresponding to a total plot area of 37 m2. The two outer rows of each plot were used as borders and windbreaks to prevent contamination between plots during application. In the usable area, the first and last 2.0 m of each row were also discarded as borders, leaving 40 central plants per plot for evaluation. A randomized complete block design was adopted, with 11 treatments and five replicates: nine combinations of three spray volumes (650, 333, and 250 Lha−1) with three adjuvant treatments: vegetable oil (VO; 1 Lha−1; Vittia, São Joaquim da Barra, SP, Brazil), sodium lauryl ether sulfate + natural compounds-based adjuvant (LESS; 0.35 Lha−1, Inquima, Unaí, MG, Brazil), and LESS (0.35 Lha−1) + VO (0.5 Lha−1). In addition, a standard farm treatment (800 Lha−1 + 1.0 Lha−1 VO, Vittia) and one untreated control were included. The other components were Difeconazole + Ciproconazole (at a rate of 0.5 Lha−1), Cyantraniliprole (at a rate of 1.5 Lha−1) and Pyraclostrobin (at a rate of 0.75 Lha−1). Treatment codes, spray volumes, adjuvant types, adjuvant rates, and active ingredients are summarized in Table 1.
Table 1.
Composition of the 11 experimental treatments: treatment code, spray volume, adjuvant type and adjuvant rate.
2.2. Treatments Application
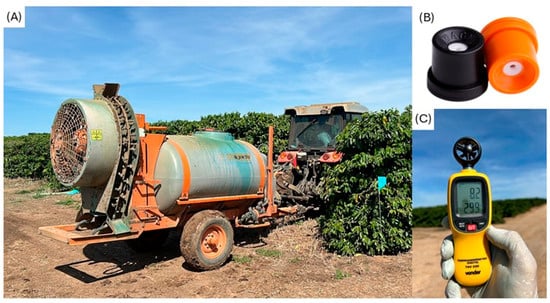
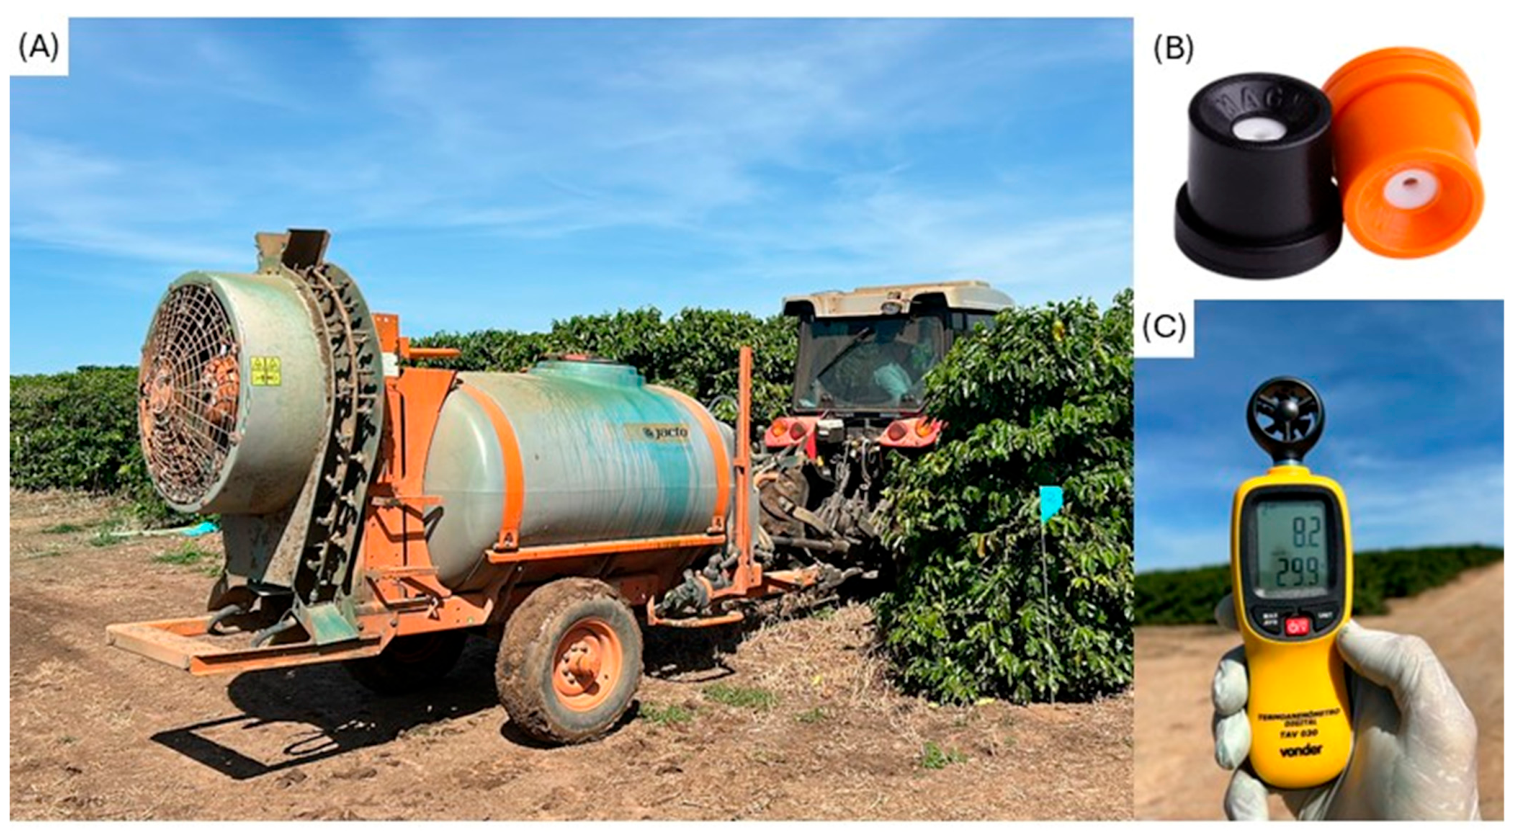
A turbo atomizer (Jacto, Pompéia, SP, Brazil) coupled to a tractor was used to apply the treatments. It contained lateral arcs with 18 spray nozzles (Figure 1A). The nozzles used were empty cones, model Magnojet MAG 1.5 (Magnojet, São Paulo, SP, Brazil) (brown), spaced 10 cm apart, and a 2000 L spray tank (model Arbus 2000) was used. The same speed was used for all treatments, approximately 1.35 ms−1 (50 m in 37 s). To adjust each spray volume, a calibration of the tip flow rates was performed for each treatment: 650 Lha−1, flow rate 0.400 Lmin−1; 333 Lha−1, flow rate 0.206 Lmin−1, 250 Lha−1, flow rate 0.154 Lmin−1 for the MAG 1.5 spray tip, and 800 Lha−1, flow rate 0.450 Lmin−1, using the MAG 2.0 tip, and a pressure of 75 PSI (Figure 1B).
Figure 1.
Equipment used for research development: (A) Mechanical turboatomizer, (B) Empty cone applicators, and (C) Digital thermo-anemometer.
Environmental conditions during applications were monitored with a digital thermo-anemometer (Vonder TEV40, Vonder, Curitiba, PR, Brazil). Applications occurred sequentially, even during the hottest times of the day (Figure 1C).
2.3. Application Technology Evaluations
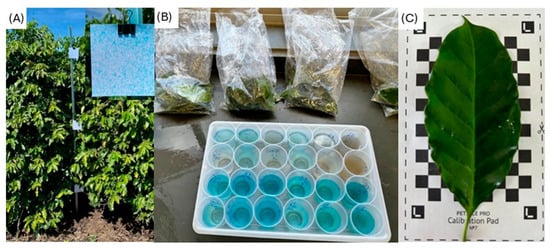
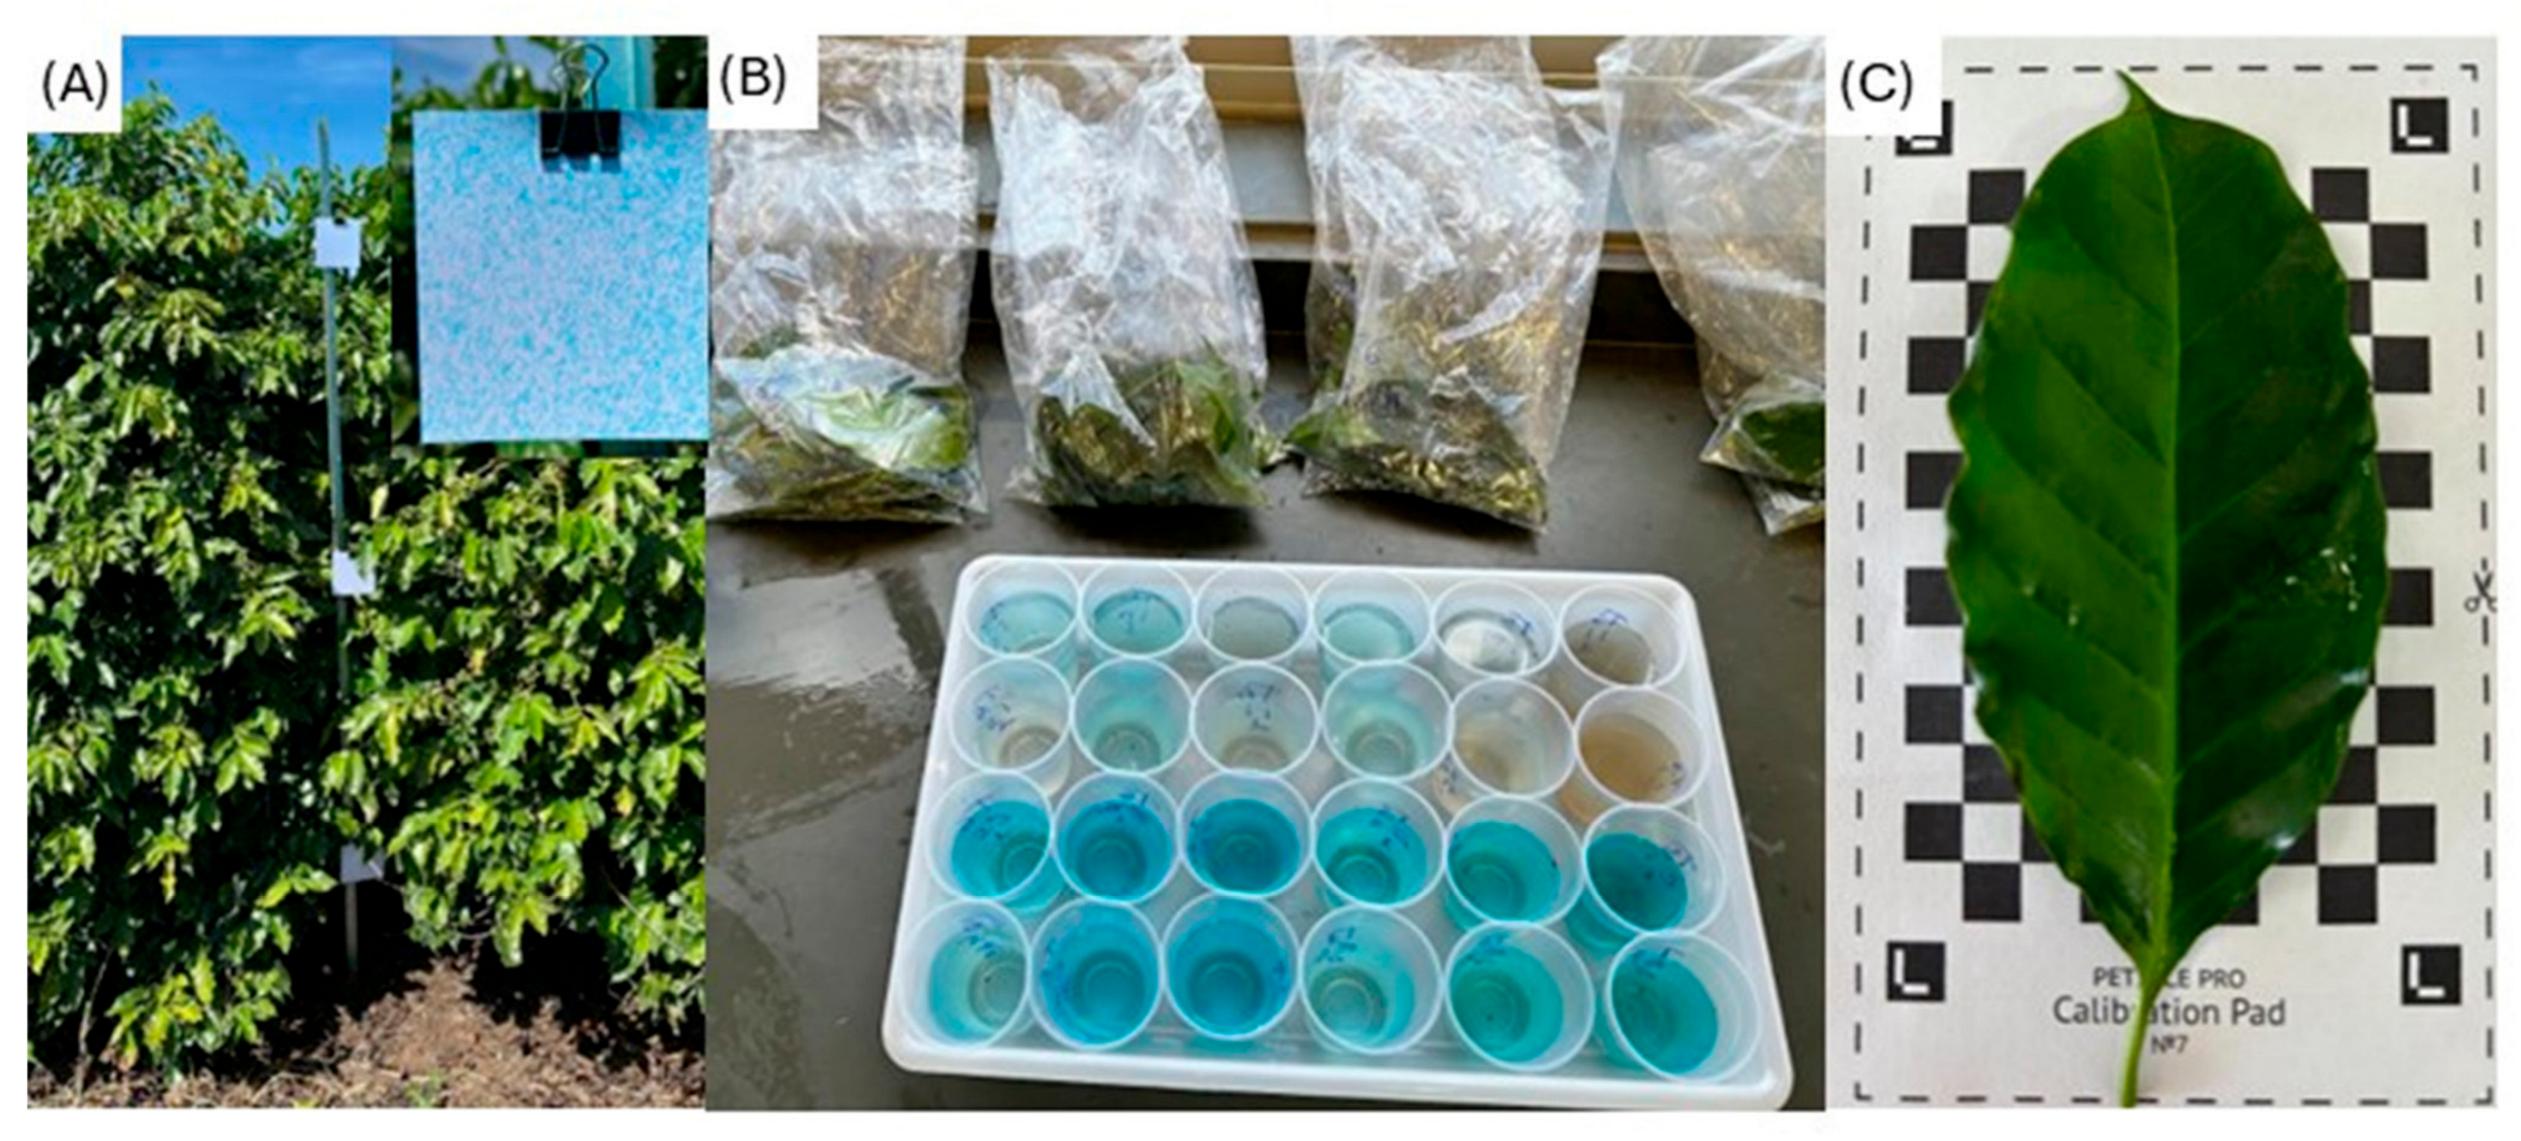
Spray deposition in the upper, middle, and lower thirds of the crop (internally and externally) was evaluated, as well as droplet coverage, density, and spectrum (VMD, volume median diameter). To evaluate these variables, white photographic paper measuring 100 × 100 mm was placed in each experimental plot. Before each application, the paper sheets were positioned vertically, fixed to a metal boom in the crop row at the upper, middle, and lower positions. To analyze droplet coverage and deposition, brilliant blue dye (FD&C, No. 1, Duas Rodas, Jaraguá do Sul, SC, Brazil) was added to the spray solution at different concentrations for each treatment, adjusted so that the theoretical amount of tracer applied per unit ground area was comparable across treatments: 800 Lha−1 = 2.5 gL−1; 650 Lha−1 = 3 gL−1; 333 Lha−1 = 3.75 gL−1; 250 Lha−1 = 4.5 gL−1. To ensure full comparability among spray volume treatments, all deposition data were normalized by the initial tracer dose applied per hectare, and the results are expressed as percentage of applied tracer recovered per unit leaf area rather than as absolute dye concentration (ng cm−2). This normalization removes any bias caused by differences in tracer concentration and allows direct comparison among spray volume treatments. When applying the treatments, three rods with marker paper sheets were installed in the application line (Figure 2). The photographic papers were digitized for subsequent analysis of the droplet spectrum using the Gotas software [20].
Figure 2.
Methods for evaluating spray deposition: (A) photographic papers, (B) brilliant blue dye, and (C) leaf area reading.
Spray deposition was evaluated in the upper, middle, and lower thirds, both internally and externally, of the coffee plant. After each application, 30 leaves were collected from each third and from each region of the plant (internal and external) in each experimental plot. Subsequently, leaf samples from each plot were immersed in 100 mL of water for dye extraction, which was then quantified using spectrophotometry. A spectrophotometer with a tungsten–halogen lamp (BiospectroSP22, Curitiba, PR, Brazil) was used to measure the color of each sample. Blue coloration was quantified by measuring the absorbance of the light beam, filtering the 630 nm wavelengths.
Using calibration curves obtained from standard solutions of the tracer dye, the absorbance data were converted to concentration (mgL−1). Using the initial concentration of each solution and the sample dilution volume (100 mL), the mass of dye retained in each coffee leaf sample was determined in the different thirds and positions evaluated. The total deposit was divided by the area of each leaf to obtain the amount of dye in micrograms (µg) per area (cm). The area of the leaves collected in each experimental plot was read using Petiole Pro software (V.001-03-24).
Penetration into the canopy was evaluated using the Canopy Penetration Index, which measures how much of the spray deposited on the outside managed to penetrate to the inside of the crop, and the uniformity of deposition was determined by the Coefficient of Variation (CV) of deposition between the upper, middle, and lower thirds of the canopy.
2.4. Disease Assessment
For coffee leaf rust (H. vastatrix) and brown eye spot (C. coffeicola), sampling was carried out to determine disease severity. Three hundred leaves were collected per plot, in the middle and lower thirds of the crop, regions that show a higher incidence of disease. In some evaluations, collections were also carried out in the upper third, due to the increase in disease severity in this region throughout the evaluation period.
Disease severity was assessed using diagrammatic scales and expressed as a percentage, calculated from the average values of the severity classes. For brown eye spot, symptoms were identified as circular brown spots with a light center and dark border, observed on both the adaxial and abaxial leaf surfaces, with active lesions of Cercospora sp. For coffee leaf rust, symptoms were identified as orange-yellow powdery pustules in the sporulation phase, observed mainly on the abaxial leaf surface.
Disease severity was assessed on 300 leaves per plot, collected before application and at 7, 14, and 21 days after application (DDA). For analysis purposes, severity was expressed as a percentage, calculated from the average values of the severity classes on the diagrammatic scales. The diagrammatic scale of Capucho et al. [21] was used as a visual reference for rust symptoms, and the scale of Custódio et al. [22] was used as the visual reference for brown eye spot (C. coffeicola) severity on coffee leaves.
2.5. Data Analysis
Data collected from the analysis of spray deposition on coffee leaves, coverage, droplet density, and spectra, as well as disease severity, were first subjected to an analysis of assumptions (normality of residuals and homogeneity of variances). Normality was checked using the Shapiro–Wilk test, and homogeneity of variances was checked using the Levene test. When assumptions were not met, data were transformed (square root or logarithmic transformation) before analysis. When assumptions were not met, data were transformed (square root or logarithmic transformation) before analysis. Analysis of variance (ANOVA) was performed using the F-test, considering a randomized complete block design with spray volume and adjuvant as factors, and block as a random effect. When significant, means were compared using the Scott–Knott test at a 5% probability level. For each evaluation time (7, 14 and 21 days after application—DAA), a two-way factorial ANOVA (spray volume × adjuvant) was performed, and the interaction between factors was tested.
In addition to the ANOVA and Scott–Knott analyses described in the original study, the following complementary metrics were calculated: (i) control efficacy using Abbott’s formula, comparing disease severity in each treatment with the untreated control; (ii) Area Under the Disease Progress Curve (AUDPC), integrating disease severity over the evaluation period; (iii) Canopy Penetration Index, calculated as the percentage ratio between internal and external deposition; (iv) Coefficient of Variation (CV) of deposition among canopy thirds, to assess vertical distribution uniformity; (v) correlation analysis (Pearson and Spearman) between deposition and control efficacy; and (vi) relative efficiency, calculated as control efficacy (%) divided by spray volume (L ha−1).
The Dunnett test was used to compare each treatment against the farm-standard control (800 L ha−1 + 2 × VO) at a 5% probability level.
3. Results and Discussion
3.1. Application Technology Parameters: Droplet Coverage, Density and Spectrum
The highest droplet coverage was achieved with the largest spray volumes (650 and 333 L ha−1). Regarding adjuvants, LESS and LESS + 0.5 VO promoted significantly greater coverage compared to VO alone (Table 2). Conversely, VO promoted higher droplet density due to a reduction in the droplet spectrum. The standard farm treatment (800 L ha−1 + 2× VO) exhibited lower values for coverage, density, and droplet spectrum, not surpassing the other treatments.
Table 2.
Average coverage, density, and droplet spectrum (VMD) in the upper, middle, and lower thirds of the coffee plant canopy after application of different spray volumes and adjuvants.
The data reveal an important pattern: larger volumes (650 and 333 L ha−1) provided greater percentage coverage on the leaves, while the LESS adjuvant (alone or in combination) consistently promoted a higher VMD (volume median diameter) compared to VO. This increase in VMD indicates that LESS favored the formation of droplets with greater spreading and wetting capacity on the leaf surface. A plausible explanation, consistent with previous studies [13], is that the LESS-based formulation may alter the dynamic surface tension and viscosity of the spray solution, favoring droplet retention and reducing drag from the turbo sprayer airflow, in addition to increasing droplet size, reducing drift potential, and improving penetration [13].
In contrast, vegetable oil (VO), with lower density and viscosity, resulted in higher droplet density but with a smaller average size (reduced VMD). Finer droplets are more susceptible to drift and evaporation, especially in the upper third of the plant, farther from the nozzles and more exposed to the airflow of the equipment. This dynamic explains the lower coverage values associated with VO, despite the high impact density recorded on the water-sensitive paper sheets. The farm standard treatment (high volume + high rate of VO) showed the worst performance, corroborating that simply increasing the volume and the oil adjuvant does not improve the quality of the application.
A crucial point emerges from this analysis: greater coverage (wetted area) does not necessarily translate into greater deposition (amount of active ingredient per unit area). Photographic paper sheets assess the impact pattern, but not the final retention of the product on the leaf. The combination of high volume and VO may have generated broad coverage, but with a high risk of surface runoff, reducing the effective amount of product retained. This phenomenon will be explored in the deposition analysis below.
3.2. Spray Deposition on Leaves
3.2.1. Outer Canopy Region
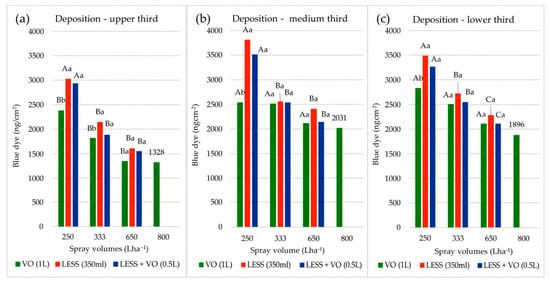
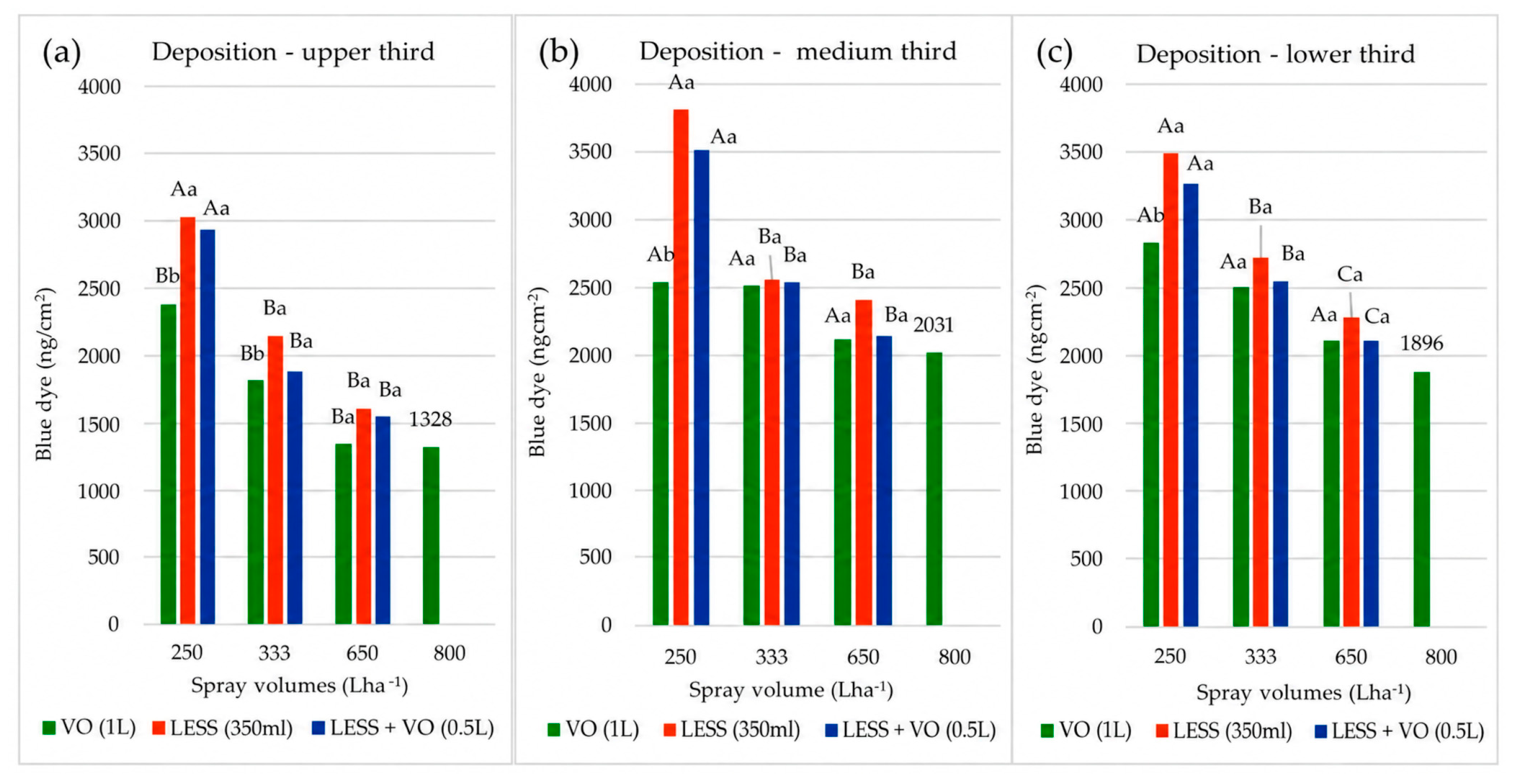
In the outer canopy region, the highest dye deposition was consistently observed with the lowest application volume (250 L ha−1) combined with the LESS adjuvant across all canopy thirds (Figure 3). In the middle third (Figure 3b), this combination resulted in the greatest deposition compared with the other spray volume and adjuvant combinations.
Figure 3.
Amount of dye per leaf area (ng cm−2) in the outer region of coffee plants after application of different spray volumes and adjuvants: (a) upper third; (b) middle third; and (c) lower third. Means followed by the same uppercase letter in the column (adjuvants: VO, LESS, LESS + VO) and the same lowercase letter in the row (spray volumes: 250, 333, 650 and 800 L ha−1) do not differ by the Scott–Knott test at 5% probability. Upper third: CV (%) = 15.25; Pinteraction = 0.0477*; Pspray vol. = 0.0000*; Padjuvants = 0.0028*; Medium third: CV (%) = 11.18; Pinteraction = 0.0176*; Pspray vol = 0.0000*; Lower third: CV (%) = 6.53; Pinteraction = 0.1255ns; Pspray vol = 0.0000*; Padjuvants = 0.0025*; Mean does not differ from the control by the Dunnet test at 5% probability.
This result contrasts with the coverage data in Table 1 and suggests that, although larger volumes create a more extensive “wet patch” (greater coverage), the product concentration is higher when using a smaller dilution volume. The absolute amount of dye (and, by extension, of the pesticide) retained per cm2 of leaf was higher in the lower-volume treatments. This is corroborated by the observation of greater runoff immediately after applications with 650 and 800 L ha−1 combined with VO, where the greater volume of water and lower viscosity promoted product loss to the soil.
The middle (Figure 3b) and lower (Figure 3c) thirds showed a similar pattern, with greater deposition and retention in the lower volumes + LESS adjuvant. The amount of dye deposited was greater in the upper third of the plant because these regions are closer to the spray jet and may also receive some of the runoff from above. In all canopy regions, the treatments with LESS adjuvant did not differ statistically from each other (pure LESS vs. LESS + VO), indicating that the addition of VO did not further increase spray deposition when LESS was used.
This inversion between coverage and deposition parameters is fundamental for application technology in dense foliage perennial crops, such as coffee. Many producers increase the spray volume seeking better penetration, which can lead to excessive runoff [23]. Adjuvants that drastically reduce surface tension, such as pure vegetable oils, can negatively influence the retention of the deposit on coffee leaves [24]. As observed by [25], smaller volumes with appropriate adjuvants can result in a more concentrated spray on the leaves, leading to a greater absolute amount of product, even with a slightly smaller wetted area.
According to [25], the lower spray volume in the presence of fatty acid and vegetable oil adjuvants ensured greater spray deposition on coffee leaves. Although the analysis with photographic paper sheets showed better coverage using an application rate of 500 Lha−1, without adjuvant, in the treatment with 200 Lha−1 + adjuvant, the deposition present on the leaves was more concentrated, resulting in a greater absolute quantity of product. So, depending on the type and concentration of the adjuvant, dye retention on coffee leaves can be three times higher compared to a spray without an adjuvant. Care must be taken to avoid runoff losses during applications in coffee crops, associated with excessive spray volume combined with adjuvant or oils in a tank mix. On the other hand, the use of an adjuvant/surfactant that adequately reduces surface tension can be an important tool in reduced spray volume application programs [19].
3.2.2. Inner Canopy Region
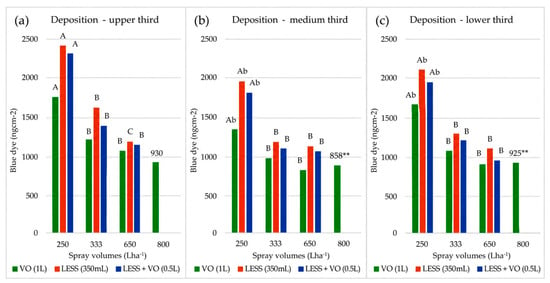
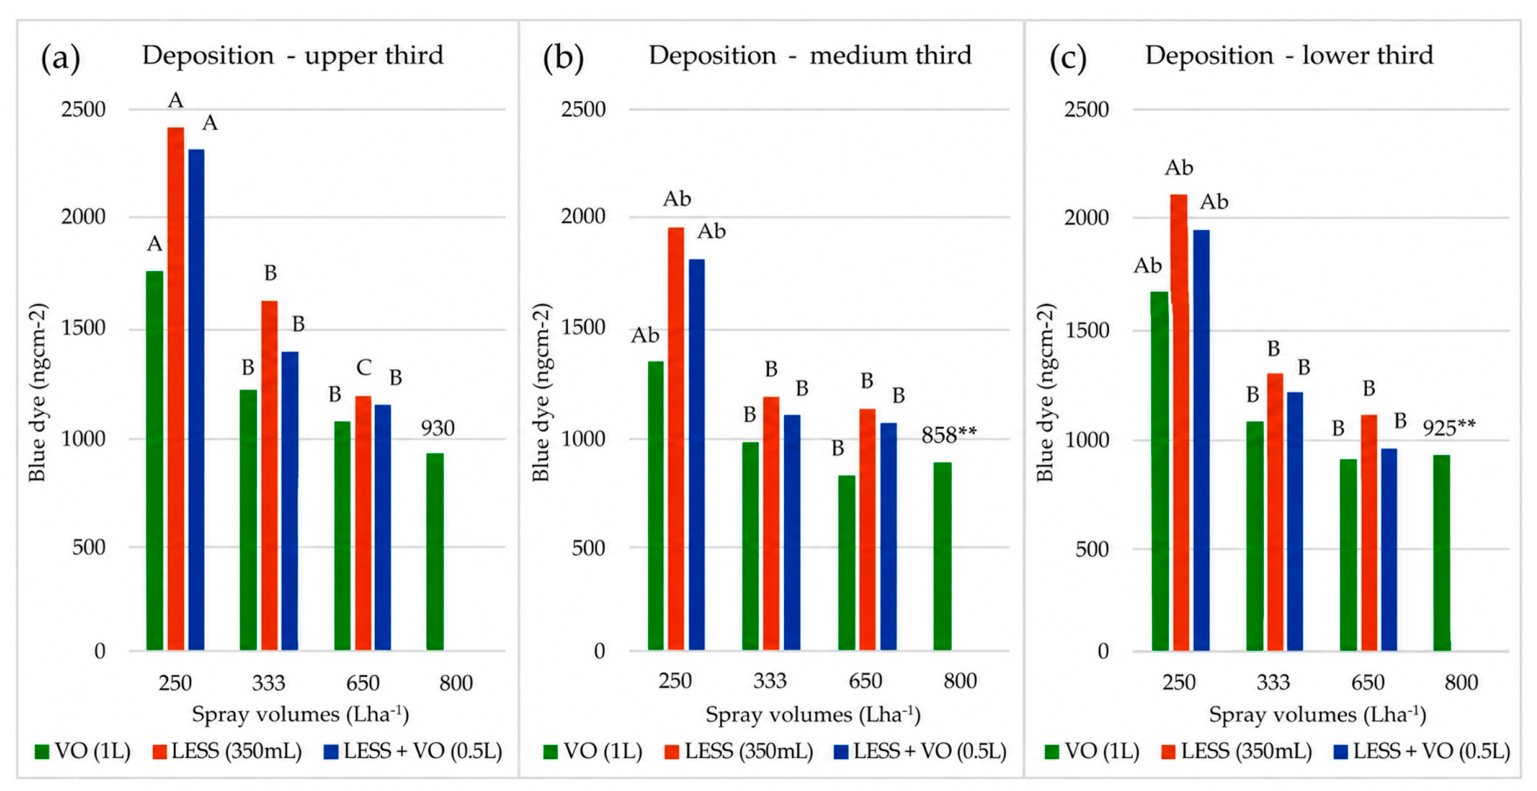
The inner region of the coffee plant received a smaller amount of spray than the outer region, as expected, since outer branches and leaves hinder penetration. Despite this, deposition analysis showed greater dye deposition with lower volumes (250 L ha−1), and the combination of LESS + 0.5 VO promoted the highest efficiency in dye deposition and leaf retention in the upper, middle, and lower inner thirds (Figure 4).
Figure 4.
Amount of dye per leaf area (ng cm−2) in the inner region of coffee plants after application of different spray volumes and adjuvants: (a) upper third; (b) middle third; and (c) lower third. Means followed by the same uppercase letter in the column (adjuvants: VO, LESS, LESS + VO) and the same lowercase letter in the row (spray volumes: 250, 333, 650 and 800 L ha−1) do not differ by the Scott–Knott test at 5% probability. Upper third: CV (%) = 9.73; Pinteraction = 0.0438*; Pspray vol = 0.0000*; Padjuvants = 0.00025*; Medium third: CV (%) = 7.83; Pinteraction = 0.0266*; Pspray vol = 0.0000*; Padjuvants = 0.0000*; Lower third: CV (%) = 13.29; Pinteraction = 0.0158*; Pspray vol = 0.0000*; Padjuvants = 0.0005*; ** Means do not differ from the control by the Dunnett test at 5% probability.
Coffee plants pose challenges for spray penetration due to dense foliage and a high leaf area index [26]. The results of this study are consistent with [14,24], who found that spray deposition generally decreases with increasing application rates and that volumes between 200 and 300 L ha−1 can provide adequate coverage and distribution without compromising quality. High volumes are more expensive and increase the risk of environmental contamination [27].
Coffee plants pose several challenges for application technology, particularly regarding spray penetration into the crop canopy and the reduction of drift [28]. The crop exhibits vegetative development with dense foliage and different biological control targets, each with specific locations. This results, even with the use of systemic products, in the need for applications with deep canopy penetration for control, applications that are often difficult due to the plant’s architecture and large leaf area index [26].
According to [14], spray deposition in the outer canopy of coffee plants, regardless of the third, generally decreased with increasing application rates. Spray volumes of 200 and 300 Lha−1 showed higher spray deposition, indicating the ability to increase leaf coverage. It appears that it is possible to use lower application rates without compromising spray quality and distribution throughout the coffee plant canopy. According to [24], application rates around 400 Lha−1 did not provide any benefits to spray deposition in coffee plants compared to 200 Lha−1, a finding corroborated by the results obtained here. High application rates are costly, as a fraction of the pesticides may reach non-target areas, resulting in inefficient management and a high risk of environmental contamination, which, in turn, jeopardizes operational performance [27].
3.2.3. Integrated Analysis: Canopy Penetration Index and Distribution Uniformity
To better understand spray performance, two key indices were calculated: Canopy Penetration Index (Internal/External deposition ratio) and Vertical Distribution Uniformity (Coefficient of Variation—CV% among thirds, Table 3).
Table 3.
Summary of average external deposition, Canopy Penetration Index, and vertical distribution uniformity (CV).
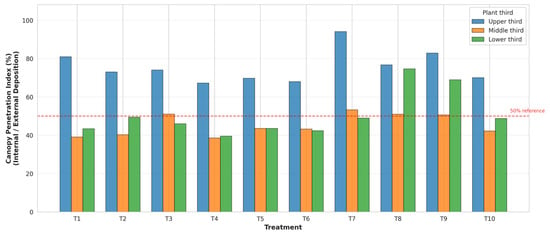
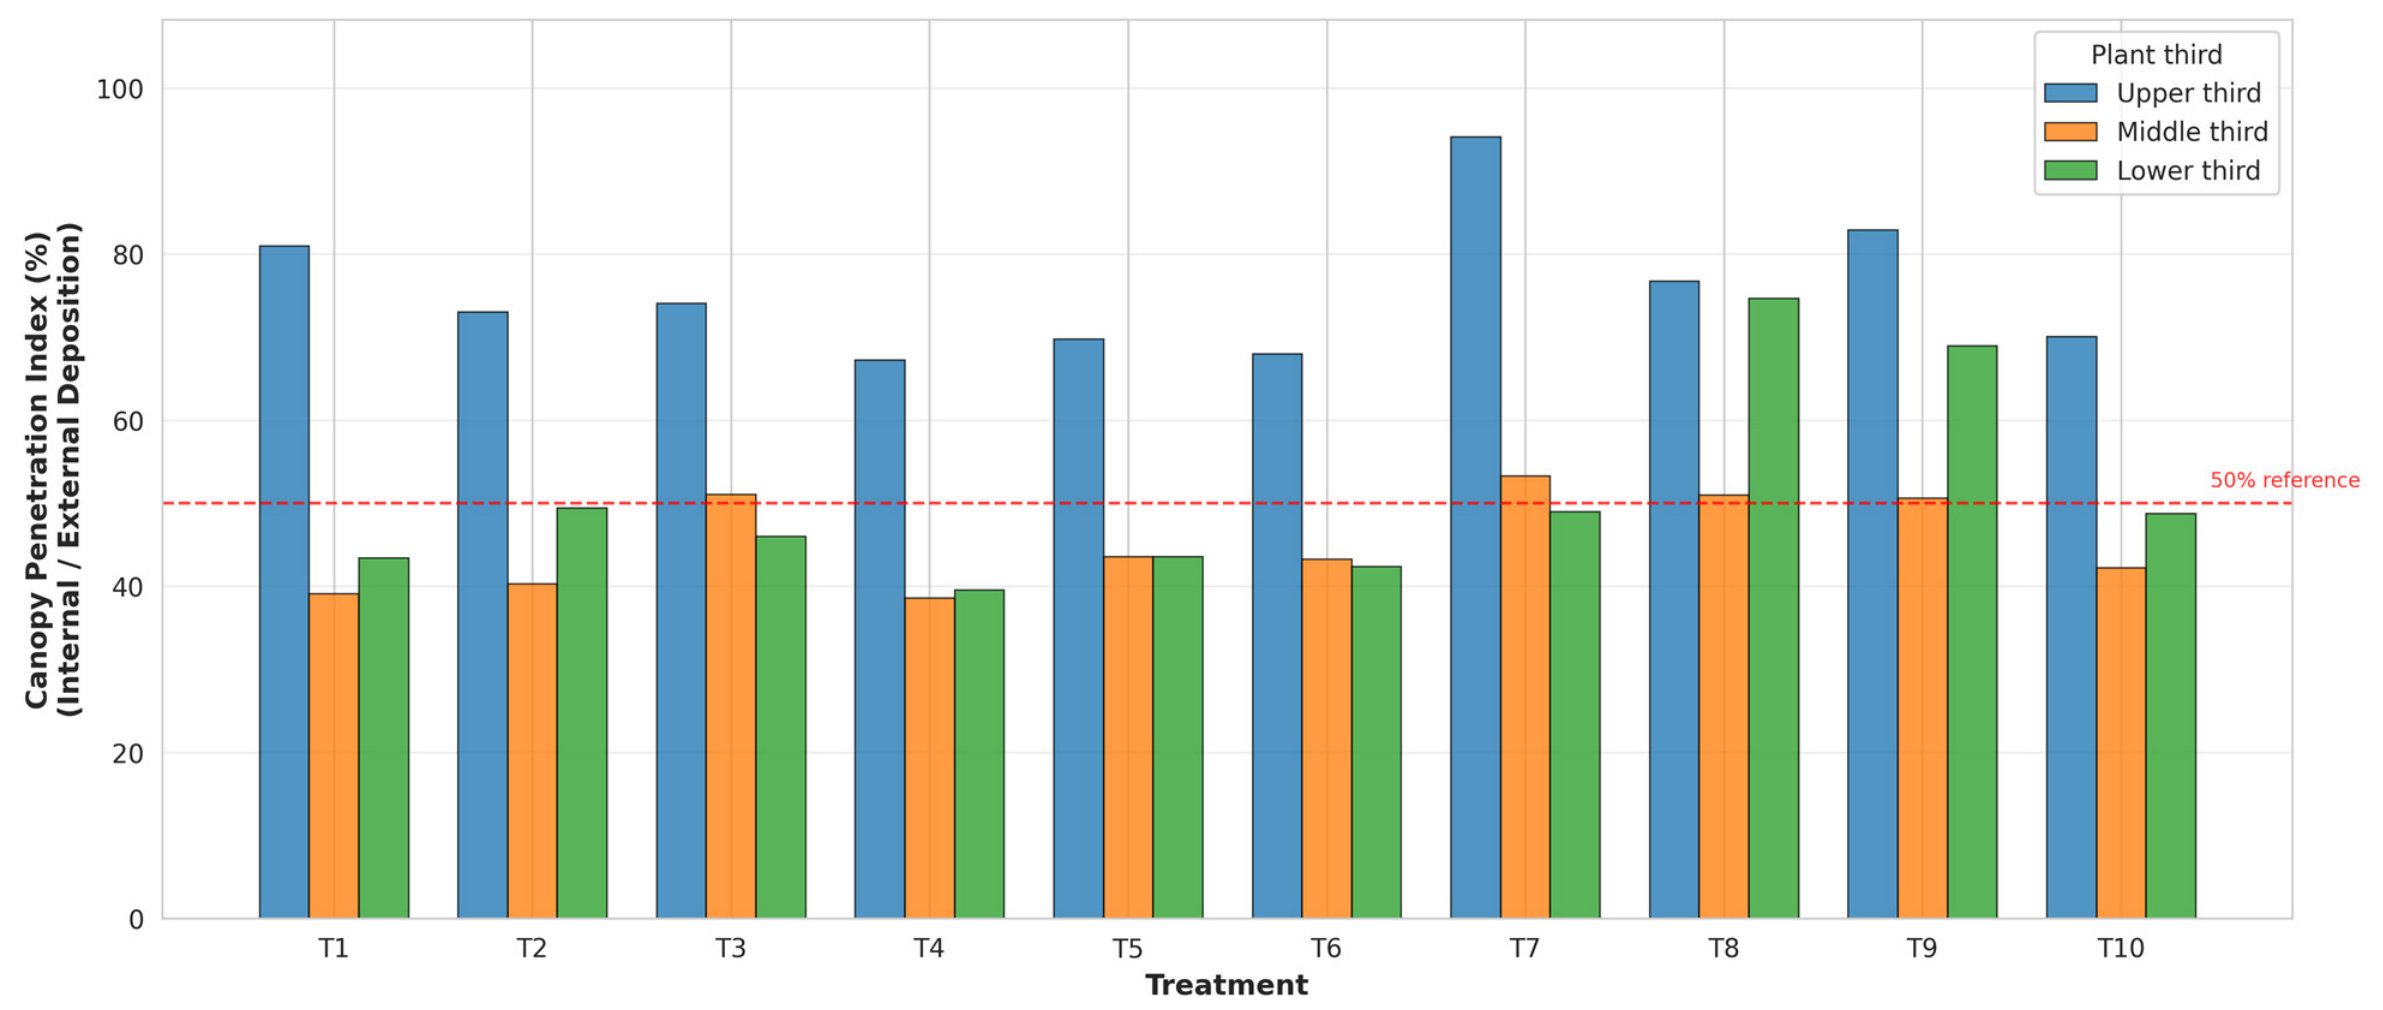
The Canopy Penetration Index (Figure 5) highlights that lower volumes were more efficient at reaching the inner canopy.
Figure 5.
Canopy Penetration Index (Internal/External ratio) by treatment and plant third.
The Canopy Penetration Index (Internal/External) demonstrated that lower application volumes (250 L ha−1), especially when associated with adjuvants, promoted superior internal deposition. Treatment 9 (250 L ha−1 + TA35 + Vegetable Oil) achieved the highest index (83.9%), indicating that the combination of a low volume with adjuvants that modify the droplet spectrum and surface tension favors product penetration into the dense architecture of the crop. This result corroborates recent studies that associate the optimization of the droplet spectrum (generating particles with balanced size and kinetic energy) with greater deposition efficiency in the inner canopy, reducing the physical barrier effect of surface foliage [9,29]. The smaller volume, when well-adjusted, seems to prevent surface runoff and enhance penetration, especially with adjuvants that reduce surface tension and improve adhesion.
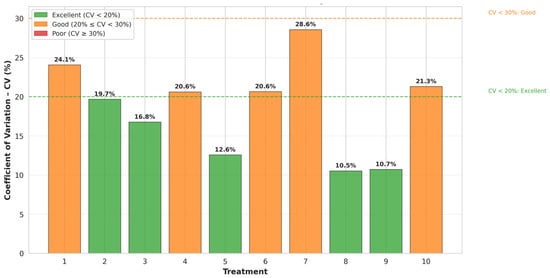
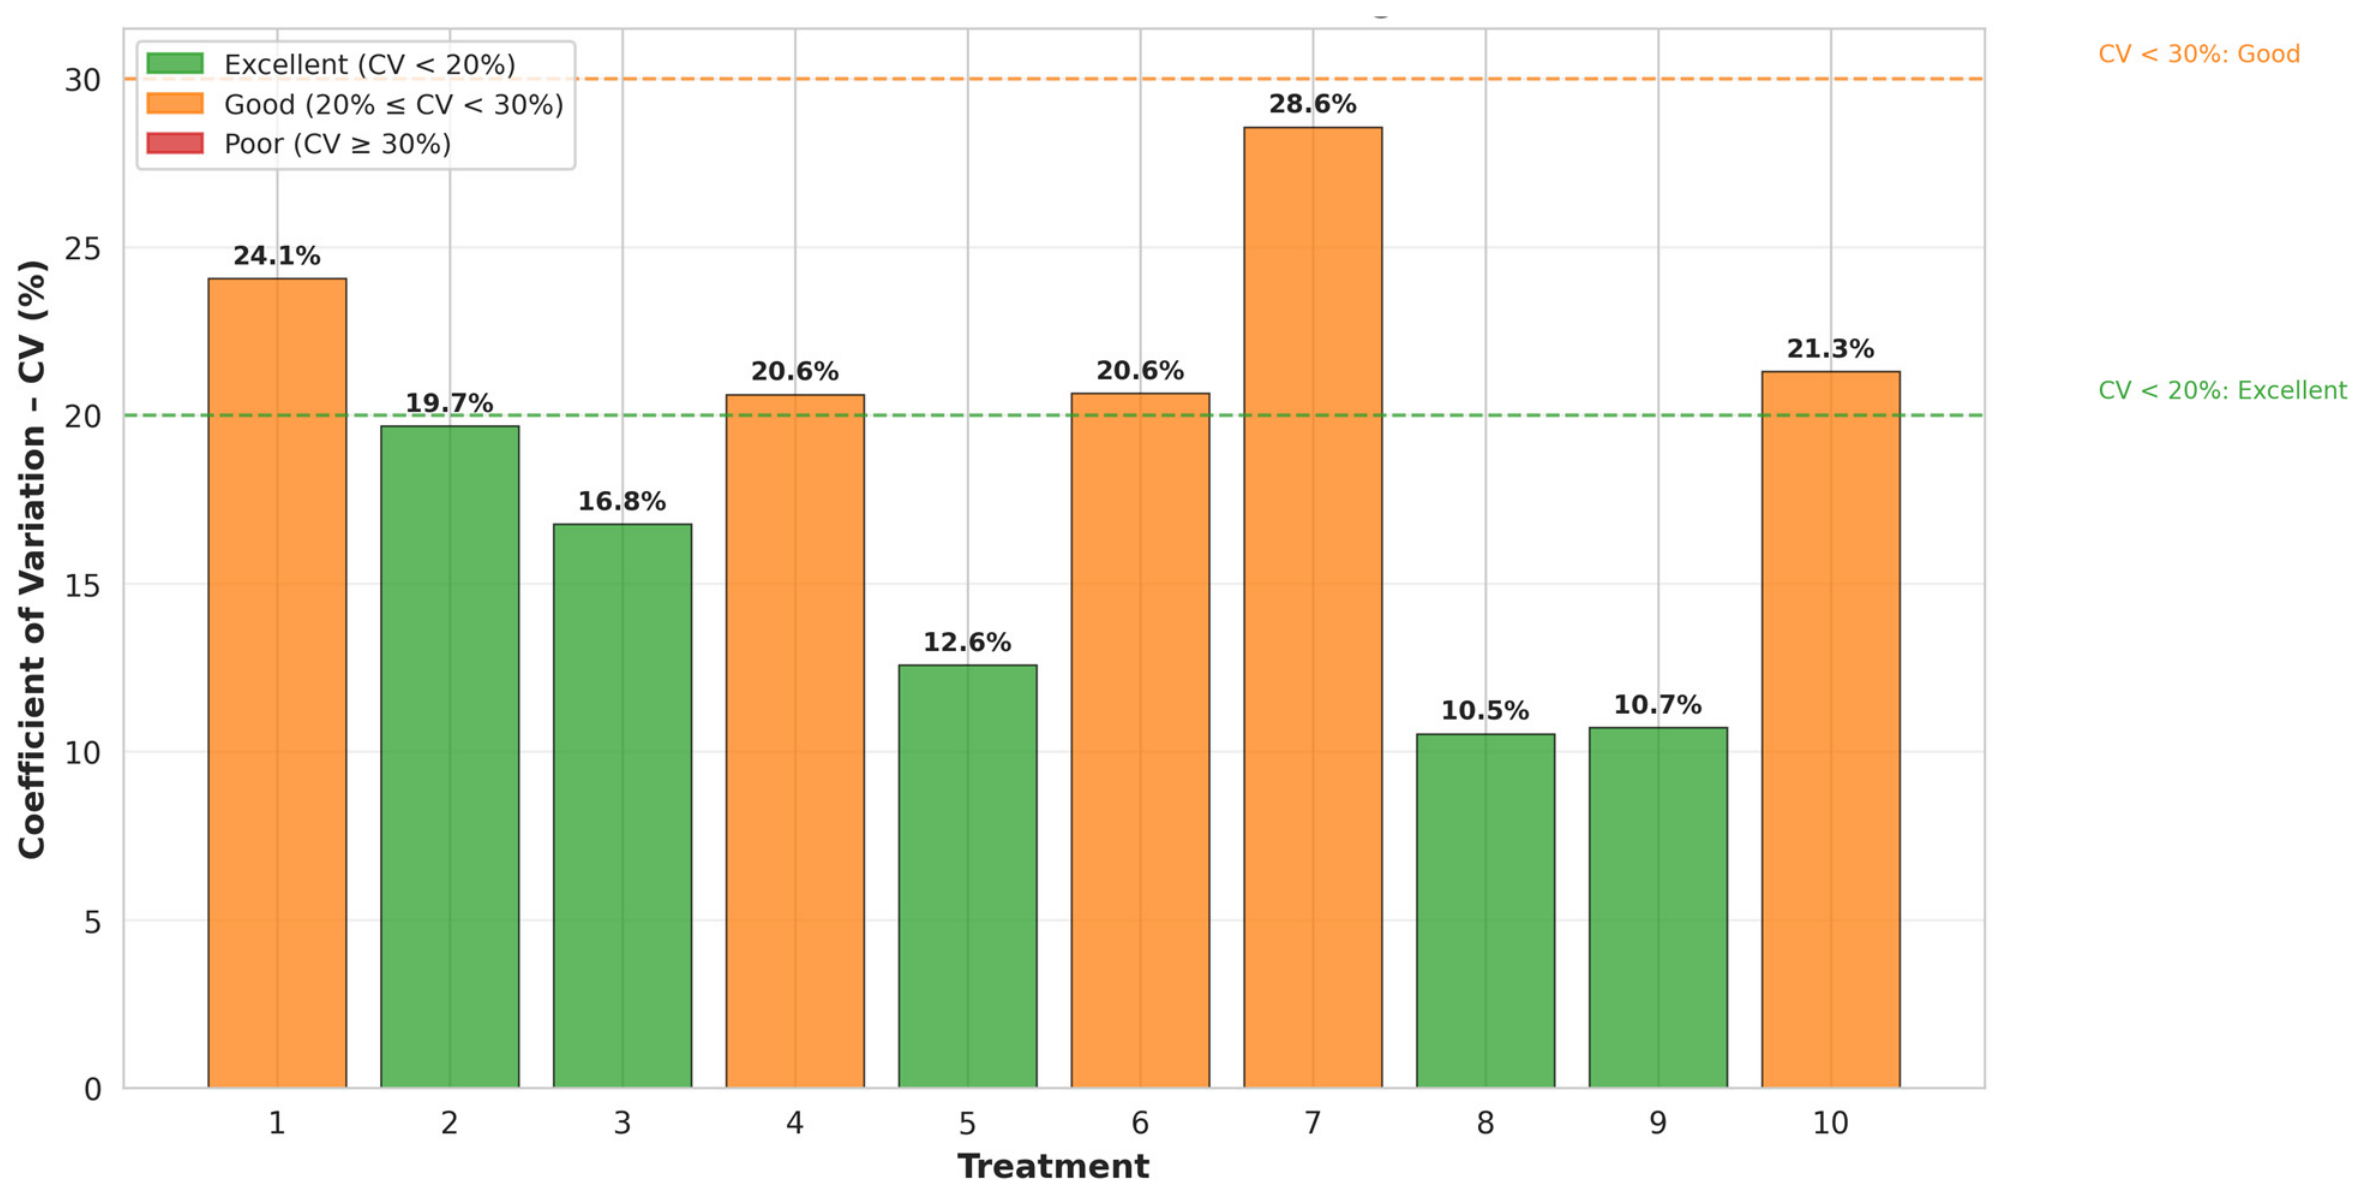
The uniformity of vertical distribution, measured by the Coefficient of Variation (CV%), showed great variation among treatments (Figure 6).
Figure 6.
Vertical distribution uniformity of deposition. Coefficient of Variation (CV%) measures homogeneity among plant thirds.
Regarding Vertical Distribution Uniformity (Figure 6), Treatment 8 (250 L ha−1 + LESS) obtained the best uniformity (CV = 10.5%), while formulations with vegetable oil (VO), such as treatment 7, tended towards greater heterogeneity (CV > 30%). This suggests that the surfactant-type adjuvant (LESS) promoted a more balanced distribution of the product among the upper, middle, and lower thirds of the plant. Similar results were reported by [30], who observed that adjuvants with spreading and retention properties can mitigate the tendency for preferential deposition on the upper leaves, favoring coverage of the middle and lower strata. On the other hand, the greater irregularity associated with some vegetable oil treatments may be related to an alteration in the dynamics of droplet deposition, possibly increasing drift or capture in the upper canopy, as discussed by [31]. Uniform distribution is critical for integrated pest and disease management, ensuring that all plant strata receive an adequate protective rate [32].
3.3. Disease Control Efficacy
Cercosporin Leaf Spot Control
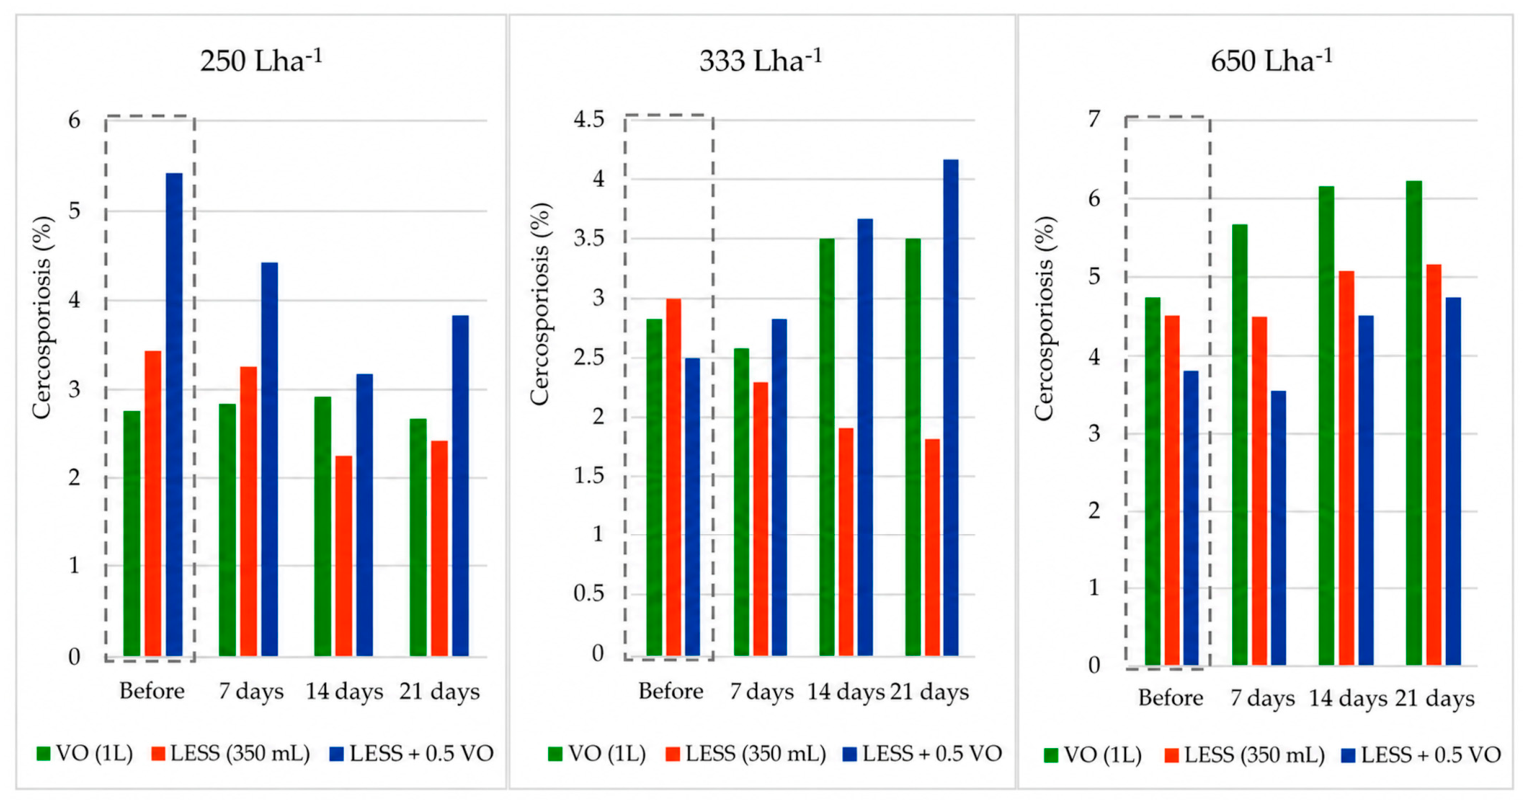
Cercospora infestation and severity decreased 7 days after application (DAA), when using the lowest spray volumes (Table 4).
Table 4.
Percentage of Cercospora leaf spot infestation (%) on coffee leaves after the application of different spray volumes and adjuvants.
The interaction between spray volume and adjuvant type significantly affected Cercospora leaf spot severity at 7, 14, and 21 days after application (DAA) (p < 0.0001). Before application, no consistent differences were observed among treatments, indicating uniform initial disease levels.
At 7 DAA, treatments applied with reduced volumes (333 and 250 L ha−1) showed lower disease severity compared to higher volumes (650 L ha−1 and 800 L ha−1 + 2× VO), regardless of the adjuvant used. Among these, the use of the LESS adjuvant at 333 L ha−1 resulted in the lowest severity values, indicating greater initial spray efficiency, possibly related to improved droplet deposition and retention, as described by [33].
At 14 DAA, the treatment with LESS + 250 L ha−1 provided one of the highest levels of Cercospora control, being statistically similar to the treatment with LESS + 0.5% VO. The superiority of reduced spray volumes became more evident during this period, especially when associated with the LESS adjuvant. In contrast, the treatments applied with 650 L ha−1 and the higher volume associated with 2× VO showed greater symptom progression. Although the addition of VO or LESS + VO at 650 L ha−1 promoted a slight reduction in severity compared to VO alone, these treatments remained less efficient than applications with reduced volumes, a result consistent with losses due to runoff and lower persistence of the spray solution on the leaf surface.
At 21 DAA, LESS applied at 333 L ha−1 maintained the lowest disease severity, demonstrating superior residual control, followed by LESS at 250 L ha−1, which also showed consistent performance. On the other hand, higher spray volumes continued to be associated with greater disease severity, suggesting that increased surface runoff and reduced droplet retention may have limited the fungicide’s persistence on the leaf surface, as discussed by [25].
These results indicate that reducing the spray volume, when combined with the LESS adjuvant, increased spray deposition efficiency and Cercospora leaf spot control over time. The superior performance of LESS at reduced volumes can be attributed, at least in part, to its physicochemical properties, such as intermediate surface tension and higher viscosity compared to vegetable oils. These characteristics favor droplet retention and reduce losses due to drift and runoff, as reported by [34].
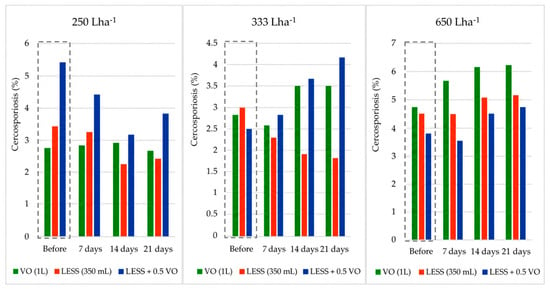
Greater retention of fine droplets is particularly important to ensure effective coverage of complex and partially protected leaf surfaces, ensuring that all canopy strata receive adequate protective doses. Similar results were reported by [35], who observed an increase in droplet density and spray coverage in the cotton canopy after the addition of adjuvants to acetamiprid formulations. Similarly, [36] demonstrated that the addition of adjuvants increased both spray coverage and pesticide deposition in the cotton canopy, reinforcing the role of adjuvants in improving application efficiency. Figure 7 shows the evolution of Cercospora infestation after the application of different spray volumes and adjuvants.
Figure 7.
Evolution of Cercospora infestation in coffee leaves after application of different volumes of spray and adjuvants.
3.4. Coffee Leaf Rust Control
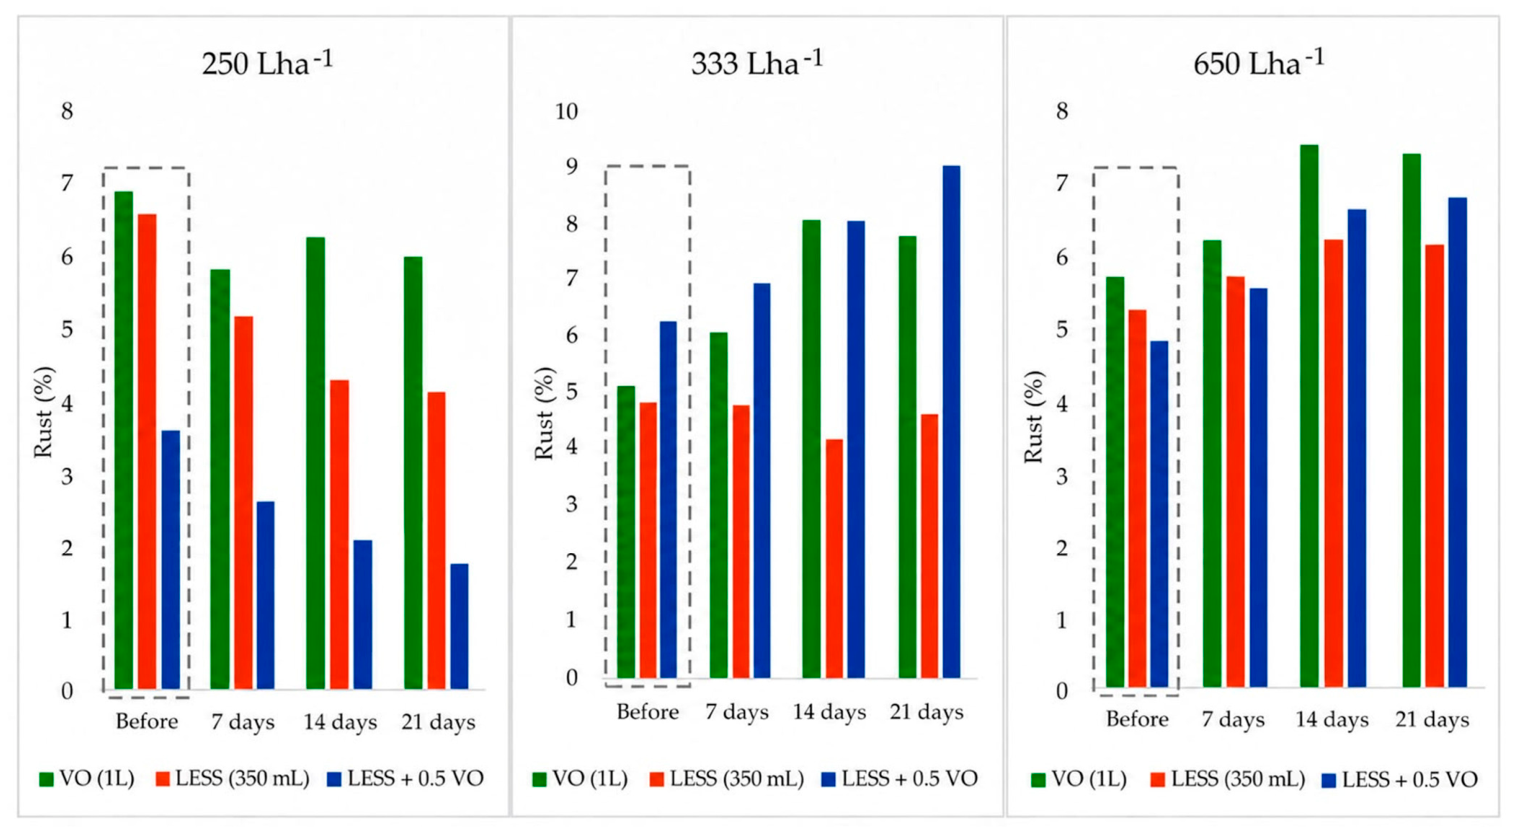
Data analysis revealed a reduction in rust infestation starting 7 days after application (DAA) with lower spray volumes (Table 5). At this evaluation time, the interaction between spray volume and adjuvant type was significant (P interaction < 0.05), demonstrating that disease control depended on the combined effect of these factors rather than on spray volume alone.
Table 5.
Percentage of coffee leaf rust (H. vastatrix) infestation (%) on coffee leaves after application of different spray volumes and adjuvants.
At 14 and 21 DAA, the combination of the LESS adjuvant + 0.5 OV with a spray volume of 250 L ha−1 reduced rust infestation, showing the lowest percentages of infected leaves in all evaluation periods. This result highlights the efficiency of reduced spray volumes when associated with appropriate adjuvant technology, suggesting better deposition, coverage, and retention of the spray solution on coffee leaves.
In contrast, disease progression was more pronounced in the untreated control and in the treatment with the highest spray volume (800 L ha−1) combined with twice the dose of OV (2× VO). These treatments showed a continuous increase in rust infestation up to 21 DAA (days after application), indicating that increasing the spray volume alone does not necessarily improve disease control and may even compromise application efficiency, contrary to the common understanding that a larger liquid volume results in better application quality. Excessive spray volumes can increase surface runoff and reduce the effective retention of the fungicide on the leaf surface, thus decreasing control efficacy. Therefore, the correct procedure is to use a low volume while producing the largest possible number of droplets, especially in crops with high leaf density, as occurs in coffee plants [37].
The superior performance of LESS can be attributed to its physicochemical properties, which include reduced drift, optimized surface tension (minimizing runoff losses), increased wettability, and increased droplet mass. These characteristics improve spray retention and distribution on the target surface, especially with lower spray volumes, leading to greater fungicide efficacy against coffee rust [38,39].
On the other hand, treatments with higher spray volumes (650 L ha−1) combined with VO or LESS alone were less effective in suppressing disease symptoms, particularly after 14 DAA. This period coincided with environmental conditions more favorable to rust development, including increased rainfall and higher temperatures recorded in the experimental area. These conditions likely accelerated infection and sporulation of the pathogen, emphasizing the importance of efficient spraying technology to maintain disease suppression under high disease pressure.
The results of this study are consistent with those reported by [40] who demonstrated that adjuvants with non-ionic surfactant properties can improve fungicide performance and provide disease control comparable to QoI fungicides, such as azoxystrobin, in reducing white rust in spinach. Similarly, the results presented here indicate that the appropriate selection of adjuvants can optimize fungicide efficacy even with reduced spray volumes.
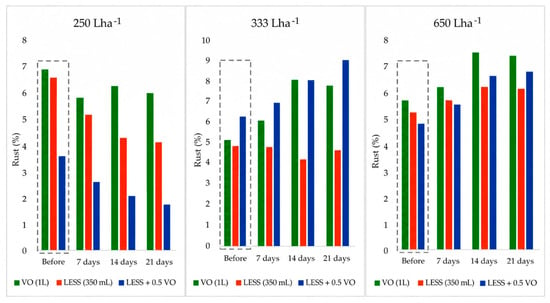
In general, these results demonstrate that the strategic use of adjuvants, particularly LESS, allows for reduced spray volumes without compromising rust control, contributing to more efficient, economical, and environmentally sustainable disease management in coffee plantations. Figure 8 shows the evolution of rust infestation after the application of different spray volumes and adjuvants.
Figure 8.
Evolution of rust infestation (%) on coffee leaves after application of different volumes of spray and adjuvants.
3.5. Integrated Efficacy Analysis
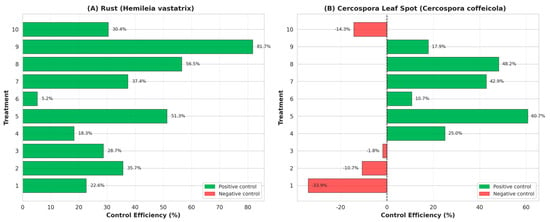
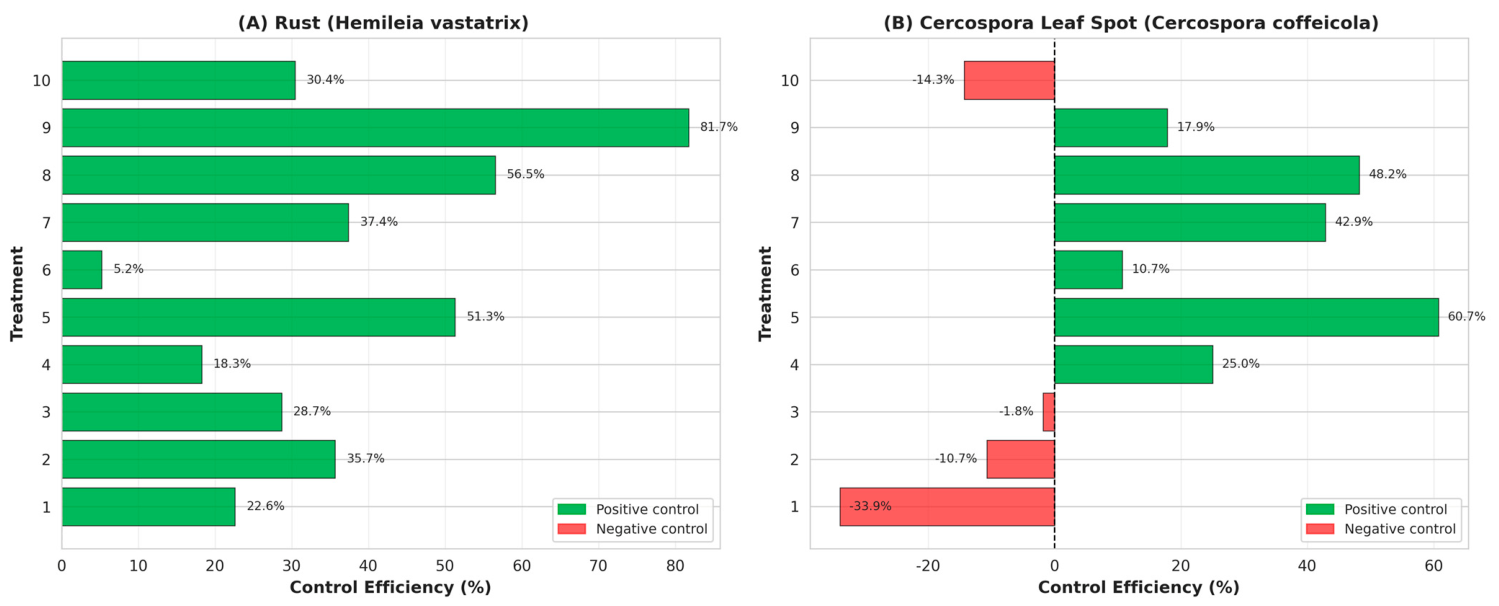
Figure 9 summarizes the control efficacy of treatments against rust and Cercospora at 21 days after application (DAA).
Figure 9.
Efficacy of rust and Cercospora control at 21 DAA. Efficacy was calculated using Abbott’s formula, comparing disease severity in treatments with unsprayed control.
At 21 DAA, the best treatment differed between diseases. For coffee leaf rust, treatment 9 (250 L ha−1 + LESS + 0.5 VO) showed the highest efficacy against rust (reaching 81.7% control) and the highest Canopy Penetration Index (83.9%). For Cercospora, the best performance was observed with Treatment 5 (333 L ha−1 + LESS), with 60.7% control. This differential response between diseases can be explained by their distinct epidemiological characteristics. Coffee leaf rust (H. vastatrix) develops pustules on the leaf surface, making it more accessible to contact fungicides, whereas Cercospora leaf spot (C. coffeicola) exhibits intra- and intercellular development, requiring greater product penetration to achieve effective control [4]. Treatments based exclusively on VO resulted in negative efficacy values for Cercospora (down to −14.3%), indicating disease progression greater than that observed in the untreated control. This paradoxical response may be associated with unfavorable physicochemical alterations promoted by VO, such as an excessive reduction in surface tension leading to spray runoff, or potential changes in the leaf cuticle that may create microenvironments conducive to infection [9].
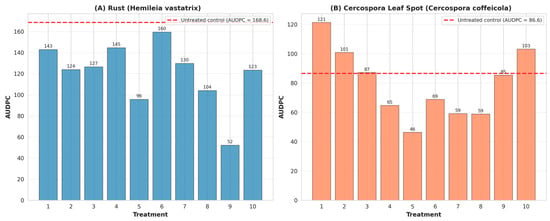
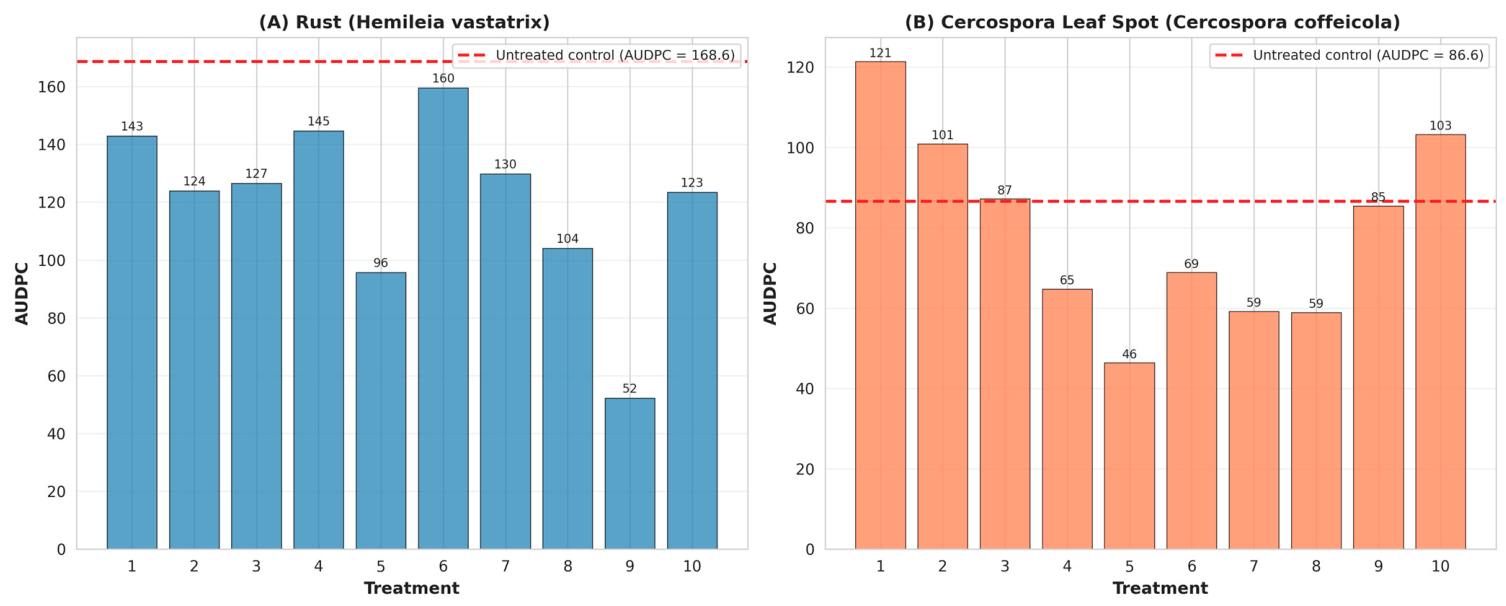
Figure 10 presents the Area Under the Disease Progress Curve (AUDPC), which integrates disease severity over time and provides a robust assessment of residual control.
Figure 10.
Area Under the Disease Progress Curve (AUDPC). The AUDPC represents the cumulative disease pressure over 21 days; lower values indicate more effective and sustained disease control.
Treatments that showed higher efficacy at 21 DAA also resulted in lower AUDPC values, confirming greater durability of disease suppression. Treatment 9 exhibited the lowest AUDPC for rust, corresponding to a 69% reduction relative to the control, demonstrating strong and persistent suppression of disease development throughout the evaluation period. This prolonged control is consistent with the higher values of internal spray deposition and penetration index observed for this treatment (Table 2), reinforcing the importance of effective product retention in protected regions of the coffee canopy. Similar mechanisms have been reported for tank-mix adjuvants that modify the physicochemical properties of spray solutions, reduce dynamic surface tension, inhibit droplet rebound, and improve wetting and spreading on leaf surfaces, ultimately resulting in higher pesticide deposition [40].
Beyond punctual and cumulative efficacy, the relationship between application quality and disease control was further explored through correlation analysis. A strong and significant negative correlation was observed between spray deposition and rust AUDPC (ρ = −0.75; p = 0.012), indicating that greater spray retention within the canopy directly translates into reduced disease progress. This finding supports a fundamental agronomic principle: efficient deposition enhances phytosanitary performance [28]. This relationship is consistent with previous studies showing that physicochemical modifications of the spray solution promoted by tank-mix adjuvants—such as reduced surface tension and increased viscosity—optimize droplet size distribution, improve deposition uniformity and penetration, reduce drift, and ultimately enhance biological efficacy [40,41]. This relationship is particularly relevant for coffee crops, whose dense canopy architecture represents a persistent challenge for spray penetration and uniform deposition [42].
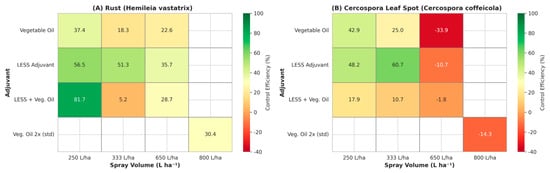
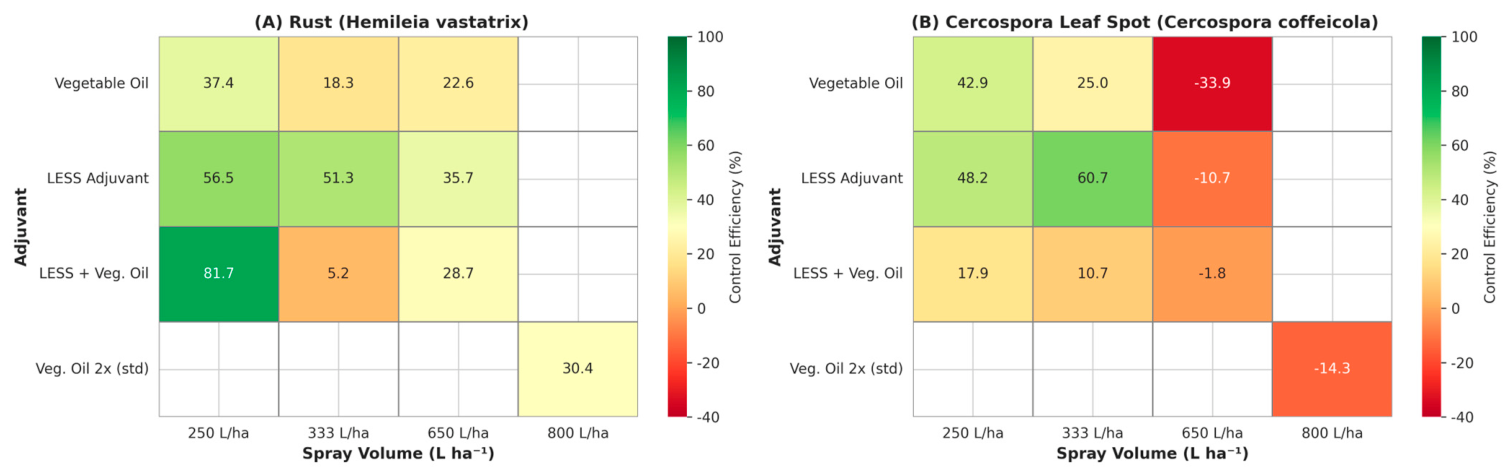
To synthesize and visually evaluate the interaction between spray volume and adjuvant type, a heatmap analysis was performed (Figure 11).
Figure 11.
Heatmap of the interaction between spray volume and adjuvant on control efficacy. Green shades indicate high efficacy, whereas red shades indicate low or no efficacy.
The heatmap reveals a distinct “high-performance block”, formed by the combination of low spray volume (250 L ha−1) with LESS or LESS + VO, particularly for rust control. Conversely, high spray volumes (650–800 L ha−1) associated exclusively with VO consistently resulted in low efficacy, forming a “low-performance block.” This integrative visualization demonstrates that optimal disease control is achieved through synergistic interactions between reduced spray volume and appropriate adjuvant selection, rather than through isolated adjustments of either factor.
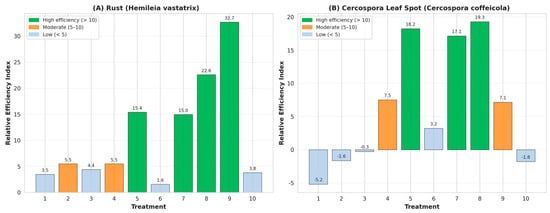
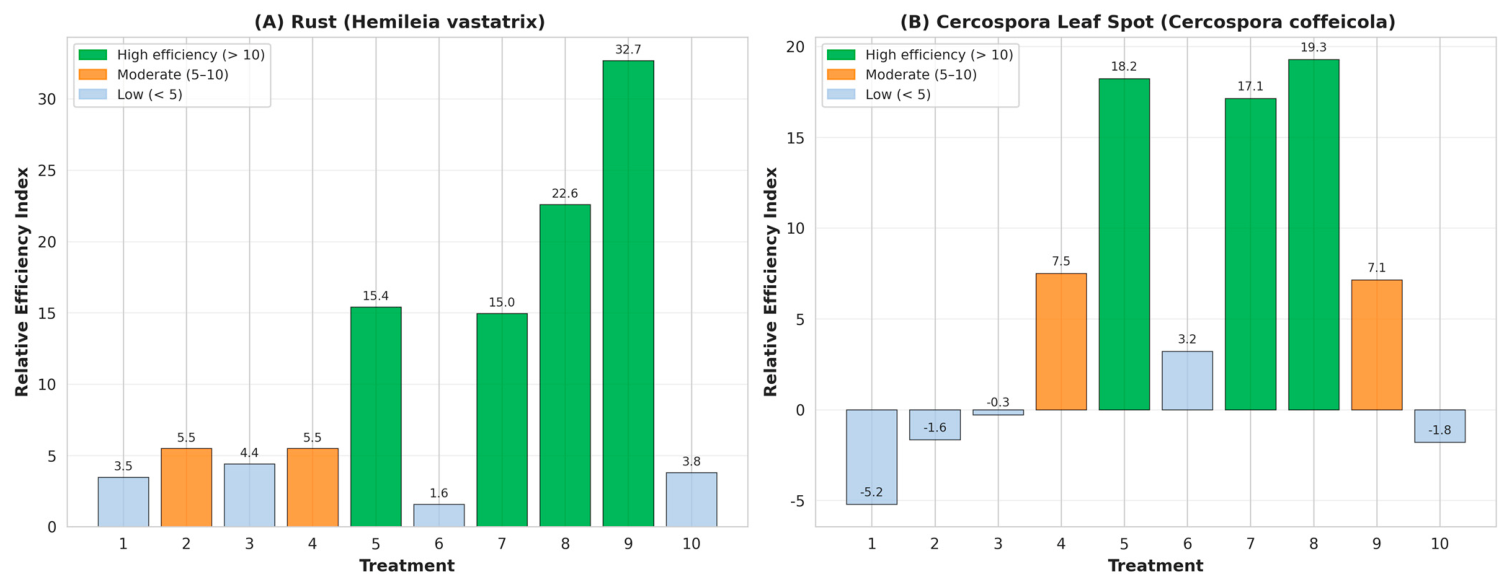
From an operational and economic perspective, the relative efficiency analysis (Figure 12) highlights the practical implications of these findings.
Figure 12.
Relative efficiency of treatments. The index expresses disease control efficacy per liter of spray volume, highlighting the most cost-effective strategies.
Lower spray volumes, particularly 250 L ha−1, showed markedly higher relative efficiency. Treatment 9 stood out as the most efficient option for rust control per liter of spray solution applied, while Treatment 8 exhibited the highest efficiency against Cercospora. Considering the 68.75% reduction in spray volume (from 800 to 250 L ha−1) combined with increased or maintained efficacy, these results indicate substantial potential for operational optimization, including reduced water and energy consumption, shorter application times, and lower overall application costs.
Overall, the integrated analysis demonstrates that spray deposition quality and formulation strategy are more critical than spray volume alone for effective disease control in coffee. The superior performance of LESS, particularly at reduced volumes, highlights its role in improving spray deposition, enhancing disease suppression over time, and increasing operational efficiency. Conversely, the inconsistent or negative performance of VO-based treatments, especially against Cercospora, underscores the importance of selecting adjuvants that are compatible with both the target disease and the application strategy.
4. Conclusions
The LESS adjuvant promoted greater droplet coverage and spreading on the evaluated targets, increasing the wetted area and product retention. The LESS + 0.5 VO formulation performed better in coverage, spreading, and leaf wetness than the application of vegetable oil alone, indicating that reduced vegetable oil doses combined with a high-performance adjuvant are more favorable for application quality and control efficacy.
The 250 L ha−1 rate provided greater spray deposition in the upper, middle and lower thirds of the outer canopy compared with higher rates, which promoted greater runoff, soil losses and potential drift.
The Canopy Penetration Index reached 83.9% for the 250 L ha−1 + LESS + VO treatment (Treatment 9), the highest among all treatments, while the best vertical uniformity was obtained with 250 L ha−1 + LESS (Treatment 8; CV = 10.5%), compared with CV > 30% for vegetable oil-based treatments.
Regarding disease control at 21 DAA, the optimal treatment differed between diseases. For coffee leaf rust, Treatment 9 (250 L ha−1 + LESS + 0.5 VO) showed the highest efficacy (81.7% control; AUDPC = 52, a 69% reduction relative to the untreated control). For brown eye spot, Treatment 5 (333 L ha−1 + LESS) showed the highest efficacy (60.7% control; AUDPC = 59). Treatments based exclusively on vegetable oil resulted in negative efficacy values for brown eye spot (down to −14.3%), indicating disease progression greater than in the untreated control. A strong negative correlation was found between spray deposition and rust AUDPC (ρ = −0.75; p = 0.012), confirming that greater spray retention within the canopy directly reduces disease progress.
Considering the 68.75% reduction in spray volume (from 800 to 250 L ha−1) combined with maintained or increased efficacy, these results demonstrate that it is possible to optimize coffee applications by using lower spray volumes associated with high-performance adjuvants. However, the optimal treatment is disease-specific: 250 L ha−1 + LESS + 0.5 VO for coffee leaf rust, and 333 L ha−1 + LESS for brown eye spot. This disease-specific response should be considered in the design of phytosanitary management programs for coffee, and future studies should combine direct physicochemical characterization with multi-location field trials to confirm and extend these findings.
Author Contributions
Conceptualization, S.M.S., A.C.Q.M. and A.P.d.S.; methodology, S.M.S., A.P.d.S., A.C.Q.M., and L.S.S.; software, S.M.S. and A.A.P.; validation, S.M.S., L.S.S., J.M.d.S. and A.A.P.; formal analysis, S.M.S., A.A.P. and L.S.S.; investigation, S.M.S., L.S.S., A.B.E. and J.M.d.S.; resources, A.P., D.S. and G.R.; data curation, S.M.S., A.P.d.S., A.A.P., L.S.S., A.B.E. and J.M.d.S.; writing—original draft preparation, S.M.S.; writing—review and editing, S.M.S., L.S.S., J.M.d.S., D.S., A.P. and G.R.; visualization, S.M.S.; supervision, S.M.S., L.S.S., A.P., D.S. and G.R.; project administration, S.M.S., L.S.S. and A.P.; funding acquisition, A.P., D.S. and G.R. All authors have read and agreed to the published version of the manuscript.
Funding
This research received no external funding.
Data Availability Statement
The dataset is available upon request from the authors. The data collected by our team for the research can be requested by other researchers for both primary and secondary studies. There are no restrictions on data sharing.
Acknowledgments
The authors acknowledge the technical support provided by the Institute of Agricultural Sciences (ICA) of the Federal University of Jequitinhonha and Vale do Mucuri (UFVJM) for the laboratory facilities and the Conquista Farm, which allowed access to the experimental farm; Inquima for the adjuvants and experimental products; and the Department of Agriculture, Environment, Food and Forests (DAGRI), Biosystems Engineering Division, of the University of Florence (UniFI).
Conflicts of Interest
The author Amanda Cristiane Queiroz Motta was employed by the company Inquima, Unai, Brazil. The remaining authors declare that the research was conducted in the absence of any commercial or financial relationships that could be construed as a potential conflict of interest.
References
- Companhia Nacional de Abastecimento—CONAB. Acompanhamento da Safra Brasileira de Café, Safra 2024/25, 12° Levantamento. Brasília, DF, Brazil, 2025. Available online: https://www.gov.br/conab/pt-br/atuacao/informacoes-agropecuarias/safras/safra-de-graos/boletim-da-safra-de-graos/12o-levantamento-safra-2024-25/12o-levantamento-safra-2024-25 (accessed on 4 October 2026).
- Cristancho, M.A.; Rozo, Y.; Escobar, C.; Rivillas, C.A.; Gaitán, A.L. Outbreak of coffee leaf rust (Hemileia vastatrix) in Colombia. New Dis. Rep. 2012, 25, 19. [Google Scholar] [CrossRef] [Scilit]
- Karthik, R.; Alfred, J.J.; Kennedy, J.J. Inception-based global context attention network for the classification of coffee leaf diseases. Ecol. Inform. 2023, 77, 102213. [Google Scholar] [CrossRef] [Scilit]
- Sera, G.H.; de Carvalho, C.H.S.; Abrahão, J.C.d.R.; Pozza, E.A.; Matiello, J.B.; de Almeida, S.R.; Bartelega, L.; Botelho, D.M.d.S. Coffee leaf rust in Brazil: Historical events, current situation, and control measures. Agronomy 2022, 12, 496. [Google Scholar] [CrossRef] [Scilit]
- Rhiney, K.; Guido, Z.; Knudson, C.; Avelino, J.; Bacon, C.M.; Leclerc, G.; Aime, M.C.; Bebber, D.P. Epidemics and the future of coffee production. Proc. Natl. Acad. Sci. USA 2021, 118, 27. [Google Scholar] [CrossRef] [Scilit] [PubMed]
- Aristizábal, L.F.; Johnson, M.; Shriner, S.; Hollingsworth, R.; Manoukis, N.C.; Myers, R.; Bayman, P.; Arthurs, S.P. Integrated pest management of coffee berry borer in Hawaii and Puerto Rico: Current status and prospects. Insects 2017, 8, e123. [Google Scholar] [CrossRef] [Scilit] [PubMed]
- Sinha, R.; Ranjan, R.; Khot, L.R.; Hoheisel, G.-A.; Grieshop, M.J. Comparison of within canopy deposition for a solid set canopy delivery system (SSCDS) and an axial-fan airblast sprayer in a vineyard. Crop Prot. 2020, 132, e105124. [Google Scholar] [CrossRef] [Scilit]
- Hu, H.; Kaizu, Y.; Huang, J.; Furuhashi, K.; Zhang, H.; Li, M.; Imou, K. Research on methods decreasing pesticide waste based on plant protection unmanned aerial vehicles: A review. Front. Plant Sci. 2022, 13, 811256. [Google Scholar] [CrossRef] [Scilit] [PubMed]
- Tavares, R.M.; da Cunha, J.P.A.R. Pesticide and adjuvant mixture impacts on the physical–chemical properties, droplet spectrum, and absorption of spray applied in soybean crop. AgriEngineering 2023, 5, 646–659. [Google Scholar] [CrossRef] [Scilit]
- Wang, B.; Geng, Z.; Pan, B.; Jiang, L.; Lin, Y. Effect of Vegetable Oil Adjuvant on Wetting, Drift, and Deposition of Pesticide Droplets from UAV Sprayers on Litchi Leaves. Agronomy 2025, 15, 293. [Google Scholar] [CrossRef] [Scilit]
- Zwertvaegher, I.K.; Verhaeghe, M.; Brusselman, E.; Verboven, P.; Lebeau, F.; Massinon, M.; Nicolaï, B.M.; Nuyttens, D. The impact and retention of spray droplets on a horizontal hydrophobic surface. Biosyst. Eng. 2014, 126, 82–91. [Google Scholar] [CrossRef] [Scilit]
- Widyaningtyas, S.; Drelich, A.; Pezron, I. Interfacial Properties and Foamability of Amphiphilic Molecules. IPTEK J. Proc. Ser. 2016, 2, 1. [Google Scholar]
- Zhu, Y.; Gao, Y.; Zhang, C.; Zhao, X.; Ma, Y.; Du, F. Static and dynamic wetting behavior of TX-100 solution on superhydrophobic rice (Oryza sativa L.) leaf surfaces. Colloids Surf. A Physicochem. Eng. Asp. 2018, 547, 148–156. [Google Scholar] [CrossRef] [Scilit]
- Alves, T.C.; Cunha, J.P.A.R.; Alves, G.S.; Silva, S.M.; Lemes, E.M. Canopy volume and application rate interaction on spray deposition for different phenological stages of coffee crop. Coffee Sci. 2020, 15, e151777. [Google Scholar]
- Cunha, J.P.A.R.d.; Lopes, L.d.L.; Alvarenga, C.B.d. Chemical Control of Coffee Berry Borer Using Unmanned Aerial Vehicle under Different Operating Conditions. AgriEngineering 2024, 6, 1639–1648. [Google Scholar] [CrossRef] [Scilit]
- Marques Filho, A.C.; Santana, L.S.; Ferraz, G.A.e.S.; Faria, R.d.O.; Saka, A.J.; da Silva, J.M.; Santana, M.S.; Rafael, H.C.; Evaristo, A.B.; Silva, S.M.; et al. Remotely Piloted Aircraft Spraying in Coffee Cultivation: Effects of Two Spraying Systems on Drop Deposition. AgriEngineering 2025, 7, 379. [Google Scholar] [CrossRef] [Scilit]
- Rodrigues, A.V.; Pelegrini, G.; Ferreira, M.C. Comparative efficacy of low-volume remotely piloted aircraft spraying with adjuvants for coffee berry borer control. Braz. J. Agric. Environ. Eng. 2026, 30, e291970. [Google Scholar] [CrossRef] [Scilit]
- Marubayashi, R.Y.P.; Oliveira, R.B.d.; Ferreira, M.d.C.; Roggia, S.; Moraes, E.D.d.; Saab, O.J.G.A. Insecticide spray drift reduction with different adjuvants and spray nozzles. Rev. Bras. Eng. Agrícola Ambient. 2021, 25, 282–287. [Google Scholar] [CrossRef] [Scilit]
- Cação, J.E.C.R.; Moreira, B.R.A.; Raetano, C.G.; Carvalho, F.K.; Prado, E.P. Spray retention on coffee leaves associated with type and concentration of adjuvants. Eng. Agríc. 2019, 39, 623–629. [Google Scholar] [CrossRef] [Scilit]
- Pessoa, M.C.P.Y.; Chaim, A. Programa computacional para estimativa de perdas de herbicidas aplicados por pulverização aérea. Pesqui. Agropecuária Bras. Brasília 1999, 34, 45–56. [Google Scholar] [CrossRef] [Scilit]
- Capucho, A.S.; Zambolim, L.; Duarte, H.S.S.; Vaz, G.R.O. Development and validation of a standard area diagram set to estimate severity of leaf rust in Coffea arabica and C. canephora. Plant Pathol. 2011, 60, 1144–1150. [Google Scholar] [CrossRef] [Scilit]
- Custódio, A.A.d.P.; Pozza, E.A.; Guimarães, S.d.S.C.; Koshikumo, É.S.M.; Hoyos, J.M.A.; De Souza, P.E. Comparison and validation of diagrammatic scales for brown eye spots in coffee tree leaves. Ciência Agrotecnologia 2011, 35, 1067–1076. [Google Scholar] [CrossRef] [Scilit]
- Decaro, S.T., Jr.; Ferreira, M.C.; Lasmar, O.; Fouquet, G. Reducing spray volume for the control of Leucoptera coffeella (Lepidoptera: Lyonetiidae) in coffee plants. Coffee Sci. 2015, 10, 491–498. [Google Scholar]
- Decaro, S.T.; Ferreira, M.d.C.; Olinto, L. Physical characteristics of oily spraying liquids and droplets formed on coffee leaves and glass surfaces. Eng. Agrícola 2015, 35, 588–600. [Google Scholar] [CrossRef] [Scilit]
- Santinato, F.; da Silva, C.D.; da Silva, R.P.; Ormond, A.T.S.; Gonasalves, V.A.R.; Santinato, R. Development and technical validation of spray kit for coffee harvester. Afr. J. Agric. Res. 2019, 14, 571–575. [Google Scholar] [CrossRef] [Scilit]
- Cunha, J.P.A.R.; Chueca, P.; Garcerá, C.; Moltó, E. Risk assessment ofpesticide spray drift from citrus applications with air-blast sprayers in Spain. Crop Prot. 2012, 42, 116–123. [Google Scholar] [CrossRef] [Scilit]
- Silva, J.E.R.; Cunha, J.P.A.R.; Nomelini, Q.S.S. Deposição de calda em folhas de cafeeiro e perdas para o solo com diferentes taxas de aplicação e pontas de pulverização. Rev. Bras. Eng. Agrícola Ambient. 2014, 18, 1302–1306. [Google Scholar] [CrossRef] [Scilit][Green Version]
- Wang, S.; Li, X.; Zeng, A.; Song, J.; Xu, T.; Lv, X.; He, X. Effects of adjuvants on spraying characteristics and control efficacy in unmanned aerial application. Agriculture 2022, 12, 138. [Google Scholar] [CrossRef] [Scilit]
- Van Zyl, S.A.; Brink, J.-C.; Calitz, F.J.; Fourie, P.H. Effects of adjuvants on deposition efficiency of fenhexamid sprays applied to Chardonnay grapevine foliage. Crop Prot. 2010, 29, 843–852. [Google Scholar] [CrossRef] [Scilit]
- İtmeç, M.; Bayat, A.; Bolat, A.; Toraman, M.C.; Soysal, A. Assessment of spray drift with various adjuvants in a wind tunnel. Agronomy 2022, 12, 2377. [Google Scholar] [CrossRef] [Scilit]
- Ye, K.; Hu, G.; Tong, Z.; Xu, Y.; Zheng, J. Key intelligent pesticide prescription spraying technologies for the control of pests, diseases, and weeds: A review. Agriculture 2025, 15, 81. [Google Scholar] [CrossRef] [Scilit]
- Song, Y.; Huang, Q.; Liu, M.; Cao, L.; Li, F.; Zhao, P.; Cao, C. Wetting and deposition behaviors of pesticide droplets with different dilution ratios on wheat leaves infected by pathogens. J. Mol. Liq. 2023, 370, 120977. [Google Scholar] [CrossRef] [Scilit]
- Basílio, S.; Júnior, M.R.F.; de Alvarenga, C.B.; da Vitória, E.L.; Vargas, B.C.; Privitera, S.; Caruso, L.; Cerruto, E.; Manetto, G. Effect of Adjuvants on Physical–Chemical Properties, Droplet Size, and Drift Reduction Potential. Agriculture 2024, 14, 2271. [Google Scholar] [CrossRef] [Scilit]
- Zeeshan, M.; Li, H.; Yousaf, G.; Ren, H.; Liu, Y.; Arshad, M.; Dou, Z.; Han, X. Effect of formulations and adjuvants on the properties of acetamiprid solution and droplet deposition characteristics sprayed by UAV. Front. Plant Sci. 2024, 15, 1441193. [Google Scholar] [CrossRef] [Scilit] [PubMed]
- Xiao, Q.; Xin, F.; Lou, Z.; Zhou, T.; Wang, G.; Han, X.; Lan, Y.; Fu, W. Effect of aviation spray adjuvants on defoliant droplet deposition and cotton defoliation efficacy sprayed by unmanned aerial vehicles. Agronomy 2019, 9, 217. [Google Scholar] [CrossRef] [Scilit]
- Vitória, E.L.d.; Krohling, C.A.; Borges, F.R.P.; Ribeiro, L.F.O.; Ribeiro, M.E.A.; Chen, P.; Lan, Y.; Wang, S.; Moraes, H.M.F.e.; Furtado Júnior, M.R. Efficiency of fungicide application an using an unmanned aerial vehicle and pneumatic sprayer for control of Hemileia vastatrix and Cercospora coffeicola in mountain coffee crops. Agronomy 2023, 13, 340. [Google Scholar] [CrossRef] [Scilit]
- Crause, D.H.; da Vitória, E.L.; Ribeiro, L.F.O.; Ferreira, F.d.A.; Lan, Y.; Chen, P. Droplet deposition of leaf fertilizers applied by an unmanned aerial vehicle in Coffea canephora plants. Agronomy 2023, 13, 1506. [Google Scholar] [CrossRef] [Scilit]
- Souza, F.G.; Portes, M.F.; Silva, M.V.; Teixeira, M.M.; Júnior, M.R.F. Impact of sprayer drone flight height on droplet spectrum in mountainous coffee plantation. Rev. Bras. Eng. Agrícola Ambient. 2022, 26, 901–906. [Google Scholar] [CrossRef] [Scilit]
- Irish, B.M.; Correll, J.C.; Morelock, T.E. The effect of synthetic surfactants on disease severity of white rust on spinach. Plant Dis. 2002, 86, 791–796. [Google Scholar] [CrossRef] [Scilit] [PubMed][Green Version]
- Zhao, R.; Sun, Z.; Bird, N.; Gu, Y.; Xu, Y.; Zhang, Z.; Wu, X. Effects of tank-mix adjuvants on physicochemical properties and dosage delivery at low dilution ratios for unmanned aerial vehicle application in paddy fields. Pest Manag. Sci. 2022, 78, 1582–1593. [Google Scholar] [CrossRef] [Scilit] [PubMed]
- Wang, L.; Xia, S.; Zhang, H.; Li, Y.; Huang, Z.; Qiao, B.; Zhong, L.; Cao, M.; He, X.; Wang, C. Tank-mix adjuvants improved spray performance and biological efficacy in rice insecticide application with unmanned aerial vehicle sprayer. Pest Manag. Sci. 2024, 80, 4371–4385. [Google Scholar] [CrossRef] [Scilit] [PubMed]
- Cunha, J.P.A.R.; Gitirana Neto, J.; Bueno, M.R. Evaluation of a device for the application of pesticides on mechanized coffee crops (Coffea arabica L.). Interciencia 2011, 36, 312–316. [Google Scholar]

Disclaimer/Publisher’s Note: The statements, opinions and data contained in all publications are solely those of the individual author(s) and contributor(s) and not of MDPI and/or the editor(s). MDPI and/or the editor(s) disclaim responsibility for any injury to people or property resulting from any ideas, methods, instructions or products referred to in the content. |
© 2026 by the authors. Licensee MDPI, Basel, Switzerland. This article is an open access article distributed under the terms and conditions of the Creative Commons Attribution (CC BY) license.