


Abstract
Wheat seed endophytic microbiota may be associated with seed nutritional quality, yet systematic studies on this relationship remain limited. In this study, nine representative wheat cultivars were selected from more than 600 wheat accessions based on starch and protein contents and classified into three groups: high-starch and low-protein (HL), medium-starch and medium-protein (MM), and low-starch and high-protein (LH). Amplicon sequencing, LEfSe differential analysis, co-occurrence network analysis, Spearman correlation analysis, and PICRUSt2 v2.6.3 and FUNGuild v1.1 functional prediction were integrated to systematically investigate the relationship between seed endophytic microorganisms and wheat nutritional quality. The results showed that Massilia, Exiguobacterium, and Vishniacozyma were among the key endophytic genera detected in wheat seeds. The composition, co-occurrence network characteristics, and predicted functional profiles of endophytic microbial communities differed markedly among wheat quality groups. The HL group exhibited higher relative abundance of predicted functions related to carbon metabolism and relatively high network modularity, whereas the MM group showed intermediate network characteristics and distinct bacterial and fungal taxa. The LH group exhibited higher network connectivity and more extensive co-occurrence associations, together with higher relative abundances of predicted functions related to nitrogen metabolism, secondary metabolism, and phytohormone-related metabolism. Spearman correlation analysis further revealed significant associations between specific endophytic genera and nutritional quality traits, including starch, protein, wet gluten, and amylose-to-amylopectin ratio. FUNGuild analysis also revealed group-specific differences in predicted fungal trophic modes. Collectively, these findings demonstrate distinct associations between seed endophytic microbial community characteristics and wheat nutritional quality profiles, providing a basis for further investigation of the potential contribution of seed microbiota to wheat quality variation.
1. Introduction
Wheat is a staple cereal crop of global importance [1]. Its protein and starch contents are core indicators for evaluating nutritional quality [1,2]. In wheat grains, the accumulation of protein and starch is governed by a dynamic balance coordinated through the allocation of carbon and nitrogen metabolic fluxes [3]. Differences in the contents of these two components confer distinct processing properties: wheat with low protein and high starch content forms the basis of high-quality weak-gluten flour, whereas high-protein wheat serves as a key raw material for producing highly resilient wheat-based foods [1]. Therefore, systematic investigation of the mechanisms underlying the formation of wheat nutritional quality and clarification of the regulatory patterns governing protein and starch accumulation can provide a theoretical basis for classified wheat production, quality improvement, and the breeding of special-purpose cultivars. Such research also offers scientific support for the production of high-quality, special-purpose wheat raw materials and the processing of premium wheat-based products.
The formation of wheat quality results from the combined effects of complex biological processes and environmental factors [4]. For a long time, related studies have mainly focused on genetic regulation, water and fertilizer management, and climatic factors. For example, Tian et al. [5] identified four candidate genes on chromosome 7A that may be associated with starch, providing a scientific basis for improving wheat starch quality through marker-assisted selection. Cai et al. [6] found that, in the Huanghuai wheat area, the application of 60 kg/ha of returning-green fertilizer and 80 kg/ha of heading fertilizer increased both yield and processing quality by 20.5% and 16.4%, respectively, compared with conventional fertilization practices. Wang et al. [7] analyzed the spatiotemporal variation patterns of climatic factors and found that the Jiaodong region is more suitable for developing medium- to strong-gluten wheat, whereas southwestern and central Shandong are more suitable for medium-gluten wheat, thereby providing a theoretical basis for delineating advantageous production regions for high-quality wheat. Although these studies have examined quality differences from genetic and environmental perspectives, they have often overlooked the potential contribution of the widely distributed plant microbiome to wheat quality. In recent years, with advances in plant microbiome research, exploration of the relationship between wheat endophytes and quality has shown considerable promise [8,9]. Indeed, seed endophytes, as stable core components throughout the plant life cycle, play crucial roles in nutrient transformation, stress responses, growth and development, and metabolic regulation [10]. Evidence indicates that some endophytic nitrogen-fixing bacteria enhance wheat stress tolerance by optimizing nitrogen transformation [11]; some endophytes significantly inhibit pathogen spore germination [12]; and others directly intervene in carbon metabolism by regulating photosynthetic rates [13]. However, systematic research remains lacking on the community characteristics of seed endophytes in wheat types with different quality profiles and their associations with nutritional quality.
In preliminary work for this study, near-infrared spectroscopy was used to screen 600 wheat accessions based on starch, protein, and related quality indicators, leading to the selection and classification of representative varieties into three groups: high-starch/low-protein (HL), medium-starch/medium-protein (MM), and low-starch/high-protein (LH). On this basis, relevant nutritional quality indicators were measured, and microbial community composition, linear discriminant analysis, correlation analysis, and functional prediction were integrated to systematically investigate the relationship between seed endophytic community structure and nutritional quality. This study aims to provide a theoretical basis for evaluating and improving wheat quality from the perspective of microbial ecology, while also offering a scientific reference for the development of high-quality, special-purpose wheat raw materials.
2. Materials and Methods
2.1. Experimental Design
Field experiments were conducted from 2024 to 2025 at the experimental station of Northwest A&F University (108.062° E, 34.289° N). Samples were collected at crop maturity in June 2025. After air-drying and storage for two months, grain quality traits of more than 600 wheat cultivars were rapidly and non-destructively assessed using a near-infrared analyzer. Based on the test results, nine representative wheat cultivars were ultimately selected for quality evaluation and integrated endophytic microbiome analysis. According to the allocation patterns of grain protein and starch, these nine representative cultivars were classified into three groups for subsequent analyses: high-starch and low-protein (HL), medium-starch and medium-protein (MM), and low-starch and high-protein (LH).
2.2. Materials and Instruments
The tested wheat cultivars included the following: HL group: Yumai 62 (443), Xiaoyan 22 (416), and Chuanyu 20 (202); MM group: Chang 6359 (353), Ligao 6 (308), and Xinong 511 (413); and LH group: Bainong 207 (433), Zhoumai 18 (337), and Laredo (158).
The total starch assay kit was purchased from Megazyme, Bray, Ireland. Sodium chloride, sodium hydroxide, copper sulfate, potassium sulfate, sulfuric acid, boric acid, 95% ethanol, methyl red, bromocresol green, methylene blue, glacial acetic acid, and potassium iodide were of analytical grade and were obtained from Guangdong Guanghua Sci-Tech Co., Ltd., Shantou, China. Potato amylose and amylopectin standards were purchased from Shanghai Macklin Biochemical Co., Ltd., Shanghai, China. pH test paper was obtained from Zhejiang Luheng Environmental Technology Co., Ltd., Hangzhou, China. The FastDNA™ Spin Kit for Soil used for DNA extraction was purchased from MP Biomedicals, Irvine, CA, USA.
The instruments used in this study included a TW200 cyclone mill (Beijing Grinder Instrument Co., Ltd., Beijing, China), a Perten DA7250 near-infrared analyzer (Perten Instruments, Hägersten, Sweden), an automatic Kjeldahl nitrogen analyzer (FOSS Analytical, Höganäs, Sweden), a Futura 3 automatic amylose analyzer (AMS, Rome, Italy), a gluten quantity and quality analyzer (Perten Instruments, Hägersten, Sweden), an ABI GeneAmp® 9700 thermal cycler, a REPS300 electrophoresis apparatus (Shanghai Tanon Life Science Co., Ltd., Shanghai, China), a Tanon-2500 gel imaging system (Shanghai Tanon Life Science Co., Ltd., Shanghai, China), and an Illumina NextSeq 2000 sequencing platform (Illumina, San Diego, CA, USA).
2.3. Measured Traits and Analytical Methods
2.3.1. Sample Preparation
From wheat grain samples harvested in the summer of 2025, 200 g of grains were weighed and milled using a cyclone mill, with the bran retained, to produce whole wheat flour, which was subsequently used for the determination of relevant quality traits.
2.3.2. Determination of Starch Content
Total starch content was determined according to GB 5009.9–2023, National Food Safety Standard—Determination of Starch in Foods, using α-amylase, glucoamylase, and a commercial assay kit [14]. Amylose content was determined according to NY/T 4479–2025, Determination of Amylose in Cereal Grains—Spectrophotometric Method, using an automatic amylose analyzer based on spectrophotometry [15].
2.3.3. Determination of Grain Protein and Wet Gluten Contents
Protein content was determined according to GB 5009.5–2025, Determination of Protein in Foods, using an automatic Kjeldahl nitrogen analyzer [16]. Wet gluten content was measured according to GB/T 5506.2–2024, Wheat and Wheat Flour—Gluten Content—Part 2: Determination of Wet Gluten by Mechanical Means, using a gluten quantity and quality analyzer [17].
2.3.4. Microbial Diversity Analysis
Healthy, plump, and mold-free wheat seeds were selected and first subjected to surface sterilization to remove epiphytic microorganisms from the seed surface. For each wheat cultivar, a 1 g seed sample was initially rinsed with sterile distilled water, followed by immersion in 75% ethanol for 30 s and treatment with 1% sodium hypochlorite (NaClO) for 150 s. The seeds were then treated again with 75% ethanol for 30 s and subsequently rinsed three to four times with sterile distilled water to remove residual sterilizing agents. To verify the effectiveness of surface sterilization, 100 μL of the final rinse water was spread onto nutrient agar (NA) plates and incubated at 30 ± 2 °C for 48–72 h. No visible microbial growth was observed on the NA plates after incubation, supporting the effectiveness of the surface-sterilization procedure. The surface-sterilized seeds were placed on sterile filter paper to absorb residual surface moisture and then thoroughly ground into a fine powder under liquid nitrogen. Subsequently, 100–200 mg of seed powder was weighed for DNA extraction. Total genomic DNA was extracted using the FastDNA™ Spin Kit for Soil.
For endophytic bacterial community analysis, the V5–V7 region of the bacterial 16S rRNA gene was amplified using a two-round nested PCR strategy. In the first round of PCR amplification, primers 799F (5′-AACMGGATTAGATACCCKG-3′) and 1392R (5′-ACGGGCGGTGTGTRC-3′) were used, with an annealing temperature of 55 °C and 27 amplification cycles. The resulting PCR products were subsequently used as templates for the second round of amplification using primers 799F (5′-AACMGGATTAGATACCCKG-3′) and 1193R (5′-ACGTCATCCCCACCTTCC-3′), with an annealing temperature of 55 °C and 13 amplification cycles. For endophytic fungal community analysis, the fungal ITS region was amplified using primers ITS1F (5′-CTTGGTCATTTAGAGGAAGTAA-3′) and ITS2R (5′-GCTGCGTTCTTCATCGATGC-3′), with an annealing temperature of 55 °C and 35 amplification cycles.
PCR amplification was performed using an ABI GeneAmp® 9700 thermal cycler in a final reaction volume of 20 μL containing 10 μL of 2× Pro Taq, 0.8 μL of forward primer (5 μM), 0.8 μL of reverse primer (5 μM), template DNA (10 ng/μL), and ddH2O to a final volume of 20 μL. The thermal cycling program consisted of an initial denaturation at 95 °C for 3 min, followed by the specified number of cycles of denaturation at 95 °C for 30 s, annealing at 55 °C for 30 s, and extension at 72 °C for 45 s, followed by a final extension at 72 °C for 10 min. The PCR products were then held at 10 °C until further processing. A no-template PCR negative control (CK), in which sterile water was used instead of template DNA, was included and subjected to the same PCR reagents and amplification conditions as the experimental samples. No visible amplification band was detected in the negative control by agarose gel electrophoresis, indicating no detectable contamination of the PCR reagents under the conditions used. Following amplification, the PCR products were purified and subjected to paired-end high-throughput sequencing on the Illumina NextSeq 2000 platform.
After demultiplexing, paired-end raw reads were quality-filtered using fastp (v0.23.4) and merged using FLASH (v1.2.11). Specifically, bases with quality scores below 20 at the ends of reads were trimmed using a 10 bp sliding window. When the average quality score within the window was below 20, the sequence was truncated from the beginning of the window. Reads shorter than 50 bp after quality filtering and reads containing more than five ambiguous bases (N) were discarded. Paired-end reads were merged according to their overlapping regions, with a minimum overlap length of 10 bp and a maximum mismatch ratio of 0.2 in the overlapping region. Sequences were assigned to individual samples according to their barcodes and primers, with no barcode mismatches and a maximum of two primer mismatches allowed, and sequence orientations were corrected accordingly.
The resulting high-quality sequences were denoised using the DADA2 v1.26 plugin implemented in the QIIME2 v2020.2 pipeline to generate amplicon sequence variants (ASVs), with chimeric sequences identified and removed as part of the DADA2 workflow. ASVs taxonomically assigned as chloroplasts or mitochondria were removed prior to downstream analyses. For bacterial sequences, taxonomic assignment of ASVs was performed against the SILVA 16S rRNA gene database (v138.2) using the classify-sklearn Naive Bayes classifier, with a confidence threshold of 0.7. For fungal ITS sequences, taxonomic assignment of ASVs was performed against the UNITE database (v9.0). To minimize the influence of differences in sequencing depth on alpha- and beta-diversity analyses, the ASV table was rarefied to 13,814 sequences per sample, corresponding to the minimum sequencing depth across samples, prior to downstream community analyses.
2.4. Data Processing and Visualization
Each wheat cultivar was analyzed using six biological replicates. Wheat quality trait data were analyzed by one-way analysis of variance (ANOVA) using SPSS 26.0, and figures were generated using Origin 2024. Results are expressed as the mean ± standard deviation (mean ± SD). Significant differences among groups were tested using Duncan’s multiple range test (p < 0.05), and different letters were used to indicate significant differences.
Microbial community analysis, network analysis, and functional prediction were performed on the R platform (v4.4.2), including alpha diversity analysis, beta diversity analysis, differential biomarker screening, microbial network correlation analysis, microbe–quality association analysis, and bacterial and fungal functional prediction. Co-occurrence networks were constructed and visualized using Gephi 0.10.1.
3. Results
3.1. Analysis of Quality Indicators and Classification Evaluation Across Different Wheat Quality Types
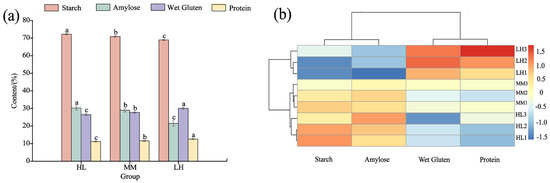
As shown in Figure 1a, significant differences in the four key quality traits—total starch, amylose, protein, and wet gluten contents—were observed among the three wheat quality groups (p < 0.05). The HL group exhibited the highest total starch content, which was 1.87% and 4.74% higher than those of the MM and LH groups, respectively. A similar trend was observed for amylose content, which was 4.52% and 4.81% higher in the HL group than in the MM and LH groups, respectively. In contrast, the LH group exhibited the highest protein and wet gluten contents. Specifically, protein content was 9.00% and 12.73% higher than those of the MM and HL groups, respectively, while wet gluten content exceeded those of the MM and HL groups by 8.5% and 13.29%, respectively.
Figure 1.
Comparison of nutritional quality traits and cluster analysis of different wheat varieties. (a) Comparison of nutritional quality traits among wheat varieties with different quality characteristics. (b) Cluster analysis of nutritional quality profiles of nine wheat varieties. Note: “HL” High-starch, low-protein wheat; “MM” Medium-starch, medium-protein wheat; “LH” Low-starch, high-protein wheat. Different lowercase letters indicate significant differences between quality types at the p < 0.05 level.
Hierarchical cluster analysis of the four quality traits across the nine wheat cultivars (Figure 1b) clearly separated the cultivars into three distinct groups. Moreover, the four quality traits were clustered into two quality-related modules: a starch-related module, comprising total starch and amylose, and a protein-related module, consisting of protein and wet gluten. This clustering pattern highlights the coordinated variation in starch- and protein-related quality traits among wheat cultivars with different quality characteristics.
3.2. Composition and Differences in Endophytic Microbial Communities in Wheat Seeds with Different Quality Types
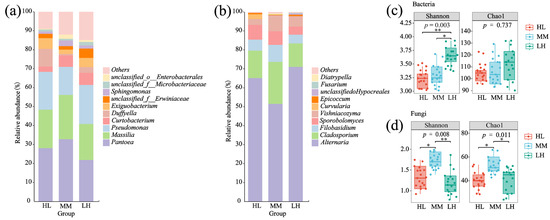
The taxonomic composition and relative abundance of seed endophytic bacteria and fungi at the genus level in wheat with different quality types are presented in Figure 2a and Figure 2b, respectively. Overall, the microbial community compositions among the three groups showed a high degree of consistency; however, clear gradient differences were observed in the relative abundance of dominant taxa.
Figure 2.
Endophytic microbial community composition and alpha diversity indices in wheat seeds of different categories. (a) Bacterial community composition. (b) Fungal community composition. (c) Shannon and Chao1 indices of bacterial communities. (d) Shannon and Chao1 indices of fungal communities. Note: Significant differences were observed between groups *: p < 0.05; **: p < 0.01.
The dominant bacterial genera mainly included Pantoea, Massilia, Pseudomonas, Curtobacterium, Duffyella, and Exiguobacterium. The fungal communities were primarily composed of the dominant genera Alternaria, Cladosporium, Filobasidium, Sporobolomyces, and Vishniacozyma.
To investigate differences in endophytic microbial alpha diversity among wheat quality groups, alpha diversity indices were compared among the different groups (Figure 2c). At the bacterial community level, the Shannon index exhibited significant differences among groups (p < 0.05). Specifically, the LH group showed a significantly higher Shannon index than the MM and HL groups, with increases of 9.59% and 15.18%, respectively. These results indicate that the low-starch and high-protein group was characterized by higher bacterial community diversity. In contrast, the Chao1 index showed no significant differences among groups (p > 0.05), indicating that bacterial richness did not differ significantly among the wheat quality groups.
However, at the fungal community level (Figure 2d), significant differences in both the Shannon and Chao1 indices were observed among the wheat quality groups (p < 0.05). The MM group exhibited a higher Shannon index than the HL and LH groups, increasing by 31.81% and 43.64%, respectively. Similarly, the Chao1 index of the MM group was significantly higher than those of the HL and LH groups by 32.67% and 35.17%, respectively (p < 0.05). These findings indicate that the MM group was characterized by higher fungal diversity and richness than the HL and LH groups.
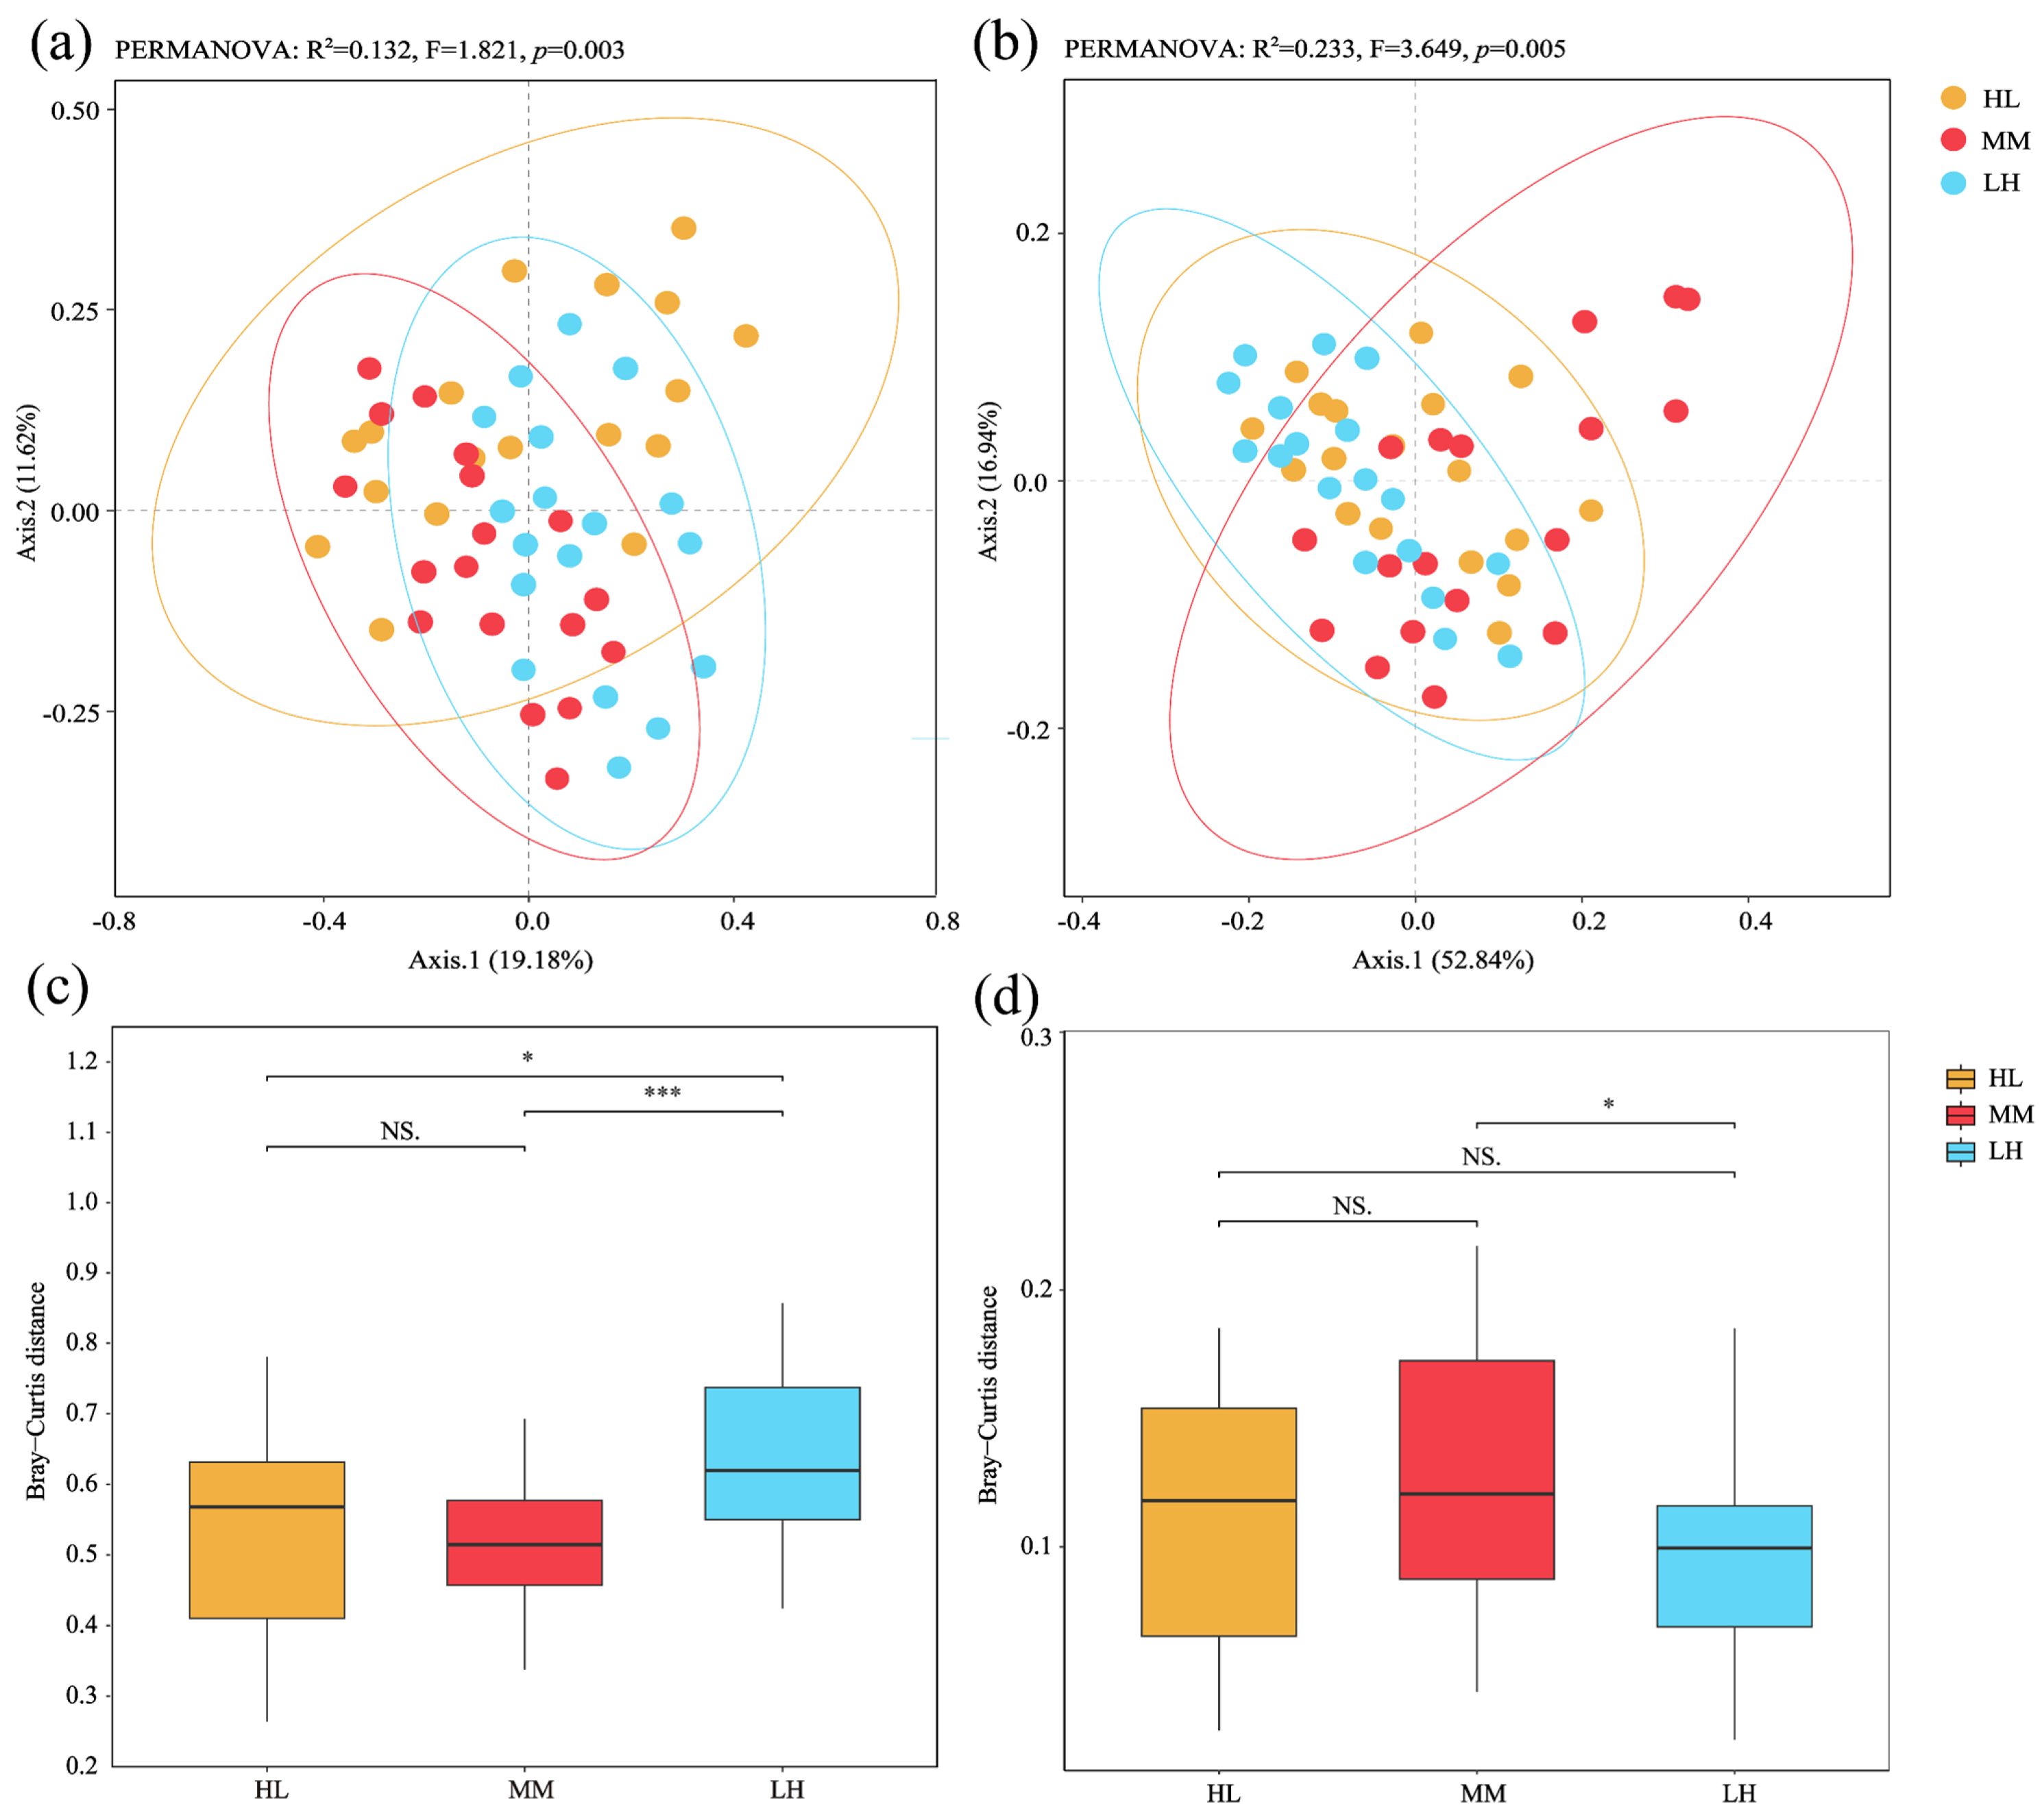
Principal coordinate analysis (PCoA) based on Bray–Curtis distances, combined with PERMANOVA analysis, demonstrated significant differences in endophytic microbial community structures among wheat quality groups (p < 0.05). Additionally, a supplementary PERMANOVA confirmed that the host cultivar background also contributed to the overall variation in these microbial communities (Table A1). As shown in Figure 3a, axis 1 and axis 2 explained 19.18% and 11.62% of the variation in bacterial community composition, respectively. The grouping factor accounted for 13.2% of the variation in bacterial community structure (R2 = 0.132, F = 1.821). For fungal communities (Figure 3b), axis 1 and axis 2 explained 52.84% and 16.94% of the variation, respectively, with a cumulative explanatory contribution of 69.78%. The grouping factor explained 23.3% of the variation in fungal community structure (R2 = 0.233, F = 3.649).
Figure 3.
Principal coordinate analysis of endophytic bacterial and fungal community structures in wheat seeds from different groups. (a) Bacterial communities. (b) Fungal communities. β-diversity was calculated based on Bray–Curtis distances, and differences in community composition among groups were visualized using boxplots. (c) Bacterial communities. (d) Fungal communities. NS indicates no significant difference; * p < 0.05, *** p < 0.001. Note: “R2” indicates the proportion of variation in microbial communities explained by differences among groups; “F” indicates the ratio of between-group variance to within-group variance.
To further characterize differences in bacterial and fungal community composition among groups, Bray–Curtis (BC) distances between groups were compared, and boxplots of BC distances were generated. As shown in Figure 3c, at the bacterial community level, the BC distance of the LH group was significantly higher than that of the HL group by 16.6% and higher than that of the MM group by 22.6%, whereas no significant difference was observed between the HL and MM groups. At the fungal community level (Figure 3d), the BC distance of the MM group was significantly higher than that of the LH group by 30.3%, while no significant differences were detected among the remaining group comparisons.
3.3. Analysis of Differential Biomarkers in Seed Endophytic Microbial Communities Among Different Wheat Quality Groups
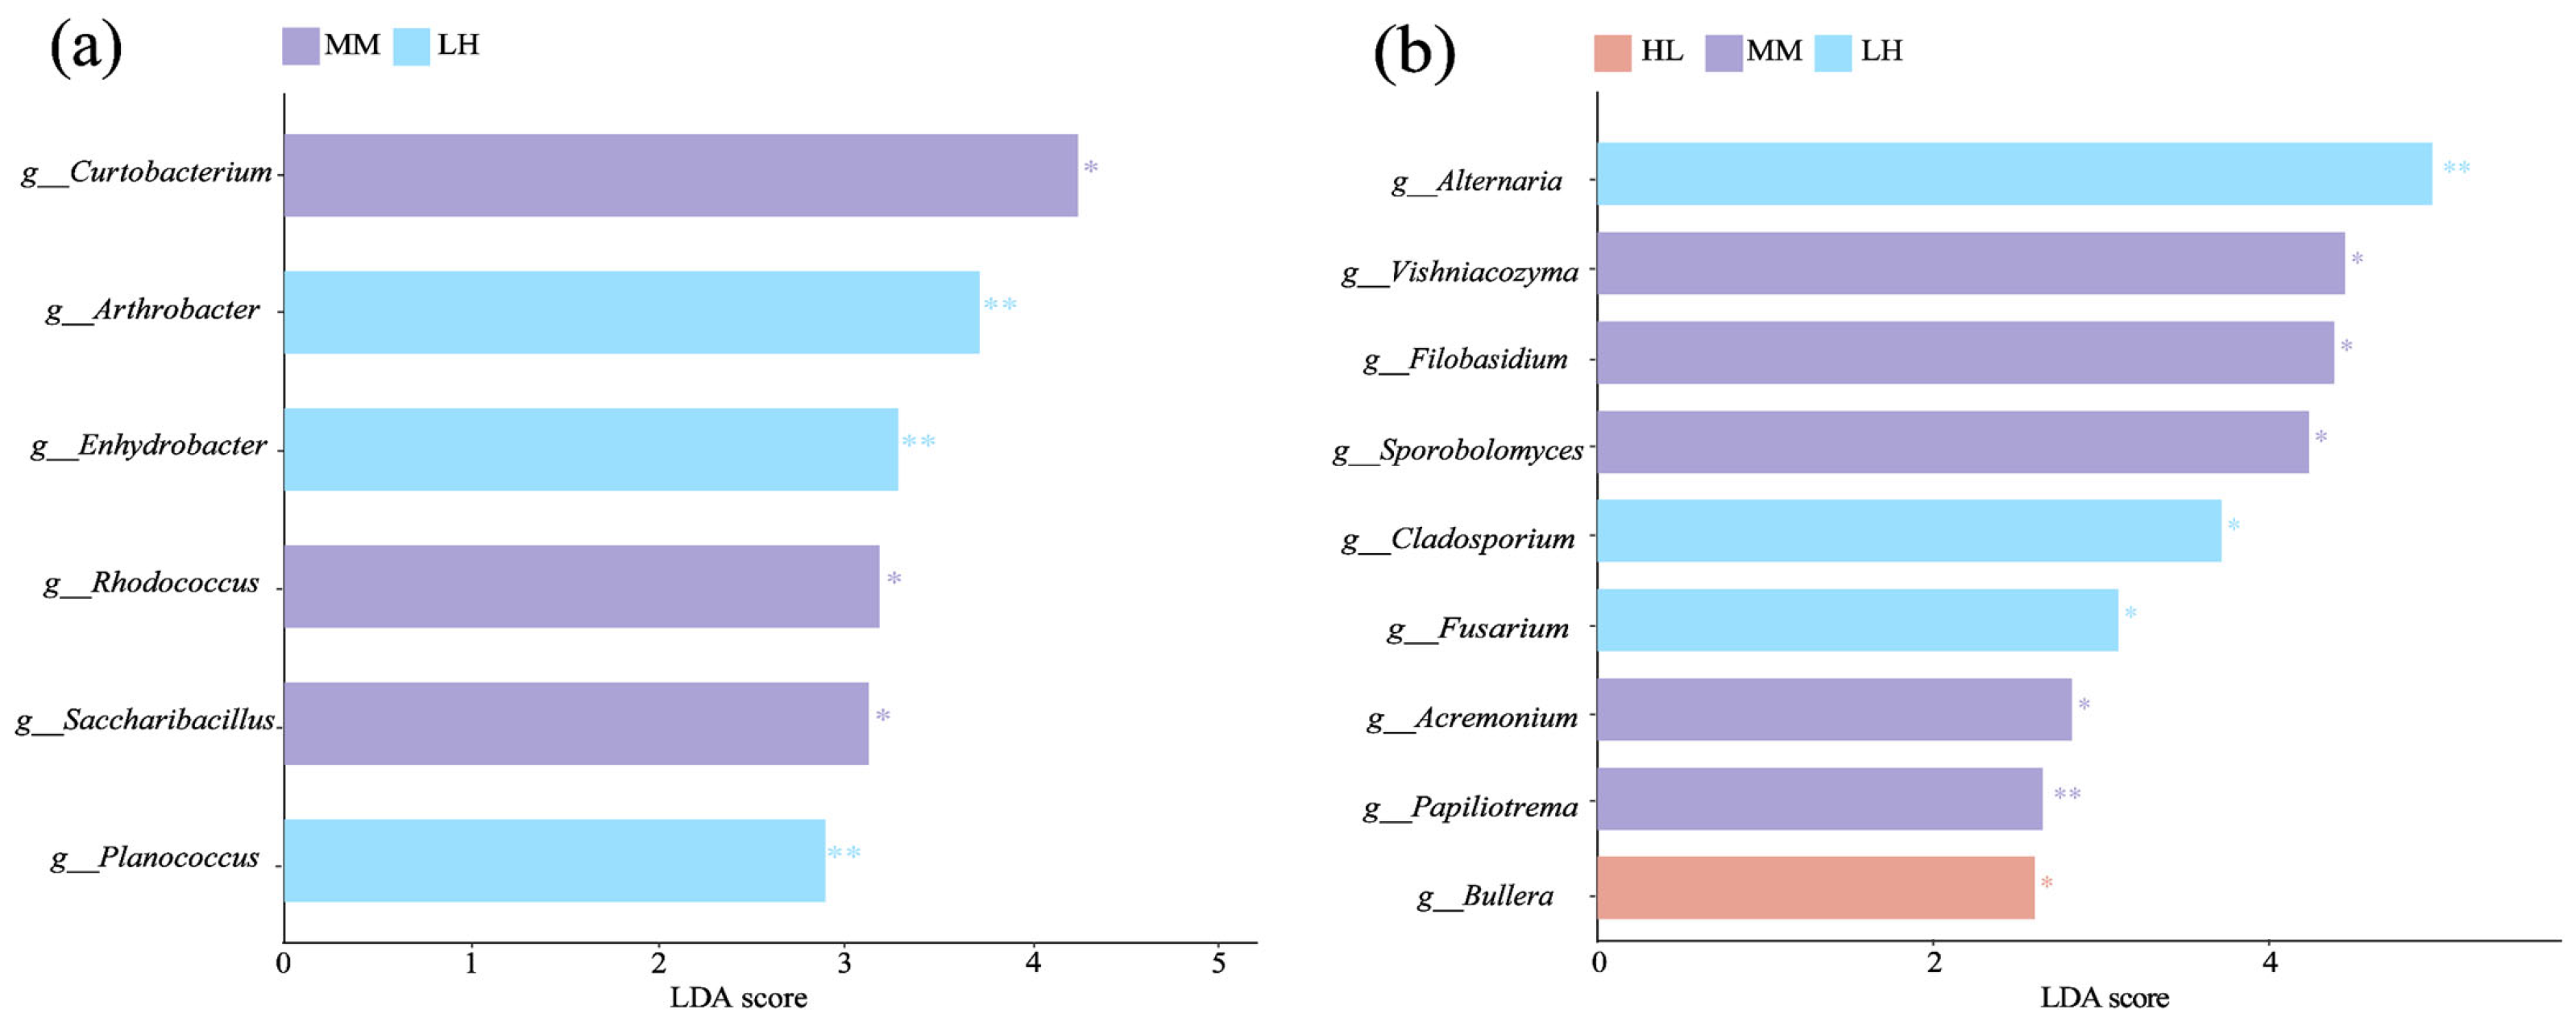
To further identify differential microbial biomarkers among wheat quality groups, the Linear Discriminant Analysis Effect Size (LEfSe) method was employed to screen for microbial taxa exhibiting significant differences among groups (LDA > 2.5, p < 0.05; Figure 4).
Figure 4.
LEfSe analysis of endophytic microbial communities among different groups. (a) Bacterial communities. (b) Fungal communities. Note: Different bacterial and fungal taxonomic groups: LDA analysis based on Lefse (LDA > 2.5), Significant differences are indicated by: * p < 0.05; ** p < 0.01.
As shown in Figure 4a, LEfSe analysis revealed distinct bacterial taxa associated with the different wheat quality groups. The MM group showed significant enrichment of Curtobacterium, Rhodococcus, and Saccharibacillus, whereas the LH group was characterized by the enrichment of Arthrobacter, Enhydrobacter, and Planococcus. These results indicate distinct bacterial community signatures among the wheat quality groups.
As shown in Figure 4b, distinct fungal taxa were also identified among the three quality groups. The HL group was characterized by the enrichment of the yeast genus Bullera, whereas the MM group showed enrichment of several yeast-associated genera, including Vishniacozyma, Filobasidium, Sporobolomyces, and Papiliotrema. In contrast, the LH group exhibited a distinct fungal enrichment pattern, with Alternaria, Cladosporium, and Fusarium identified as discriminant taxa. Collectively, the LEfSe results revealed group-specific bacterial and fungal community signatures associated with different wheat quality profiles.
3.4. Analysis of Co-Occurrence Network Characteristics of Seed Endophytic Microbial Communities Among Different Wheat Quality Groups
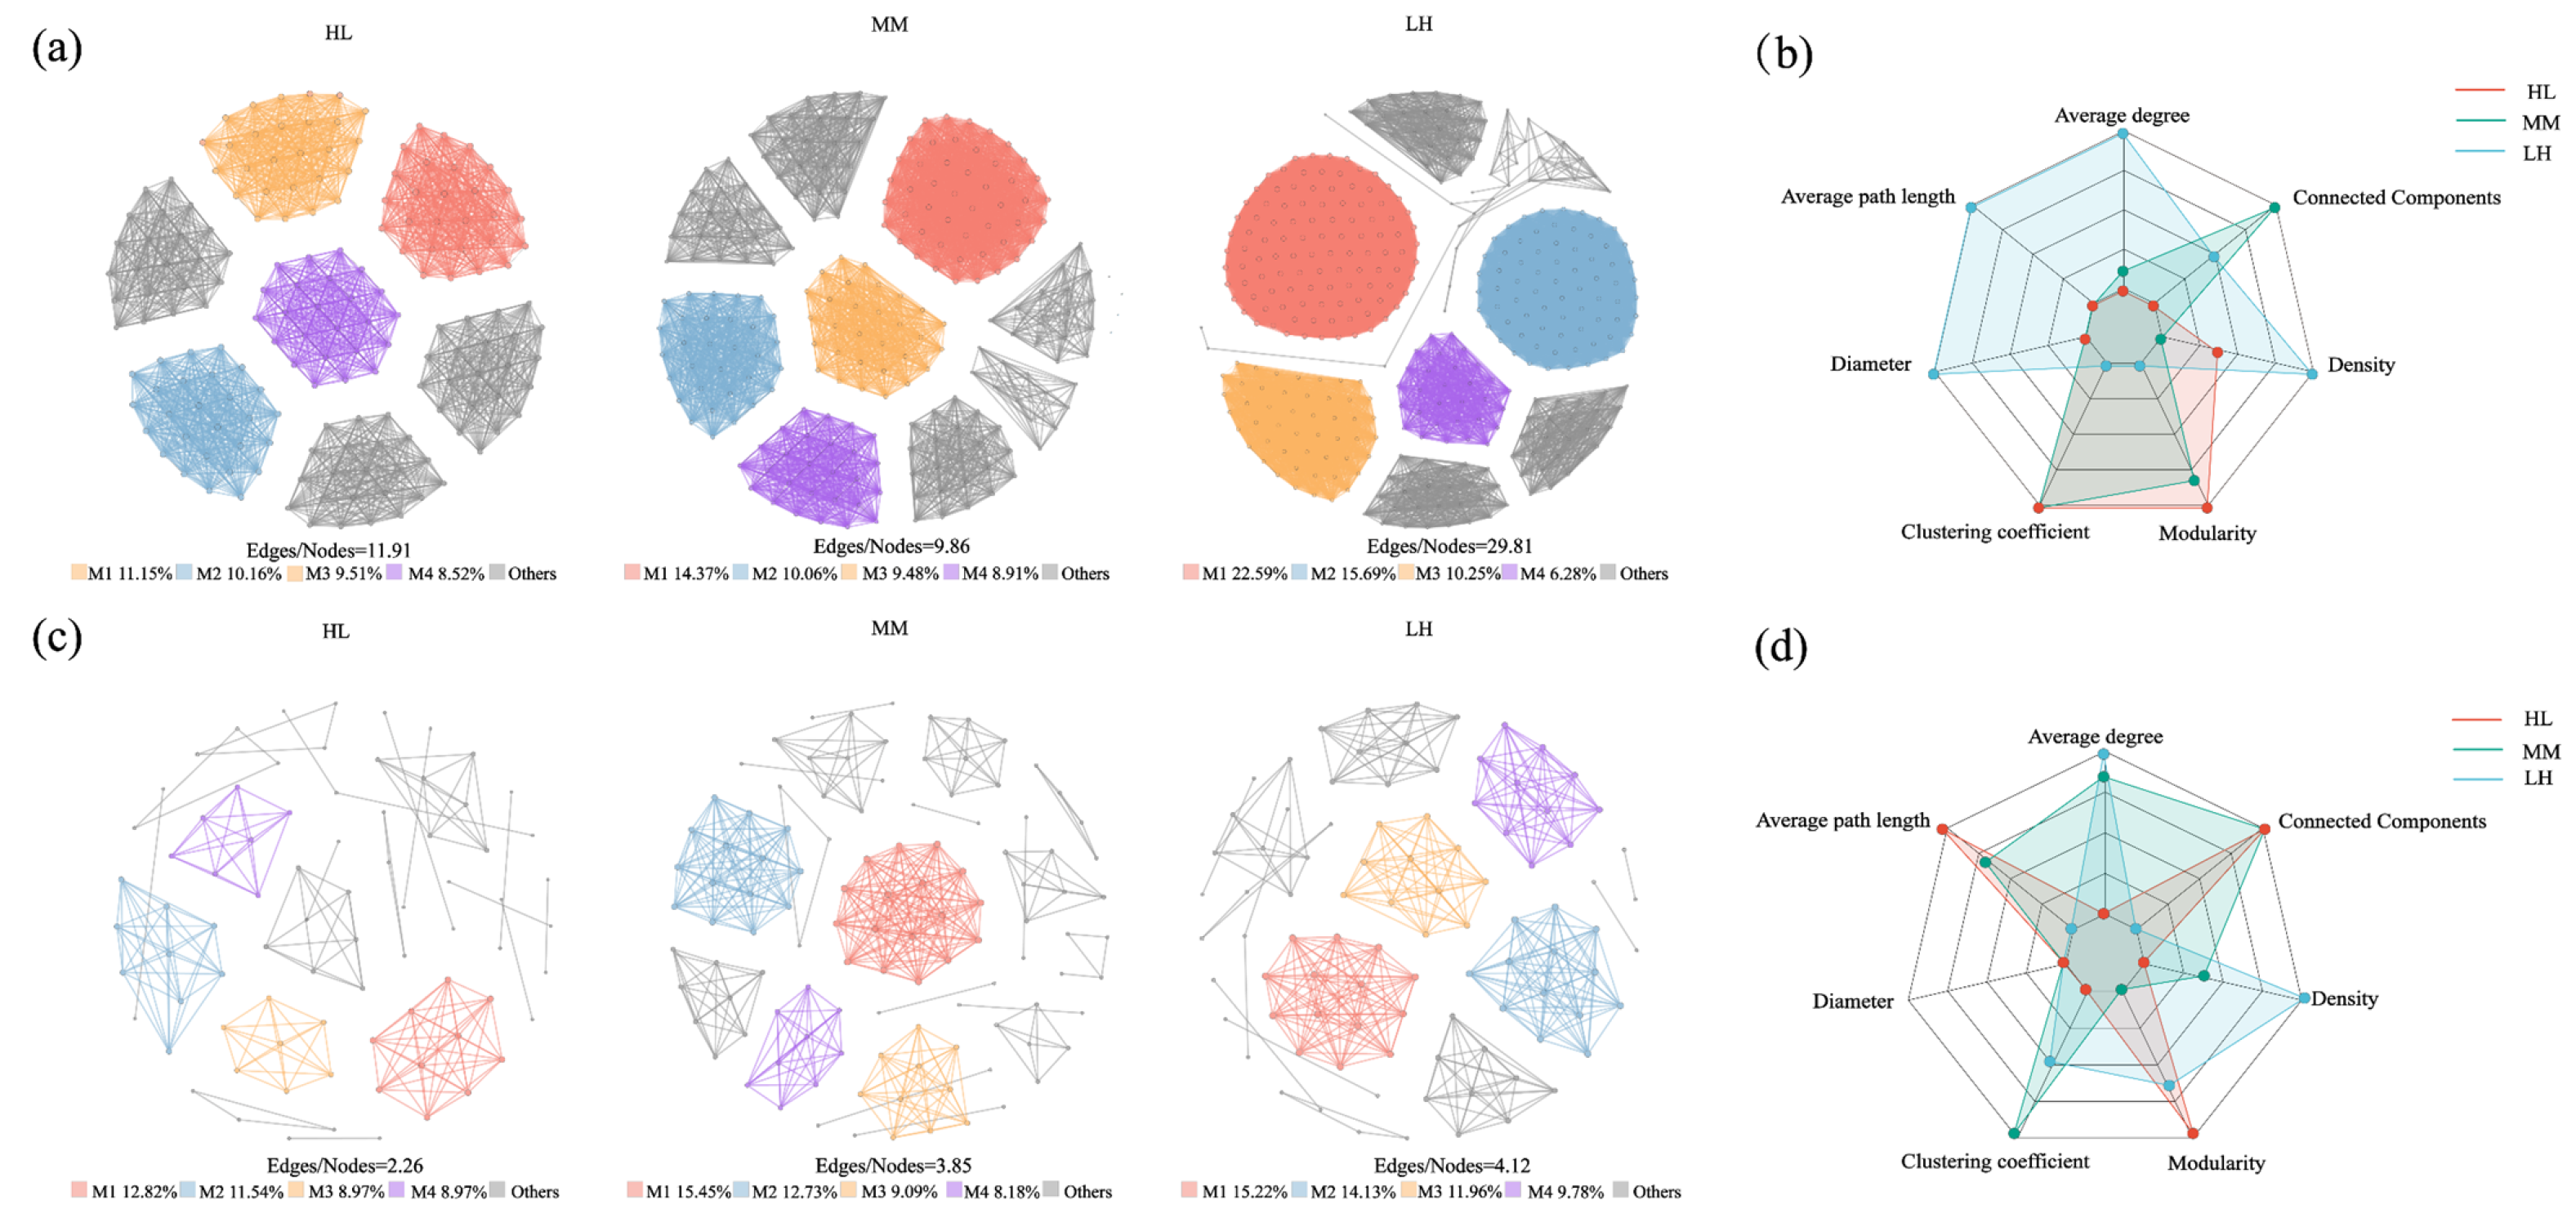
To further characterize the co-occurrence patterns of seed endophytic microbial communities among wheat quality groups, species co-occurrence networks and radar charts of their topological properties were constructed (Figure 5).
Figure 5.
Correlation analysis of co-occurrence networks of endophytic microbial communities in wheat seeds from different groups. (a) Co-occurrence network of endophytic bacterial communities. (b) Topological feature analysis of bacterial community co-occurrence networks. (c) Co-occurrence network of endophytic fungal communities. (d) Topological feature analysis of fungal community co-occurrence networks. Note: Network analysis of bacteria and fungi across different groups (p < 0.05, |r| > 0.6).
The network of the HL group (Figure 5a,c) showed a relatively balanced modular partitioning pattern (M1–M4), characterized by distinct modular organization and relatively limited inter-module connectivity, resulting in a more dispersed network structure. The MM group exhibited moderate module proportions and an intermediate level of inter-module connectivity. In contrast, the LH group exhibited high network complexity and connectivity. Its M1 module accounted for 22.59% of the network, and the nodes showed extensive co-occurrence associations.
Radar chart analysis of the topological parameters of the endophytic bacterial (Figure 5b) and fungal (Figure 5d) communities revealed differences in network structure among the three quality groups, with the HL group exhibiting particularly high modularity. The modularity of the bacterial network in the HL group was 0.851, which was 4.67% and 30.32% higher than those of the MM and LH groups, respectively. Similarly, the modularity of the fungal network was 0.847, which was 3.29% and 1.07% higher than those of the MM and LH groups, respectively. These results indicate that, despite the relatively low overall connectivity of the bacterial network in the HL group, it exhibited a more highly modular network structure.
Most bacterial network topological properties in the MM group were intermediate between those of the HL and LH groups. In contrast, the bacterial and fungal networks of the LH group exhibited higher values for several connectivity-related topological parameters, including average degree and network density. Specifically, the average degree of the bacterial network in the LH group was 59.967, which was 151.69% and 111.41% higher than those of the HL and MM groups, respectively. The average degree of the fungal network was 8.239, which was 2.56% and 6.88% higher than those of the HL and MM groups, respectively. The density of the bacterial network was 0.164, representing increases of 17.99% and 32.26% compared with the HL and MM groups, respectively. The density of the fungal network was 0.091, which was 54.24% and 28.17% higher than those of the HL and MM groups, respectively.
These results indicate that the low-starch and high-protein group exhibited a highly complex endophytic bacterial network characterized by extensive co-occurrence associations among microbial taxa. Further analysis of key microbial taxa within the networks identified representative genera associated with the different wheat quality groups. The core taxa in the HL group mainly included Massilia, Genolevuria, Bullera, and Fusarium. The MM group was characterized by Curtobacterium, Rhodococcus, Saccharibacillus, Vishniacozyma, Papiliotrema, and Sporobolomyces, whereas the LH group was characterized by Exiguobacterium, Arthrobacter, Enhydrobacter, Alternaria, and Acremonium.
3.5. Associations Between Nutritional Quality Traits and Seed Endophytic Microbiota Across Different Wheat Quality Groups
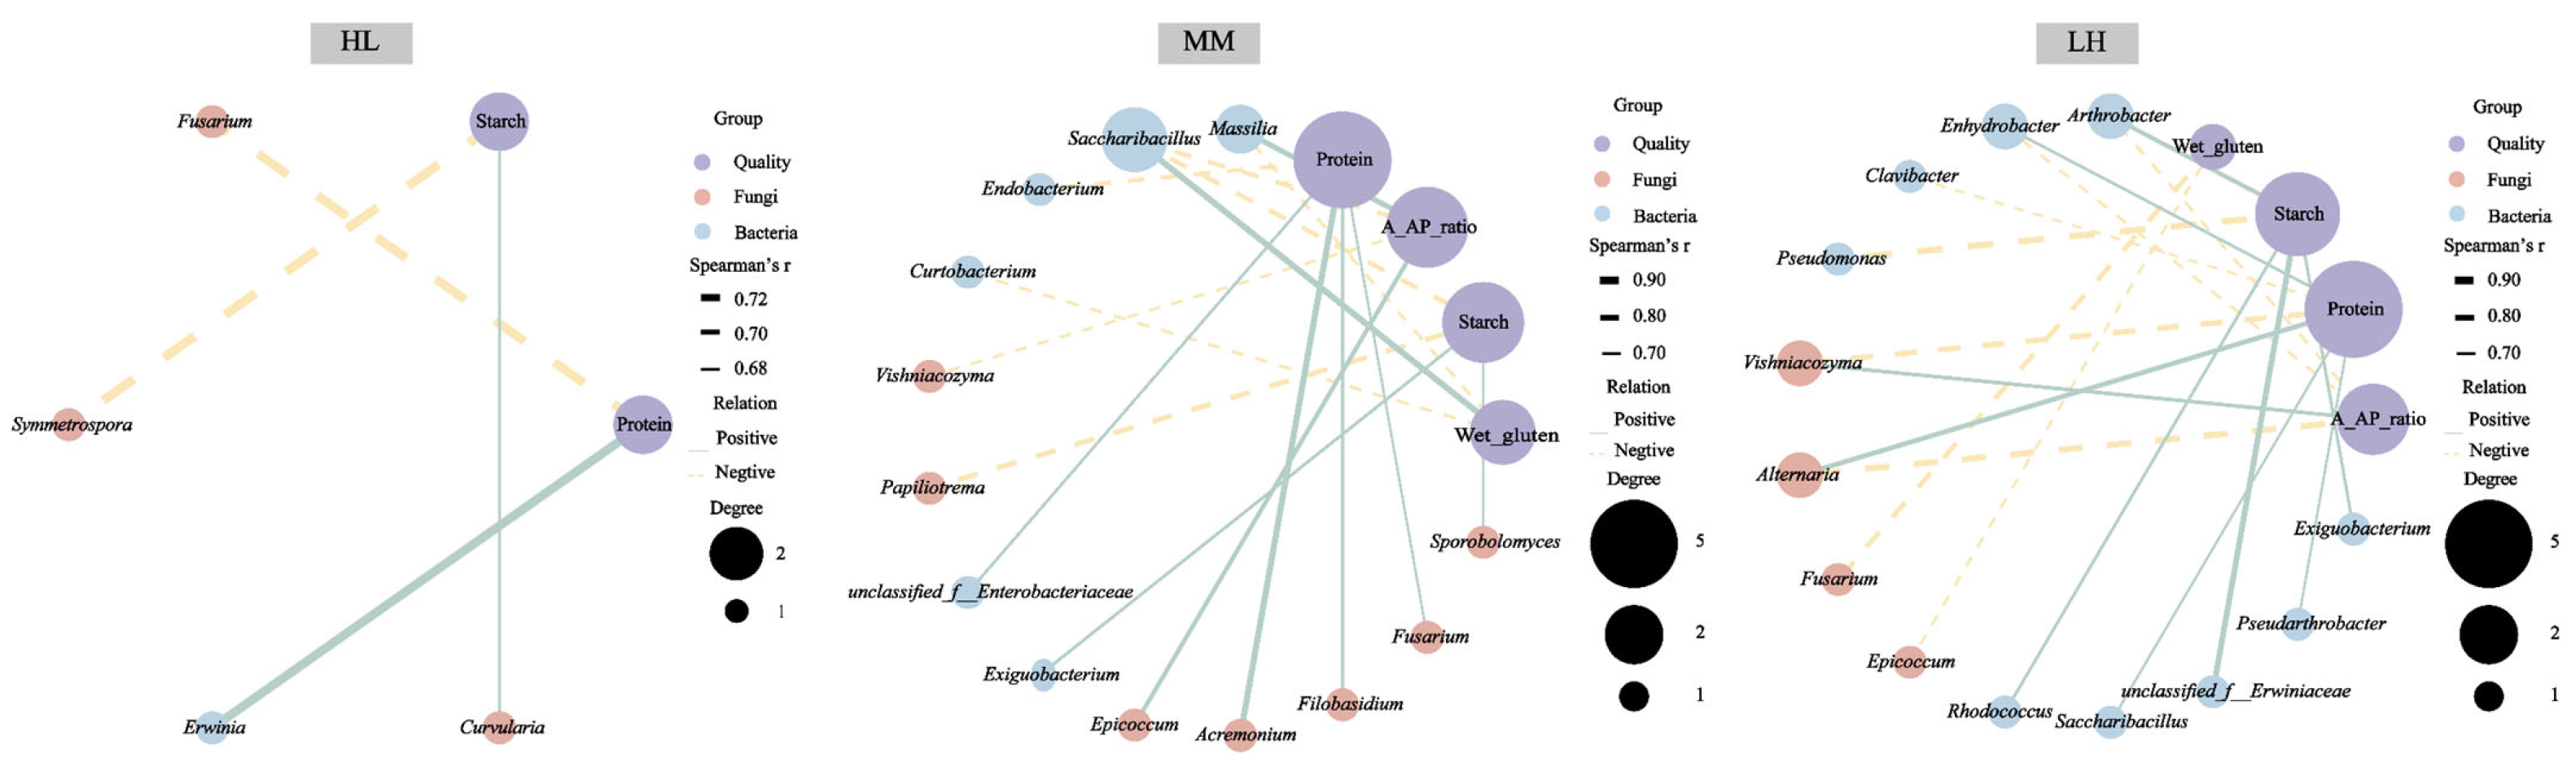
To further investigate potential associations between seed endophytic microorganisms and wheat quality differentiation, Spearman correlation network analysis was performed between four nutritional quality traits and dominant endophytic genera. The results showed that wheat samples across different quality gradients exhibited distinct microbe–quality association patterns, and network complexity differed significantly among quality groups (p < 0.05), as shown in Figure 6.
Figure 6.
Correlation network analysis between wheat nutritional quality and seed endophytic microbiota across different groups. Note: Spearman’s correlation analysis of core microorganisms and wheat nutritional quality (p < 0.05; |r| > 0.6). Purple nodes represent four types of wheat nutritional quality indicators; red nodes represent fungi; and blue nodes represent bacteria. Green solid lines indicate a significant positive correlation, while yellow dashed lines indicate a significant negative correlation.
In the HL group, the microbe–quality association network was comparatively simple and showed relatively low connectivity. Total starch content was significantly negatively correlated with Symmetrospora and significantly positively correlated with Curvularia. Protein content showed a significant positive correlation with Erwinia and a significant negative correlation with Fusarium. These results indicate distinct associations between specific endophytic genera and starch or protein content in the HL group.
The MM group exhibited a relatively complex microbe–quality association network involving multiple microbial genera. Protein content was positively correlated with Filobasidium and Acremonium, but negatively correlated with Endobacterium and Fusarium. Total starch content was positively associated with Sporobolomyces and negatively correlated with Saccharibacillus and Papiliotrema. Within this network, Saccharibacillus was negatively correlated with the amylose-to-amylopectin ratio (A:AP ratio) and total starch content, but positively correlated with wet gluten content.
The LH group exhibited the most complex microbe–quality association network among the three groups. In this group, protein content was significantly positively correlated with Alternaria and Enhydrobacter, but negatively correlated with Vishniacozyma and Clavibacter. Total starch content was negatively correlated with Pseudomonas, while positively associated with Arthrobacter and Rhodococcus. In addition, the A:AP ratio was significantly negatively correlated with Alternaria, Enhydrobacter, and Arthrobacter.
3.6. Functional Prediction of Endophytic Microbiota Across Wheat Nutritional Quality Groups
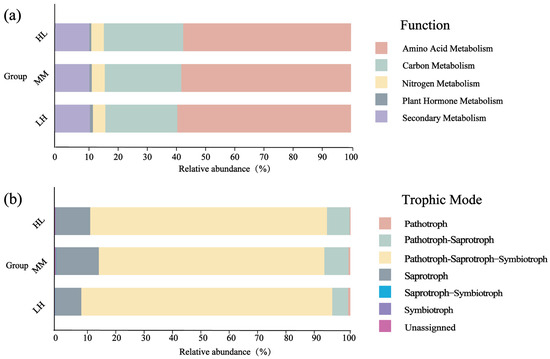
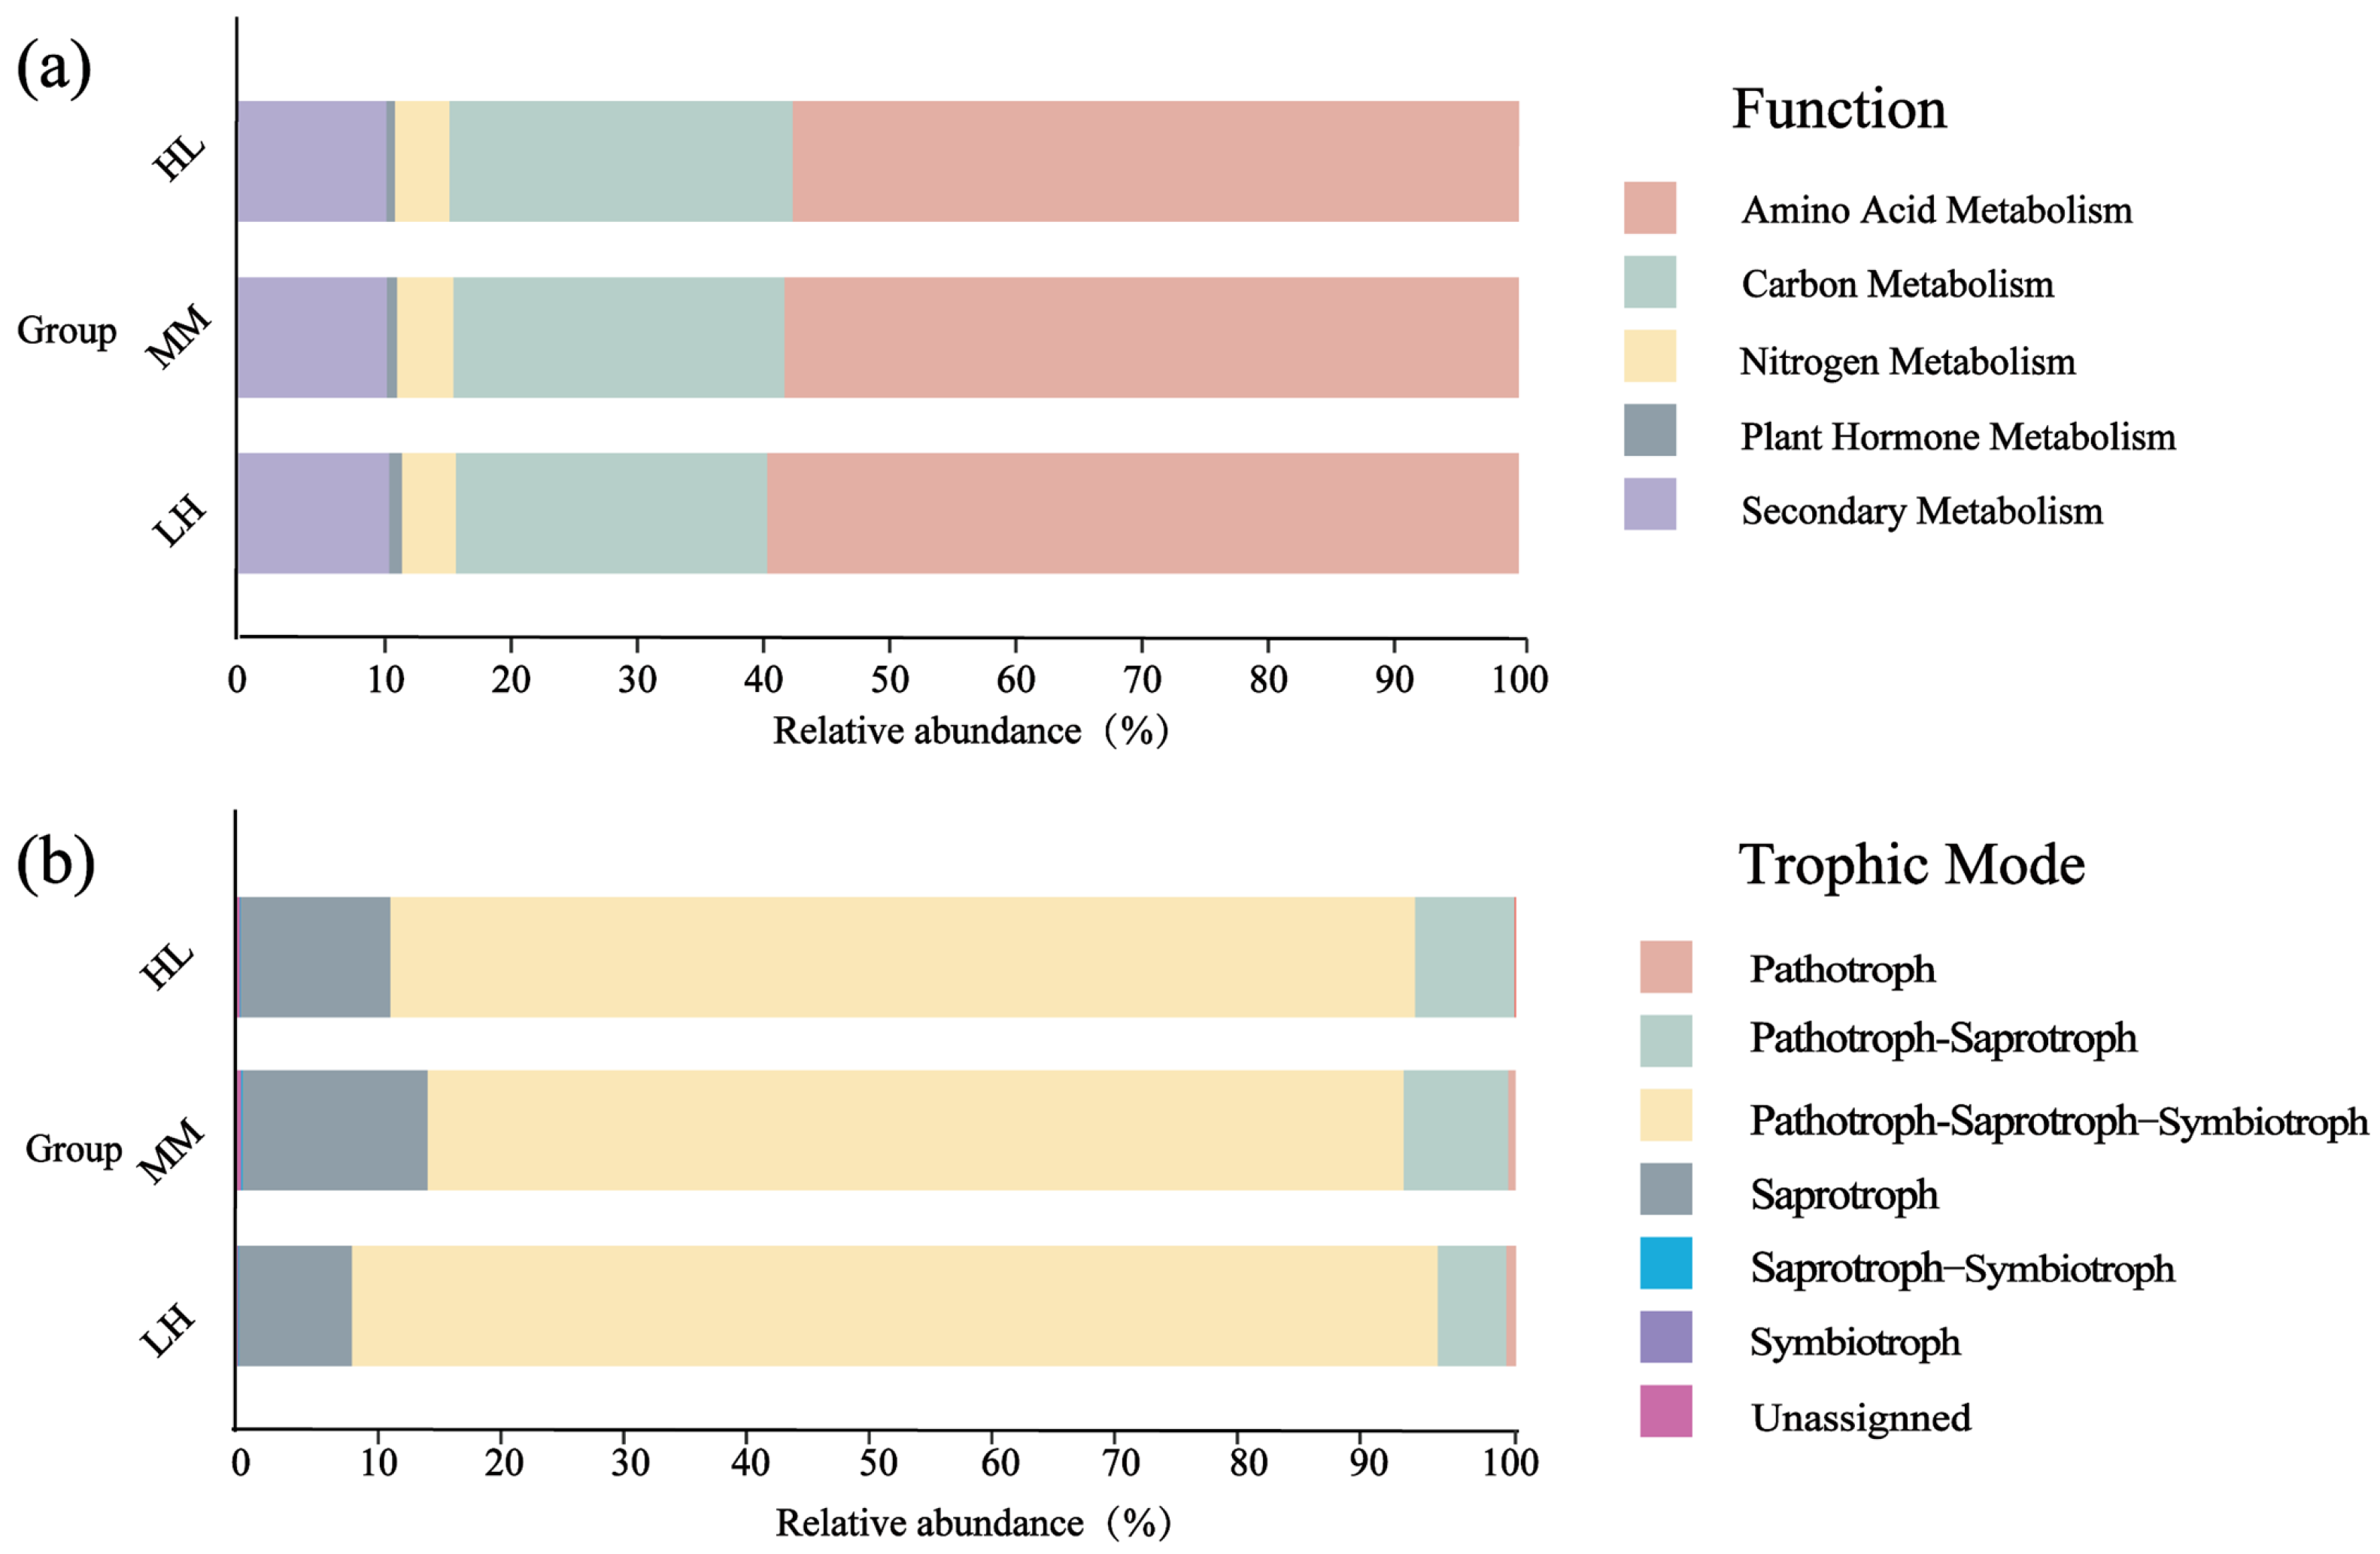
To further clarify potential functional differences in endophytic microbial communities among the different groups, PICRUSt2 and FUNGuild were used to predict bacterial metabolic pathways and fungal ecological functions, respectively, as shown in Figure 7.
Figure 7.
Functional prediction of wheat endophytic microbial communities grouped by nutritional quality. (a) PICRUSt2-based functional prediction of bacterial communities. (b) FUNGuild-based functional prediction of fungal communities.
As shown in Figure 7a, PICRUSt2 functional prediction identified five major predicted metabolic categories across the wheat quality groups. Across all groups, amino acid metabolism and carbon metabolism were the dominant functional categories, with their combined relative abundance exceeding 80%. Further comparisons revealed clear differences in pathway abundance among groups. The HL group had the highest relative abundance of carbon metabolism pathways, followed by the MM group, whereas the LH group showed the lowest abundance. In contrast, for other key pathways, including secondary metabolism, phytohormone metabolism, and nitrogen metabolism, the LH group consistently exhibited the highest relative abundance, followed by the MM group, while the HL group showed the lowest abundance. These results suggest that the endophytic bacterial community in the LH group showed higher predicted metabolic potential related to secondary metabolism, phytohormone-related metabolism, and nitrogen metabolism. The MM group showed a relatively balanced overall metabolic functional profile, whereas the HL group showed a higher relative abundance of predicted functions related to carbon metabolism.
For FUNGuild functional prediction, the confidence levels “highly probable,” “probable,” and “possible” were retained to improve the reliability of functional assignment. As shown in Figure 7b, FUNGuild-based ecological guild assignment classified the endophytic fungal communities into six predicted trophic modes: pathotroph, pathotroph–saprotroph, pathotroph–saprotroph–symbiotroph, saprotroph, saprotroph–symbiotroph, and symbiotroph. Among these, the pathotroph–saprotroph–symbiotroph mode represented the dominant trophic mode across all groups, with a relative abundance consistently above 75%, following the trend LH > HL > MM. In addition, the saprotroph and pathotroph–saprotroph modes also remained relatively abundant across groups, with the highest relative abundance observed in the MM group, followed by the HL group, and the lowest in the LH group.
4. Discussion
4.1. Composition and Divergence Patterns of Seed Endophytic Microbiota Across Wheat Nutritional Quality Groups
The abundance analysis in this study showed that seed endophytic bacterial communities in wheat were dominated by Pantoea and Pseudomonas. This finding is highly consistent with the results reported by Solanki et al. [18]. At the genus level, the present study further showed that these two genera were consistently detected as endophytic bacterial taxa in wheat seeds. In terms of the fungal community, the community structure exhibited marked functional diversity, comprising taxa such as Alternaria and Cladosporium, as well as microorganisms with potential metabolic functions, including Filobasidium, Sporobolomyces, and Vishniacozyma. This is consistent with the view proposed by Deng et al. [19] suggesting that wheat endophytic microbial communities do not represent a single functional group but rather constitute a complex microecosystem comprising microbial taxa with diverse potential ecological roles. It can be inferred that such complex microbial co-occurrence patterns within the community may be closely associated with differences in nutrient-related characteristics of wheat grains and, consequently, with wheat nutritional quality profiles, although the underlying ecological and metabolic relationships require further experimental validation.
Systematic analysis of differential microorganisms among groups, together with functional prediction, revealed distinct microbial community characteristics and predicted functional profiles associated with different wheat quality groups. The HL group was characterized by a higher relative abundance of predicted functions related to carbon metabolism, accompanied by the enrichment of taxa such as Bullera, a representative genus of Basidiomycota. Previous studies have suggested that such fungi may influence host carbon metabolism, potentially contributing to increased starch accumulation and changes in the relative protein proportion [8]. These observations suggest a potential association between the microbial characteristics of the HL group and its relatively high starch content, although a direct contribution of these microorganisms to starch biosynthesis cannot be inferred from the present data. The MM group exhibited an intermediate pattern in several microbial community and predicted functional characteristics, which may be associated with the relatively moderate starch and protein contents observed in this group [20]. In contrast, the LH group showed a higher relative abundance of predicted functions related to nitrogen metabolism, accompanied by distinct microbial taxa and co-occurrence patterns. These co-occurrence patterns, together with the predicted functional profiles, suggest a potential association between the endophytic microbial community and carbon–nitrogen allocation in wheat grains. Such associations may be linked to differences in amino acid metabolism and the relative accumulation of protein and starch [21,22]. Notably, the microbial patterns observed in the LH group partially differed from the findings of Jiang et al. [8]. These findings suggest that the observed microbial associations may be more closely associated with predicted protein-related functional profiles than with starch accumulation, potentially reflecting differences in wheat quality characteristics.
4.2. Co-Occurrence Network Characteristics of Seed Endophytic Microbiota Across Wheat Nutritional Quality Groups
A systematic comparison of the structural characteristics of seed endophytic microbial communities among wheat quality groups revealed distinct community patterns. In the HL group, the microbial community was mainly composed of carbon metabolism-associated microorganisms and some potential pathogens. Although Ajayi et al. [23] suggested that taxa represented by Fusarium may impose certain biotic stresses and negatively affect quality traits, the enrichment of Massilia, Bullera, and related taxa in the present study may be associated with differences in microbial community organization and predicted functional profiles. These microbial groups may be associated with predicted functions related to carbohydrate metabolism and degradation and may also show potential associations with pathogen suppression [24]. Such a complex and diverse microbial environment may collectively maintain a metabolic state favorable for high starch accumulation.
In the MM group, the microbial community was mainly characterized by taxa associated with microecological homeostasis and metabolic coordination. These microorganisms may be associated with the predicted functional profiles of carbon and nitrogen metabolism and may also exhibit potential associations with other microbial taxa through niche-related co-occurrence patterns, potentially contributing to differences in the nutritional profiles of wheat grains [23,24]. In the LH group, the microbial community was dominated by growth-promoting bacteria and pathogenic fungi. Overall, these findings are consistent with the observations of Pieterse et al. [25] and further suggest a potential link between endophytic microbial community organization and host functional responses.
Based on the above topological features and taxonomic composition, the three wheat quality groups exhibited distinct microbial community organizations and co-occurrence patterns. The HL group was characterized by relatively high modularity and predicted carbon metabolism-related functional potential, which may be associated with the relatively high starch content observed in this group [26]. The MM group exhibited intermediate network characteristics and predicted carbon- and nitrogen-related functional profiles, which may be associated with its relatively moderate starch and protein contents [24]. In contrast, the LH group exhibited high network connectivity, with more extensive co-occurrence associations among microbial taxa [27]. Together with the higher relative abundance of predicted nitrogen metabolism-related functions, these characteristics suggest a potential association between the endophytic microbial community and the relatively high protein content of the LH group. Previous studies have suggested that microbial associations may influence host stress responses and carbon–nitrogen metabolism [25]; however, the present results do not demonstrate direct microbial regulation of host carbon or nitrogen allocation. Therefore, the potential involvement of these microbial communities in protein and starch accumulation should be regarded as a hypothesis requiring further experimental validation.
4.3. Associations Between Core Seed Endophytic Microbiota and Wheat Nutritional Quality Traits
The specific associations between grain endophytic microbial communities and wheat nutritional quality differed markedly among the three wheat quality groups.
In the HL group, the association network between microorganisms and quality traits was relatively simple and concentrated. A fungal community centered on Fusarium showed a clear negative correlation with protein content. This co-occurrence pattern suggests that specific fungal communities may be associated with predicted differences in carbon and nitrogen metabolism in the HL group. Such associations could potentially be linked to the balance between carbon and nitrogen allocation and the high starch proportion observed in the grains, although this hypothesis requires further experimental validation. This inference is consistent with previous studies reporting that pathogenic fungi can affect host nutrient allocation [28,29] and may provide a potential explanation for the observed nutritional characteristics of the HL group.
The MM group exhibited a more balanced and complex microbial interaction pattern. Saccharibacillus occupied a highly connected position in the network, indicating its prominence within the observed association network. This genus may be associated with host carbon and nitrogen metabolism. Its co-occurrence with potentially beneficial microorganisms such as Vishniacozyma, Papiliotrema, Massilia, and Acremonium may reflect potential associations with host metabolic homeostasis [30,31]. Collectively, these co-occurrence patterns may be associated with carbon–nitrogen metabolism and the relatively moderate starch and protein contents observed in the MM group, although direct microbial regulation of nutrient allocation cannot be inferred from the correlation-based network.
The LH group exhibited the highest network complexity, characterized by more extensive co-occurrence associations among nodes. Genera such as Pseudomonas, Alternaria, Arthrobacter, and Enhydrobacter were prominent members of these co-occurrence patterns and may be associated with predicted nitrogen metabolism-related functions and the relatively high protein content observed in the LH group. This finding differs from the results reported by Jiang et al. [8], suggesting that the associations of microorganisms such as Pseudomonas, Rhodococcus, and Fusarium with protein- and starch-related characteristics may vary across wheat cultivars or environmental conditions. Although taxa such as Alternaria may consume carbon sources by inducing stress responses and thereby affect wheat quality [29,32], microorganisms such as Vishniacozyma, Saccharibacillus, and Rhodococcus showed co-occurrence associations that may be linked to host stress responses and nutritional quality [8,31,33]. Collectively, these microbial co-occurrence patterns were associated with the low-starch, high-protein nutritional profile observed in the LH group, suggesting a potential relationship between the organization of the seed endophytic microbial community and grain nutritional characteristics. These findings suggest a potential association between higher grain protein content and differences in predicted metabolic profiles, which may also be linked to cultivar characteristics, seed composition, and environmental factors [34].
4.4. Limitations, Implications, and Future Perspectives
This study was mainly based on a wheat population tested in Yangling, Shaanxi Province, and did not fully investigate the effects of complex environmental factors across different ecological regions on wheat seed endophytic microbiota and nutritional quality. In addition, wheat nutritional quality is influenced by host genotype, which may also affect the composition and structure of seed endophytic microbial communities. Previous studies have demonstrated that wheat grain endophytic microbiota can be shaped by both wheat genotype and cultivation environment, and that these microbial differences may further influence downstream microbial ecosystems and quality-related characteristics [35]. Because each quality group in this study comprised different wheat cultivars, the potential confounding effects of cultivar/genotype and quality group could not be fully disentangled. Therefore, the observed microbial differences among the HL, MM, and LH groups should be interpreted as associations with different wheat quality profiles rather than effects attributable solely to nutritional quality. Furthermore, the functional profiles obtained using PICRUSt2 and FUNGuild were inferred from taxonomic composition and represent predicted functional potential rather than direct measurements of microbial metabolic activity or ecological function. However, this study primarily focused on the association between microbial community structure and nutritional quality, while the interaction mechanisms and underlying processes linking these two aspects remain to be further elucidated.
Given the limited number of studies examining the relationship between wheat seed endophytic microbiota and nutritional quality, this study systematically characterized their associations, aiming to provide a theoretical basis for future investigations into the potential application of seed microbiome manipulation for targeted improvement of wheat nutritional quality. Moreover, this study has potential value for food applications, as it may provide a basis for the screening and quality optimization of functional wheat raw materials.
5. Conclusions
By systematically characterizing the structure of seed endophytic microbial communities across wheat quality groups, this study identified key microbial taxa associated with wheat nutritional characteristics. In the HL group, endophytic taxa, including Massilia, Erwinia, Bullera, and Fusarium, were associated with predicted carbon metabolism-related functions. In the MM group, network-associated taxa, such as Curtobacterium, Rhodococcus, Saccharibacillus, and Vishniacozyma, exhibited distinct co-occurrence patterns and were associated with diverse predicted metabolic functions. The LH group was characterized by the enrichment of bacterial genera including Arthrobacter, Enhydrobacter, and Exiguobacterium, together with fungal taxa such as Alternaria, which showed potential associations with biotic stress-related interactions and grain protein variation. Collectively, these findings reveal distinct associations between seed endophytic microbial community characteristics and wheat nutritional quality profiles.
This study provides a theoretical basis for further exploring the contribution of seed microbiota to wheat quality variation and offers potential insights for the development of microbiome-based strategies for wheat quality improvement and specialized wheat processing.
Author Contributions
Writing—original draft preparation, writing—review and editing, software, validation, H.S.; methodology, software, K.Y.; formal analysis, R.L.; investigation, Z.C.; investigation, Y.S. and Y.Z.; data curation, methodology, Z.M. and Q.Z.; funding acquisition, supervision, project administration, D.H. All authors have read and agreed to the published version of the manuscript.
Funding
This work was supported by Moutai Co., Ltd. Science and Technology “Open Competition” Project [grant number MTGF2023037] and Major Project of Sichuan Province Engineering Technology Research Center of Liquor-Making Grains [grant number H50525003].
Institutional Review Board Statement
Not applicable.
Informed Consent Statement
Informed consent was obtained from all subjects involved in the study.
Data Availability Statement
All data available are presented in this manuscript.
Conflicts of Interest
All authors declare that the research was conducted in the absence of any commercial or financial relationships that could be construed as a potential conflict of interest.
Appendix A
Table A1.
PERMANOVA analysis of bacterial and fungal community composition associated with wheat quality and cultivar.
References
- Peng, Y.; Zhao, Y.; Yu, Z.; Zeng, J.; Xu, D.; Dong, J.; Ma, W. Wheat Quality Formation and Its Regulatory Mechanism. Front. Plant Sci. 2022, 13, 834654. [Google Scholar] [CrossRef] [Scilit] [PubMed]
- Desai, A.S.; Brennan, M.A.; Brennan, C.S. Effect of Fortification with Fish (Pseudophycis bachus) Powder on Nutritional Quality of Durum Wheat Pasta. Foods 2018, 7, 62. [Google Scholar] [CrossRef] [Scilit] [PubMed]
- Xijun, L.; Junjie, G.; Danli, W.; Lin, L.; Jiaran, Z. Effects of protein in wheat flour on retrogradation of wheat starch. J. Food Sci. 2014, 79, C1505–C1511. [Google Scholar] [CrossRef] [Scilit] [PubMed]
- Stupin, A.S.; Lukyanova, O.V.; Vinogradov, D.V. Formation of Grain Quality of Spring Soft Wheat Varieties Depending on Agrotechnical Methods. IOP Conf. Ser. Earth Environ. Sci. 2022, 954, 012080. [Google Scholar] [CrossRef] [Scilit]
- Tian, Y.; Liu, P.; Zhang, X.; Liu, Y.; Kong, D.; Nie, Y.; Xu, H.; Han, X.; Sang, W.; Li, W. Genome-wide association study and KASP marker development for starch quality traits in wheat. Plant Genome 2024, 17, e20514. [Google Scholar] [CrossRef] [Scilit] [PubMed]
- Cai, W.L.; Song, X.H.; Wei, J.; Liu, X.Q.; Li, L.L.; Liu, X.Y.; Li, Z.H.; Wang, P.; Cui, C.X.; Chen, G.Z.; et al. Effects of Reduced and Delayed Nitrogen Fertilization on Grain Yield and Quality of Wheat. J. Triticeae Crops 2025, 45, 942–951. [Google Scholar]
- Wang, X.Y.; Zhao, Y.; Tian, X.X.; Ren, L.Y.; Wang, R.J.; Li, Z.H.; Li, X.Y. Spatiotemporal Variation Characteristics of Wheat Quality and Effects of Meteorological Factors in Shandong Province. J. Triticeae Crops 2026, 46, 520–530. [Google Scholar]
- Jiang, M.; Wang, Z.; Li, X.; Liu, S.; Song, F.; Liu, F. Relationship between endophytic microbial diversity and grain quality in wheat exposed to multi-generational CO2 elevation. Sci. Total Environ. 2021, 776, 146029. [Google Scholar] [CrossRef] [Scilit] [PubMed]
- Yergeau, É.; Quiza, L.; Tremblay, J. Microbial indicators are better predictors of wheat yield and quality than N fertilization. FEMS Microbiol. Ecol. 2020, 96, fiz205. [Google Scholar] [CrossRef] [Scilit] [PubMed]
- Sanz-Puente, I.; Redondo-Salvo, S.; Torres-Cortés, G.; de Toro, M.; Fernandes, S.; Börner, A.; Lorenzo, Ó.; de la Cruz, F.; Robledo, M. Seed-mediated vertical transmission of Pantoea core endophytes. ISME J. 2025, 19, wraf192. [Google Scholar] [CrossRef] [Scilit] [PubMed]
- Hadj Brahim, A.; Ben Ali, M.; Daoud, L.; Jlidi, M.; Akremi, I.; Hmani, H.; Feto, N.A.; Ben Ali, M. Biopriming of Durum Wheat Seeds with Endophytic Diazotrophic Bacteria Enhances Tolerance to Fusarium Head Blight and Salinity. Microorganisms 2022, 10, 970. [Google Scholar] [CrossRef] [Scilit] [PubMed]
- Ren, Z.; Chen, A.J.; Zong, Q.; Du, Z.; Guo, Q.; Liu, T.; Chen, W.; Gao, L. Microbiome Signature of Endophytes in Wheat Seed Response to Wheat Dwarf Bunt Caused by Tilletia controversa Kühn. Microbiol. Spectr. 2023, 11, e00390-22. [Google Scholar] [CrossRef] [Scilit] [PubMed]
- Qin, Y.; Xie, X.-Q.; Khan, Q.; Wei, J.-L.; Sun, A.-N.; Su, Y.-M.; Guo, D.-J.; Li, Y.-R.; Xing, Y.-X. Endophytic Nitrogen-Fixing Bacteria DX120E Inoculation Altered the Carbon and Nitrogen Metabolism in Sugarcane. Front. Microbiol. 2022, 13, 1000033. [Google Scholar] [CrossRef] [Scilit] [PubMed]
- Determination of Starch in Foods. 2023. Volume 16. Available online: https://www.codeofchina.com/standard/GB5009.9-2023.html?utm_source=chatgpt.com (accessed on 23 July 2026).
- Determination of Amylose Content in Rice 2025. Volume 20. Available online: https://www.codeofchina.com/standard/GB5009.9-2023.html?utm_source=chatgpt.com (accessed on 23 July 2026).
- Determination of Protein in Foods. 2016. Volume 12. Available online: https://www.codeofchina.com/standard/GB5009.9-2023.html?utm_source=chatgpt.com (accessed on 23 July 2026).
- Determination of Wet Gluten and Gluten Index by Mechanical Means. 2024. Volume 20. Available online: https://www.codeofchina.com/standard/GB5009.9-2023.html?utm_source=chatgpt.com (accessed on 23 July 2026).
- Solanki, M.K.; Abdelfattah, A.; Sadhasivam, S.; Zakin, V.; Wisniewski, M.; Droby, S.; Sionov, E. Analysis of Stored Wheat Grain-Associated Microbiota Reveals Biocontrol Activity among Microorganisms against Mycotoxigenic Fungi. J. Fungi 2021, 7, 781. [Google Scholar] [CrossRef] [Scilit] [PubMed]
- Deng, S.; Liu, Y.; Deng, Z.; Huang, Y. Isolation of actinobacterial endophytes from wheat sprouts as biocontrol agents to control seed pathogenic fungi. Arch. Microbiol. 2021, 203, 6163–6171. [Google Scholar] [CrossRef] [Scilit] [PubMed]
- Opulente, D.A.; LaBella, A.L.; Harrison, M.C.; Wolters, J.F.; Liu, C.; Li, Y.; Kominek, J.; Steenwyk, J.L.; Stoneman, H.R.; VanDenAvond, J.; et al. Genomic factors shape carbon and nitrogen metabolic niche breadth across Saccharomycotina yeasts. Science 2024, 384, eadj4503. [Google Scholar] [CrossRef] [Scilit] [PubMed]
- Lacrampe, N.; Lugan, R.; Dumont, D.; Nicot, P.C.; Lecompte, F.; Colombié, S. Modelling metabolic fluxes of tomato stems reveals that nitrogen shapes central metabolism for defence against Botrytis cinerea. J. Exp. Bot. 2024, 75, 4093–4110. [Google Scholar] [CrossRef] [Scilit] [PubMed]
- Schultz, J.C.; Appel, H.M.; Ferrieri, A.P.; Arnold, T.M. Flexible resource allocation during plant defense responses. Front. Plant Sci. 2013, 4, 324. [Google Scholar] [CrossRef] [Scilit] [PubMed]
- Ajayi, O.; Mahalingam, R. Seed endophytes of malting barley from different locations are shaped differently and are associated with malt quality traits. BMC Plant Biol. 2025, 25, 151. [Google Scholar] [CrossRef] [Scilit] [PubMed]
- Romanens, E.; Pedan, V.; Meile, L.; Miescher Schwenninger, S. Influence of two anti-fungal Lactobacillus fermentum-Saccharomyces cerevisiae co-cultures on cocoa bean fermentation and final bean quality. PLoS ONE 2020, 15, e0239365. [Google Scholar] [CrossRef] [Scilit] [PubMed]
- Pieterse, C.M.; Zamioudis, C.; Berendsen, R.L.; Weller, D.M.; Van Wees, S.C.; Bakker, P.A. Induced systemic resistance by beneficial microbes. Annu. Rev. Phytopathol. 2014, 52, 347–375. [Google Scholar] [CrossRef] [Scilit] [PubMed]
- Huot, B.; Yao, J.; Montgomery, B.L.; He, S.Y. Growth-defense tradeoffs in plants: A balancing act to optimize fitness. Mol. Plant 2014, 7, 1267–1287. [Google Scholar] [CrossRef] [Scilit] [PubMed]
- Wagg, C.; Schlaeppi, K.; Banerjee, S.; Kuramae, E.E.; van der Heijden, M.G.A. Fungal-bacterial diversity and microbiome complexity predict ecosystem functioning. Nat. Commun. 2019, 10, 4841. [Google Scholar] [CrossRef] [Scilit] [PubMed]
- Trümper, C.; Paffenholz, K.; Smit, I.; Kössler, P.; Karlovsky, P.; Braun, H.P.; Pawelzik, E. Identification of regulated proteins in naked barley grains (Hordeum vulgare nudum) after Fusarium graminearum infection at different grain ripening stages. J. Proteom. 2016, 133, 86–92. [Google Scholar] [CrossRef] [Scilit] [PubMed]
- Zhao, J.Q. Diversity Analysis of Microorganisms on Grain Surfaces and Their Effects on Grain Quality. Master’s Thesis, Henan University of Technology, Zhengzhou, China, 2024. [Google Scholar] [CrossRef]
- Jiang, L.; Seo, J.; Peng, Y.; Jeon, D.; Park, S.J.; Kim, C.Y.; Kim, P.I.; Kim, C.H.; Lee, J.H.; Lee, J. Genome insights into the plant growth-promoting bacterium Saccharibacillus brassicae ATSA2(T). AMB Express 2023, 13, 9. [Google Scholar] [CrossRef] [Scilit] [PubMed]
- Rivas, R.; García-Fraile, P.; Zurdo-Piñeiro, J.L.; Mateos, P.F.; Martínez-Molina, E.; Bedmar, E.J.; Sánchez-Raya, J.; Velázquez, E. Saccharibacillus sacchari gen. nov., sp. nov., isolated from sugar cane. Int. J. Syst. Evol. Microbiol. 2008, 58, 1850–1854. [Google Scholar] [CrossRef] [Scilit] [PubMed]
- Zhao, L.; Wang, J.; Zhang, H.; Zhou, Y.; Wang, C.; Wang, P.; Wei, Z.; Li, H.; Ding, Y. Integration Analysis of Transcriptomics and Proteomics Reveals the Inhibitory Effect of Carvacrol on Alternaria alternata by Interfering with Carbohydrate Metabolism. Postharvest Biol. Technol. 2024, 213, 112928. [Google Scholar] [CrossRef] [Scilit]
- Vujanovic, V. Tremellomycetes Yeasts in Kernel Ecological Niche: Early Indicators of Enhanced Competitiveness of Endophytic and Mycoparasitic Symbionts against Wheat Pathobiota. Plants 2021, 10, 905. [Google Scholar] [CrossRef] [Scilit] [PubMed]
- Wang, X.; Hou, L.; Lu, Y.; Wu, B.; Gong, X.; Liu, M.; Wang, J.; Sun, Q.; Vierling, E.; Xu, S. Metabolic Adaptation of Wheat Grain Contributes to a Stable Filling Rate under Heat Stress. J. Exp. Bot. 2018, 69, 5531–5545. [Google Scholar] [CrossRef] [Scilit] [PubMed]
- Zhou, H.; Zhao, M.; Xiong, Q.; Feng, C.; Pu, Z.; Chen, G.; Wang, S.; Dong, Y.; Wang, X.; Long, H.; et al. Effect of Wheat Varieties and Cultivation Environments on Grain Endophytes, Microbial Communities, and Quality of Medium-High Temperature Daqu in Chinese Baijiu. Foods 2025, 14, 982. [Google Scholar] [CrossRef] [Scilit] [PubMed]
Disclaimer/Publisher’s Note: The statements, opinions and data contained in all publications are solely those of the individual author(s) and contributor(s) and not of MDPI and/or the editor(s). MDPI and/or the editor(s) disclaim responsibility for any injury to people or property resulting from any ideas, methods, instructions or products referred to in the content. |
© 2026 by the authors. Licensee MDPI, Basel, Switzerland. This article is an open access article distributed under the terms and conditions of the Creative Commons Attribution (CC BY) license.