


Abstract
Climate variability and recurrent spring drought increasingly affect cereal production in Central Europe, creating a need for field phenotyping methods that can detect crop responses before harvest. This study evaluated UAV-derived multispectral vegetation indices in relation to grain-yield variation in spring wheat, spring barley, and oat grown at the same location during two climatically contrasting seasons. Multispectral measurements were obtained repeatedly during crop development in drought-affected 2024, characterized by faster thermal accumulation, and in the wetter and cooler 2025 season. Spectral–yield relationships differed markedly between seasons and species. In 2024, correlations with yield were strong in wheat (up to r = 0.793) and barley (up to r = 0.826), but moderate in oat (up to r = 0.512). In 2025, these relationships were weaker in wheat and barley and non-significant in oat. After adjustment for field-strip effects, this seasonal contrast remained in wheat and barley, although with weaker correlations, but not in oat: the 2024 oat correlations disappeared, whereas selected 2025 correlations became significant. PCA showed that vegetation indices formed a common spectral gradient, while the association between grain yield and this gradient varied by species and season. CART analysis supported these patterns, with more complex trees and stronger cross-validated performance in 2024. The results show that UAV spectral phenotyping captured yield-related canopy variation more clearly in 2024, and that the informative spectral traits and their relationships with yield differed among species and between the two contrasting seasons.
Keywords:
Triticum aestivum; Hordeum vulgare; Avena sativa; UAV-based phenotyping; climate change; drought; yield; PCA; CART 1. Introduction
Climate change is currently one of the most significant factors influencing crop production in Central Europe [1,2]. Rising air temperatures, increasing rainfall variability, and more frequent dry periods are increasing the risk of agricultural drought and reducing water availability for crops [3]. A particularly unfavorable phenomenon is the observed shift in precipitation patterns from prolonged, low-intensity rainfall to short, intense convective rain showers. Although total precipitation does not always decrease substantially, a greater proportion of water is lost through runoff and evaporation rather than infiltrating the soil [4,5,6]. This problem is particularly significant in Poland, where approximately 60% of arable land consists of light soils with limited water-holding capacity [7,8]. Under such conditions, even short periods of rainfall deficiency can lead to water stress, limiting plant growth and yield [9].
Drought affects plant functioning at many levels of biological organization [10]. One of the earliest responses is a reduction in tissue water potential and partial stomatal closure, which reduces water loss through transpiration but also restricts CO2 supply to the leaves and reduces photosynthesis [11]. High temperature may further impair photosynthetic activity by disrupting the photosynthetic apparatus and reducing the activity of Rubisco activase, the chaperone responsible for maintaining Rubisco in its active form [12,13]. Consequently, leaf and shoot growth slow, leaf area decreases, root system architecture changes, and hormonal balance is disturbed [11]. Prolonged water deficit accelerates leaf senescence, reduces chlorophyll content, impairs assimilated transport, and limits yield formation. In cereals, tillering, stem elongation, heading, and grain filling are particularly sensitive stages. Even moderate drought may substantially reduce productivity by decreasing the number of ears per unit area, kernels per ear, and thousand-grain weight [14]. However, temporary water shortages do not always translate directly into final yield losses because physiological recovery, altered growth dynamics, and assimilate redistribution may partly compensate for stress effects [15,16,17].
Those constraints are especially important for spring cereals, whose entire development cycle occurs in spring and early summer [18,19,20]. Spring wheat, spring barley, and oat have long played an important role in Polish cropping systems, particularly in crop rotations and feed production. Their cultivation has also been favored by a shorter growing season and lower production costs [21,22,23]. In 2025, the total area of spring cereals in Poland was approximately 0.9 million ha, following a substantial decline over recent decades. By comparison, winter cereals occupied approximately 4.6 million ha, including about 2.4 million ha of winter wheat and 0.4 million ha of winter barley. Spring wheat covered approximately 0.2 million ha. It remains important as a replacement crop after winter crop failure and in organic farming, although its sensitivity to drought, lower yield stability, and weaker economic competitiveness have contributed to its gradual marginalization [9]. Spring barley occupies a similar area and remains important for brewing and feed production because of its short growing season and progress in breeding for tolerance to environmental stress. Oat has the largest share among spring cereals, covering approximately 0.5 million ha annually. Its relatively stable cultivation area reflects its adaptation to poorer soils and the lack of a widely grown, frost-tolerant winter form that could replace the spring crop [9]. Growing consumer demand for fiber-rich and functional foods also supports renewed interest in oat production [24].
Despite advances in breeding and the increased yield potential of modern cultivars, evaluation of plant responses to environmental stress still relies largely on visual scoring and selection based on final yield [25,26,27]. Such assessment provides information mainly at the end of the growing season and offers limited insight into the processes responsible for differences among genotypes. Under field conditions, plant responses result from interactions among genotype, developmental stage, and multiple, strongly confounded weather variables. Consequently, methods that allow quantitative assessment of plant condition during the growing season, before differences become fully expressed in yield, are increasingly important [25].
Advances in field phenotyping have created new opportunities for crop monitoring [28,29]. Unmanned aerial vehicles (UAVs) equipped with multispectral sensors enable rapid, repeatable, and non-destructive data acquisition over large experimental areas. Reflectance recorded in selected spectral bands can be combined into vegetation indices associated with biomass development, nutritional status, chlorophyll-related canopy properties, canopy structure, and responses to water stress [28]. Indices such as NDVI, GNDVI, NDRE, OSAVI, and EVI are widely used to monitor crop condition and assess relationships with yield [30,31,32,33]. Their interpretation differs, however, because the recorded signal may be influenced by canopy greenness, biomass, chlorophyll content, nitrogen status, canopy architecture, and soil background [34].
At the same time, spectral–yield relationships are not universal. Their strength may vary with crop species, genotype, developmental stage, canopy structure, and environmental conditions [35,36,37,38,39]. Previous studies have commonly focused on individual crop species and a limited number of growing seasons. Consequently, their stability across seasons with contrasting hydrothermal conditions remains insufficiently understood, particularly in direct comparisons among spring cereal species [37,40,41,42,43,44,45]. This question is biologically relevant because spring cereal species may differ in their responses to temperature and precipitation during key stages of yield formation, as demonstrated for spring barley and oat [46]. From a breeding perspective, it is therefore important to determine which spectral indices best capture yield-related canopy variation under water stress and whether their relationships with yield are comparable among species.
To the best of our knowledge, this is the first study to compare UAV-derived spectral–yield relationships across spring wheat, spring barley, and oat cultivated simultaneously in adjacent trial areas at the same location. Therefore, this study evaluated UAV-derived vegetation indices in the three spring cereals and compared their relationships with grain yield between two growing seasons with contrasting hydrothermal conditions.
2. Materials and Methods
2.1. Plant Material and Field Trials
The experimental material consisted of spring cultivars of wheat (Triticum aestivum L.), barley (Hordeum vulgare L.), and oat (Avena sativa L.).
The spring wheat cultivars evaluated in 2024 were Aplauz, Aura, Copacabana, Eskapada, Florentyna, Goplana, Itaka, Klaudyna, Konstancja, Ksymena, KWS Dorium, KWS Facette, Leokadia, Magadan, Merkawa, Mohican, Patricia, Pireus, Stachus, SU Ahab, Uwertura, WPB Lynx, and WPB Pebbles. In 2025, Eskapada, Florentyna, Goplana, Konstancja, Pireus, and Uwertura were replaced by Akcesja, Conata, Pamiana, Pelagia, and Porfiryna.
The spring barley cultivars evaluated in 2024 were Adwokat, Amaretto, Aristelle, Bizon, Burbon, Feedway, Florence, Furio, Jovita, Kakadu, Komplet, KWS Premis, Laser, Lexy, LG Flamenco, LG Rumba, Magnus, Masimo, Mecenas, Narrator, NOS Gambit, NOS Playmaker, Pazur, Pilote, Radek, RGT Planet, Sting, and Tilmor. In 2025, Amaretto, Bizon, Jovita, Kakadu, KWS Premis, LG Rumba, Magnus, Pilote, RGT Planet, and Sting were replaced by Antares, Kamrat, KWS Imagis, Level, LG Caruso, Magellan, Nestor, Orlando, Robin, and Sartre.
The oat cultivars evaluated in 2024 were Bingo, Dynamit, Gepard, Kreator, Kozak, MHR Samuraj, Motto, Pablo, Poker, Rambo, Refleks, and Vasco. In 2025, Dynamit, MHR Samuraj, Motto, and Poker were excluded, whereas Belfer and Waran were added.
Field trials were conducted in 2024 and 2025 at Strzelce, Poland (52.314980° N, 19.407555° E), as part of the Post-Registration Variety Testing system (PDO) [47,48]. The three cereal species were evaluated in separate, adjacent trial areas according to species-specific PDO designs. Wheat and barley were cultivated under standard and intensive management, with two replicates within each management level, whereas oat was grown under standard management with three replicates. Cultivars were randomized within replicates. The management levels formed separate field strips; this spatial structure was therefore considered in the supplementary strip-adjusted analysis described below.
Each experimental plot had an area of 10 m2 and consisted of eight rows spaced 12.5 cm apart. The sowing density was 450 seeds m−2. Although the experimental fields were classified as soil quality class IIIa, they showed substantial spatial heterogeneity. Therefore, the individual plot was used as the basic analytical unit. Entire plots were harvested to determine grain yield, and spectral and agronomic variables were analyzed at the plot level without prior averaging by cultivar or management level. This approach retained the variation among individual plots and enabled direct assessment of relationships between canopy spectral characteristics and grain yield under field conditions.
The analyses included 92 and 88 wheat plots, 112 and 112 barley plots, and 36 and 30 oat plots in 2024 and 2025, respectively.
The set of cultivars was not identical between years because the trials followed the current PDO assortment. Accordingly, comparisons between 2024 and 2025 concern species-level patterns in the examined cultivar sets and are not interpreted as estimates of cultivar responses across years.
2.2. Meteorological Data
Meteorological data (daily air temperature and precipitation) for the experimental years (2024–2025) and the multi-year reference period (1996–2025) were sourced from the IMGW-PIB station (Institute of Meteorology and Water Management—National Research Institute), the nearest station with a full set of weather data.
Drought conditions were assessed using the standardized precipitation–evapotranspiration index (SPEI) and the Selyaninov hydrothermal coefficient (HTC), based on precipitation and temperature data [9,49,50,51]. Both indices were calculated monthly from March to July, covering the growing season for spring cereals in Central Europe.
2.2.1. SPEI Calculation
The SPEI was calculated from the monthly climatic water balance (D), defined as the difference between monthly precipitation (P) and potential evapotranspiration (PET) estimated from monthly mean air temperature using the Thornthwaite method, with correction for month and day length [51,52], following standardization established by Vicente-Serrano [51]. The SPEI is based on the SPI calculation framework, with the climatic water balance P-PET, rather than precipitation alone, used as the input variable. The calculations were performed using the SPEI package in R as described by Beguería et al. [53].
Drought classes were defined as follows: SPEI > −0.5, no drought; −1.0 < SPEI ≤ −0.5, moderately dry (MD); −1.5 < SPEI ≤ −1.0, dry (D); −2.0 < SPEI ≤ −1.5, very dry (VD); and SPEI ≤ −2.0, extremely dry (ED).
2.2.2. HTC Calculation
The hydrothermal coefficient (HTC) was calculated as [9,49,50]:
where P is the sum of precipitation (mm), T is the daily average air temperature (°C), and n is the number of days in the given month. Drought classes were defined as follows: HTC ≥ 1.3, no drought; 1.0 ≤ HTC < 1.3, moderately dry (MD); 0.7 ≤ HTC < 1.0, dry (D); 0.4 ≤ HTC < 0.7, very dry (VD); and HTC < 0.4, extremely dry (ED).
HTC = (P × 10)/(T × n)
2.2.3. GDD Calculation
Growing degree days (GDD) were calculated from the date of sowing to describe thermal conditions during plant development [54]:
where T av. is the daily average air temperature (°C), and 5 °C was used as the base temperature. Negative values were set to zero. Calculations covered the period from sowing to harvest.
2.3. Field Phenotyping and Trait Assessment
Field phenotyping included the assessment of phenological stages, morphological traits, yield-related traits, and disease resistance. Heading date was recorded separately for each cultivar as the number of days from 1 January, whereas emergence, tillering, stem elongation, heading, and wax maturity were expressed as average calendar dates for each species.
Morphological and yield-related traits included plant height (cm), lodging in barley and oat on a 9-point scale [Lodg.], grain moisture content (%) [Moist.], grain yield per plot (kg), and thousand grain weight (g). For oat, hectoliter weight (kg hL−1) [Hect.] and husk content (%) [Husk] were also determined. In oat, lodging was assessed twice in 2025, on 10 July and 4 August.
Disease resistance was assessed using a 9-point scale. In wheat, the evaluated diseases included powdery mildew caused by Blumeria graminis, brown rust caused by Puccinia recondita, and, in 2024, yellow rust caused by Puccinia striiformis. In barley, the assessed diseases included powdery mildew (Blumeria graminis), net blotch (Pyrenophora teres), barley leaf stripe (Pyrenophora graminea), and Cephalosporium stripe (Cephalosporium gramineum). In oat, the evaluated diseases included powdery mildew caused by Blumeria graminis, crown rust caused by Puccinia coronata, and oat leaf blotch caused by Pyrenophora chaetomioides. In 2025, powdery mildew in oat was assessed twice, on 24 June and 24 July.
Sowing and harvest dates, together with the average dates of the main phenological stages, are presented in Table 1.
Table 1.
Sowing and harvest dates as well as mean dates of phenological stages of spring wheat, barley and oat in 2024 and 2025. Dates are provided as numbers in the format Day. Month.
2.4. UAV-Based Spectral Measurements
Multispectral data were acquired using an unmanned aerial vehicle (UAV; Phantom 4 Multispectral, DJI, Shinzhen, China) equipped with sensors recording reflectance in five spectral bands: blue (450 ± 16 nm), green (560 ± 16 nm), red (650 ± 16 nm), red edge (730 ± 16 nm), and near-infrared (840 ± 26 nm). RGB images were acquired simultaneously.
UAV missions were planned using DJI GS Pro (Ground Station Pro), version 2.0.18, installed on an iPad. Depending on the cereal species and year, the surveyed area ranged from 0.08 to 0.29 ha. Flights were conducted at an altitude of 20 m above ground level (AGL), at a horizontal speed of 2.0 m s−1, with RTK/RTN positioning (BS/A 20/27) and 80% forward and 80% side overlap. Images were stored directly on a microSD card installed onboard the UAV. The camera was operated in CO Landscape mode, providing a ground sampling distance (GSD) of 1.05 cm pixel−1. A total of 9576 images were acquired in 2024 and 9279 images in 2025, including images from five multispectral bands and the RGB camera.
Flights were performed at the same time of day and, as far as field conditions allowed, under comparable illumination. The Phantom 4 Multispectral is equipped with an integrated sunlight sensor that records incident irradiance during image acquisition. Sensor metadata were retained during processing in Pix4Dfields to improve consistency among flight campaigns.
Pix4Dfields, version 2.12.1 [55], and the open-source QGIS software, version 3.44 [56], were used to generate orthomosaics for the individual spectral bands and to calculate vegetation indices for each experimental plot. RGB orthomosaics were used to delineate plot boundaries. UAV-based phenotyping was conducted on 26 April, 15 May, 21 May, 28 May, and 6 June 2024, and on 24 April, 9 May, 27 May, 12 June, and 2 July 2025. Six vegetation indices were calculated for each plot using the mean reflectance (ρ) values of the respective spectral bands (Table 2). Owing to technical limitations, spectral data were unavailable for oat on 6 June 2024 and for barley on 27 May and 12 June 2025.
Table 2.
Spectral vegetation indices used in the study and their formulas.
For each experimental plot, vegetation indices were calculated separately for each UAV acquisition date. Date-specific values were used as the primary basis for assessing changes in spectral–yield relationships during crop development. For the complementary PCA and CART analyses and for relationships with agronomic traits other than yield, the index values were averaged across the available acquisition dates for each plot, with each date receiving equal weight. These values are referred to as temporally averaged indices rather than seasonal means because the number and timing of available observations differed among some species–year datasets.
2.5. Data Structure and Statistical Analyses
All statistical analyses were performed at the individual-plot level, separately for each cereal species and growing season. Data were not averaged by cultivar or management level because of the substantial spatial heterogeneity of the experimental fields.
Minimum, maximum, mean, and standard deviation were calculated for grain yield and vegetation indices. Pearson correlation coefficients were used to assess relationships among vegetation indices, grain yield, and agronomic traits. Statistical significance was evaluated at p < 0.05 using the XLSTAT Life Science package (Version 2021.3.1.1177, Lumivero, Denver, CO, USA) Statistical Software for Excel [63]. The correlation analyses were exploratory; therefore, nominal p-values are reported without adjustment for multiple testing, and interpretation focuses primarily on effect sizes and the consistency of patterns across indices and acquisition dates.
Correlations between grain yield and individual vegetation indices were calculated separately for each UAV acquisition date to assess changes in spectral–yield relationships during crop development (Table A2). For complementary analyses combining spectral and agronomic traits, vegetation indices were averaged across the available acquisition dates for each plot, with equal weighting of dates. When measurements were unavailable for a species on a given date, the mean was calculated from the remaining observations. These temporal averages summarize the available repeated measurements and do not represent phenologically normalized trajectories.
Linear regression was used to illustrate the relationship between NDVI and grain yield. The coefficient of determination (R2) was used to describe the proportion of variation in grain yield explained by NDVI.
Because management levels and parts of the spatial field structure were arranged in strips, a sensitivity analysis was performed by removing the categorical field-strip effect from both yield and each temporally averaged vegetation index. Pearson correlations between the resulting residuals were then calculated as strip-adjusted partial correlations (Table A3). This analysis assessed how much of the plot-level spectral–yield association remained after accounting for broad spatial differences among field strips.
Principal component analysis (PCA) was used to characterize the multivariate structure of spectral and agronomic variation. The analysis included temporally averaged vegetation indices, grain yield, heading date, plant height, and other available agronomic traits. Variables were standardized before analysis, and the results were presented as biplots of the first two principal components using the FactoMineR v.25/01: An R Package for Multivariate Analysis package in R 4.6.0 [64].
Classification and Regression Tree (CART) analysis was used to identify variables and threshold values associated with grain yield. Analyses were conducted separately for each species and year using the rpart and rpart.plot package v. 3.1.4 in R 4.6.0 [65]. Grain yield was treated as the continuous response variable, whereas temporally averaged vegetation indices (NDVI, NDRE, LCI, EVI, GNDVI, and OSAVI) were included as predictors. At each node, the split producing the greatest reduction in within-node variance in grain yield was selected (method = “anova”). To account for variations in sample size (n), minimum split (minsplit) and minimum bucket size (minbucket) parameters were customized for each dataset (Table A5). To prevent overfitting, full decision trees were pruned using cost-complexity pruning (prune()) based on the minimum cross-validation error (xerror) derived from default 10-fold cross-validation (xval = 10). Model performance was summarized using training R2, cross-validated R2, cross-validation error, and root mean square error (RMSE) [65].
3. Results
3.1. Characterization of Weather in Growing Seasons
Weather conditions differed markedly between the two growing seasons (Table 3). Precipitation in March and April was relatively similar between years, whereas much stronger differences occurred from May onwards. In 2024, precipitation was approximately half that recorded in 2025 in May and July, and was also lower in June. Consequently, total precipitation from March to July amounted to 187.2 mm in 2024 compared with 313.1 mm in 2025. At the same time, temperatures were generally higher in 2024, with the largest difference observed in May (17.2 vs. 11.9 °C). Mean temperature for the March–July period was 15.2 °C in 2024 and 13.6 °C in 2025. These differences were reflected in the hydrothermal indices. In 2024, drought conditions developed during the main period of crop growth, with particularly severe water deficit indicated by SPEI in May and by HTC in July. In contrast, moisture conditions from May onwards were favorable in 2025. For the March–July period, HTC increased from 0.8 in 2024 to 1.5 in 2025, while SPEI increased from −1.9 to 0.2.
Table 3.
Monthly precipitations total and average temperatures in March–July in years 2024 and 2025 (multi-year reference data from 1996 to 2025, in parentheses), along with drought indices: HTC, and SPEI. Abbreviations: ΣP—sum of precipitation [mm]; T av.—average temperature [°C]; HTC—Hydrothermal coefficient of Selyaninov; SPEI—Standardized Precipitation Evapotranspiration Index.
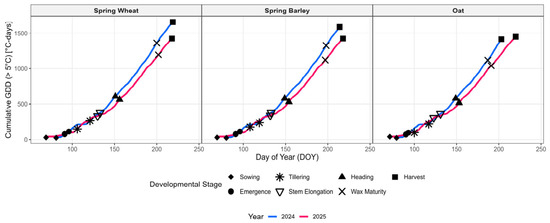
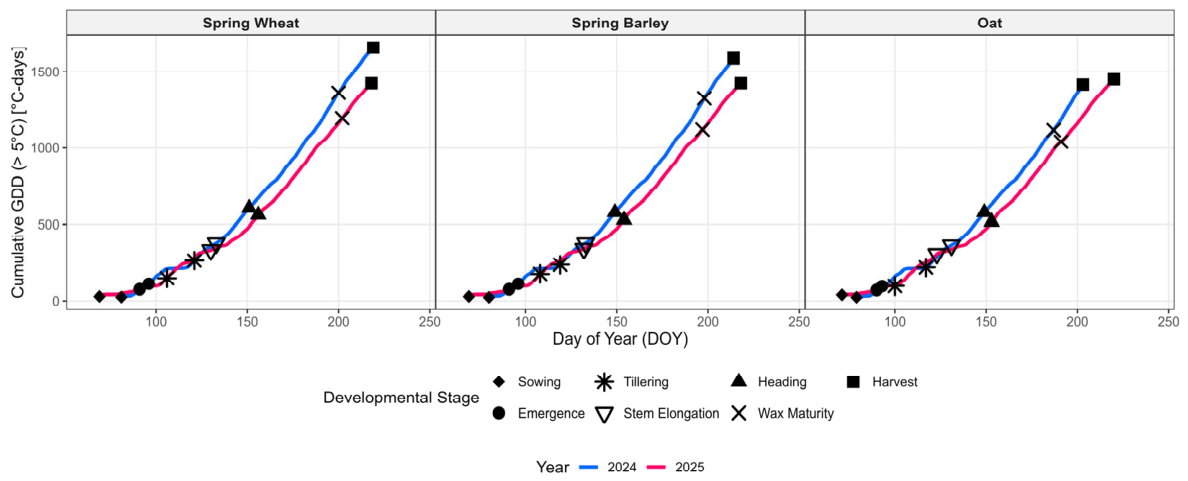
Differences between seasons were also reflected in thermal conditions expressed as growing degree days (GDD) (Figure 1). Accumulated GDD followed a similar pattern during the early part of the growing season, but from approximately mid-May onwards accumulation was faster in 2024 than in 2025. By harvest, cumulative GDD reached approximately 1600 °C·days for wheat and barley in 2024, compared with approximately 1400 °C·days in 2025. For oat, cumulative GDD at harvest was approximately 1400 °C·days in both seasons; however, direct comparison between years is affected by the substantially different harvest dates. Overall, the 2024 growing season combined lower precipitation with faster thermal accumulation during the main period of crop development, whereas 2025 was characterized by more favorable moisture conditions and slower temperature accumulation.
Figure 1.
Accumulation of growing degree days (GDD) during the 2024 and 2025 growing seasons for spring wheat, spring barley and oat. Mean dates of the recorded phenological stages are indicated by vertical dashed lines.
3.2. Differences in Spectral–Yield Relationships Among Species
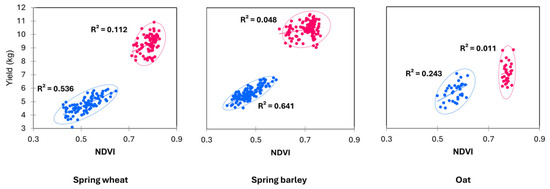
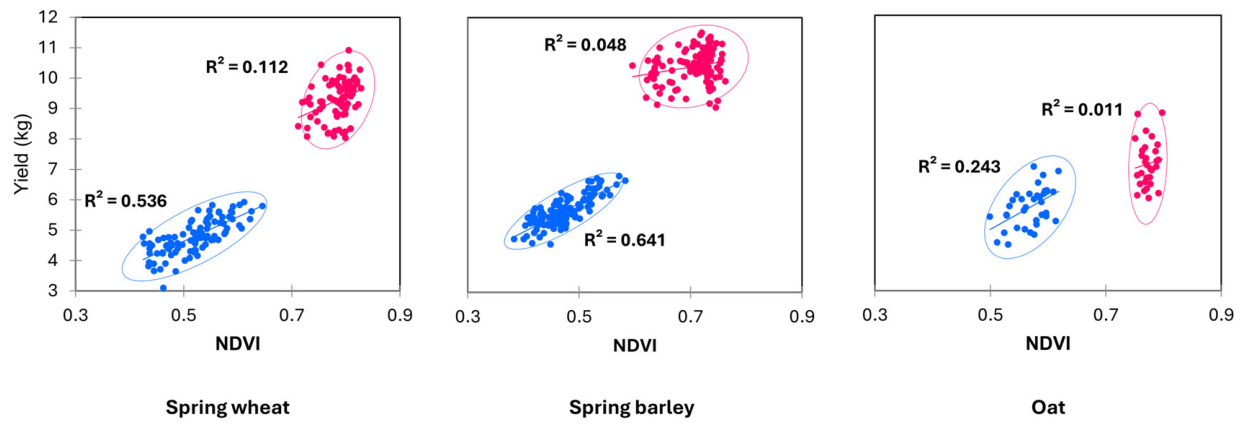
The contrasting hydrothermal conditions observed in the two growing seasons were reflected in the relationships between canopy spectral traits and grain yield (Figure 2). The strength of the NDVI–yield relationship differed among species. In general, both grain yield and NDVI values were higher in the more favorable 2025 season than in the drought-affected 2024 season. In spring wheat, the NDVI–yield relationship was relatively strong in 2024 (R2 = 0.536), whereas the coefficient of determination decreased approximately fivefold in 2025. A similar but more pronounced seasonal difference was observed in spring barley, where R2 declined from 0.641 in 2024 to 0.048 in 2025. In oat, the NDVI–yield relationship was weaker already in 2024 (R2 = 0.243) and was non-significant in 2025.
Figure 2.
Relationships between grain yield (kg/plot) and NDVI in spring wheat, spring barley, and oat during the drought-affected 2024 season (blue dots) and the more favorable 2025 season (red dots). Linear regression lines were fitted separately for each year, and the corresponding coefficients of determination (R2) are shown in each panel.
In general, both grain yield and NDVI values were higher in the more favorable 2025 season than in the drought-affected 2024 season, as also reflected by the descriptive statistics for individual acquisition dates and temporally averaged spectral indices (Table A1).
3.3. Correlation Structure of Spectral and Agronomic Traits
Temporally averaged vegetation indices were strongly intercorrelated in all three cereal species, although the strength of these relationships varied somewhat between species and years (Table 4). In wheat and barley, particularly close relationships were observed between NDRE and LCI and among NDVI, GNDVI, and OSAVI, indicating that the indices largely described a common gradient of canopy spectral variation.
Table 4.
Pearson correlation coefficients among temporally averaged vegetation indices (NDVI, NDRE, LCI, EVI, GNDVI, and OSAVI), heading date, plant height, and grain yield in spring wheat, spring barley, and oat in 2024 and 2025. Only statistically significant correlations (p < 0.05) are presented; non-significant relationships are denoted as n.s.
A strong seasonal contrast was evident in the relationships between the averaged vegetation indices and grain yield. In spring wheat in 2024, the strongest correlations with yield were observed for NDRE and LCI (r = 0.793), followed by GNDVI (r = 0.737) and NDVI (r = 0.732). In spring barley, all six indices were strongly correlated with yield (0.734 ≤ r ≤ 0.826), with the highest coefficients for OSAVI, LCI, and GNDVI. These relationships were markedly weaker in 2025, when correlation coefficients did not exceed 0.334 in wheat or 0.272 in barley.
Oat showed a different pattern. In 2024, correlations between vegetation indices and yield were moderate rather than strong, ranging from r = 0.454 for NDRE to r = 0.512 for EVI. In 2025, none of the vegetation indices was significantly correlated with grain yield. Relationships between spectral indices and agronomic traits were generally weaker and less consistent than those observed among the spectral variables themselves, although plant height was positively related to several spectral indices in selected species and seasons.
Analysis of individual UAV acquisition dates showed that the strength of spectral–yield relationships also changed during crop development (Table A2). In the drought-affected 2024 season, correlations in wheat and barley were generally weaker at the earliest acquisition and increased during May and early June. In contrast, relationships remained weak or non-significant through most of the 2025 season. Oat again showed a weaker pattern, with moderate correlations at several dates in 2024 and no significant ones in 2025.
Adjustment for field-strip effects reduced several correlations (Table A3), showing that broad spatial field structure contributed to the observed plot-level relationships. In 2024, however, significant adjusted correlations remained for most indices in wheat and for all indices in barley, with the strongest adjusted relationships for NDRE and LCI. In oat, the 2024 correlations were no longer significant after adjustment. In 2025, adjusted correlations remained weak in wheat, disappeared in barley, and were significant for selected indices in oat. The unadjusted correlations therefore describe the combined field-scale association, whereas the adjusted results provide a more conservative assessment after removal of strip-level variation.
3.4. Multivariate Relationships Among Spectral and Agronomic Traits
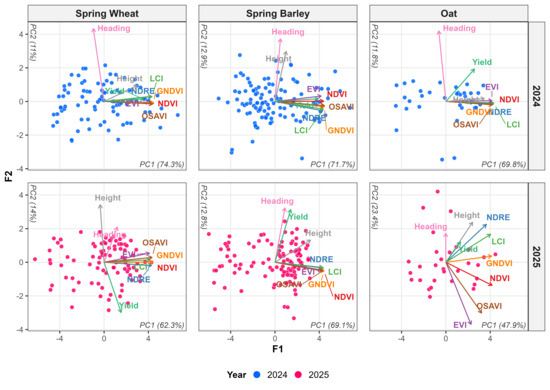
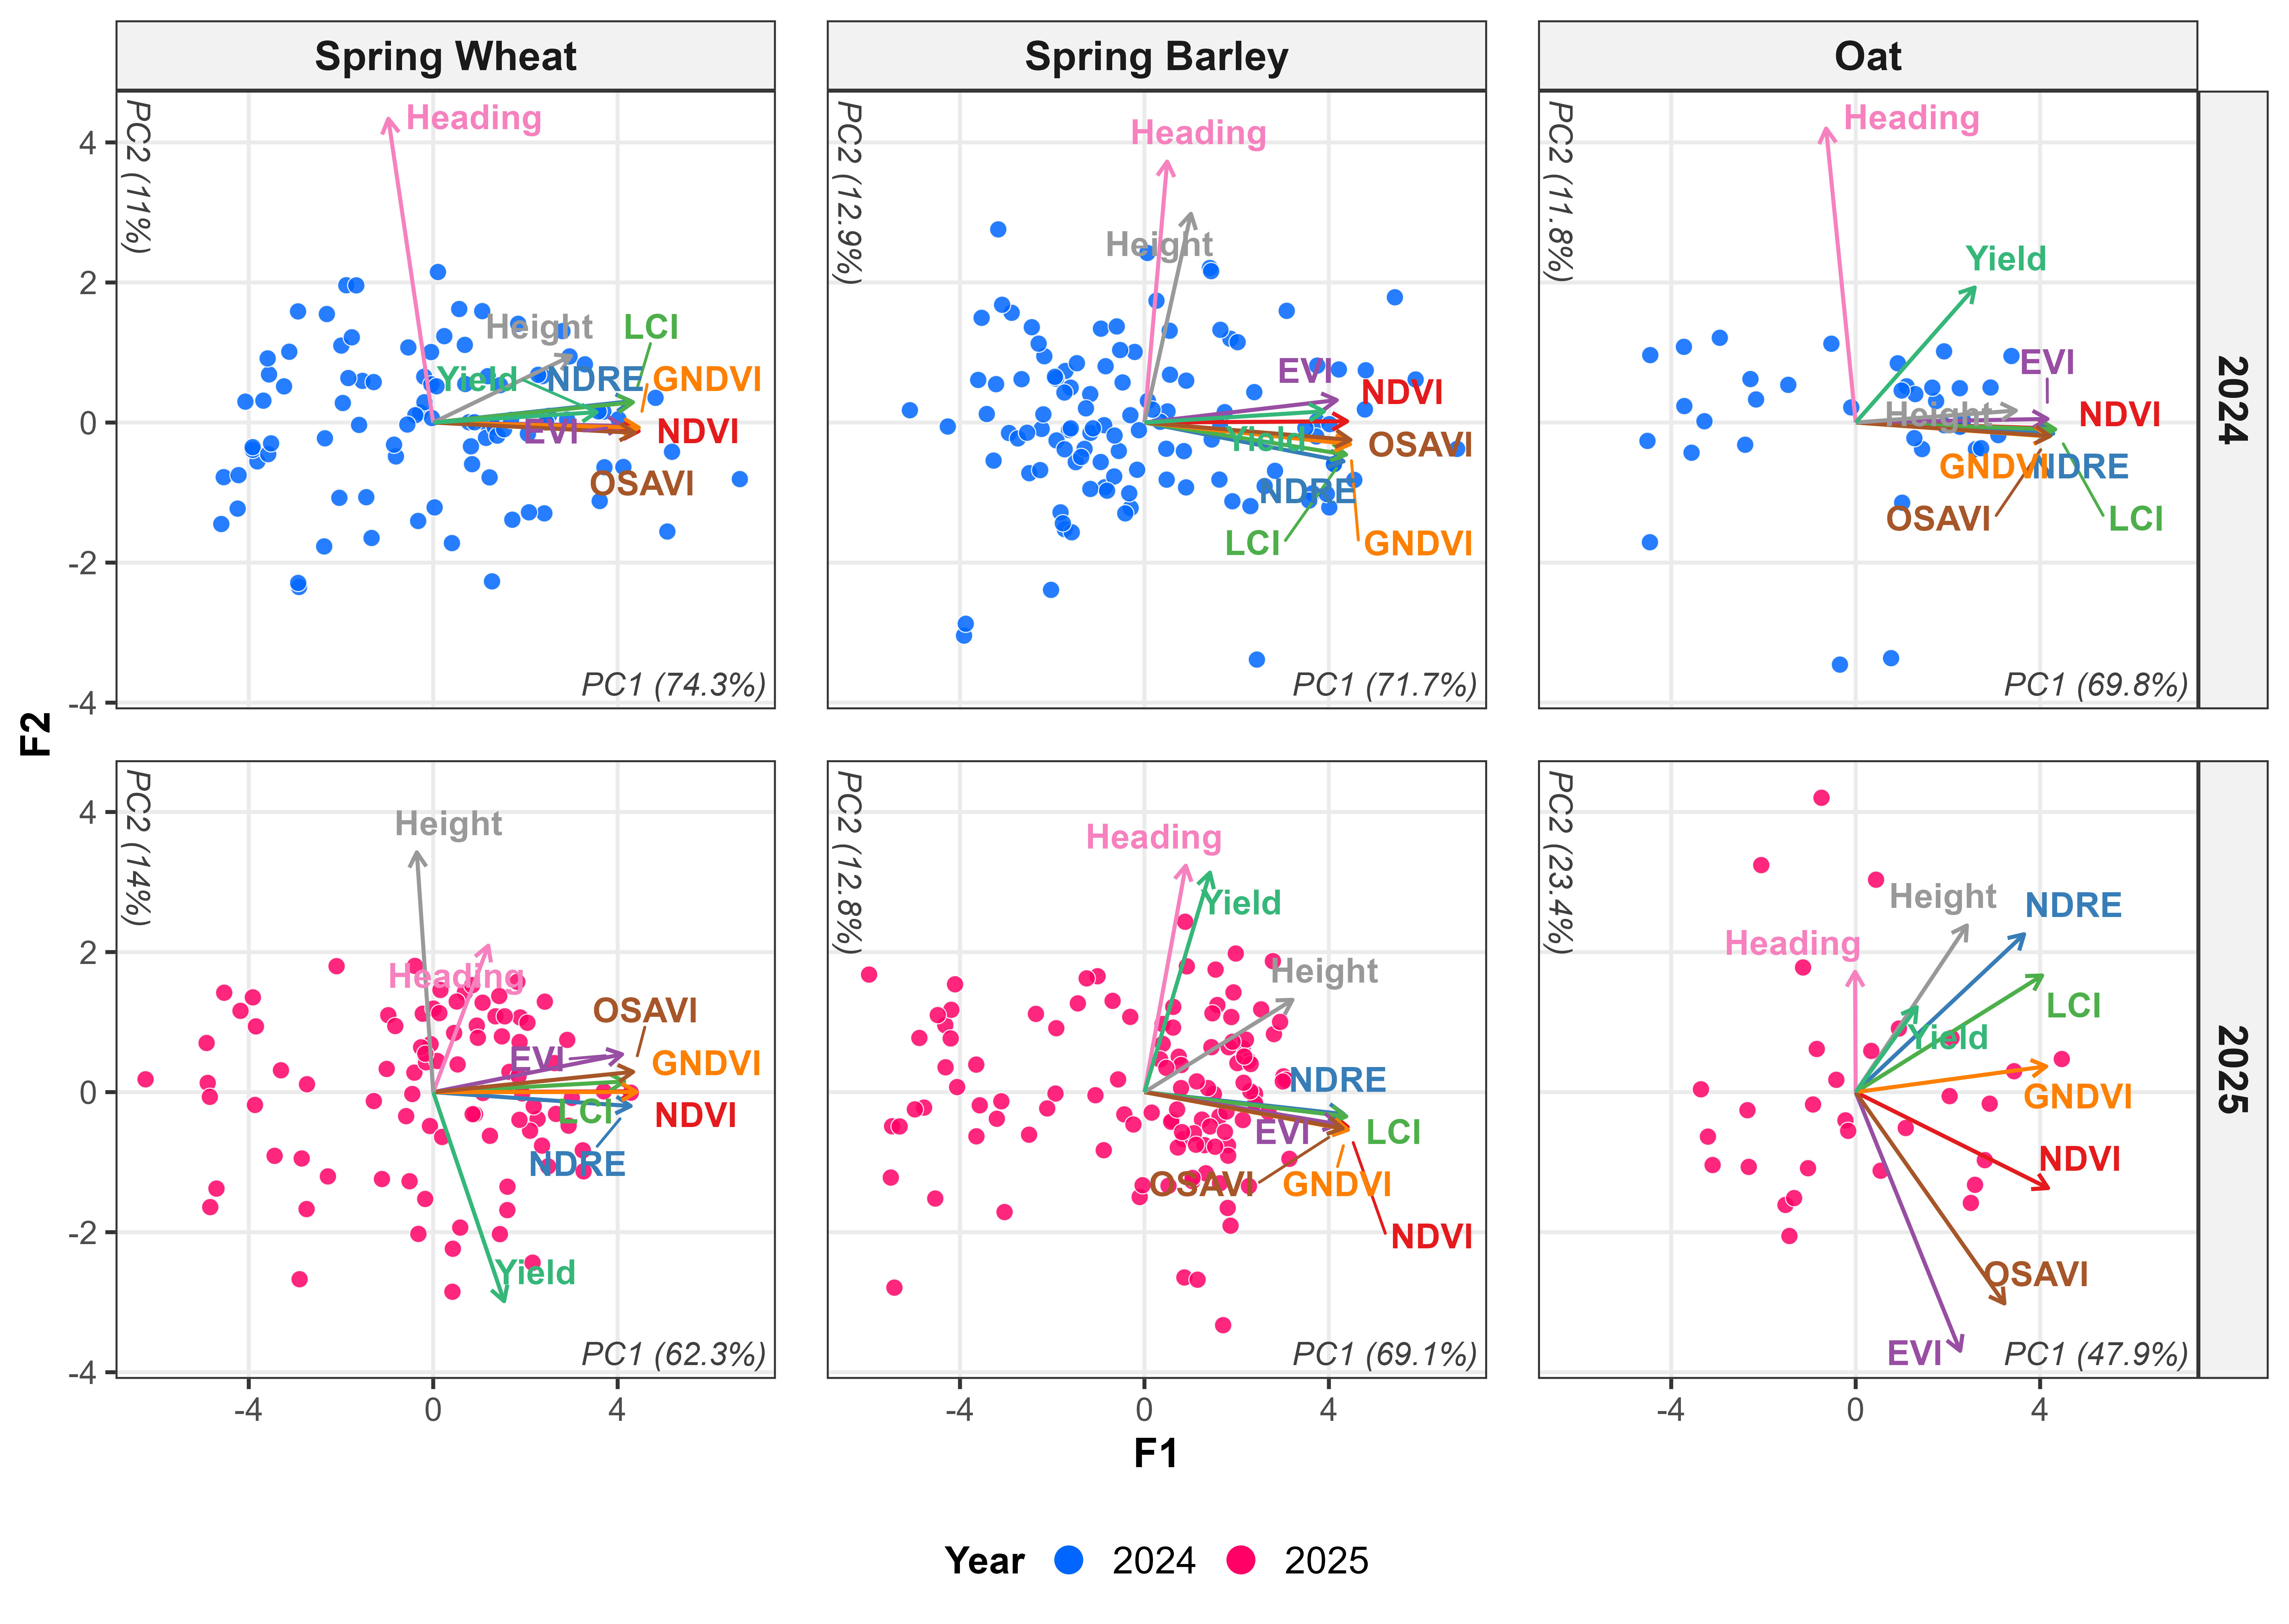
Principal component analysis based on plot-level data showed a broadly similar organization of spectral variables across species and years (Figure 3). Vegetation indices were primarily associated with the first principal component (PC1), whereas the position of grain yield, heading date, and plant height varied between species and seasons.
Figure 3.
Principal component analysis (PCA) biplots based on plot-level data for spring wheat, spring barley and oat grown under contrasting hydrothermal conditions in 2024 (upper panel) and 2025 (lower panel). The first two principal components (PC1 and PC2) are shown. The points represent individual field plots, whereas the vectors indicate the direction and strength of trait contributions. Variables included spectral vegetation indices (NDVI, NDRE, LCI, EVI, GNDVI and OSAVI), grain yield, plant height and heading date. The percentage of total variance explained by each principal component is indicated on the corresponding axis.
In spring wheat in 2024, the first two components explained 85.3% of total variation, with PC1 accounting for 74.3% and PC2 for 11.0% (Table 5). All vegetation indices were strongly associated with PC1, with loadings ranging from 0.915 for EVI to 0.991 for GNDVI. Grain yield was also strongly aligned with PC1 (0.788), together with plant height (0.664), whereas heading date was mainly associated with PC2 (0.964) (Table A4).
Table 5.
Eigenvalues and variance explained by PCA components.
In 2025, the first two components explained 76.2% of total variation. PC1 again represented the spectral variables, with loadings ranging from 0.910 for EVI to 0.980 for GNDVI. In contrast to 2024, grain yield showed a lower loading on PC1 (0.342) and was more strongly associated with PC2 (−0.663), opposite to plant height (0.761). Thus, the close alignment between grain yield and the main spectral component observed in wheat in 2024 was markedly reduced in 2025.
In spring barley, a similar seasonal shift was observed. In 2024, the first two components explained 84.7% of total variation, and grain yield was strongly aligned with the spectral PC1 (loading = 0.865), together with all vegetation indices. In 2025, the first two components explained 81.9% of total variation. Vegetation indices remained strongly associated with PC1, but grain yield was more closely associated with PC2 (0.697) than with PC1 (0.316), together with heading date (0.719).
Oat showed a less pronounced association between grain yield and the dominant spectral component. In 2024, yield occupied an intermediate position relative to the spectral variables, whereas in 2025 it was largely separated from them. The first two components explained 81.5% and 67.3% of total variation in 2024 and 2025, respectively.
Overall, PCA showed that vegetation indices formed a coherent spectral group across species and years, while the position of grain yield relative to this group differed markedly between seasons and species. Yield was closely aligned with the dominant spectral component in wheat and barley in 2024, but showed a weaker association with this component in 2025 and in oat.
3.5. CART Analysis of Yield Differentiation
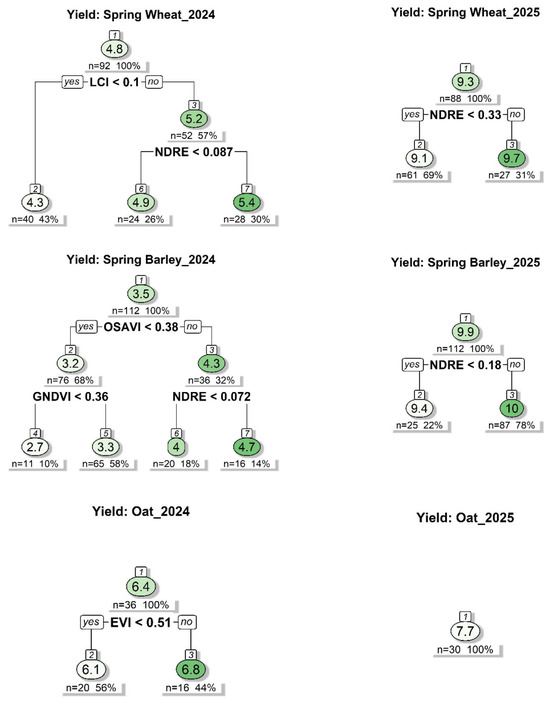
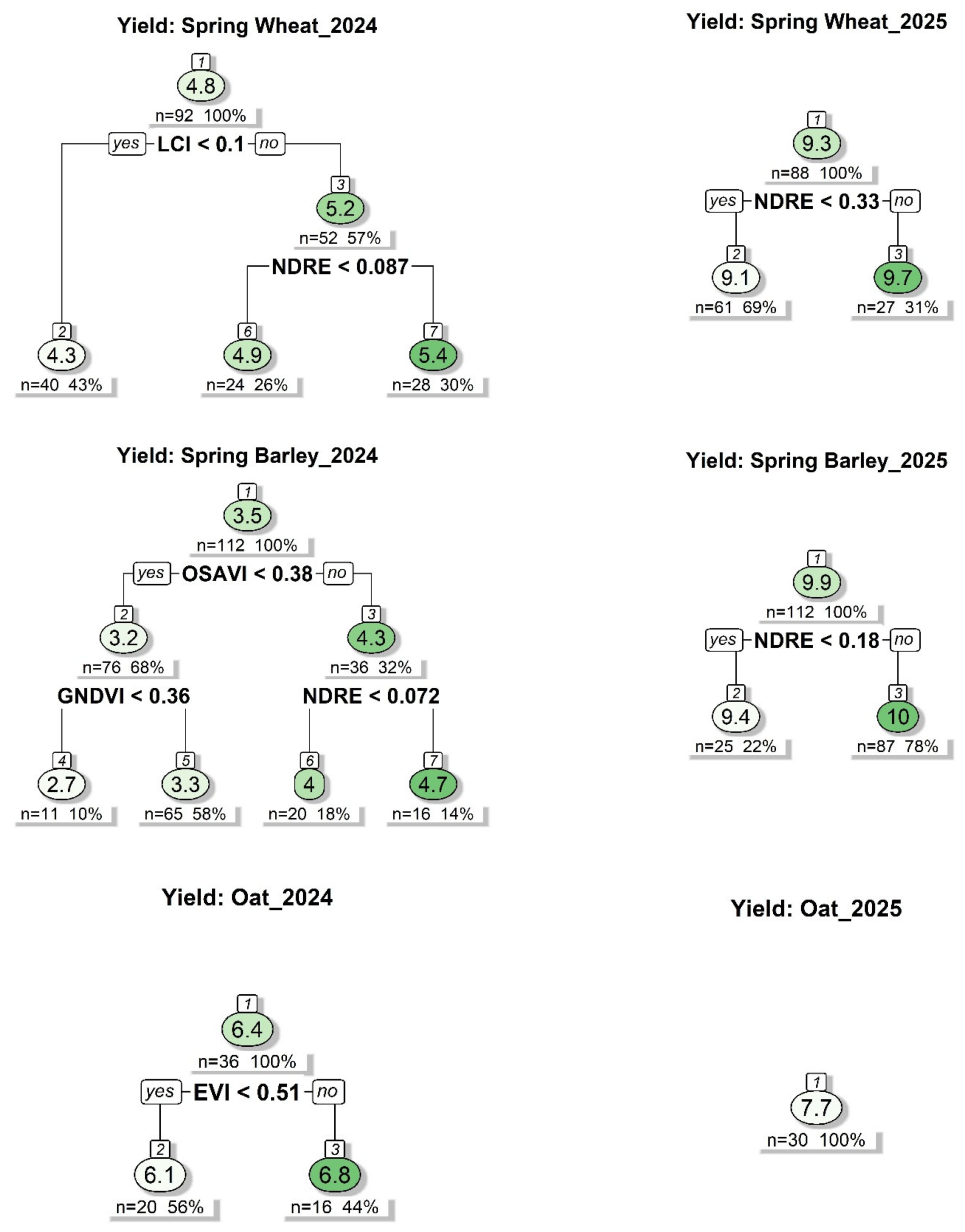
Classification and Regression Tree (CART) analysis showed differences among species and years in the spectral variables associated with grain yield (Figure 4).
Figure 4.
Classification and Regression Tree (CART) analysis of grain yield in spring wheat, spring barley, and oat in 2024 and 2025. Trees were fitted separately for each species and year using temporally averaged vegetation indices. Node values indicate mean grain yield (kg plot−1), while n denotes the number and percentage of plots assigned to each node. No splitting variable was retained for oat in 2025.
In spring wheat in 2024, LCI was selected as the primary splitting variable. Plots with LCI < 0.10 had a lower mean grain yield (4.3 kg plot−1; n = 40, 43%) than plots with LCI ≥ 0.10 (5.2 kg plot−1; n = 52, 57%). Within the latter group, NDRE provided an additional split: mean yield was 4.9 kg plot−1 at NDRE < 0.087 and 5.4 kg plot−1 at NDRE ≥ 0.087. In 2025, the wheat tree consisted of a single split based on NDRE. Mean yield was 9.1 kg plot−1 at NDRE < 0.33 and 9.7 kg plot−1 at NDRE ≥ 0.33.
In spring barley in 2024, OSAVI was the primary splitting variable. Plots with OSAVI < 0.38 had a mean yield of 3.2 kg plot−1, whereas those with OSAVI ≥ 0.38 yielded 4.3 kg plot−1. Additional splits were based on GNDVI in the lower-OSAVI group and NDRE in the higher-OSAVI group, with the highest mean yield (4.7 kg plot−1) observed at NDRE ≥ 0.072. In 2025, only NDRE was retained by the CART model, with a threshold of 0.18 separating plots with mean yields of 9.4 and 10.0 kg plot−1.
For oat, CART identified EVI as the only splitting variable in 2024. Mean yield was 6.1 kg plot−1 for EVI < 0.51 and 6.8 kg plot−1 for EVI ≥ 0.51. In 2025, no splitting variable was identified.
Overall, CART selected spectral indices as yield-separating variables, but the selected indices and tree complexity differed among species and years. NDRE occurred in the wheat and barley trees in both seasons, whereas the oat response was weaker and no split was obtained in 2025. Model fit and predictive performance varied markedly between seasons for all species (Table A5). In 2024, CART models showed the strongest fit and cross-validated performance for spring barley (training R2 = 0.743, cross-validated R2 = 0.680, RMSE = 0.336 kg plot−1) and spring wheat (training R2 = 0.669, cross-validated R2 = 0.548, RMSE = 0.334 kg plot−1), whereas oat showed considerably weaker cross-validated performance (R2 = 0.121). In 2025, cross-validated performance declined sharply in all three crops.
4. Discussion
4.1. Hydrothermal Contrast Between the Two Growing Seasons
The contrast between the two seasons was not limited to total precipitation but also involved the timing of water deficit relative to crop development. The seasonal contrast was consistently reflected by both hydrothermal indices used in the study: HTC, which relates precipitation to temperature [49,50], and SPEI, which incorporates climatic water balance through precipitation and potential evapotranspiration estimated using the Thornthwaite approach [9,51,52]. In 2024, the strongest moisture limitation occurred in May, when spring cereals were undergoing rapid canopy development and approaching heading. Temperatures were also higher and thermal accumulation progressed faster than in 2025. Water limitation therefore coincided with a period of high developmental activity and was followed by further hydrothermal stress later in the season [14,18,46]. In 2025, wetter and cooler conditions in May created a less restrictive environment during canopy development and establishment of reproductive potential.
Vegetation indices do not measure drought directly but reflect changes in canopy properties resulting from plant responses to environmental conditions [34,35]. When water limitation affects canopy expansion, pigment maintenance, senescence, and the duration of active photosynthetic tissue during stages critical for yield formation, spectral variation may become closely associated with final productivity [14,16]. Under more favorable conditions, differences in canopy reflectance may be less closely related to yield because reproductive development and grain filling are not constrained by a strong water deficit [37].
Spectral–yield relationships were stronger in the drought-affected 2024 season than in the wetter and cooler 2025 season. Because each hydrothermal condition was represented by a single year, the influence of drought cannot be separated experimentally from other interannual differences. The weather contrast nevertheless provides a biologically plausible context for the observed differences among the two seasons, without establishing drought as their sole cause [37,41,45,46].
4.2. Species-Level Patterns in Spectral Traits and Grain Yield
Correlation analysis showed clear differences among species in the relationship between canopy spectral traits and grain yield. Wheat and barley showed strong spectral–yield relationships under the drought-affected conditions of 2024, whereas oat responded more weakly and showed no significant relationships in 2025. Vegetation indices therefore cannot be treated as universal predictors of productivity across cereal species, even when measurements are obtained with the same sensor and acquisition protocol [37,40,44].
These differences may arise because canopy reflectance integrates several structural and physiological properties whose contributions vary among crops. In wheat and barley, the strong performance of red-edge- and greenness-related indices in 2024 was consistent with a close association between canopy condition and productivity. In oat, the weaker contribution of red-edge indices and the relatively stronger association with EVI suggest a different balance of structural and pigment-related components in the spectral signal [45]. Differences in canopy and panicle architecture could contribute to this pattern, but these traits were not measured directly and this explanation remains a hypothesis [32,35,62].
Seasonal patterns also differed among species. Wheat and barley retained weak but detectable spectral–yield relationships in 2025, whereas in oat these relationships disappeared. In the drought-affected 2024 dataset, canopy condition appeared to more directly reflect the constraints affecting productivity, whereas under favorable conditions, yield may depend on a broader range of processes that are less closely represented by vegetation indices [37,38,43].
The relationship also changed during crop development. In wheat and barley in 2024, spectral–yield correlations increased after the earliest UAV acquisitions, indicating that canopy reflectance became more informative as the 2024 season progressed. In 2025, the relationships were weaker and less persistent, emphasizing the importance of measurement timing [31,41,42]. Together, these results show that the usefulness of spectral traits depends on species, developmental stage, and environmental conditions.
4.3. Multivariate Structure of Spectral and Agronomic Traits
PCA showed that the main difference between seasons and species concerned the position of grain yield relative to the common spectral dimension rather than the organization of the spectral variables themselves. In wheat and barley in both seasons, and in oat in 2024, vegetation indices contributed strongly to the dominant principal component, indicating that despite differences in spectral formulation they shared a large proportion of the same plot-level variation. Oat in 2025 was an exception, with spectral variation distributed more evenly between the first two components.
The high pairwise correlations among NDVI, NDRE, LCI, EVI, GNDVI, and OSAVI confirm substantial overlap in the information captured by these indices [34,35]. Although they differ in sensitivity to canopy greenness, chlorophyll-related properties, biomass, and soil background, much of their variation under field conditions changed jointly [35,59,62].
In wheat and barley in 2024, grain yield was closely aligned with the dominant spectral component, whereas in 2025 it shifted toward secondary components. In oat, the association between yield and the main spectral component was weaker in both seasons, and in 2025, yield was largely separated from the spectral variables [37,43]. Thus, the principal seasonal change concerned not the spectral structure itself, but the extent to which this common spectral variation was associated with yield.
Because the vegetation indices were strongly correlated, the index showing the highest individual correlation should not necessarily be interpreted as representing a biologically distinct signal [34,35]. Rather, several indices may represent overlapping aspects of a common canopy-status gradient [37,38].
PCA also showed that variation among individual plots was predominantly continuous rather than organized into discrete groups. Treating the plot as the analytical unit preserved this field-scale variation, which would have been partly reduced by averaging observations at the cultivar or management level.
4.4. CART Analysis Reveals Threshold-Based Relationships Between Canopy Traits and Yield
Unlike correlation analysis and PCA, CART identifies threshold values associated with changes in yield and can therefore detect non-linear responses under field conditions [65].
CART supported the patterns identified by correlation analysis and PCA. During the drought-affected 2024 season, wheat and barley formed more complex trees, with several spectral variables contributing to yield differentiation. In 2025, the trees were much simpler: NDRE was the only variable retained for wheat and barley, and no split was identified for oat. This contrast, together with the higher cross-validated CART performance in 2024, is consistent with the stronger spectral–yield relationships and closer alignment of yield with the main spectral gradient observed in that season [37,38].
The variables selected by CART differed among species, with LCI and NDRE contributing in wheat, OSAVI, GNDVI, and NDRE in barley, and EVI in oat in 2024. However, because the vegetation indices were strongly collinear, selection of a particular index by an individual tree should be interpreted cautiously. Alternative indices carrying similar spectral information may produce comparable splits, and the threshold values should therefore be regarded primarily as data-specific indicators of yield differentiation rather than universal physiological boundaries.
CART thus complements PCA by translating a common spectral gradient into threshold-based partitions of yield variation. Its contrasting performance in the two datasets is consistent with spectral information being more closely related to productivity in drought-affected 2024 than in the wetter and cooler 2025 season.
4.5. Study Limitations
Several limitations should be considered when interpreting the results. First, the study covered only two growing seasons at a single location, with each hydrothermal condition represented by one year. Year and hydrothermal conditions therefore cannot be separated statistically, and the results should be understood as a comparison of two climatically contrasting seasons rather than a causal test of drought. Second, the cultivar sets were not identical between years because the experiments followed the current PDO assortment; the interannual comparison consequently concerns species-level patterns in the material examined. Third, the experimental design was not fully equivalent among species, particularly for oat compared with wheat and barley, which limits direct quantitative comparisons among crops. Fourth, adjustment for field-strip effects reduced several spectral–yield correlations, indicating that broad spatial field structure contributed to some plot-level associations. Fifth, the vegetation indices were strongly collinear, so identification of a single “best” index should be interpreted cautiously, especially in correlation- and CART-based analyses. Finally, the temporally averaged indices combined measurements obtained at different developmental stages and from unequal numbers of dates in some datasets. Date-specific correlations therefore provide the more direct evidence for changes during crop development, while the averaged values used in PCA and CART should be treated as complementary summaries. Accordingly, the results are restricted to the field conditions and plant material examined in this study.
5. Conclusions
Grain yield and the relationships between UAV-derived spectral traits and yield differed markedly between the two hydrothermally contrasting seasons. Spectral–yield relationships were stronger in drought-affected 2024 than in the wetter and cooler 2025 season, indicating that spectral phenotyping captured yield-related canopy variation particularly clearly in 2024. Because the study compared only two years, this contrast should not be interpreted as a causal estimate of drought effects. After adjustment for field-strip effects, the seasonal contrast remained in wheat and barley, although the correlations were weaker. In oat, the 2024 correlations disappeared, whereas correlations for selected indices became significant in 2025.
The side-by-side evaluation of three spring cereal species at the same location during the same two growing seasons revealed species-specific spectral patterns. Red-edge and chlorophyll-related indices were closely related to wheat yield in 2024 and GNDVI and OSAVI contributed strongly in barley, whereas oat showed weaker and less consistent spectral–yield relationships. UAV-based spectral phenotyping can therefore support field assessment of spring cereals, but measurement timing, spatial variation within the field, environmental context, and crop species must be considered when interpreting the indices. Further research should validate these relationships across additional locations and seasons and examine whether combining spectral indices with canopy structural and textural traits improves the robustness of yield prediction under contrasting environmental conditions.
Author Contributions
Conceptualization, K.R.; methodology, T.G. and S.J.; validation, K.R., T.G. and S.J.; formal analysis, T.G. and D.P.; investigation, K.R., T.G. and S.J.; resources, P.S. and P.M.; data curation, T.G., D.P. and S.J.; writing—original draft preparation, K.R.; writing—review and editing, K.R., T.G. and D.P.; visualization, D.P. and T.G.; supervision, K.R.; project administration, K.R. and P.S.; funding acquisition, K.R., P.S. and P.M. All authors have read and agreed to the published version of the manuscript.
Funding
This research was funded by: (1) The Ministry of Agriculture and Rural Development of Poland, 2026–2029, in the framework of Basic Research for Biological Progress in Crop Production, Task No. 54, “Use of machine learning methods and spectral phenotyping using drones for the detection of stress tolerance in winter wheat genotypes under changing climate conditions”; (2) The National Centre for Research and Development (NCBR) Poland, as a part of the R&D Activity of the Intelligent Development Operational Program 2014–2020 cofinanced by the European Regional Development Funds, grant number POIR-01.01.01-00-0782/16-00, project sustainability evidence.
Data Availability Statement
The original contributions presented in this study are included in the article.
Acknowledgments
T.G. and S.J. contributed equally to this work and are considered co-first authors.
Conflicts of Interest
Authors: S.J., P.S., P.M. were employed by the company Plant Breeding Strzelce Ltd. Co., IHAR Group, 99-307 Strzelce, Poland. The remaining authors declare that the research was conducted in the absence of any commercial or financial relationships that could be construed as potential conflicts of interest. The funders had no role in the design of the study; in the collection, analyses, or interpretation of data; in the writing of the manuscript; or in the decision to publish the results.
Abbreviations
The following abbreviations are used in this manuscript:
| AGL | above ground level |
| B.gr | Blumeria graminis |
| C.gr. | Cephalosporium gramineum |
| CART | Classification and Regression Tree |
| EVI | Enhanced Vegetation Index |
| GDD | Growing Degree Days |
| GNDVI | Green Normalized Difference Vegetation Index |
| GSD | ground sampling distance |
| Hect. | hectoliter weight |
| HTC | Selyaninov hydrothermal coefficient |
| Husk | husk content |
| LCI | Leaf Chlorophyll Index |
| Lodg. | lodging |
| Moist. | grain moisture content |
| NDRE | Normalized Difference Red Edge Index |
| NDVI | Normalized Difference Vegetation Index |
| NIR | Near-infrared |
| n.s. | non-significant |
| OSAVI | Optimized Soil Adjusted Vegetation Index |
| PCA | Principal Component Analysis |
| PET | Potential evapotranspiration |
| RE | Red-edge |
| RGB | Reed, green, blue |
| RTK | Real-time kinematic |
| RTN | Real-time network |
| SPEI | Standardized Precipitation Evapotranspiration Index |
| UAV | Unmanned aerial vehicle |
Appendix A
Table A1.
Summary statistics for spectral indices on individual acquisition dates and averaged across dates (Avr.) for spring wheat (W), spring barley (B) and oat (O), in years 2024 and 2025. Number of plots in 2024/2025: spring wheat 92/88, spring barley 112/112, oat 36/30 with no missing values. Dates are provided as numbers in the format Day. Month.
Table A2.
Pearson correlation coefficients among vegetation indices on individual acquisition dates. (NDVI, NDRE, LCI, EVI, GNDVI, and OSAVI), and grain yield in: (A) spring wheat, (B) spring barley, and (C) oat in 2024 and 2025. Only statistically significant correlations (p < 0.05) are presented; non-significant are denoted as n.s. Terms of UAV phenotyping: 26 April, 15 May, 21 May, 28 May, and 6 June, whereas in 2025: 24 April, 9 May, 27 May, 12 June, and 2 July. Dates are provided as numbers in the format Day. Month.
Table A3.
Robustness of relationships between temporally averaged vegetation indices and grain yield after accounting for spatial variation among field strips. Pearson correlation coefficients (r) were calculated using individual plot data. Strip-adjusted correlations (Partial r) were calculated after removing the categorical effect of field strip from both the vegetation index and grain yield. Significant correlations are indicated as * p < 0.05, ** p < 0.01, and *** p < 0.001.
Table A4.
PCA loadings of spectral and agronomic variables on PC1 and PC2 in spring wheat, spring barley, and oat in 2024 and 2025.
Table A5.
CART Performance Metrics in spring wheat, spring barley, and oat in 2024 and 2025.
References
- Ghazi, B.; Salehi, H.; Przybylak, R.; Pospieszyńska, A. Projection of climate change impact on the occurrence of drought events in Poland. Sci. Rep. 2025, 15, 5609. [Google Scholar] [CrossRef] [Scilit] [PubMed]
- Naumann, G.; Alfieri, L.; Wyser, K.; Mentaschi, L.; Betts, R.; Carrao, H.; Spinoni, J.; Vogt, J.; Feyen, L. Global Changes in Drought Conditions Under Different Levels of Warming. Geophys. Res. Lett. 2018, 45, 3285–3296. [Google Scholar] [CrossRef] [Scilit]
- Furtak, K.; Wolińska, A. The impact of extreme weather events as a consequence of climate change on the soil moisture and on the quality of the soil environment and agriculture—A review. CATENA 2023, 231, 107378. [Google Scholar] [CrossRef] [Scilit]
- Groisman, P.; Knight, R.; Easterling, D.; Karl, T.R.; Hegerl, G.; Razuvaev, V. Trends in Intense Precipitation in the Climate Record. J. Clim. 2005, 18, 1326–1350. [Google Scholar] [CrossRef] [Scilit]
- Klöffel, T.; Barron, J.; Nemes, A.; Giménez, D.; Jarvis, N. Soil, climate, time and site factors as drivers of soil structure evolution in agricultural soils from a temperate-boreal region. Geoderma 2024, 442, 116772. [Google Scholar] [CrossRef] [Scilit]
- Hafeez, A.; Batool, R.; Arshad, A.; Khan, M.; Ali, S.; Singh, N.; Garhwal, V.; Javed, M.A.; Fatima, E.; Suleman, F. Soil and water conservation under changing climate. In Challenges and Solutions of Climate Impact on Agriculture; Fahad, S., Adnan, N., Munir, I., Lal, R., Nawaz, T., Saud, S., Eds.; Academic Press: Cambridge, MA, USA, 2024; pp. 307–328. [Google Scholar]
- Kozłowski, M.; Borowiak, K.; Sojka, M.; Kocięcka, J.; Liberacki, D.; Otremba, K.; Napierała, M.; Zbierska, A.; Oliskiewicz-Krzywicka, A. Classification issues of drained organic soils in relation to selected features of soil water regime: A case study from central Poland. Ecol. Eng. Environ. Technol. 2025, 26, 199–211. [Google Scholar] [CrossRef] [Scilit] [PubMed]
- Marcinkowski, P.; Szporak-Wasilewska, S.; Kardel, I. Assessment of soil erosion under long-term projections of climate change in Poland. J. Hydrol. 2022, 607, 127468. [Google Scholar] [CrossRef] [Scilit]
- Oleksiak, T.; Spyroglou, I.; Pacoń, D.; Matysik, P.; Pernisova, M.; Rybka, K. Effect of drought on wheat production in Poland between 1961 and 2019. Crop Sci. 2022, 62, 728–743. [Google Scholar] [CrossRef] [Scilit]
- Rybka, K.; Nita, Z. Physiological requirements for wheat ideotypes in response to drought threat. Acta Physiol. Plant. 2015, 37, 97. [Google Scholar] [CrossRef] [Scilit]
- Kumar, A.; Muthuramalingam, P.; Kumar, R.; Tiwari, S.; Verma, L.; Park, S.; Shin, H. Adapting Crops to Rising Temperatures: Understanding Heat Stress and Plant Resilience Mechanisms. Int. J. Mol. Sci. 2025, 26, 10426. [Google Scholar] [CrossRef] [Scilit] [PubMed]
- Li, G.; Chen, T.; Feng, B.; Peng, S.; Tao, L.; Fu, G. Respiration, Rather Than Photosynthesis, Determines Rice Yield Loss Under Moderate High-Temperature Conditions. Front. Plant Sci. 2021, 12, 678653. [Google Scholar] [CrossRef] [Scilit] [PubMed]
- Amaral, J.; Lobo, A.K.M.; Carmo-Silva, E. Regulation of Rubisco activity in crops. New Phytol. 2024, 241, 35–51. [Google Scholar] [CrossRef] [Scilit] [PubMed]
- Vadez, V.; Grondin, A.; Chenu, K.; Henry, A.; Laplaze, L.; Millet, E.J.; Carminati, A. Crop traits and production under drought. Nat. Rev. Earth Environ. 2024, 5, 211–225. [Google Scholar] [CrossRef] [Scilit]
- Appiah, M.; Abdulai, I.; Schulman, A.; Moshelion, M.; Dewi, E.; Daszkowska-Golec, A.; Bracho Mujica, G.; Rötter, R.P. Drought response of water- conserving and non-conserving spring barley cultivars. Front. Plant Sci. 2023, 14, 1247853. [Google Scholar] [CrossRef] [Scilit]
- Nykiel, M.; Lisik, P.; Dębski, J.; Florea, B.I.; Rybka, K. Chl a fluorescence and proteomics reveal the protection of photosynthetic apparatus in tolerant but not susceptible to dehydration wheat cultivar. Biol. Plant. 2019, 63, 287–297. [Google Scholar] [CrossRef] [Scilit]
- Kangasjärvi, S.; Neukermans, J.; Li, S.; Aro, E.-M.; Noctor, G. Photosynthesis, photorespiration, and light signalling in defence responses. J. Exp. Bot. 2012, 63, 1619–1636. [Google Scholar] [CrossRef] [Scilit]
- Kosová, K.; Urban, M.O.; Vítámvás, P.; Prášil, I.T. Drought Stress Response in Common Wheat, Durum Wheat, and Barley: Transcriptomics, Proteomics, Metabolomics, Physiology, and Breeding for an Enhanced Drought Tolerance. In Drought Stress Tolerance in Plants, Vol 2: Molecular and Genetic Perspectives; Hossain, M.A., Wani, S.H., Bhattacharjee, S., Burritt, D.J., Tran, L.-S.P., Eds.; Springer International Publishing: Cham, Switzerland, 2016; pp. 277–314. [Google Scholar]
- Slawin, C.; Ajayi, O.; Mahalingam, R. Association mapping unravels the genetic basis for drought related traits in different developmental stages of barley. Sci. Rep. 2024, 14, 25121. [Google Scholar] [CrossRef] [Scilit]
- Sallam, A.; Dawood, M.; Jarquin, D.; Mohamed, E.; Hussein, M.; Börner, A.; Ali, A. Genome-wide scanning to identify and validate single nucleotide polymorphism markers associated with drought tolerance in spring wheat seedlings. Plant Genome 2024, 17, e20444. [Google Scholar] [CrossRef] [Scilit] [PubMed]
- Jarecki, W. Changes in the sown area, yields and harvests of major crops and the consumption of selected means of production in Polish agriculture over the years 2011–2021. Rural Period. 2024, 30, 207–225, (In Polish with Abstract in English). [Google Scholar] [CrossRef] [Scilit]
- Madej, A. Processes of concentration in cereal production in Poland. Pol. J. Agron. 2018, 35, 23–31, (In Polish with English Abrtract). [Google Scholar] [CrossRef]
- Kapusta, F. Cereals as a component of agriculture and economy in Poland. Econ. 21st Century 2016, 2, 121–137, (In Polish with English Abstract). [Google Scholar] [CrossRef] [Scilit]
- Jasmin, A.S.; Nilavu, E.D.; Jayakumar, A.; Petchiammal, I.K.; Pramitha, L.J.; Devasena, N.; Francis, N.; Madhavan, A.P.; Selvaraj, R. A comprehensive review on mutation breeding milestones in cereals: Conventional to advanced molecular approaches to achieve sustainable goals in trait improvement. Plant Sci. Today 2024, 11, 641–653. [Google Scholar] [CrossRef] [Scilit]
- Pawar, P.; Navathe, S.; Yashavanthakumar, K.J.; Kumari, J.; Kumar, S.; Basavaraj, P.S.; Singh, S.K.; Singh, G.P.; Oak, M. Effective selection criteria for high-throughput wheat drought tolerance screening using integrated physiological and statistical approaches. Plant Physiol. Rep. 2025, 31, 45–60. [Google Scholar] [CrossRef] [Scilit]
- Austin, R.B. Augmenting yield-based selection. In Plant Breeding: Principles and Prospects; Hayward, M.D., Bosemark, N.O., Romagosa, I., Cerezo, M., Eds.; Springer: Dordrecht, The Netherlands, 1993; pp. 391–405. [Google Scholar]
- Gahlaut, V.; Jaiswal, V.; Balyan, H.S.; Gupta, P.K. Conditional QTL analysis of grain yield and eight yield-contributing traits under drought stress in wheat (Triticum aestivum L.). Plant Physiol. Rep. 2025, 30, 736–748. [Google Scholar] [CrossRef] [Scilit]
- Wang, R.-F.; Qu, H.-R.; Su, W.-H. From sensors to insights: Technological trends in image-based high-throughput plant phenotyping. Smart Agric. Technol. 2025, 12, 101257. [Google Scholar] [CrossRef] [Scilit]
- Rui, Z.; Zhang, Z.; Zhang, M.; Azizi, A.; Igathinathane, C.; Cen, H.; Vougioukas, S.; Li, H.; Zhang, J.; Jiang, Y.; et al. High-throughput proximal ground crop phenotyping systems—A comprehensive review. Comput. Electron. Agric. 2024, 224, 109108. [Google Scholar] [CrossRef] [Scilit]
- Estrada, F.; Flexas, J.; Araus, J.L.; Mora-Poblete, F.; Gonzalez-Talice, J.; Castillo, D.; Matus, I.A.; Méndez-Espinoza, A.M.; Garriga, M.; Araya-Riquelme, C.; et al. Exploring plant responses to abiotic stress by contrasting spectral signature changes. Front. Plant Sci. 2023, 13, 1026323. [Google Scholar] [CrossRef] [Scilit] [PubMed]
- Yu, R.; Cao, X.; Liu, J.; Nie, R.; Zhang, C.; Yuan, M.; Huang, Y.; Liu, X.; Zheng, W.; Wang, C.; et al. Using UAV-Based Temporal Spectral Indices to Dissect Changes in the Stay-Green Trait in Wheat. Plant Phenomics 2024, 6, 0171. [Google Scholar] [CrossRef] [Scilit] [PubMed]
- Zhao, S.; Luo, S.; Fang, Z.; Liu, X.; Chen, J. Multi dimensional variable influence mechanism analysis for wheat biomass estimation using fused UAV spectral and canopy height data and machine learning. Front. Plant Sci. 2026, 17, 1887967. [Google Scholar] [CrossRef] [Scilit] [PubMed]
- Stepanov, A.; Dubrovin, K.; Sorokin, A. Function fitting for modeling seasonal normalized difference vegetation index time series and early forecasting of soybean yield. Crop J. 2022, 10, 1452–1459. [Google Scholar] [CrossRef] [Scilit]
- Góral, T.; Rybka, K. Spectral indices in cereal phenotyping under field conditions: Possibilities and limitations. Biul. Inst. Hod. Aklim. Roślin 2026, 305/306. in production (In Polish with English Abstract, table headers and figure legends). [Google Scholar]
- Thenkabail, P.S.; Smith, R.B.; De Pauw, E. Hyperspectral Vegetation Indices and Their Relationships with Agricultural Crop Characteristics. Remote Sens. Environ. 2000, 71, 158–182. [Google Scholar] [CrossRef] [Scilit]
- Aparicio, N.; Villegas, D.; Casadesus, J.; Araus, J.L.; Royo, C. Spectral Vegetation Indices as Nondestructive Tools for Determining Durum Wheat Yield. Agron. J. 2000, 92, 83–91. [Google Scholar] [CrossRef] [Scilit]
- Paiboonvorachat, C.; Rajagopalan, K.; Pumphrey, M.O.; Carter, A.H.; Zhang, C.; Sangjan, W.; Sankaran, S. Variability in crop responses as a function of environment affects the NDVI relationship with grain yield in wheat. Plant Phenomics 2026, 8, 100237. [Google Scholar] [CrossRef] [Scilit] [PubMed]
- Badagliacca, G.; Messina, G.; Praticò, S.; Lo Presti, E.; Preiti, G.; Monti, M.; Modica, G. Multispectral Vegetation Indices and Machine Learning Approaches for Durum Wheat (Triticum durum Desf.) Yield Prediction across Different Varieties. AgriEngineering 2023, 5, 2032–2048. [Google Scholar] [CrossRef] [Scilit]
- Panek, E.; Gozdowski, D. Relationship between MODIS Derived NDVI and Yield of Cereals for Selected European Countries. Agronomy 2021, 11, 340. [Google Scholar] [CrossRef] [Scilit]
- Zhao, P.; Li, W.; Wang, C.; Wang, B.; Yang, T.; Wang, X.; Liu, Z.; Liu, H.; Wang, F. UAV remote sensing for yield prediction in staple crops: A review. Front. Plant Sci. 2026, 17, 1840669. [Google Scholar] [CrossRef] [Scilit] [PubMed]
- Shafiee, S.; Mroz, T.; Burud, I.; Lillemo, M. Evaluation of UAV multispectral cameras for yield and biomass prediction in wheat under different sun elevation angles and phenological stages. Comput. Electron. Agric. 2023, 210, 107874. [Google Scholar] [CrossRef] [Scilit]
- Heinemann, P.; Prey, L.; Hanemann, A.; Ramgraber, L.; Seidl-Schulz, J.; Noack, P.O. Enhancing model performance through date fusion in multispectral and RGB image-based field phenotyping of wheat grain yield. Precis. Agric. 2025, 26, 20. [Google Scholar] [CrossRef] [Scilit]
- Mróz, T.; Shafiee, S.; Crossa, J.; Montesinos-Lopez, O.A.; Lillemo, M. Multispectral-derived genotypic similarities from budget cameras allow grain yield prediction and genomic selection augmentation in single and multi-environment scenarios in spring wheat. Mol. Breed. 2024, 44, 5. [Google Scholar] [CrossRef] [Scilit] [PubMed]
- Bukowiecki, J.; Rose, T.; Holzhauser, K.; Rothardt, S.; Rose, M.; Komainda, M.; Herrmann, A.; Kage, H. UAV-based canopy monitoring: Calibration of a multispectral sensor for green area index and nitrogen uptake across several crops. Precis. Agric. 2024, 25, 1556–1580. [Google Scholar] [CrossRef] [Scilit]
- Feng, Y.; Wang, G.; Wang, J.; Zheng, H.; Miao, X.; Sun, X.; Li, P.; Li, Y.; Jia, Y. Relationships Between Oat Phenotypes and UAV Multispectral Imagery Under Different Water Deficit Conditions by Structural Equation Modelling. Agronomy 2025, 15, 1389. [Google Scholar] [CrossRef] [Scilit]
- Hakala, K.; Jauhiainen, L.; Rajala, A.A.; Jalli, M.; Kujala, M.; Laine, A. Different responses to weather events may change the cultivation balance of spring barley and oats in the future. Field Crops Res. 2020, 259, 107956. [Google Scholar] [CrossRef] [Scilit]
- Drzazga, T.; Krajewski, P.; Śmiałek, E. Usefulness of different input level environments in selection of winter wheat. Biul. Inst. Hod. Aklim. Roślin 2013, 270, 3–16, (In Polish with English Abstract and Tables and Figures description). [Google Scholar] [CrossRef] [Scilit]
- Rozbicki, J.; Gozdowski, D.; Studnicki, M.; Mądry, W.; Golba, J.; Sobczyński, G.; Wijata, M. Management Intensity Effects on Grain Yield and Its Quality Traits of Winter Wheat Cultivars in Different Environments in Poland. Electron. J. Pol. Agric. Univ. 2019, 22, 1–10. [Google Scholar] [CrossRef] [Scilit]
- Selyaninov, G.T. About climate agricultural estimation. Proc. Agric. Meteorol. 1928, 20, 165–177. [Google Scholar]
- Devyatova, E.; Kochugova, E.; Cydenzapov, M. Comparison of Selyaninov’s Hydrothermal Coefficient (Aridity Criterion) over Buryatia, Russia, in the Summer Period from 1979 to 2019 according to Meteorological Stations and ECMWF ERA5. Environ. Sci. Proc. 2022, 19, 55. [Google Scholar] [CrossRef] [Scilit]
- Vicente-Serrano, S.M.; Beguería, S.; López-Moreno, J.I. A Multiscalar Drought Index Sensitive to Global Warming: The Standardized Precipitation Evapotranspiration Index. J. Clim. 2010, 23, 1696–1718. [Google Scholar] [CrossRef] [Scilit]
- Thornthwaite, C.W. An approach toward a rational classification of climate. Geogr. Rev. 1948, 38, 55–94. [Google Scholar] [CrossRef] [Scilit] [PubMed]
- Beguería, S.; Vicente-Serrano, S.M.; Reig, F.; Latorre, B. Standardized precipitation evapotranspiration index (SPEI) revisited: Parameter fitting, evapotranspiration models, tools, datasets and drought monitoring. Int. J. Climatol. 2014, 34, 3001–3023. [Google Scholar] [CrossRef] [Scilit]
- Grigorieva, E.; Matzarakis, A.; De Freitas, C. Analysis of growing degree-days as climate impact indicator in a region with extreme annual air temperature amplitude. Clim. Res. 2010, 42, 143–154. [Google Scholar] [CrossRef] [Scilit]
- Pix4D SA. PIX4Dfields; Pix4D SA: Lausanne, Switzerland, 2023; Available online: https://support.pix4d.com/hc/pix4dfields (accessed on 25 February 2026).
- QGIS Development Team. QGIS Geographic Information System. Open Source Geospatial Foundation Project. 2025. Available online: https://qgis.org/project/overview/ (accessed on 25 February 2026).
- Rouse, J.W.; Haas, R.H.; Schell, J.A.; Deering, D.W. Monitoring vegetation systems in the great plains with ERTS. In Proceedings of Proceedings of the Third Earth Resources Technology Satellite-1 Symposium (NASA SP-351); National Aeronautics and Space Administration: Washington, DC, USA, 1974; Volume 1, pp. 309–317. [Google Scholar]
- Metternicht, G. Vegetation indices derived from high-resolution airborne videography for precision crop management. Int. J. Remote Sens. 2003, 24, 2855–2877. [Google Scholar] [CrossRef] [Scilit]
- Maccioni, A.; Agati, G.; Mazzinghi, P. New vegetation indices for remote measurement of chlorophylls based on leaf directional reflectance spectra. J. Photochem. Photobiol. B Biol. 2001, 61, 52–61. [Google Scholar] [CrossRef] [Scilit] [PubMed]
- Datt, B. Remote Sensing of Water Content in Eucalyptus Leaves. Aust. J. Bot. 1999, 47, 909–923. [Google Scholar] [CrossRef] [Scilit]
- Dorigo, W.A.; Zurita-Milla, R.; de Wit, A.J.W.; Brazile, J.; Singh, R.; Schaepman, M.E. A review on reflective remote sensing and data assimilation techniques for enhanced agroecosystem modeling. Int. J. Appl. Earth Obs. Geoinf. 2007, 9, 165–193. [Google Scholar] [CrossRef] [Scilit]
- Daughtry, C.S.T.; Walthall, C.L.; Kim, M.S.; de Colstoun, E.B.; McMurtrey, J.E. Estimating Corn Leaf Chlorophyll Concentration from Leaf and Canopy Reflectance. Remote Sens. Environ. 2000, 74, 229–239. [Google Scholar] [CrossRef] [Scilit]
- Addinsoft. XLSTAT Statistical and Data Analysis Solution, Version 2024.1; Computer Software; Addinsoft: Paris, France, 2024; Available online: https://www.xlstat.com (accessed on 24 September 2025).
- Lê, S.; Josse, J.; Husson, F. FactoMineR: An R Package for Multivariate Analysis. J. Stat. Softw. 2008, 25, 1–18. [Google Scholar] [CrossRef] [Scilit]
- Milborrow, S. rpart.plot: Plot ‘rpart’ Models: An Enhanced Version of ‘plot.rpart’. 2026. Available online: https://cran.r-project.org/web/packages/rpart.plot/index.html (accessed on 24 September 2025).

Disclaimer/Publisher’s Note: The statements, opinions and data contained in all publications are solely those of the individual author(s) and contributor(s) and not of MDPI and/or the editor(s). MDPI and/or the editor(s) disclaim responsibility for any injury to people or property resulting from any ideas, methods, instructions or products referred to in the content. |
© 2026 by the authors. Licensee MDPI, Basel, Switzerland. This article is an open access article distributed under the terms and conditions of the Creative Commons Attribution (CC BY) license.