


Abstract
Weed interference is a major constraint in the production of Angelica dahurica, where seedling–weed similarity, small target size, soil background variation, and occlusion make reliable field recognition difficult. This study develops a lightweight attention-enhanced one-stage detector for real-time crop-versus-weed localization in A. dahurica fields. The detector combines a MobileNetV3 backbone for computationally efficient feature extraction, the parameter-free SimAM mechanism for discriminative feature enhancement, and the Inner-EIoU loss for improved localization of small and partially occluded targets. A field image dataset was collected in Luoning County, Luoyang City, Henan Province, China, comprising a total of 2286 original images. To avoid potential data leakage, the dataset was first divided into training, validation, and test sets at the original-image level. Data augmentation was then performed separately within each subset, resulting in a final dataset of 11,430 images. Under the augmented-test evaluation protocol, the proposed detector achieved 92.5% precision, 94.8% recall, 93.6% F1-score, and 95.2% mAP@0.5, while requiring 0.275 million parameters and 1.1 GFLOPs and reaching 215 FPS in offline inference. For an independent field-validation dataset collected after model training and deployment, precision, recall, F1-score, and mAP@0.5 were 91.6%, 88.4%, 90.0%, and 91.8%, respectively. On an NVIDIA Jetson Orin Nano 8GB edge platform, TensorRT FP16 acceleration produced an average speed of 46.8 FPS. The results show that the proposed detector offers a practical balance among detection accuracy, model compactness, inference speed, and field adaptability. Accordingly, it can serve as a visual-perception component for precision-weeding systems in Angelica dahurica fields.
1. Introduction
Angelica dahurica is an economically important medicinal plant widely used in traditional Chinese medicine. Its dried root has high medicinal and economic value and is widely used in traditional Chinese medicine and related health products. Previous studies have shown that the root of Angelica dahurica contains various active components, including coumarins and volatile oils, and is an important medicinal and edible plant resource [1,2]. With the increasing demand for standardized, green, and high-quality production of Chinese medicinal materials, the precision of field management in Angelica dahurica production is directly related to yield, quality, and safety.
During the field growth of Angelica dahurica, weeds are one of the key factors affecting normal crop development. Weeds compete with Angelica dahurica seedlings for water, nutrients, light, and growing space, and may also reduce field ventilation and light transmission, thereby increasing the risk of pest and disease transmission. Previous studies have reported that weeds in medicinal plant fields can significantly increase management costs and cause yield losses under severe weed infestation. At present, weed control in Chinese medicinal crop fields still mainly relies on manual weeding and chemical herbicides. Manual weeding is labor-intensive, inefficient, and costly, making it difficult to meet the needs of large-scale planting. Chemical weeding is efficient, but medicinal crops are subject to strict requirements regarding pesticide residues, product quality, and safety. Excessive herbicide use may lead to reduced medicinal quality, pesticide residues, and ecological risks [3,4]. In contrast, mechanized precision weeding based on visual recognition and mechanical actuators can identify weed locations, transmit target information to a robotic arm or terminal weeding device, and complete site-specific weeding by physical means. This approach can reduce herbicide use, lower labor intensity, and control operational costs [5,6,7,8]. Therefore, developing high-accuracy and lightweight weed recognition technology for Angelica dahurica fields is necessary for low-cost mechanized weeding and green production of Chinese medicinal materials.
In recent years, artificial intelligence, machine vision, and deep learning have developed rapidly, providing new technical approaches for agricultural target recognition, crop phenotyping, pest and weed detection, and intelligent agricultural machinery operations [9,10]. Early agricultural vision recognition studies relied mainly on handcrafted features, such as color, texture, and morphology, and were vulnerable to illumination changes, occlusion, complex backgrounds, and target-scale variation. With the development of convolutional neural networks, deep learning object detection models such as Faster R-CNN, SSD, and RetinaNet have gradually been applied to crop and weed recognition tasks [11,12,13,14,15]. Based on the DeepWeeds dataset, Saleem et al. compared single-stage and two-stage detectors, including SSD, RetinaNet, Faster R-CNN, R-FCN, CenterNet, and EfficientDet, and demonstrated that deep learning detectors can effectively improve field weed identification. However, different models vary in detection accuracy, inference speed, and adaptability to complex scenes [16,17,18]. For real-time weed detection in seedling maize fields, Liu et al. compared Faster R-CNN, SSD300, YOLOv3, YOLOv3-tiny, and YOLOv4-tiny, further indicating that conventional two-stage detectors and SSD-type models still have limitations in real-time field operation and lightweight deployment [19].
Among object detection algorithms, YOLO-series models have been widely used in real-time agricultural detection tasks because of their end-to-end detection structure, high detection speed, and favorable accuracy [15,19,20,21]. To address illumination occlusion, algae interference, and rice leaf-tip similarity in complex paddy-field environments, Chen et al. proposed a weed recognition method based on ViT-improved YOLOv7. The method combined image enhancement, a ViT classification network, a GhostNet backbone, and a coordinate attention mechanism to improve weed recognition in complex environments, increasing average precision by 3.3 percentage points while substantially reducing the number of parameters and computational cost [22]. For weed detection and localization in fields of the Chinese medicinal plant Dictamnus dasycarpus, Xu et al. proposed the YOLO-Riny weed detection algorithm and combined it with ByteTrack for weed target tracking, providing a real-time detection and localization approach for laser-based weeding in medicinal plant fields [23]. For weed recognition in wheat fields, Liu et al. proposed YOLOv8-MBM, which uses a visual converter module and multi-scale feature fusion to enhance the representation of small weed targets and complex backgrounds. The results showed that the model outperformed mainstream models such as Fast R-CNN, YOLOv3, YOLOv4-tiny, YOLOv5s, YOLOv7, and YOLOv9 [24]. For specific weed recognition in rapeseed fields, Tao and Wei proposed STBNA-YOLOv5 and compared it with SSD, Faster R-CNN, YOLOv3, DETR, and EfficientDet. Their results showed that the improved model achieved better Precision, F1-score, and mAP@0.5 [25]. These studies indicate that YOLO-series models have promising application potential for crop–weed recognition, precision weeding, and intelligent agricultural machinery.
Furthermore, to address small targets, dense distribution, severe occlusion, and complex backgrounds under different operating scenarios, researchers have improved YOLO models from the perspectives of lightweight backbone networks, attention mechanisms, multi-scale feature fusion, detection-head optimization, and loss-function improvement. Zheng et al. proposed YOLOv8-DMAS to solve the problems of diverse weed species, dense distribution, and missed detection of small targets in cotton fields by improving the feature extraction structure, multi-scale modules, and detection heads [26]. Huang et al. proposed a lightweight improved YOLOv8s model for maize-field weed detection, improving detection accuracy while reducing GFLOPs and model size, demonstrating that lightweight design contributes to real-time field recognition under resource-constrained conditions [27]. Peng et al. constructed AGRI-YOLO based on YOLOv11n for maize-field weed detection, significantly reducing the number of parameters and computational cost and supporting precision weeding on resource-constrained edge devices [28]. These studies show that YOLO-based agricultural models are shifting from simply pursuing detection accuracy to balancing accuracy, lightweighting, and real-time deployment performance [29].
Recent deployment-oriented studies have further explored lightweight models and edge computing for real-time weed perception. Islam et al. investigated lightweight convolutional neural network models for real-time weed detection and segmentation on edge devices [30]. Rai et al. developed optimized YOLO-Spot models based on YOLOv7-tiny for weed identification in aerial images and videos and evaluated their deployment on a resource-constrained edge platform [31]. Arthur et al. combined YOLOv7-CBAM, DeepSORT, and pixel-grid analysis to achieve real-time weed localization and intra-row weed-density estimation in apple orchards [32]. These studies demonstrate the value of balancing detection performance, computational efficiency, and practical deployment capability. However, the application of lightweight crop–weed detectors to Angelica dahurica fields, particularly for seedling-stage mechanical weeding, remains insufficiently explored.
Although existing studies have achieved favorable results in weed detection tasks for various crop fields, research on weed detection in Angelica dahurica fields, a Chinese medicinal material planting scenario, remains relatively limited. Compared with common grain or vegetable fields, Angelica dahurica seedlings are small at the seedling stage, and their leaf morphology is similar to that of some weeds. The field soil background is complex, and weeds often occlude or overlap with Angelica dahurica seedlings, leading to missed detections, false detections, and inaccurate localization. Meanwhile, practical weeding operations require the model to achieve not only high detection accuracy but also a low parameter count, low computational cost, and high inference speed so that real-time detection and field deployment can be implemented on industrial computers or edge computing platforms. Therefore, constructing a weed detection model with high accuracy, lightweight structure, and robustness for Angelica dahurica fields has important research value and application significance.
To address the morphological similarity between weeds and Angelica dahurica seedlings, small target size, complex background, and severe occlusion in A. dahurica fields, this study develops the MSI detector from the YOLOv11n baseline. The design combines a MobileNetV3 backbone, the parameter-free SimAM attention mechanism, and the Inner-EIoU bounding-box regression loss. The detector is evaluated through model comparison, module ablation, loss-function comparison, convergence analysis, detection-result visualization, robustness analysis, Grad-CAM interpretation, and independent field validation after edge-side deployment.
The main contributions of this study are as follows:
- (1)
- A field image dataset for weed detection in Angelica dahurica fields was constructed, covering different acquisition times, natural illumination conditions, and field backgrounds, providing a data basis for intelligent weeding research in Angelica dahurica fields.
- (2)
- The MSI detector was proposed by combining MobileNetV3, SimAM, and Inner-EIoU to improve detection accuracy, lightweighting, and real-time performance.
- (3)
- The influence of each improved module on weed recognition, localization, and model lightweight performance under complex Angelica dahurica field conditions was verified through mainstream model comparisons, module ablation, loss-function comparison, and heatmap visualization.
- (4)
- The improved model was deployed on an NVIDIA Jetson Orin Nano 8GB edge computing platform to verify the real-time performance and application feasibility of the model in practical mechanical weeding scenarios.
2. Materials and Methods
2.1. Dataset Acquisition
The dataset used in this study was obtained entirely from real Angelica dahurica field environments. The image acquisition site was located in Jiankou Township, Luoning County, Luoyang, Henan Province, China (34°21′57″ N, 111°45′4″ E). Images were collected from April to May 2025, mainly covering the seedling growth stage of Angelica dahurica. To improve the representativeness of the dataset for real field environments, the acquisition process covered different natural illumination and field background conditions as much as possible. During this period, weeds and Angelica dahurica seedlings showed certain similarities in color, texture, and spatial distribution. At the same time, crop occlusion, complex soil backgrounds, and uneven weed density were present, which effectively reflected the practical complexity of weed detection in Angelica dahurica fields.
To improve the representativeness of the dataset under real field conditions, environmental parameters, including soil volumetric water content, soil electrical conductivity, and soil temperature, were recorded simultaneously during image acquisition. The location of the experimental area and the field image acquisition environment are shown in Figure 1. Figure 1a shows the geographical location of the study area in Luoning County, Luoyang City, Henan Province; Figure 1b presents the overall environment of the image acquisition area in the Angelica dahurica field; Figure 1c shows a local view of A. dahurica plants and the surrounding weed distribution; and Figure 1d provides an enlarged view of an area with dense weed growth. As shown in the figure, A. dahurica plants and various weed species are interspersed throughout the experimental field. Considerable differences in plant density, weed abundance, and background complexity are observed among different acquisition areas, which increase the difficulty of weed detection and localization under field conditions.
Figure 1.
Location of the experimental area and field image acquisition environment of the Angelica dahurica field. (a) Location of the experimental area in Luoning County, Luoyang City, Henan Province. (b) Overall environment of the image acquisition area in the A. dahurica field. (c) Local distribution of A. dahurica plants and surrounding weeds. (d) Enlarged view of an area with dense weed growth.
To further quantify the spatial heterogeneity of the soil environment in the Angelica dahurica planting area, representative sampling points were selected in the image acquisition area. At each point, soil volumetric water content, soil electrical conductivity, and soil temperature were measured using a soil temperature and moisture rapid tester. The measurement depth was 15 cm, and all measurements were completed within 1 h before or after image acquisition on the same day to ensure good temporal synchronization between environmental parameters and visual image data. Soil environmental parameter data for the experimental area are presented in Table 1. The data show differences in soil water content, electrical conductivity, and temperature among sampling points, indicating significant soil environmental variation within the acquisition area. Such differences may further affect the growth status, leaf color, and field background characteristics of Angelica dahurica and weeds. Therefore, recording soil environmental parameters helps demonstrate the environmental coverage and representativeness of the dataset.
Table 1.
Soil environmental parameter data from the experimental field.
As shown in Table 1, the sampling depth at all sampling points was 15 cm, indicating that soil parameters were obtained under the same depth conditions and are therefore comparable. Soil water content varied from 18.57% to 29.54%, electrical conductivity varied from 2.07 to 2.93 mS/cm, and temperature varied from 28.5 to 30.5 °C. Although all sampling points were located in the same Angelica dahurica planting area, local differences in soil moisture, salinity, and temperature were observed, showing that the internal environment of the experimental field was not completely uniform.
These soil environmental differences may further affect the growth status, leaf color, plant size, and soil background characteristics of Angelica dahurica and weeds, thereby increasing the complexity of target recognition in field images. Therefore, the sampling data in Table 1 demonstrate, to some extent, that the dataset was derived from real field environments and has good environmental representativeness, providing a basis for analyzing model performance in complex Angelica dahurica field scenarios.
During image acquisition, an Honor 100 smartphone was used to capture images approximately 30–40 cm above Angelica dahurica and weeds. The acquired images were saved as RGB images with a resolution of 3072 × 4096 pixels. After image acquisition, the original images were screened and organized. Images with severe blur, overexposure, underexposure, high duplication, or unclear targets were removed to ensure the validity of the subsequent training data. Finally, 2286 original images were obtained.
2.2. Dataset Preprocessing
LabelImg was used to annotate Angelica dahurica and weed targets with rectangular bounding boxes. The annotated categories included Angelica dahurica and weeds. It should be noted that this study did not perform fine-grained classification of different weed species; instead, all non-Angelica dahurica plants in the field were uniformly labeled as the weed class. The Angelica dahurica label was set as “baizhi”, and the weed label was set as “zacao”. Annotation files were saved in YOLO format, and each annotation file contained the target class index, bounding-box center coordinates, bounding-box width, and bounding-box height. During annotation, bounding boxes were drawn as closely as possible around the target contour. Occluded targets, small targets, and dense weed regions were checked individually to reduce missed and incorrect annotations that could affect model training and performance evaluation.
In real field environments, “weeds” do not correspond to a single species but consist of plant groups with obvious differences in morphology, texture, and growth habits. Different weeds vary in leaf shape, color depth, plant height, and spatial distribution. Meanwhile, some weeds have color and morphological characteristics similar to those of Angelica dahurica seedlings, which can easily cause false detections or missed detections. To visually demonstrate the diversity of weed targets in the dataset, this study selected representative samples, including flixweed, thistle, jointed goatgrass, speedwell, bindweed, and horseweed, as shown in Figure 2. These samples cover different leaf shapes, plant forms, and growth postures and effectively reflect target diversity and complexity in weed detection for Angelica dahurica fields.
Figure 2.
Weed sample images from the Angelica dahurica field. (a) Flixweed; (b) thistle; (c) jointed goatgrass; (d) speedwell; (e) bindweed; (f) horseweed.
To increase the number of Angelica dahurica and weed samples and improve model robustness, data augmentation methods, including brightness adjustment, horizontal flipping, noise addition, and random rotation, were applied independently within the training, validation, and test subsets [33]. The augmented samples are shown in Figure 3, where Figure 3a denotes the original image, Figure 3b brightness enhancement, Figure 3c horizontal mirroring, Figure 3d Gaussian noise, and Figure 3e random rotation.
Figure 3.
Examples of data augmentation effects. (a) Original image; (b) brightness enhancement; (c) horizontal mirroring; (d) Gaussian noise; (e) random rotation.
To avoid potential data leakage between the training, validation, and test subsets, the 2286 original images were first divided at the raw-image level at a ratio of 8:1:1. The training, validation, and test subsets contained 1828, 229, and 229 original images, respectively. Data augmentation was then performed within each subset, and all augmented versions inherited the subset assignment of their corresponding original images. Therefore, no original image and its augmented variants appeared simultaneously in different subsets. The specific image counts are reported in Table 2.
Table 2.
Raw-image-level dataset split and image counts after augmentation.
As shown in Table 2, after augmentation within each subset, the training set contained 9140 images, while the validation and test subsets each contained 1145 images. The validation subset was used to monitor model training. The augmented test subset was used as the common evaluation basis for the model-comparison, ablation, and loss-function experiments. In addition, the original 229 test images were evaluated separately to provide a non-augmented reference for the final MSI detector.
2.3. Improved MSI Detector
2.3.1. Overall Structure of the MSI Detector
To improve weed detection accuracy and deployment efficiency under complex A. dahurica field conditions, we developed the MSI detector from the compact YOLOv11n baseline. The detector retains a single-stage object-detection pipeline with three functional components: a feature-extraction backbone, a multi-scale feature-fusion neck, and a detection head. The backbone extracts texture, morphology, and edge information; the neck combines spatial detail with semantic context across scales; and the head predicts class labels, confidence scores, and bounding-box coordinates. The resulting design is intended to preserve the fast inference behavior required by field machinery while improving recognition of small, dense, and partially occluded weeds.
Although the original YOLOv11n has a good lightweight foundation, it is still easily affected by small-scale weeds, leaf occlusion, soil background interference, and the visual similarity between Angelica dahurica seedlings and weeds in field scenarios, leading to missed detections, false detections, or localization deviations for some targets. To address these problems, this study improves the model in three aspects: feature extraction, feature enhancement, and bounding-box regression.
The overall structure of the MSI detector is shown in Figure 4. The network follows a single-stage detection framework composed of Backbone, Neck, and Detect Head modules. The Backbone extracts hierarchical features from the input image, the Neck performs multi-scale feature fusion to retain both fine spatial detail and high-level semantic information, and the Detect Head produces the class, confidence, and location outputs used for crop-versus-weed localization.
Figure 4.
Overall structure of the MSI detector for weed detection in Angelica dahurica fields. Solid arrows indicate forward feature propagation and feature fusion; dashed arrows indicate the connections from the ground-truth annotations and prediction outputs to the Inner-EIoU loss function; dashed rounded rectangles indicate the boundaries of the functional modules.
Compared with the original YOLOv11n, the proposed MSI detector introduces three coordinated changes. First, MobileNetV3 replaces the computationally heavier backbone to reduce parameters and floating-point operations. Second, SimAM is inserted into feature extraction and fusion to emphasize discriminative crop and weed regions and suppress soil, shadow, and occlusion interference. Third, the original bounding-box regression loss is replaced with Inner-EIoU to improve localization of small and partially occluded targets. Together, these changes seek a better balance between recognition quality and edge-side efficiency rather than optimizing a single accuracy metric.
2.3.2. MobileNetV3 Lightweight Backbone Network
To reduce the number of model parameters and computational complexity and improve applicability for real-time field detection and edge-device deployment, this study adopts MobileNetV3 to replace the original backbone network of YOLOv11n. Although the original YOLOv11n backbone has favorable detection performance, the Angelica dahurica field weed detection task requires further reductions in model size and computational cost while maintaining recognition accuracy to meet the real-time inference requirements of industrial computers or edge computing platforms.
MobileNetV3 is a lightweight convolutional neural network designed for mobile and embedded devices. It combines depthwise separable convolution, inverted residual structures, linear bottlenecks, and lightweight attention mechanisms, maintaining strong feature extraction ability while reducing the number of parameters and computational cost [34]. Compared with standard convolution, depthwise separable convolution decomposes a standard convolution into a depthwise convolution and a pointwise convolution, substantially reducing redundant computation in convolution operations. The computational cost of standard convolution can be expressed as
where DK denotes the convolution kernel size, M denotes the number of input channels, N denotes the number of output channels, and DF denotes the input feature map size.
Depthwise separable convolution consists of depthwise convolution and pointwise convolution, and its computational cost can be expressed as
The ratio between the two computational costs can be expressed as
Equations (1)–(3) show that decomposing standard convolution into depthwise and pointwise convolutions can effectively reduce redundant computation, thereby decreasing model computational cost and improving inference speed.
In the proposed model, MobileNetV3 is mainly used to replace the Backbone of YOLOv11n and output feature maps at different scales to the subsequent Neck network for multi-scale feature fusion. Because weeds in Angelica dahurica fields usually have small scale, dense distribution, and obvious occlusion, shallow features contain more edge, texture, and spatial location information, while deep features contain stronger semantic representation. Therefore, this study preserves the multi-scale features output from different stages of MobileNetV3, corresponding to the P3, P4, and P5 layers in the subsequent feature fusion network. P3, P4, and P5 correspond to feature layers with strides of 8, 16, and 32, respectively, thus balancing detailed information for small weed targets and semantic discrimination under complex backgrounds.
By introducing MobileNetV3, the model can significantly reduce Params and FLOPs while maintaining effective feature extraction ability, providing a lightweight foundation for deployment in real-time Angelica dahurica field weeding systems.
2.3.3. SimAM Attention Mechanism
The background of Angelica dahurica field images is complex. Weeds and Angelica dahurica seedlings show certain similarities in color, texture, and leaf morphology, while soil, shadows, plant residues, and leaf occlusion also introduce interference. During feature extraction, if the model cannot adequately distinguish target regions from background regions, small weeds may be missed, similar targets may be incorrectly detected, and bounding-box localization may become inaccurate. Therefore, this study introduces the SimAM attention mechanism into the MSI detector to enhance feature representation of key target regions [35].
Existing attention mechanisms mainly include channel attention and spatial attention. Their structural differences are shown in Figure 5. Channel attention mainly weights feature maps along the channel dimension, as shown in Figure 5a. Its core idea is to estimate the importance of different feature channels and assign weights accordingly. However, such methods usually apply the same weight to all spatial positions within one channel, making it difficult to further distinguish target regions from background regions. Spatial attention mainly weights feature maps along the spatial dimension, as shown in Figure 5b. It can highlight important spatial regions in an image but usually processes all channels in the same way, making it difficult to fully express semantic differences among channels.
Figure 5.
Structural comparison of different attention mechanisms. (a) Channel attention mechanism; (b) spatial attention mechanism; (c) SimAM (a simple, parameter-free attention module) three-dimensional attention mechanism. X denotes the input feature map, while C, W, and H denote the number of channels, width, and height, respectively.
Unlike the above one-dimensional channel attention and two-dimensional spatial attention mechanisms, SimAM assigns three-dimensional attention weights to each neuron in the feature map, as shown in Figure 5c. This method does not introduce additional convolutional or fully connected layers and does not add learnable parameters. Instead, it constructs an energy function to measure the difference between each neuron and its surrounding neurons. Neurons with more obvious differences usually contain stronger discriminative information and should be assigned higher attention weights. For the weed detection task in Angelica dahurica fields, this mechanism helps the model focus on weed leaf edges, texture differences, and local morphological features while suppressing interference from soil background, shadows, and occluded regions.
Let the input feature map be X, and let the number of channels, height, and width be C, H, and W, respectively. For neurons within each channel, SimAM measures the linear separability between the current neuron and other neurons in the same channel using an energy function. The minimum energy can be expressed as
where t denotes the current neuron, denotes the mean of neurons within the same channel, denotes the variance of neurons within the same channel, and is a regularization coefficient. The mean and variance are expressed as
where M = H × W denotes the number of feature points in a single channel. Equations (4)–(6) indicate that when a neuron differs significantly from surrounding neurons, its energy value is relatively small, indicating that this position contains more obvious discriminative features. To convert energy values into attention weights, SimAM normalizes the energy values and uses the sigmoid function to generate attention weights, thus completing feature enhancement:
where is the original input feature map, X′ is the enhanced output feature map, E denotes the set of energy values of all neurons in the feature map, and ⊙ denotes the Hadamard product, i.e., element-wise multiplication. This design preserves the lightweight and efficient properties of the model while accurately capturing discriminative information that deviates from the normal activation pattern, effectively suppressing background noise and interference and improving the model’s ability to capture key features.
SimAM introduces no additional learnable parameters and only a small amount of computational overhead. It enhances key-region feature representation while maintaining model lightweighting. Compared with traditional channel attention and spatial attention mechanisms, SimAM simultaneously considers information in both channel and spatial dimensions, making it more suitable for Angelica dahurica field scenarios involving small weed targets, dense distributions, complex backgrounds, and severe occlusion. Therefore, this module helps improve weed recognition and robustness under complex environments.
2.3.4. Inner-EIoU Bounding-Box Regression Loss Function
In object detection tasks, the bounding-box regression loss directly affects the model’s prediction accuracy for target position and scale. Weeds in Angelica dahurica fields usually have a small scale, dense distribution, and mutual leaf occlusion. Some weeds are similar to Angelica dahurica seedlings in color and morphology, which can easily cause location offset, width–height mismatch, or incomplete target boxes between predicted boxes and ground-truth boxes. Therefore, relying only on the original bounding-box regression loss in YOLOv11n cannot fully satisfy the localization requirements for small weeds under complex field environments. To further improve bounding-box regression ability, this study introduces the Inner-EIoU loss function to improve the original bounding-box loss.
Intersection over Union (IoU) is the most fundamental metric in bounding-box regression. It can be calculated as
where B denotes the predicted box, denotes the ground-truth box, || denotes the intersection area between the predicted box and the ground-truth box, and || denotes their union area. IoU reflects the overlap between the predicted and ground-truth boxes. However, when the two boxes do not intersect, IoU cannot effectively reflect the distance relationship between them, resulting in slow convergence during regression.
To further improve bounding-box regression accuracy, EIoU loss considers the overlap area, center-point distance, width difference, and height difference between the predicted and ground-truth boxes based on IoU. The EIoU loss function can be expressed as
where and denote the center points of the predicted and ground-truth boxes, respectively; and denote the width and height of the predicted box; and denote the width and height of the ground-truth box; denotes the diagonal length of the minimum enclosing rectangle of the predicted and ground-truth boxes; and denote the width and height of the minimum enclosing rectangle; and denotes the Euclidean distance. Compared with CIoU, EIoU decomposes the aspect-ratio constraint into two independent penalty terms for width and height, enabling the model to regress the width and height of the predicted box separately and improving bounding-box localization accuracy.
However, ordinary EIoU mainly constrains regression based on the overlap relationship between the original predicted and ground-truth boxes. For small, occluded, and densely distributed weeds in Angelica dahurica fields, it may still be affected by complex backgrounds and low-quality samples. Therefore, the Inner-IoU method constructs auxiliary bounding boxes for IoU calculation, allowing the model to focus more on the overlap within the internal target region and strengthening regression constraints on key target areas.
Let the center coordinates, width, and height of the predicted box be , , , and , respectively, and let those of the ground-truth box be , , , and . The predicted and ground-truth boxes are scaled using the scale factor to obtain corresponding internal auxiliary boxes. In this study, was set to 0.7. The coordinates of the internal auxiliary box of the predicted box can be expressed as
The coordinates of the internal auxiliary box of the ground-truth box can be expressed as
Based on the internal auxiliary boxes of the predicted and ground-truth boxes, Inner-IoU can be calculated as
where denotes the internal auxiliary box of the predicted box after scaling, denotes the internal auxiliary box of the ground-truth box after scaling, and denotes the intersection over union between the two internal auxiliary boxes. By introducing internal auxiliary boxes, the model can focus more on the target center region and key local features and reduce the influence of background regions and edge noise on bounding-box regression.
On this basis, Inner-IoU and EIoU are combined to construct the Inner-EIoU loss function, expressed as
This loss function strengthens the overlap constraint between the internal regions of predicted and ground-truth boxes using , making the model focus more on the core region of weed targets. At the same time, it retains the independent constraints of EIoU on center-point distance, width difference, and height difference, enabling more accurate regression of predicted boxes in terms of position, width, and height [36,37].
For weed detection in Angelica dahurica fields, Inner-EIoU can effectively improve localization performance for small-scale and occluded targets. When a weed target is small or its edge region is occluded, the internal auxiliary box can reduce the influence of background noise and edge uncertainty on regression, allowing the model to focus more on the main body of the target. Meanwhile, the decoupled width and height constraints in EIoU further reduce width–height mismatch. Therefore, introducing Inner-EIoU into the MSI detector helps improve bounding-box localization accuracy and overall detection performance under complex field environments.
3. Results and Discussion
3.1. Experimental Environment, Training Parameters, and Evaluation Metrics
To ensure the fairness of experimental results among different models, all models were trained and tested under the same hardware, software, and training parameter settings. The computer hardware used in the experiments included an Intel(R) Core(TM) i5-14400F CPU, 32 GB RAM, and an NVIDIA GeForce RTX 5060 GPU. The software environment included Python 3.10.0, PyTorch 2.9.0, CUDA 13.0, and PyCharm 2022.3.3. The experimental environment is shown in Table 3.
Table 3.
Experimental environment configuration.
During model training, all images were resized to 640 × 640 pixels to meet the input requirements of YOLO-series models. The number of training epochs was set to 100, the batch size was set to 16, the optimizer was stochastic gradient descent (SGD), the initial learning rate was set to 0.01, and the momentum parameter was set to 0.937. To ensure the fairness of comparative experiments, YOLOv11n, the MSI detector, and other comparison models used the same dataset splitting strategy and main training parameters. The detailed training parameters are shown in Table 4.
Table 4.
Training parameter settings.
To comprehensively evaluate the performance of the proposed MSI detector in the Angelica dahurica field weed detection task, this study evaluates detection accuracy, model complexity, and real-time performance. Detection accuracy metrics include Precision (P), Recall (R), F1-score, and mAP@0.5. Model complexity and real-time metrics include the number of parameters (Params), floating-point operations (FLOPs), and frames per second (FPS) [38]. Precision denotes the proportion of correct targets among model predictions, Recall denotes the ability of the model to detect real targets, and F1-score evaluates the balance between Precision and Recall. The formulas are as follows:
where TP denotes the number of correctly detected targets, FP denotes the number of false detections, and FN denotes the number of missed detections. mAP is a commonly used comprehensive metric in object detection and measures the average detection accuracy across different classes. It is calculated as
where n denotes the number of detection classes and denotes the average precision of the class. This study includes two detection classes: Angelica dahurica and weeds; therefore, = 2. mAP@0.5 denotes mean average precision at an IoU threshold of 0.5 and reflects the model’s bounding-box localization ability. In addition, Params and FLOPs are used to measure model size and computational complexity, respectively, while FPS is used to evaluate real-time inference capability.
3.2. Performance Comparison of Object Detection Models
To evaluate the overall performance of the MSI detector in weed detection under complex Angelica dahurica field conditions, SSD, Faster R-CNN, YOLOv5n, YOLOv8n, and the original YOLOv11n were selected as comparison models. All models were trained and evaluated using the same dataset partition and major training settings. The quantitative results on the augmented test subset are presented in Table 5.
Table 5.
Performance comparison of different object detection models on the augmented test subset.
As shown in Table 5, SSD and Faster R-CNN achieved mAP@0.5 values of 86.4% and 87.9%, respectively. Although Faster R-CNN exhibited relatively high precision and recall, its parameter count and computational cost reached 33.6 M and 153.2 GFLOPs, respectively, while its inference speed was only 62.0 FPS. These results indicate that the two-stage detector has limited suitability for real-time field applications and deployment on resource-constrained devices. YOLOv5n achieved a relatively high inference speed of 192.0 FPS, but its precision, recall, and mAP@0.5 were lower than those of YOLOv8n and YOLOv11n.
To provide a more intuitive comparison, the detection metrics and the accuracy–efficiency characteristics of the different models are visualized in Figure 6. Figure 6a compares precision, recall, F1 score, and mAP@0.5 across the six models. The results show that the MSI detector achieved the highest values for all four metrics, with precision, recall, F1 score, and mAP@0.5 reaching 92.5%, 94.8%, 93.6%, and 95.2%, respectively. Compared with the original YOLOv11n, these metrics increased by 1.5, 3.4, 2.4, and 3.0 percentage points, respectively. In particular, the improvement in recall indicates that the proposed model reduced missed detections of weeds under small-target, dense-distribution, and occlusion conditions.
Figure 6.
Performance comparison of different object detection models. (a) Comparison of precision, recall, F1 score, and mAP@0.5; (b) comparison of the trade-off among mAP@0.5, inference speed, and parameter count, where bubble size represents the number of parameters.
Figure 6b further presents the trade-off among mAP@0.5, inference speed, and parameter count. The horizontal and vertical axes represent FPS and mAP@0.5, respectively, while the bubble size represents the number of model parameters. A model located closer to the upper-right corner provides a more favorable balance between detection accuracy and inference speed. The MSI detector is located in the upper-right region of the figure, achieving the highest mAP@0.5 of 95.2% and the highest inference speed of 215.0 FPS, while containing only 0.275 M parameters. In contrast, Faster R-CNN has the largest parameter count and the lowest inference speed. Although YOLOv5n provides relatively high inference speed, its detection accuracy remains lower than that of YOLOv8n, YOLOv11n, and the MSI detector.
Compared with the original YOLOv11n, the MSI detector reduced the parameter count from 2.58 M to 0.275 M and the computational cost from 6.3 to 1.1 GFLOPs, while increasing the inference speed from 185.6 to 215.0 FPS. Therefore, the proposed model not only improves weed detection accuracy but also achieves greater model compactness and computational efficiency. These results demonstrate that the MSI detector provides a favorable balance among detection accuracy, model complexity, and real-time performance, making it suitable as a visual-perception component for edge-deployed precision-weeding systems.
3.3. Ablation Experiments
To verify the influence of MobileNetV3, SimAM, and Inner-EIoU on model performance, this study used the original YOLOv11n as the baseline model and conducted ablation experiments under the same dataset and training parameter settings. The results on the augmented test subset are shown in Table 6.
Table 6.
Ablation experiment results of the MSI detector on the augmented test subset.
As shown in Table 6, the original YOLOv11n achieved a Precision, Recall, F1-score, and mAP@0.5 of 91.0%, 91.4%, 91.2%, and 92.2%, respectively, with 2.58 M parameters and 6.3 G FLOPs. After only introducing MobileNetV3, the number of parameters decreased to 0.275 M, FLOPs decreased to 1.1 G, and FPS increased to 232, indicating that MobileNetV3 can significantly reduce model complexity and improve inference speed. However, because lightweighting of the backbone network weakens feature extraction capability to some extent, detection accuracy decreased.
After only introducing SimAM, the model’s Precision, Recall, F1-score, and mAP@0.5 increased to 93.2%, 94.1%, 93.6%, and 94.0%, respectively, indicating that the SimAM attention mechanism can enhance feature representation of key regions of Angelica dahurica and weeds and reduce interference from soil background, shadows, and occlusion. After only replacing the loss function with Inner-EIoU, the model mAP@0.5 increased to 95.6%, indicating that this loss function can improve bounding-box regression and enhance localization accuracy for small-scale and occluded targets.
After integrating the three improvements, the MSI detector achieved a Precision, Recall, F1-score, and mAP@0.5 of 92.5%, 94.8%, 93.6%, and 95.2%, respectively, while reducing the number of parameters and FLOPs to 0.275 M and 1.1 G and achieving 215 FPS. It should be noted that the model using only Inner-EIoU achieved the highest mAP@0.5 value of 95.6%. However, this model retained the original YOLOv11n backbone and therefore did not reduce model complexity or improve deployment efficiency. In contrast, the final MSI detector achieved only a 0.4 percentage-point decrease in mAP@0.5 compared with the Inner-EIoU-only model, while reducing the number of parameters from 2.58 M to 0.275 M and FLOPs from 6.3 G to 1.1 G. The inference speed also increased from 185.6 FPS to 215.0 FPS. Therefore, the final MSI detector was selected not because it obtained the single highest mAP@0.5, but because it provided the best overall balance among detection accuracy, model compactness, computational efficiency, and suitability for edge-side deployment.
3.4. Comparison of Different Loss Functions
To verify the effectiveness of the Inner-EIoU loss function for weed detection in Angelica dahurica fields, this study used the original YOLOv11n as the base model and only replaced the bounding-box regression loss while keeping the network structure, dataset division, and training parameters unchanged. CIoU, DIoU, EIoU, WIoU, and Inner-EIoU were compared. The results on the augmented test subset are shown in Table 7.
Table 7.
Comparison of different bounding-box regression losses based on YOLOv11n on the augmented test subset.
As shown in Table 7, different bounding-box regression losses have different effects on model detection performance. Inner-EIoU achieved an mAP@0.5 of 95.6%, which was higher than those of the other loss functions. Compared with CIoU, Inner-EIoU improved mAP@0.5 by 3.4 percentage points, indicating that it can effectively improve bounding-box localization accuracy.
This is because Inner-EIoU introduces an internal auxiliary box constraint based on EIoU, enabling the model to focus more on the target body region during training and reducing regression errors caused by edge backgrounds, occlusion, and incomplete small targets. Therefore, Inner-EIoU is more suitable for detecting small-scale, dense, and occluded weed targets in Angelica dahurica fields.
3.5. Training Process and Convergence Analysis
To further analyze the training stability and convergence of the MSI detector, this study visualized the loss functions and evaluation metrics during model training. The results are shown in Figure 7. The figure shows that with increasing training epochs, box loss, cls loss, and dfl loss in both the training and validation sets generally decreased and gradually stabilized in the later training stage. This indicates that the model effectively learned the feature information of Angelica dahurica and weed targets and that no obvious divergence occurred during training.
Figure 7.
Training process curves of the MSI detector model.
Meanwhile, Precision, Recall, and mAP@0.5 generally increased with training epochs and remained relatively stable in the later stage. The stable improvement of the mAP curve indicates that the model’s ability to identify target classes and localize bounding boxes gradually improved. The combined loss and accuracy curves show that the MSI detector has good convergence and training stability for the Angelica dahurica field weed detection task.
To further analyze detection performance under different confidence thresholds, this study plotted the F1–confidence curve and Precision–Recall curve of the MSI detector, as shown in Figure 8. Figure 8a shows that when the confidence threshold is approximately 0.209, the overall F1 value of all classes is approximately 0.93, indicating that the model achieves a good balance between Precision and Recall. Figure 8b shows that the PR curves of Angelica dahurica and weeds remain at a high level, indicating that the model maintains good Precision under different Recall conditions.
Figure 8.
Performance curves of the MSI detector model. (a) F1–confidence curve; (b) Precision–Recall curve.
In summary, the MSI detector converges stably during training and shows good detection performance for both Angelica dahurica and weeds, providing a reliable basis for subsequent detection-result visualization, heatmap analysis, and field validation.
3.6. Visualization Analysis of Detection Results
To visually compare the actual detection effects of different models under complex Angelica dahurica field environments, this study selected the same test image for visualization analysis. The results are shown in Figure 9. The original image contains densely distributed Angelica dahurica seedlings and weed targets, some of which are small. The soil background is complex, which imposes high requirements on the model’s detection ability.
Figure 9.
Detection-result comparison of different models in the Angelica dahurica field weed detection task. (a) Original image; (b) YOLOv11n; (c) YOLOv11n-MobileNetV3; (d) YOLOv11n-Inner-EIoU; (e) YOLOv11n-SimAM; (f) YOLOv11n-MSI.
The detection results show that YOLOv11n can identify most Angelica dahurica and weed targets, but some small targets and dense regions still exhibit low confidence or unstable localization. After introducing MobileNetV3, the model maintains a certain detection capability, but because of backbone lightweighting, the detection confidence and localization stability of some targets decrease. After using Inner-EIoU, the detection boxes fit the target regions better, indicating that the improved loss function contributes to improved bounding-box regression accuracy. After introducing SimAM, the model’s attention to weed targets is enhanced, and detection in small-target and dense regions improves.
Overall, MSI detector detects Angelica dahurica and weed targets in the image more completely, with stable bounding boxes and high target confidence. This result indicates that the combination of MobileNetV3, SimAM, and Inner-EIoU improves the model’s recognition and localization capability for weed targets under complex Angelica dahurica field environments, which is consistent with the ablation experiment results.
To further analyze detection stability under complex field disturbances, this study constructed three types of interference, namely occlusion, Gaussian noise, and motion blur, based on the same test image. YOLOv5n, YOLOv8n, YOLOv11n, and the MSI detector were selected for robustness visualization comparison. The results are shown in Figure 10. Occlusion interference was used to simulate leaf overlap, mutual occlusion among targets, or occlusion by operational components; Gaussian noise was used to simulate image quality degradation caused by sensor noise and illumination fluctuations during image acquisition; and motion blur was used to simulate imaging blur caused by moving acquisition or the motion of weeding equipment in the field.
Figure 10.
Robustness detection-result comparison of different models under original and disturbed image conditions. The first row shows original image detection results; the second to fourth rows show occlusion, Gaussian noise, and motion blur conditions, respectively; the first to fourth columns show YOLOv5n, YOLOv8n, YOLOv11n, and the MSI detector, respectively.
Figure 10 shows that under the original image condition, all models can detect some Angelica dahurica and weed targets, but their detection stability differs in small-target, dense-region, and complex soil background scenarios. YOLOv5n and YOLOv8n have relatively insufficient recognition ability for some small weed targets and tend to miss detections in dense-target or complex-background regions. YOLOv11n shows improved detection performance but still exhibits bounding-box shift and confidence reduction under disturbance conditions. In contrast, the MSI detector maintains relatively complete target detection results under different conditions, and its detection boxes fit the Angelica dahurica and weed target regions well, indicating that the improved model has more stable feature extraction and target localization ability.
After occlusion, noise, and motion blur disturbances are added, some comparison models show missed detections, bounding-box shifts, or decreased confidence, especially for small weeds and densely distributed regions. The MSI detector still identifies Angelica dahurica and weeds effectively, indicating that the joint improvements of the MobileNetV3 lightweight backbone, SimAM attention mechanism, and Inner-EIoU loss function enhance the model’s ability to attend to key target regions and adapt to complex interference conditions.
Overall, the MSI detector shows good detection stability and robustness under original and disturbed image conditions. For mechanized weeding in Angelica dahurica fields, detection results must be further transmitted to a robotic arm or terminal weeding mechanism to provide target localization information for mechanical weeding actions. Therefore, stable recognition and accurate localization under complex environments are of great importance. The results in Figure 10 show that the improved model can provide a reliable visual perception basis for low-cost mechanized precision weeding.
3.7. Heatmap Visualization Analysis
To further verify the ability of the improved model to attend to target regions, Grad-CAM was used to visualize the last-layer features of different models. One Angelica dahurica sample and two weed samples were selected for heatmap analysis, as shown in Figure 11 [39]. The highlighted regions in the figure indicate positions with higher model attention.
Figure 11.
Heatmap visualization comparison of different models on Angelica dahurica and weed samples. The first column shows original images, and the second to fifth columns show heatmap results of YOLOv5n, YOLOv8n, YOLOv11n, and the MSI detector, respectively. The first row shows weed sample 1, the second row shows an Angelica dahurica sample, and the third row shows weed sample 2.
Figure 11 shows that the heatmap responses of YOLOv5n and YOLOv8n are relatively scattered, and part of the attention is concentrated on the soil background. YOLOv11n shows enhanced target responses, but background interference still exists in some samples. In contrast, the high-response regions of the MSI detector are more concentrated on the main body of Angelica dahurica and weeds, especially on weed leaf edges and central regions. This indicates that the improved model can more effectively extract key target features and reduce the influence of complex backgrounds on detection results.
3.8. Comparison of Model Performance on Original and Augmented Test Images
To further examine the influence of test-image augmentation on the evaluation results, the trained MSI detector was evaluated separately on the original non-augmented test images and the corresponding augmented test images. The original test subset contained 229 images, whereas the augmented test subset contained 1145 images. Both evaluations were conducted using the same trained model, model weights, input image size, inference settings, and evaluation metrics.
On the 229 original test images, the MSI detector achieved a Precision of 93.1%, a Recall of 95.2%, an F1-score of 94.1%, and an mAP@0.5 of 95.9%. On the 1145-image augmented test subset, the corresponding values were 92.5%, 94.8%, 93.6%, and 95.2%, respectively. Compared with the augmented test subset, the original test images produced increases of 0.6, 0.4, 0.5, and 0.7 percentage points in Precision, Recall, F1-score, and mAP@0.5, respectively.
The slightly higher scores on the original test images indicate that the applied image transformations introduced additional visual variations and increased the evaluation difficulty to some extent. Because the augmented test images were generated from the original test images, they are correlated rather than fully independent observations. Therefore, the results on the 229 original test images are reported as a non-augmented reference for the final MSI detector, while the results on the 1145 augmented images are retained as a supplementary robustness-oriented evaluation.
The original images were divided into the training, validation, and test subsets before augmentation, and all augmented versions retained the subset assignment of their corresponding original images. Therefore, no original image or its augmented variants were shared across different subsets. The model-comparison and ablation experiments reported in Table 5, Table 6 and Table 7 were conducted under the same augmented-test evaluation protocol to ensure consistent comparisons among the models and experimental variants. Accordingly, the results in Table 5, Table 6 and Table 7 are used to assess relative performance differences under a common protocol, whereas the original-image results provide an additional reference for evaluating the final MSI detector without test-image augmentation.
3.9. Field Validation and Edge-Side Deployment Analysis
To further verify the field adaptability and edge-side inference capability of the improved model, the MSI detector was deployed on an NVIDIA Jetson Orin Nano 8GB edge computing platform after model training. Field validation experiments were conducted using image data collected by a Stereolabs ZED 2i stereo camera equipped with a 2.1 mm lens and a polarizer installed on a mechanical weeding prototype in an actual Angelica dahurica field, as shown in Figure 12. It should be noted that the field validation data used in this section were independent of the previous training, validation, and test sets. Specifically, after model training and deployment were completed, new field videos were collected under actual Angelica dahurica planting conditions. Therefore, this part of the data can more realistically reflect model detection performance under natural illumination variation, complex soil background, plant occlusion, slight camera vibration, and mechanical operation conditions, while avoiding evaluation bias caused by mixing training and field validation data.
Figure 12.
Mechanical weeding prototype and camera installation used in the field validation experiments.
The independent field validation dataset consisted of 300 image frames extracted from continuous field videos collected after model training and deployment. These frames were not used in the previous training, validation, or test subsets. To reduce redundancy between adjacent video frames, image frames were sampled from the continuous videos and then manually annotated with the locations and categories of Angelica dahurica plants and field weeds. After annotation, model detection results were matched with the manual annotations, and TP, FP, and FN were counted according to the IoU relationship between ground-truth boxes and predicted boxes. Precision, Recall, F1-score, and mAP@0.5 were then calculated. This evaluation method was used to assess false detections, missed detections, and target localization performance under actual field operation scenarios.
The experimental results showed that the MSI detector achieved a Precision, Recall, F1-score, and mAP@0.5 of 91.6%, 88.4%, 90.0%, and 91.8%, respectively, on the independent field validation dataset. Compared with the laboratory test results, all detection metrics decreased to some extent. This decrease was mainly caused by natural illumination variation, plant occlusion, slight camera vibration, soil texture interference, and differences in weed target scale under actual field conditions. Nevertheless, the model still maintained relatively high detection accuracy, indicating good field adaptability for crop–weed visual detection in Angelica dahurica fields.
For edge-side deployment, the trained MSI detector was converted into a TensorRT FP16 engine and evaluated on the NVIDIA Jetson Orin Nano 8GB platform [40]. The input video frames were resized to 640 × 640 pixels before being fed into the detector, and the batch size was set to 1 for real-time frame-by-frame inference. The device was operated in the 15 W power mode. Before speed measurement, 10 warm-up inference iterations were performed, and the warm-up time was excluded from the FPS calculation. The subsequent 300 frame-extracted images were processed sequentially as the timed evaluation set, and the average detection speed was calculated based on the total processing time of these 300 images. Under these settings, the MSI detector achieved an average speed of 46.8 FPS on the Jetson platform. The reported FPS refers to the average detection-pipeline speed, mainly including image resizing, TensorRT FP16 inference, and post-processing such as non-maximum suppression. It does not include camera exposure time, image transmission delay, camera-to-world coordinate transformation, actuator response, or mechanical weeding execution time. The complete end-to-end latency from image acquisition to actuator response was not measured in this study.
For comparison, the original YOLOv11n was tested on the same NVIDIA Jetson Orin Nano 8GB platform under identical deployment conditions. It achieved an average detection-pipeline speed of 41.2 FPS, while the MSI detector achieved 46.8 FPS, indicating that the proposed model provides higher edge-side inference efficiency.
Overall, the MSI detector demonstrated favorable field detection performance and real-time edge-side inference capability. However, it should be emphasized that this study focuses on crop–weed visual perception and edge-side inference rather than the complete closed-loop mechanical weeding process. The detected weed positions can provide visual localization information for subsequent mechanical weeding control. Camera-to-world coordinate transformation accuracy, actuator positioning error, weed removal rate, and long-term continuous-operation stability were not quantitatively evaluated in this study and will be further investigated in future integrated mechanical weeding experiments.
3.10. Agricultural Implications and Limitations
The proposed MSI detector has potential applications in digital agriculture and precision weed management in Angelica dahurica production. Recent studies have demonstrated the feasibility of lightweight models, edge-side inference, and real-time weed localization in different agricultural scenarios [30,31,32]. Compared with these studies, the present work focuses on crop–weed detection in Angelica dahurica fields during the seedling stage and evaluates the model on an NVIDIA Jetson Orin Nano 8GB platform. Because the crops, datasets, task definitions, hardware platforms, and evaluation protocols differ among these studies, direct numerical comparisons are not appropriate. The model is intended to provide visual-perception and weed-localization information for subsequent mechanical rotary weeding.
Several limitations should be acknowledged. First, the dataset was collected mainly from one production area and represented primarily the seedling stage of Angelica dahurica. Therefore, additional validation is required under different geographic regions, seasons, soil conditions, and early-stage field environments. Second, all non-Angelica dahurica plants were grouped into one weed class. This binary crop–weed formulation is suitable for the mechanical rotary-weeding scenario considered in this study, in which detected weeds receive the same mechanical treatment, but it does not support species-level weed identification or weed-specific control strategies.
Third, the field-validation experiment evaluated visual detection and edge-side inference rather than a complete perception-to-actuation system. The reported 46.8 FPS represents the average detection-pipeline speed of the MSI detector on the Jetson Orin Nano platform and does not include camera-to-world coordinate transformation, actuator response, or mechanical weeding execution. Coordinate-transformation accuracy, actuator positioning error, weed-removal rate, crop-safety rate, and long-term operating stability should be evaluated in future integrated field experiments. Overall, the present study provides a field-specific and edge-deployable visual-perception component for precision weed management in Angelica dahurica fields.
4. Conclusions
To address the problems of morphological similarity between weeds and Angelica dahurica seedlings, small target size, complex backgrounds, and severe occlusion in Angelica dahurica fields, this study proposed the MSI detector, an improved YOLOv11n-based weed detection model. The model uses MobileNetV3 to replace the original backbone network to reduce the number of parameters and computational complexity, introduces the parameter-free SimAM attention mechanism to enhance feature representation of key weed regions, and adopts the Inner-EIoU loss function to improve bounding-box localization accuracy for small and occluded targets.
The experimental results show that the MSI detector achieved a Precision, Recall, F1-score, and mAP@0.5 of 92.5%, 94.8%, 93.6%, and 95.2%, respectively, on the test set, with 0.275 M parameters, 1.1 G FLOPs, and 215 FPS. Compared with the original YOLOv11n, the improved model significantly reduced model complexity while improving detection accuracy, indicating that the proposed method provides favorable accuracy, lightweighting, and real-time performance for weed detection in Angelica dahurica fields. Ablation experiments, detection-result visualization, robustness analysis, and heatmap results further show that the combination of MobileNetV3, SimAM, and Inner-EIoU improves the model’s recognition and localization ability under complex field backgrounds, small weed targets, and occluded target conditions. Although the Inner-EIoU-only variant achieved a slightly higher mAP@0.5 of 95.6%, the final MSI detector was selected because it substantially reduced the parameter count and computational cost while providing faster inference, thereby offering a better overall balance for edge-side deployment.
To evaluate the field applicability of the visual detection stage, the MSI detector was deployed on an NVIDIA Jetson Orin Nano 8GB edge computing platform, and an independent field validation dataset consisting of 300 frame-extracted images was constructed from videos collected by a field camera after model deployment. Field validation results showed that the MSI detector achieved a Precision, Recall, F1-score, and mAP@0.5 of 91.6%, 88.4%, 90.0%, and 91.8%, respectively. After TensorRT FP16 acceleration, the model reached an average detection-pipeline speed of 46.8 FPS on the Jetson platform, indicating that it can meet the real-time inference requirement of the visual perception stage. However, this speed does not represent the execution speed of a complete perception-to-actuation mechanical weeding system.
In summary, the MSI detector provides a favorable balance among detection accuracy, model compactness, real-time inference, and edge-side deployment capability for weed detection in A. dahurica fields. The model can provide visual perception and target localization support for early-stage mechanized precision weeding. However, the current study does not fully evaluate the complete perception-to-actuation process. Future work should expand the dataset across different growth stages, seasons, field environments, and weed communities, and should further quantify camera-to-world coordinate-transformation error, actuator positioning accuracy, weed removal rate, and long-term continuous-operation stability in integrated mechanical weeding experiments.
Author Contributions
Conceptualization, J.P., X.Y. and Z.G.; methodology, X.Y., J.P. and Z.G.; software, X.Y.; validation, X.Y., H.W. and F.D.; formal analysis, X.Y.; investigation, X.Y., H.W., F.D. and J.Z.; resources, J.P., Z.G., X.L. and L.G.; data curation, X.Y.; writing—original draft preparation, X.Y.; writing—review and editing, J.P., Z.G., X.L. and L.G.; visualization, X.Y.; supervision, Z.G. and F.D.; project administration, Z.G. and F.D.; funding acquisition, Z.G. and F.D. All authors have read and agreed to the published version of the manuscript.
Funding
This research was funded by the Henan Province 2025 Integrated Pilot Project for Agricultural Machinery Research, Development, Manufacturing, Promotion, and Application, grant number HNYTH2025-01, and the 2026 Institutional Scientific Research Project of Luoyang Polytechnic, grant number 2026B09.
Data Availability Statement
The model configuration files, code, training parameters, and dataset-splitting description are available from the corresponding author upon reasonable request. The raw field images and complete annotation files are not publicly available at this stage because they contain field-site information and are subject to data-ownership and ongoing project data-management considerations. A limited anonymized subset and the materials necessary for editorial or peer-review verification can be provided upon reasonable request, subject to applicable permissions and data-management restrictions.
Conflicts of Interest
The authors declare no conflicts of interest.
References
- Zhao, H.; Feng, Y.-L.; Wang, M.; Wang, J.-J.; Liu, T.; Yu, J. The Angelica dahurica: A Review of Traditional Uses, Phytochemistry and Pharmacology. Front. Pharmacol. 2022, 13, 896637. [Google Scholar] [CrossRef] [Scilit] [PubMed]
- Wang, Q.; Li, Y.; Wang, S.; Xiang, Z.; Dong, W.; Li, X.; Wei, Y.; Gao, P.; Dai, L. A Review of the Historical Records, Chemistry, Pharmacology, Pharmacokinetics and Edibility of Angelica dahurica. Arab. J. Chem. 2023, 16, 104877. [Google Scholar] [CrossRef] [Scilit]
- Li, X.; Chen, Y.; Lai, Y.; Yang, Q.; Hu, H.; Wang, Y. Sustainable Utilization of Traditional Chinese Medicine Resources: Systematic Evaluation on Different Production Modes. Evid.-Based Complement. Altern. Med. 2015, 2015, 218901. [Google Scholar] [CrossRef] [Scilit] [PubMed]
- Aćimović, M.; Navarro Rocha, J.; Bratovčić, A.; Vieweger, A. Weed Management in Medicinal and Aromatic Plants: Current Strategies and Future Perspectives—A Narrative Review. Agronomy 2026, 16, 901. [Google Scholar] [CrossRef] [Scilit]
- Zhang, W.; Miao, Z.; Li, N.; He, C.; Sun, T. Review of Current Robotic Approaches for Precision Weed Management. Curr. Robot. Rep. 2022, 3, 139–151. [Google Scholar] [CrossRef] [Scilit] [PubMed]
- Upadhyay, A.; Zhang, Y.; Koparan, C.; Rai, N.; Howatt, K.; Bajwa, S.; Sun, X. Advances in Ground Robotic Technologies for Site-Specific Weed Management in Precision Agriculture: A Review. Comput. Electron. Agric. 2024, 225, 109363. [Google Scholar] [CrossRef] [Scilit]
- Shamshiri, R.R.; Kaviani Rad, A.; Behjati, M.; Balasundram, S.K. Sensing and Perception in Robotic Weeding: Innovations and Limitations for Digital Agriculture. Sensors 2024, 24, 6743. [Google Scholar] [CrossRef] [Scilit] [PubMed]
- Qu, H.-R.; Su, W.-H. Deep Learning-Based Weed-Crop Recognition for Smart Agricultural Equipment: A Review. Agronomy 2024, 14, 363. [Google Scholar] [CrossRef] [Scilit]
- Hu, K.; Wang, Z.; Coleman, G.; Bender, A.; Yao, T.; Zeng, S.; Song, D.; Schumann, A.; Walsh, M. Deep Learning Techniques for In-Crop Weed Recognition in Large-Scale Grain Production Systems: A Review. Precis. Agric. 2024, 25, 1–29. [Google Scholar] [CrossRef] [Scilit]
- Hasan, A.S.M.M.; Sohel, F.; Diepeveen, D.; Laga, H.; Jones, M.G.K. A Survey of Deep Learning Techniques for Weed Detection from Images. Comput. Electron. Agric. 2021, 184, 106067. [Google Scholar] [CrossRef] [Scilit]
- Ren, S.; He, K.; Girshick, R.; Sun, J. Faster R-CNN: Towards Real-Time Object Detection with Region Proposal Networks. In Proceedings of the Advances in Neural Information Processing Systems 28, Montreal, QC, Canada, 7–12 December 2015; pp. 91–99. Available online: https://proceedings.neurips.cc/paper/2015/hash/14bfa6bb14875e45bba028a21ed38046-Abstract.html (accessed on 10 July 2026).
- Liu, W.; Anguelov, D.; Erhan, D.; Szegedy, C.; Reed, S.; Fu, C.-Y.; Berg, A.C. SSD: Single Shot MultiBox Detector. In Proceedings of the European Conference on Computer Vision, Amsterdam, The Netherlands, 11–14 October 2016; pp. 21–37. [Google Scholar] [CrossRef] [Scilit]
- Lin, T.-Y.; Goyal, P.; Girshick, R.; He, K.; Dollár, P. Focal Loss for Dense Object Detection. In Proceedings of the IEEE International Conference on Computer Vision, Venice, Italy, 22–29 October 2017; pp. 2980–2988. [Google Scholar] [CrossRef] [Scilit]
- Tan, M.; Pang, R.; Le, Q.V. EfficientDet: Scalable and Efficient Object Detection. In Proceedings of the IEEE/CVF Conference on Computer Vision and Pattern Recognition, Seattle, WA, USA, 13–19 June 2020; pp. 10781–10790. [Google Scholar] [CrossRef] [Scilit]
- Redmon, J.; Divvala, S.; Girshick, R.; Farhadi, A. You Only Look Once: Unified, Real-Time Object Detection. In Proceedings of the IEEE Conference on Computer Vision and Pattern Recognition, Las Vegas, NV, USA, 27–30 June 2016; pp. 779–788. [Google Scholar] [CrossRef] [Scilit]
- Olsen, A.; Konovalov, D.A.; Philippa, B.; Ridd, P.; Wood, J.C.; Johns, J.; Banks, W.; Girgenti, B.; Kenny, O.; Whinney, J.; et al. DeepWeeds: A Multiclass Weed Species Image Dataset for Deep Learning. Sci. Rep. 2019, 9, 2058. [Google Scholar] [CrossRef] [Scilit] [PubMed]
- Saleem, M.H.; Velayudhan, K.K.; Potgieter, J.; Arif, K.M. Weed Identification by Single-Stage and Two-Stage Neural Networks: A Study on the Impact of Image Resizers and Weights Optimization Algorithms. Front. Plant Sci. 2022, 13, 850666. [Google Scholar] [CrossRef] [Scilit] [PubMed]
- Saleem, M.H.; Potgieter, J.; Arif, K.M. Weed Detection by Faster RCNN Model: An Enhanced Anchor Box Approach. Agronomy 2022, 12, 1580. [Google Scholar] [CrossRef] [Scilit]
- Liu, S.; Jin, Y.; Ruan, Z.; Ma, Z.; Gao, R.; Su, Z. Real-Time Detection of Seedling Maize Weeds in Sustainable Agriculture. Sustainability 2022, 14, 15088. [Google Scholar] [CrossRef] [Scilit]
- Wang, C.-Y.; Bochkovskiy, A.; Liao, H.-Y.M. YOLOv7: Trainable Bag-of-Freebies Sets New State-of-the-Art for Real-Time Object Detectors. In Proceedings of the IEEE/CVF Conference on Computer Vision and Pattern Recognition, Vancouver, BC, Canada, 17–24 June 2023; pp. 7464–7475. [Google Scholar] [CrossRef] [Scilit]
- Bochkovskiy, A.; Wang, C.-Y.; Liao, H.-Y.M. YOLOv4: Optimal Speed and Accuracy of Object Detection. arXiv 2020, arXiv:2004.10934. [Google Scholar]
- Chen, X.; Wu, C.; Dang, P.; Zhang, E.; Chen, Y.; Tang, C.; Qi, L. Recognizing Weed in Rice Field Using ViT-Improved YOLOv7. Trans. Chin. Soc. Agric. Eng. 2024, 40, 185–193. [Google Scholar] [CrossRef]
- Xu, Y.; Liu, Z.; Li, J.; Huang, D.; Chen, Y.; Zhou, Y. Real-Time Detection and Localization of Weeds in Dictamnus dasycarpus Fields for Laser-Based Weeding Control. Agronomy 2024, 14, 2363. [Google Scholar] [CrossRef] [Scilit]
- Liu, Y.; Zeng, F.; Diao, H.; Zhu, J.; Ji, D.; Liao, X.; Zhao, Z. YOLOv8 Model for Weed Detection in Wheat Fields Based on a Visual Converter and Multi-Scale Feature Fusion. Sensors 2024, 24, 4379. [Google Scholar] [CrossRef] [Scilit] [PubMed]
- Tao, T.; Wei, X. STBNA-YOLOv5: An Improved YOLOv5 Network for Weed Detection in Rapeseed Field. Agriculture 2025, 15, 22. [Google Scholar] [CrossRef] [Scilit]
- Zheng, L.; Yi, J.; He, P.; Tie, J.; Zhang, Y.; Wu, W.; Long, L. Improvement of the YOLOv8 Model in the Optimization of the Weed Recognition Algorithm in Cotton Field. Plants 2024, 13, 1843. [Google Scholar] [CrossRef] [Scilit] [PubMed]
- Huang, J.; Xia, X.; Diao, Z.; Li, X.; Zhao, S.; Zhang, J.; Zhang, B.; Li, G. A Lightweight Model for Weed Detection Based on the Improved YOLOv8s Network in Maize Fields. Agronomy 2024, 14, 3062. [Google Scholar] [CrossRef] [Scilit]
- Peng, G.; Wang, K.; Ma, J.; Cui, B.; Wang, D. AGRI-YOLO: A Lightweight Model for Corn Weed Detection with Enhanced YOLO v11n. Agriculture 2025, 15, 1971. [Google Scholar] [CrossRef] [Scilit]
- Wang, X.; Wang, Q.; Qiao, Y.; Zhang, X.; Lu, C.; Wang, C. Precision Weed Management for Straw-Mulched Maize Field: Advanced Weed Detection and Targeted Spraying Based on Enhanced YOLO v5s. Agriculture 2024, 14, 2134. [Google Scholar] [CrossRef] [Scilit]
- Islam, M.D.; Liu, W.; Izere, P.; Singh, P.; Yu, C.; Riggan, B.; Zhang, K.; Jhala, A.J.; Knezevic, S.; Ge, Y.; et al. Towards Real-Time Weed Detection and Segmentation with Lightweight CNN Models on Edge Devices. Comput. Electron. Agric. 2025, 237, 110600. [Google Scholar] [CrossRef] [Scilit]
- Rai, N.; Zhang, Y.; Villamil, M.; Howatt, K.; Ostlie, M.; Sun, X. Agricultural Weed Identification in Images and Videos by Integrating Optimized Deep Learning Architecture on an Edge Computing Technology. Comput. Electron. Agric. 2024, 216, 108442. [Google Scholar] [CrossRef] [Scilit]
- Arthur, L.; Mahnan, S.; He, L.; Hussain, M.; Heinemann, P.; Brunharo, C. YOLOv7-CBAM and DeepSORT with Pixel Grid Analysis for Real-Time Weed Localization and Intra-Row Density Estimation in Apple Orchards. Comput. Electron. Agric. 2026, 239, 111071. [Google Scholar] [CrossRef] [Scilit]
- Shorten, C.; Khoshgoftaar, T.M. A Survey on Image Data Augmentation for Deep Learning. J. Big Data 2019, 6, 60. [Google Scholar] [CrossRef] [Scilit]
- Howard, A.; Sandler, M.; Chu, G.; Chen, L.-C.; Chen, B.; Tan, M.; Wang, W.; Zhu, Y.; Pang, R.; Vasudevan, V.; et al. Searching for MobileNetV3. In Proceedings of the IEEE/CVF International Conference on Computer Vision, Seoul, Republic of Korea, 27 October–2 November 2019; pp. 1314–1324. [Google Scholar] [CrossRef] [Scilit]
- Yang, L.; Zhang, R.-Y.; Li, L.; Xie, X. SimAM: A Simple, Parameter-Free Attention Module for Convolutional Neural Networks. In Proceedings of the 38th International Conference on Machine Learning, Virtual, 18–24 July 2021; PMLR: Cambridge, MA, USA, 2021; Volume 139, pp. 11863–11874. Available online: https://proceedings.mlr.press/v139/yang21o.html (accessed on 12 July 2026).
- Zhang, Y.-F.; Ren, W.; Zhang, Z.; Jia, Z.; Wang, L.; Tan, T. Focal and Efficient IOU Loss for Accurate Bounding Box Regression. Neurocomputing 2022, 506, 146–157. [Google Scholar] [CrossRef] [Scilit]
- Zhang, H.; Xu, C.; Zhang, S. Inner-IoU: More Effective Intersection over Union Loss with Auxiliary Bounding Box. arXiv 2023, arXiv:2311.02877. [Google Scholar]
- Lin, T.-Y.; Maire, M.; Belongie, S.; Hays, J.; Perona, P.; Ramanan, D.; Dollár, P.; Zitnick, C.L. Microsoft COCO: Common Objects in Context. In Proceedings of the European Conference on Computer Vision, Zurich, Switzerland, 6–12 September 2014; pp. 740–755. [Google Scholar] [CrossRef] [Scilit]
- Selvaraju, R.R.; Cogswell, M.; Das, A.; Vedantam, R.; Parikh, D.; Batra, D. Grad-CAM: Visual Explanations from Deep Networks via Gradient-Based Localization. In Proceedings of the IEEE International Conference on Computer Vision, Venice, Italy, 22–29 October 2017; pp. 618–626. [Google Scholar] [CrossRef] [Scilit]
- NVIDIA. Jetson Orin Nano Developer Kit User Guide: Hardware Layout. Available online: https://developer.nvidia.com/embedded/learn/jetson-orin-nano-devkit-user-guide/hardware_spec.html (accessed on 5 June 2026).
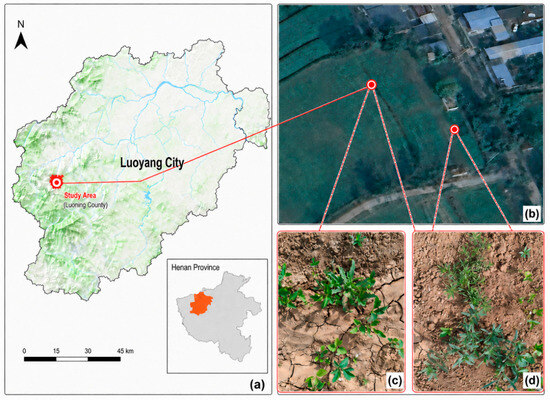
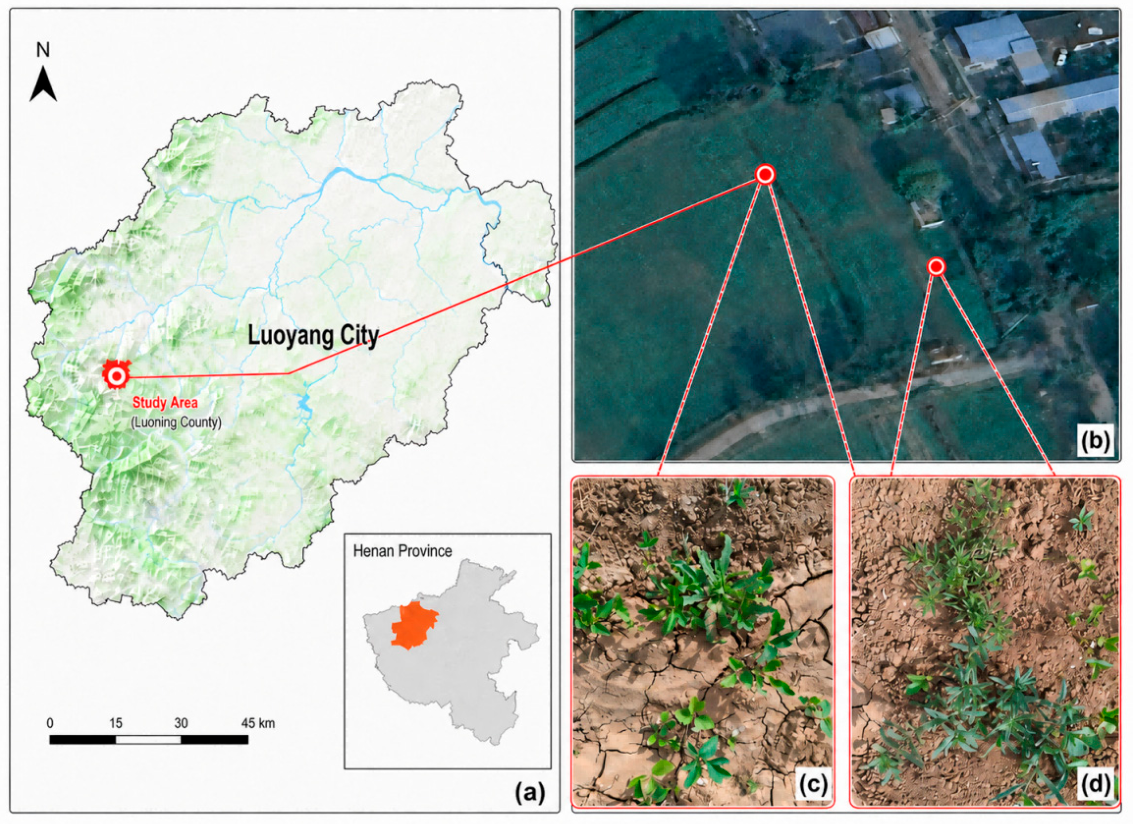
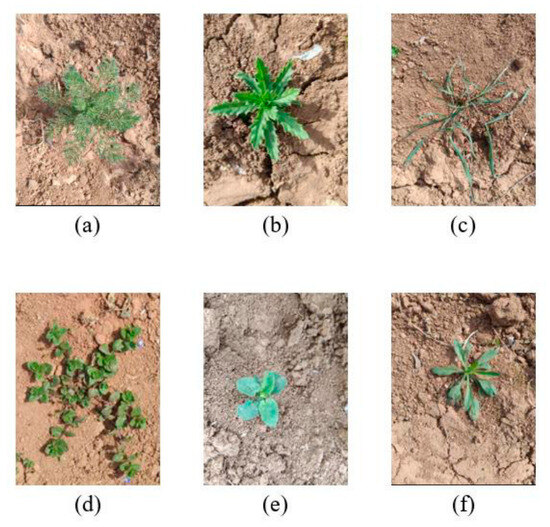
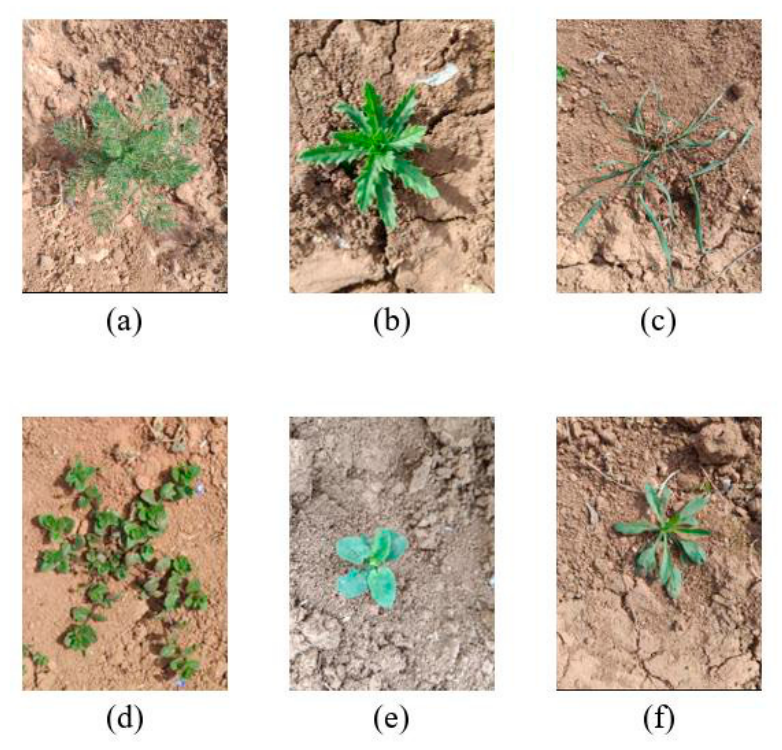
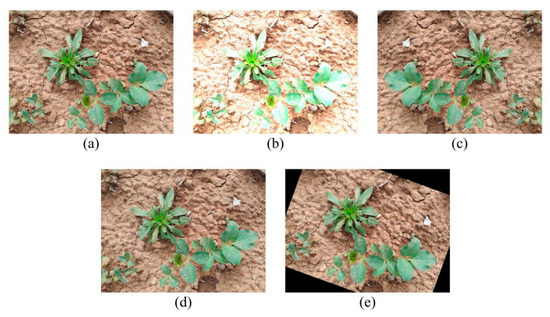
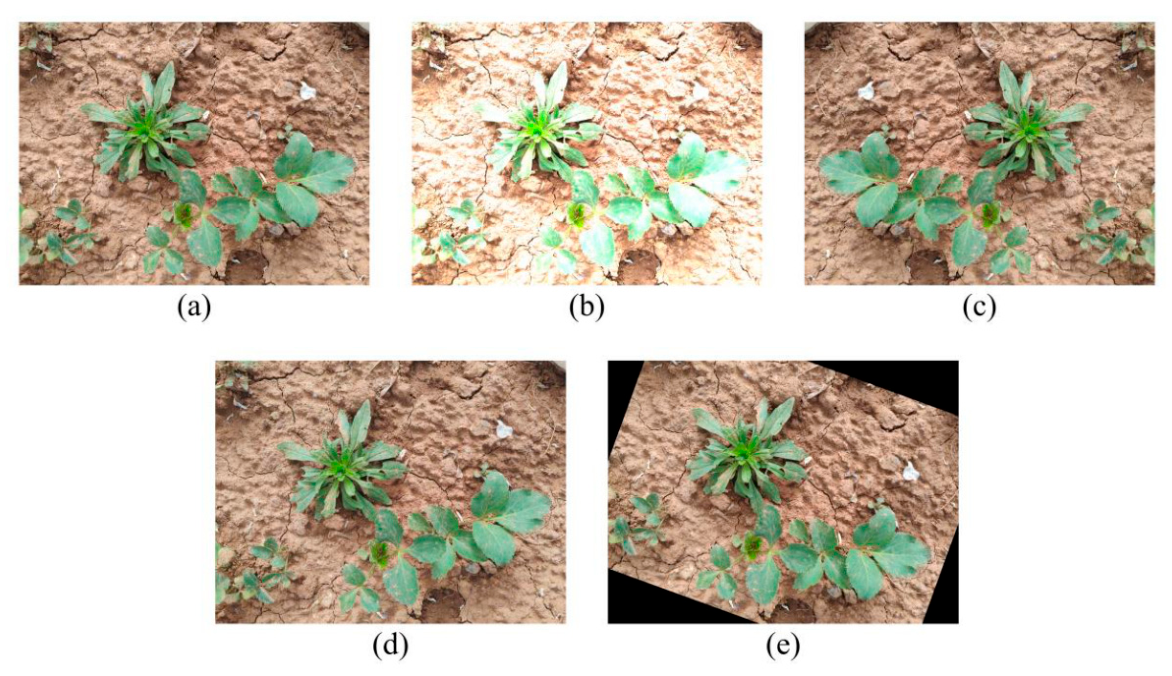
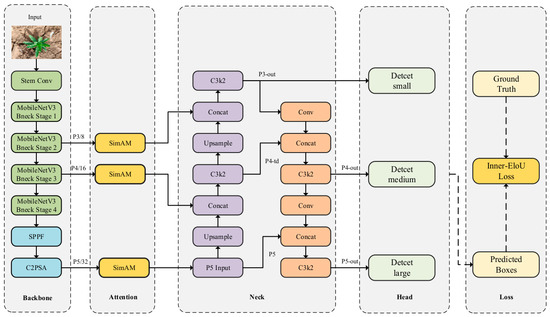
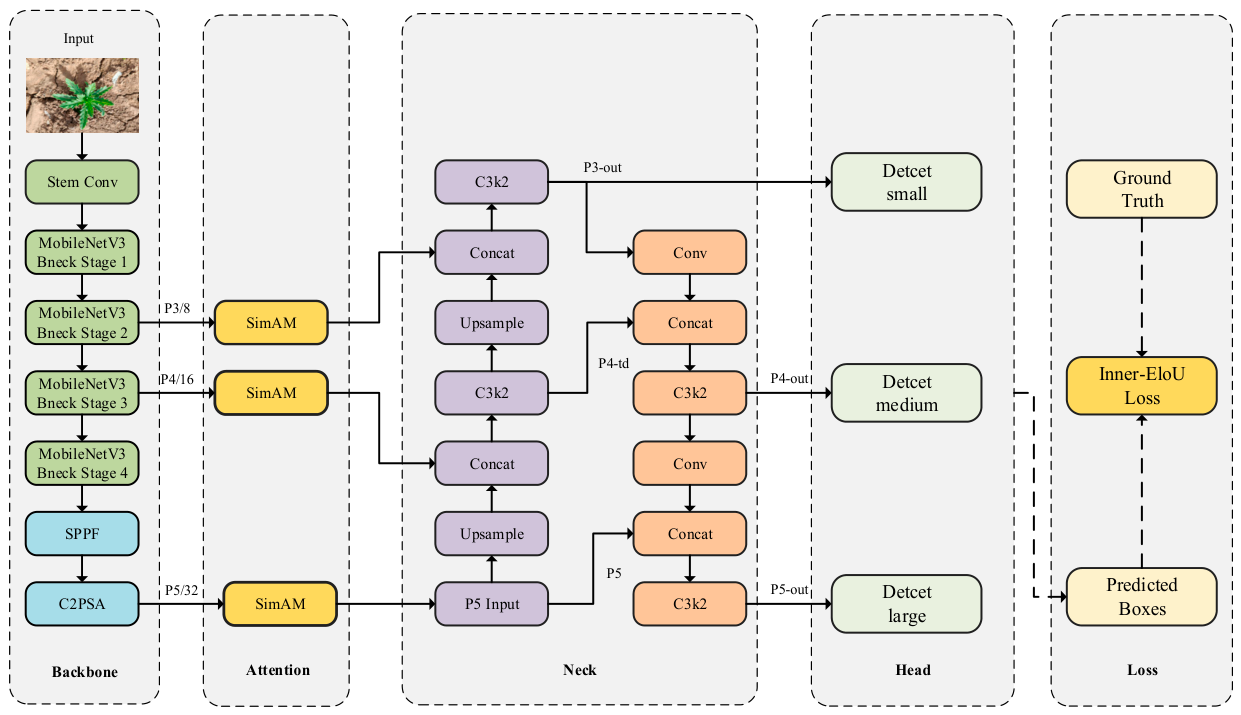
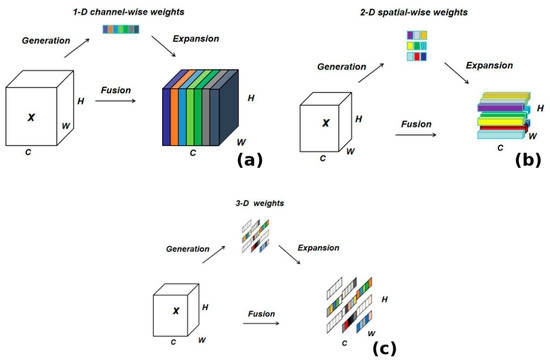
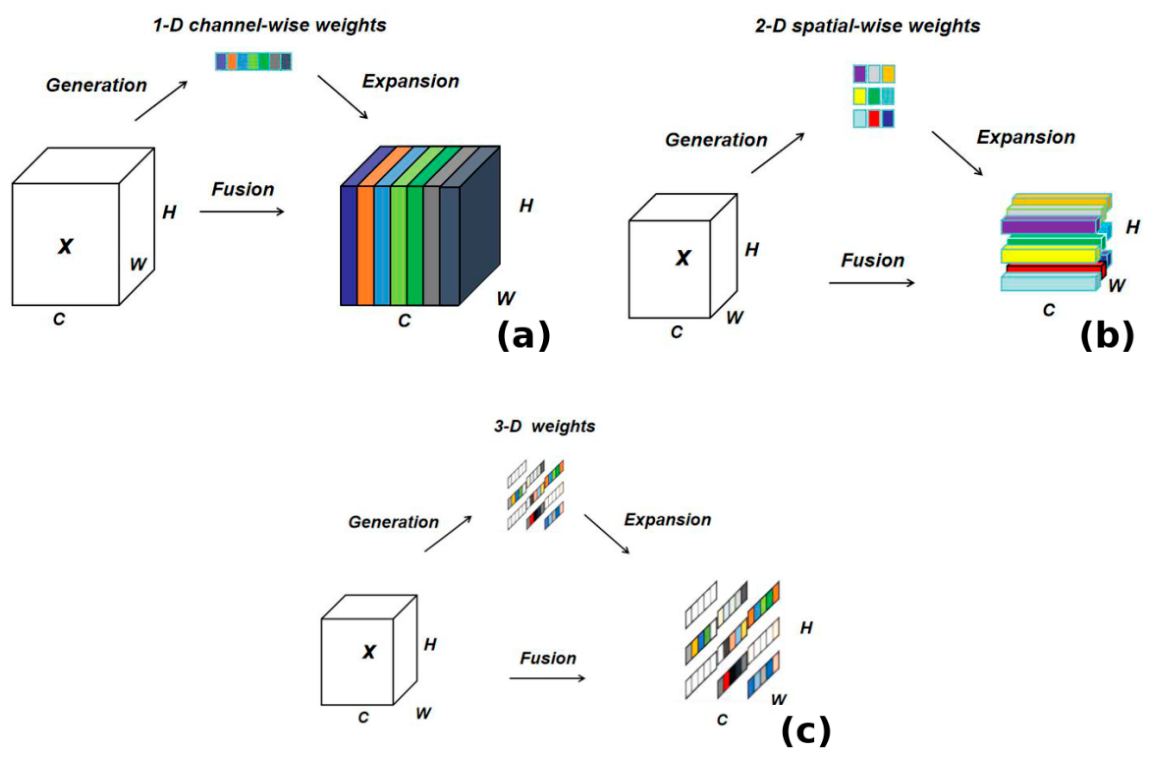
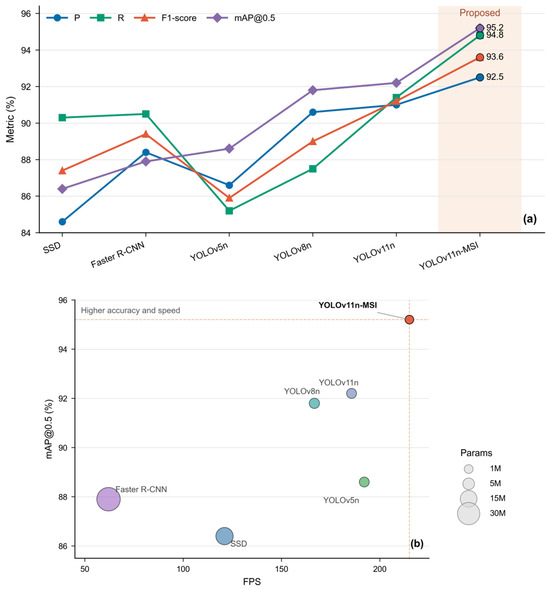
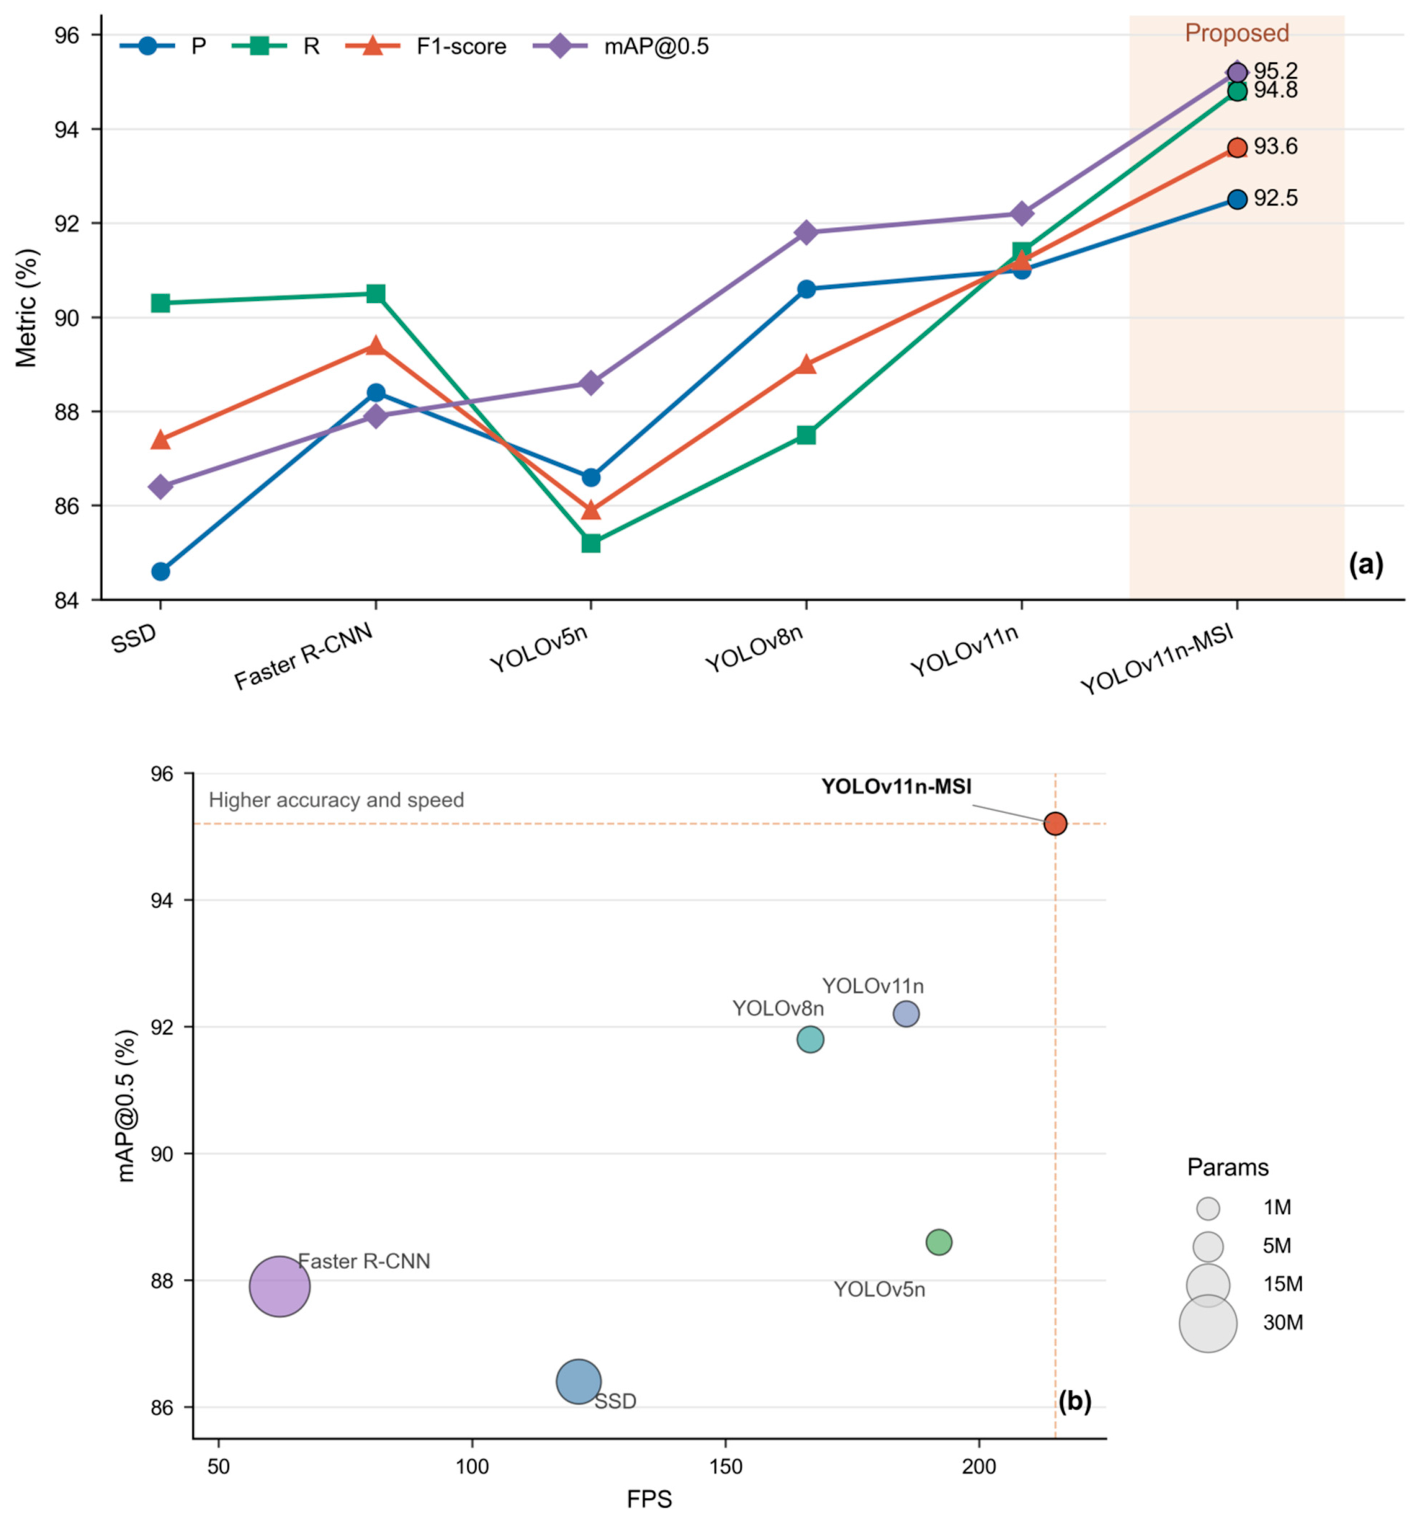
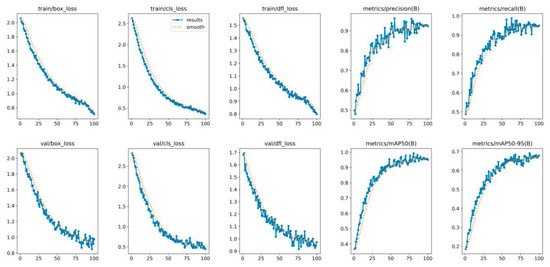
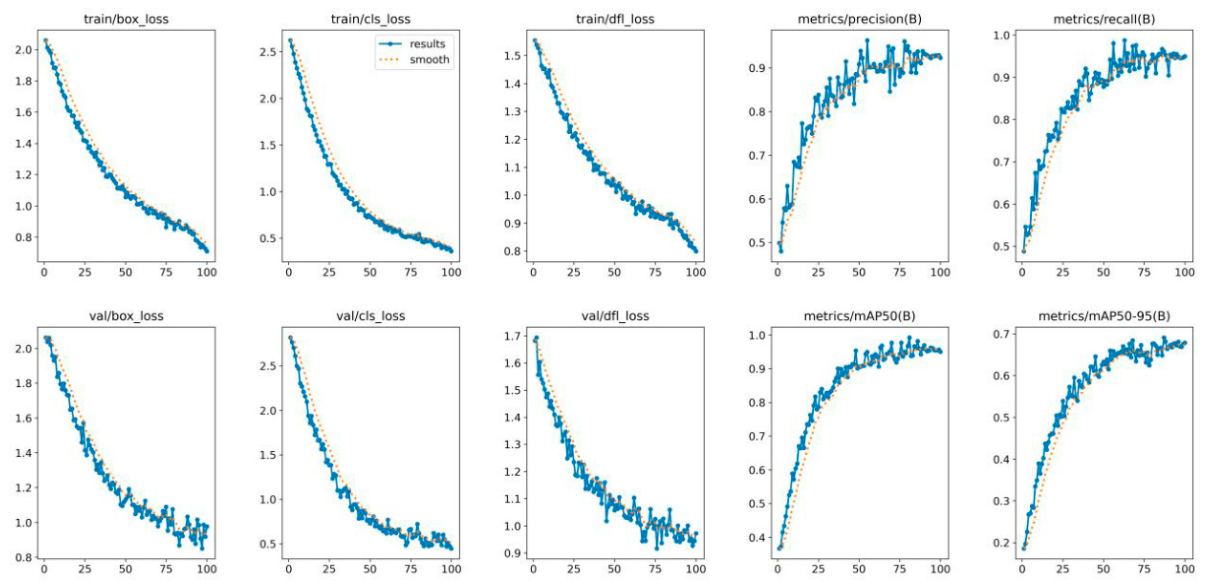
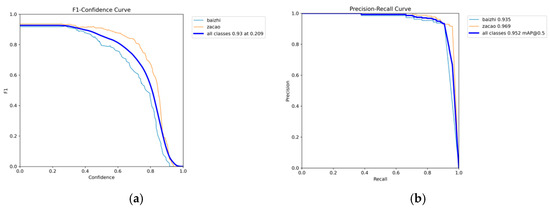
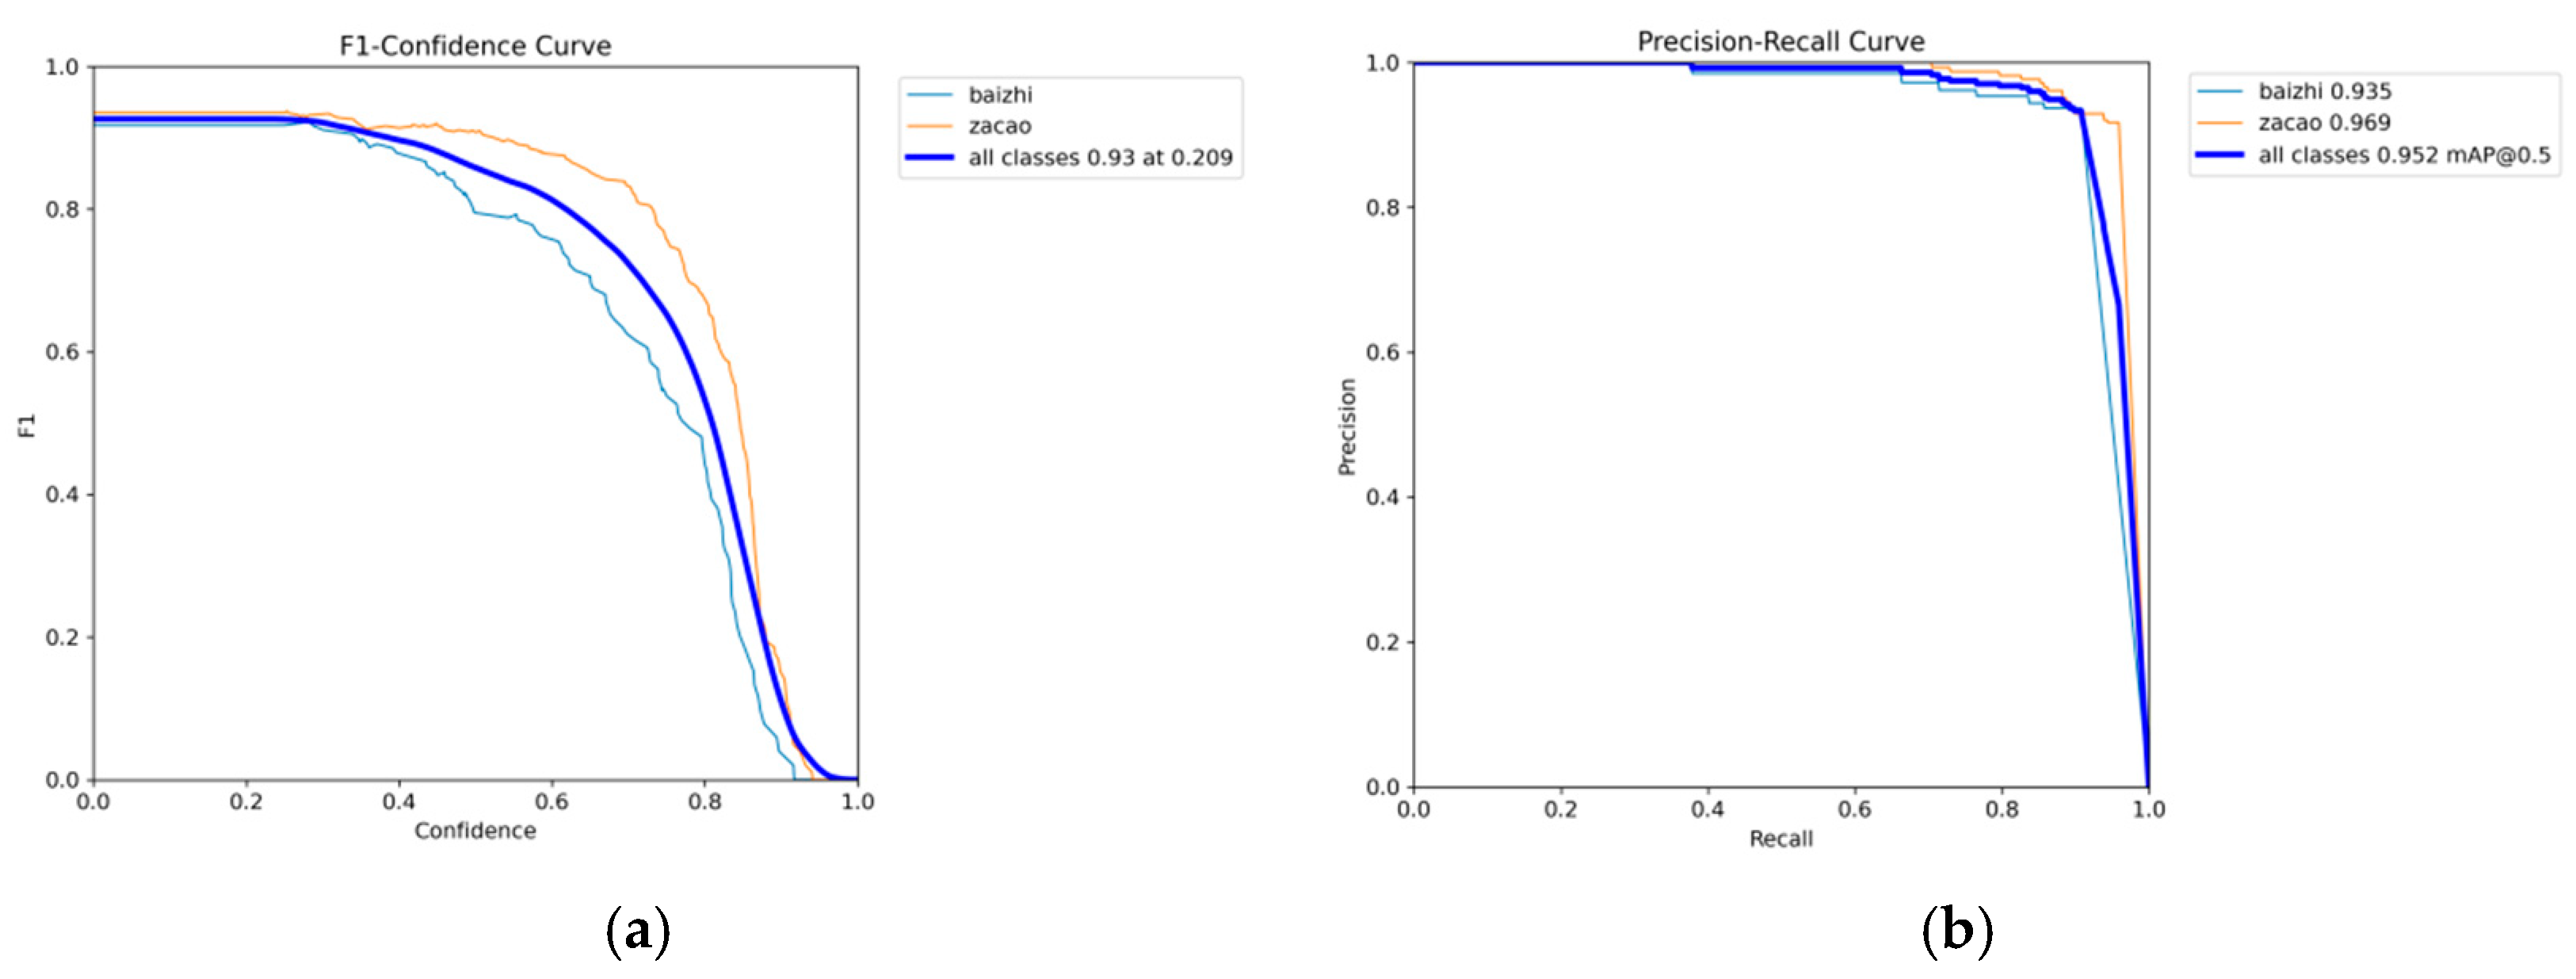
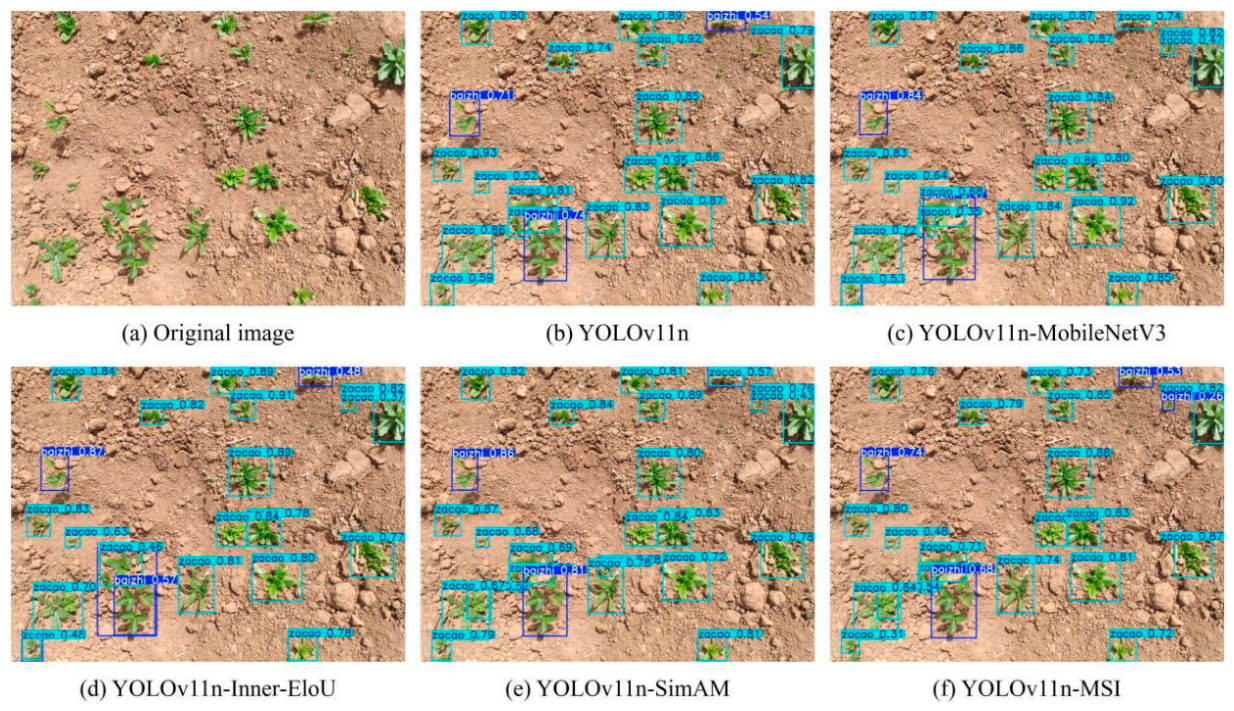
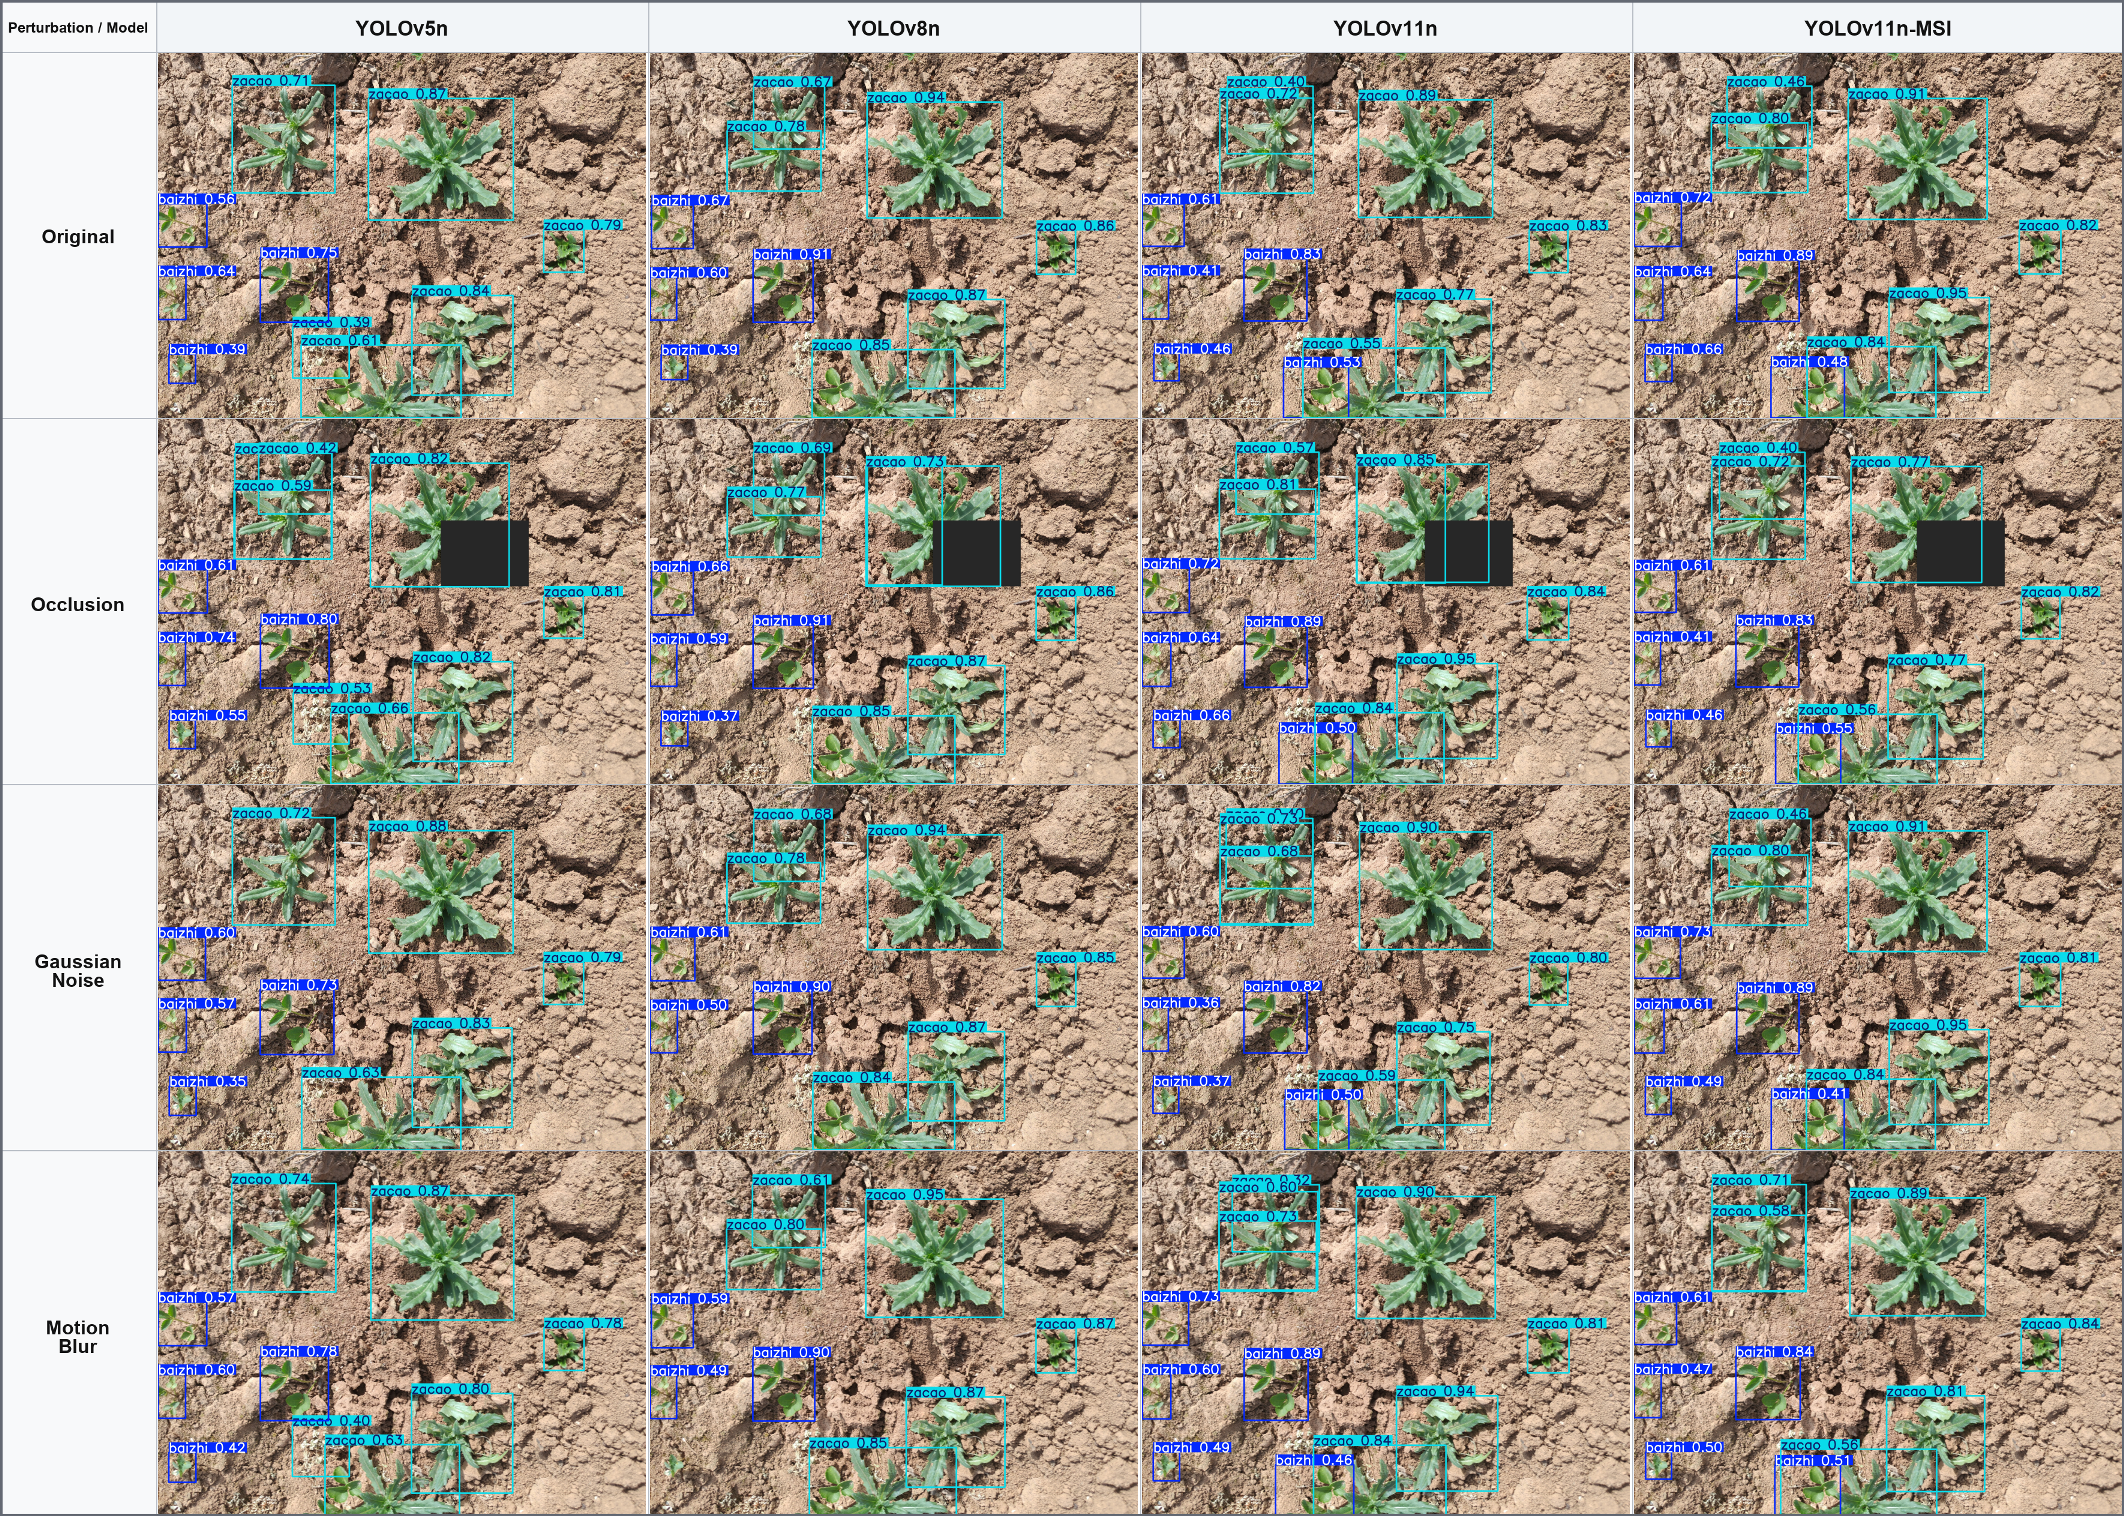
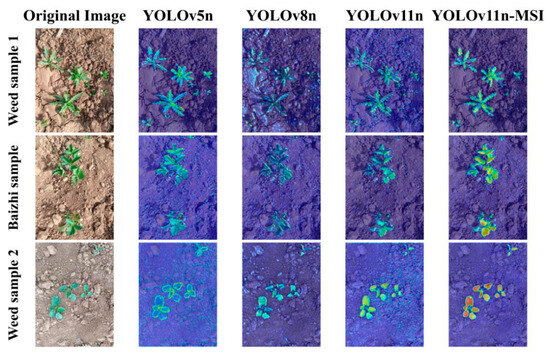
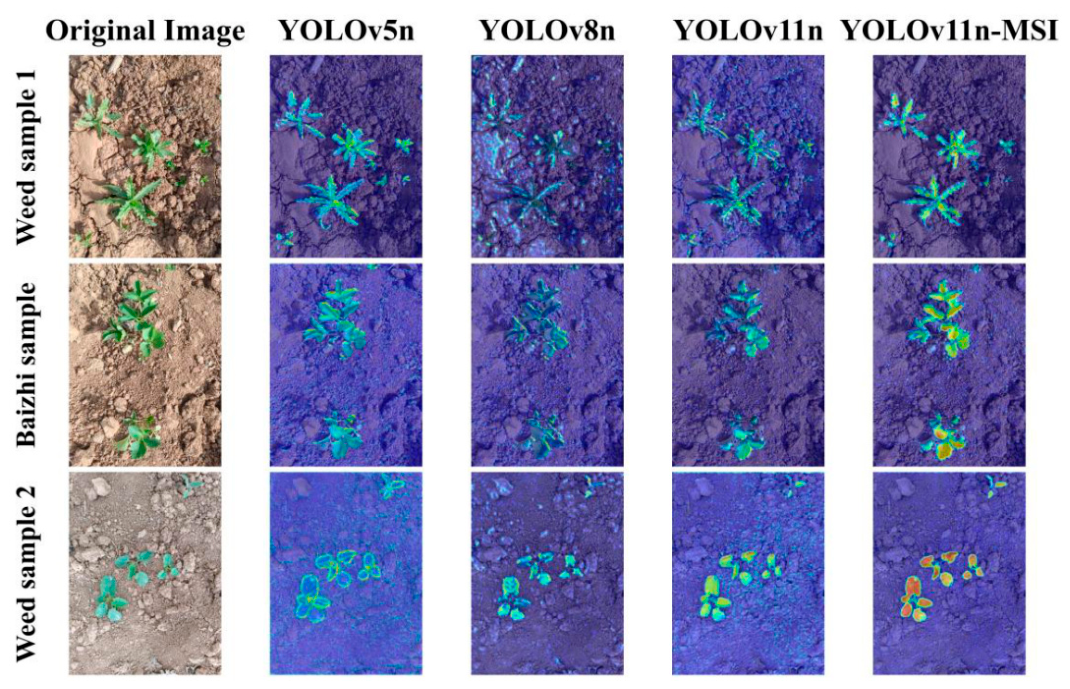
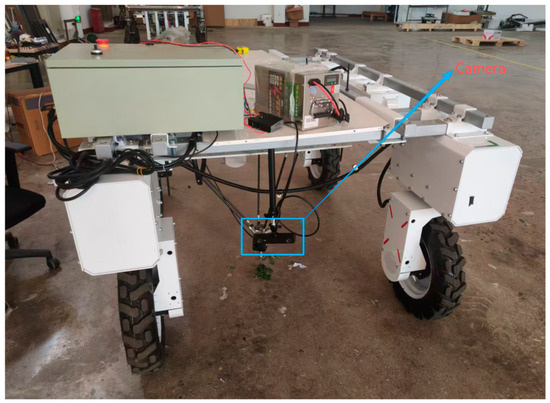
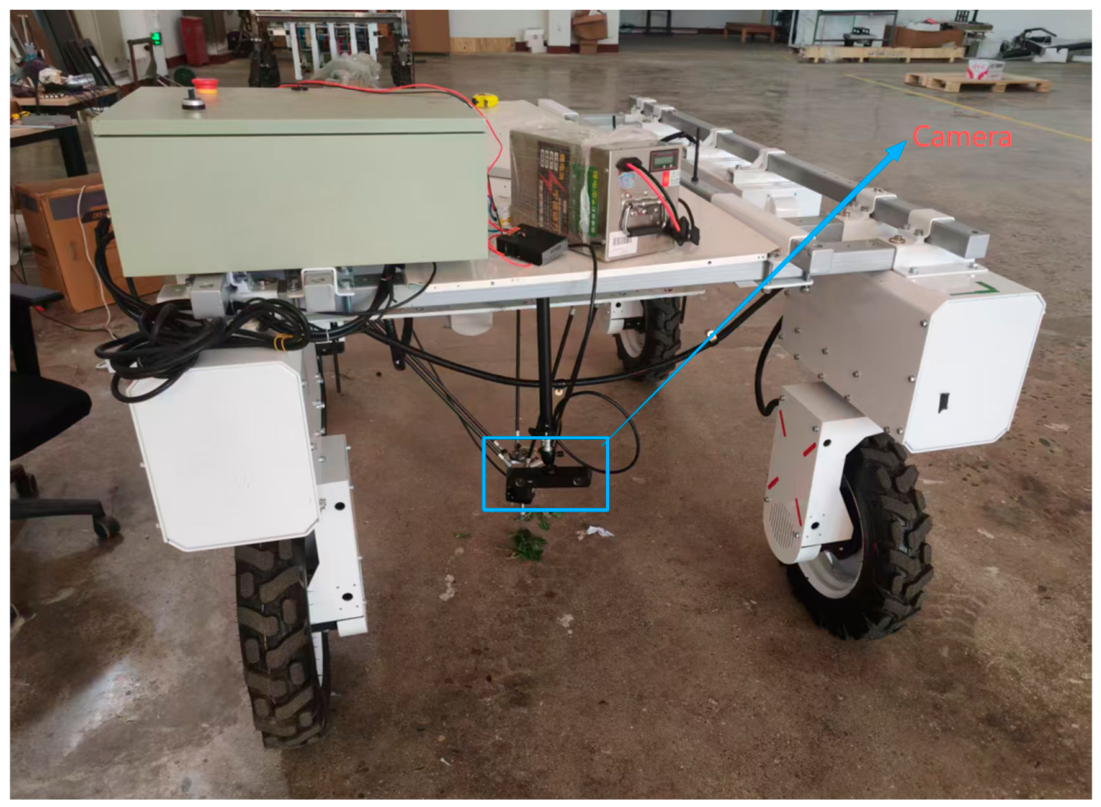

Disclaimer/Publisher’s Note: The statements, opinions and data contained in all publications are solely those of the individual author(s) and contributor(s) and not of MDPI and/or the editor(s). MDPI and/or the editor(s) disclaim responsibility for any injury to people or property resulting from any ideas, methods, instructions or products referred to in the content. |
© 2026 by the authors. Licensee MDPI, Basel, Switzerland. This article is an open access article distributed under the terms and conditions of the Creative Commons Attribution (CC BY) license.