


Abstract
Quality inspection of imported saw-ginned cotton mainly involves the determination of color grade and impurity grade. Traditional manual grading and High Volume Instrument (HVI) testing are limited by subjectivity, insufficient accuracy, single-indicator measurement, and long inspection cycles. To address these limitations, this study developed a machine vision-based intelligent identification system for saw-ginned cotton quality grading. The system integrates a portable image acquisition box, a cloud-based intelligent recognition service, and a HarmonyOS-based mobile application. A total of 6363 saw-ginned cotton images were collected using the self-developed image acquisition device for model training and testing. Based on U-Net background segmentation, a dual-branch parallel recognition framework was established for cotton color grading and impurity grading. The CA-ResNet50 model, integrating ResNet50, the Efficient Channel Attention (ECA) mechanism, and the AdamW optimization strategy, was constructed for cotton color grade recognition. The AD-UNet model, incorporating Atrous Spatial Pyramid Pooling (ASPP)-based multi-scale contextual modeling and the DySample adaptive upsampling mechanism, was developed for impurity segmentation. In addition, the HarmonyOS-based mobile application supports information query, image acquisition, intelligent recognition, and data traceability. Experimental results showed that the CA-ResNet50 color grading model achieved an F1-Score of 94.8%. Based on the AD-UNet impurity segmentation results and the calculated impurity area ratio, the accuracy of impurity grade determination reached 97.3%. The average cloud-based inference time for a single image was approximately 0.8 s, and the complete workflow, including sample flattening, image acquisition, and recognition, required approximately 10 min. The proposed system improves the accuracy, efficiency, objectivity, and traceability of saw-ginned cotton quality identification, providing technical support for rapid inspection and quality supervision of imported cotton.
1. Introduction
China is a major producer and importer of cotton. According to statistics released by the General Administration of Customs, China imported approximately 1.07 million tons of cotton in 2025, of which saw-ginned upland cotton accounted for more than 80% [1]. The quality inspection of imported cotton plays an increasingly important role in safeguarding fair trade and protecting the legitimate interests of domestic consignees. In the inspection of imported cotton, color grade and impurity grade are important indicators of cotton quality and directly affect quality evaluation and market pricing. According to GB 1103.1—2023, *Cotton—Part 1: Saw-Ginned Upland Cotton* [2], cotton quality inspection includes color grade determination, impurity content evaluation, and other related indicators. At present, cotton color grade detection is mainly conducted using manual sensory grading and High Volume Instrument (HVI) testing. The former depends on inspectors’ experience, whereas the latter determines color grade by measuring cotton reflectance (Rd) and yellowness (+b) and matching these values with the Hunter Lab color grade chart [3,4]. Impurity detection mainly relies on manual picking or visual judgment, and cotton quality is evaluated according to the amount of non-fibrous components and impurity content in cotton samples [5,6]. These traditional methods are limited by subjectivity, susceptibility to environmental variations, and long inspection cycles, making it difficult to meet the strict requirements of port quality inspection [7,8].
Computer vision-based detection provides important technical support for the intelligent development of cotton quality inspection and has been widely applied in studies on cotton color grading and impurity recognition [9,10]. Existing studies mainly focus on laboratory cotton color grading, impurity recognition in machine-harvested seed cotton, and foreign fiber detection during processing. In laboratory or standard cotton sample color grading scenarios, researchers have improved color grade discrimination mainly through chromaticity feature modeling, traditional machine learning, and deep neural network optimization. For example, Wu et al. [11] addressed the fine-grained classification problem in cotton color grading, where intra-class variations are large and inter-class differences are subtle, by introducing collaborative and erasing dual-attention mechanisms to enhance fine-grained feature representation. To achieve color grading of Egyptian cotton lint, Fisher et al. [12] extracted different features from unclean and clean cotton lint images and generated four image processing schemes for cotton lint grading. By combining these schemes with artificial neural network (ANN), random forest, and support vector machine (SVM) classifiers, they compared their classification performance, among which the random forest classifier achieved the highest accuracy of 82.13–90.21%. Li et al. [13] constructed a cotton color grade prediction model based on a Back Propagation (BP) neural network using cotton fiber brightness and yellowness as input variables, with an average relative error of 3.203% between predicted and measured values. Wang et al. [14] introduced multi-scale feature fusion and the CBAM attention mechanism into MobileNetV2 to address the subtle color differences between cotton grades, achieving a classification accuracy of 92.10% for five grades of white cotton.
In the scenarios of impurity detection in machine-harvested seed cotton and cotton processing, existing studies mainly focus on the classification of impurities such as cotton shells, cotton branches, broken leaves, plastic film, and foreign fibers. Zhang et al. [15] addressed the scale variation of impurity components in machine-harvested seed cotton by using filtering windows of different sizes for image filtering and sharpening, followed by the extraction of color and shape features from large and small impurities, achieving an average impurity recognition accuracy of 89%. Li [16] proposed an impurity classification and recognition method for machine-harvested seed cotton by combining an improved Canny operator with an improved YOLOv4 model. A mathematical model for impurity rate statistics based on the V-W model was also established, and the average error of impurity rate estimation for four impurity types, including cotton shells, cotton branches, weeds, and leaf fragments, was approximately 4.1%. For the intelligent detection of foreign fibers in seed cotton, Q. Li et al. [17] constructed the Cotton-YOLO model by enhancing the YOLOv7 backbone and YOLO head through the integration of the ConvNeXt module and the Swin-Transformer module, achieving an mAP50 of 95.75% for foreign fiber detection. Zhao et al. [18] addressed the difficulty of distinguishing white or transparent foreign fibers using conventional imaging by selecting optimal feature bands through principal component analysis and proposing a recognition method integrating hyperspectral imaging with PCA-AlexNet, achieving an average recognition accuracy of 95.2%.
Overall, the above studies mainly focus on cotton color classification, impurity classification, or foreign fiber detection. However, imported saw-ginned cotton presents lower inter-grade color separability and often contains tiny impurities. Studies on the simultaneous color grading of saw-ginned cotton and quantitative estimation of tiny impurity content remain limited. Cotton quality identification involves sample pretreatment, image acquisition, intelligent recognition, and data visualization. Therefore, the development of a portable and intelligent system is of practical significance for improving inspection efficiency.
To address the problems of insufficient accuracy, susceptibility to environmental variations, and long inspection cycles in imported saw-ginned cotton quality identification, this study proposes a machine vision-based intelligent identification system for saw-ginned cotton quality grading. The main contributions of this study are as follows: (1) The system integrates a portable image acquisition device, a cloud-based intelligent recognition service, and a HarmonyOS-based mobile application, realizing an integrated workflow of image acquisition, recognition, and visualization, thereby improving the efficiency of saw-ginned cotton quality identification. (2) A portable cotton image acquisition device was developed, and an imported saw-ginned cotton image dataset was constructed, providing data support for cotton quality identification under standardized imaging conditions. (3) A background-segmentation-based dual-branch parallel framework for saw-ginned cotton quality identification was constructed. A cotton color grading model based on ResNet50 and improved by incorporating the ECA channel attention mechanism and AdamW optimization strategy was proposed, and a saw-ginned cotton impurity segmentation model integrating ASPP-based multi-scale contextual modeling and the DySample adaptive upsampling mechanism was established, thereby improving the accuracy of saw-ginned cotton quality identification.
2. Materials and Methods
2.1. Framework of the Intelligent Cotton Quality Identification System
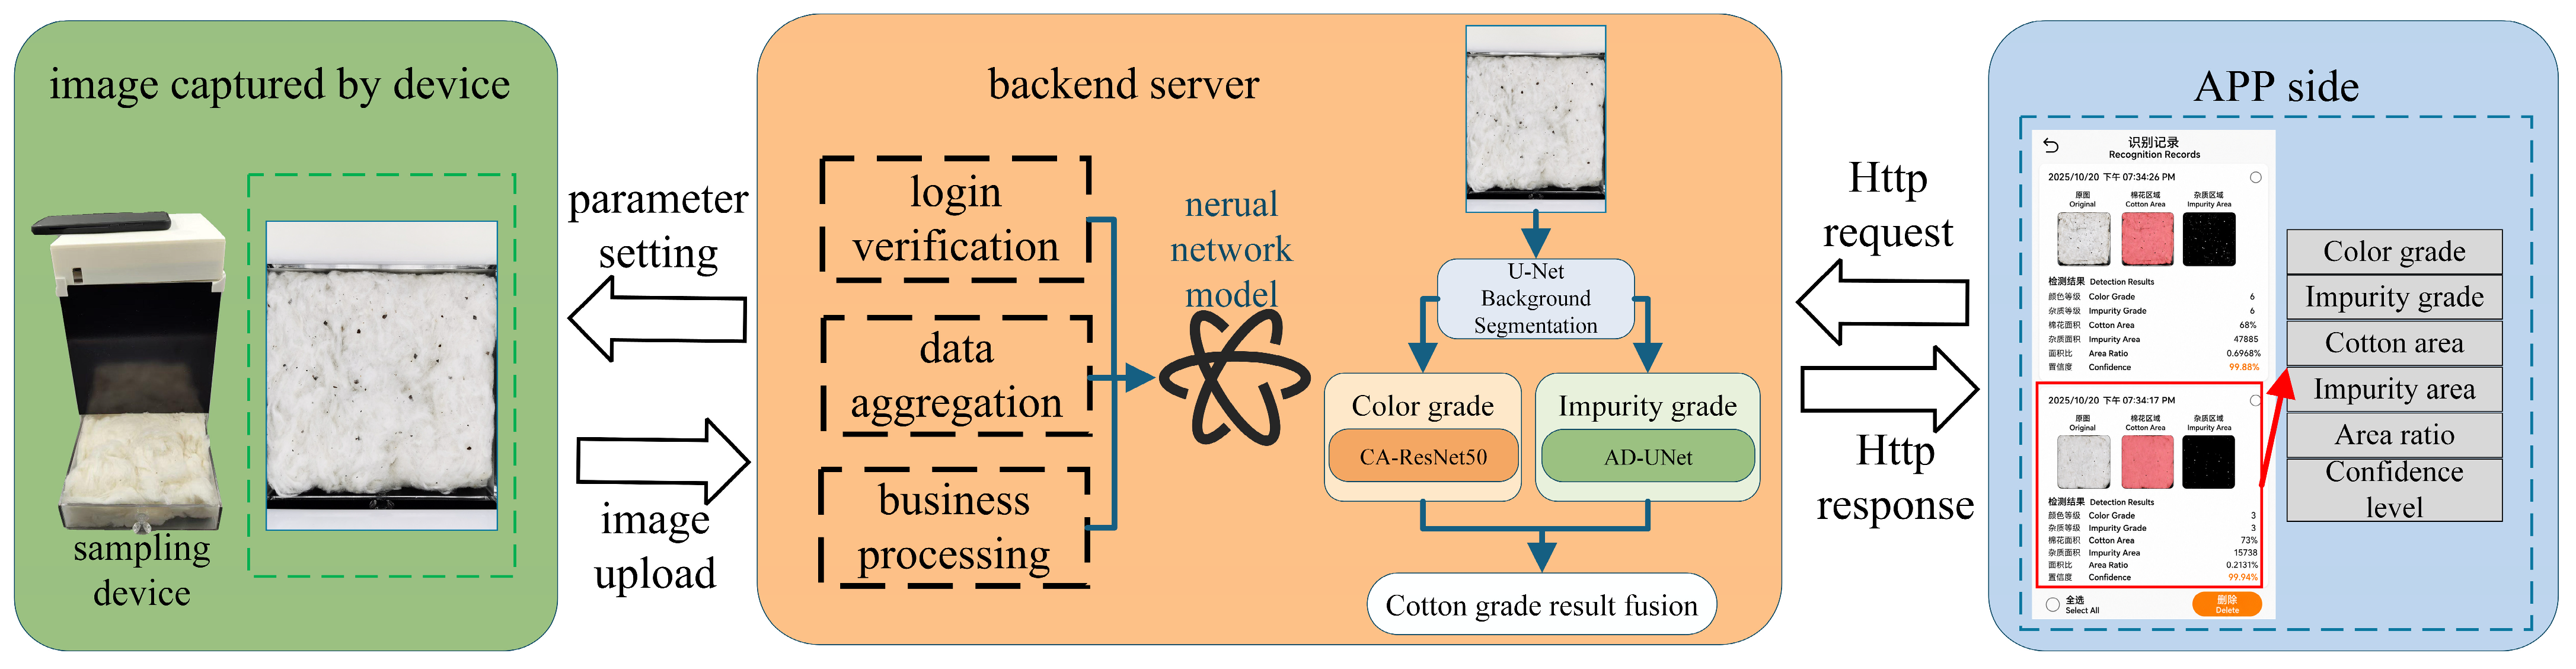
The proposed intelligent cotton grading system comprises three core components: an enclosed image acquisition box, a backend computing service, and a mobile application. The self-developed acquisition device adopts an enclosed box structure, which provides a stable and controllable illumination environment and ensures environmental consistency during image acquisition. Cotton sample images are captured via a mobile phone and uploaded to the backend server. After receiving the image data, the backend service invokes the cotton color grading model and impurity grading model to automatically conduct cotton quality analysis and generate grading results. These results are synchronized to the mobile application to realize the visual display of cotton grading indicators. The application can be directly installed on the mobile phone for image acquisition, which eliminates the reliance on large-scale laboratory testing equipment. The proposed system features flexible operation and high portability, and it meets the demands for rapid cotton quality identification and record management in diverse application scenarios. The overall framework of the system is illustrated in Figure 1.
Figure 1.
Framework of the intelligent cotton quality grading and identification system.
2.2. Cotton Image Acquisition Device
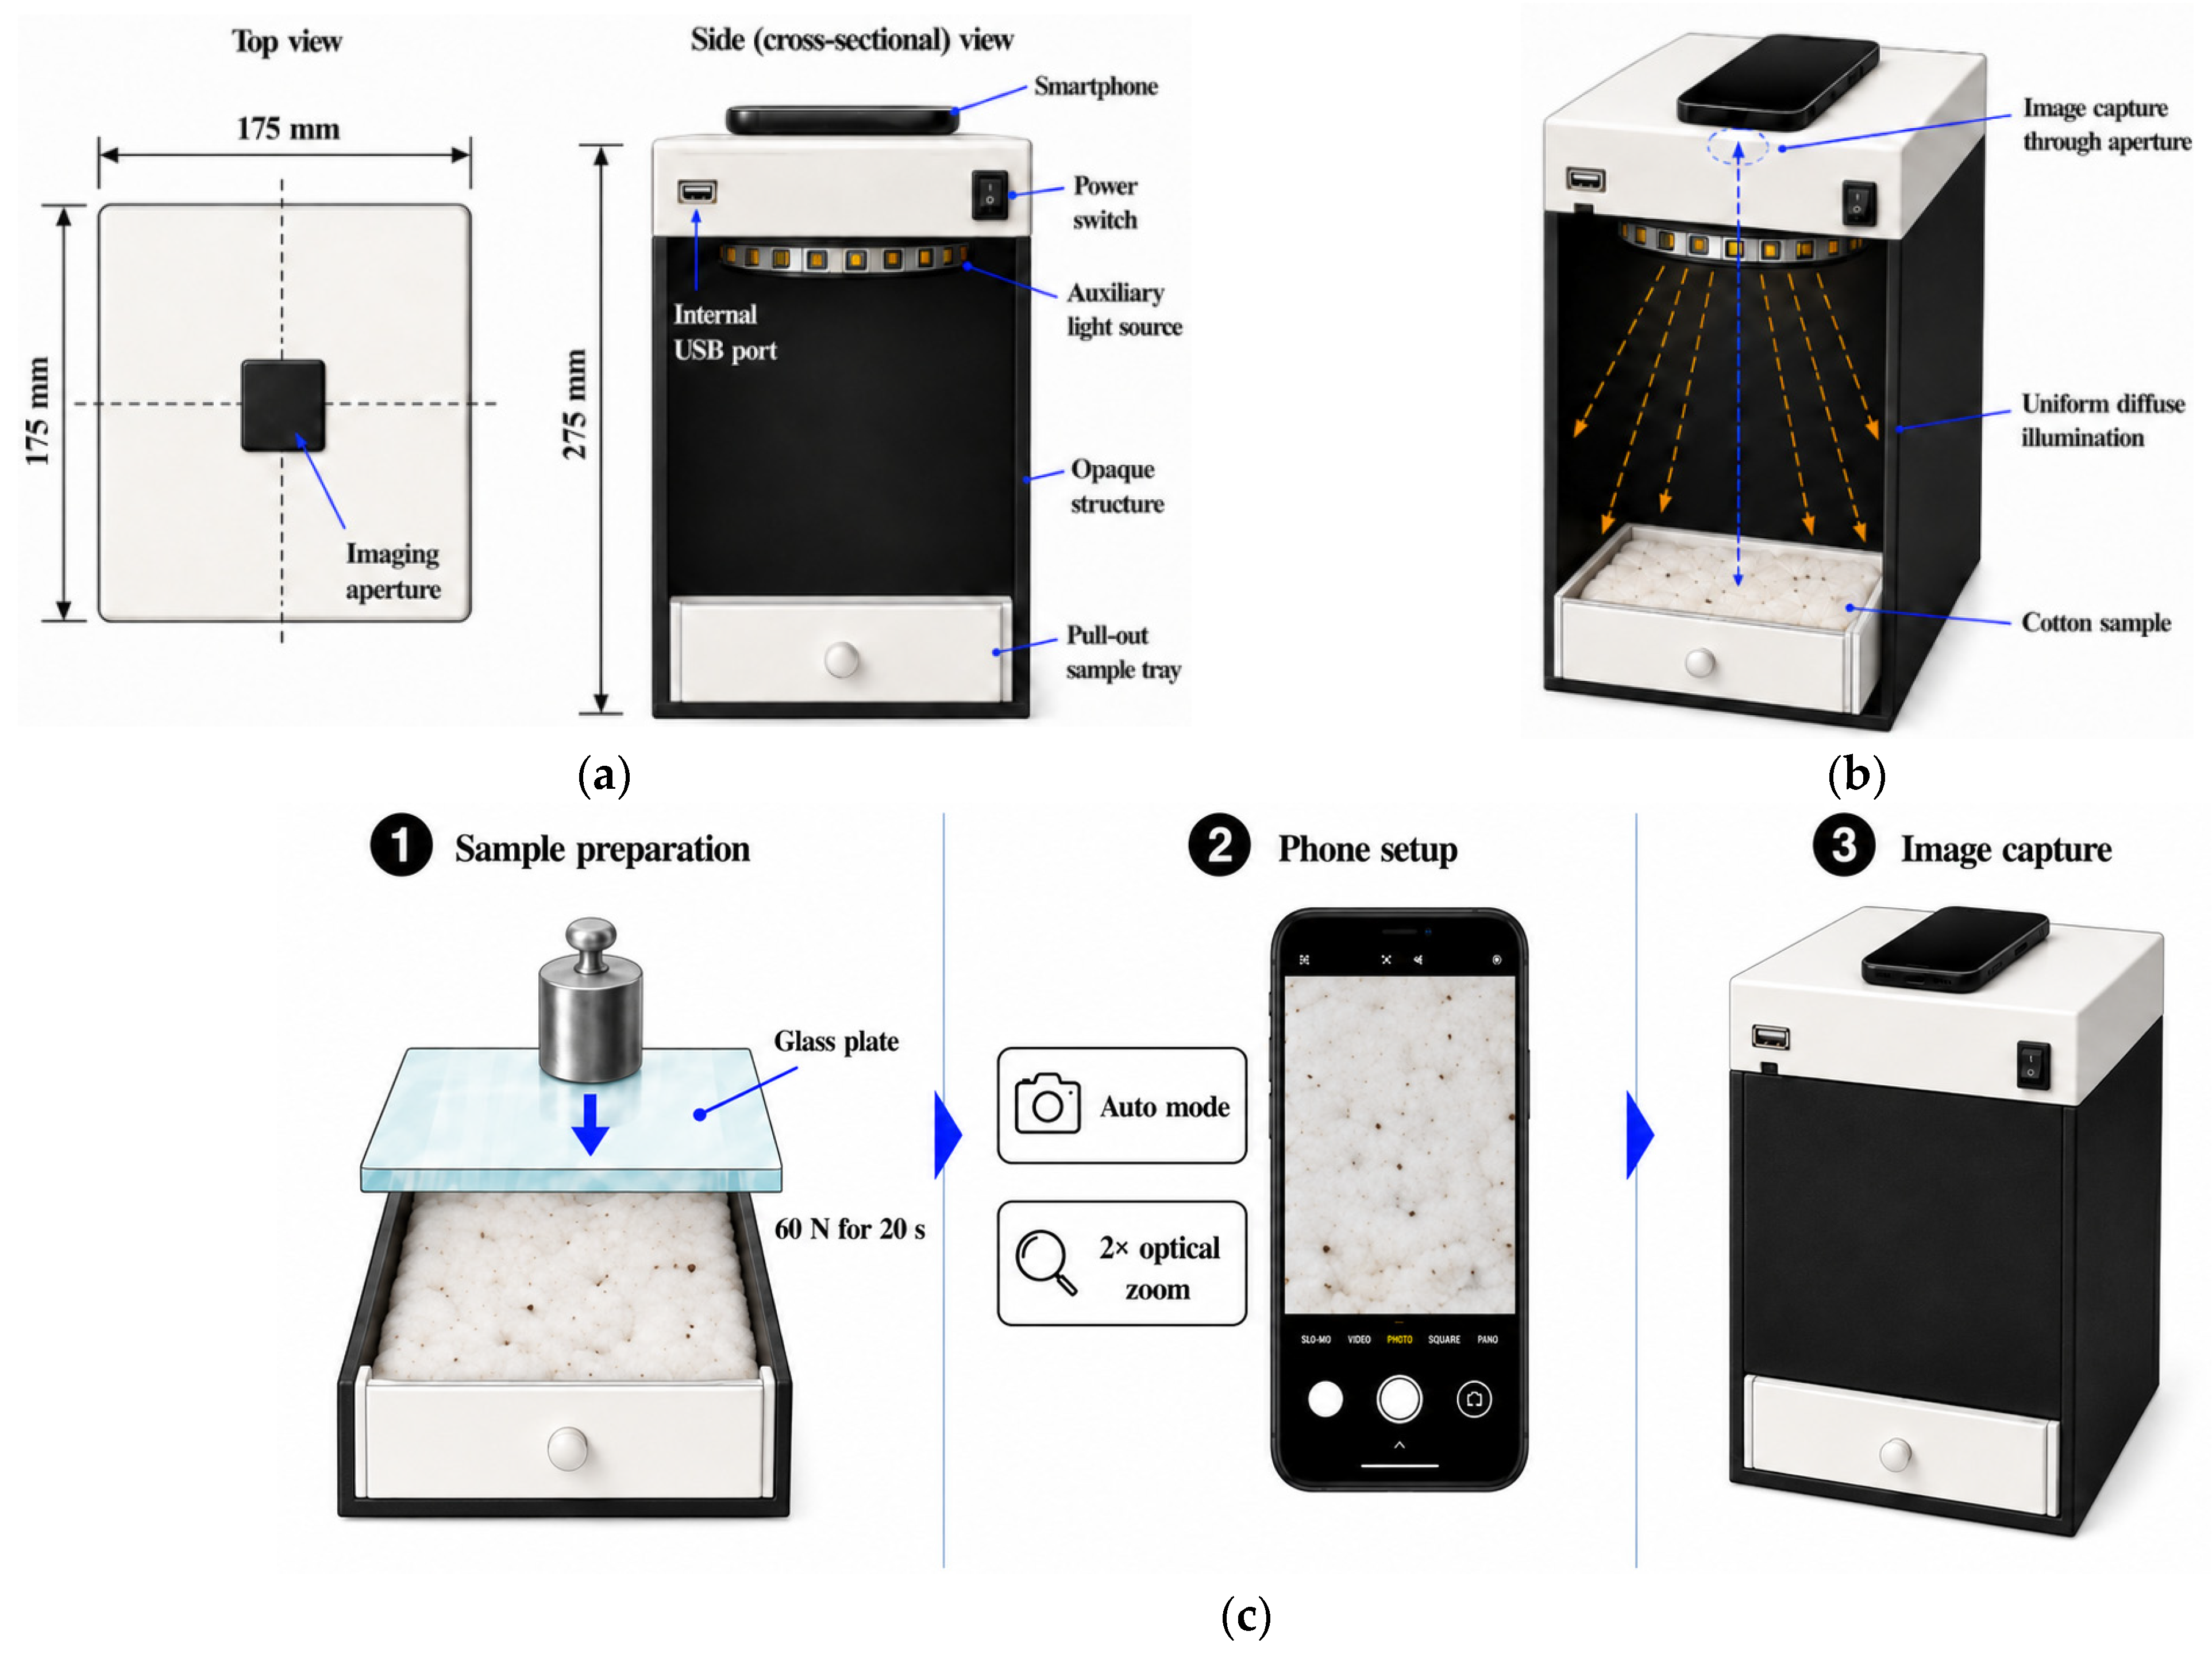
In this study, a cotton image acquisition device was designed and fabricated. The main structure of the device is an enclosed light-shielding box with horizontal dimensions of 175 mm × 175 mm and a height of 272 mm. An imaging aperture is reserved on the top of the box to secure a smartphone and enable image capture via the built-in camera. An auxiliary light source is installed inside the box, with an opaque structure connected beneath the light source to facilitate diffuse reflection, which creates a stable and uniform illumination environment for imaging. A pull-out sample tray is fitted at the bottom of the box. Cotton samples can be placed on the tray after it is pulled out, and pushing the tray back into place forms a fully enclosed light-shielding environment, which effectively eliminates external light interference. Featuring a simplified structure, compact size, and high portability, the device is applicable to portable and rapid cotton detection in diverse scenarios. The structural schematic of the device is illustrated in Figure 2.
Figure 2.
Image acquisition device for cotton grading. (a) Device structure and dimensions; (b) working principle; (c) image acquisition process.
The initial sketch of Figure 2 was generated with the assistance of [ChatGPT, GPT-5.5]. We provided self-produced planar diagrams and physical photos of the cotton image acquisition device as reference materials. All dimensional parameters, labels and structural descriptions in the finalized schematic were thoroughly inspected, revised and validated by the authors to guarantee precision and data accuracy.
During the image acquisition process, the smartphone was set to automatic shooting mode. To prevent resolution loss induced by digital zoom, all images were captured under a 2× optical zoom focal length setting. Considering that the fluffiness of cotton samples may affect surface flatness, imaging distance, and local shadow distribution, thereby causing variations in imaging consistency, a glass plate was used during sample preparation to apply a pressure of 60 N to the cotton surface for 20 s. This parameter was determined based on preliminary experiments and on-site operational feasibility. It enabled the sample surface to become relatively flat without noticeably damaging the appearance characteristics of the cotton, reducing imaging deviations caused by differences in sample looseness and improving the consistency of subsequent color recognition and impurity segmentation.
2.3. Construction of the Cotton Image Dataset
In this study, a total of 6363 cotton images were collected using the developed cotton image acquisition device. The images were saved in JPG format with a resolution of 2736 × 3648 pixels. The experimental samples were obtained from different imported cotton batches, with each sample corresponding to a single image. All samples and images were provided and reviewed by Zhangjiagang Customs. The dataset comprised representative samples covering seven color grades of white cotton and eight impurity grades of upland cotton. The color grading was implemented in accordance with the Official Cotton Standards of the United States for Upland Cotton [19]. In the grade coding system, the first digit (ranging from 1 to 7) represents the color grade, while the suffix digit indicates the color type. Codes ending in “1” correspond to white cotton; for instance, 11 refers to Grade 1 White Cotton and 21 refers to Grade 2 White Cotton. Impurity grading was conducted following U.S. cotton standards, which classify cotton into eight grades (1–8) according to impurity area ratio. Specifically, color grades were determined jointly by HVI measurement indicators of standard cotton samples and expert evaluation, whereas impurity grades were assigned according to the area proportion of annotated impurities in the images.
To balance annotation efficiency and pixel-level annotation accuracy, a semi-automatic annotation strategy was employed for dataset construction. The detailed implementation procedures are outlined as follows: (1) A subset of images was selected, and the locally deployed Segment Anything Model (SAM) was utilized for auxiliary annotation to generate preliminary pixel-level labels for cotton and impurity regions [20]. (2) The preliminary annotations generated in Step (1) were manually reviewed and revised by customs domain experts to form a small-scale, high-quality initial annotation dataset. (3) A segmentation model was trained on the annotated dataset established in Step (2). The trained model was subsequently applied to conduct batch inference on the remaining images to automatically generate pre-annotated segmentation masks. (4) Customs professionals further optimized the segmentation boundaries of the pre-annotated masks to produce final standardized annotation files. (5) In accordance with the impurity grading criteria specified in U.S. cotton standards, the area ratio of impurity regions to cotton regions in each image was calculated as the fundamental basis for impurity grade classification.
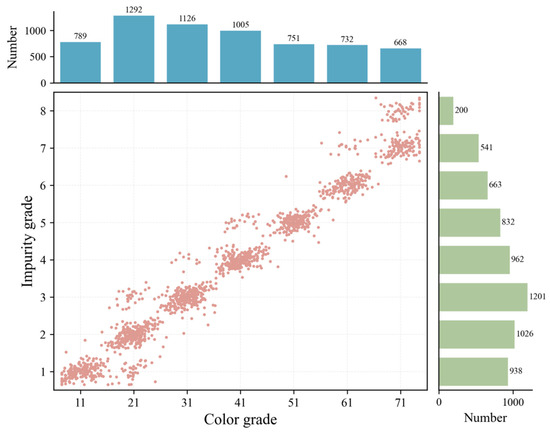
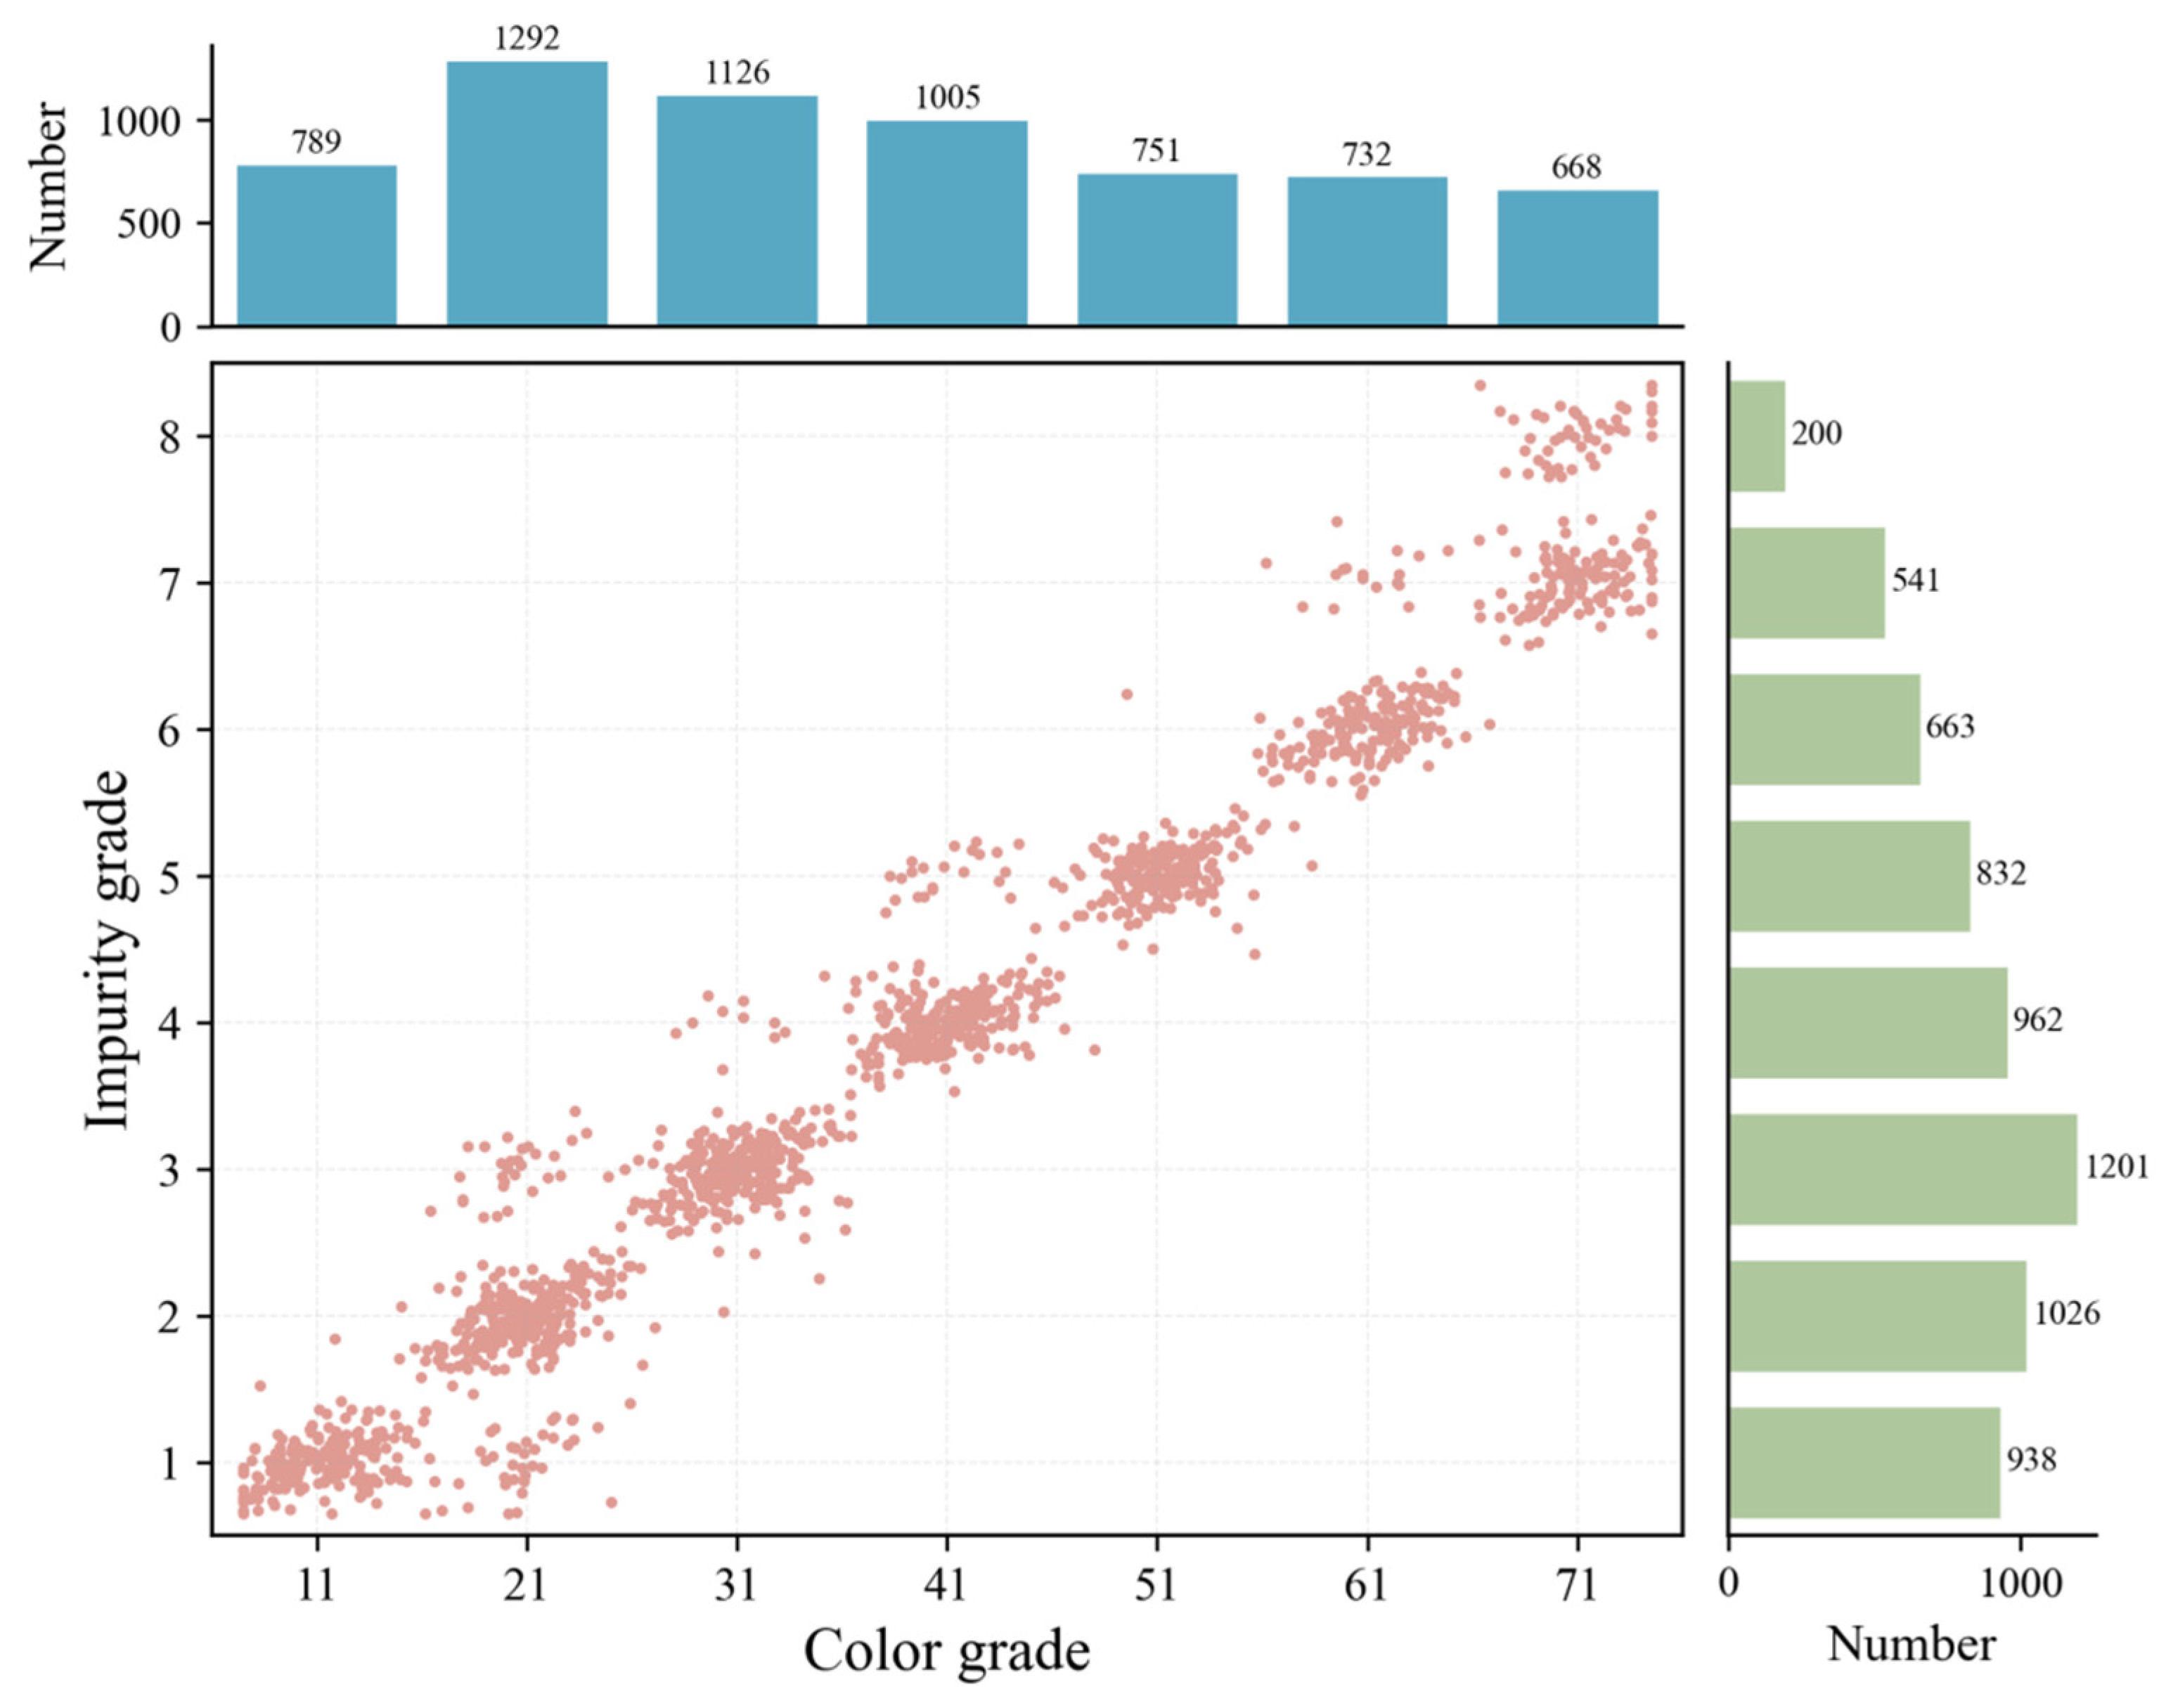
For the expert-reviewed complete dataset, statistical analysis of sample distribution was performed in terms of color grading and impurity grading, and the sample distribution across different grades is illustrated in Figure 3. A random sampling strategy considering different imported batches was adopted to split the entire dataset into training, validation, and test subsets at a ratio of 8:1:1, including 5091 images for training, 636 images for validation, and 636 images for testing. This approach ensures that the sample distribution of each subset is consistent with that of the original dataset, thereby eliminating distribution bias resulting from dataset partitioning.
Figure 3.
Distribution of grades in the cotton dataset.
2.4. Intelligent Identification Network for Cotton Quality Grading
2.4.1. Dual-Branch Parallel Recognition Framework for Cotton Quality Based on Background Segmentation
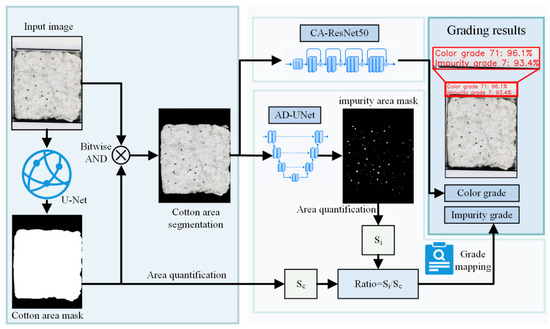
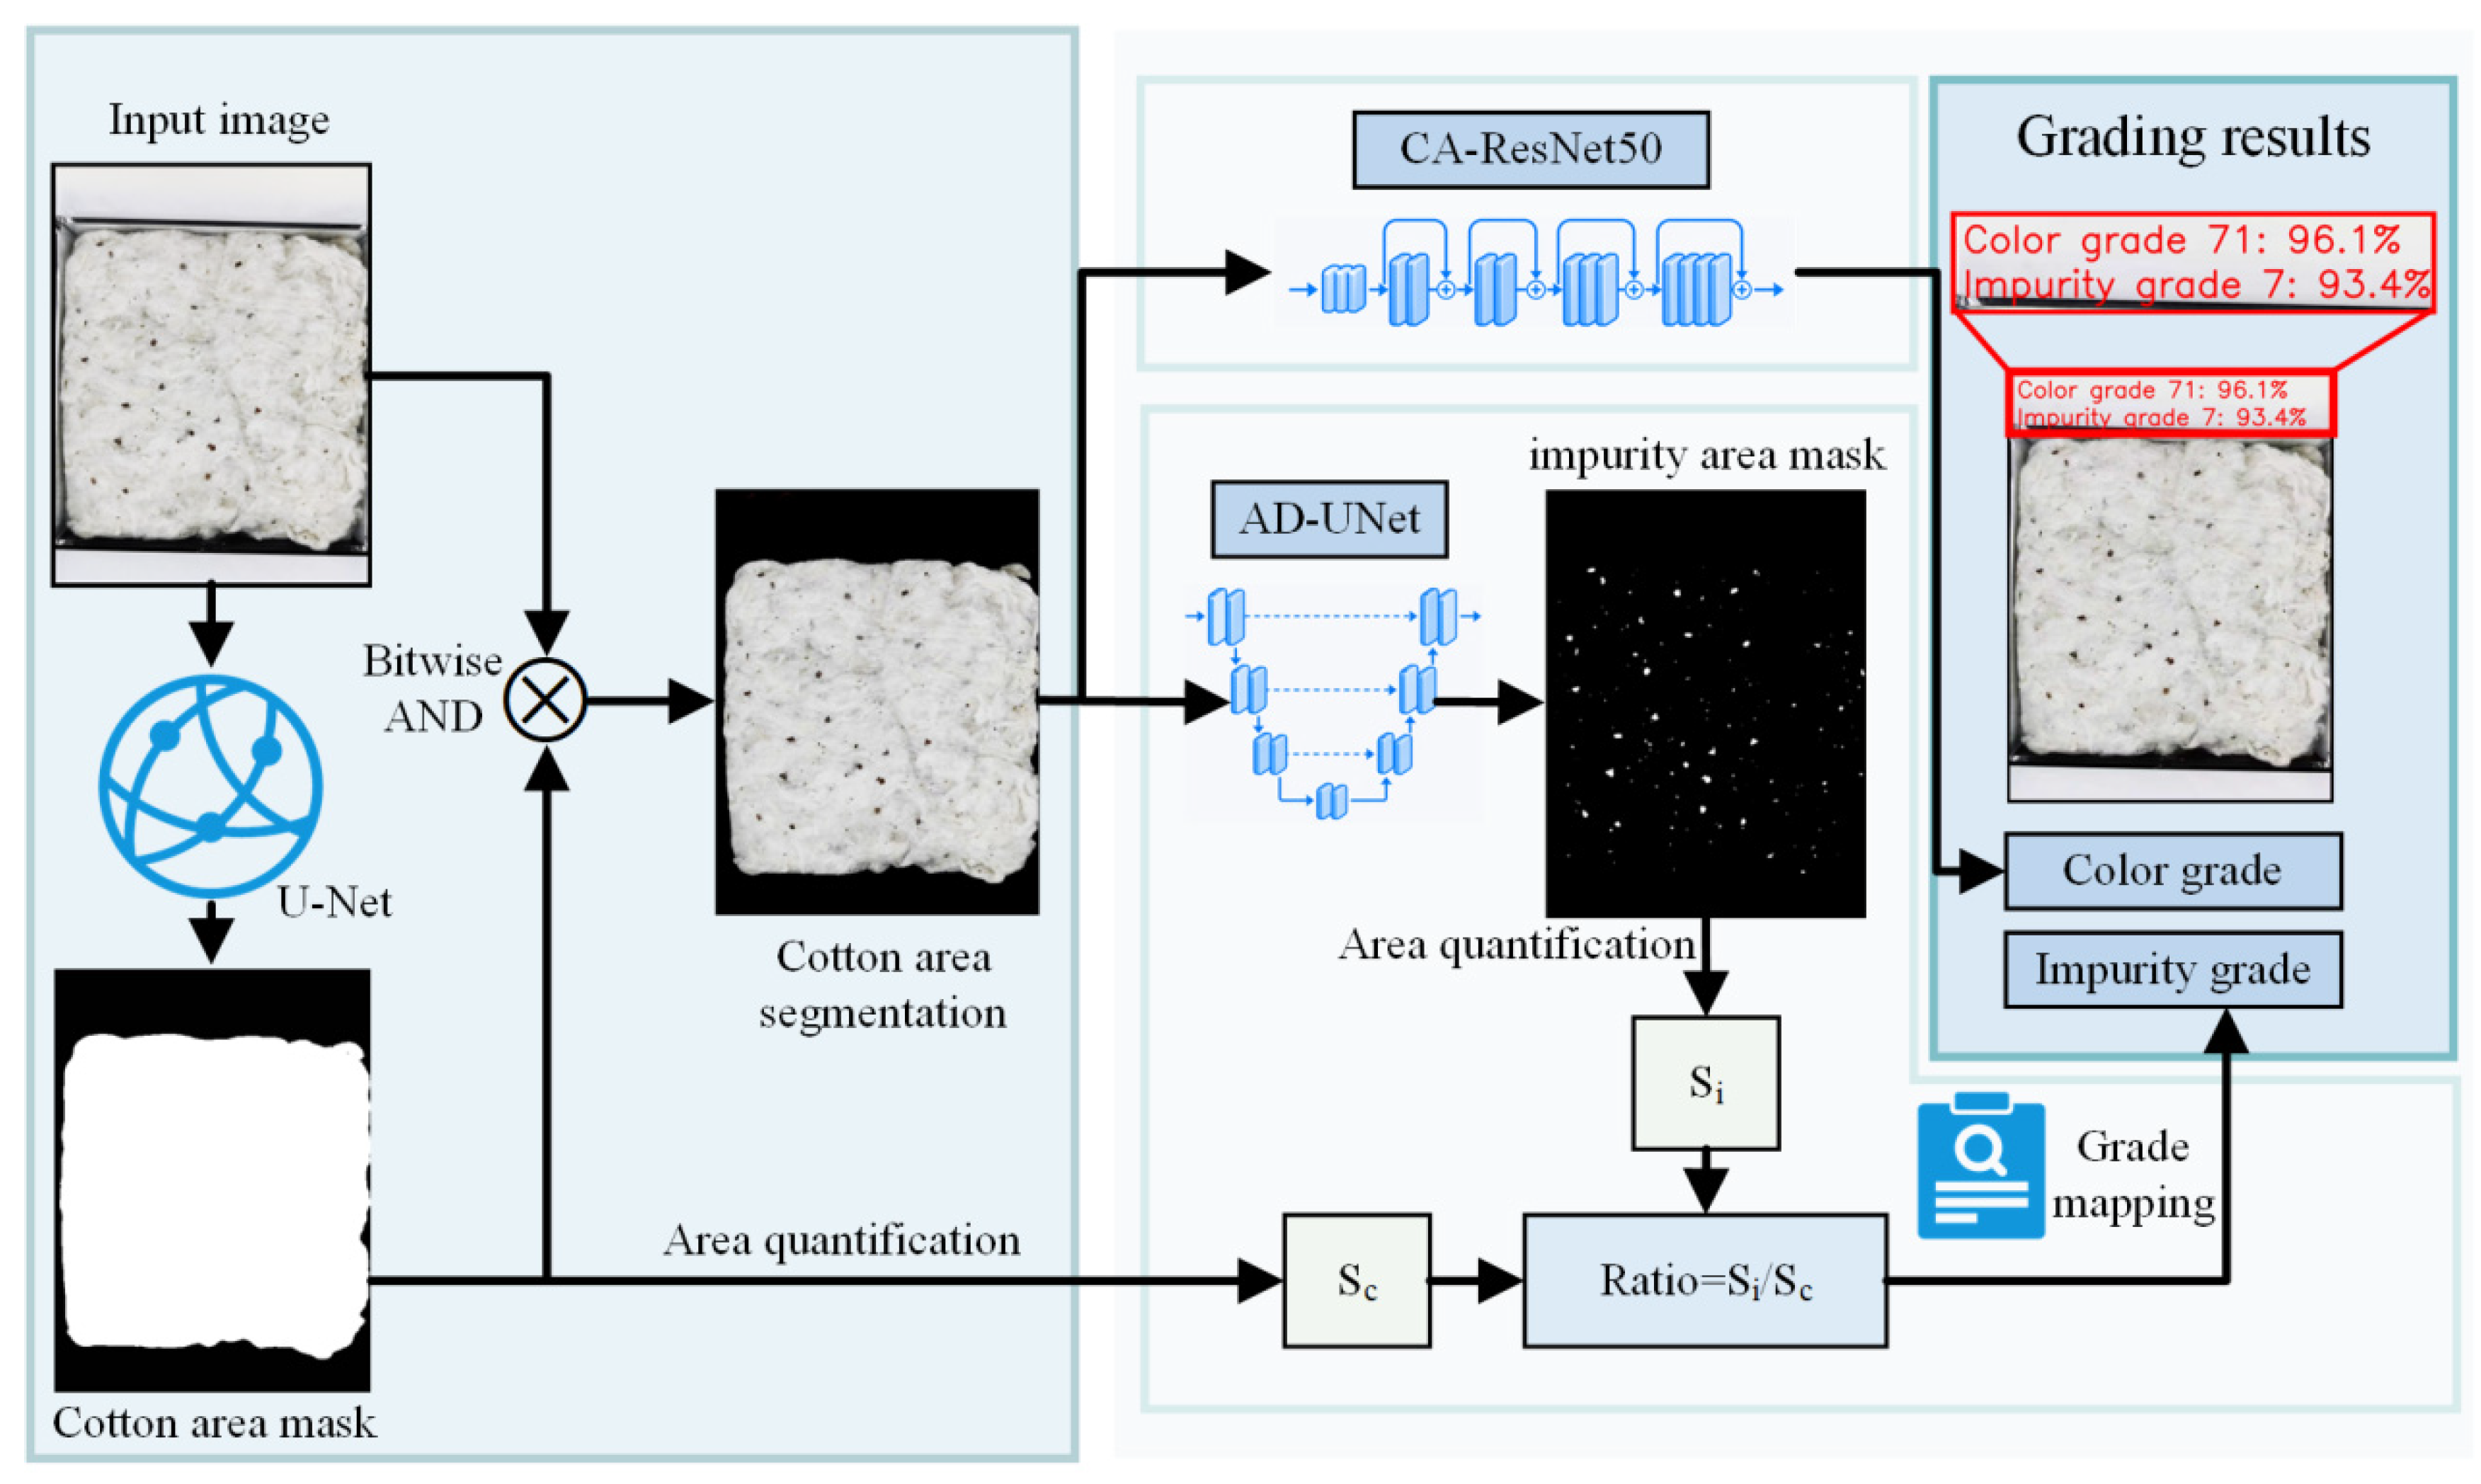
To improve the recognition accuracy of cotton color grading and impurity grading, this study designed and constructed a dual-branch parallel grading framework based on background segmentation, which comprises the cotton color grading model CA-ResNet50 and the cotton impurity segmentation model AD-UNet. The specific workflow of the proposed framework is detailed as follows (Figure 4):
Figure 4.
Schematic illustration of the background-segmentation-based dual-branch parallel recognition framework for cotton quality.
- Cotton background segmentation. The original cotton image is taken as the input, and the U-Net network [21] is adopted to segment the cotton region and generate the corresponding mask. A logical AND operation is subsequently executed between the original image and the mask to extract the valid cotton region, thereby mitigating the interference of complex backgrounds in subsequent grading tasks.
- Cotton color grading. The cotton image processed via background segmentation in Step (1) is directly fed into the CA-ResNet50 model to achieve automatic output of cotton color grade recognition results.
- Cotton impurity grading. The constructed AD-UNet network is utilized to conduct pixel-level impurity segmentation on the segmented cotton image to obtain the mask of impurity regions. The pixel areas of the cotton body and impurity regions are then calculated respectively for the computation of the impurity area ratio. Finally, the cotton impurity grade is determined in accordance with the standard for cotton impurity grading.
2.4.2. CA-ResNet50 Recognition Network
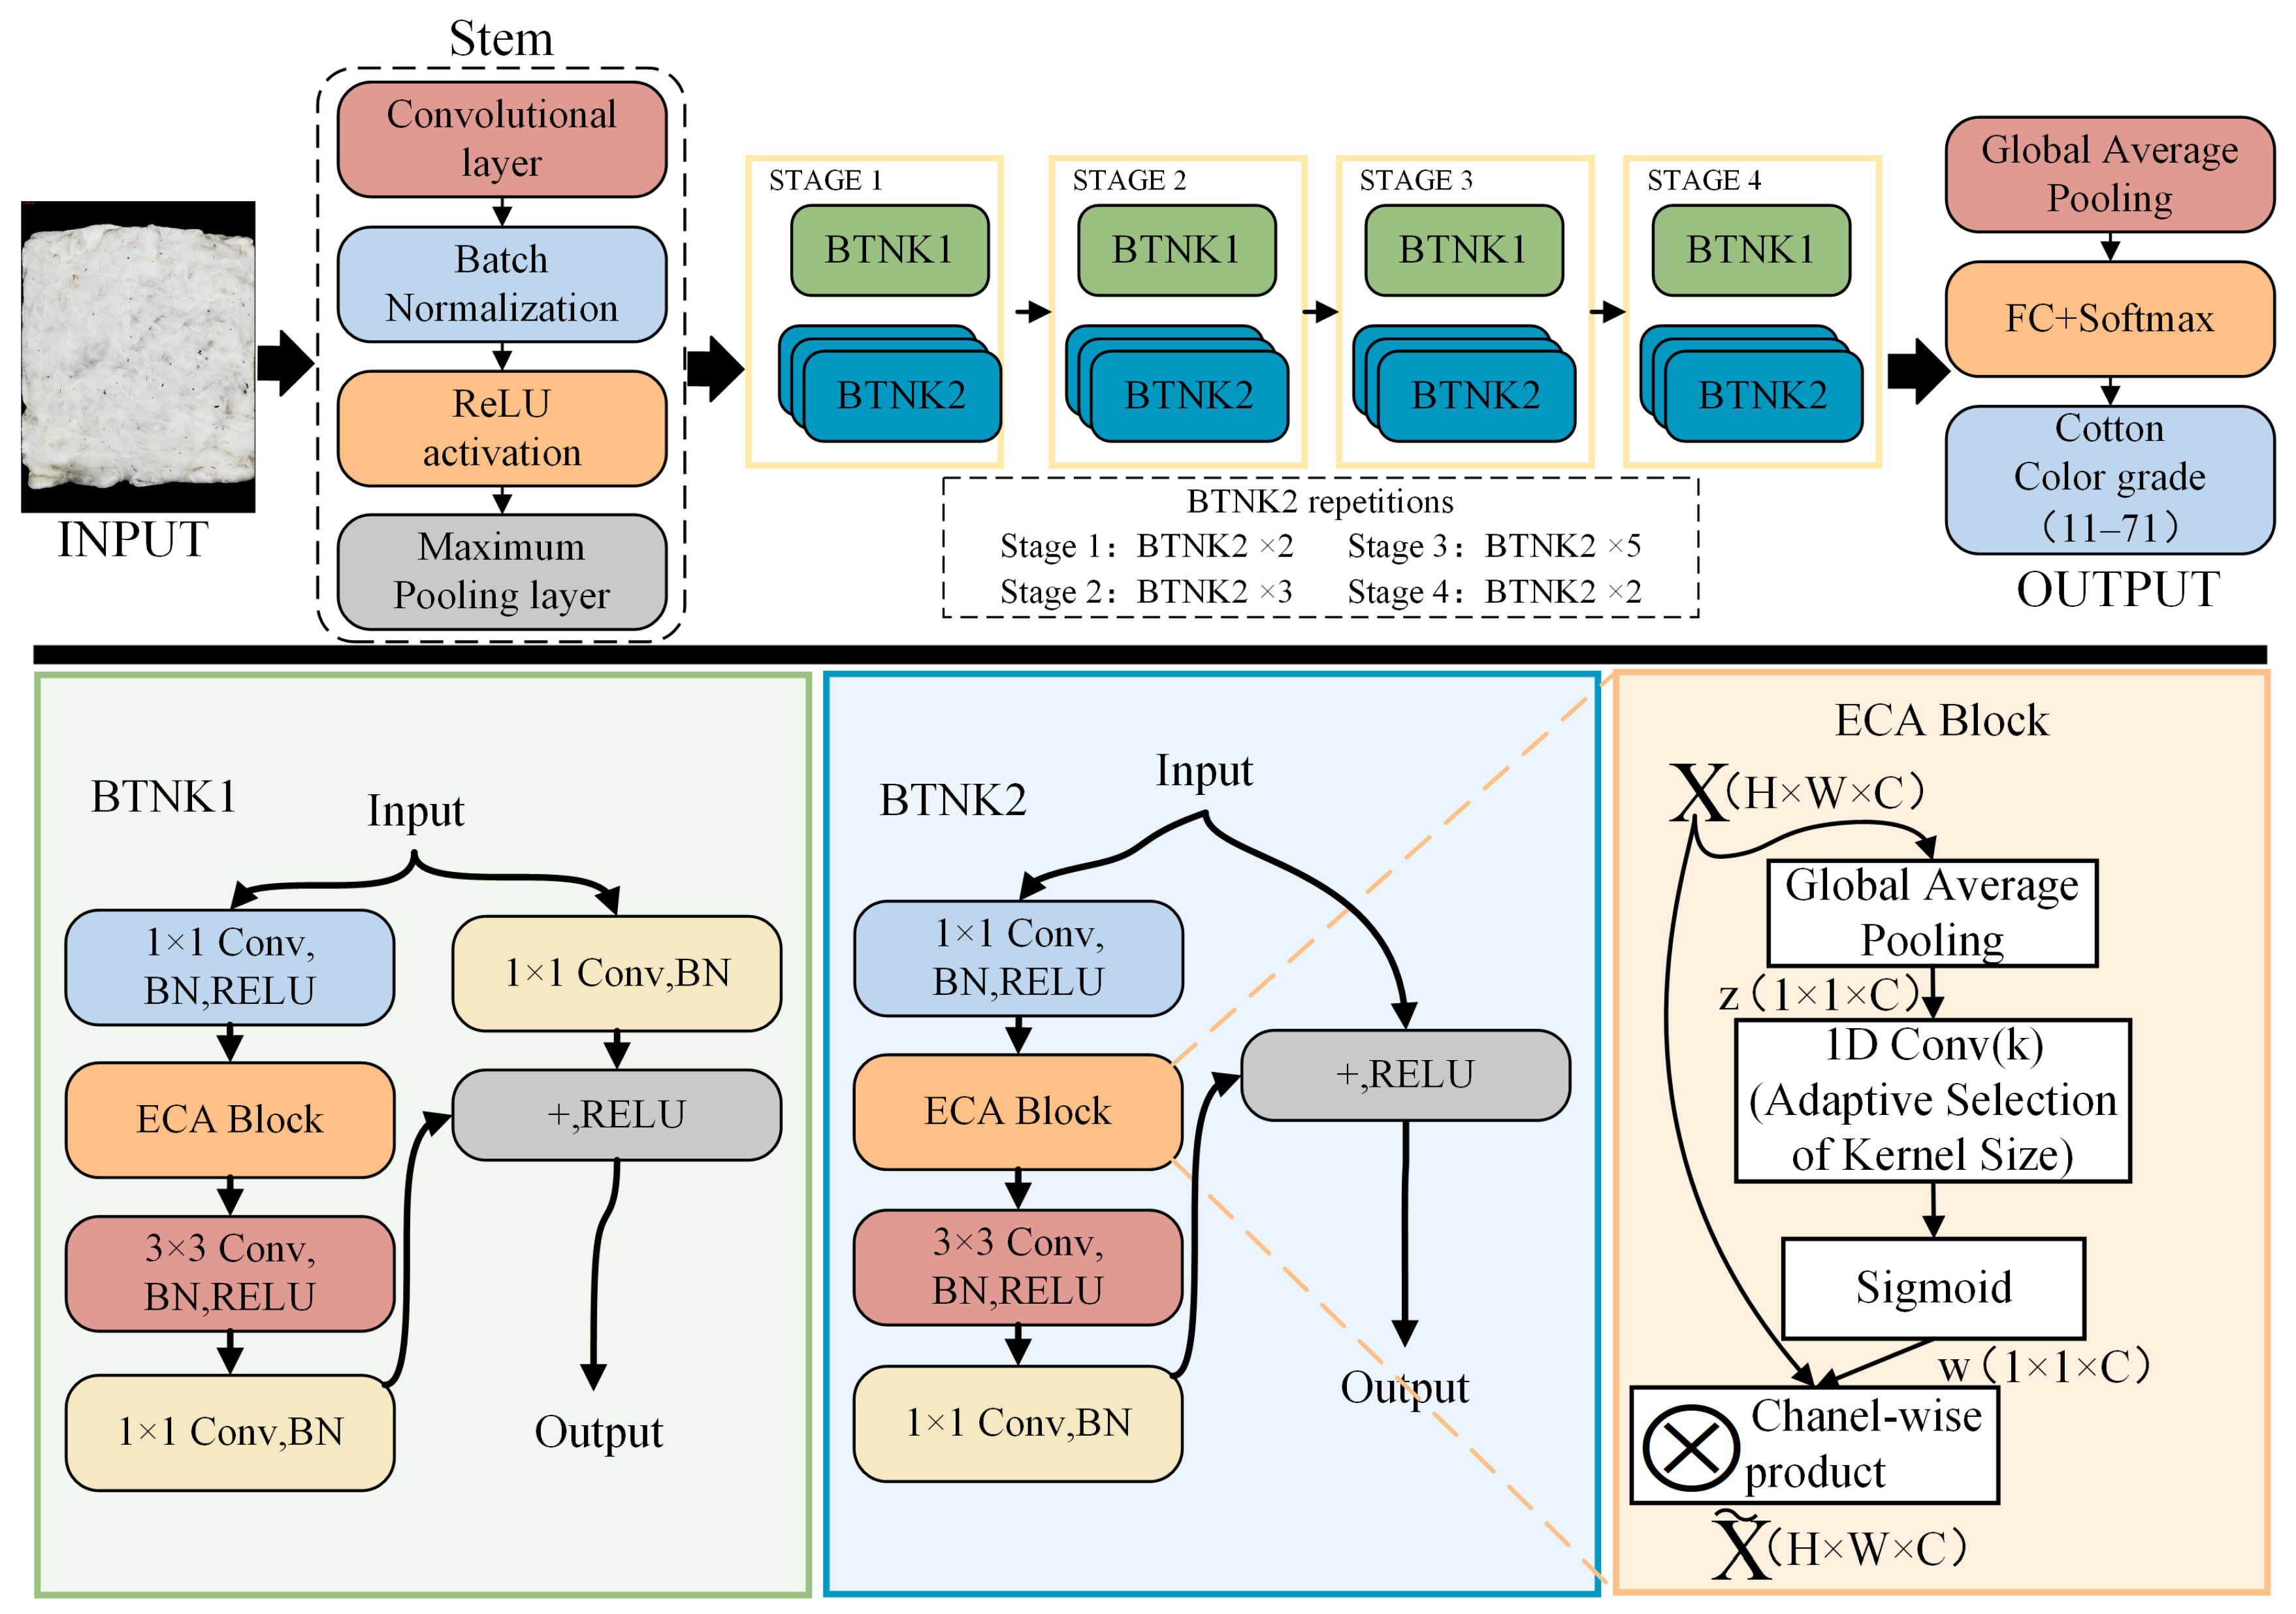
To achieve fine-grained discrimination of cotton color grades, this study proposed a cotton color grading recognition model named CA-ResNet50, where CA denotes Channel Attention. The ResNet50 network [22] consists of a stem block (Conv-BN-ReLU-MaxPool), four residual stages (Stage 1 to Stage 4), global average pooling (GAP), and a classification layer (FC + Softmax). The stem block extracts shallow texture and color response features and implements downsampling via the max-pooling layer (MaxPool) to reduce spatial resolution. In the hierarchical residual stages (Stage 1 to Stage 4), each stage contains two types of bottleneck residual blocks. Specifically, BTNK1 is adopted for spatial downsampling and channel matching at the initial position of each stage, while BTNK2 is utilized to deepen feature representation while preserving spatial resolution. Following feature extraction via the four residual stages, the network aggregates spatial features into a global vector through GAP and outputs the predicted cotton color grade (11–71) via the FC + Softmax classification layer.
On the basis of ResNet50, this study further improves the model from the perspectives of optimization strategy and feature attention to improve its convergence stability and discriminative robustness. In terms of training optimization, the original optimizer is replaced with AdamW [23]. The AdamW algorithm improves regularization effectiveness by decoupling weight decay, thereby enhancing the convergence stability and generalization performance of the model.
For feature modeling, an Efficient Channel Attention (ECA) module [24] is embedded between the 1 × 1 convolutional layer (Conv-BN-ReLU) and the 3 × 3 convolutional layer in the main branch of BTNK1 and BTNK2 residual blocks to adaptively recalibrate channel responses. The recalibrated main-branch features are subsequently fused with the shortcut branch and activated via ReLU for output. At this stage, the features have undergone preliminary channel transformation and nonlinear mapping, containing richer aggregated color responses. Before the features are input into the 3 × 3 convolutional layer, the ECA module adaptively assigns weights to channel responses, which guides the subsequent spatial feature extraction to focus on color-discriminative information and suppress redundant responses induced by texture and illumination disturbances.
Let denote the input feature of the ECA module with dimensions , where and represent the feature height and width, respectively, and denotes the number of feature channels. GAP is performed on to obtain the channel descriptor , and this aggregation process can be formulated as follows:
After the global channel descriptor is obtained, local cross-channel dependencies are modeled via one-dimensional convolution, where the convolution kernel size is adaptively determined according to the number of channels . Accordingly, a larger convolution kernel is utilized to integrate information from adjacent channels when the input feature contains a greater number of channels; conversely, a smaller convolution kernel is adopted when the channel number is low to avoid redundant channel responses. The calculation of the kernel size is formulated as follows:
denotes the nearest odd number, while and are hyperparameters for controlling the mapping relationship. In this study, the default parameter settings of the ECA module are adopted, with and [24]. The channel weight is obtained via Sigmoid mapping. The recalibrated output is generated through channel-wise multiplication, which enhances channel responses relevant to color discrimination and suppresses interference. The corresponding calculation process is presented as follows:
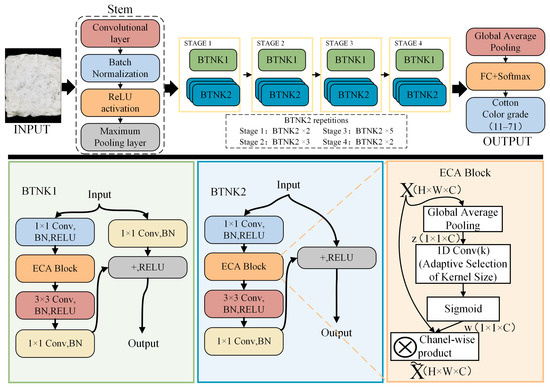
The network structure is illustrated in Figure 5.
Figure 5.
Architecture of the CA-ResNet50 network for cotton color grade recognition. Note: BTNK1 and BTNK2 denote residual bottleneck modules; ECA Block denotes the Efficient Channel Attention module; Conv, BN, and ReLU denote convolution, batch normalization, and the activation function, respectively; H, W, and C denote the height, width, and number of channels of the feature map, respectively; and FC + Softmax denotes the classification output layer.
2.4.3. AD-UNet Segmentation Network
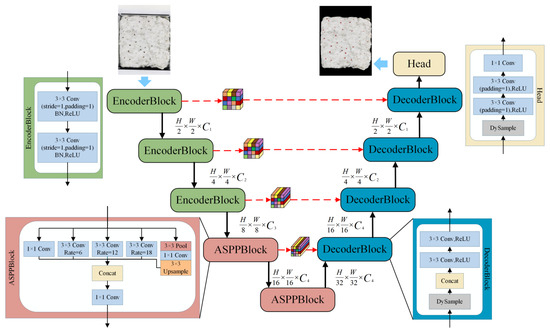
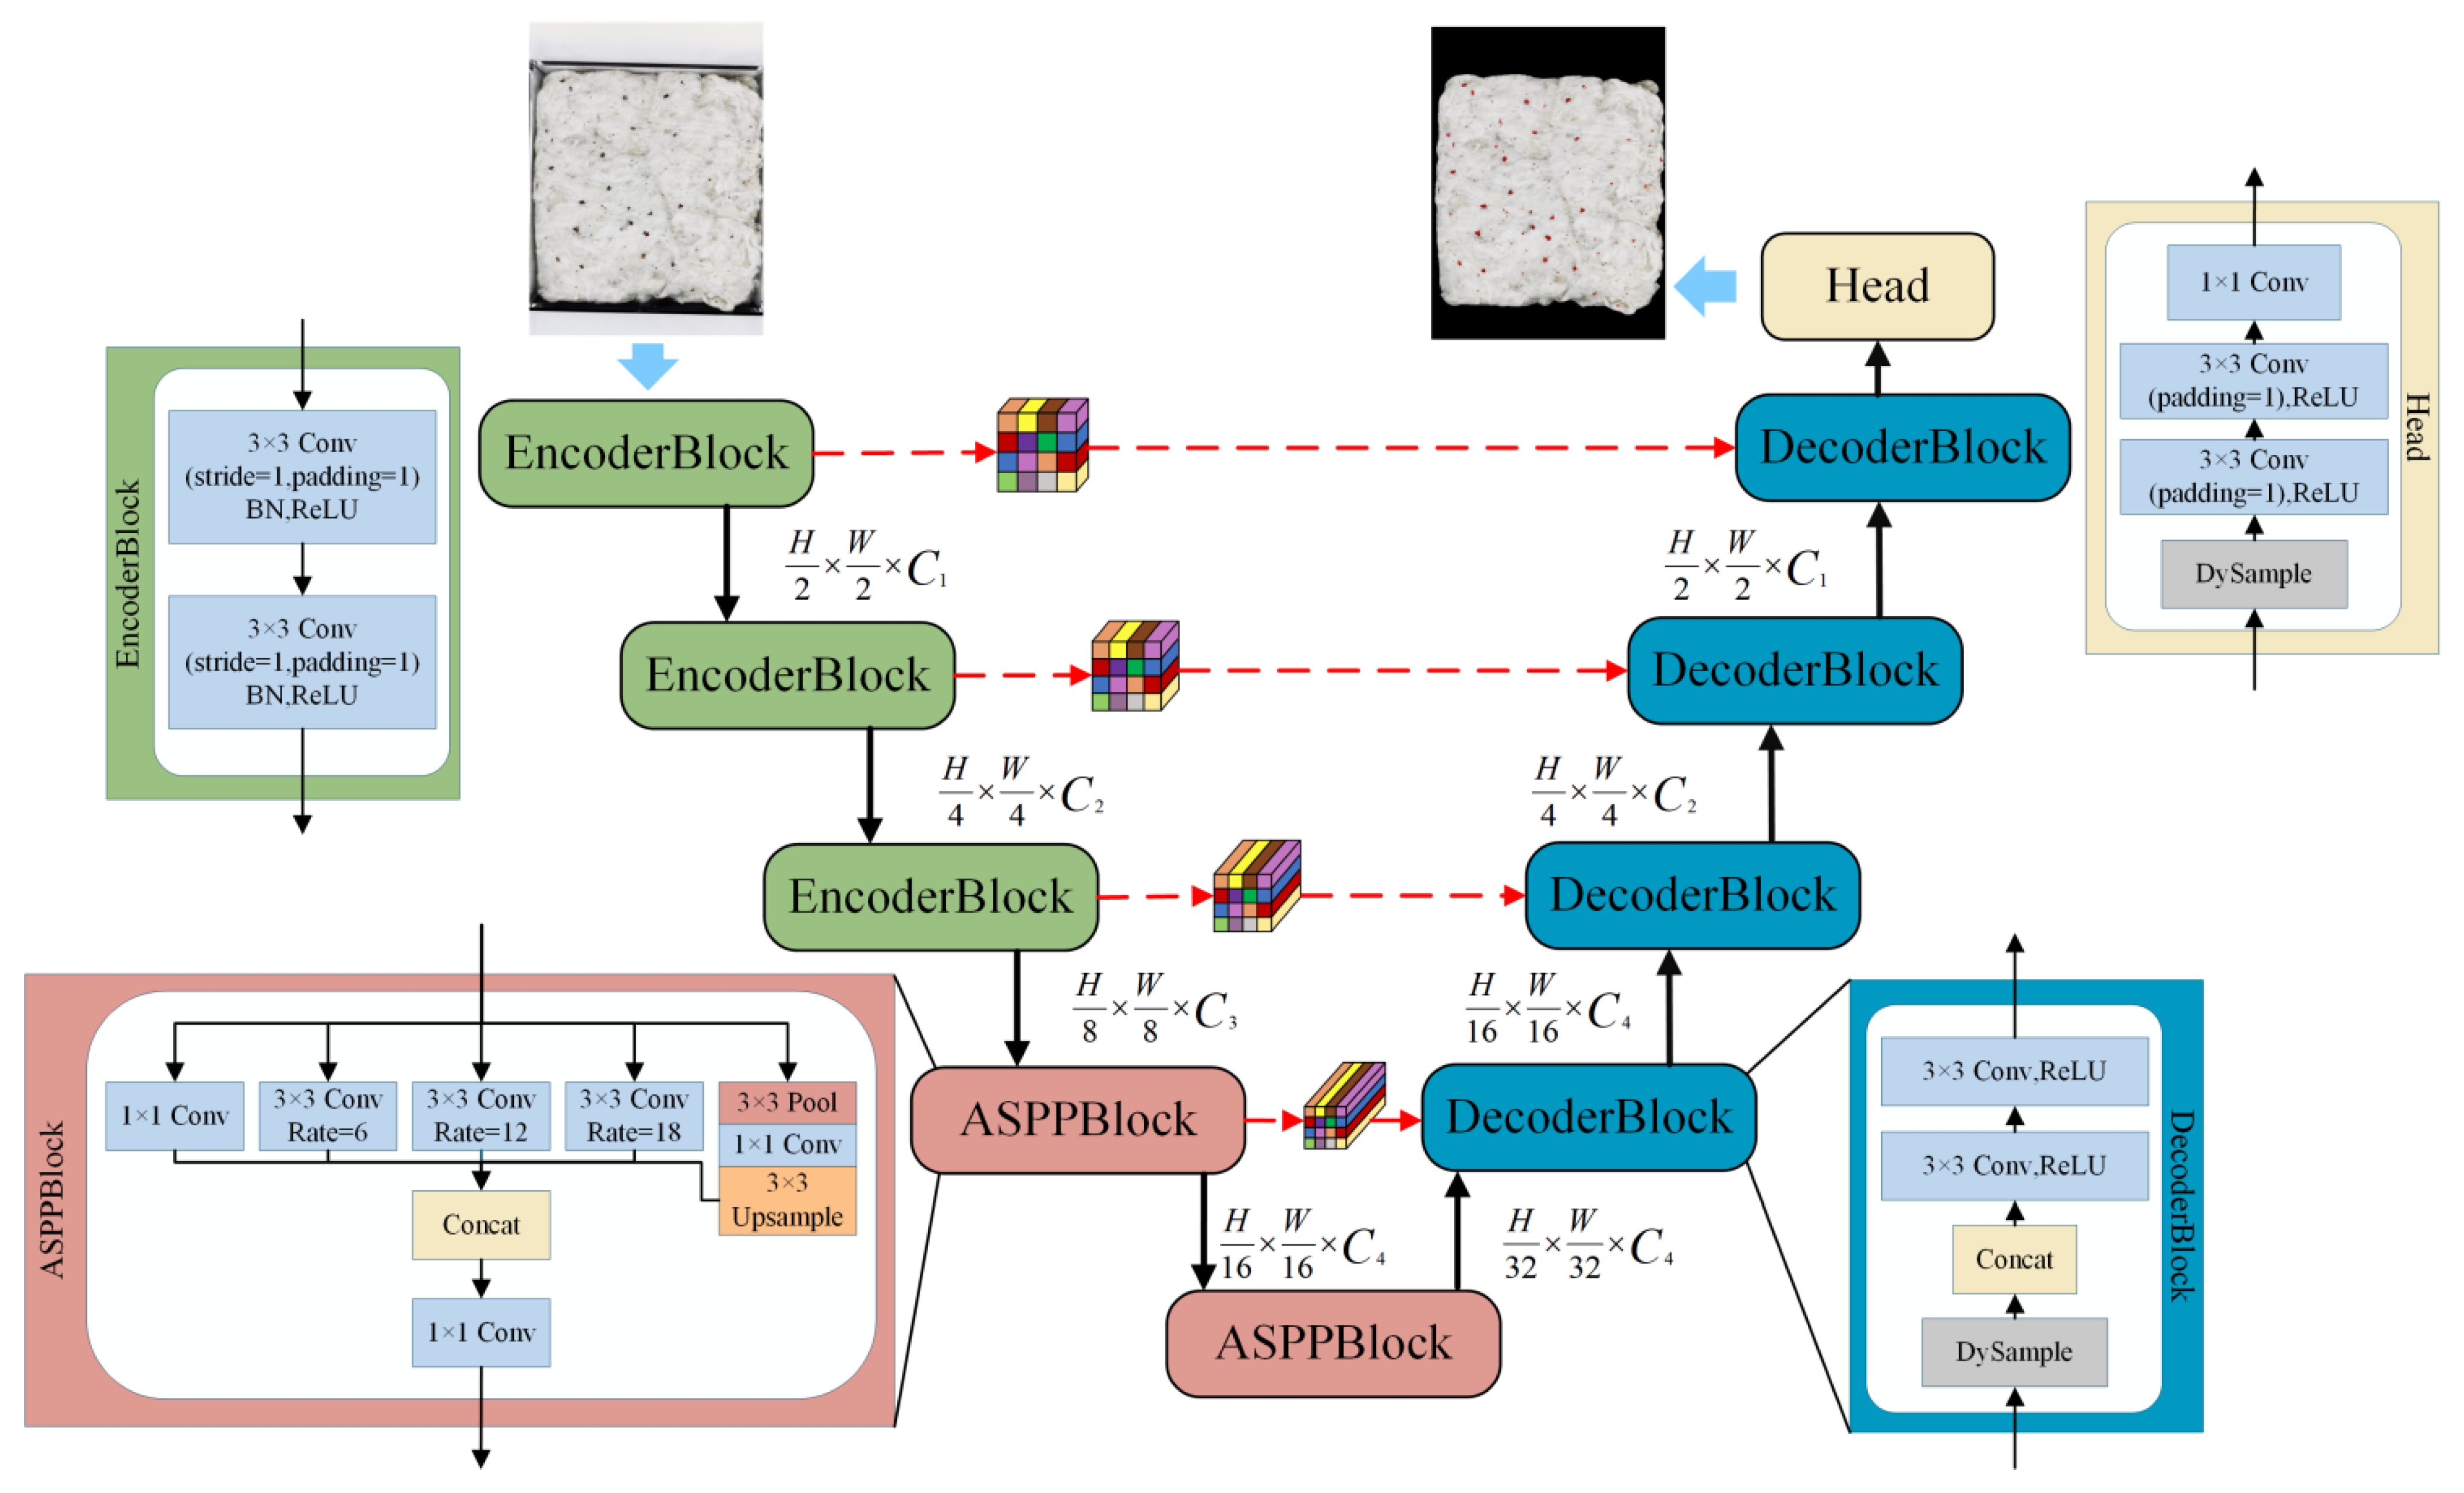
To guarantee segmentation accuracy while maintaining inference efficiency, this study proposed an improved cotton impurity segmentation network termed AD-UNet. In the proposed AD-UNet, A denotes the Atrous Spatial Pyramid Pooling (ASPP) module for multi-scale contextual modeling, and D denotes the DySample adaptive upsampling module. To address the challenges of significant scale variations, complex morphology, and low contrast between impurities and cotton fiber backgrounds, AD-UNet inherits the advantages of the U-Net encoder–decoder framework. Specifically, the ASPP module is embedded in the last two encoder stages [25] to implement multi-scale contextual modeling and improve the model’s adaptability to scale variations in impurity targets, while the DySample adaptive upsampling mechanism is introduced in the decoder [26] to refine boundary clarity and ensure target integrity. The overall architecture is demonstrated in Figure 6.
Figure 6.
Architecture of the AD-UNet network for cotton impurity segmentation. Note: EncoderBlock and DecoderBlock denote the encoder module and decoder module, respectively; ASPPBlock denotes the Atrous Spatial Pyramid Pooling module; Head denotes the output prediction head; Conv, BN, ReLU, and Concat denote convolution, batch normalization, the activation function, and feature concatenation, respectively; H, W, and C denote the height, width, and number of channels of the feature map, respectively; and C1–C4 denote the channel dimensions at different stages.
AD-UNet follows an encoder–decoder architecture and retains spatial information via skip connections. The encoder extracts hierarchical features from shallow texture representations to deep semantic representations through progressive downsampling. In contrast, the decoder gradually restores feature spatial resolution via upsampling and fuses decoded features with skip-connected features at corresponding scales. This design balances semantic discrimination and edge details and finally outputs pixel-level predictions of impurity regions. Nevertheless, impurity targets present an obvious cross-scale distribution, so convolutions with a single receptive field fail to simultaneously cover large-scale cotton structural features and fine impurity details, which may cause missed detections and region merging in complex scenarios. Furthermore, conventional fixed interpolation-based upsampling tends to generate over-smoothed results at low-contrast boundaries, leading to discontinuous small impurities and blurred contours.
To enhance the cross-scale representation capability, the ASPP module is inserted at the outputs of the last two encoder stages. Features at these stages carry robust semantic information and possess low spatial resolution; the introduction of extensive contextual constraints improves the segmentation consistency of models in complex background scenarios. Compared with the scheme of embedding the ASPP module solely in a single bottleneck layer, the two-stage embedding design enables multi-scale feature aggregation at two distinct downsampling scales. The deeper stage focuses on global structural modeling, while the shallower stage preserves richer local detail representations, enabling the model to achieve more robust adaptation to scale variations in impurity targets. The ASPP module comprises multiple parallel branches, including a 1 × 1 convolution branch, several 3 × 3 atrous convolution branches with varying dilation rates, and a global pooling branch. Feature maps derived from all branches are concatenated and fused via a 1 × 1 convolution for output. This design aggregates multi-scale contextual information, expands the effective receptive field without further reduction in feature resolution, and integrates semantic information from different scales.
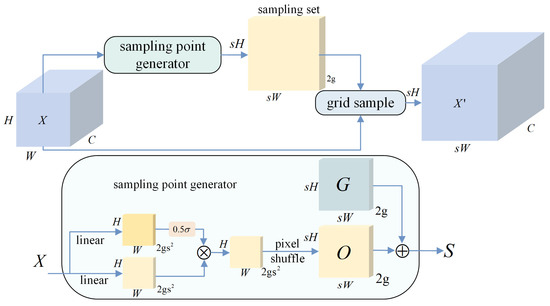
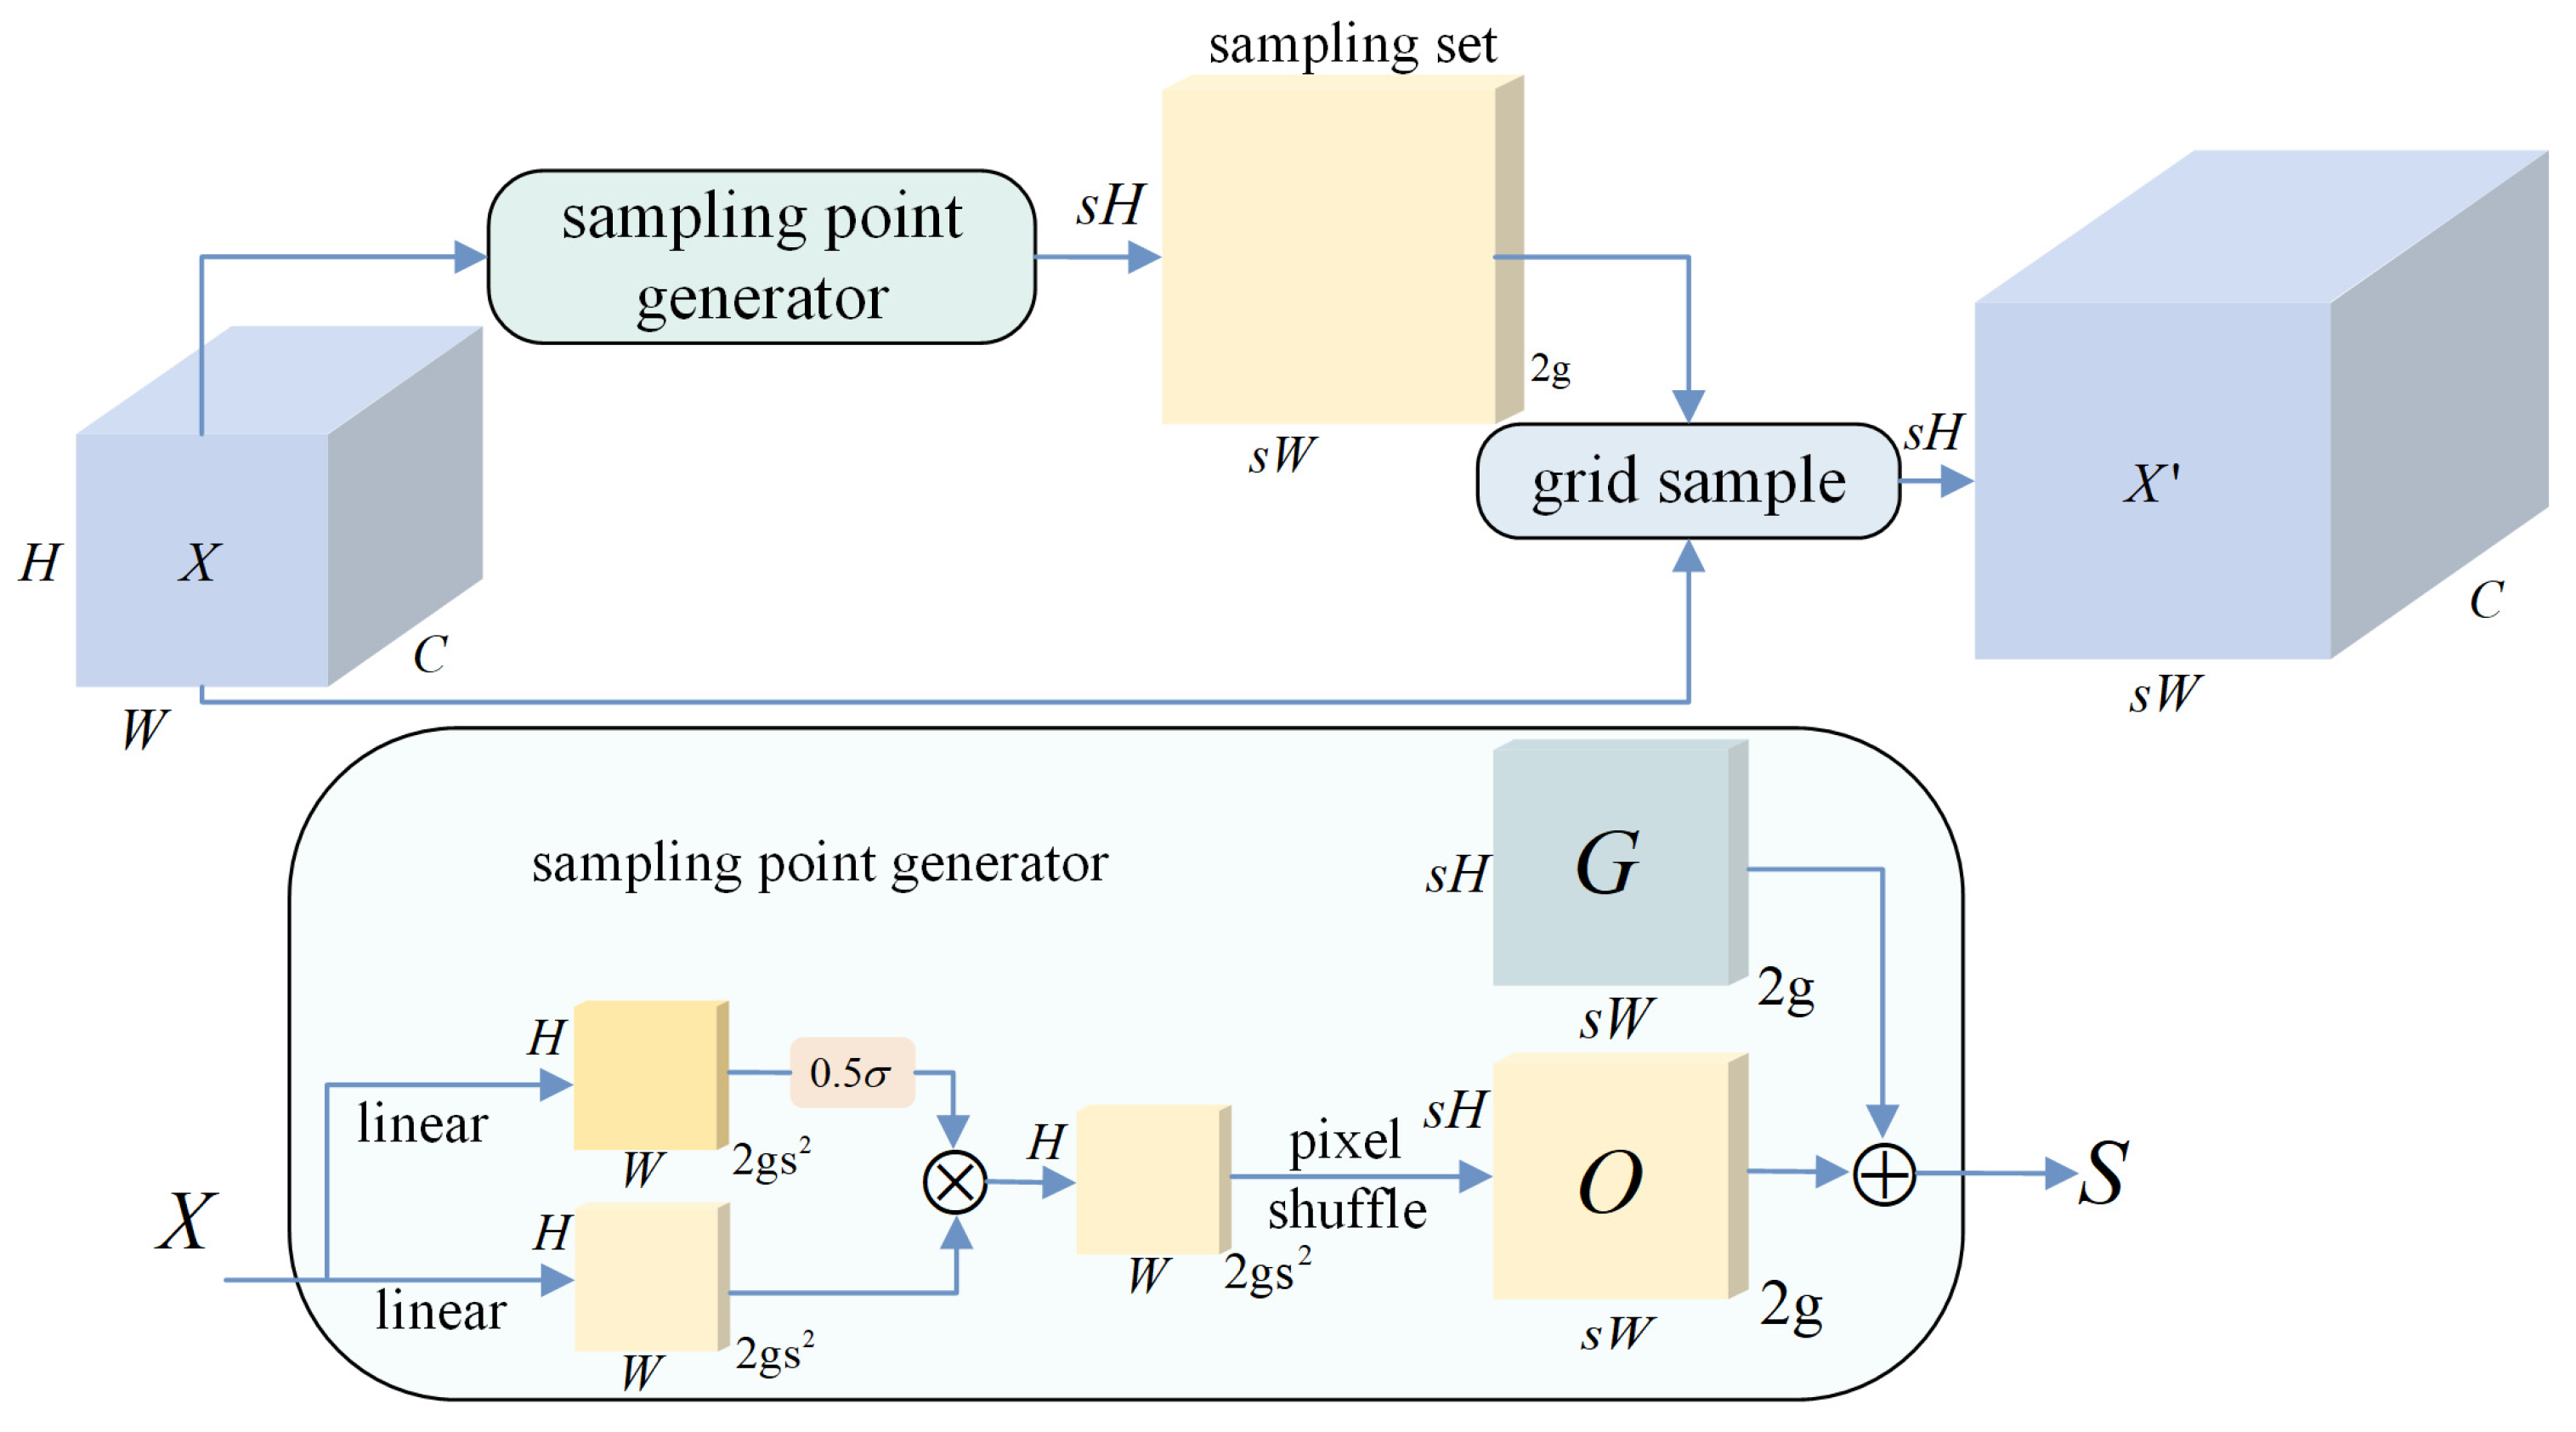
To improve the quality of detail reconstruction, this study adopts the DySample dynamic upsampling mechanism to replace all upsampling operations in the decoder. Unlike fixed interpolation strategies, DySample adaptively predicts sampling offsets according to input features and implements dynamic resampling. Let denote the input feature map with a dimension of , where and represent the height and width of the feature map, respectively, and refers to the number of feature channels. Through the sampling point generator, the dynamic sampling set is generated from , with a size of , where and denote the height and width after upsampling, respectively, and represents the number of sampling points corresponding to each output position. As each sampling point is defined by a two-dimensional coordinate , each output position requires coordinate values to characterize its corresponding sampling location set. Grid sampling uses the dynamic sampling set to resample the input feature map , thereby obtaining the upsampled feature map (Figure 7). The corresponding process is formulated as follows:
Figure 7.
Architecture of DySample. Note: X and X′ denote the input feature map and the upsampled output feature map, respectively; S, G, and O denote the dynamic sampling set, regular sampling grid, and predicted offsets, respectively; H, W, and C denote the dimensions of the input feature map; sH and sW denote the spatial dimensions after upsampling; and g denotes the number of sampling points corresponding to each output position.
In DySample, the sampling set is constructed by adding the offset to the regular sampling grid , where the offset is generated through a linear transformation. The calculation process is defined as follows:
During the generation of the offset , the input feature map undergoes two linear transformations to produce two feature maps. The two feature maps are fused via element-wise multiplication and scaled by a coefficient of , where denotes a learnable parameter. The scaled feature map is subsequently processed by the Pixel Shuffle operation to generate the final offset with a dimension of . By dynamically generating sampling points, the sampling positions can be adaptively adjusted to fit local textures and boundary structures, which alleviates blurring and deformation artifacts caused by the averaging of foreground and background features at edges in fixed-kernel upsampling. During feature restoration at different scales, over-smoothing is consistently suppressed, and critical information regarding tiny impurities, elongated structures, and low-contrast boundaries is progressively preserved, thereby enhancing the boundary clarity of segmentation results and the integrity of target objects.
By integrating the ASPP module and the DySample mechanism into the AD-UNet, the proposed network improves the segmentation accuracy of impurities in complex scenes while maintaining high computational efficiency, thus providing reliable pixel-level segmentation results for the subsequent calculation of impurity area ratio and determination of impurity grades (Figure 7).
2.5. Model Evaluation
To quantitatively evaluate the performance of the cotton quality detection and grading models proposed in this study, evaluation metrics were selected according to three tasks: color grade recognition, pixel-level impurity segmentation, and quantitative estimation of impurity area ratio. Precision, Recall, -Score, Intersection over Union (IoU), and Dice coefficient were adopted as evaluation metrics to quantify the consistency between model predictions and ground-truth annotations at both the pixel level and the sample level. The calculation formulas for Precision, Recall, and -Score are defined as follows:
Here, True Positive (TP) represents the number of target samples or pixels correctly predicted as targets, False Positive (FP) represents the number of background samples or pixels incorrectly predicted as targets, and False Negative (FN) represents the number of target samples or pixels incorrectly predicted as background. Based on the above definitions, the three metrics were calculated for segmentation and recognition tasks through pixel-wise comparison between predicted masks and ground-truth masks, as well as correspondence analysis between predicted categories and ground-truth categories, respectively.
In addition, to further evaluate the spatial overlap degree between segmented mask regions and ground-truth annotated regions, IoU and Dice coefficient were introduced as evaluation metrics for segmentation consistency. Their definitions are presented as follows:
Here, denotes the pixel set of the target mask region segmented by the model, denotes the pixel set of the manually annotated target region, and denotes the number of pixels in the set. The symbols and represent the intersection and union operations of sets, respectively.
To quantitatively evaluate the consistency between the predicted impurity area ratio and the ground-truth impurity area ratio, this study adopted the coefficient of determination , mean absolute error (MAE), and root mean square error (RMSE) as evaluation metrics. Among these metrics, reflects the degree to which predicted values explain the variation trend of ground-truth values; MAE characterizes the average level of prediction errors; and RMSE exhibits higher sensitivity to large errors and can indicate the presence of samples with obvious deviations generated by the model. Collectively, these three metrics assess the estimation results of impurity area ratio from the perspectives of trend consistency, average error, and abnormal error sensitivity.
Here, represents the ground-truth impurity area ratio, represents the predicted impurity area ratio, represents the mean value of ground-truth impurity area ratio, and represents the number of samples.
2.6. Development of the Mobile Application for the Intelligent Cotton Grading and Identification System
To promote the practical application of the cotton quality grading method, a mobile application for intelligent cotton grading and identification was designed and developed based on the HarmonyOS platform HarmonyOS 5.1.1 (19). DevEco Studio 5.1.1 was utilized as the core development environment. The front-end interface was built with ArkTS and ArkUI, while Java was adopted to implement partial business logic, realizing functions including cotton sample image acquisition, recognition result presentation, grading standard query, and historical record management. The system applies the architecture of “mobile-side acquisition and display, and server-side model inference”. The mobile application is primarily responsible for image acquisition, image upload, result reception, and visual display, while the AD-UNet impurity segmentation model and CA-ResNet50 color grading model are deployed on the server side.
After users capture cotton sample images, the server sequentially conducts image preprocessing, cotton region extraction, impurity segmentation, color grading, impurity area ratio calculation, and grade mapping, and subsequently returns the recognition results to the mobile application. This design transfers the computationally intensive deep learning inference process to the server side, which reduces the hardware burden on mobile devices and facilitates subsequent model updates and unified maintenance. Multi-device test results demonstrated that, under a stable network environment, the system required an average of approximately 0.8 s to complete the entire process of image upload, model inference, and result feedback for a single image. This response speed satisfies the requirements for rapid cotton sample identification and provides mobile application support for intelligent cotton quality grading.
3. Results and Analysis
3.1. Experimental Environment and Settings
To systematically verify the practicality of the proposed “background segmentation–dual-branch grading” intelligent cotton quality identification system, a comprehensive evaluation was performed from three core dimensions: segmentation accuracy, grading performance, and engineering adaptability. All experiments were conducted under identical experimental environments, parameter settings, and datasets. The hardware environment includes an Intel six-core Xeon Gold 6142 CPU and an NVIDIA RTX 3080 GPU, while the software environment comprises Python 3.9.18, PyTorch 2.0.1, and CUDA 11.8. All models were trained on the annotated dataset constructed in this study, with consistent training parameters maintained to guarantee the objectivity and comparability of experimental results.
In the overall system, background segmentation acts as a prerequisite step for subsequent color grading and impurity grading. The U-Net segmentation model was adopted to segment input cotton images, achieving an IoU of 99% and a Dice coefficient of 99%. Based on the segmentation outputs, parallel tasks of cotton color grading and cotton impurity grading were implemented. All subsequent ablation comparisons were conducted based on the segmented cotton regions.
3.2. Results and Analysis of Cotton Color Grading
3.2.1. Ablation Experiment on the Improvement Mechanism of the Cotton Color Grading Network
To further verify the effect of background segmentation on the color grading task, this study first compared the recognition performance of the baseline ResNet50 under two input conditions: original images and segmented cotton region images. The corresponding results are presented in Table 1. When segmented cotton region images were used as input, the precision of the model increased from 87.1% to 89.2%, recall rose from 87.6% to 89.0%, and the -Score improved from 87.4% to 89.1%. These results demonstrate that background segmentation can mitigate the influence of imaging backgrounds on color discrimination to a certain extent, enabling the model to more effectively focus on learning color features from the primary cotton regions.
Table 1.
Effect of background segmentation on cotton color grading performance.
To address the challenges of subtle color differences and high susceptibility to local shadow interference in cotton color grading, this study adopted ResNet50 as the baseline network. In terms of training strategies, the AdamW optimizer was utilized to optimize the parameter update process. In terms of network structure, the ECA channel attention mechanism was embedded into the residual blocks of ResNet50. To validate the effectiveness of different improvement strategies, three experimental settings were established: the ResNet50 baseline, the ResNet50 model with the AdamW optimization strategy, and the improved model integrated with both the AdamW optimizer and the ECA channel attention mechanism. Ablation experiments were carried out accordingly. The results are summarized in Table 2.
Table 2.
Ablation results of the improved ResNet50 model for cotton color grading. Note: “√” indicates that the corresponding component was included in the model.
The three model configurations described above were tested on the same test set. As indicated by the ablation results presented in Table 2, the baseline ResNet50 yielded a precision of 89.2%, a recall of 89.0%, and an -Score of 89.1% in the cotton color grading task, demonstrating that the model can complete basic color grade recognition but retains room for improvement in capturing fine-grained color differences. With the network architecture kept unchanged, the introduction of the AdamW optimization strategy improved the three metrics to 90.0%, 89.6%, and 89.8%, respectively. This finding indicates that decoupled weight decay and adaptive learning rate updating optimize the parameter optimization process, enabling the network to learn color grade-related features more stably; nevertheless, the performance improvement achieved solely by training strategy optimization remains limited. After the further integration of the ECA channel attention mechanism, the model attained a precision of 94.9%, a recall of 94.8%, and an -Score of 94.8%, corresponding to increases of 5.7, 5.8, and 5.7 percentage points relative to the baseline ResNet50, and increases of 4.9, 5.2, and 5.0 percentage points compared with the AdamW-only configuration. These results suggest that the ECA module enhances color-discriminative feature responses via channel recalibration and mitigates the interference of non-target factors, including local textures and shadows, on color discrimination. Overall, AdamW primarily enhances the stability of parameter updating during model training, while ECA strengthens the feature representation capability for color features. The integration of the two methods further boosts the overall recognition performance of the cotton color grading model.
3.2.2. Comparison and Analysis of Cotton Color Grading Models
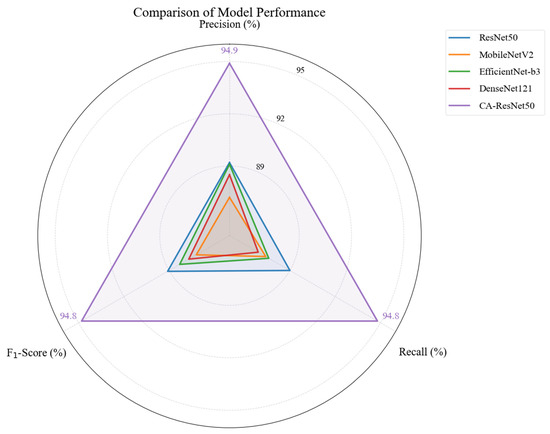
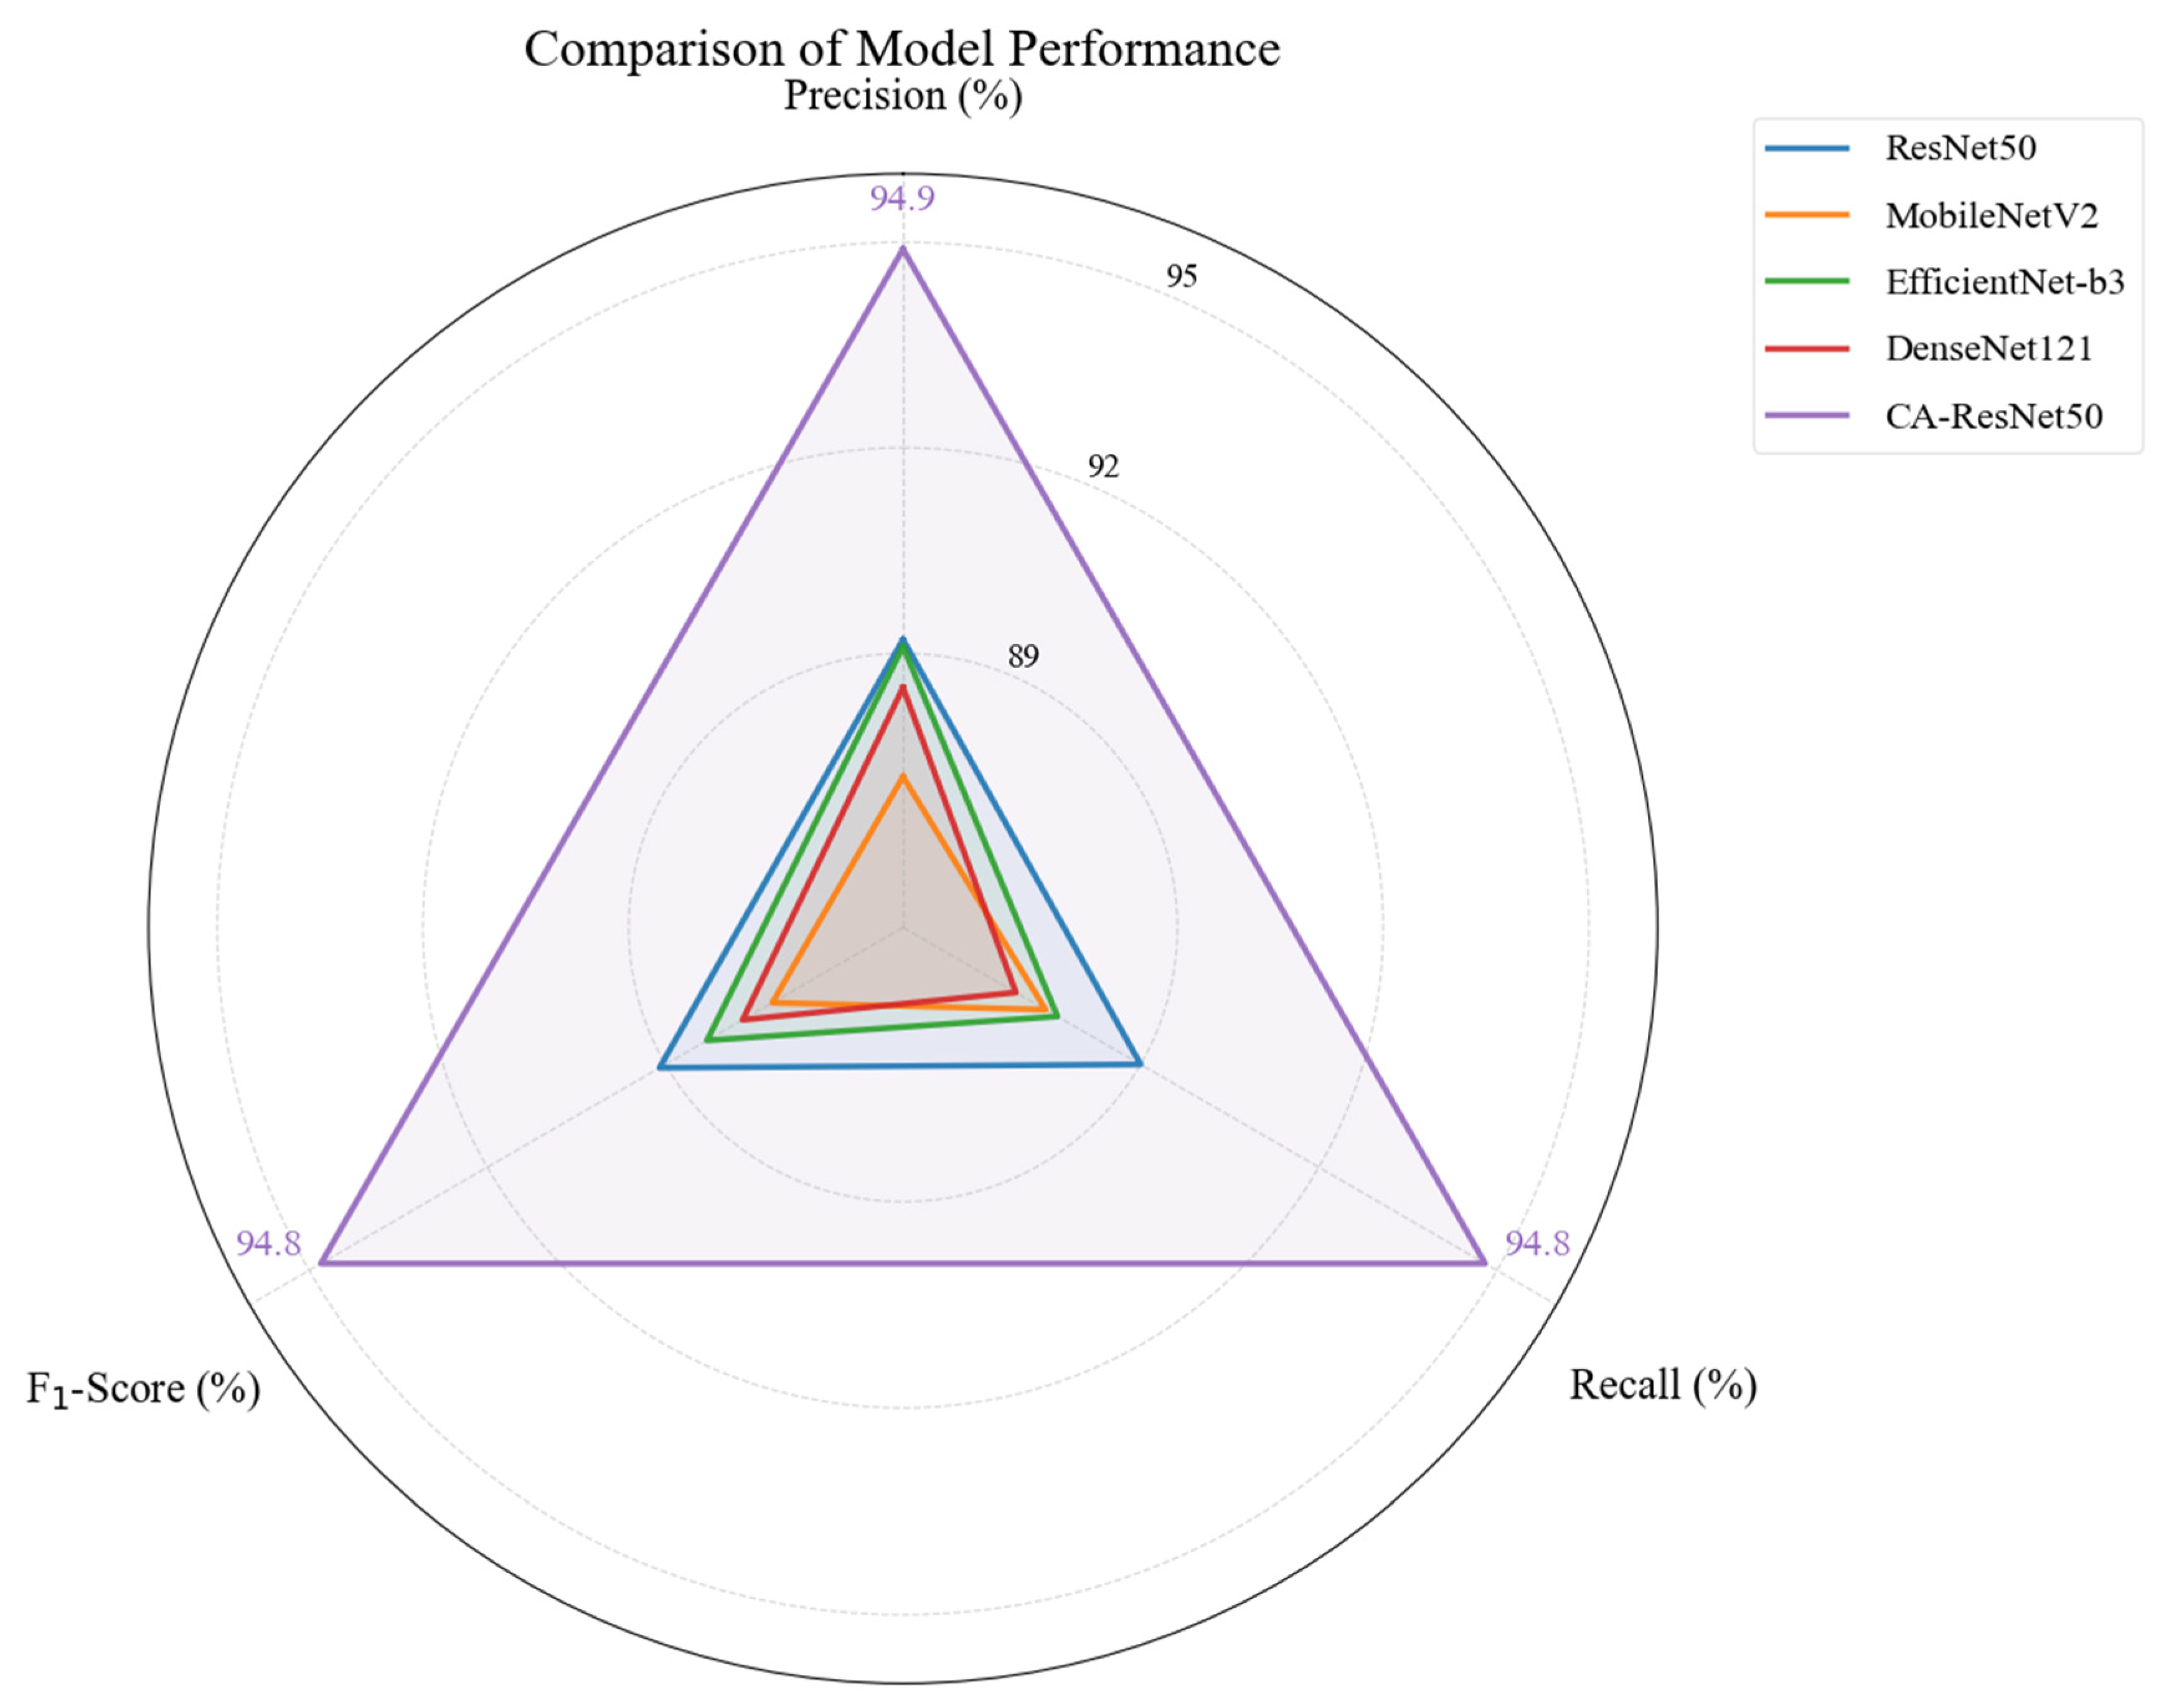
To investigate the adaptability of different classical convolutional networks to the cotton color grading task, this study conducted a horizontal comparison of four mainstream baseline classification models, namely ResNet50, MobileNetV2 [27], EfficientNet-B3 [28], and DenseNet121 [29], under identical dataset and experimental conditions. The experimental results are presented in Figure 8 and Table 3. The results indicate that among the baseline models without structural modification or training strategy optimization, ResNet50 achieved the optimal overall performance, with a precision of 89.2%, a recall of 89.0%, and an -Score of 89.1%. All three metrics were higher than those of the other comparative networks, demonstrating that ResNet50 delivers more stable feature representation for subtle color differences in cotton. EfficientNet-B3 and DenseNet121 achieved the second-best overall performance, yet exhibited weaker stability in fine-grained color discrimination compared with ResNet50. The lightweight architecture MobileNetV2 presents limited feature representation capability and relatively inferior overall recognition performance.
Figure 8.
Radar chart of color grading results for different models.
Table 3.
Cotton color grading results of different models.
In addition to the comparison of mainstream baseline models, this study further optimized the color grading performance of the baseline network by adopting ResNet50 as the backbone architecture. The improved model integrated with the ECA channel attention mechanism and the AdamW optimizer is denoted as CA-ResNet50. The test results reveal that CA-ResNet50 achieved a precision of 94.9%, a recall of 94.8%, and an -Score of 94.8%. Compared with the baseline ResNet50, its precision, recall, and -Score increased by 5.7, 5.8, and 5.7 percentage points, respectively. The overall recognition performance was substantially enhanced, with all quantitative metrics distinctly superior to those of all baseline classification models involved in the comparison.
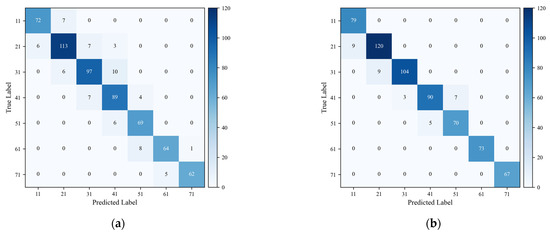
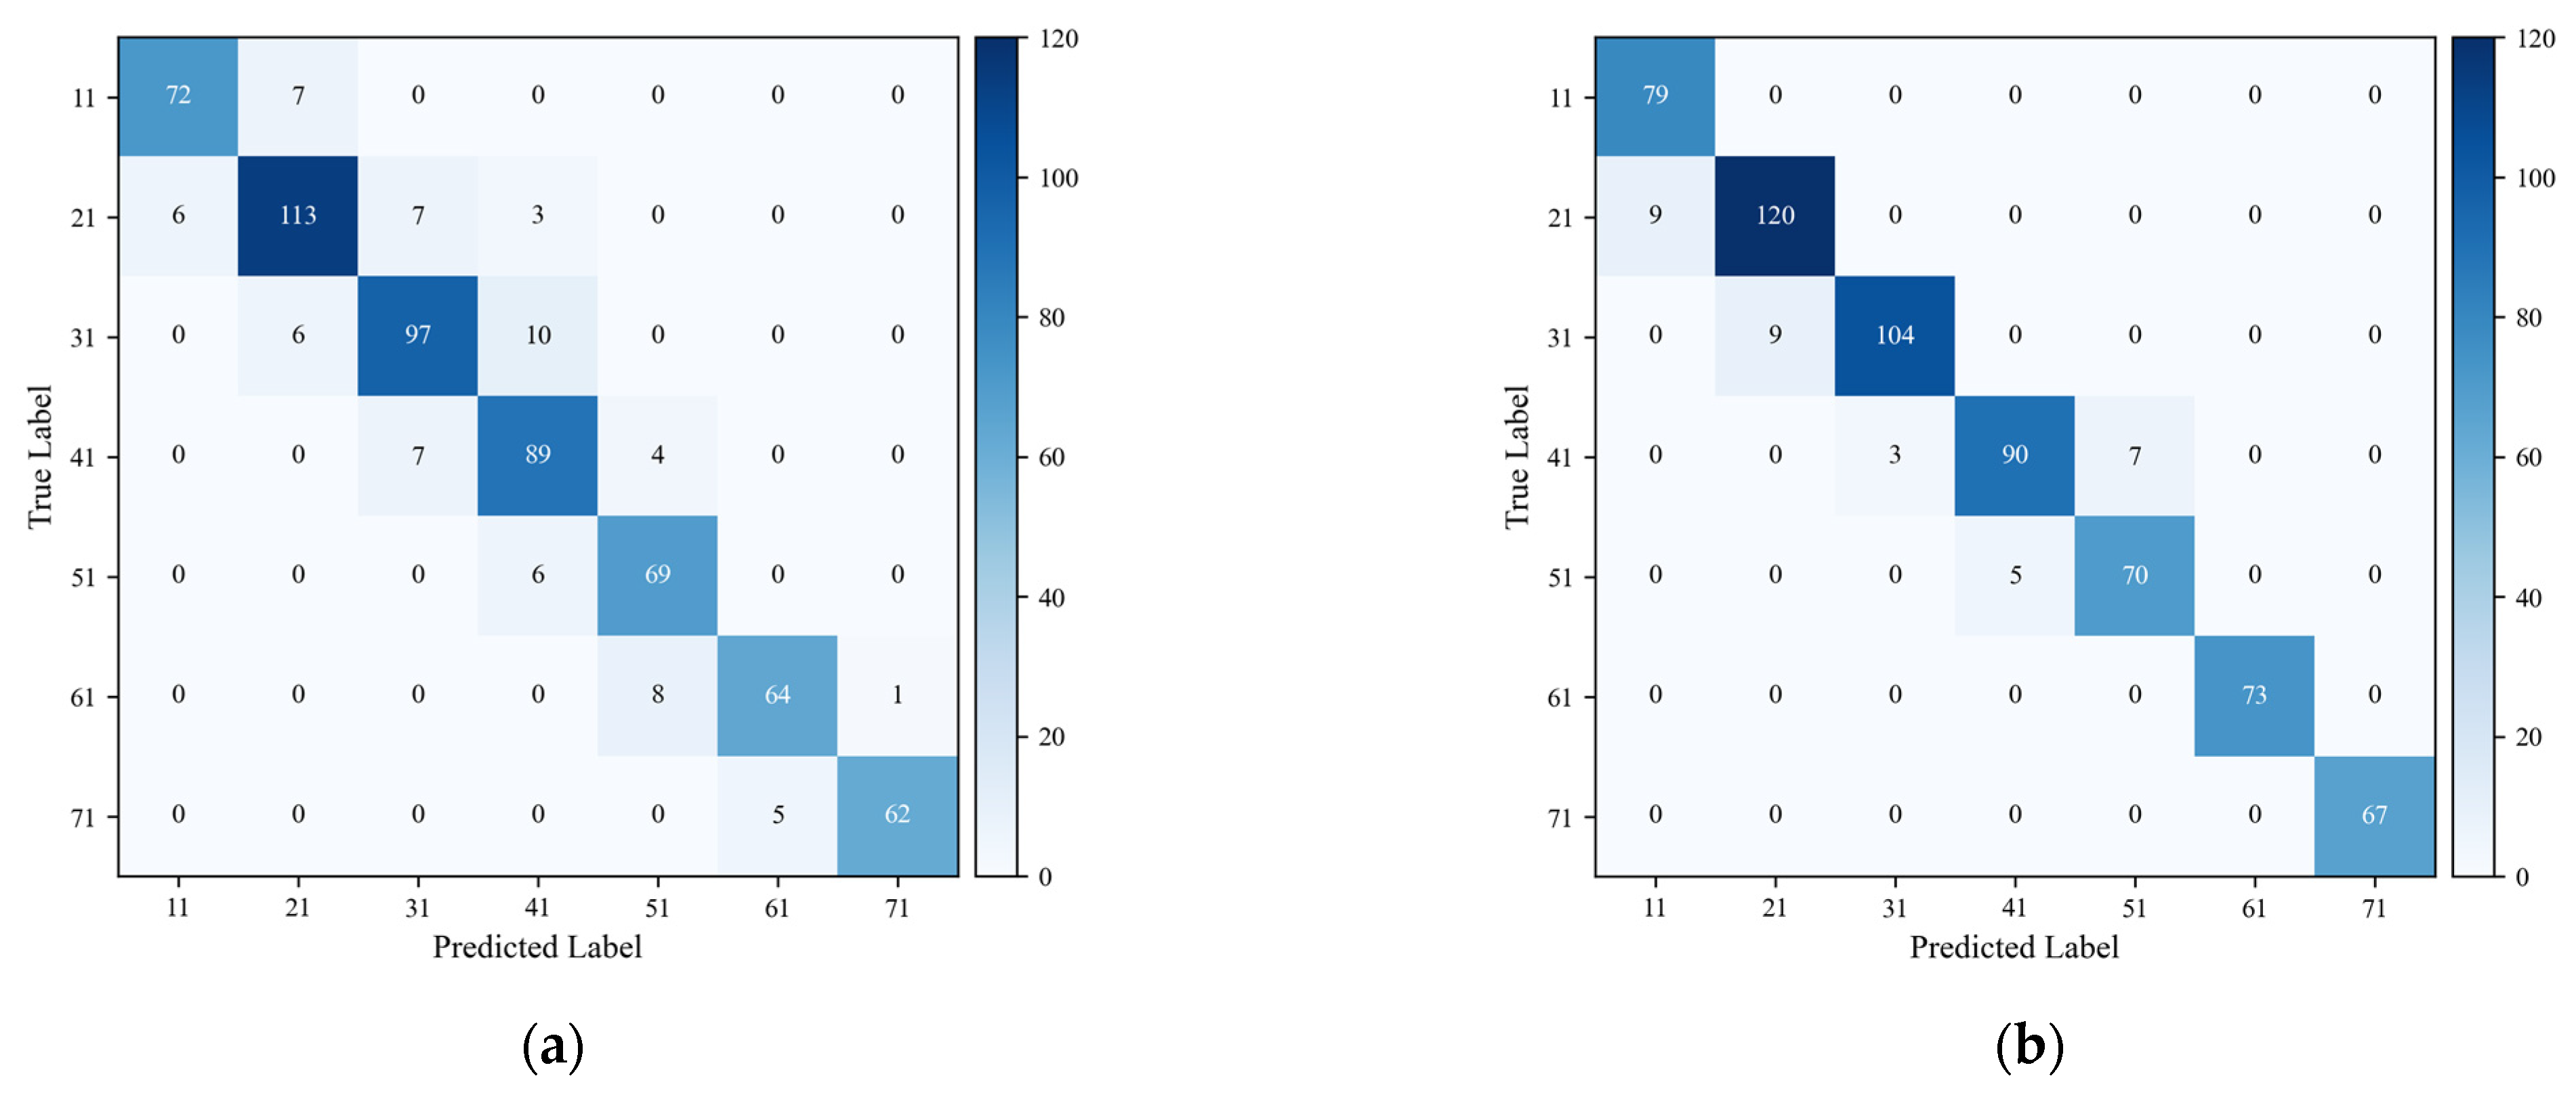
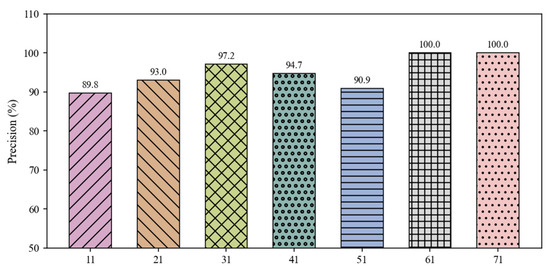
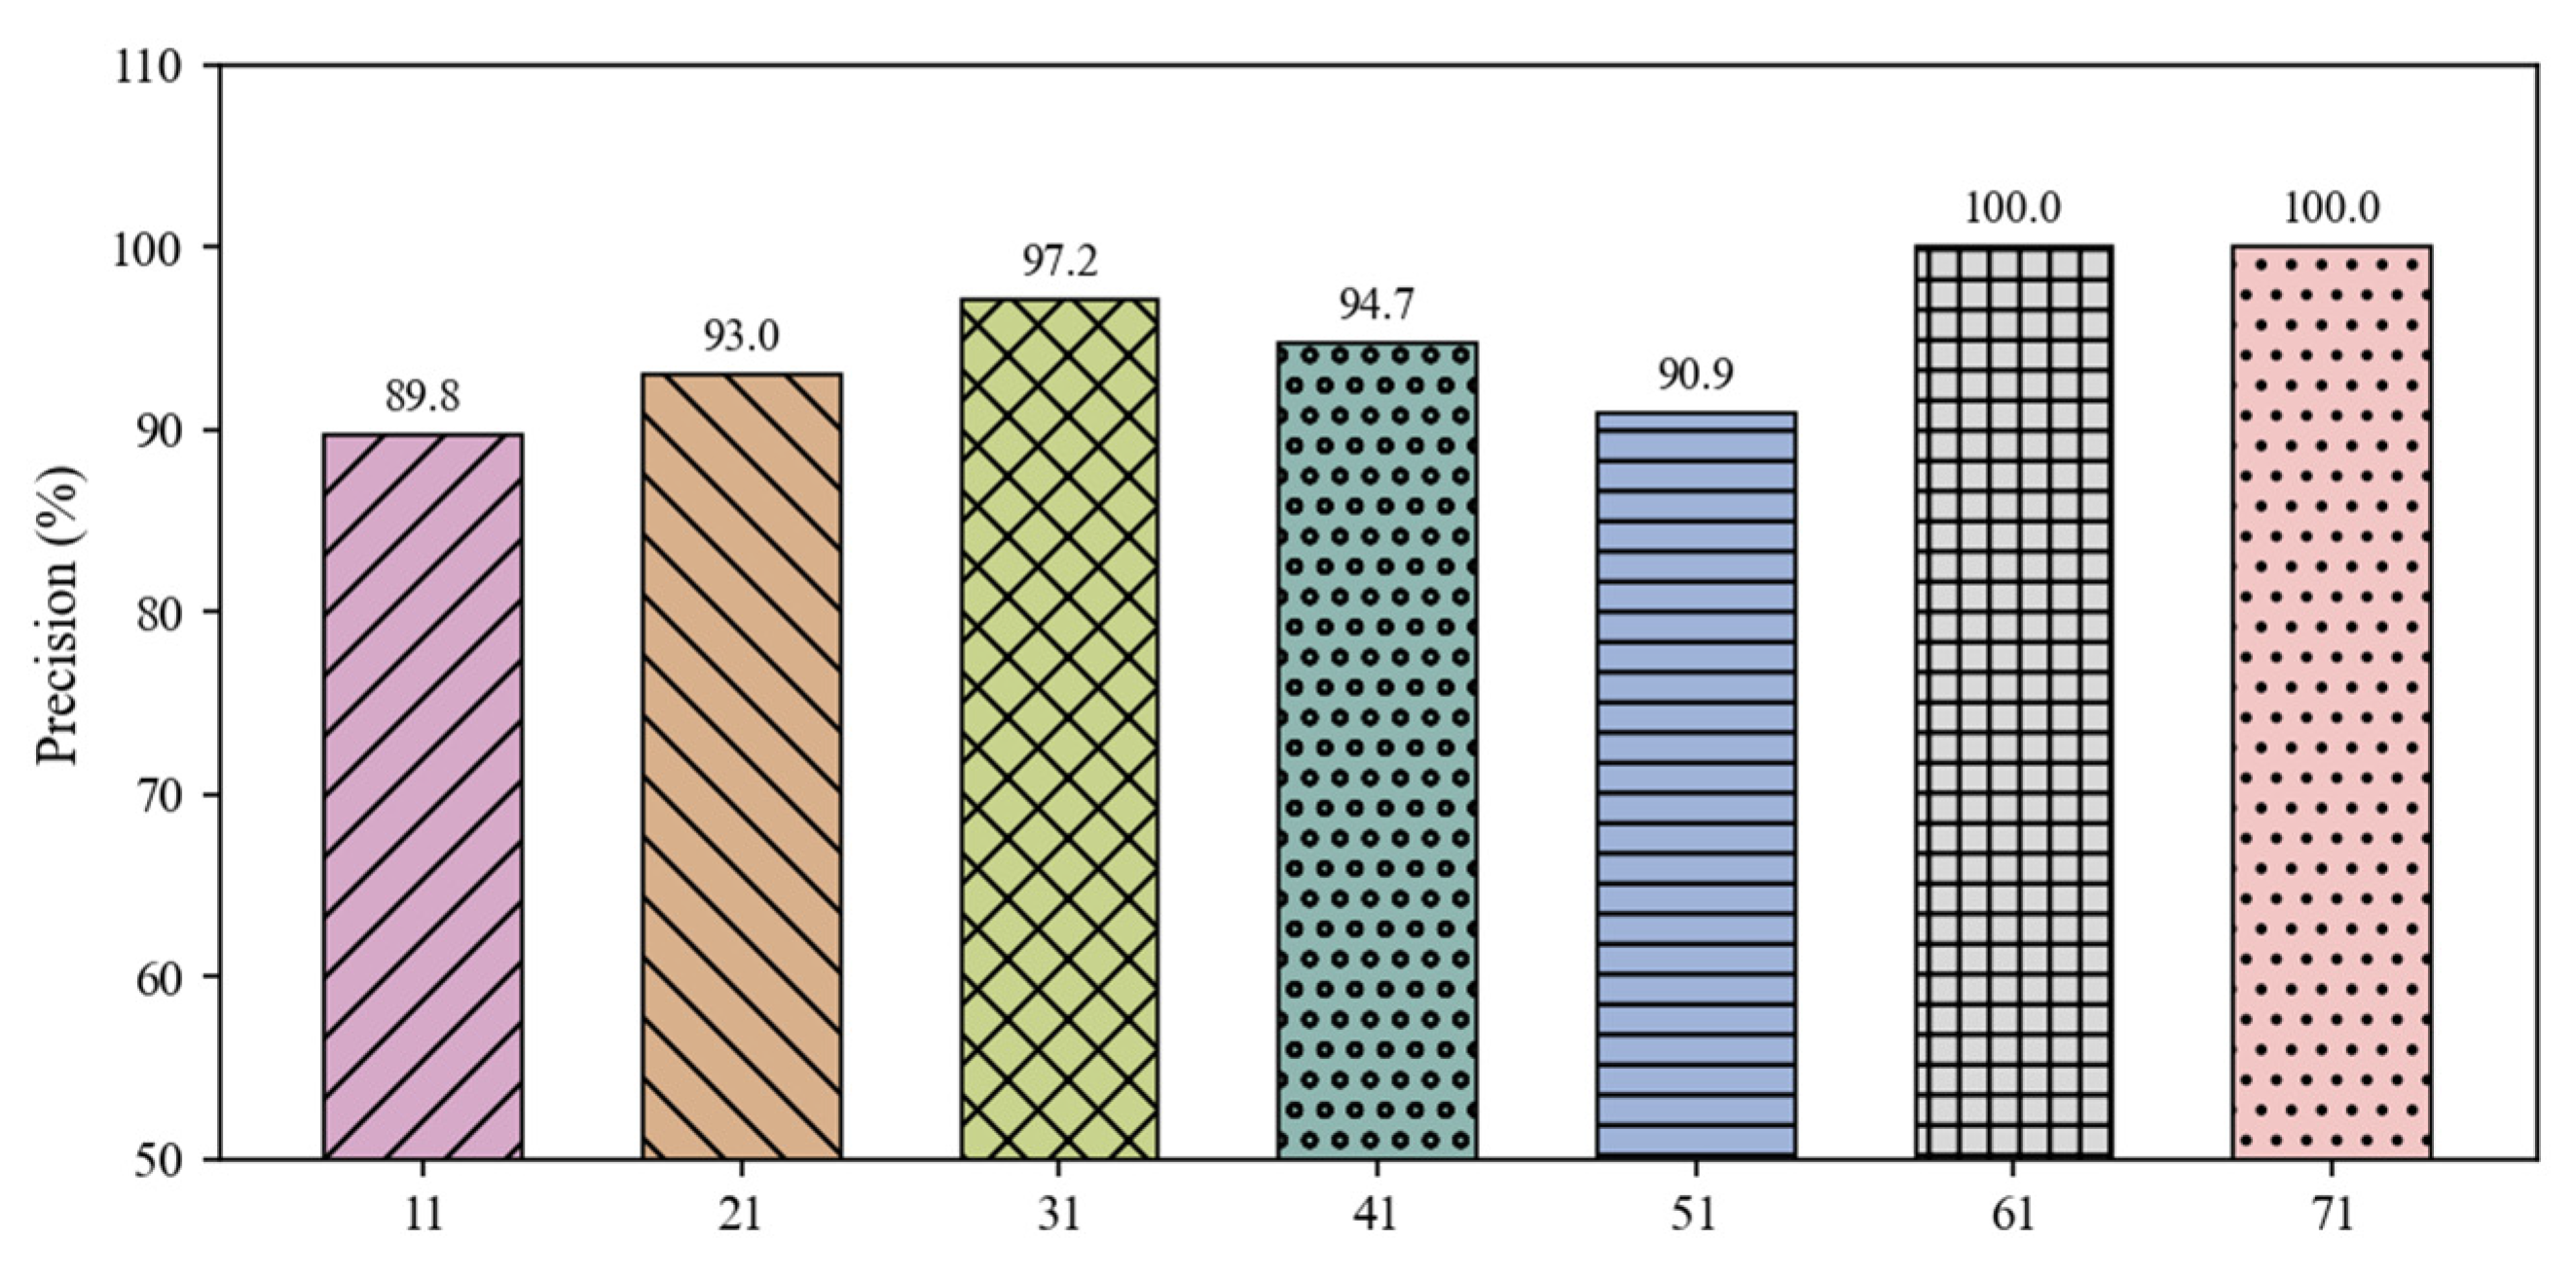
To further analyze the model’s misclassification distribution and its recognition performance for each color grade, a confusion matrix and per-class recognition precision were adopted for evaluation. The corresponding results are illustrated in Figure 9 and Figure 10, respectively. As shown in Figure 9, the misclassified samples of CA-ResNet50 were mainly concentrated between adjacent color grades, with no obvious cross-grade misclassification observed. This finding suggests that subtle color differences between adjacent grades remain the primary challenge for model recognition, while the model possesses a robust discriminative capability for color grades with larger differences. Combined with the results in Figure 10, CA-ResNet50 maintained a high recognition rate for most color grades, which verifies that the improved model achieves relatively stable recognition performance across different categories. The confusion matrix and per-class recognition precision results further demonstrate that the improved model enhances the representation of color-discriminative features and strengthens the capability to distinguish subtle color differences in cotton, thereby improving the overall recognition performance in the color grading task.
Figure 9.
Confusion matrices of color grading results before and after model improvement. (a) ResNet50 confusion matrix; (b) CA-ResNet50 confusion matrix.
Figure 10.
Bar chart of color grading results obtained by the CA-ResNet50 model.
3.3. Results and Analysis of Cotton Impurity Grading
3.3.1. Ablation Experiment on the Improvement Mechanism of the Impurity Segmentation Network
To address the challenges of large-scale variation, irregular morphology, and low foreground-background contrast in cotton impurity segmentation, this study incorporated the ASPP multi-scale contextual modeling module and the DySample adaptive upsampling mechanism into the original U-Net network. Four model configurations with single-module and multi-module combinations were tested, and the experimental results are presented in Table 4.
Table 4.
Cotton impurity segmentation results based on the improved U-Net model. Note: “√” indicates that the corresponding component was included in the model.
The experimental results demonstrated that ASPP constructed multi-scale receptive fields through parallel atrous convolutions and strengthened multi-scale contextual modeling without reducing feature resolution. This design could enable the network to simultaneously perceive the morphological features of large cotton clusters and small impurities, thereby mitigating the feature loss caused by target scale variation. DySample replaced traditional interpolation with a dynamic sampling mechanism and adaptively optimized the upsampling process according to feature map content, allowing the network to accurately recover edge details between cotton and impurities and promote spatial detail reconstruction during upsampling. Through the collaborative optimization of ASPP-based multi-scale feature extraction and DySample-based dynamic upsampling, the proposed model improved the segmentation accuracy of low-contrast and multi-scale impurity targets while maintaining high computational efficiency, and optimized the segmentation quality of impurity boundaries. Compared with the models equipped with a single improvement module, the final AD-UNet achieved further performance improvements, with a precision of 89.3%, a recall of 88.1%, and a Dice coefficient of 88.5%. These results verify the effectiveness of the collaborative optimization of multi-scale features and dynamic upsampling.
3.3.2. Comparison and Analysis of Impurity Segmentation Models
For the cotton impurity segmentation task, this study conducted a comparative evaluation of U-Net, U-Net++ [30], and classical semantic segmentation models including DeepLabv3 [31] and HRNet [32]. As indicated by the quantitative metrics in Table 5, U-Net delivered relatively balanced performance in this task and outperformed most comparative models in terms of precision, IoU, and Dice coefficient, achieving a precision of 87.8%, a recall of 86.1%, and a Dice coefficient of 86.9%. U-Net++ enhanced multi-scale feature fusion between the encoder and decoder via nested skip connections. To further explore the effects of different encoder backbones on impurity segmentation performance, ResNet34, ResNet50, and EfficientNet-B3 served as the encoders of U-Net++, forming three variant models: U-Net++_ResNet34, U-Net++_ResNet50, and U-Net++_EfficientNet-B3. Among these variants, U-Net++_ResNet34 achieved a relatively high precision, while U-Net++_EfficientNet-B3 presented superior IoU and Dice coefficient values. Nevertheless, none of the three variants outperformed the original U-Net in overall performance.
Table 5.
Cotton impurity segmentation results of different models.
DeepLabv3 and HRNet exhibited poor adaptability to cotton impurity targets, with IoU values below 63% and Dice coefficients of only approximately 76%, which could indicate their limited adaptability to low-contrast small targets and irregular impurity regions. The comparative results demonstrate that different semantic segmentation architectures present significant differences in feature extraction capability for low-contrast and multi-scale impurity targets, and U-Net is more suitable for cotton impurity detection in terms of segmentation accuracy and regional overlap performance.
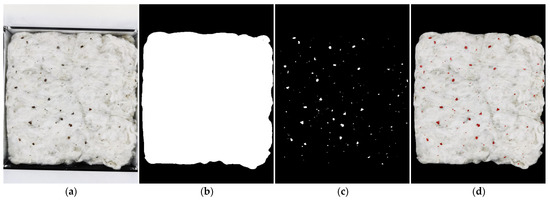
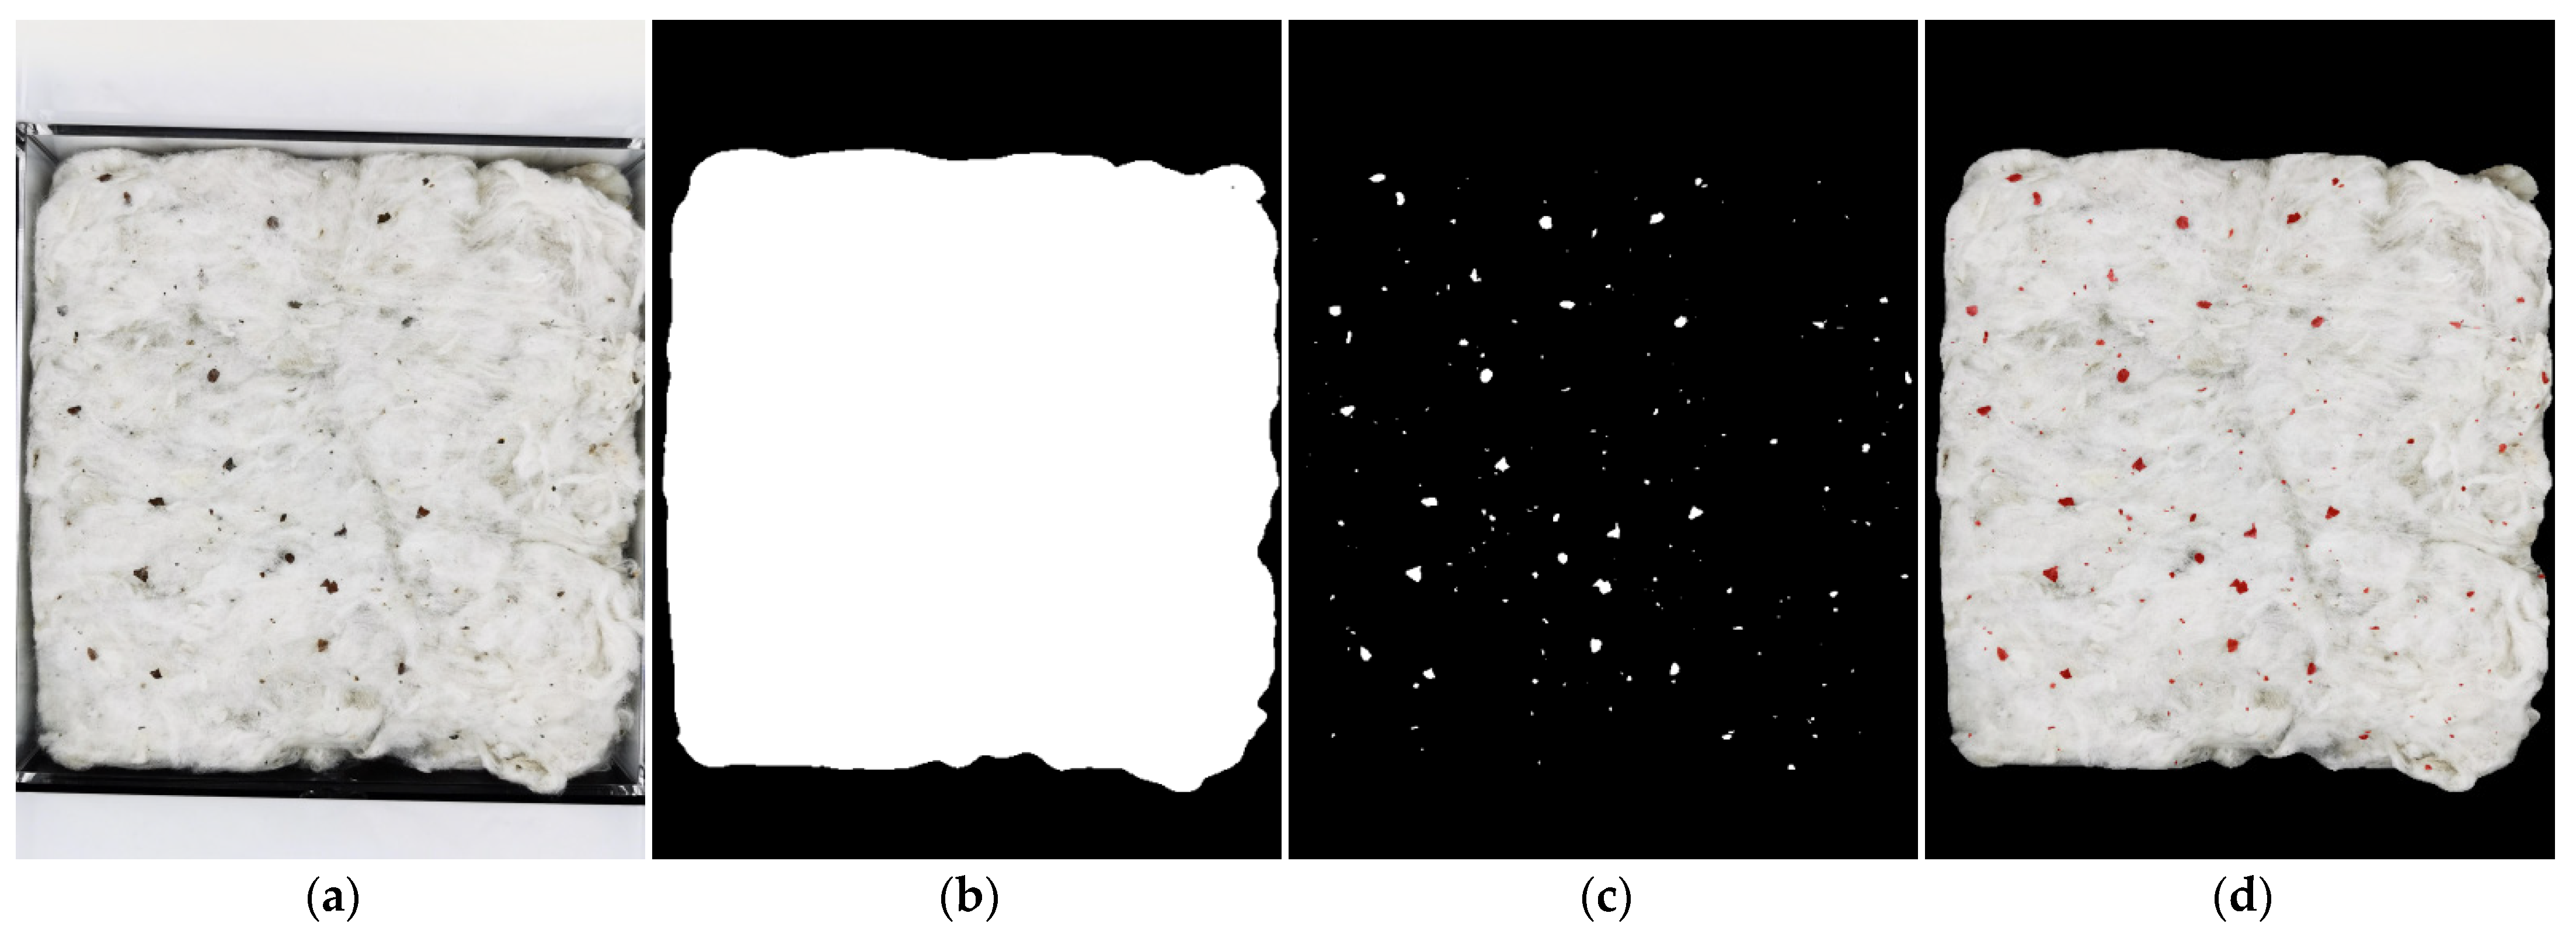
To further compensate for the limitations of the baseline network and enhance the segmentation performance for multi-scale impurities and weak-boundary targets, this study adopted U-Net as the base architecture and integrates the ASPP multi-scale feature module and the DySample adaptive upsampling mechanism to construct an improved segmentation model, namely AD-UNet. Compared with the baseline U-Net, AD-UNet achieved comprehensive improvements in all metrics, with precision, recall, IoU, and Dice coefficient increased by 1.5, 2.0, 2.4, and 1.6 percentage points, respectively. The improved model effectively strengthened the recognition of impurity regions, regional overlap, and segmentation consistency, delivering more stable segmentation results for the subsequent estimation of impurity area ratio and cotton impurity grade determination based on the impurity area ratio (Figure 11).
Figure 11.
Results of the cotton grading and identification process. (a) Original image; (b) cotton/background segmentation mask; (c) impurity segmentation mask; (d) impurity segmentation result.
3.3.3. Results and Analysis of Cotton Impurity Grading Based on AD-UNet
After completing the segmentation of the cotton foreground region and impurity targets, the ratio of the pixel area of impurities to the pixel area of effective cotton regions was adopted as the quantitative basis for calculating the impurity area ratio. Grading thresholds were determined in accordance with the impurity content intervals specified in the U.S. cotton impurity grading standard, thereby realizing the intelligent grading of cotton impurities. The impurity area ratio was calculated as follows:
where R_imp denotes the impurity area ratio, A_imp denotes the pixel area of impurities, and A_cotton denotes the pixel area of the effective cotton region. Based on the calculated R_imp, each cotton sample was mapped to the corresponding upland cotton impurity grade. The specific thresholds are listed in Table 6.
Table 6.
Mapping relationship between upland cotton impurity grade and impurity area ratio.
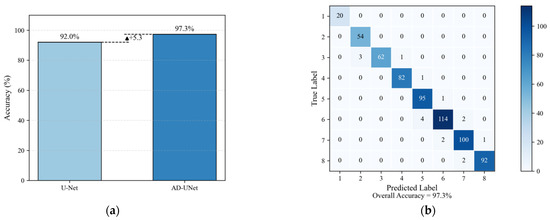
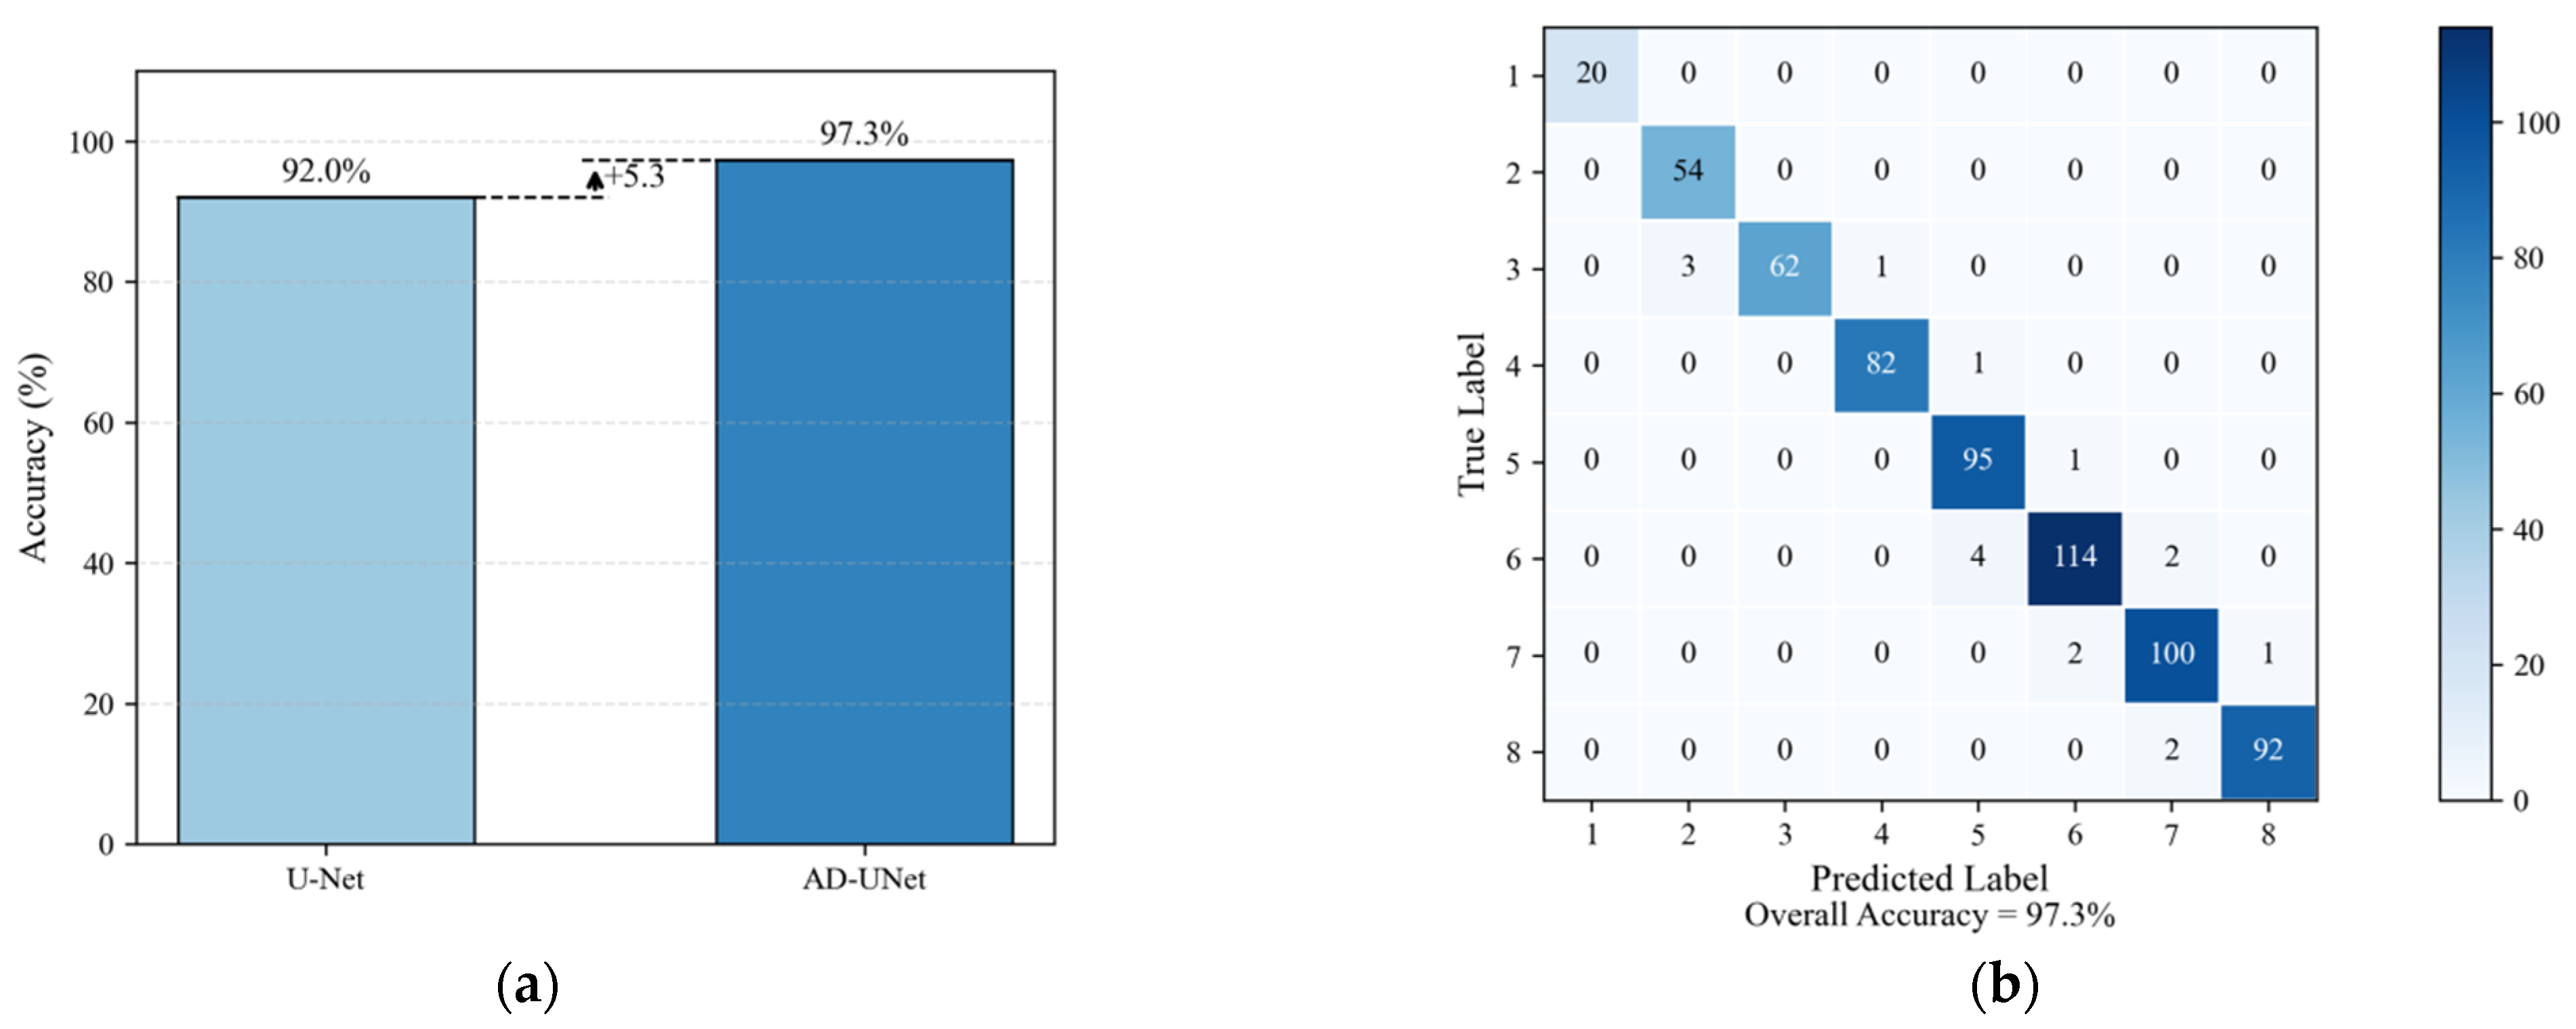
To verify the effectiveness of the segmentation results applied to the cotton impurity grading task, the impurity grades predicted by the model on the test set were compared with the manually annotated ground-truth grades, and misclassification cases were further analyzed via the impurity grading confusion matrix. The experimental results show that the overall accuracy of impurity grade recognition based on the improved U-Net segmentation model reached 97.3%. The confusion matrix analysis reveals that misclassified samples of impurity grading were concentrated in adjacent grade intervals without severe cross-grade misclassifications, indicating that the grading errors could be within a controllable range. These findings demonstrate that the proposed intelligent cotton impurity grading model based on AD-UNet can satisfy the practical application requirements of intelligent cotton impurity grading (Figure 12).
Figure 12.
Confusion matrix of impurity grading results obtained by the AD-UNet model. (a) Comparison of impurity grading accuracy. (b) Confusion matrix of AD-UNet.
3.3.4. Error Analysis of Impurity Area Ratio Estimation and Threshold-Mapping-Based Grading
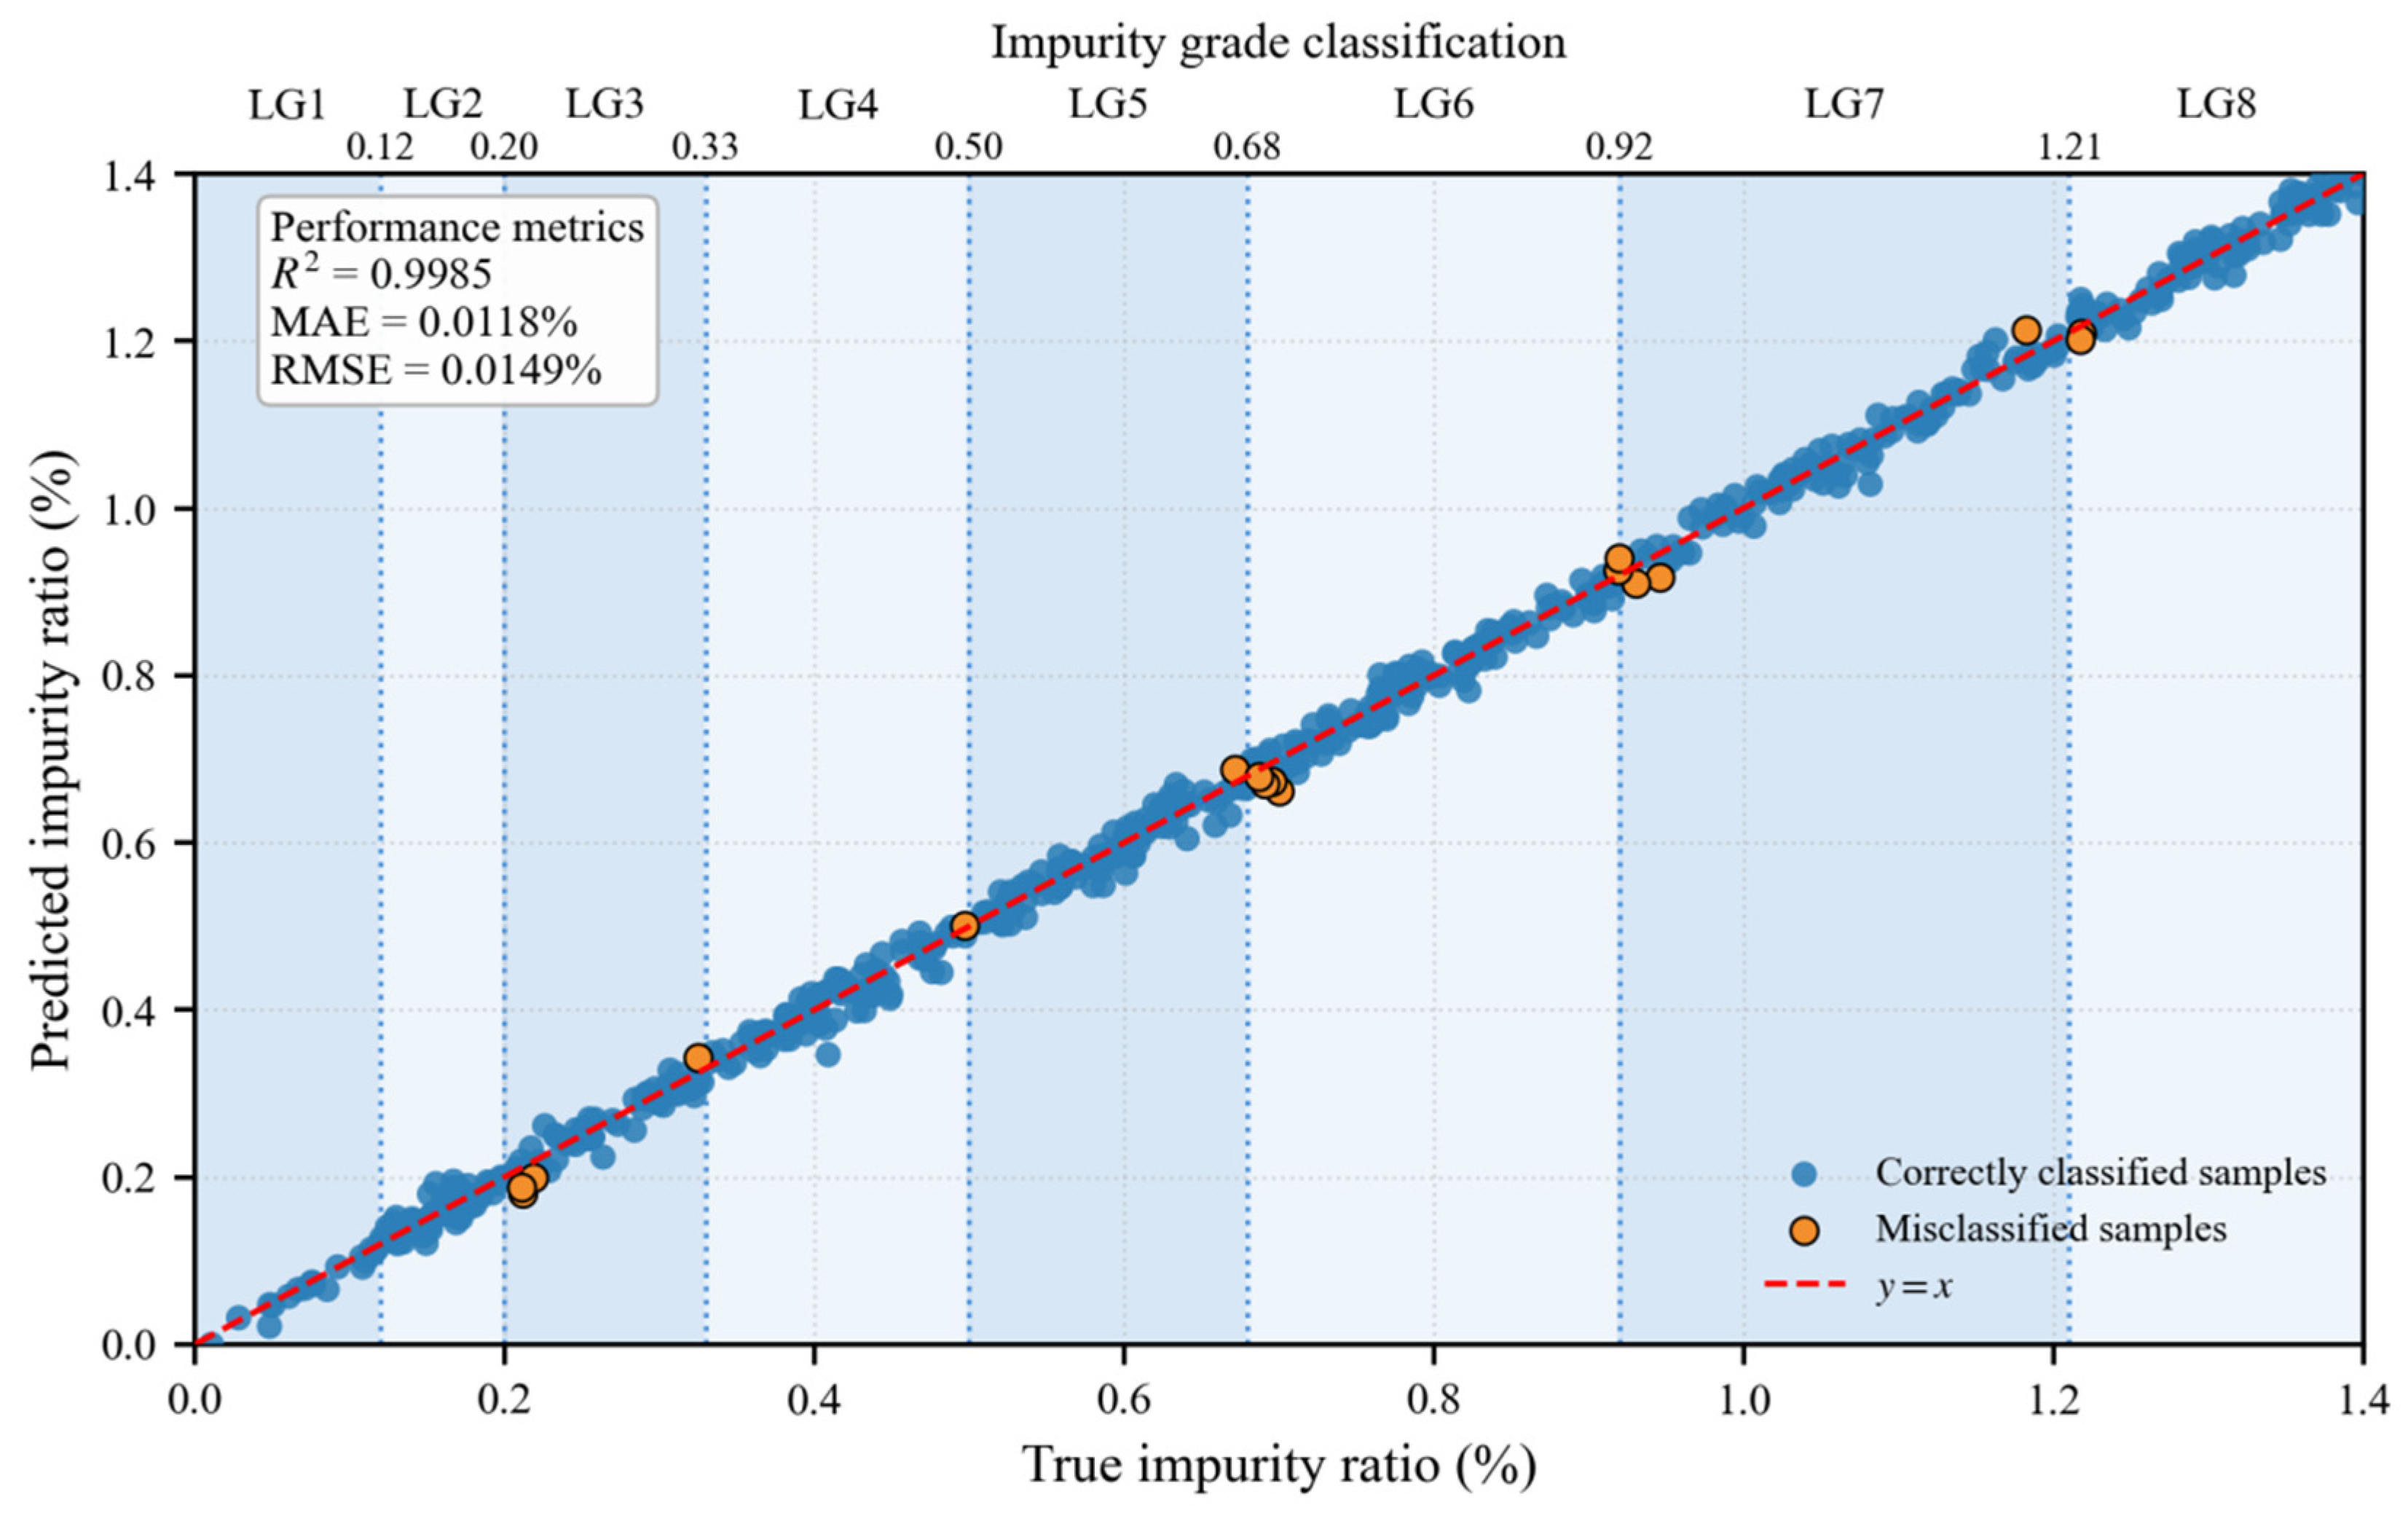
To further validate the impurity area ratio estimation results derived from the segmentation area ratio method, this study plotted the correlation between the ground-truth and predicted impurity area ratios, as shown in Figure 13. As illustrated in the figure, the scatter points corresponding to the predicted and ground-truth impurity area ratios are generally distributed along the reference line , indicating a high consistency between the model-predicted impurity area ratios and the manually annotated results. The quantitative results demonstrate that the coefficient of determination between the two reached 0.9985, which suggests that the predicted impurity area ratio can effectively reflect the variation trends of ground-truth impurity area ratio. The MAE was 0.0118 percentage points, and the RMSE was 0.0149 percentage points, indicating that the model exhibits a relatively low overall numerical deviation in impurity area ratio estimation. The minor discrepancy between RMSE and MAE values reveals that the estimation errors are not dominated by a small number of abnormal samples, which verifies the general stability of the model prediction results.
Figure 13.
Relationship between ground-truth and predicted impurity area ratios obtained by AD-UNet.
In terms of sample distribution, most correctly graded samples were concentrated near the reference line , with their predicted and ground-truth impurity area ratios falling within identical grade intervals. A small number of misclassified samples were primarily distributed around grade thresholds, especially on both sides of the boundary between adjacent grade intervals. This phenomenon indicates that when the ground-truth impurity area ratio is close to a grade boundary, even a minor deviation between the predicted impurity area ratio and the ground-truth value can cause the sample to cross the threshold and be categorized into an adjacent grade. Therefore, the final grading errors did not stem from systemic failures in impurity area ratio estimation but are mainly attributed to the boundary sensitivity of samples near grade thresholds.
To further clarify the correlation between impurity area ratio estimation errors and final grade determination, a threshold-boundary distance analysis was adopted in this study. For each sample, the distance between its ground-truth impurity area ratio and the nearest grade threshold was calculated and compared with the absolute error of the predicted impurity area ratio. Specifically, if the prediction error is smaller than the nearest threshold distance of a sample, the sample can maintain its original grade assignment despite the existence of a minor impurity area ratio estimation error. The analysis results indicated that the average estimation error across all samples was 0.0118 percentage points, while the average nearest-threshold distance was 0.0590 percentage points, approximately 5.0 times the average estimation error. Among all samples, 573 yielded prediction errors smaller than their nearest-threshold distances, accounting for 90.09% of all samples, thereby indicating relatively stable grade assignments of most samples.
As revealed by further analysis, all grading errors were concentrated in samples with a nearest-threshold distance not exceeding 0.030 percentage points. When the distance between the ground-truth impurity area ratio and the nearest grade threshold exceeded 0.030 percentage points, the grading accuracy reached 100%. This result aligns with the observation (Figure 13) that misclassified samples were mainly distributed near grade boundaries, indicating that although impurity segmentation errors affect impurity area ratio estimation, they change the final grading result only when the error causes the predicted impurity area ratio to cross a grade threshold. This finding also explains why the final impurity grading accuracy based on impurity area ratio threshold mapping reached 97.3% despite certain errors in pixel-level impurity segmentation. As indicated by the high , low MAE and RMSE, and the results of threshold-boundary distance analysis, the model achieved generally stable estimation of the impurity area ratio, and the cotton impurity grading method based on impurity area ratio threshold mapping exhibited good feasibility and result reliability on this dataset.
3.4. Application Implementation of the Intelligent Cotton Grading and Identification System
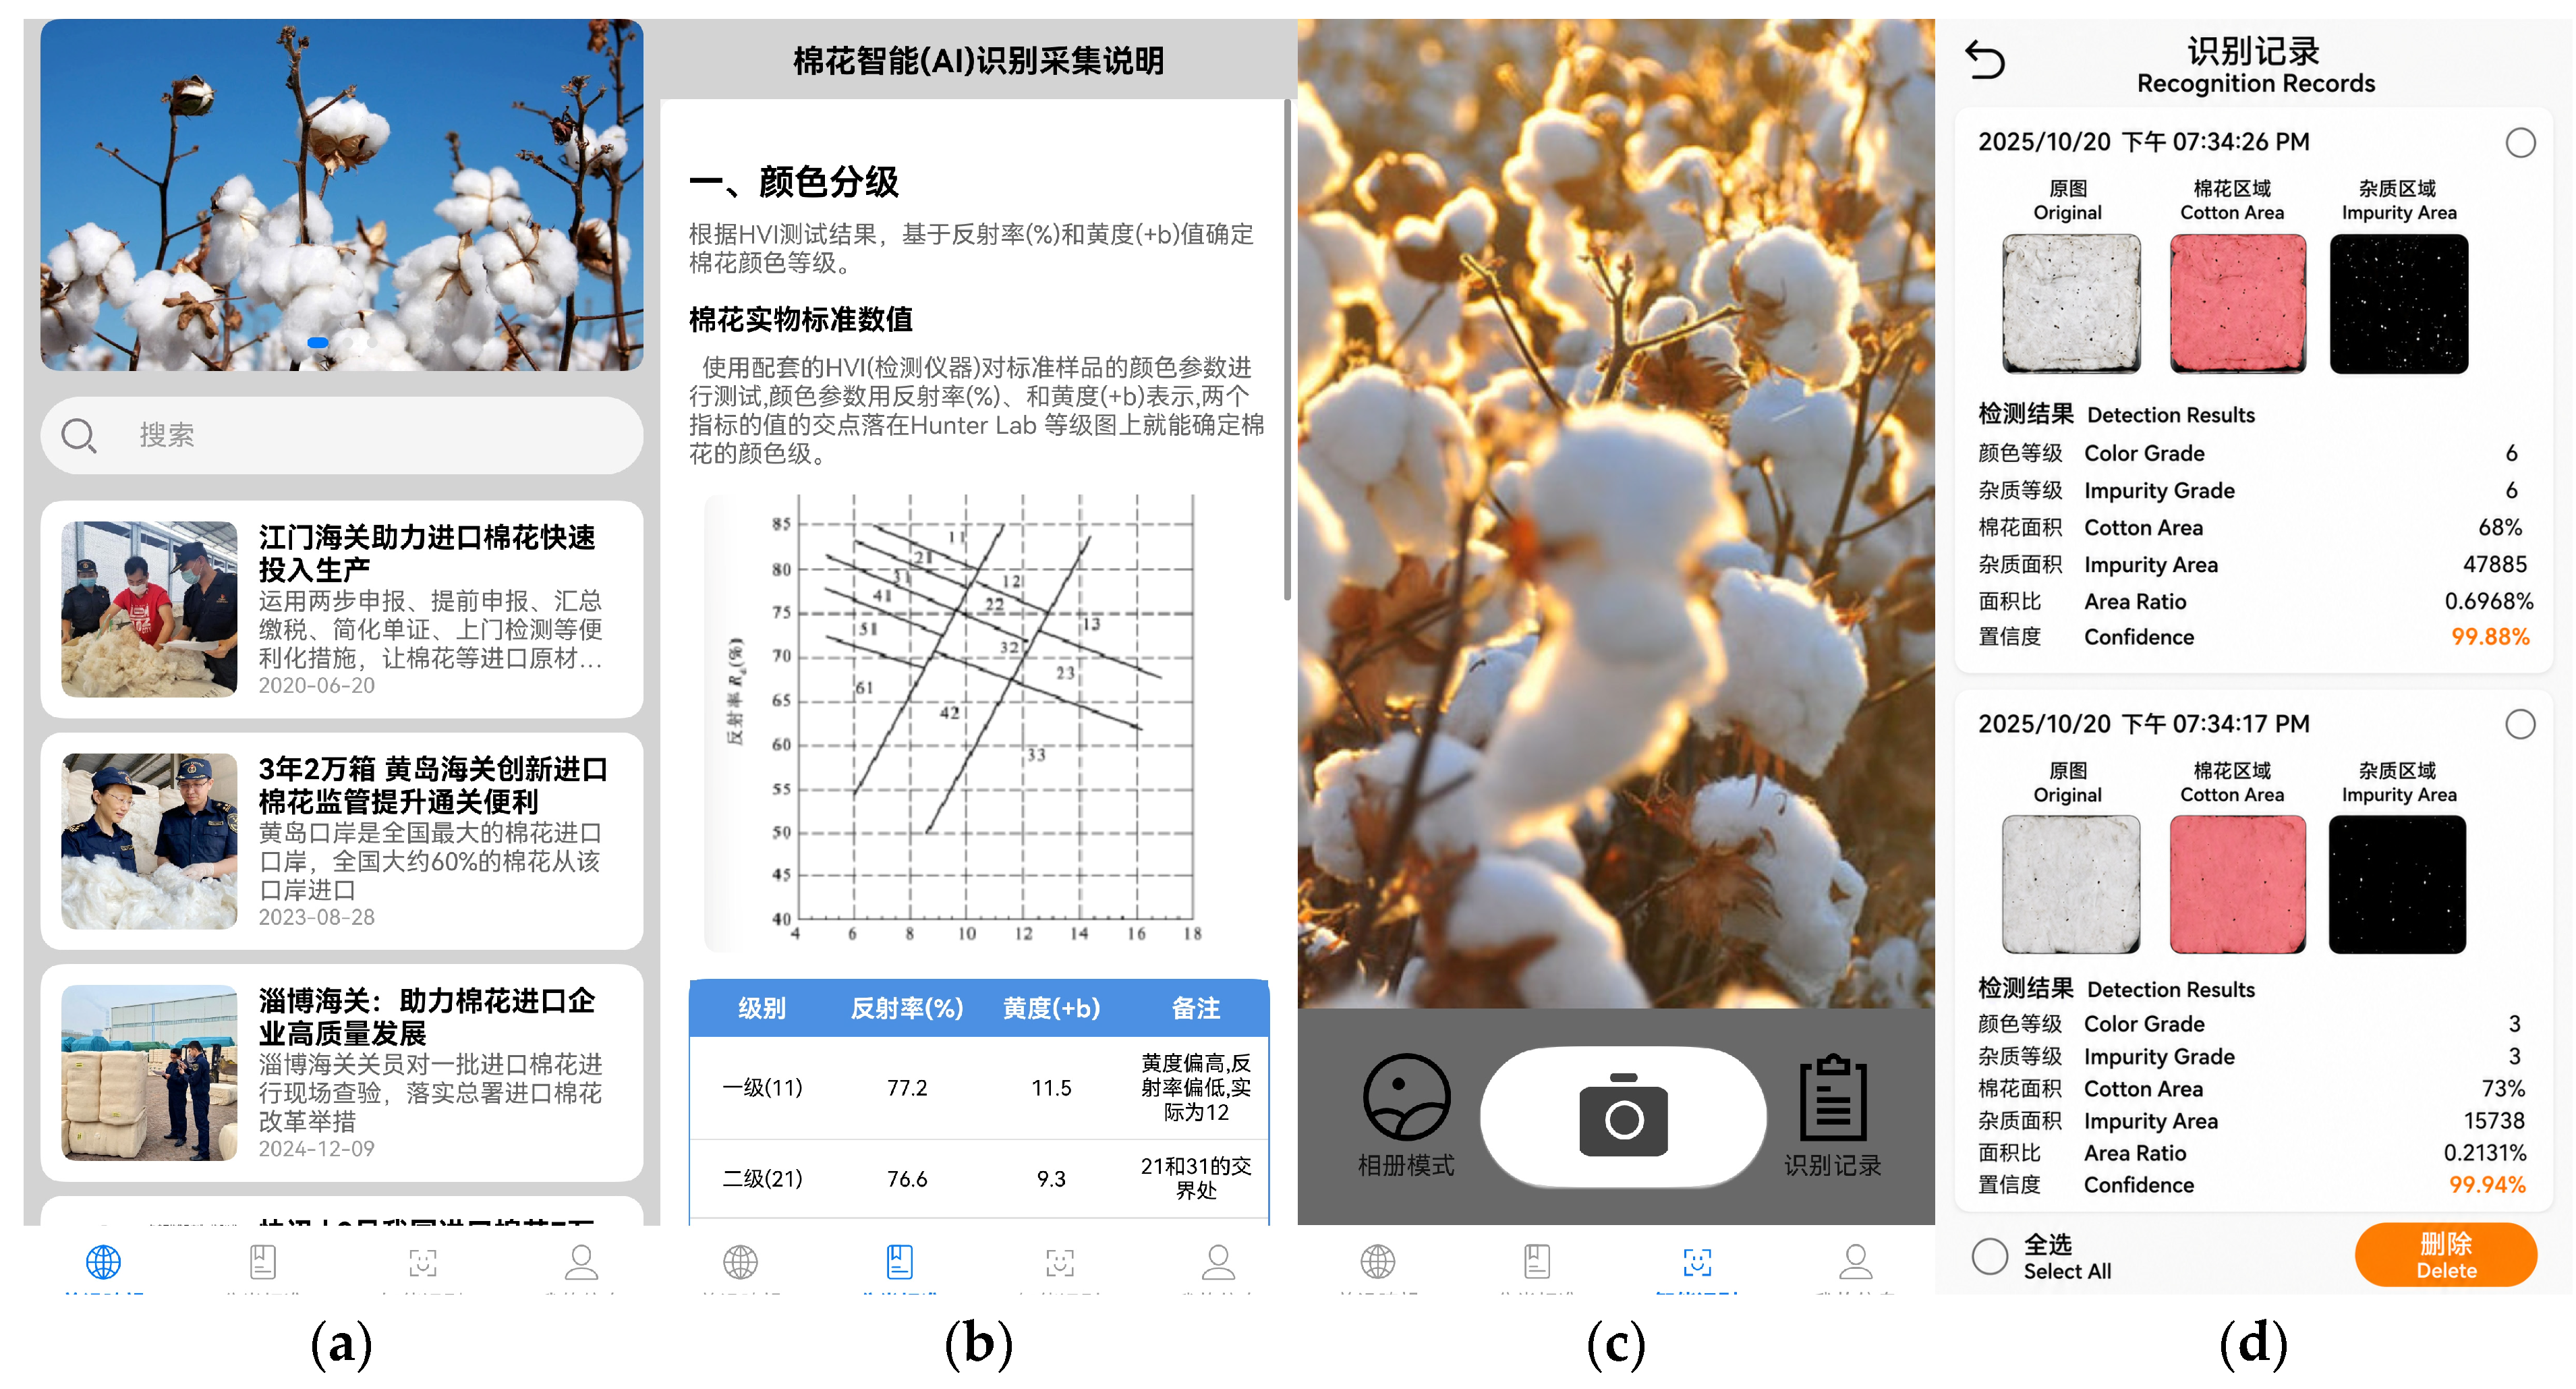
To deploy the cotton color and impurity grading algorithms proposed in this study in practical customs inspection scenarios, a HarmonyOS-based mobile application for intelligent cotton grading and identification was developed. The application interface adopts a concise modular design, with intelligent recognition as its core function. Users can import cotton sample images either by on-site photography or local album upload. Once images are uploaded to the cloud, they are remotely processed and analyzed by the algorithm. The interface can synchronously display the visualized segmentation results of cotton foregrounds and impurities, and output quantitative detection data, including color grade, impurity grade, and impurity area ratio.
The auxiliary function module integrates three practical sections to fully satisfy the application requirements of customs inspection scenarios. First, the Frontier Overview section provides real-time updates on industry information and customs policy developments related to imported cotton, enabling users to keep abreast of industry trends. Second, the Grading Standards section embeds official cotton grading specifications, allowing inspectors to inquire about and compare relevant standards in real time and support accurate on-site judgment. Third, the Recognition Records section automatically stores key information of each inspection task, including sample images, grading results, and inspection time. It also supports query, export, and traceability, which facilitates subsequent data review and inspection rechecking, and ensures the traceability of inspection procedures and the verifiability of inspection data.
This application adopts cloud servers for deep learning model deployment and remote algorithm inference. It simplifies traditional manual operation procedures and realizes an integrated full-process service covering image acquisition, cloud-based intelligent analysis, result visualization and data traceability. The interface of the developed HarmonyOS application is presented in Figure 14.
Figure 14.
Interface of the intelligent cotton grading and identification application. (a) Frontier overview page. (b) Grading standard page. (c) Image upload page. (d) Record review page.
Field test data obtained from Zhangjiagang Customs verify that the system achieved efficient cloud inference, with an average processing time of 0.8 s for a single cotton sample image. The average duration of the complete workflow, including sample preparation, image acquisition and uploading, cloud-based intelligent analysis, and grading result visualization, was 10 min. Compared with traditional inspection methods, the proposed system significantly reduces inspection time, cuts down labor and sample submission costs, and effectively eliminates the temporal and spatial limitations of conventional on-site inspection. It provides a viable technical solution for the rapid quality inspection of imported cotton.
4. Discussion
As a core raw material of the textile industry, the accuracy of cotton quality grading directly affects trade fairness and the stability of subsequent processing, which is essential for the orderly development of the industry. The machine vision-based cotton quality grading system constructed in this study focuses on two core tasks: color grading and impurity grade identification. Balancing grading accuracy and engineering practicality, the system supports convenient operation on HarmonyOS. It effectively mitigates the low efficiency and subjective errors of traditional manual grading, providing technical support for the standardized management of cotton quality.
In this study, the channel attention mechanism was used to enhance the feature representation capability of the network, while ASPP-based multi-scale contextual modeling and the DySample adaptive upsampling mechanism were adopted to improve the segmentation performance for tiny impurities and weak-boundary regions. These designs improved the accuracy of imported saw-ginned cotton quality identification. Although the system has been experimentally applied at Zhangjiagang Customs, further optimization is still required before broader deployment in practical port inspection scenarios.
Future work will focus on three aspects. First, a quality identification model based on multimodal information and fine-grained feature enhancement will be constructed. Fine-grained features of saw-ginned cotton will be further enhanced to improve the discriminability of subtle inter-grade differences. Textual standard information and other modalities will also be incorporated to reduce omissions and misclassifications caused by minor visual differences, thereby improving the recognition accuracy of adjacent-grade samples. Second, more types and samples of imported cotton will be included to expand the application scenarios. The current system is mainly adapted to conventional white cotton grading, while the coverage of special cotton types, such as dyed cotton and contaminated cotton, remains insufficient. Future studies will include cotton samples from different production regions, batches, and working conditions to improve the cross-scenario generalization capability of the model. Third, online model deployment will be further optimized. By integrating model lightweighting techniques, models suitable for online deployment on mobile devices will be developed to reduce dependence on network connectivity and improve operational efficiency.
In summary, the cotton quality grading system constructed in this study helps overcome the limitations of traditional manual grading. Through continuous optimization of algorithm accuracy, expansion of sample coverage, strengthened validation in real-world scenarios, and further refinement of engineering deployment, the system can provide technical support for standardized cotton quality management and contribute to the high-quality development of the industry.
5. Conclusions
To address prevalent industrial problems in intelligent cotton quality identification, including low accuracy in color grade discrimination, difficulties in quantitative measurement of impurity content, heavy reliance on manual inspection, and the long cycle of traditional quality inspection workflows, this study developed a machine vision-based intelligent cotton quality identification system for cotton color grading and impurity grade evaluation. The recognition performance of the proposed algorithms and the practical application effectiveness of the system were verified through multi-model comparison experiments, ablation validation tests, and field application testing at Zhangjiagang Customs.
For the cotton color grading task, this study first compared the performance of several mainstream convolutional neural networks in fine-grained cotton color recognition. On this basis, this study proposed CA-ResNet50, a cotton color grading model integrated with the ECA channel attention mechanism, and adopted the AdamW optimization strategy during model training to enhance iterative convergence efficiency. The proposed CA-ResNet50 cotton color grading model achieved a precision of 94.9%, a recall of 94.8%, and an -Score of 94.8%. Compared with the baseline ResNet50 model, the precision, recall, and -Score of CA-ResNet50 increased by 5.7, 5.8, and 5.7 percentage points respectively, indicating a significant improvement in the overall discriminative capability of cotton color features. Confusion matrix analysis reveals that misclassifications were mainly concentrated between adjacent color grades without severe cross-grade classification errors, indicating that the grading results were stable and reliable and can effectively support quantitative cotton color grade determination.
Impurity segmentation serves as a critical foundation for the calculation of impurity area ratio and the determination of impurity grades. Cotton impurities typically present large scale variations and low foreground-background contrast, which may lead to deviations in impurity pixel statistics and further affect subsequent grade evaluation. To solve this problem, this study proposed AD-UNet, an impurity segmentation model that integrates ASPP-based multi-scale perception and the DySample adaptive upsampling mechanism. Compared with the baseline U-Net model, the IoU and Dice coefficient of AD-UNet increase by 2.4 and 1.6 percentage points respectively, and its comprehensive segmentation performance was superior to that of comparative algorithms including DeepLabv3 and HRNet. Through the collaborative fusion of multi-scale features, the model effectively suppresses complex background interference and improves the segmentation integrity of small and irregular impurities. After calculating the pixel areas of cotton regions and impurity regions and matching the calculated data with the official cotton impurity content grading standards, the final recognition accuracy of cotton impurity grades reached 97.35%.
Based on the above improved algorithms, this study completed the server-side model deployment and developed a HarmonyOS-based mobile application for intelligent cotton grading and identification. The system integrates the functions of intelligent recognition, grading standard query, industry information push, and inspection record tracing, forming an integrated quality inspection workflow covering image acquisition, cloud inference, result visualization, and data traceability. Field tests conducted at Zhangjiagang Customs demonstrated that the entire on-site inspection process took approximately 10 min on average. This solution can reduce reliance on laboratory sites and large-scale equipment, adapt to indoor reinspection and outdoor on-site sampling inspection scenarios, and satisfy the operational requirements for rapid quality inspection and standardized supervision of imported cotton at ports.
In summary, this study achieved effective innovations at two levels, visual algorithm optimization and industry-specific intelligent system integration, thereby addressing the major limitations of traditional cotton quality identification, including insufficient accuracy, low automation, and delayed inspection responses. The constructed machine vision-based identification framework and cloud-mobile collaborative solution can provide methodological and technical references for the appearance quality inspection of agricultural products and rapid quarantine inspection of bulk commodities at ports, presenting favorable academic value and engineering application prospects.
Author Contributions
Conceptualization, J.L. (Jun Lyu) and K.Z.; methodology, J.L. (Jun Lyu), J.L. (Junyi Luo) and K.Z.; software, J.L. (Junyi Luo); validation, J.L. (Jun Lyu) and J.L. (Junyi Luo); formal analysis, J.L. (Jun Lyu) and J.L. (Junyi Luo); investigation, J.L. (Jun Lyu), J.L. (Junyi Luo) and K.Z.; resources, K.Z. and Z.D.; data curation, J.L. (Junyi Luo) and K.Z.; writing—original draft preparation, J.L. (Jun Lyu) and J.L. (Junyi Luo); writing—review and editing, J.L. (Jun Lyu), J.L. (Junyi Luo), K.Z. and Z.D.; supervision, K.Z.; project administration, K.Z. All authors have read and agreed to the published version of the manuscript.
Funding
This work was supported by the Nanjing Customs Scientific Research Project: Development of Intelligent (AI) Grading Detection Equipment for Imported Cotton (2025KJ39).
Data Availability Statement
The datasets generated and analyzed during the current study are available from the corresponding author upon reasonable request.
Acknowledgments
We thank Zhangjiagang Customs for supplying the cotton sample data and technical support for this study. We appreciate the reviewers’ valuable suggestions on this manuscript and the editor’s efforts in processing the manuscript. During the preparation of this study, the authors used [ChatGPT, GPT-5.5] for the purposes of generating the initial version of Figure 2 based on self-provided plane layout and physical photos. The authors have reviewed and edited the output and take full responsibility for the content of this publication.
Conflicts of Interest
The authors declare no conflicts of interest.
References
- General Administration of Customs of the People’s Republic of China. Table of Quantity and Value of Major Imported Commodities in December 2025 (RMB Value). Available online: http://zms.customs.gov.cn/customs/2026-01/18/article_2026011811043099486.html (accessed on 14 April 2026).
- GB 1103.1-2023; Cotton—Part 1: Saw-Ginned Upland Cotton. Standards Press of China: Beijing, China, 2023.
- Guo, Z.; Zhang, Z.; Zhou, L. Study on cotton color vision detection system and its influencing factors. Mach. Electron. 2022, 40, 3–7. [Google Scholar]
- Bao, B.; Yu, X.; Wang, E.; Chu, D.; Gao, W.; Ouyang, Y.; Zhang, C.; Chen, W.; Wang, C.; Jin, H.; et al. Mechanical specimen preparation method for next-generation cotton quality testing using HVIs. Ind. Crops Prod. 2025, 233, 121455. [Google Scholar] [CrossRef] [Scilit]
- Li, H.; Li, Q.; Zhou, W.; Zhang, R.; Hong, S.; Zhang, M.; Zhai, Z. Measurement of seed cotton color using RGB imaging and Color-Unet. Agronomy 2025, 15, 19. [Google Scholar] [CrossRef] [Scilit]
- Rady, A.; Fisher, O.; El-Banna, A.A.A.; Emasih, H.H.; Watson, N.J. Computer vision and transfer learning for grading of Egyptian cotton fibres. AgriEngineering 2025, 7, 127. [Google Scholar] [CrossRef] [Scilit]
- Jiang, L.; Chen, W.; Shi, H.; Zhang, H.; Wang, L. Cotton-YOLO-Seg: An enhanced YOLOv8 model for impurity rate detection in machine-picked seed cotton. Agriculture 2024, 14, 1499. [Google Scholar] [CrossRef] [Scilit]
- Hu, D.; Liu, X.; Xu, J. Improved YOLOv5-based image detection of cotton impurities. Text. Res. J. 2024, 94, 906–917. [Google Scholar] [CrossRef] [Scilit]
- Liang, H.; Jing, J.; Maimaiti, A.; Zhang, L. Classification and evaluation of cotton quality in Xinjiang based on cluster analysis and discriminant analysis. Wool Text. J. 2023, 51, 121–126. [Google Scholar] [CrossRef]
- Li, L. Raw cotton impurity classification method based on improved MobileNetV2. Wool Text. J. 2021, 49, 83–88. [Google Scholar] [CrossRef]
- Wu, W.; Tang, J.; Tang, G. Study on the color grade inspection method of fine-grained cotton based on attention mechanism. China Fiber Insp. 2023, 5, 74–78. [Google Scholar] [CrossRef]
- Fisher, O.J.; Rady, A.; El-Banna, A.A.A.; Emaish, H.H.; Watson, N.J. AI-assisted cotton grading: Active and semi-supervised learning to reduce the image-labelling burden. Sensors 2023, 23, 8671. [Google Scholar] [CrossRef] [Scilit] [PubMed]
- Li, S.; Shan, G.; Jia, L.; Zhong, M.; Liu, R. Cotton color scale prediction based on BP neural network. Cotton Text. Technol. 2019, 47, 68–71. [Google Scholar]
- Wang, Z.; Wu, Z.; You, M.; Zhang, L.; Abudurexiti, M. Cotton color grade detection based on improved MobileNetV2. Cotton Text. Technol. 2024, 52, 15–21. [Google Scholar]
- Zhang, C.; Li, L.; Dong, Q.; Ge, R. Recognition method for machine-harvested cotton impurities based on color and shape features. Trans. Chin. Soc. Agric. Mach. 2016, 47, 28–34, 41. [Google Scholar]
- Li, T. Research on Classification, Identification, and Detection Technology of Impurities in Machine-Picked Seed Cotton. Master’s Thesis, University of Jinan, Jinan, China, 2022. [Google Scholar] [CrossRef]
- Li, Q.; Ma, W.; Li, H.; Zhang, X.; Zhang, R.; Zhou, W. Cotton-YOLO: Improved YOLOv7 for rapid detection of foreign fibers in seed cotton. Comput. Electron. Agric. 2024, 219, 108752. [Google Scholar] [CrossRef] [Scilit]
- Zhao, L.; Li, Q.; Yu, X.; Chang, Y. An intelligent identification method for foreign fibers in seed cotton based on hyperspectral imaging with the PCA-AlexNet model. Front. Agric. Sci. Eng. 2025, 12, 883–899. [Google Scholar] [CrossRef] [Scilit]
- U.S. Department of Agriculture, Agricultural Marketing Service. Official Cotton Standards of the United States for the Grade of American Upland Cotton; U.S. Department of Agriculture: Washington, DC, USA, 2023.
- Kirillov, A.; Mintun, E.; Ravi, N.; Mao, H.; Rolland, C.; Gustafson, L.; Xiao, T.; Whitehead, S.; Berg, A.C.; Lo, W.-Y.; et al. Segment Anything. In Proceedings of the IEEE/CVF International Conference on Computer Vision, Paris, France, 2–6 October 2023; pp. 4015–4026. [Google Scholar] [CrossRef] [Scilit]
- Ronneberger, O.; Fischer, P.; Brox, T. U-Net: Convolutional networks for biomedical image segmentation. In Medical Image Computing and Computer-Assisted Intervention—MICCAI 2015; Navab, N., Hornegger, J., Wells, W.M., Frangi, A.F., Eds.; Lecture Notes in Computer Science; Springer: Cham, Switzerland, 2015; Volume 9351, pp. 234–241. [Google Scholar] [CrossRef] [Scilit]
- He, K.; Zhang, X.; Ren, S.; Sun, J. Deep residual learning for image recognition. In Proceedings of the IEEE Conference on Computer Vision and Pattern Recognition, Las Vegas, NV, USA, 27–30 June 2016; pp. 770–778. [Google Scholar] [CrossRef] [Scilit]
- Loshchilov, I.; Hutter, F. Decoupled weight decay regularization. In Proceedings of the 7th International Conference on Learning Representations, New Orleans, LA, USA, 6–9 May 2019. [Google Scholar]
- Wang, Q.; Wu, B.; Zhu, P.; Li, P.; Zuo, W.; Hu, Q. ECA-Net: Efficient channel attention for deep convolutional neural networks. In Proceedings of the IEEE/CVF Conference on Computer Vision and Pattern Recognition, Seattle, WA, USA, 13–19 June 2020; pp. 11531–11539. [Google Scholar] [CrossRef] [Scilit]
- Chen, L.-C.; Zhu, Y.; Papandreou, G.; Schroff, F.; Adam, H. Encoder–decoder with atrous separable convolution for semantic image segmentation. In Proceedings of the European Conference on Computer Vision, Munich, Germany, 8–14 September 2018; pp. 833–851. [Google Scholar] [CrossRef] [Scilit]
- Liu, W.; Lu, H.; Fu, H.; Cao, Z. Learning to upsample by learning to sample. In Proceedings of the IEEE/CVF International Conference on Computer Vision, Paris, France, 2–6 October 2023; pp. 6004–6014. [Google Scholar] [CrossRef] [Scilit]
- Sandler, M.; Howard, A.; Zhu, M.; Zhmoginov, A.; Chen, L.-C. MobileNetV2: Inverted residuals and linear bottlenecks. In Proceedings of the IEEE/CVF Conference on Computer Vision and Pattern Recognition, Salt Lake City, UT, USA, 18–22 June 2018; pp. 4510–4520. [Google Scholar] [CrossRef] [Scilit]
- Tan, M.; Le, Q.V. EfficientNet: Rethinking model scaling for convolutional neural networks. In Proceedings of the 36th International Conference on Machine Learning, Long Beach, CA, USA, 9–15 June 2019; pp. 6105–6114. [Google Scholar]
- Huang, G.; Liu, Z.; van der Maaten, L.; Weinberger, K.Q. Densely connected convolutional networks. In Proceedings of the IEEE Conference on Computer Vision and Pattern Recognition, Honolulu, HI, USA, 21–26 July 2017; pp. 4700–4708. [Google Scholar] [CrossRef] [Scilit]
- Zhou, Z.; Siddiquee, M.M.R.; Tajbakhsh, N.; Liang, J. UNet++: A nested U-Net architecture for medical image segmentation. In Deep Learning in Medical Image Analysis and Multimodal Learning for Clinical Decision Support; Stoyanov, D., Taylor, Z., Carneiro, G., Eds.; Lecture Notes in Computer Science; Springer: Cham, Switzerland, 2018; Volume 11045, pp. 3–11. [Google Scholar] [CrossRef] [Scilit] [PubMed]
- Chen, L.-C.; Papandreou, G.; Schroff, F.; Adam, H. Rethinking atrous convolution for semantic image segmentation. arXiv 2017, arXiv:1706.05587. [Google Scholar] [CrossRef] [Scilit]
- Sun, K.; Xiao, B.; Liu, D.; Wang, J. Deep high-resolution representation learning for human pose estimation. In Proceedings of the IEEE/CVF Conference on Computer Vision and Pattern Recognition, Long Beach, CA, USA, 15–20 June 2019; pp. 5693–5703. [Google Scholar] [CrossRef] [Scilit]

Disclaimer/Publisher’s Note: The statements, opinions and data contained in all publications are solely those of the individual author(s) and contributor(s) and not of MDPI and/or the editor(s). MDPI and/or the editor(s) disclaim responsibility for any injury to people or property resulting from any ideas, methods, instructions or products referred to in the content. |
© 2026 by the authors. Licensee MDPI, Basel, Switzerland. This article is an open access article distributed under the terms and conditions of the Creative Commons Attribution (CC BY) license.