


Abstract
Yunnan ‘Bingtang’ oranges possess significant market competitiveness due to their unique taste and high sugar content. However, the limited efficiency of traditional quality inspection methods severely hampers the industrial grading process. Sugar content (Brix), as a core indicator of internal quality, is also a key factor determining consumer repurchase rates. This study focuses on the characteristic ‘Bingtang’ orange variety “Yunguan Orange” in the Longling Chu Orange Demonstration Base in Yunnan Province. Hyperspectral imaging data and corresponding sugar content values were collected during three critical stages from fruit set to harvest, and sugar content prediction research was conducted within the 400–1000 nm spectral range. Based on the extraction of regions of interest (ROI), Multispectral Scattering Correction (MSC) coupled with the Savitzky-Golay first-order derivative (SG-1st Deriv) method was employed to preprocess the raw spectral data (RAW). This study focused on investigating the performance of the Competitive Adaptive Weighted Sampling (CARS) algorithm across six prediction models. Raw full spectra (RAW) and the Sequential Projection Algorithm (SPA) were adopted as comparative schemes in ablation experiments to systematically analyze the influence of different feature extraction strategies. Experimental results showed that the coefficient of determination (R2) for most models exceeded 0.8 on the test set, while the root mean square error (RMSE) remained below 1.0. The findings indicate that under the current experimental conditions, this system can realize acceptable quantitative analysis for tested Yunguan oranges and greatly lower the overall model complexity. It clarifies the compatibility of the CARS algorithm with various prediction models, and systematically integrates three innovations of multi-stage sampling, SPA/CARS comparison and multi-type model evaluation, providing critical theoretical support and technical parameters for the development of low-cost, real-time online sorting equipment.
1. Introduction
The ‘Bingtang’ orange industry is a vital component of the global fruit trade, with China serving as a major producer and consumer of this variety [1]. The commercially branded citrus product “Chu Orange” from Yunnan has become an industry benchmark, characterized by thin peel, abundant juice, and balanced sugar–acid ratio under standardized quality management. Its core cultivated cultivar used in this study is Yunguan Orange, a high-quality strain belonging to the ‘Bingtang’ orange group. In market competition, consistent fruit quality is central to achieving brand premium; sugar content not only determines palatability but also serves as a key indicator of ripeness and storage life. Currently, fruit sorting largely relies on conveyor-based equipment that grades fruits solely by size, color, and weight, while internal quality testing—such as sugar content—still primarily involves manual sampling and destructive physicochemical analysis [2]. This approach suffers from drawbacks including destructiveness, time lags, and insufficient sample representativeness, making it difficult to identify fruits with intact exteriors but substandard sugar content, which poses a potential threat to brand reputation.
In response to the limitations of traditional testing methods, non-destructive testing (NDT) has emerged as a research focus in agricultural product quality assessment. Visible/near-infrared (Vis-NIR) spectroscopy, due to its high sensitivity to the overtone and sum absorption of hydrogen-containing groups, has evolved into the mainstream technology for rapid detection of internal components in agricultural products [3]. Hyperspectral imaging technology, as an extension of this, can simultaneously collect spectral and spatial information, providing comprehensive data support for the precise detection of fruit and vegetable quality, and has been widely applied in research on the internal quality of various fruits and vegetables.
In the field of grape detection, Cornelissen et al. proposed the LISA framework, which integrates YOLOv11-L detection, 2D CNN weight regression, and a light-invariant spectral autoencoder to achieve light-robust detection of grape yield and quality [4]. In citrus research, Xi et al. employed Vis/NIR spectra combined with preprocessing methods and the SPA algorithm to efficiently predict soluble solids content (SSC) in Satsuma mandarins [5]; Xiao Yuxin et al. compared machine learning and deep learning models, combining hyperspectral imaging to predict SSC, identified variety-specific characteristics, and validated model reliability through SHAP analysis [6]. In other fruit and vegetable sectors, Zhao Tengbo used a CNN-BiGRU model combined with UAV remote sensing data to accurately predict chlorophyll content in pomegranate leaves [7]; Yan Tian et al. achieved accurate, non-destructive detection of SSC in Fuji apples through SWAE algorithms and GWO-SVR modeling [8]. In the broader context of agricultural quality management, the integration of smart sensors and artificial intelligence has proven highly effective; for instance, Feed Forward Neural Networks (FFNN) have been successfully deployed to monitor microclimates and optimize the drying process of agricultural products like red peppers [9]. Liu Hao et al. designed an online sugar content sorting system for ‘Bingtang’ oranges, constructing an SPXY-CARS-PLSR model that achieved 92% accuracy within a 1 °Brix error margin [10], providing an important reference for the engineering application of the technology. Similar to most existing detection studies, their experiment only sampled mature fruits at a single stage and adopted a single modeling algorithm, without comparing multiple feature screening strategies or exploring spectral dynamic changes throughout fruit ripening.
Although hyperspectral technology offers significant advantages, issues such as redundant information, noise, and spectral band collinearity in massive datasets [11] can easily lead to a surge in computational load and increased risk of overfitting; feature extraction is therefore a critical step in building robust predictive models. Research has confirmed that the SPA and CARS algorithms can effectively screen for wavelengths associated with sugar content [10,12,13], but most studies are limited to static samples at a single time point or from a single batch, neglecting the dynamic physiological changes of the fruit throughout the entire harvest period [14]. Besides, few studies quantitatively compare SPA and CARS under a unified multi-stage sample framework, and there lacks systematic comparison between machine learning and deep learning models. This results in reduced prediction accuracy across different time periods, failing to meet the requirements for continuous sorting on production lines.
To address these limitations, we put forward two testable hypotheses: (H1) Compared with SPA and raw full spectra, CARS can more effectively reduce spectral collinearity and spectral dimensionality, and achieve stable prediction performance compatible with multiple regression models for multi-stage oranges; (H2) under small multi-stage datasets, regularized linear models (ElasticNet) exhibit better generalization than nonlinear and deep learning models. Three clear research objectives are defined to clarify scattered innovations:
- (1)
- Collect samples across three fruit developmental stages to characterize dynamic spectral-sugar relationships during fruit ripening;
- (2)
- Conduct ablation experiments with raw spectra and SPA as benchmarks to quantify the dimensionality reduction and anti-collinearity optimization effect of CARS;
- (3)
- Compare six machine learning and two lightweight deep learning models to determine the optimal CARS-based prediction model and its synergistic mechanism.
Different from conventional single-stage, single-model detection schemes reported in most previous studies, the multi-period sampling and multi-algorithm comparative framework established in this study forms the core advancement of the present experiment. This study focuses on the need for non-destructive sugar content detection throughout the entire harvest period of Yunnan ‘Bingtang’ oranges and establishes a comprehensive technical framework comprising “spectral preprocessing—feature extraction—multi-model comparison and validation.” By optimizing the spectral preprocessing scheme—centered on the CARS algorithm and incorporating RAW spectra with the SPA algorithm—we conducted validation experiments, compared six machine learning models, and systematically evaluated the impact of feature extraction methods on predictive performance. Ultimately, we constructed a prediction model with favorable fitting and relatively stable generalization performance for multi-stage ‘Bingtang’ orange samples collected in this study.
2. Materials and Methods
2.1. Overview of the Study Area and Experimental Sample Data Collection
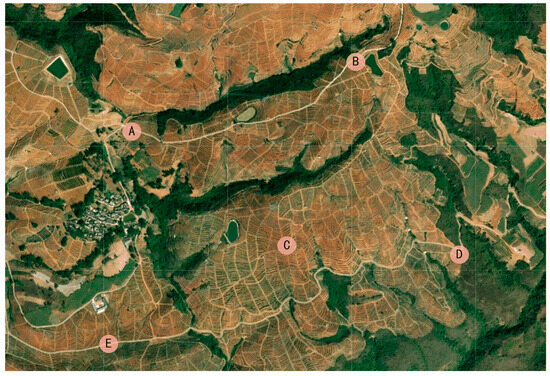
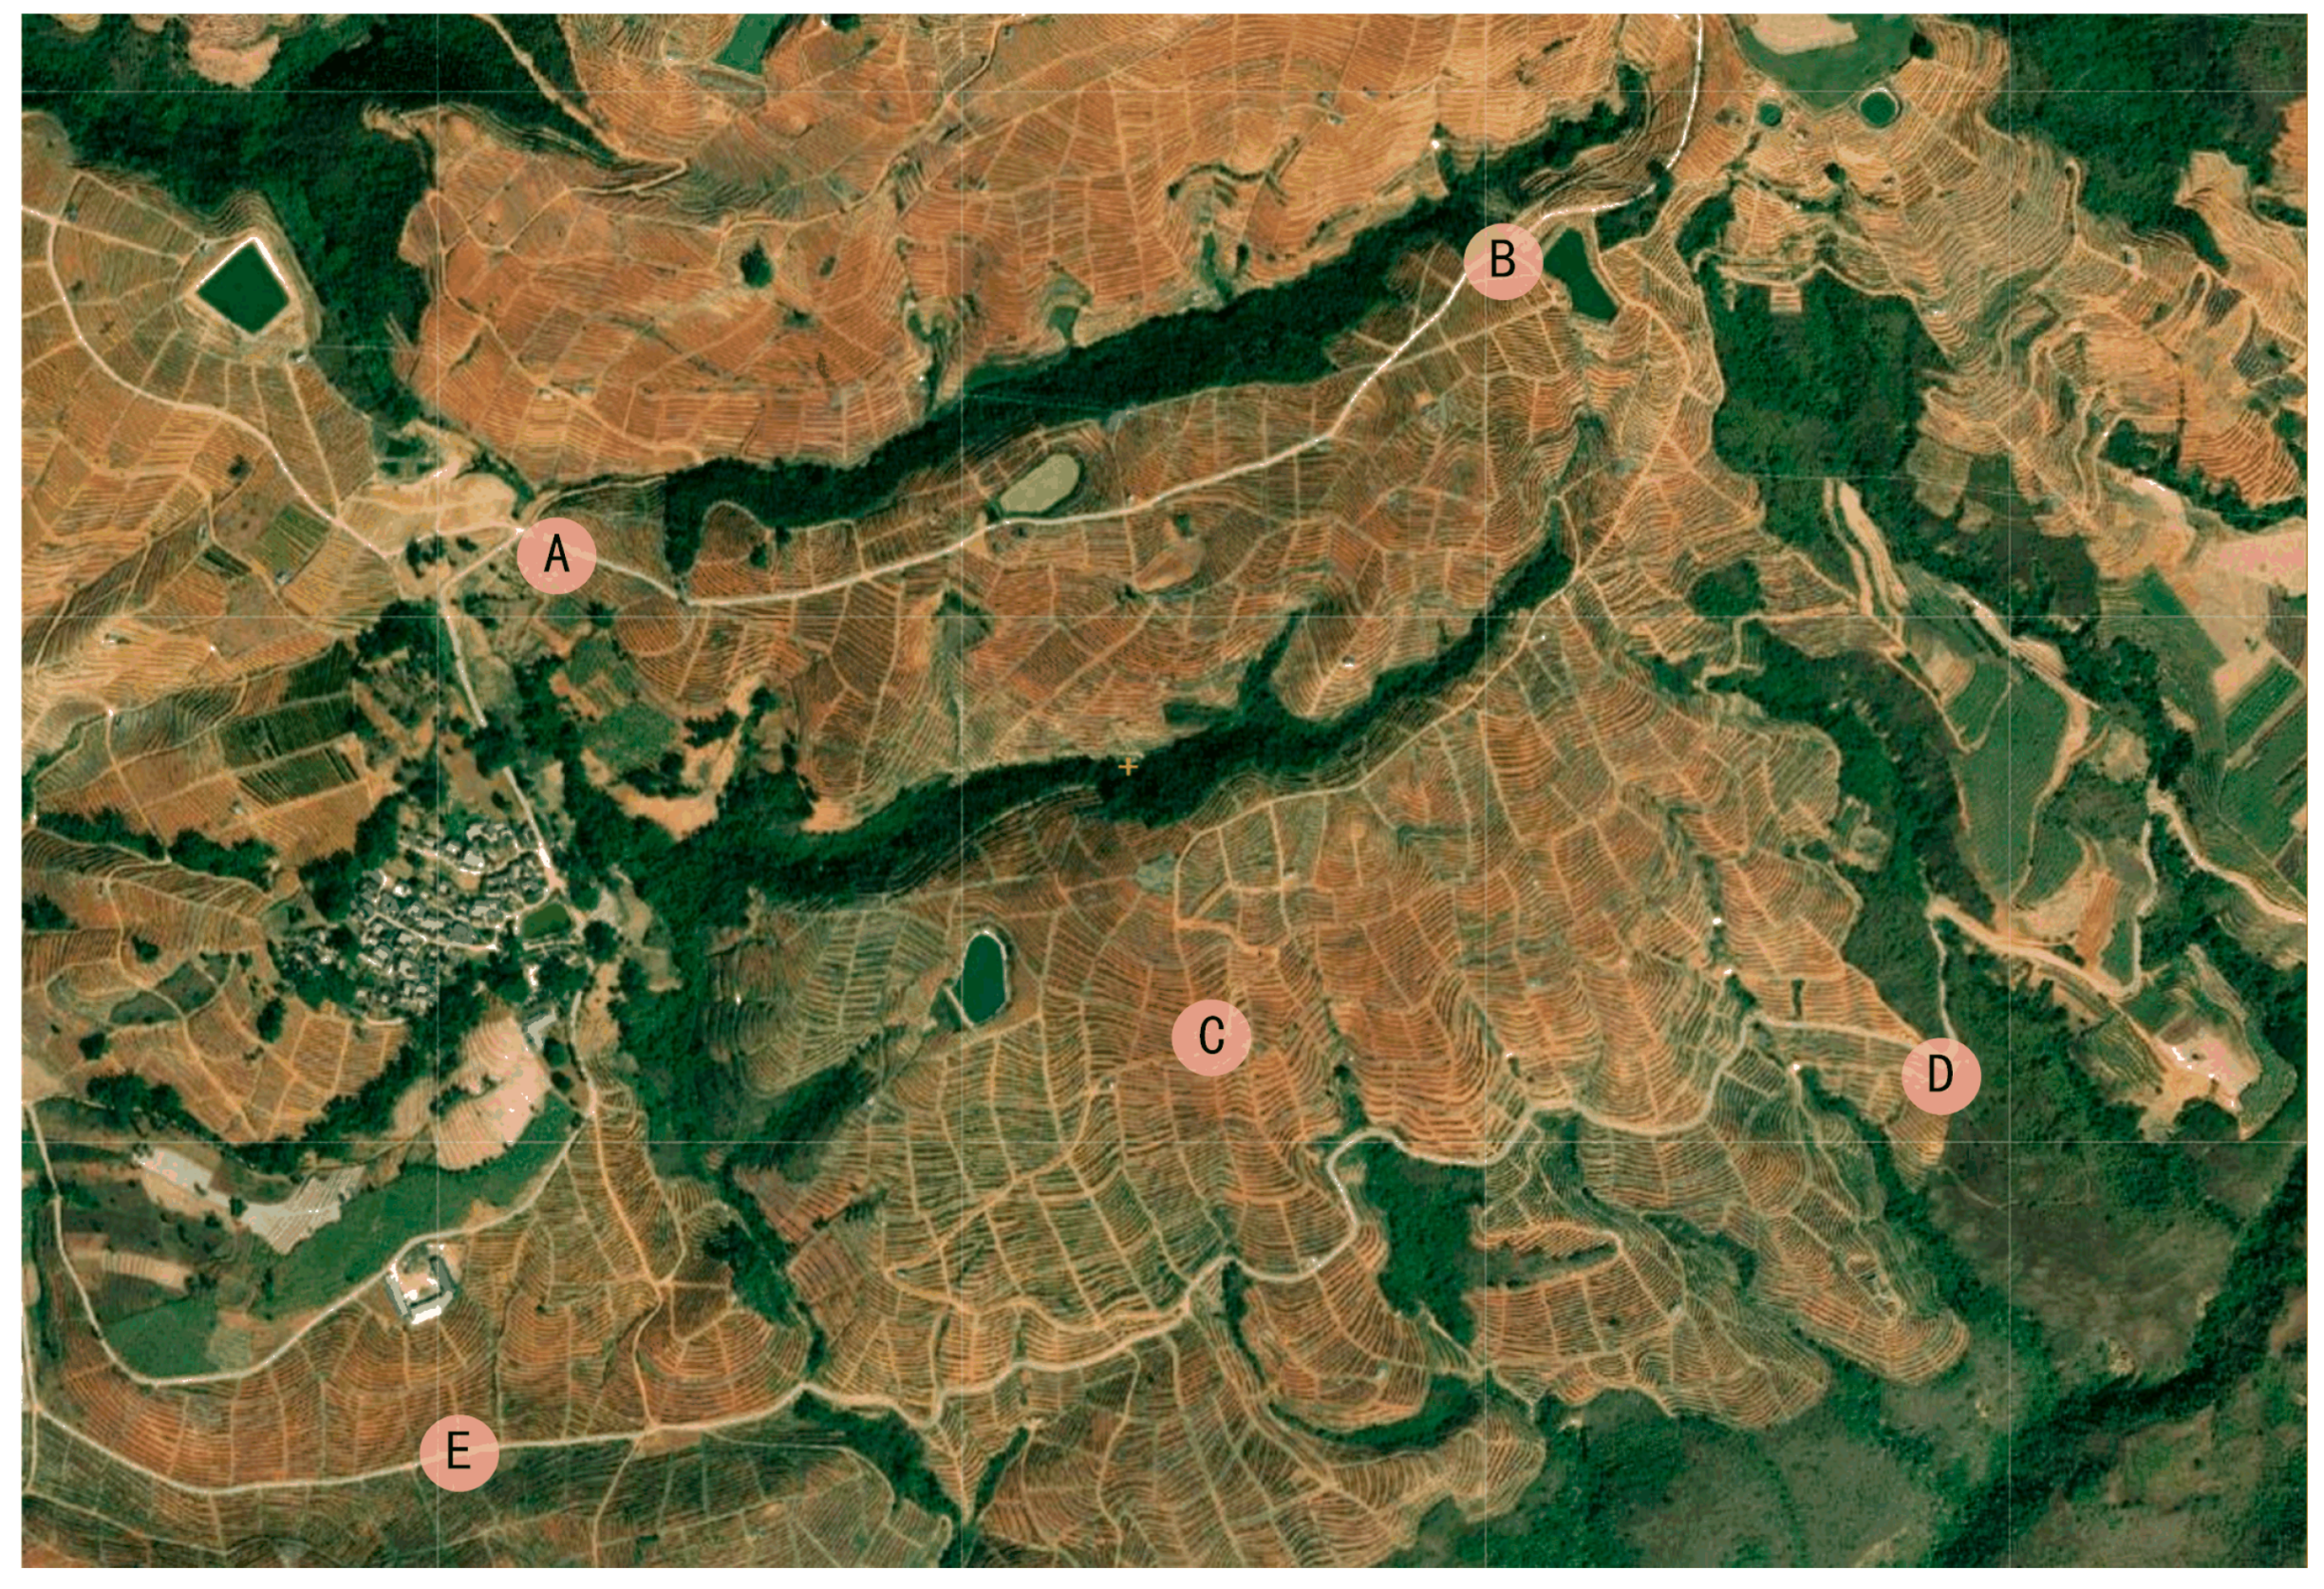
This study was conducted at the Chu Orange Demonstration Base in Mengnuo Town, Longling County, Baoshan City, Yunnan Province. The study area is located in western Yunnan at an elevation of 800–1200 m. Benefiting from the unique climate of the Gaoligong Mountains and the Nujiang River basin, the area receives over 2000 h of sunshine annually, with an average annual temperature of approximately 20.6 °C, with an annual accumulated temperature exceeding 7000 °C and significant diurnal temperature fluctuations, which are conducive to sugar accumulation in the fruit. To ensure the representativeness of the samples and fully account for the spatial heterogeneity of microtopography and light conditions, this study delineated five typical experimental areas (A–E) within the base. Each area is separated by a straight-line distance of ≥800 m, covering different microtopographies and light conditions. Yun Guan oranges from the base were selected as experimental samples for all areas. Yunguan Orange is a high-quality cultivar of the Bingtang Orange and the primary variety cultivated at the Chu Orange base, possessing the core characteristics of Bingtang Orange: thin skin, abundant juice, and high sugar content. Sampling points were precisely located using GPS (Area A: 24°15′09″ N 99°03′32″ E; Area B: 24°15′19″ N 99°04′09″ E; Area C: 24°14′50″ N 99°03′54″ E, Zone D 24°14′51″ N 99°04′26″ E, Zone E 24°14′38″ N 99°03′32″ E).
For fruit sample selection, stratified random sampling was implemented across five experimental plots (A–E). Within each plot, five fruit trees with consistent growth vigor were randomly selected from non-marginal planting zones and uniquely tagged for traceability. These 25 designated individual trees served as fixed sampling subjects throughout all three phenological sampling phases. For each tagged tree, a single fruit was harvested from the upper, middle, and lower canopy layers during each developmental stage (early color transformation, mid-to-late color transformation, and commercial maturity), which generated 9 fruit specimens per tree in total. All harvested fruits were screened according to unified physical standards: fruit diameter of 65–85 mm, symmetrical fruit morphology, intact calyx, and absence of visible pest lesions, mechanical injuries or severe sunburn, resulting in an initial dataset comprising 225 intact ‘Bingtang’ orange samples. Tree-based stratification was strictly enforced during dataset partitioning to prevent fruits sourced from a single tree from being allocated simultaneously to both training and test subsets. After collection, the samples were immediately sent to the laboratory. Following cleaning and numbering, they were left to rest for 24 h [15] under constant temperature and humidity conditions (24 °C, 50% relative humidity) to eliminate the influence of temperature on spectral data acquisition, after which spectral data collection and physicochemical measurements of sugar content were conducted. The study area is shown in Figure 1.
Figure 1.
Partial satellite map and experimental area location of Longling.
2.2. Hyperspectral Image Acquisition
2.2.1. Hyperspectral Imaging System
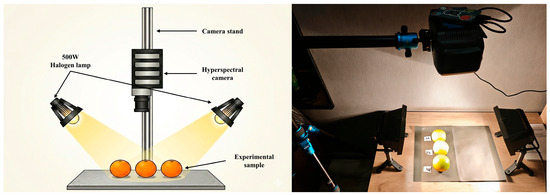
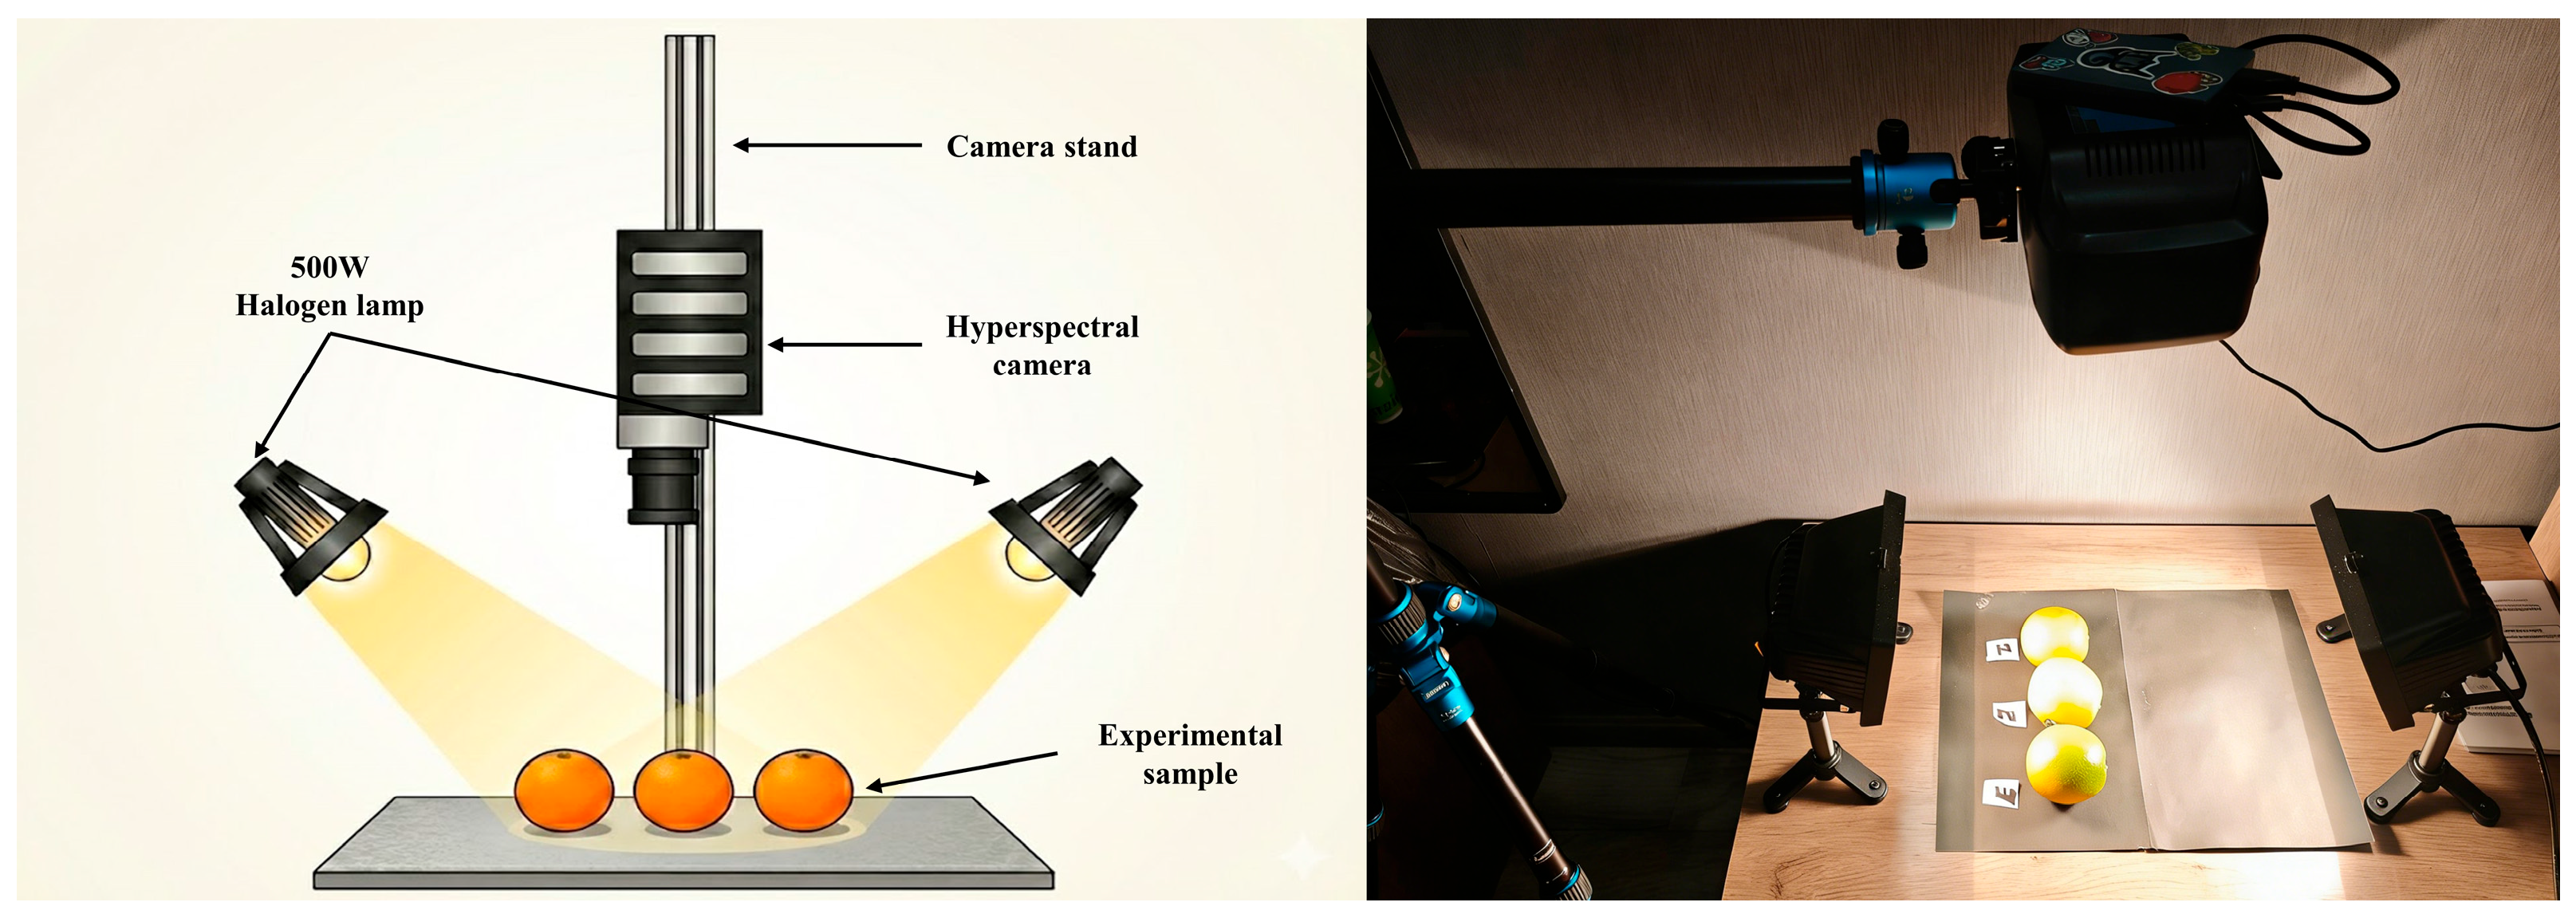
Images were acquired using a hyperspectral imaging system (HSI System), consisting of a forward-scanning hyperspectral camera (FS-IQ-VISNIR, CHNSpec, Hangzhou, China), a camera mount, and two 500 W halogen tungsten lamps. Figure 2 shows a schematic diagram of the hyperspectral imaging system. The camera covers the 400–1000 nm spectral range, with an actual detection range of 388.7–1010.1 nm, a spectral resolution of 2.5 nm, and 1920 spatial pixels. It is equipped with a white calibration plate, and data acquisition is performed using FigSpec Cam software v1.0 (CHNSpec, Hangzhou, China).
Figure 2.
Hyperspectral imaging system and structural diagram.
2.2.2. Hyperspectral Image Acquisition and Preprocessing
Images were captured indoors without any additional light sources to minimize environmental interference. The camera exposure time was set to 14 ms, with the lens positioned 400 mm above the sample, and images were acquired using an inward-scanning method. Prior to acquisition, the halogen tungsten lamp and camera were preheated for at least 30 min to ensure a stable and uniform light source [16]. During image acquisition, the ‘Bingtang’ orange was placed on black, non-reflective cardstock, and the equatorial region of the fruit was imaged. Each scan included 1–3 samples, which were numbered sequentially.
To suppress the effects of system random noise and sensor response non-uniformity, standard whiteboard reflection images and all-black background images were acquired before and after image acquisition, respectively. The raw hyperspectral data were then radiometrically calibrated using the following equation [17], with the correction formula shown in Equation (1):
In Equation (1), represents the calibrated relative reflectance image, represents the raw hyperspectral image, represents the all-black calibration image (representing sensor thermal noise), and represents the all-white calibration image (representing the spatial intensity distribution of the light source and variations in sensor pixel response).
Given that fruits typically exhibit higher reflectance in the near-infrared band, this study employs a thresholding method to separate fruits from the background and extract spectral data from regions of interest (ROIs): Based on the high reflectance of fruits in the near-infrared band, the reflectance image at a wavelength of 800 nm [14,18] was selected. After normalizing it to the 0–255 grayscale range, Otsu’s method was used to adaptively calculate the optimal threshold T [19]. This method determines the threshold by maximizing the inter-class variance. Assuming that image pixels are classified into two categories—foreground (fruit C0) and background (C1)—the inter-class variance is defined as in Equation (2):
In Equation (2), 0 and 1 represent the probabilities of foreground and background pixels at threshold t, respectively, while μ0 and μ1 represent the average gray-scale values of the two pixel classes, respectively. The optimal threshold T satisfies Equation (3):
The binarized mask is applied to the original hyperspectral image cube to extract the spectral data of all pixels within the ROI and calculate the average spectral reflectance. All image processing was performed using ENVI (Version 5.7, Exelis Visual Information Solutions, Boulder, CO, USA).
2.3. Determination of Physicochemical Properties and Sugar Content in ‘Bingtang’ Oranges
Immediately after the hyperspectral images were acquired, destructive physicochemical analyses were conducted. A digital Brix refractometer (DLX-SDJ1514, DELIXI ELECTRIC, Yueqing, China) was used to measure the sugar content of the ‘Bingtang’ oranges. The instrument has a measurement accuracy of ±0.2% and a measurement range of 0–55 °Brix. To minimize errors, the “multi-point blended juicing” method was employed: four symmetrical points were selected along the fruit’s equator; the fruit was peeled and juiced; the juice was filtered through a 0.2 mm mesh and thoroughly mixed; the instrument was calibrated with distilled water before measurement; each sample was measured three times, and the average value was taken as the true sugar content.
2.4. Data Preprocessing and Feature Extraction
2.4.1. Spectral Preprocessing
The extracted average spectral data are subject to interference from factors such as instrument noise, stray light, sample scattering, and baseline drift; therefore, preprocessing is required to improve the signal-to-noise ratio (SNR). This study employed a combined MSC + SG-1st Deriv preprocessing scheme for spectral data.
MSC corrects scattering effects and additive offsets caused by the uneven surface morphology and texture of the fruit peel by performing linear regression between the sample spectrum and the average spectrum; in the SG smoothing and first-order derivative processing, this study first compared the smoothing effects and residual noise levels of spectra under different combinations of window sizes (9, 13, 17, 21) and polynomial orders (2, 3). It was found that when the sliding window size was set to 17 and the polynomial order to 3, this combination effectively removed high-frequency noise and eliminated baseline drift while optimally preserving the original spectral peak shapes and suppressing random noise. Therefore, this parameter combination was selected for processing.
2.4.2. Selection of Characteristic Wavelengths
To simplify the model and improve computational efficiency, this study compared two classical wavelength screening strategies: the Sequential Projection Algorithm (SPA) and Competitive Adaptive Weighted Sampling (CARS). SPA is a forward variable selection algorithm that iteratively projects residual wavelengths onto the orthogonal subspace of selected wavelengths, selecting the wavelength with the largest projection vector magnitude to maximize the elimination of band collinearity [20]; The CARS algorithm constructs a PLS model based on Monte Carlo sampling, combines an exponential decay function (EDF) to eliminate wavelengths with small regression coefficients, retains key variables through adaptive weighted sampling (ARS), and determines the optimal feature subset based on the root mean square error of cross-validation (RMSECV) [21].
2.5. Construction and Evaluation of Prediction Models
2.5.1. Model Architecture Design
This study employs the Competitive Adaptive Weighted Sampling (CARS) algorithm as the core feature extraction method. To systematically validate its feature selection performance, we designed ablation experiments: using preprocessed RAW spectra (without additional filtering) features screened by SPA as the control group, and features screened by CARS as the experimental group. Six machine learning models were constructed, covering linear, nonlinear, ensemble, and regularization categories, to comprehensively validate the effectiveness of the CARS algorithm: Partial Least Squares Regression (PLSR) used default parameters and relied on latent variable projection to address multicollinearity; Support Vector Regression (SVR) was based on a radial basis function kernel, with the penalty term and kernel parameters optimized via grid search; Random Forest (RF) was configured with a maximum tree depth (max_depth = 10) and a minimum number of samples per leaf node (min_samples_leaf = 5) to control overfitting and reduce prediction variance; XGBoost employed L2 regularization (reg_lambda = 1) and incorporated an early stopping strategy (early_stopping_rounds = 10), terminating training when validation set performance stabilized to enhance model generalization; Bayesian Ridge Regression (BayesianRidge) combines Bayesian inference with Ridge regression to suppress overfitting under default parameters; ElasticNet integrates L1 and L2 regularization to simultaneously perform feature selection and multicollinearity mitigation [22].
Besides six conventional machine learning algorithms, 1D-CNN and lightweight Transformer were built for comparison using CARS-screened sequential spectral features, with detailed architectures and unified training settings as follows.
1D-CNN contained two Conv1D-BN-MaxPool modules (16 and 32 filters, kernel = 3), followed by dropout layers, a 64-neuron dense layer and single regression output. It was optimized by Adam (lr = 0.001), with MSE loss. To prevent catastrophic mode collapse and adapt to the limited sample size, a strictly tuned micro-Transformer was designed. It adopted one single attention encoder block (2 heads, key_dim = 32, ff_dim = 64). Instead of global average pooling, a Flatten layer was employed to retain individual wavelength token weights, and pure linear projections (Dense) combined with explicit positional encodings were used to preserve spectral sequence identity. Furthermore, strict regularization (Dropout = 0.1, GELU activations) and target variable (Brix) standardization were implemented. Its initial learning rate was set to 0.0005. For both deep models, unified regularization strategies were applied: 20% training data as internal validation, batch size = 8, max epochs of 80 (1D-CNN)/120 (Transformer). Early stopping (patience = 25) and learning rate decay were adopted to alleviate overfitting, and all random seeds were fixed at 42 for reproducibility.
2.5.2. Data Split and Evaluation Metrics
This study adopted two complementary evaluation frameworks to comprehensively assess the generalization performance of regression models. The stratified 8:2 train–test split was designated as the primary external validation scheme to mimic unknown fruit batches on commercial sorting lines, while stratified 5-fold cross-validation was supplemented as an auxiliary robustness test to eliminate random bias introduced by one-time dataset segmentation. For primary external validation, an 8:2 stratified random splitting strategy was implemented based on fruit ripening batches and individual fruit tree units. All samples were stratified across three developmental stages, with each fruit tree defined as an independent sampling unit to avoid fruits harvested from the same tree being simultaneously allocated to both training and test subsets. With a fixed random seed of 42 for full reproducibility, 175 samples were assigned to the training set, and the remaining 42 samples formed a completely independent test set. This unseen test set served as the core benchmark for evaluating the practical predictive potential of each model. This tree-based stratified grouping rule is fully consistent and uniformly adopted for both the external train–test split and the subsequent 5-fold cross-validation to eliminate data leakage from identical fruit individuals. For auxiliary stability verification, tree-stratified 5-fold cross-validation consistent with the above external splitting rule was conducted on the full preprocessed dataset. The 25 fixed tagged fruit trees distributed across five orchard blocks (A–E) were set as the minimum grouping unit; all fruits collected from a single tree were entirely assigned to one single fold and prohibited from splitting across multiple folds, so samples from the same tree would never simultaneously appear in training and validation subsets. The full dataset was divided into five balanced, mutually exclusive folds with consistent sugar content and ripening-stage distributions. Each fold was alternately designated as the validation set, and the other four fold were combined for model training. The average R2, RMSE, and MAE across five validation rounds were calculated to quantify the intrinsic stable generalization performance of each algorithm. Three universal evaluation metrics were used to quantify model predictive capacity: the coefficient of determination R2, root mean square error (RMSE), and mean absolute error (MAE). A higher R2 corresponds to stronger fitting and generalization ability, while smaller RMSE and MAE values represent lower absolute prediction errors. The corresponding calculation formulas are displayed in Equation (4):
In Equation (4), is the true sugar content value of the i-th sample, is the predicted value, is the mean of the true values, and n is the number of samples.
2.6. Experimental Software
All post-processing of hyperspectral images, feature extraction, and model construction were implemented using Python 3.12.10 and edited in PyCharm 2025.1.6 (JetBrains s.r.o., Prague, Czech Republic).
3. Results and Analysis
This section first analyzes the basic characteristics of sample sugar content and the patterns of spectral response, then verifies the feature selection performance of the CARS algorithm through model comparison, and finally clarifies the superiority of the CARS algorithm via computation experiments, forming a logical chain of ‘Basic Characteristics—Spectral Properties—Model Performance—Algorithm Validation.’
3.1. Statistical Characteristics of Rock Sugar Orange Brix
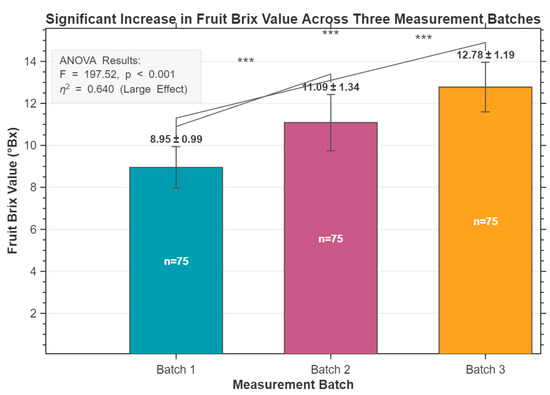
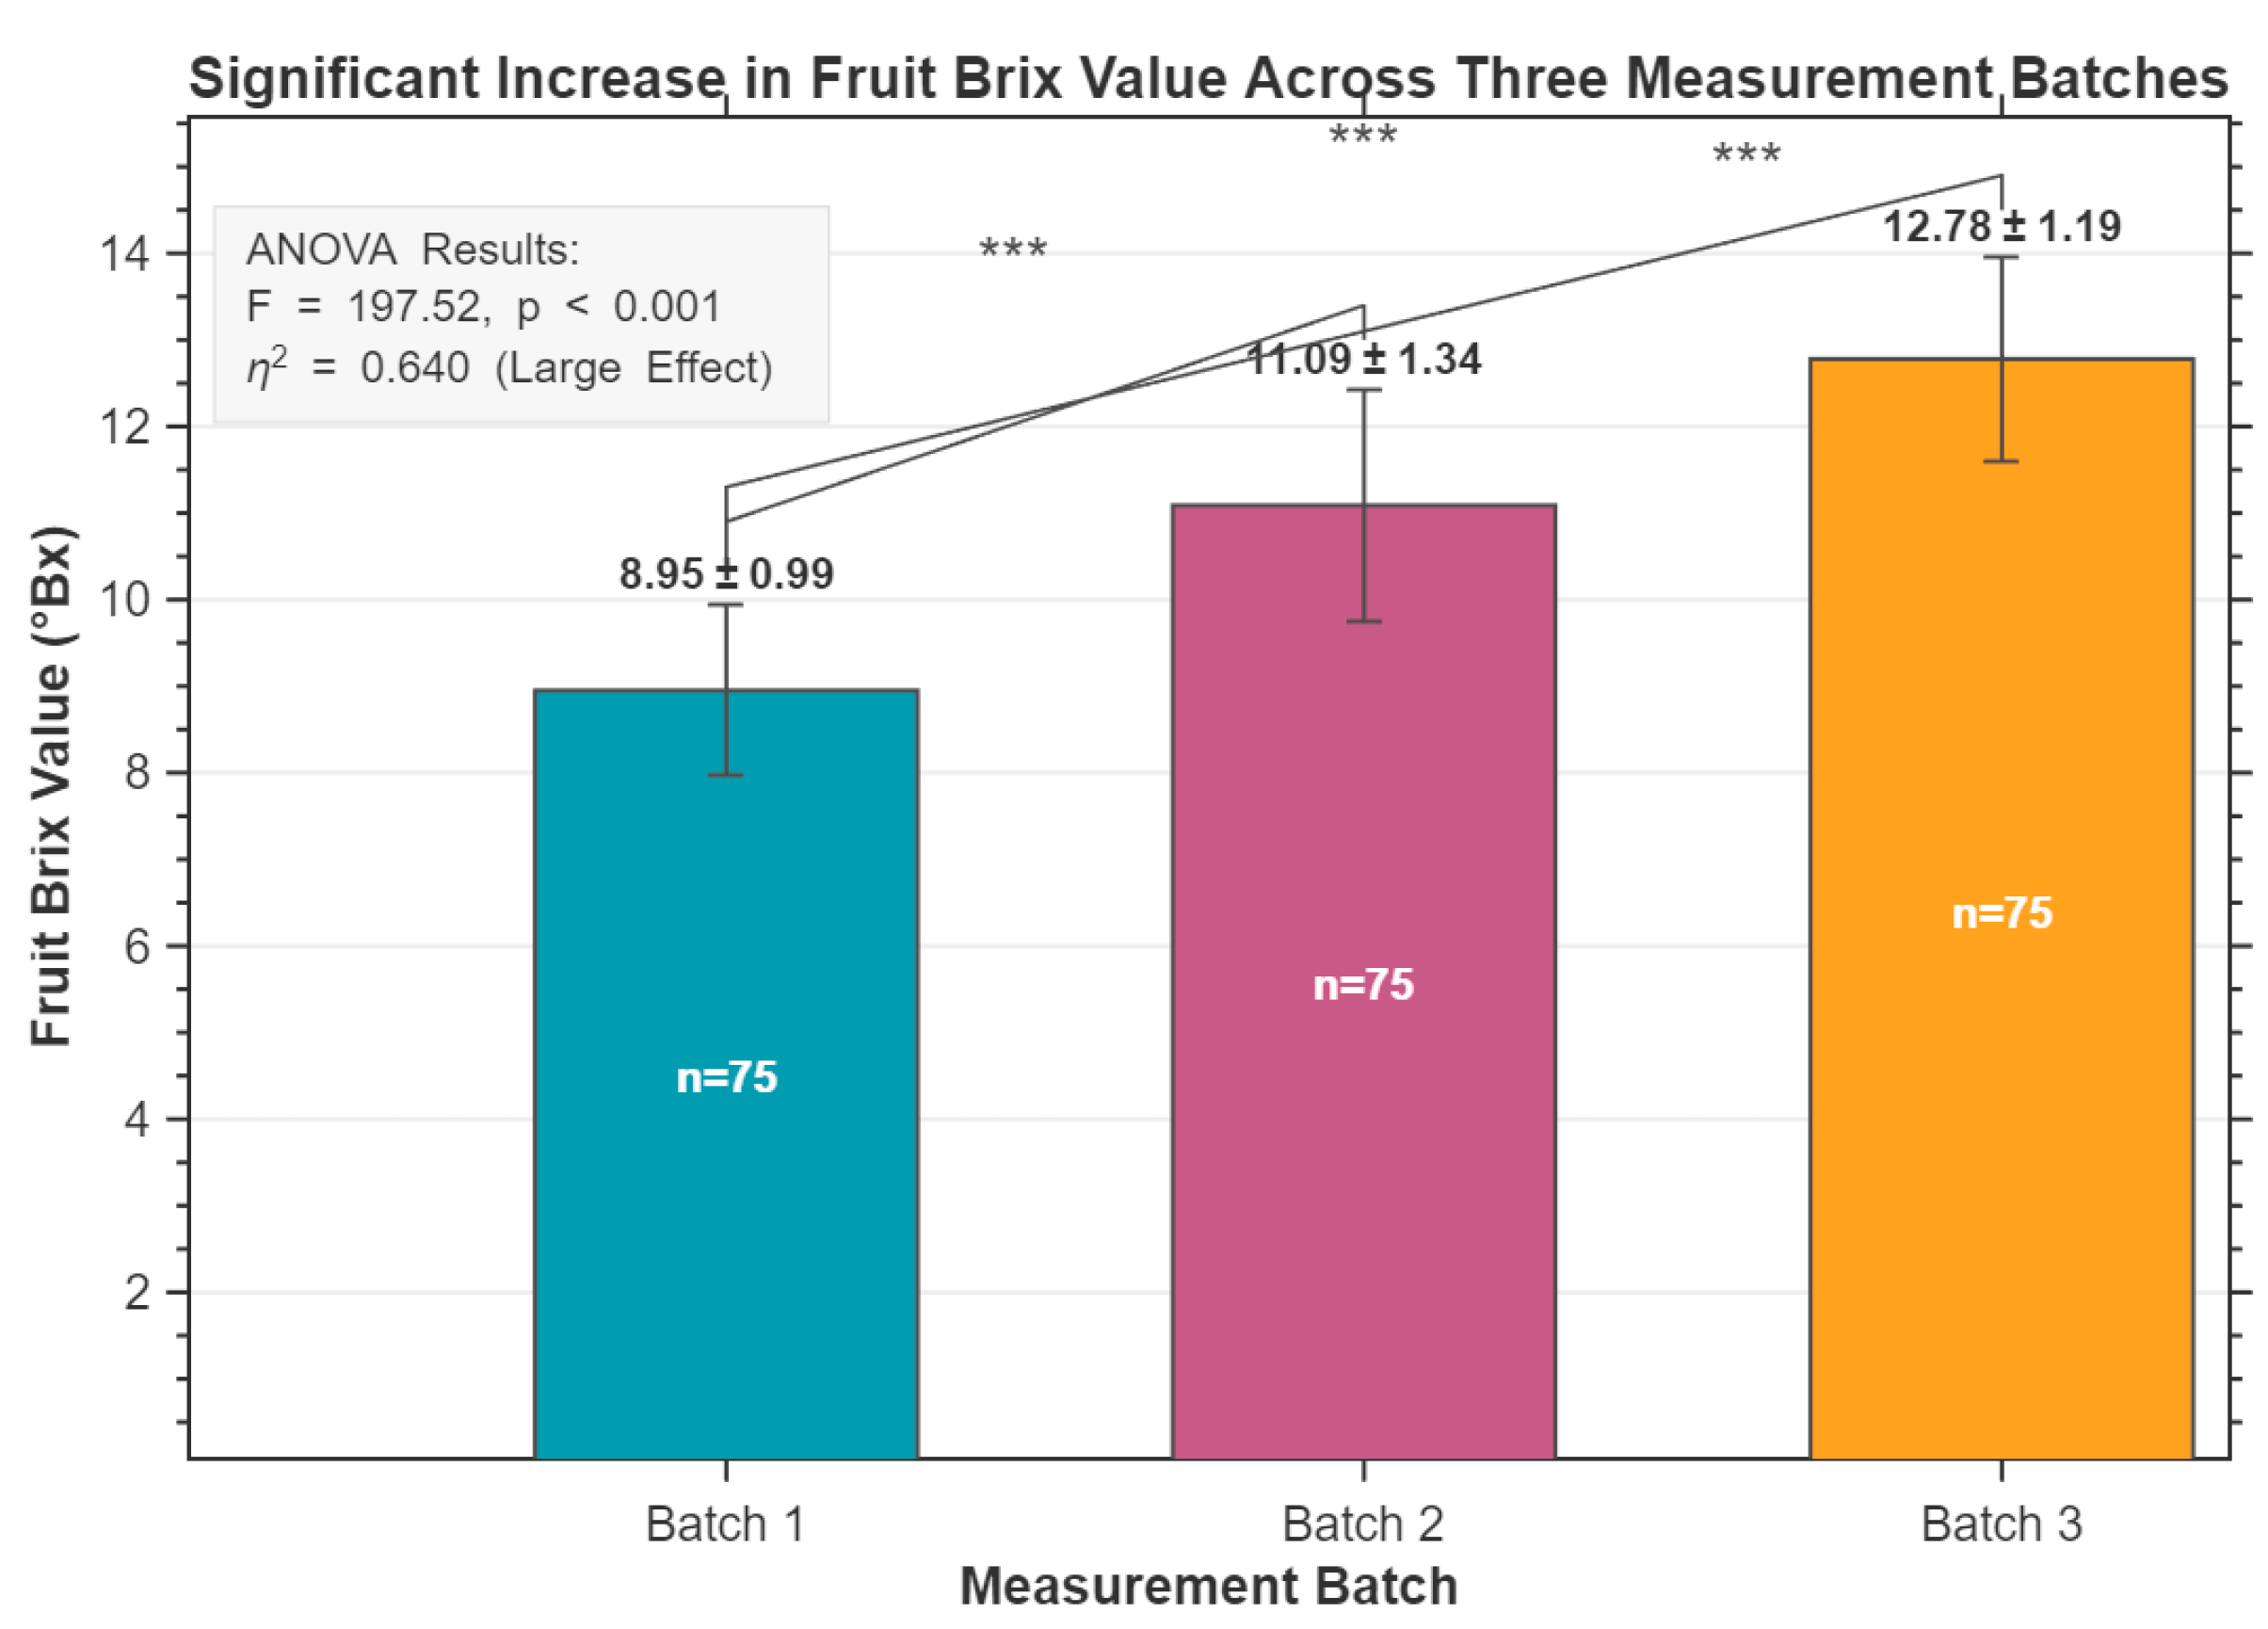
To clarify the distribution of sugar content in the samples and the patterns of variation across growth stages, a statistical analysis was conducted on the sugar content data of 225 samples. The results are shown in Table 1 and Figure 3. The overall sugar content of the samples ranged from 6.90 to 13.80 °Brix, with a mean of 10.94 °Brix and a standard deviation of 1.96 °Brix, indicating significant variation in sugar content among the samples and confirming their representativeness for modeling. When analyzed by batch, the average fruit sugar content increased significantly as the growing season progressed (from October 1 to November 20) (p < 0.01, one-way ANOVA). The first batch (early color change) averaged 8.95 °Brix (standard deviation 0.99 °Brix, lowest variability), the second batch (mid-to-late color change) averaged 11.09 °Brix (standard deviation 1.34 °Brix, highest variability), while the third batch (harvest period) averaged 12.77 °Brix (standard deviation 1.19 °Brix). There was a highly significant difference in average sugar content between the first and third batches (p < 0.01), a trend that reveals the dynamic accumulation mechanism of sugars during fruit development.
Table 1.
Statistical results of sugar content (Brix) in rock sugar orange samples.
Figure 3.
Analysis of sugar content increase in Bingtang orange fruits. (Asterisks denote statistically significant differences from post-hoc multiple comparisons after one-way ANOVA. *** indicates p < 0.001, meaning the difference between the two connected batches is highly statistically significant.).
3.2. Analysis of Hyperspectral Data Preprocessing Effects
Prior to spectral post-processing, this study performed outlier detection on the raw spectral data using the Modified Z-score method based on the Median Absolute Deviation (MAD) to enhance statistical robustness. The degree of deviation was quantified by calculating the Euclidean distance between each sample’s spectrum and the average spectrum of the dataset; subsequently, the Modified Z-score was calculated based on the MAD values of the distance distribution, with a threshold set at 3.5. Samples with an absolute value of the Modified Z-score greater than 3.5 were identified as outliers. To ensure consistency in the analysis, this outlier removal process was applied uniformly to all subsequent preprocessing stages. In this study, 8 outlier samples presenting extreme spectral fluctuation or internal fruit deterioration were identified and removed from a total of 225 samples, leaving 217 valid samples (72 for Batch 1, 73 for Batch 2, 72 for Batch 3) for subsequent modeling analysis.
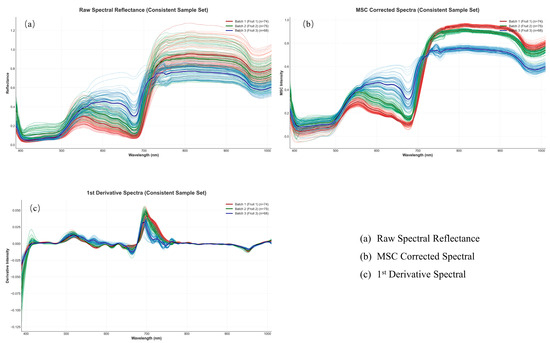
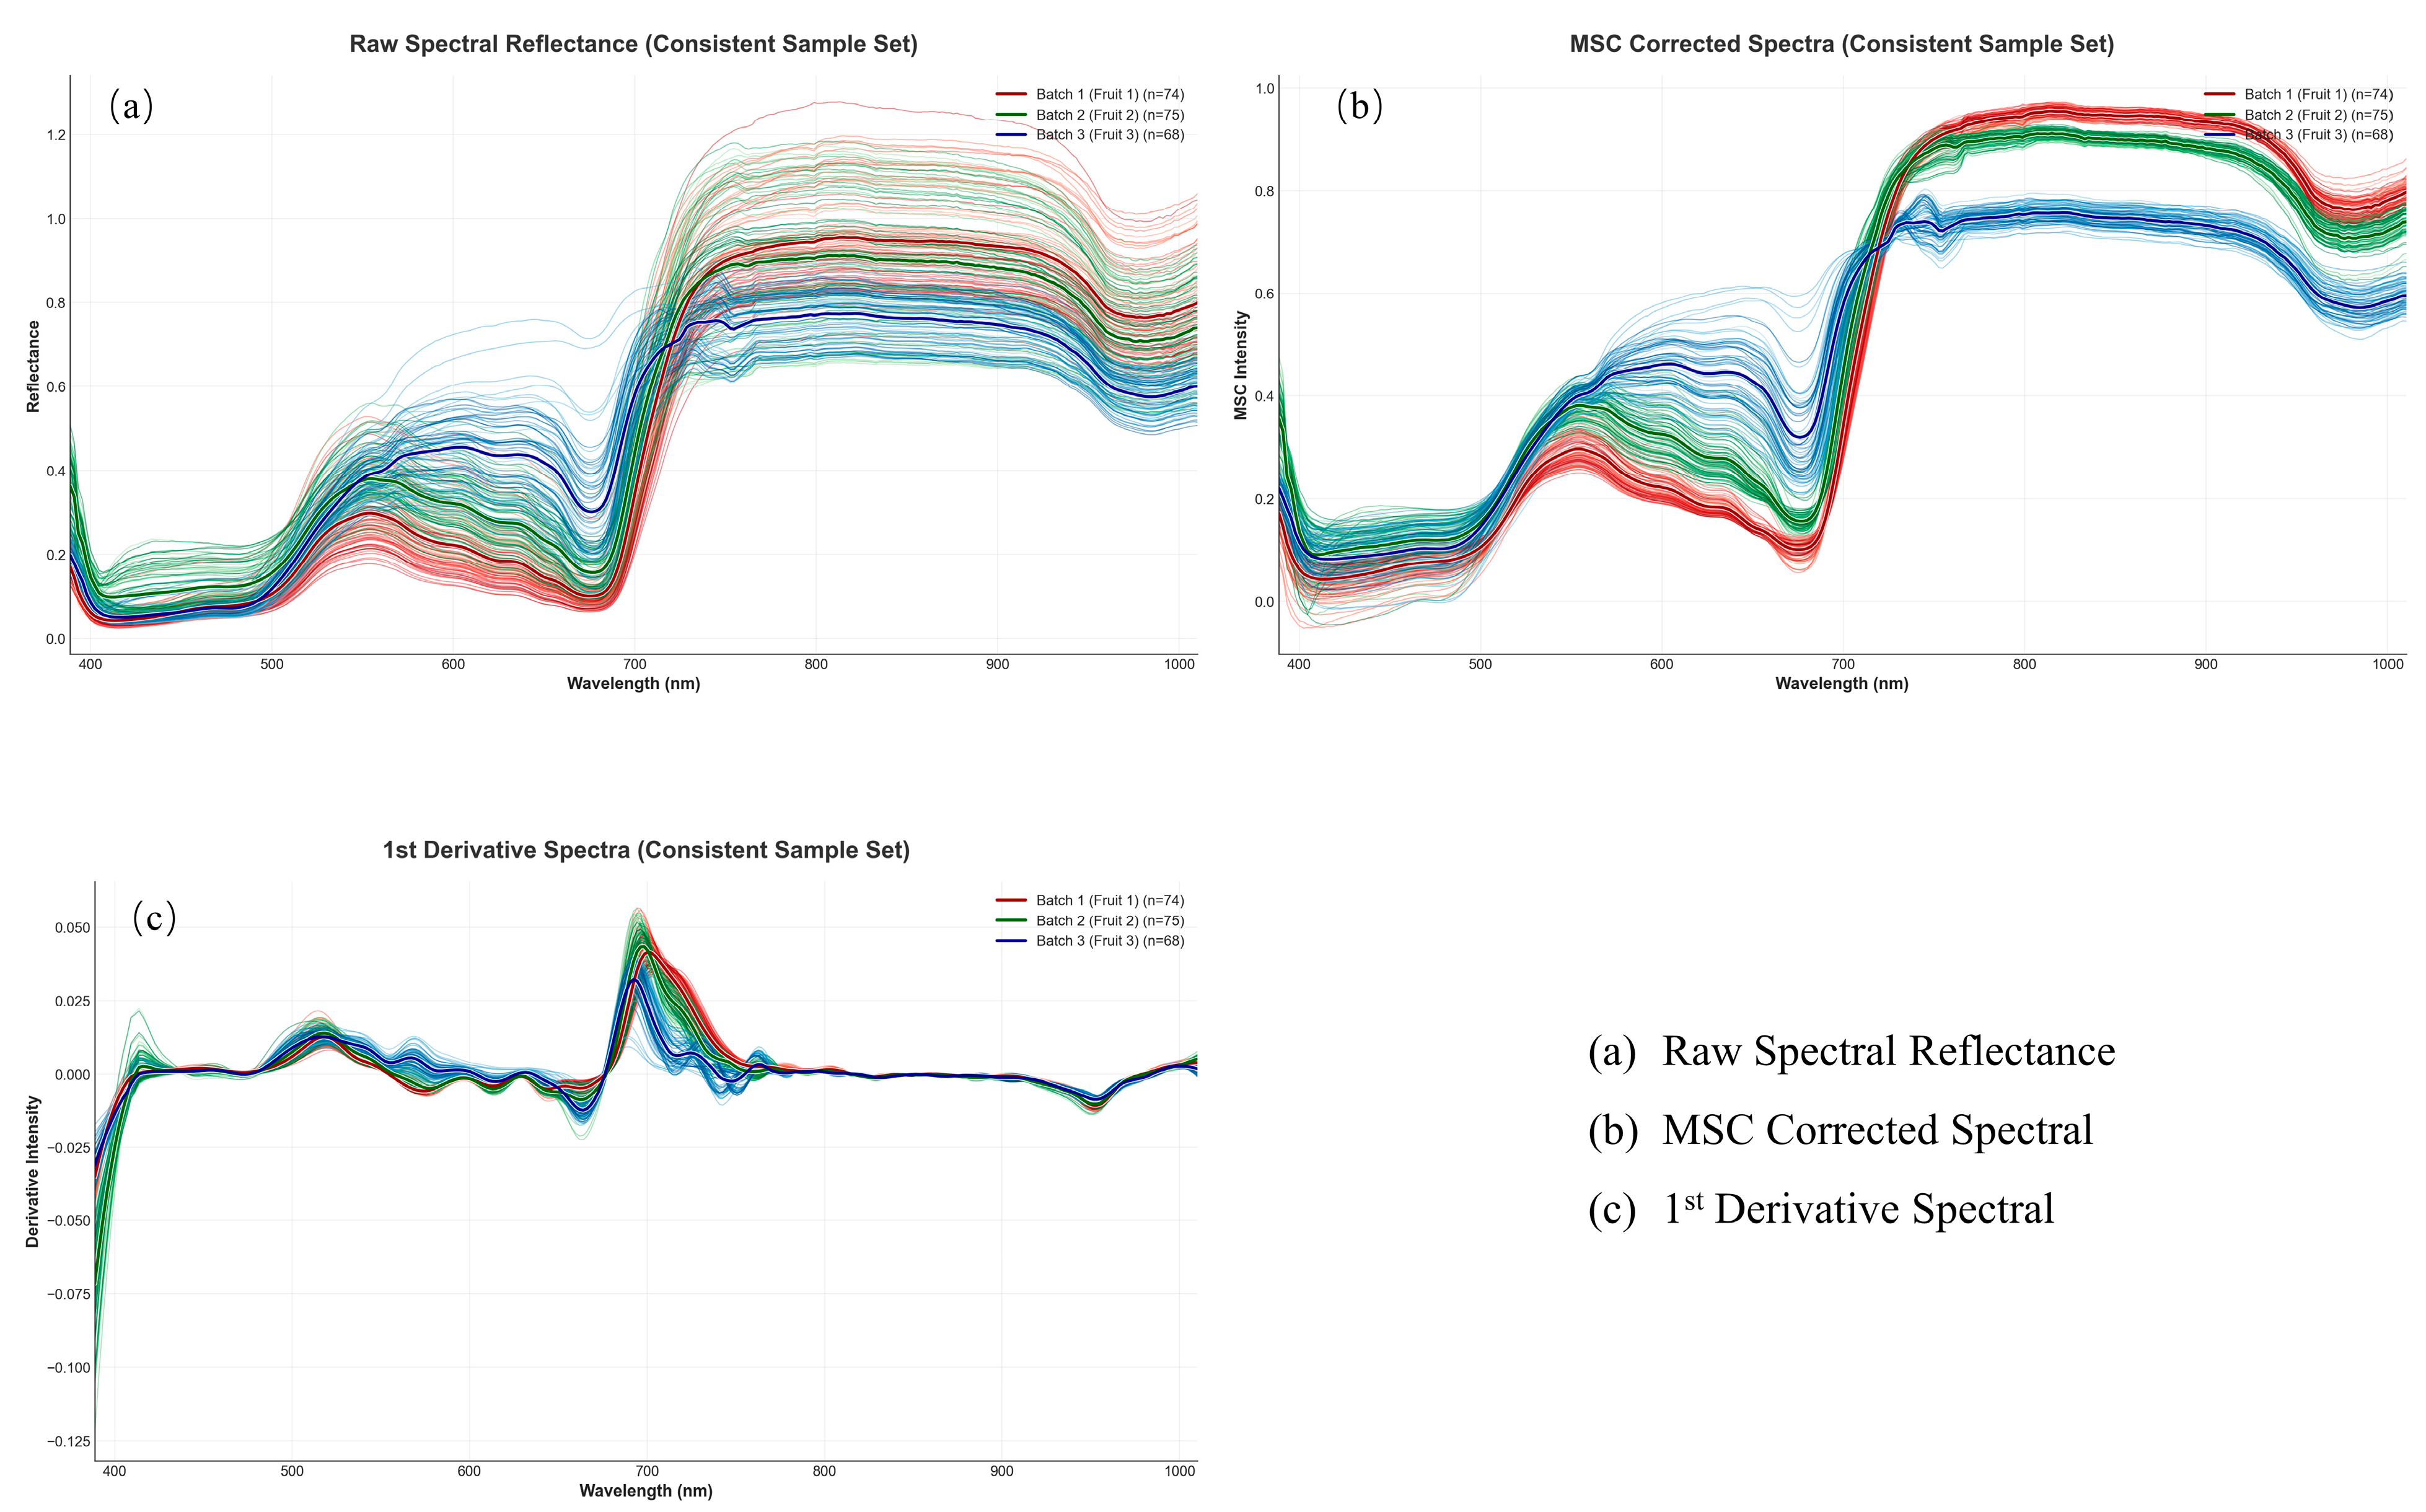
As shown in Figure 4, after outlier removal, the dispersion of the raw spectra decreased significantly, the overlap of curves within the same batch increased, and interference was effectively eliminated. The overall trend aligns with the optical properties of citrus fruits [23]: reflectance fluctuates upward in the 400–700 nm visible light region, and in the near-infrared region beyond 700 nm, it jumps to a high range of 0.6–1.2. Furthermore, the corrected spectra of the mature fruit batch (Batch 3) collected in the third round still maintain low reflectance characteristics in the 700–1000 nm range. After spectral image processing, noise in the spectra of the three fruit batches was effectively suppressed, and the signal-to-noise ratio was significantly improved. Distinct characteristic absorption peaks were observed at 413.7, 518.8, 696.4, and 762.7 nm [24,25,26,27]. The formation of these characteristic peaks at each wavelength is closely related to the characteristic chemical bond vibrations and molecular absorption properties of sugars and related substances in the fruit, providing key spectral evidence for sugar content prediction.
Figure 4.
Original reflectance spectra and spectral response after main preprocessing of Bingtang orange fruits.
It is worth noting that Batch 3 exhibits higher intensity and sharper peak shapes for the derivative peaks near 700 nm. As this region lies at the boundary between visible and near-infrared light, it can simultaneously capture absorption information from pigments such as chlorophyll and vibrational signals from sugar-related chemical bonds, demonstrating potential as a key spectral band for sugar content prediction. The manifestation of the aforementioned spectral features provides reliable experimental evidence the effectiveness of the adopted preprocessing scheme in noise reduction, enhancing the distinctiveness of characteristic peaks, and preserving valid spectral information, thereby providing a reliable spectral basis for the subsequent construction of quantitative sugar content prediction models.
3.3. Model Prediction Results Based on the CARS Algorithm
Based on preprocessing and outlier removal, characteristic wavelengths were screened using the CARS algorithm, and six models were constructed to predict sugar content, with the aim of clarifying the compatibility of CARS features with each model and their predictive performance.
3.3.1. CARS Feature Screening Results
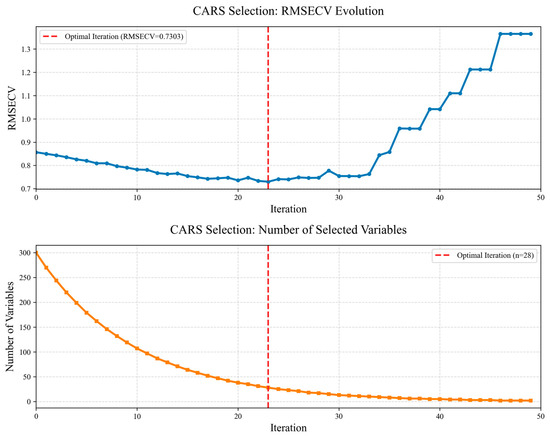
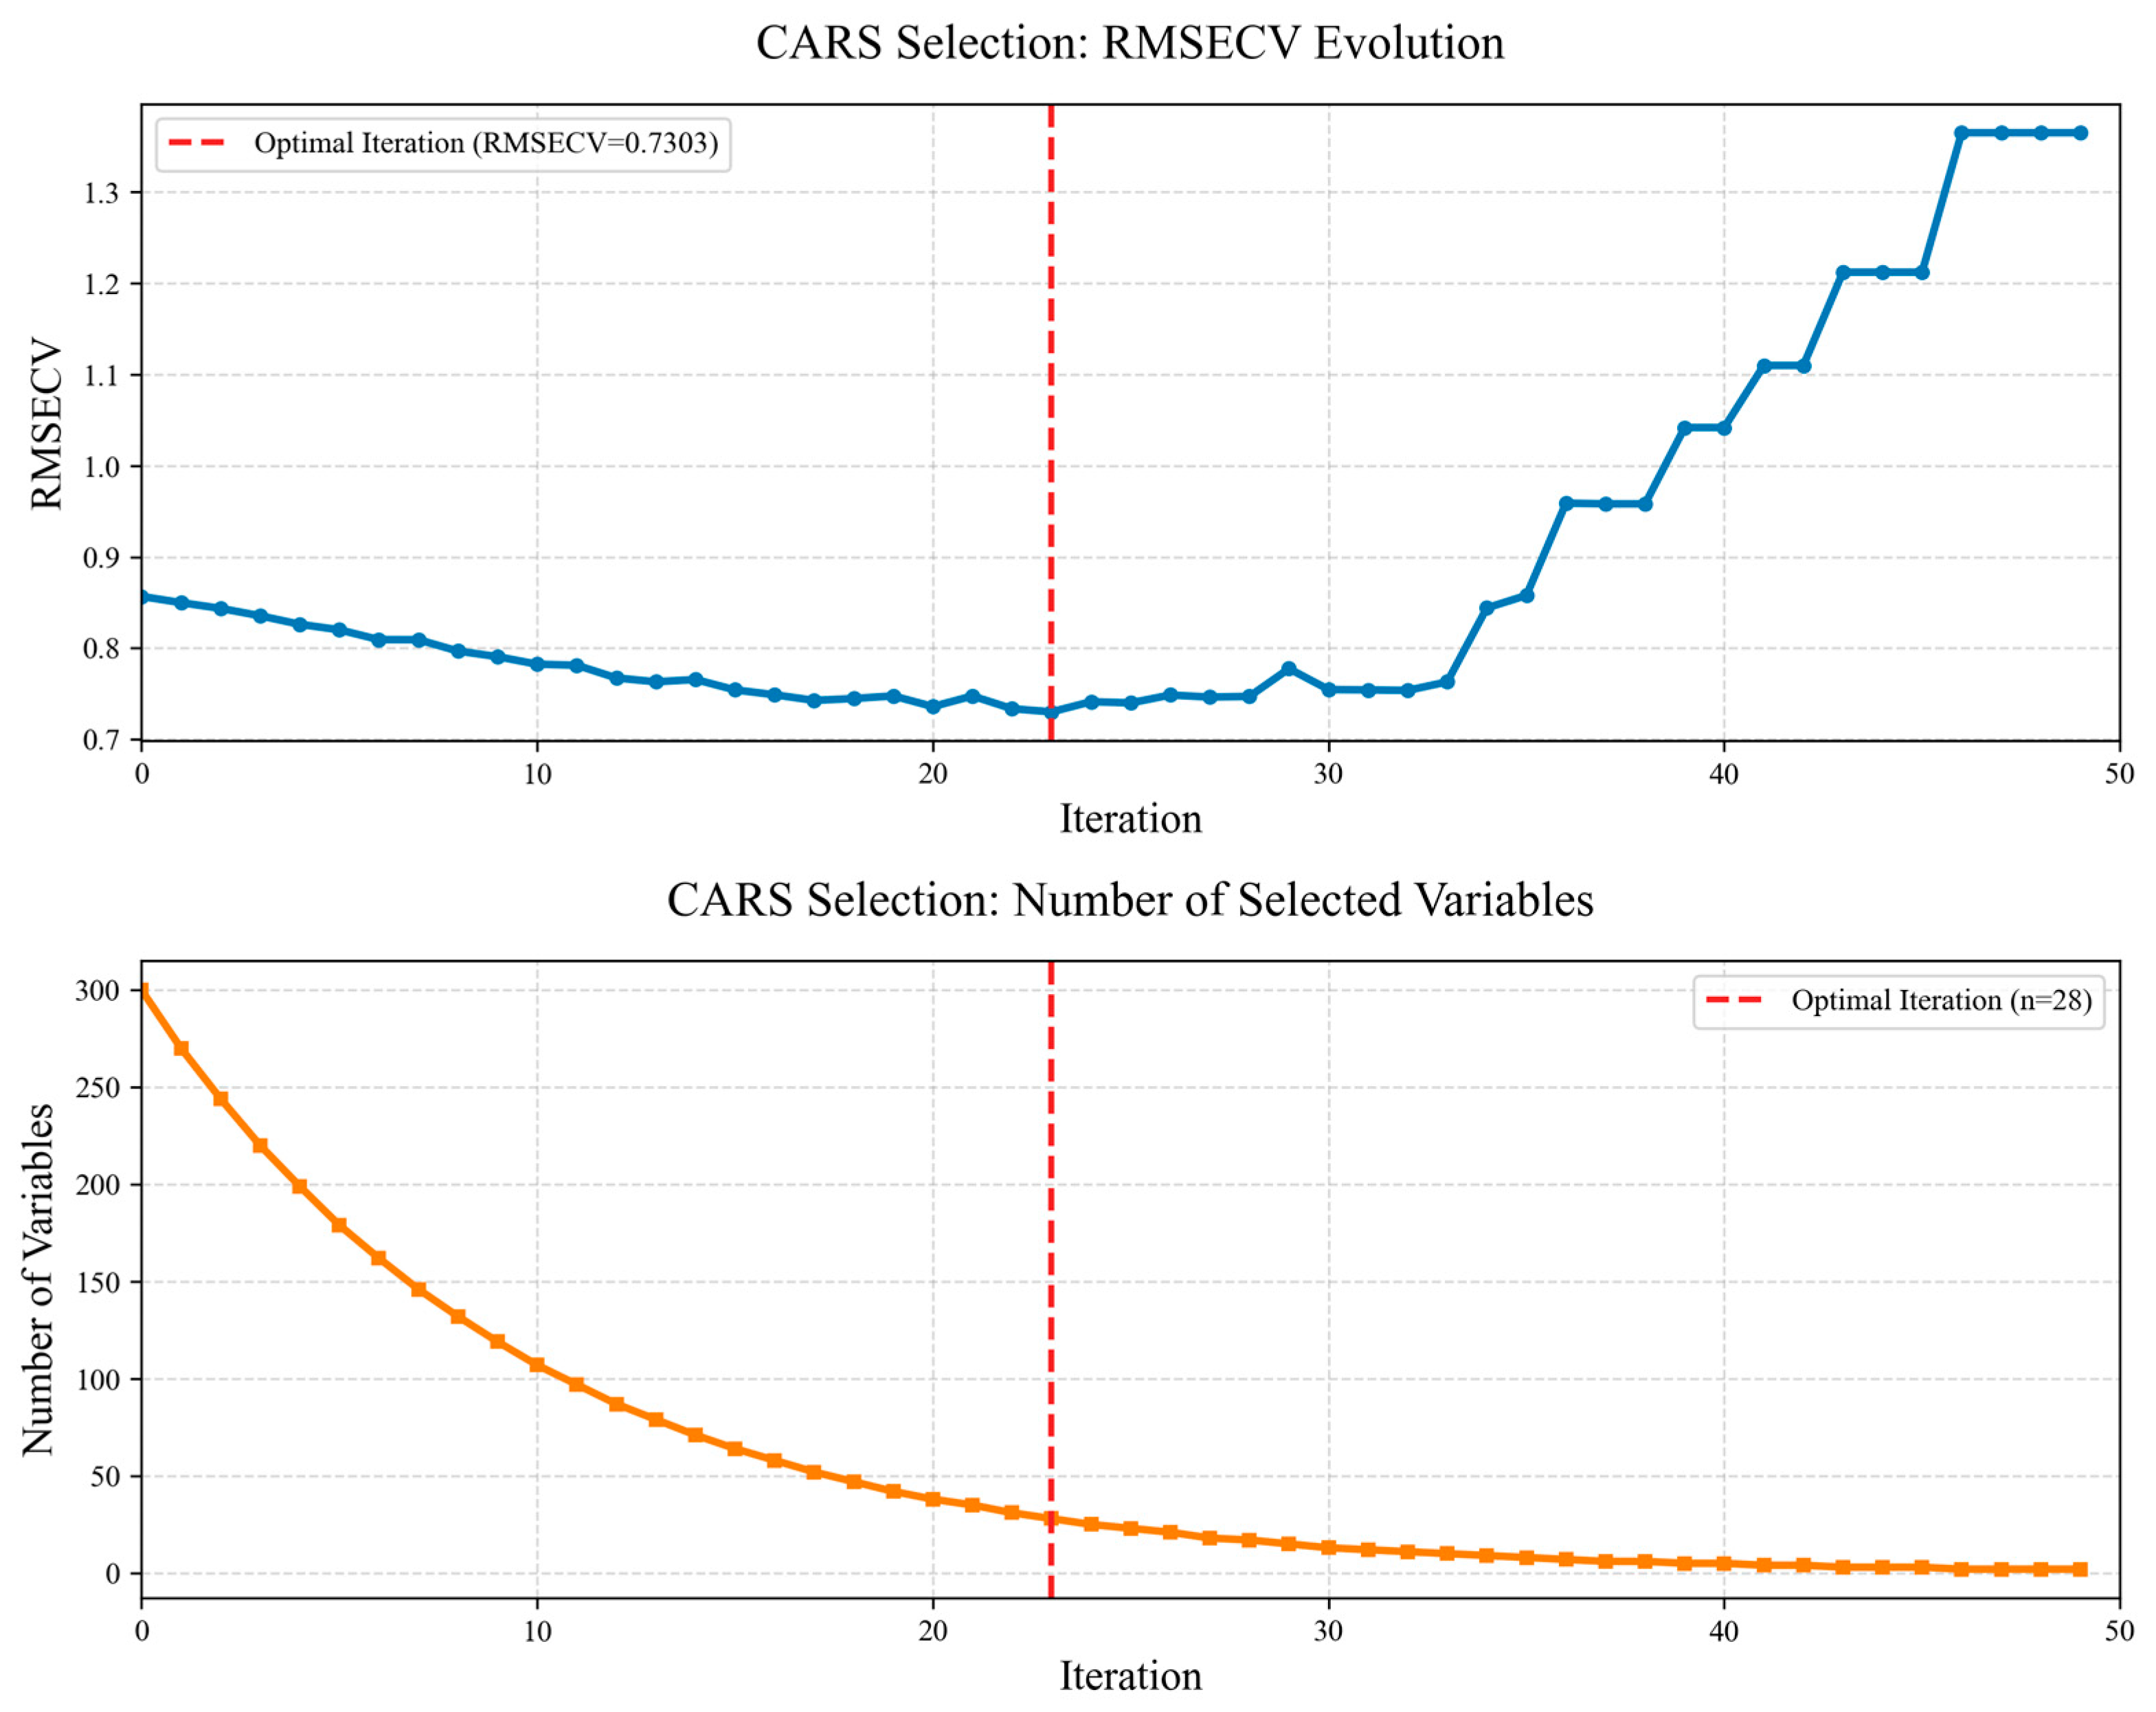
The CARS iterative screening process is shown in Figure 5. As the number of iterations increased from 0 to 50, the number of selected features decreased exponentially from over 300 to fewer than 10; The root mean square error of cross-validation (RMSECV) first decreased and then increased, forming a typical “trough” curve. This is because the initial removal of redundant noise bands improved model accuracy, while excessive screening in the later stages led to a loss of useful information, causing accuracy to decline. When the number of iterations reached 23, the RMSECV dropped to a minimum (0.7303), indicating that the model had reached the optimal balance between predictive accuracy and variable complexity, with a total of 28 feature wavelengths selected.
Figure 5.
CARS iteration process and optimal number of iterations (the top figure shows the trend of RMSECV, and the bottom figure shows the trend of the number of features, clearly indicating that the 23rd iteration is the optimal point.).
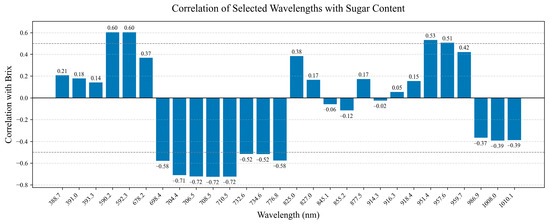
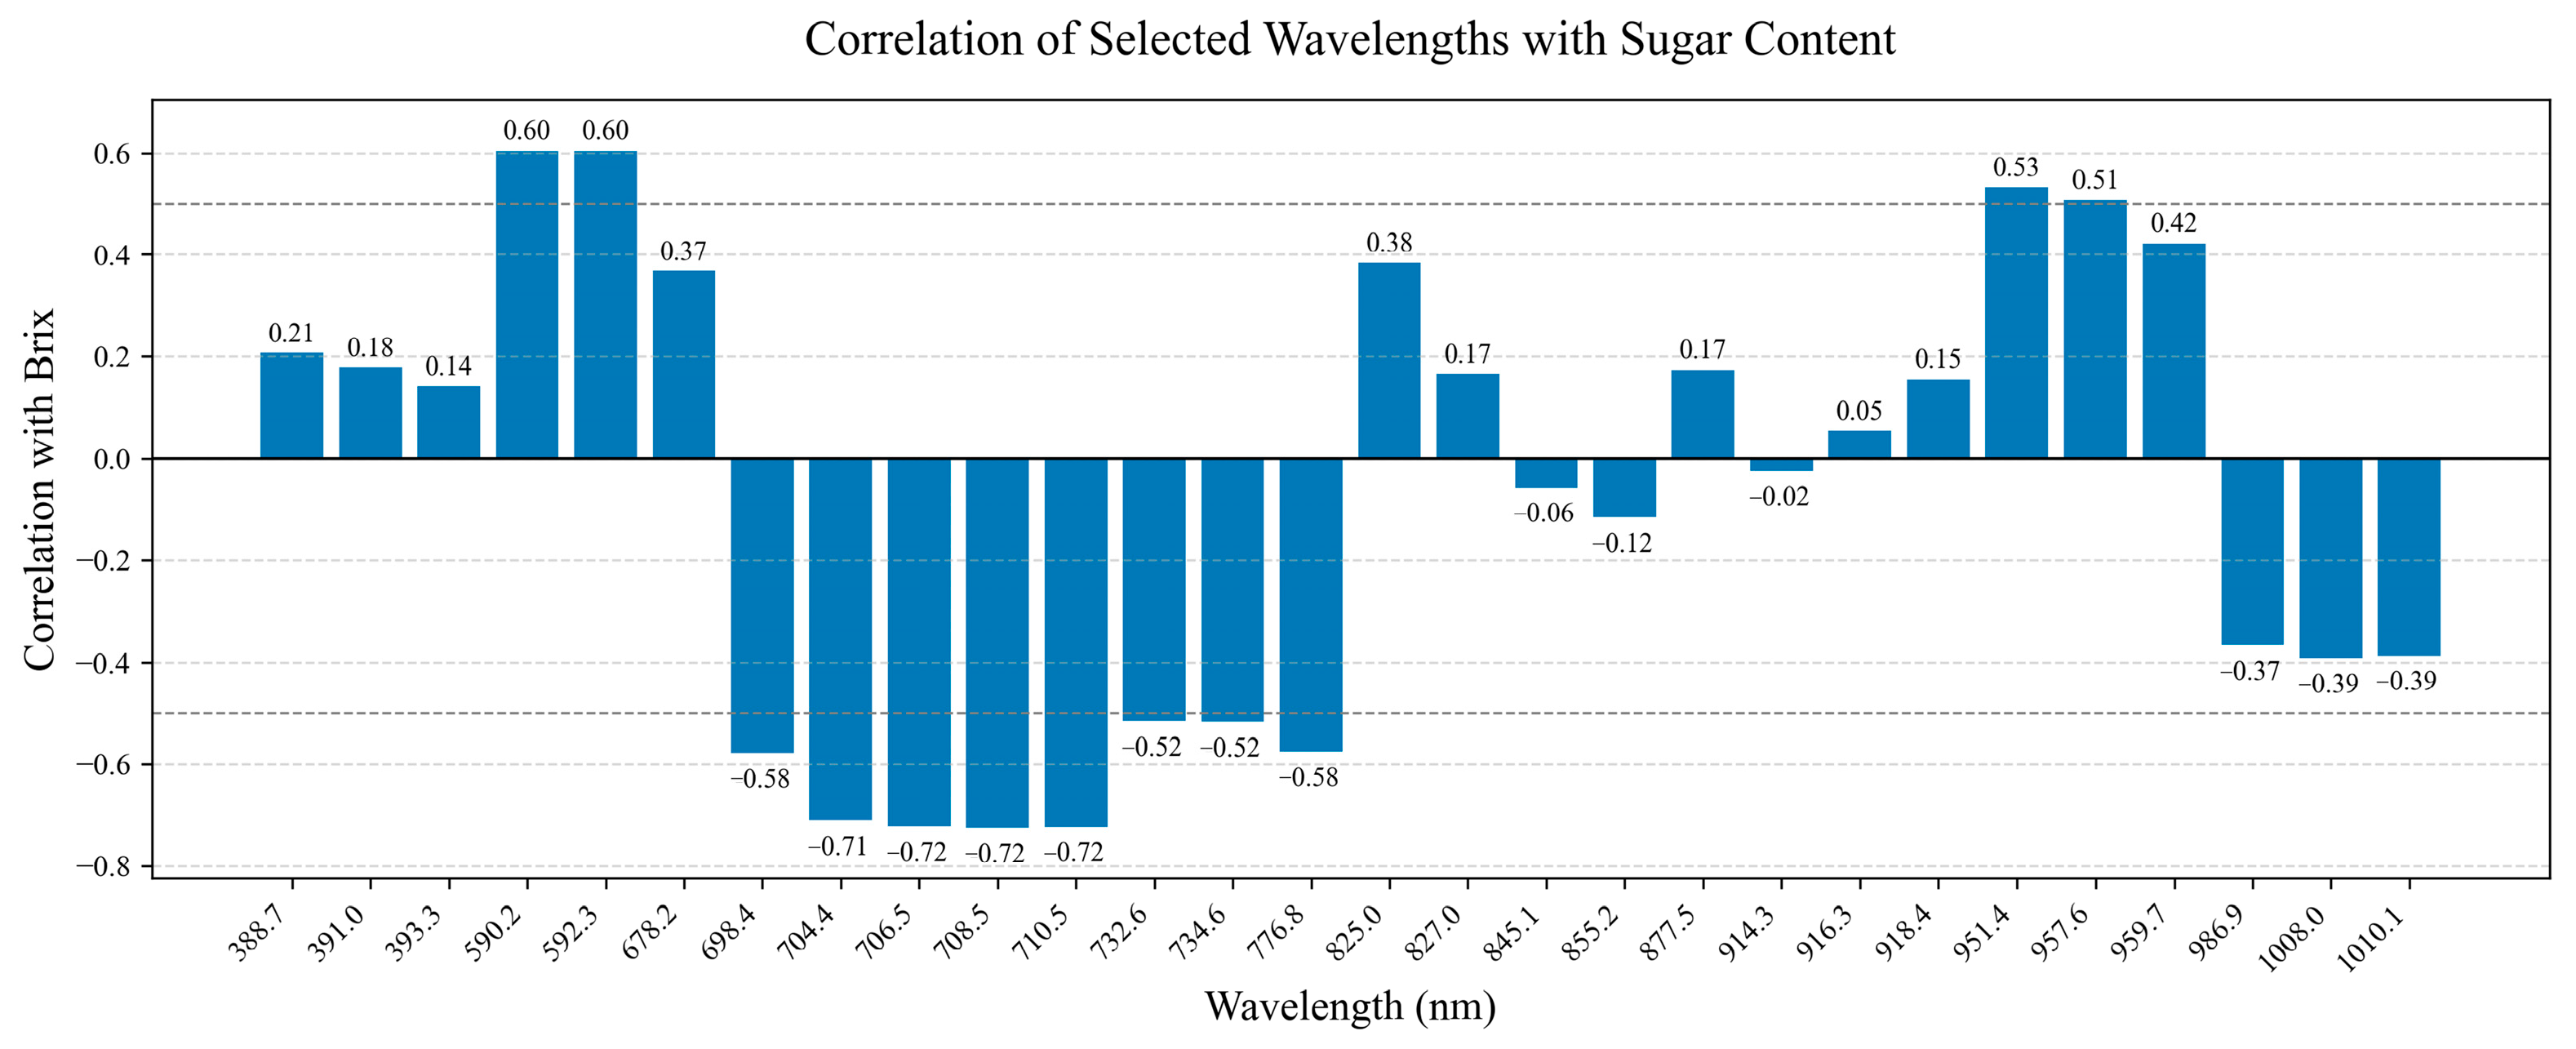
The correlation between the 28 characteristic spectral bands and sugar content is shown in Figure 6. The bands are distributed in the range of 388.7–1010.1 nm, with the core correlation bands being particularly significant: the 706.5–710.5 nm band shows a strong negative correlation with sugar content (correlation coefficient −0.72), while 592.3 nm and 951.4 nm show strong positive correlations (correlation coefficients of 0.60 and 0.53, respectively). These results are highly consistent with existing research: Zhao et al. found that 704.48–805.26 nm is the optimal range for predicting apple sugar content [28]; Chen et al. noted that the region around 914 nm is significantly correlated with fruit sugar content [29]; and the correlation in the red light region (680–750 nm) is consistent with the conclusions of Tomislav et al. [30]. From a near-infrared spectroscopy mechanism analysis, the 704.4–708.5 nm band is located near the absorption regions of the third harmonic of the O-H bond and the sum frequency of the C-H bond. The accumulation of sugars leads to changes in the concentration of these groups in the fruit’s internal water and carbohydrates relative to the microenvironment, thereby causing enhanced absorption and reduced reflectance in this region, which manifests as a strong negative correlation with sugar content. The band near 592.3 nm may be related to the second harmonic of the C–H bond, while the band at 951.4 nm falls within the typical absorption range of the second harmonic of the O–H bond [31], which are key chemical functional groups influencing the internal quality and sugar content of citrus fruits. Although these references are based on apples and Lycium barbarum with different fruit tissue matrices, the vibration absorption rules of C-H and O-H chemical bonds in carbohydrate molecules are universal across fruit species. The strong correlation of these bands with sugar content essentially reflects the sensitivity of near-infrared spectroscopy to changes in hydrogen-containing components within the fruit, validating the scientific validity and universality of the screening criteria. Therefore, the band correlation trends can provide approximate theoretical support for this ‘Bingtang’ orange study, while the exact correlation coefficients vary due to differences in fruit peel thickness, cell structure and internal water content.
Figure 6.
Correlation analysis between characteristic bands and sugar content.
3.3.2. Comparison of Model Performance
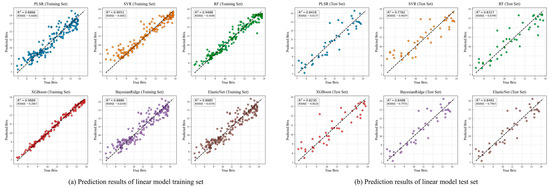
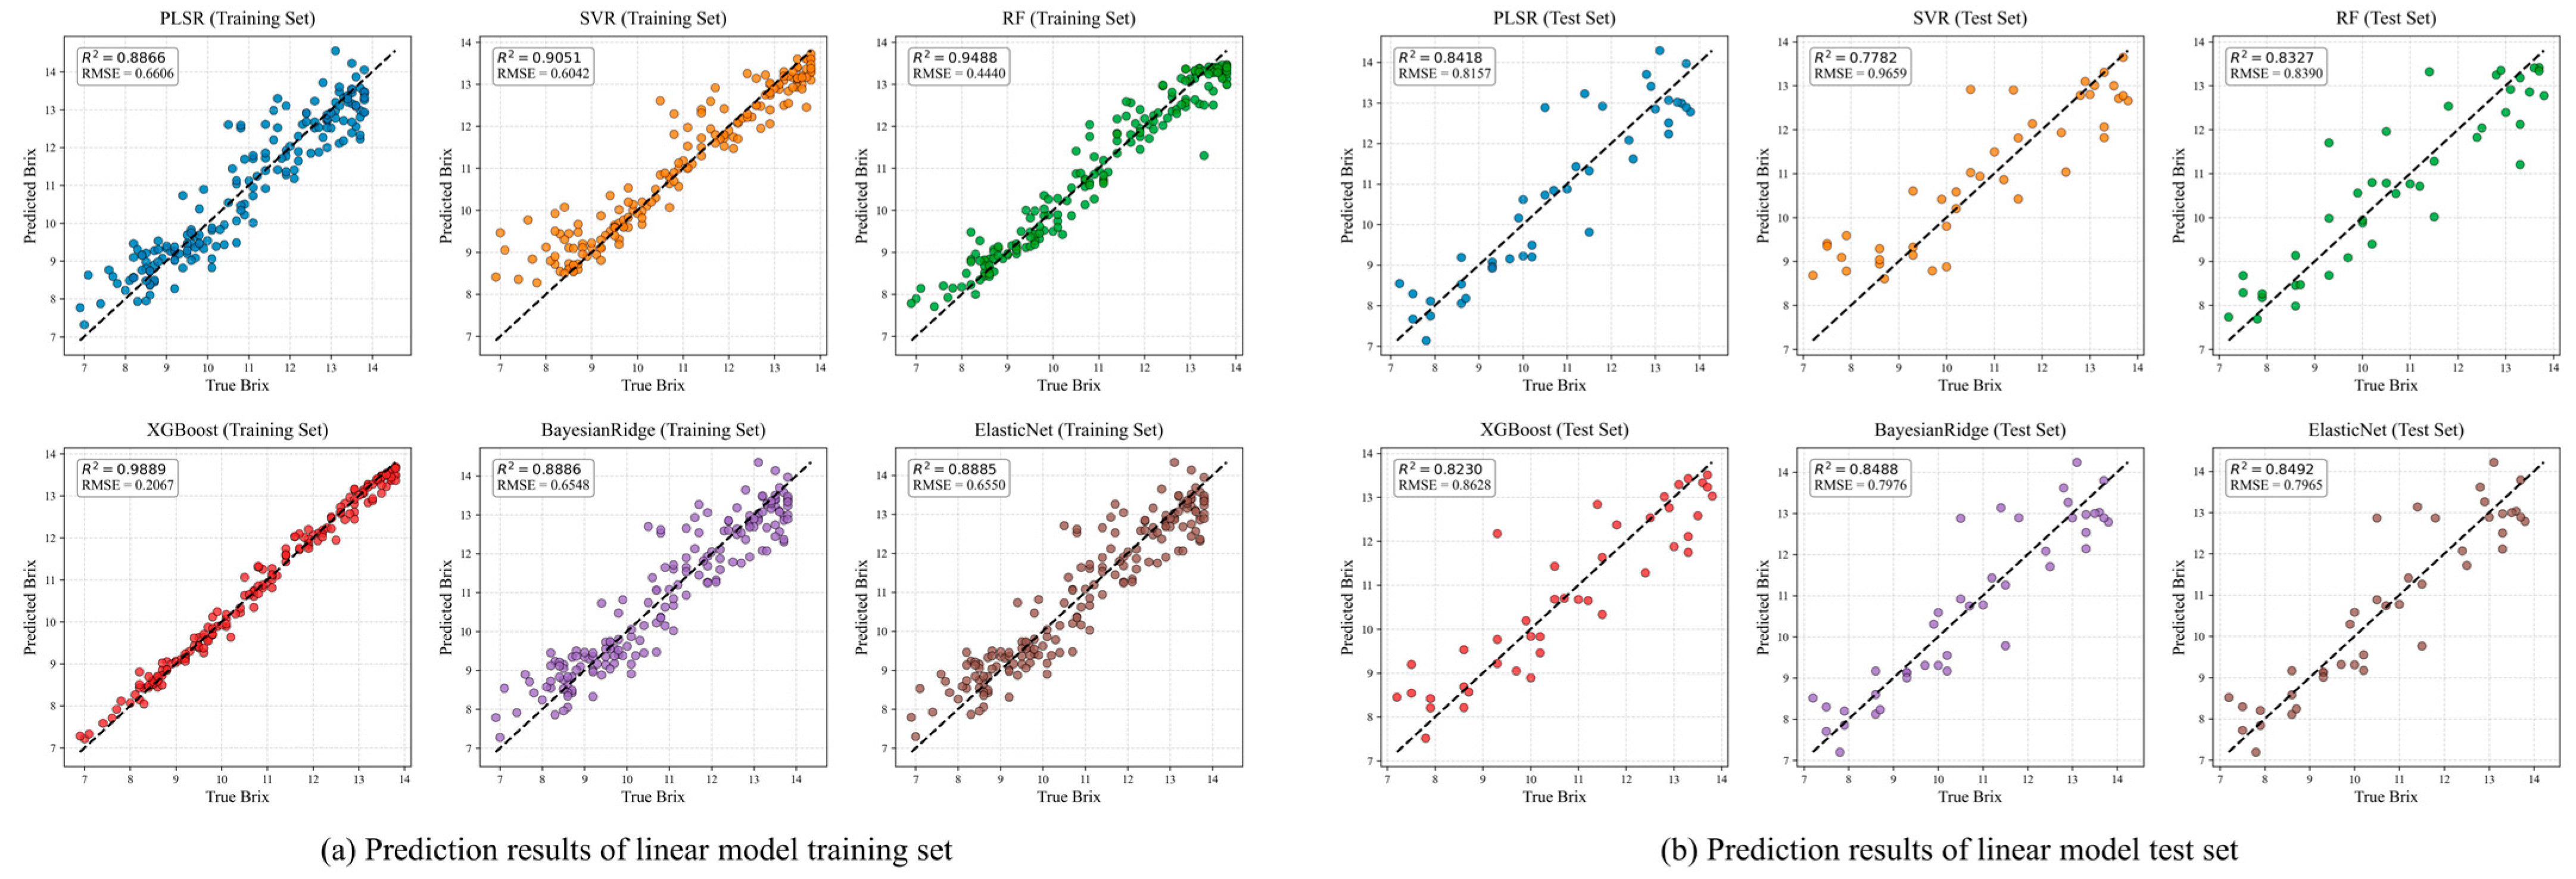
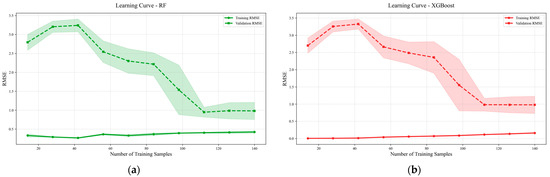
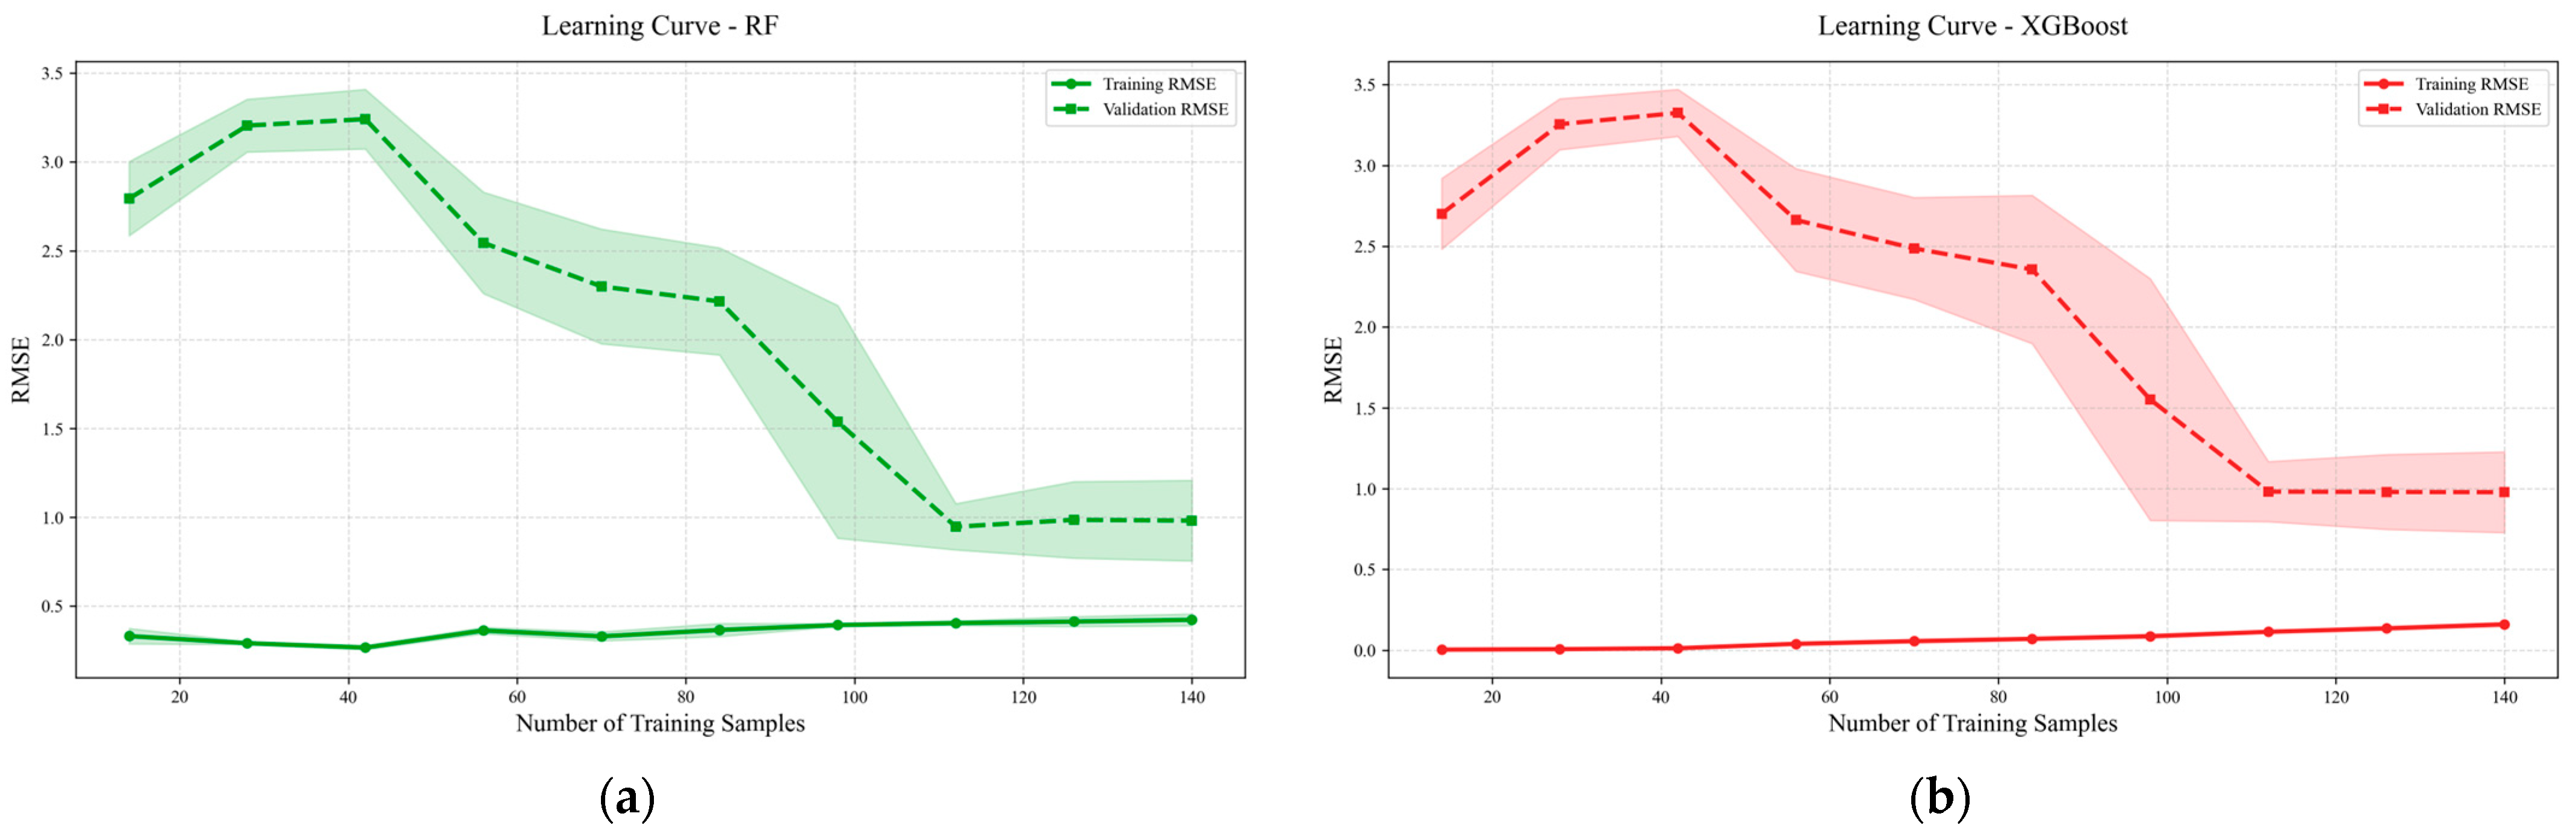
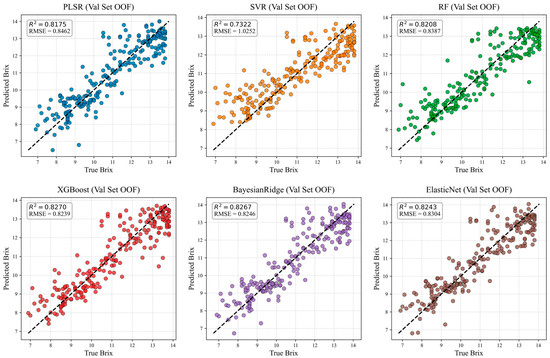
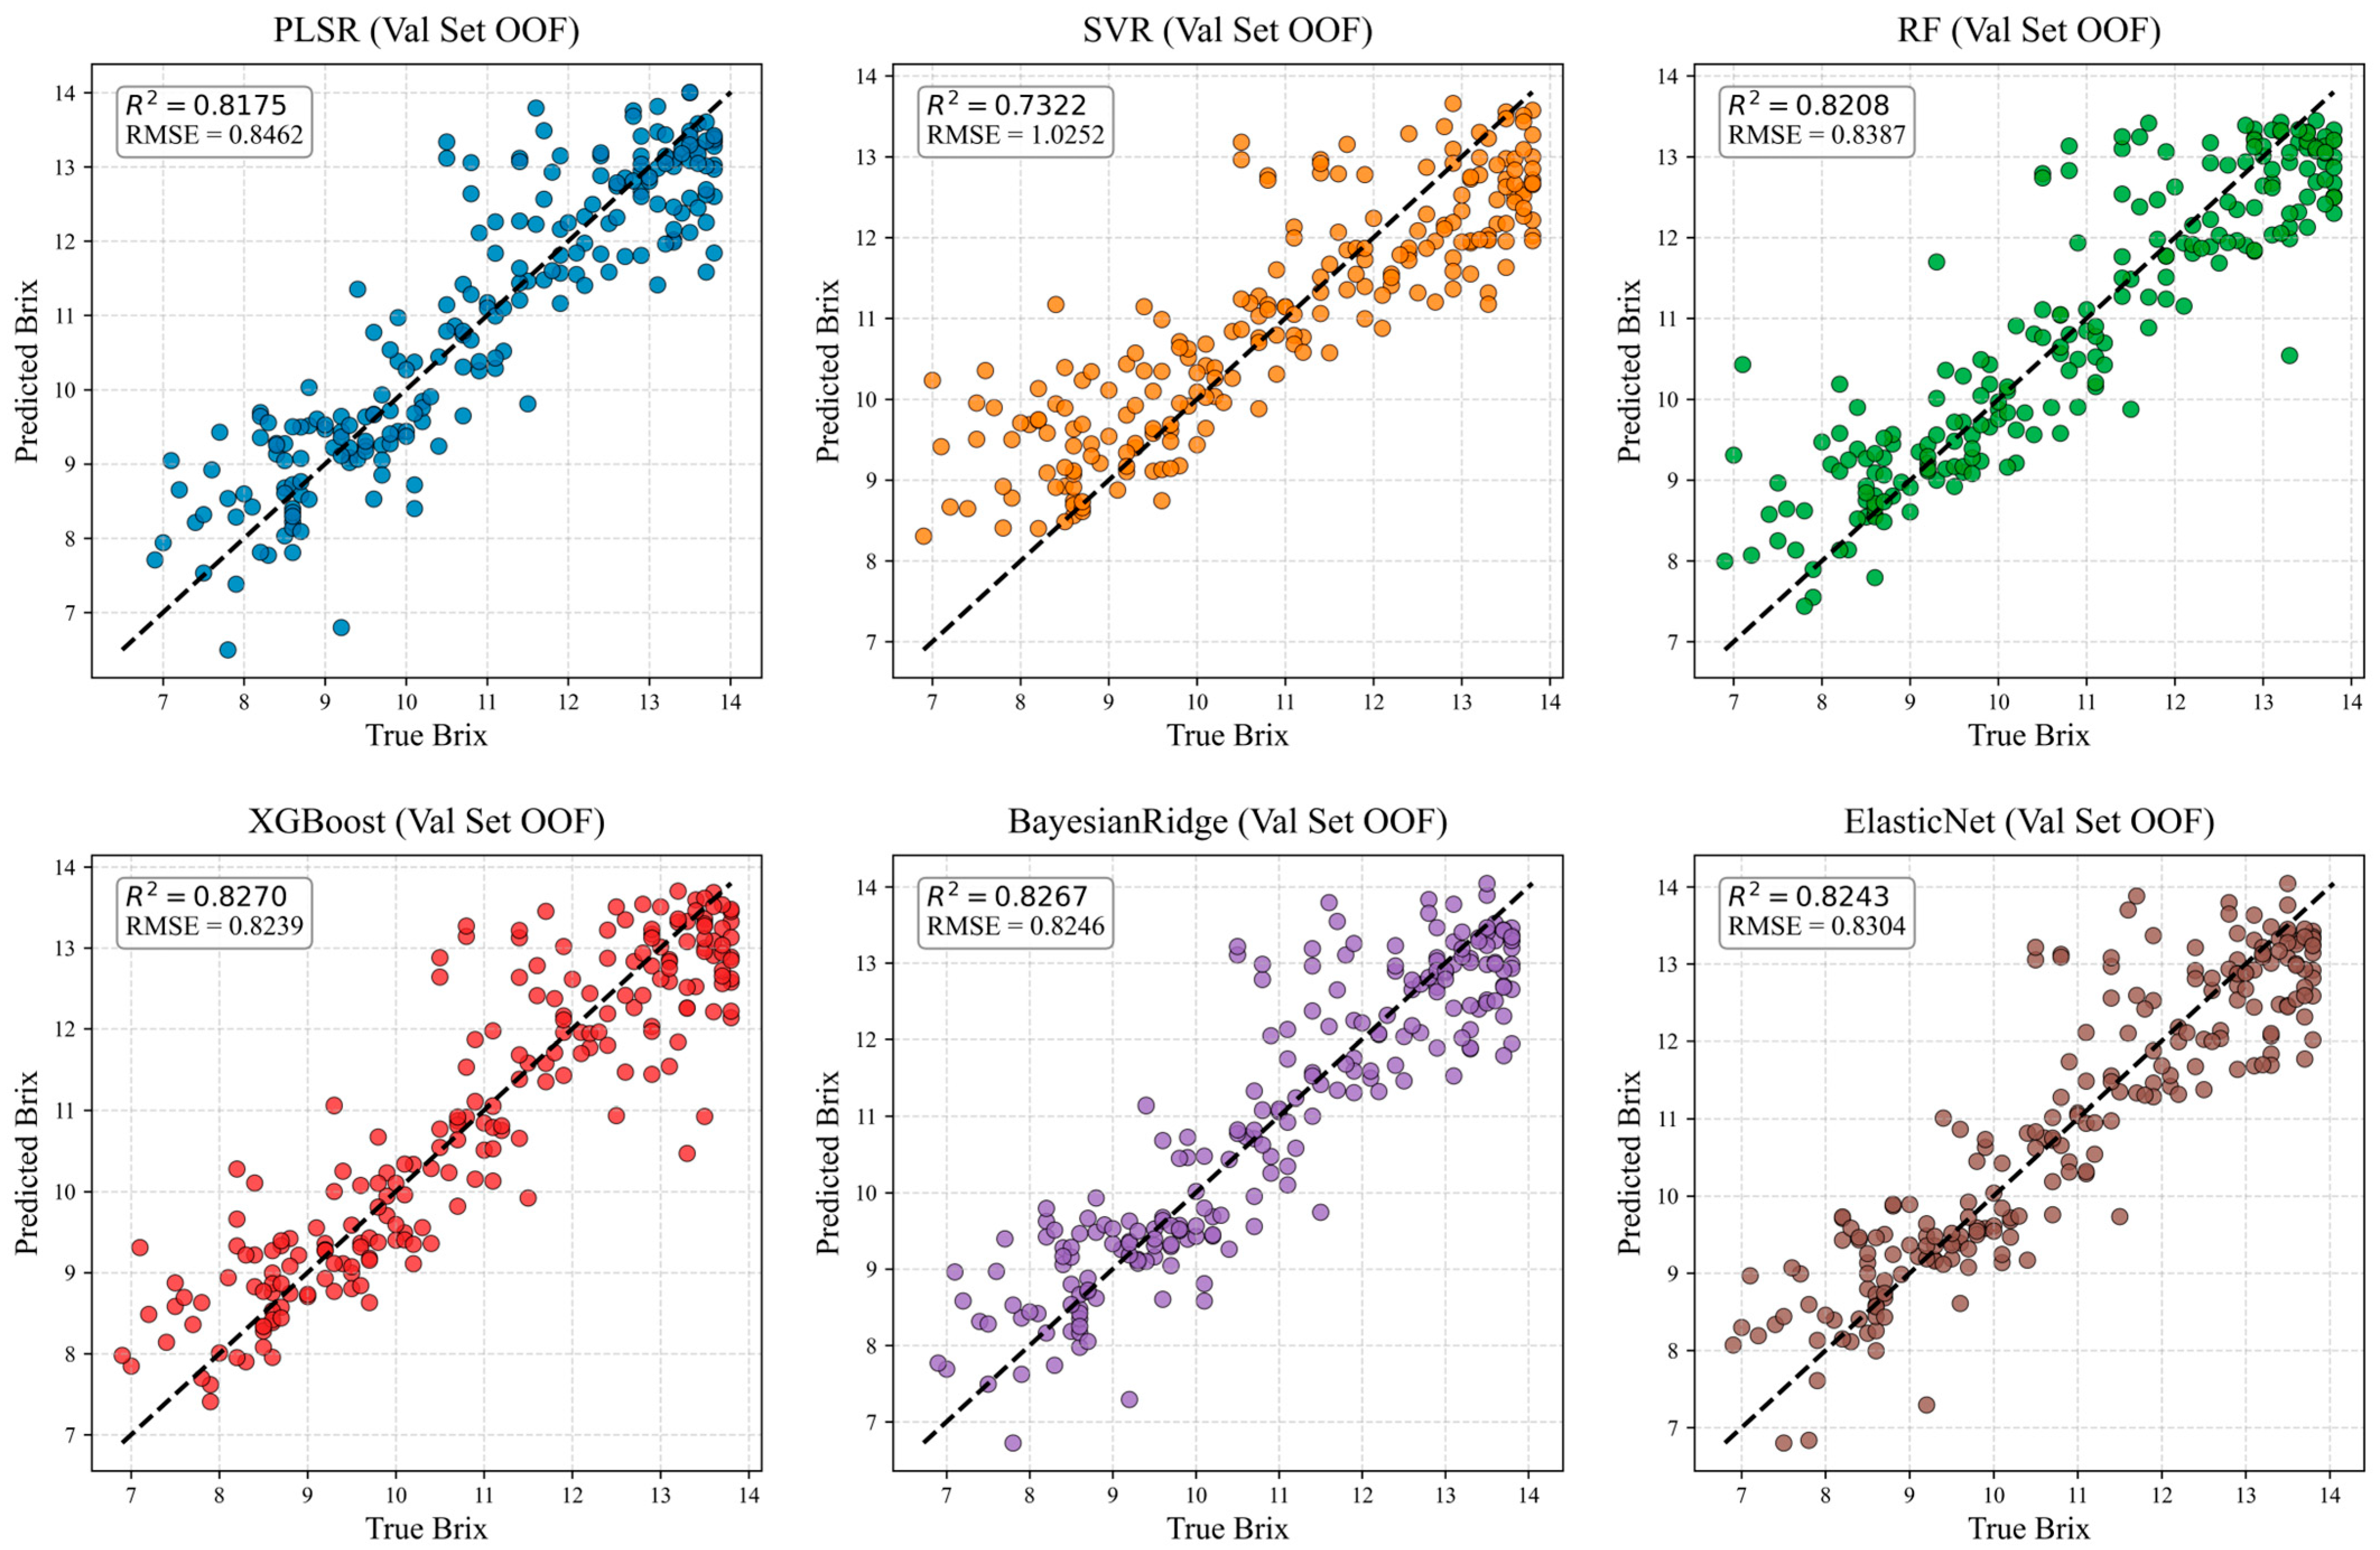
The performance of the six models based on CARS features is shown in Table 2 and Figure 7. As shown in Table 2, the regularized linear model performed best: the ElasticNet model achieved R2 = 0.8492, RMSE = 0.7965, and MAE = 0.6186 on the test set; the Bayesian Ridge model performs similarly (R2 = 0.8488, RMSE = 0.7976); the PLSR model achieves an R2 of 0.8418, confirming the dominant linear relationship between spectral data and sugar content. Non-linear models exhibit a significant risk of overfitting: the RF and XGBoost models demonstrated near-perfect fit on the training set (R2 values of 0.9488 and 0.9889, respectively), but their performance dropped significantly on the test set (R2 decreased by approximately 0.12–0.16), and there was a marked gap between training and testing errors, as shown in Figure 8. Although control measures such as regularization and early stopping were implemented, complex nonlinear models still tend to memorize noise in the training data rather than generalize patterns under the current sample size, leading to overfitting. The SVR model achieved an R2 of 0.7782 on the test set, indicating that the advantages of nonlinear models were not fully realized.
Table 2.
Summary of model performance metrics based on CARS features.
Figure 7.
Scatter-plots of predicted and measured sugar content.
Figure 8.
Learning curves for RF (a) and XGBoost (b).
Predictive results from the primary 8:2 independent test set illustrated that the ElasticNet model built on CARS-selected characteristic wavelengths delivered the optimal predictive performance, with a test-set R2 of 0.8492 and an RMSE of 0.7965, outperforming the other five machine learning models.
To exclude performance fluctuations caused by single random segmentation, stratified 5-fold cross-validation was further implemented for supplementary stability assessment. The averaged cross-validation indicators of all six models are summarized in Table 3, and the corresponding scatter-plots between predicted and measured sugar content under 5-fold cross-validation are displayed in Figure 9. Averaged cross-validation metrics indicated that BayesianRidge attained a marginally higher mean validation R2 (0.8252) compared with ElasticNet (0.8223), with a negligible performance gap of only 0.0029 between the two regularized linear models. Such a trivial difference demonstrates that ElasticNet and BayesianRidge belong to the same high-performance tier, and both achieve reliable generalization for sugar content prediction across multi-stage ‘Bingtang’ orange samples.
Table 3.
Summary of model performance metrics based on CARS features (averaged stratified 5-fold cross-validation).
Figure 9.
Scatter-plots of predicted and measured sugar content derived from stratified 5-fold cross-validation.
Although ElasticNet exhibited a slight disadvantage in averaged cross-validation indicators, it possesses unique advantages aligned with the research objectives of this study. Unlike BayesianRidge, which relies on data-adaptive Bayesian prior regularization, ElasticNet integrates combined L1 and L2 penalty terms. The L1 regularization further sparsifies residual redundant bands retained after CARS screening to simplify model architecture, whereas L2 regularization effectively alleviates multicollinearity among characteristic spectral wavelengths. Moreover, ElasticNet avoids iterative Bayesian posterior sampling, which reduces computational overhead and delivers more transparent mathematical interpretability. Considering the demand for lightweight, low-cost online sorting equipment proposed in this work, the CARS–ElasticNet framework was ultimately selected as the core quantitative prediction model for fruit sugar content.
Figure 7 provides a visual validation of model performance: the predicted points for ElasticNet, BayesianRidge, and PLSR are tightly clustered around the ideal prediction line, demonstrating excellent fitting performance; while the predicted points for XGBoost on the training set almost align with the ideal line, the dispersion on the test set increases, clearly indicating overfitting, which is consistent with the data in Table 2. In summary, the CARS algorithm can effectively compress spectral dimensionality; paired with regularized linear models, it achieves favorable sugar content prediction performance on our test set.
3.4. Ablation Experiment Analysis
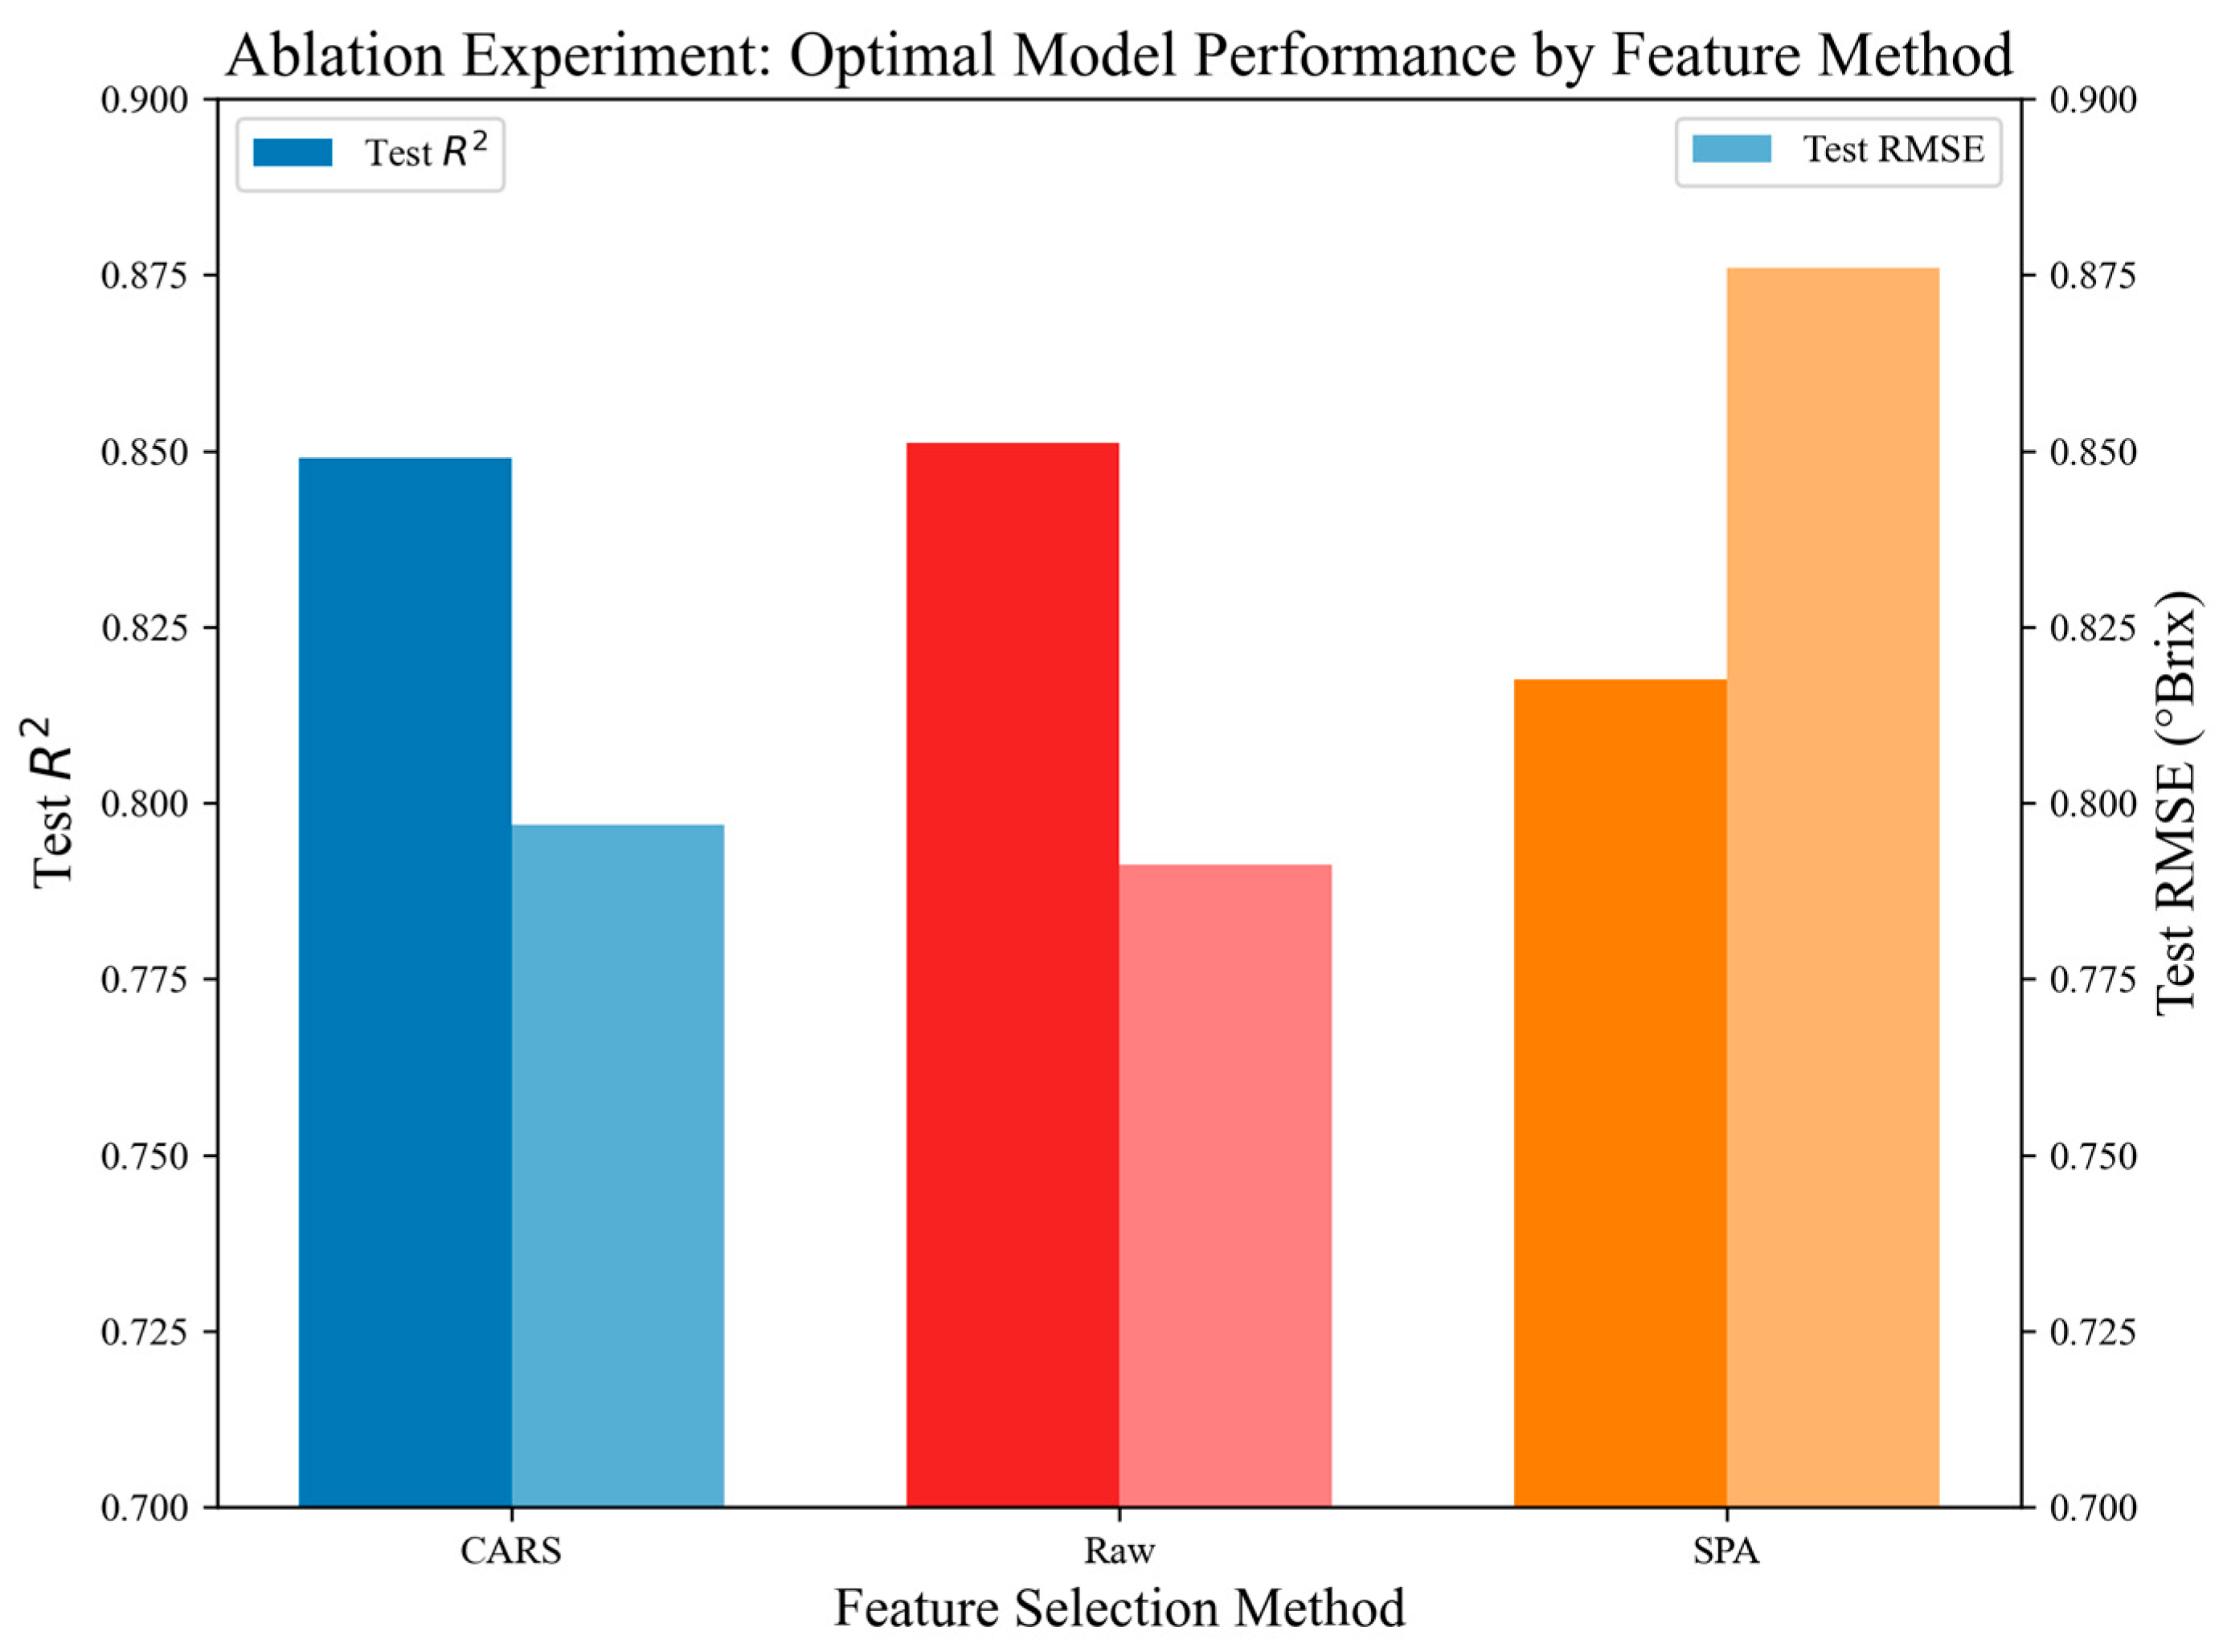
To further validate the superiority of the CARS algorithm, we compared model performance under three feature input methods—RAW spectra, SPA screening, and CARS screening (Table 4, Figure 10)—to clarify the impact of different feature extraction methods on model adaptability and prediction accuracy.
Table 4.
Performance metrics of each model in the ablation experiments.
Figure 10.
Comparison of R2 and RMSE for the optimal models under different feature selection methods in the ablation experiments (Dark bars represent R2, light bars represent RMSE, clearly demonstrating the advantages of the CARS algorithm).
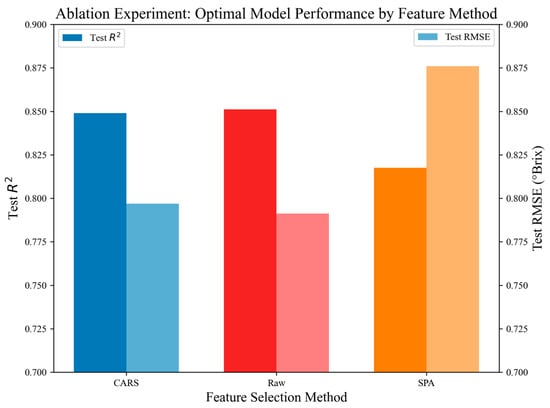
Figure 10 compares the performance of optimal models under three feature extraction pipelines. It can be seen that the ElasticNet model using CARS-selected wavelengths achieves balanced prediction metrics relative to models built with raw spectra or SPA-selected bands.
The non-convergence of ElasticNet under raw and SPA inputs mainly arises from strong multicollinearity in the spectral matrix. A large number of collinear wavebands interfere with the L1–L2 regularization solving process and degrade prediction stability. SPA reduces spectral dimensionality, yet its screening criterion only optimizes spectral orthogonality without prioritizing correlations with fruit sugar, leaving considerable collinear noise in the retained variables and limiting their explanatory power for Brix.
By contrast, CARS performs iterative wavelength screening guided by cross-validation error. It adaptively discards wavebands weakly associated with sugar and preserves chemically relevant characteristic bands, which alleviates multicollinearity in input data. This property eases the solving difficulty of regularized linear models and facilitates the sparsification and anti-collinearity functions of dual regularization. Within the experimental setup of this study, CARS shows relatively good adaptability when paired with linear regression models, compared with raw full spectra and SPA.
3.5. Prediction Using Deep Learning Models Based on the CARS Algorithm
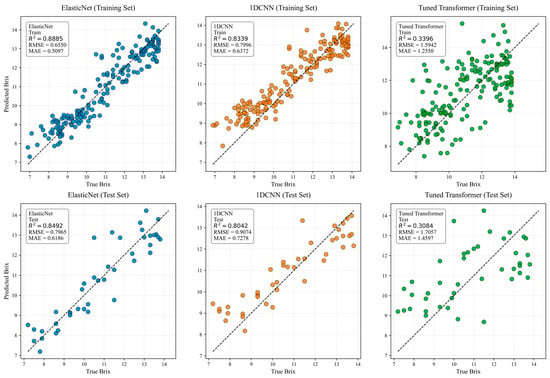
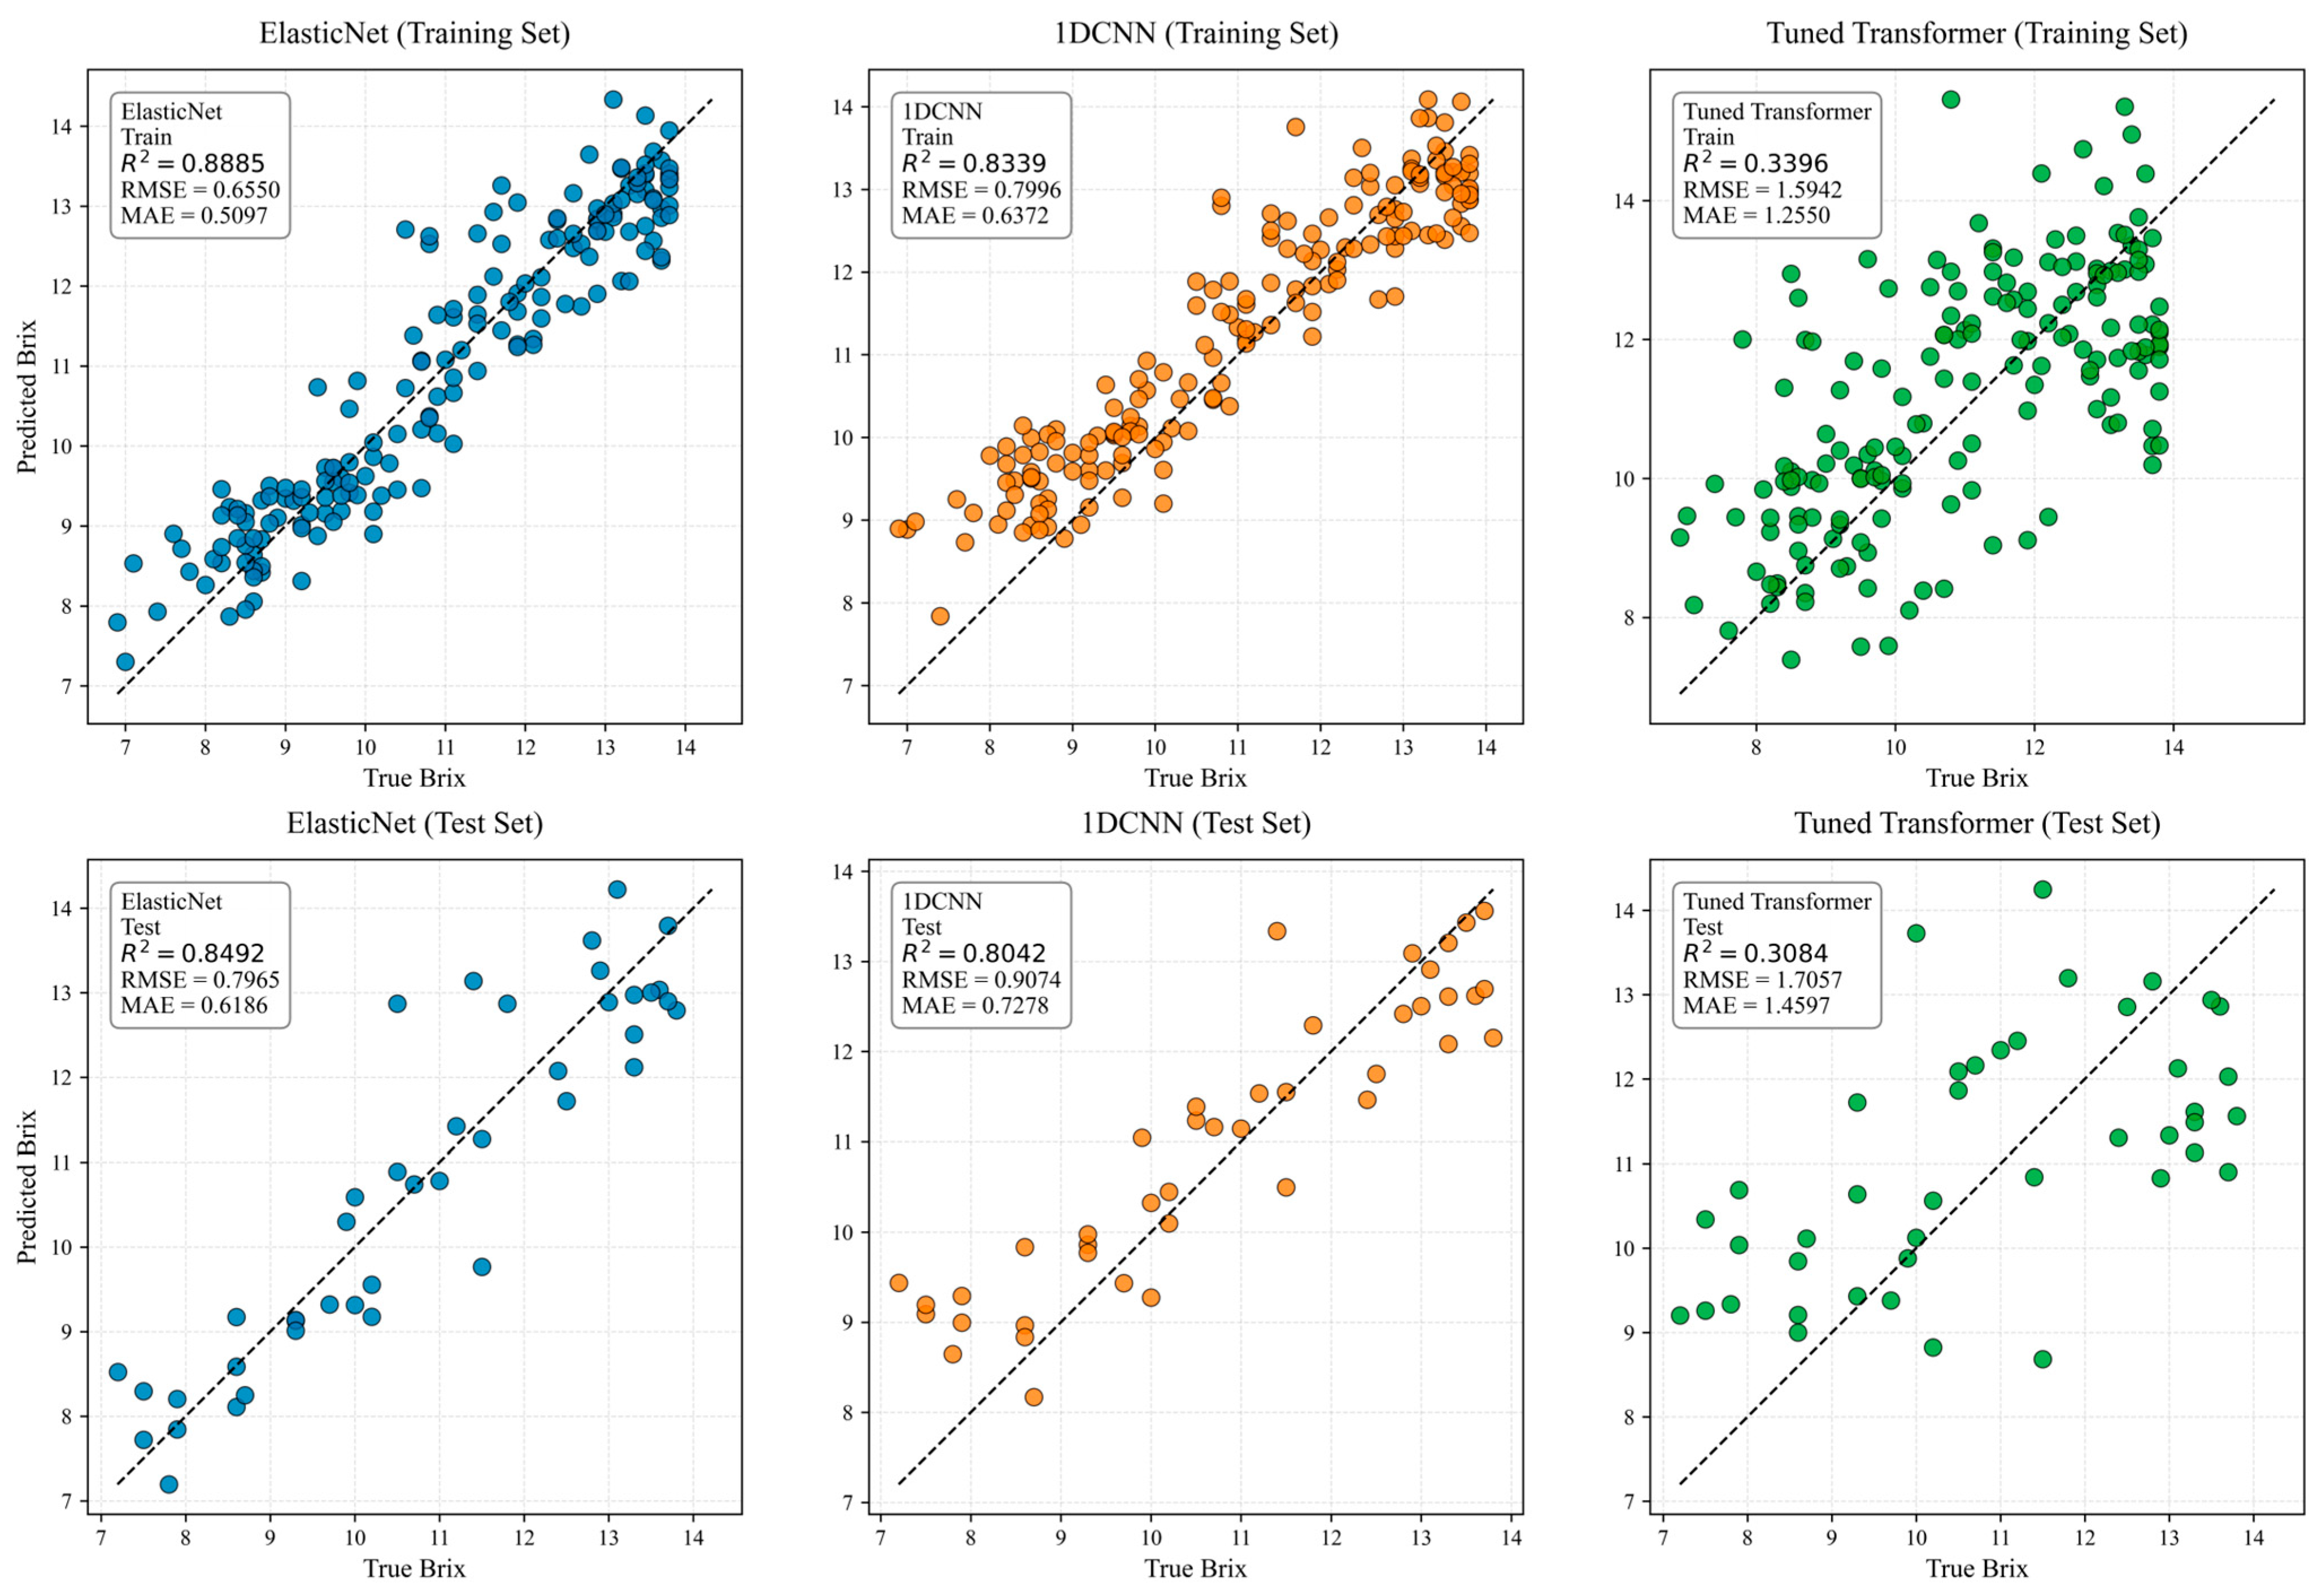
This study also leveraged the characteristics of one-dimensional spectral data following CARS feature selection, selecting 1D-CNN and a lightweight Transformer as deep learning models for comparative validation. The results are shown in Figure 11 and Table 5. 1D-CNN is well-suited for capturing local correlation features in spectral sequences and is a commonly used deep learning model in spectral analysis; the lightweight Transformer, on the other hand, attempts to capture long-range correlations between wavelengths through a simplified architecture, while also being suited for small-sample data scenarios. Both networks adopted unified regularization strategies including dropout, batch normalization, and early stopping during training. The results show that ElasticNet’s predictive performance remains significantly superior to both deep learning models, whereas the 1D-CNN achieved an R2 of only 0.8042 on the test set. Despite the rigorous structural tuning and target variable scaling, the tuned micro-Transformer only achieved an R2 of 0.3084 on the test set. Although it successfully overcame the catastrophic mode collapse (predicting a constant mean) and demonstrated a valid predictive trend, its performance still significantly trailed behind the ElasticNet baseline. These experimental observations align closely with mainstream academic views in the field of near-infrared spectroscopy. Sample sizes for sugar content prediction based on spectral images are typically small, whereas deep learning models require large amounts of data to support the learning of complex parameters. In small-sample scenarios, they are prone to overfitting or underfitting. The number of trainable parameters of the two deep models far exceeds the empirical sample-to-parameter ratio required for stable model convergence. As Chang et al. pointed out in their study on predicting fruit sugar content using near-infrared spectroscopy, the generalization ability of deep learning models is far weaker than that of linear models when sample sizes are small [32]. Furthermore, the relationship between sugar content and spectral features is primarily a linear one described by Beer–Lambert’s law. Even with dropout, batch normalization, and early stopping integrated to suppress overfitting, such regularization could not offset the fundamental shortage of training data. As a regularized linear model, ElasticNet can accurately capture this relationship. Wartini et al. found in their hyperspectral soil studies that when linear correlations are strong, linear models generally outperform deep learning models, as the latter’s nonlinear fitting capabilities can inadvertently fit noise [33]. Furthermore, the feature dimension has been reduced to a low level after CARS filtering, so the advantages of deep learning models in high-dimensional data cannot be fully realized. This linear intrinsic property makes deep networks prone to fitting irrelevant spectral noise rather than valid chemical signals. Within the feature extraction workflow centered on the CARS algorithm, the CARS–ElasticNet coupling scheme is more efficient and robust for small-sample spectral sugar prediction governed by linear relationships. Deep learning methods, however, can only fully exploit their advantages under large-sample, high-dimensional data conditions.
Figure 11.
Scatter-plots of predicted values versus actual sugar content for the ElasticNet model, 1D-CNN model, and Tuned Transformer model based on the CARS algorithm.
Table 5.
Comparison of performance metrics between deep learning models based on CARS features and the ElasticNet model.
4. Discussion
4.1. Analysis of Results
4.1.1. Mechanism of Preprocessing and Feature Selection Effects
Regarding the spectral preprocessing results in Section 3.2, the effectiveness of the MSC + SG-1st Deriv combined approach stems from dual optimization: MSC smooths out scattering differences between samples via linear regression, thereby effectively suppressing non-chemophysical noise induced by fruit peel surface effects and uneven texture [5], normalizing spectral trends across different batches. The SG first-derivative method, on the other hand, enhances component characteristic peaks through polynomial fitting, separating the spectral responses of chemical components such as chlorophyll and sugars from the noise. It should be clearly stated that the current study only measured soluble solid content (Brix) as the core target indicator, and no independent quantitative chemical detection of phenolics, anthocyanins, chlorophyll, or carbohydrate fractions was performed on the experimental fruit samples. All mechanistic interpretations of characteristic absorption bands in this section are deductive analyses based on universally validated spectral-molecule correlation rules from peer-reviewed fruit spectroscopy literature, rather than direct conclusions supported by compound concentration data measured in our experiment. Among these, the O-H bond vibration peak near 950 nm and the derivative peak near 700 nm provide clear chemical evidence for sugar content prediction, as Vis/NIR signals are highly sensitive to these hydrogen-containing groups in citrus [31].
This spectral characteristic is attributed to the double and sum frequency vibration absorption of C-H and O-H bonds in sugar molecules [34]. According to published spectral research on horticultural fruits, the characteristic peak at 413.7 nm primarily originates from the characteristic absorption of phenolic compounds, such as flavonoids in the fruit [24]. These compounds containing phenolic hydroxyl groups possess conjugated systems, which generate electronic transitions near this wavelength band. Minor shifts in the band may occur due to differences in substituent groups. Since the content of phenolic compounds is correlated with fruit ripeness and sugar accumulation, this band can serve as an auxiliary feature for predicting sugar content.
Based on documented optical properties of citrus pigments, the characteristic peak at 518.8 nm corresponds to the characteristic absorption of anthocyanins in fruit [25]. The benzopyran ring structure in the anthocyanin molecule produces specific absorption at this wavelength. Changes in its content accompany the dynamic accumulation of sugar during fruit ripening, and the absorption intensity has an indirect correlation with sugar content, making it a suitable collaborative feature variable for constructing sugar content prediction models.
Consistent with chlorophyll spectral characteristics reported in agricultural spectroscopy literature, the characteristic peak at 696.4 nm is the characteristic absorption peak of chlorophyll a, corresponding to the specific absorption of red light by the porphyrin ring in the chlorophyll a molecule [26]. During fruit ripening, chlorophyll gradually degrades while sugar content continuously accumulates, exhibiting a negative correlation; the absorption intensity in this wavelength band can indirectly reflect the degree of sugar accumulation in the fruit.
From the perspective of carbohydrate molecular vibration principles summarized in near-infrared spectroscopy research, the characteristic peak at 762.7 nm is associated with the combined C-H bond vibration bands of carbohydrates in the fruit. This wavelength lies in the transition region between the near-infrared and visible light spectra, where the vibrational harmonics and combination bands of C-H bonds in carbohydrates overlap to form a characteristic peak [27]. Because it is directly related to carbohydrate content, its absorption intensity shows a significant positive correlation with sugar content, making it a core characteristic wavelength for predicting fruit sugar content and a key indicator for quantitative sugar content prediction [34].
Based on the CARS screening results in Section 3.3, the scientific validity of the 28 key bands can be explained from two perspectives: First, the screening process utilized RMSECV-based adaptive optimization to balance feature dimensionality and generalization ability, thereby avoiding information loss caused by over screening; second, the core wavelength bands (704.4–708.5 nm, 592.3 nm, and 951.4 nm) are directly related to the physiological mechanisms of sugar accumulation. Fruits with high sugar content exhibit stronger absorption characteristics in the near-infrared region, accompanied by a corresponding drop in reflectance, thereby encoding significant discriminative information in the spectral response curve. This pattern aligns with the universal principles of sugar content detection in fruits and vegetables [35].
Combined with the dynamic ripening and sugar accumulation process of three batches of experimental fruits, the internal physiological–spectral linkage mechanism can be further elaborated as follows: During fruit ripening, soluble sugars continuously accumulate in fruit pulp, altering the microenvironment of intracellular water and carbohydrate molecules. The increase in sugar concentration raises the number of O-H and C-H chemical bonds, which strengthens the overtone and combination absorption of near-infrared light at specific wavelengths. For the 706.5–710.5 nm band located at the visible-near-infrared junction, the third harmonic of O-H bonds and C-H combination vibration overlap; higher sugar content leads to stronger light absorption and lower spectral reflectance, forming a strong negative correlation with Brix value. For visible bands, chlorophyll a at 696.4 nm gradually degrades with ripening, reducing light absorption and increasing reflectance, which indirectly reflects sugar accumulation. The anthocyanin absorption peak at 518.8 nm rises as fruit matures and sugar accumulates, showing an indirect positive correlation with sugar content. The phenolic compound band at 413.7 nm is related to fruit stress resistance and ripening degree, serving as auxiliary spectral feature for sugar prediction. The carbohydrate C-H vibration peak at 762.7 nm directly responds to total soluble solids, which is the core physical basis for quantitative sugar inversion. Consistent with the spectral curves in Figure 4, Batch 3 mature fruits with the highest average sugar content exhibit sharper derivative peaks near 700 nm, which further supports the correlation between dynamic sugar accumulation and spectral variation observed across the three ripening batches. Previous related studies mostly only reported simple statistical correlations between spectral bands and fruit internal components without elaborating coupled physiological and molecular vibration mechanisms across multi-stage ripening gradients, limiting the physical interpretability of prediction results. It should be clarified that all mechanistic interpretations of phenolics, anthocyanins, chlorophyll, and carbohydrates herein are qualitatively deduced from existing spectroscopy literature. Quantitative biochemical measurements of these compounds were not included in the current experimental design, which solely targets soluble solid prediction. The spectral and mechanistic analysis above only delivers qualitative theoretical support for CARS-selected bands based on published spectral principles, to enhance interpretability of the sugar prediction model. Most previous studies only reported simple statistical correlations between spectral bands and fruit internal components without elaborating such coupled physiological and molecular vibration mechanisms, which limited the physical interpretability of prediction results. The above multi-stage spectral dynamic observation and molecular mechanism analysis provide solid physical basis for the CARS screened characteristic wavelengths, greatly improving the reliability and interpretability of the subsequent sugar content quantitative prediction model.
4.1.2. Insights from Model Fit and Ablation Experiments
Most conventional related studies only build one single regression model for single-stage fruit samples; differently, the model comparison results in Section 3.3 indicate that the regularized linear model exhibits the best fit with CARS features. This is because the relationship between the spectral characteristics of Navel oranges and sugar content is primarily linear; PLSR, BayesianRidge, and ElasticNet models can effectively capture this linear relationship, and the regularization mechanism further mitigates residual multicollinearity; In contrast, nonlinear models such as RF and XGBoost are prone to fitting noise in small sample sizes, leading to overfitting. Similarly, pure self-attention mechanisms inherently struggle to construct local spectral inductive biases from scratch given the limited sample size, which empirically justifies the superiority of lightweight linear architectures for this task. This is closely related to the high-dimensional nature of hyperspectral data and the limited sample size.
The ablation experiment results in Section 3.4 confirm the core value of the CARS algorithm: the redundant information and multicollinearity issues in RAW spectra cause the high-dimensional-sensitive ElasticNet model to fail training. The SPA algorithm focuses solely on spectral band orthogonality while ignoring chemical correlations, resulting in insufficient feature selection effectiveness; in contrast, the CARS algorithm, through iterative PLS weighting, precisely retains bands strongly correlated with sugar content. This approach not only resolves the high-dimensional redundancy issue but also provides the model with feature inputs of clear chemical significance, successfully activating the regularization advantages of the ElasticNet model. This observation further explains why ElasticNet fails to converge on raw and SPA feature sets: the strong multicollinearity of unoptimized bands cannot be fully offset by the model’s own regularization. Consistent with the conclusion proposed by Zou et al. [36]. ElasticNet relies on low-redundancy, high-correlation feature inputs to achieve stable and accurate prediction; the CARS algorithm exactly provides such high-quality characteristic wavelengths for subsequent modeling.
4.2. Mechanism Discussion: Reasons for the Optimality of the CARS–ElasticNet Model
The stratified 8:2 independent external test set, adopted as the primary evaluation benchmark, verified that the CARS–ElasticNet model achieved superior predictive accuracy on unseen fruit samples. Supplementary stratified 5-fold cross-validation further confirmed the competitive performance of the ElasticNet algorithm. The prominent practical applicability of the CARS–ElasticNet framework originates from the synergistic effect of the two algorithms, which can be elaborated from three dimensions:
First, the synergistic feature refinement and dimensionality reduction function of CARS. Guided by cross-validation error, the CARS algorithm eliminates collinear noise bands irrelevant to sugar content and retains 28 chemically interpretable characteristic wavelengths. This operation greatly alleviates the severe multicollinearity of full-spectrum data, removes the core obstacle that causes ElasticNet solving failure, and stabilizes the regularization penalty calculation during model training. At the same time, the selected feature bands possess clear chemical significance, providing the model with precise input signals and avoiding excessive coefficient penalties caused by irrelevant information in the RAW spectra.
Second, the adaptation of the regularization mechanism to feature characteristics. ElasticNet integrates L1 and L2 regularization. L1 regularization further eliminates weakly correlated features remaining after CARS screening, while L2 regularization mitigates residual multicollinearity among bands [22]. This is highly compatible with the low-dimensional, highly correlated nature of features selected by CARS, forming a dual safeguard of “feature screening + regularization optimization” to enhance the model’s generalization ability.
Third, the alignment of linear modeling with data characteristics. During the sugar accumulation process of Bing Tang oranges, changes in spectral response are primarily driven by the linear increase in sugar content. Linear models can accurately capture these changes, while ElasticNet’s regularization mechanism further enhances the model’s adaptability to samples across different growth stages, resulting in a difference of only 0.0395 in R2 between the training and testing sets, thereby meeting the requirements for detection throughout the entire growing season.
It should be noted that raw-spectrum BayesianRidge achieves a marginal improvement in single test-set fitting accuracy compared with CARS–ElasticNet. However, this minor numerical advantage cannot offset the critical practical defects of full raw spectral input, including ultra-high data dimensionality, severe collinearity and poor model universality. The comprehensive synergistic advantages of CARS in dimensionality reduction, multicollinearity elimination and multi-model adaptability make the CARS–ElasticNet framework the optimal solution oriented to actual online sorting equipment, rather than the full-spectrum scheme limited to laboratory static single-model testing.
4.3. Limitations and Future Directions
Although this study has established an efficient sugar content prediction system, three limitations remain: First, the present experiment only took fruit soluble solid content (Brix) as the sole quantitative detection target, and we did not conduct separate destructive quantitative measurements of phenolics, anthocyanins, chlorophyll, and carbohydrate fractions on the collected Yunguan orange samples. All mechanistic explanations linking specific spectral peaks to these substances rely solely on universal molecular vibration laws and published citrus spectroscopy literature, without direct concentration data from our own fruit samples to quantitatively validate the band–component correlation. In addition, all experimental samples were sourced from a single Chu Orange demonstration base in Longling, and samples from other producing regions or different ‘Bingtang’ orange cultivars were not included, restricting the cross-site generalization capacity of the constructed model. Second, the interference effects of fruit physiological traits such as peel thickness and pulp water content on hyperspectral reflectance were not quantitatively decoupled and analyzed in this study, which may introduce unaccounted noise into the spectral signal and slightly affect model stability under complex on-site orchard conditions. third, only traditional machine learning models were employed, and the potential of deep learning for automatic feature extraction was not explored.
Future research can be advanced from four aspects: First, expand the sample range, include ‘Bingtang’ orange samples from multiple production areas and multiple strains to improve model universality and synchronous quantitative detection of phenolics, anthocyanins, chlorophyll, and carbohydrate fractions will be performed to quantitatively calibrate spectral-component correlation relationships in future research; second, integrate fruit physiological monitoring data to optimize preprocessing and feature selection strategies, and establish a correlation model linking “physiological indicators—spectral features—sugar content”; third, after expanding the sample size and constructing a larger hyperspectral database, introduce a broader variety of advanced deep learning models (e.g., hybrid CNN-Transformer architectures, advanced attention mechanisms) to explore new end-to-end methods for sugar content prediction and further improve accuracy.
4.4. Prospects for Technological Application
The 28 key feature bands identified in this study lay the core wavelength foundation for developing specialized multispectral equipment for sugar content sorting of Navel oranges. Compared to full-spectrum high-resolution imaging systems, multispectral cameras designed specifically for these bands can significantly reduce hardware costs and computational data loads, exhibits promising application potential under laboratory static measurement conditions. Key challenges for future technology transfer include: ① Adapting laboratory static measurement conditions (such as darkrooms and fixed light sources) to dynamic production lines with variable ambient lighting; this requires the design of light-shielding devices and light source calibration modules to ensure detection stability; ② Establishing a stable, low-cost combination of narrowband light sources and filters, and customizing optical components for core wavelength bands such as 704.4–708.5 nm, 592.3 nm, and 951.4 nm to balance detection accuracy and hardware costs; ③ Perform model calibration and transfer learning for different regions and varieties of ‘Bingtang’ oranges to build a universal prediction model, ensuring generalization performance and truly enabling the transition of the technology from the laboratory to the production line.
5. Conclusions
Guided by the three proposed research objectives, this study established a complete analytical workflow covering spectral preprocessing, feature screening, and multi-model comparison, which is applicable to non-destructive sugar detection of Longling Yunguan oranges across all three ripening stages sampled in this work. The key conclusions are as follows: First, a standardized preprocessing workflow combining MSC with the first derivative of SG was established; when combined with the modified Z-score method, this significantly enhanced the signal-to-noise ratio and feature response of the spectral signals; Second, the significant synergistic matching effect of CARS and ElasticNet was verified. Although raw full-spectrum BayesianRidge shows a tiny advantage in test-set R2, the 28 characteristic wavelengths screened by CARS largely alleviate the dimensional collinearity problem of raw hyperspectral data, realize stable convergence of all six regression models, and greatly reduce data computation volume, with the CAR–-ElasticNet model reaching a test set R2 of 0.8492 for our samples; Third, we analyzed the correlation characteristics of core bands such as 704.4–710.5 nm, which can serve as preliminary wavelength references for developing low-cost multispectral sensors targeting similar Yunnan ‘Bingtang’ orange varieties. The proposed workflow can partially reduce the time cost of destructive physicochemical detection and offer algorithm references for intelligent sorting of ‘Bingtang’ oranges from the studied production base. Compared with traditional single-time-point static detection modes, the multi-ripening-period sampling design and multi-algorithm horizontal comparison framework proposed in this study can provide more stable technical support for on-line continuous fruit sorting.
6. Patents
Zhao, H.; Deng, L.; Cao, Z.; Wang, Z.; Zheng, L.; Yang, H. A Nondestructive Prediction Method for Sugar Content in Bingtang Orange Fruits Based on Hyperspectral Images. China Patent Application No. 202610396315.5, 30 March 2026 (Under substantive examination).
Author Contributions
Conceptualization, L.D., H.Z., T.L., and Z.C.; Methodology, L.D.; Software, L.D.; Formal analysis, L.D.; Investigation, L.D., Z.W., L.Z., H.Y., G.J., J.C., and Y.Z.; Validation, Z.W.; Data curation, L.Z., H.Y., G.J., J.C., and Y.Z.; Resources, L.Z., H.Y., G.J., J.C., and Y.Z.; Writing—original draft, L.D.; Writing—review and editing, H.Z. and Z.C.; Supervision, H.Z., T.L., and Z.C.; Project administration, T.L. and Z.C.; Funding acquisition, T.L. and Z.C. All authors have read and agreed to the published version of the manuscript.
Funding
This research was funded by the China Central Fund for Guiding Development of Local Science and Technology, grant number NO. 202407AB110010. This research was funded by the Yunnan Project for Key Core Technologies in Agriculture, grant number No. 2025HXJSGG0103. This research was funded by the Major Project of Yunnan Provincial Science and Technology, grant number No. 202502AE090019. This research was funded by Yunnan International Joint Laboratory of Agricultural Remote Sensing and Digital Technology, grant number NO. 202503AP140020. This work has been supported by the Yunnan Science and Technology Major Project under Grant No. 202602AE090051.
Data Availability Statement
The raw data supporting the conclusions of this article will be made available by the authors on request.
Acknowledgments
The authors would like to thank the staff at the Chu’s Orange Base in Longling County, Baoshan City, Yunnan Province for their invaluable assistance and support during the field sampling and data collection process. We also extend our gratitude to the anonymous reviewers for their constructive comments and suggestions that greatly improved the quality of this manuscript.
Conflicts of Interest
The authors declare no conflicts of interest.
Abbreviations
The following abbreviations are used in this manuscript:
| HSI | Hyperspectral Image |
| NIR | Near-Infrared |
| SVM | Support Vector Machine |
| R2 | Coefficient of Determination |
| RMSE | Root Mean Square Error |
References
- Huang, W.H.; Qi, C.J. Research on the evolution of spatial layout and driving factors of Chinese Bingtang orange production. J. Huazhong Agric. Univ. (Soc. Sci. Ed.) 2022, 4, 90–103. [Google Scholar]
- Liu, J.A. A Study on the Detection of Ripeness in Korla Pears Using Hyperspectral Technology. Master’s Thesis, Tarim University, Alar, China, 2025. [Google Scholar]
- Wang, H.; Peng, J.; Xie, C.; Bao, Y.; He, Y. Fruit quality evaluation using spectroscopy technology: A review. Sensors 2015, 15, 11889–11927. [Google Scholar] [CrossRef] [Scilit] [PubMed]
- Cornelissen, C.; De Coninck, S.; Willekens, A.; Leroux, S.; Simoens, P. In-Field Mapping of Grape Yield and Quality with Illumination-Invariant Deep Learning. IEEE Internet Things J. 2025, 12, 49207–49220. [Google Scholar] [CrossRef] [Scilit]
- Tian, X.; Li, J.; Yi, S.; Jin, G.; Qiu, X.; Li, Y. Nondestructive Determination of Soluble Solids Content in Citrus Using Near-Infrared Transmittance Technology Combined with the Variable Selection Algorithm. Artif. Intell. Agric. 2020, 4, 48–57. [Google Scholar] [CrossRef] [Scilit]
- Xiao, Y.; Zhai, Y.; Zhou, L.; Yin, Y.; Qi, H.; Zhang, C. Detection of Soluble Solid Content in Citrus Fruits Using Hyperspectral Imaging with Machine and Deep Learning: A Comparative Study of Two Citrus Cultivars. Foods 2025, 14, 2091. [Google Scholar] [CrossRef] [Scilit] [PubMed]
- Zhao, T. A CNN-BiGRU-Based Method for Predicting Chlorophyll Content in Pomegranate Leaves. Agric. Eng. 2025, 15, 45–51. [Google Scholar]
- Tian, Y.; Sun, J.; Zhou, X.; Yao, K.; Tang, N. Detection of soluble solid content in apples based on hyperspectral technology combined with deep learning algorithms. J. Food Process. Preserv. 2022, 46, e16414. [Google Scholar] [CrossRef] [Scilit]
- Fiorentino, C.; D’Antonio, P.; Toscano, F.; Capece, N.; Conceição, L.A.; Scalcione, E.; Modugno, F.; Sannino, M.; Colonna, R.; Lacetra, E.; et al. Smart Sensors and Artificial Intelligence Driven Alert System for Optimizing Red Peppers Drying in Southern Italy. Sustainability 2025, 17, 1682. [Google Scholar] [CrossRef] [Scilit]
- Liu, H.; Gong, Z.; Wen, C.; Wang, Z.; Dai, X. Design and Testing of an Online Brix Detection and Sorting System for ‘Bingtang’ Oranges Based on Visible/Near-Infrared Spectroscopy. J. Hunan Agric. Univ. (Nat. Sci. Ed.) 2023, 49, 497–502. [Google Scholar]
- Fu, H.; Zhang, A.; Sun, G.; Ren, J.; Jia, X.; Pan, Z.; Ma, H. A novel band selection and spatial noise reduction method for hyperspectral image classification. IEEE Trans. Geosci. Remote Sens. 2022, 60, 1–13. [Google Scholar] [CrossRef] [Scilit]
- Yang, Y.; Fu, X.; Zhou, Y. Hyperspectral Spatial Frequency Domain Imaging Technique for Soluble Solids Content and Firmness Assessment of Pears. Horticulturae 2024, 10, 853. [Google Scholar] [CrossRef] [Scilit]
- Kim, M.-J.; Yu, W.-H.; Song, D.-J.; Chun, S.-W.; Kim, M.S.; Lee, A.; Kim, G.; Shin, B.-S.; Mo, C. Prediction of Soluble-Solid Content in Citrus Fruit Using Visible–Near-Infrared Hyperspectral Imaging Based on an Effective-Wavelength Selection Algorithm. Sensors 2024, 24, 1512. [Google Scholar] [CrossRef] [Scilit] [PubMed]
- Wang, Q.; Lu, J.; Wang, Y.; Miao, F.; Liu, S.; Shui, Q.; Gao, J.; Gao, Y. In situ nondestructive identification of citrus fruit ripeness via hyperspectral imaging technology. Plant Methods 2025, 21, 77. [Google Scholar] [CrossRef] [Scilit] [PubMed]
- Kim, M.J.; Lim, J.; Kwon, S.W.; Kim, G.; Kim, M.S.; Cho, B.K.; Baek, I.; Lee, S.H.; Seo, Y.; Mo, C. Geographical origin discrimination of white rice based on image pixel size using hyperspectral fluorescence imaging analysis. Appl. Sci. 2020, 10, 5794. [Google Scholar] [CrossRef] [Scilit]
- Shao, Y.; Liu, Y.; Xuan, G.; Wang, Y.; Gao, Z.; Hu, Z.; Han, X.; Gao, C.; Wang, K. Application of hyperspectral imaging for spatial prediction of soluble solid content in sweet potato. RSC Adv. 2020, 10, 33148–33154. [Google Scholar] [CrossRef] [Scilit] [PubMed]
- Guo, W.; Zhao, F.; Dong, J. Nondestructive Measurement of Soluble Solids Content of Kiwifruits Using Near-Infrared Hyperspectral Imaging. Food Anal. Methods 2016, 9, 38–47. [Google Scholar]
- He, D.J.; Yang, Q.; Xue, S.P.; Xiong, Y.Z. Spectral reflectance of fruits and near-infrared image processing in agricultural applications. Trans. Chin. Soc. Agric. Eng. 1996, 12, 80–84. [Google Scholar]
- Goh, T.Y.; Basah, S.N.; Yazid, H.; Safar, M.J.A.; Saad, F.S.A. Performance analysis of image thresholding: Otsu technique. Measurement 2018, 114, 298–307. [Google Scholar] [CrossRef] [Scilit]
- Chen, J.; Bai, T.; Zhang, N.; Zhu, L.; Zhang, X. Hyperspectral detection of sugar content in sugar-sweetened apples based on sample grouping and SPA feature selection methods. Infrared Phys. Technol. 2022, 125, 104240. [Google Scholar] [CrossRef] [Scilit]
- Wu, T.; Yu, J.; Lu, J.; Zou, X.; Zhang, W. Research on an inversion model of cultivated soil moisture content based on hyperspectral imaging analysis. Agriculture 2020, 10, 292. [Google Scholar] [CrossRef] [Scilit]
- Liu, W.; Li, Q. An efficient elastic net with regression coefficients method for variable selection of spectral data. PLoS ONE 2017, 12, e0171122. [Google Scholar] [CrossRef] [Scilit] [PubMed]
- Wang, G.; Liu, Y.; Li, X.; Zhang, Y.; Wang, J.; Jiang, X. Differences in optical properties of fruit tissues between stone fruits and citrus fruits. Infrared Phys. Technol. 2021, 112, 103599. [Google Scholar] [CrossRef] [Scilit]
- Merzlyak, M.N.; Solovchenko, A.E.; Smagin, A.I.; Gitelson, A.A. Apple flavonols during fruit adaptation to solar radiation: Spectral features and technique for non-destructive assessment. J. Plant Physiol. 2005, 162, 151–160. [Google Scholar] [CrossRef] [Scilit] [PubMed]
- Gomes, V.; Rendall, R.; Reis, M.S.; Mendes-Ferreira, A.; Melo-Pinto, P. Determination of sugar, pH, and anthocyanin contents in port wine grape berries through hyperspectral imaging: An extensive comparison of linear and non-linear predictive methods. Appl. Sci. 2021, 11, 10319. [Google Scholar] [CrossRef] [Scilit]
- Pourdarbani, R.; Sabzi, S.; Hernández-Hernández, M.; Hernández-Hernández, J.L.; Gallardo-Bernal, I.; Herrera-Miranda, I. Non-destructive estimation of total chlorophyll content in apple fruit based on color features, spectral data, and the most effective wavelengths using a hybrid artificial neural network—Imperialist competitive algorithm. Plants 2020, 9, 1547. [Google Scholar] [CrossRef] [Scilit] [PubMed]
- Golic, M.; Walsh, K.; Lawson, P. Short-wavelength near-infrared spectra of sucrose, glucose, and fructose with respect to sugar concentration and temperature. Appl. Spectrosc. 2003, 57, 139–145. [Google Scholar] [CrossRef] [Scilit] [PubMed]
- Zhao, J.; Vittayapadung, S.; Chen, Q.; Chaitep, S.; Chuaviroj, R. Nondestructive measurement of sugar content in apples using hyperspectral imaging techniques. Maejo Int. J. Sci. Technol. 2009, 3, 130–142. [Google Scholar]
- Chen, L.; Yang, S.; Nan, Z.; Li, Y.; Ma, J.; Ding, J.; Lv, Y.; Yang, J. Detection of dextran, maltodextrin, and soluble starch in adulterated Lycium barbarum polysaccharides (LBPs) using Fourier-transform infrared spectroscopy (FTIR) and machine learning models. Heliyon 2023, 9, e17174. [Google Scholar] [CrossRef] [Scilit]
- Medic, T.; Ray, P.; Han, Y.; Broggini, G.A.L.; Kollaart, S. Remote sensing of inner fruit quality using multispectral LiDAR: Estimating sugar and dry matter content in apples. Comput. Electron. Agric. 2024, 224, 109128. [Google Scholar] [CrossRef] [Scilit]
- Kim, S.-Y.; Hong, S.-J.; Kim, E.; Lee, C.-H.; Kim, G. Application of ensemble neural-network method to integrated sugar content prediction model for citrus fruit using Vis/NIR spectroscopy. J. Food Eng. 2023, 338, 111254. [Google Scholar] [CrossRef] [Scilit]
- Chang, J.; Song, D. Detection of sugar content in food based on the electrochemical method with the assistance of partial least squares and deep learning. J. Food Meas. Charact. 2023, 17, 4864–4869. [Google Scholar] [CrossRef] [Scilit]
- Ng, W.; Minasny, B.; Mendes, W.d.S.; Demattê, J.A.M. The influence of training sample size on the accuracy of deep learning models for the prediction of soil properties using near-infrared spectroscopy data. Soil 2020, 6, 565–578. [Google Scholar] [CrossRef] [Scilit]
- Guo, G.; Zhang, M.; Gong, Z.; Zhang, S.; Wang, X.; Zhou, Z.; Yang, Y.; Xie, G. Construction of a biomass ash content model based on near-infrared spectroscopy and complex sample set partitioning. Spectrosc. Spectr. Anal. 2023, 43, 3143–3149. [Google Scholar]
- Valdora, V.; Agostinelli, C. Robust Penalized Estimators for High-Dimensional Generalized Linear Models. arXiv 2023, arXiv:2312.04661. [Google Scholar]
- Zou, H.; Hastie, T. Regularization and variable selection via the elastic net. J. R. Stat. Soc. Ser. B Stat. Methodol. 2005, 67, 301–320. [Google Scholar] [CrossRef] [Scilit]

Disclaimer/Publisher’s Note: The statements, opinions and data contained in all publications are solely those of the individual author(s) and contributor(s) and not of MDPI and/or the editor(s). MDPI and/or the editor(s) disclaim responsibility for any injury to people or property resulting from any ideas, methods, instructions or products referred to in the content. |
© 2026 by the authors. Licensee MDPI, Basel, Switzerland. This article is an open access article distributed under the terms and conditions of the Creative Commons Attribution (CC BY) license.