


Abstract
The goal of agrivoltaic engineers is to use growing space for the synergistic production of both food and energy, typically via photovoltaic (PV) capture. Most research in this area has been carried out in arid, high-light environments, but subtropical and temperate regions are also critical production zones, and installation designs vary considerably. In this study, tomato and lettuce production using an agrivoltaic high tunnel (HT) design specific for a subtropical environment (NE Georgia, USA, USDA Zone 8A) was tested using organic production standards. The design utilized typical HTs (approx. 11 m × 5 m) with solar panel arrays hung internally. The design aimed to (1) meet off-grid power needs, (2) mitigate excessive temperature and humidity, (3) balance shade and plant productivity, and (4) simplify installation and maintenance. Treatments were replicated at the HT level, and cultivar differences were assessed to identify genotypes that might serve in future work to optimize yield under partial shade. In 2023 and 2024, we employed novel organic photovoltaic (OPV) panels, which are partially opaque. The OPV panels provided sufficient energy needs to maintain beneficial conditions without external power sources. In 2024, tomato plants in the OPV HTs experienced an area-weighted daily light integral (DLI, mol photons m−2 d−1) of approximately 31.8 (95% CI [28.9, 34.7]), compared to 34.7 (95% CI [31.8, 37.6]) in non-OPV HTs, an approximate reduction of 8%. Average maximum temperatures in the OPV HTs were 33.5 °C (95% CI [30.6, 36.4], compared to 35.1 °C (95% CI [30.9, 39.2]) in the non-OPV HTs, an approximate reduction of 1.6 °C. In 2023, tomato marketable yield was reduced by approximately 0.9 kg per plant in OPV HTs compared to non-OPV HTs (p = 0.023). In 2024, yields were statistically equivalent across all treatments (p > 0.1), while marketable fraction was improved relative to 2023 and was greatest in the HTs. Lettuce yield for both years was unaffected by the presence of HTs or OPV panels (p > 0.1). In 2025, we conducted an additional experiment using a shade-equivalent array of conventional 100% opaque photovoltaic (PV) panels and observed a similar reduction in DLI and no significant impact on tomato yield parameters (p > 0.1 Both designs were effective at equilibrating conditions inside the HTs to ambient temperature levels outside the tunnels. Using results from the study, an app for agrivoltaic value estimation was developed. Based on that software, the presented agrivoltaic design under currently available silicon–PV technology achieves an 18% annual return, assuming system depreciation is minimal and surplus energy could be applied to other on-farm needs.
Keywords:
photovoltaics; sustainability; controlled environment; organic production; tomato; lettuce 1. Introduction
High tunnels (HTs) are large, relatively inexpensive greenhouses that use flexible polyethylene sheets instead of glass or polycarbonate [1,2]. Their use typically results in marketable yield improvements of 20% to 60% compared to open fields, across many species [1,3,4,5,6]. HTs can also enable one or more additional growing seasons per year in warm climates and extend the main growing season in cool ones [7]. They also produce far more consistent harvests [1]. In contrast with conventional greenhouses, these structures do not typically require permitting or incur additional property taxes. HTs can be installed without fixed ground anchors; in conjunction with their light weight, this flexibility allows them to be moved on sleds and thus to permit cultivation of the covered soil by machinery of essentially any size.
Even with these substantial gains, it can take ~2–5 years for growers to recoup material and installation costs [8]. In addition, plastic is often replaced every 3–4 years. HTs rarely possess active thermal regulation; in hot and humid climates, HTs often (and with increasing frequency) reach detrimental conditions in the summer [2]. Heat waves occurring at critical growth periods can result in effectively zero yield, substantially cutting into the advantages outlined above. Numerous cooling strategies have been proposed, although most require energy outlays that may be prohibitive, particularly if electrical infrastructure is unavailable, i.e., “off-grid” applications [9].
Coupling conventional photovoltaics (PV) with controlled environment systems (i.e., agrivoltaics), including greenhouses, has generated substantial interest among growers and researchers over the past ~15 years [10,11]. While adding this PV capacity incurs additional cost, the costs may be partially offset by on-site electricity production. Shade cast by panels may also reduce summer temperature conditions. In fact, agrivoltaic methods often benefit solar equipment as well via the cooling effect of adjacent plant transpiration [12]. Yet, reductions in light have complex effects on plant growth that need further study, particularly in subtropical environments where few experiments have been carried out.
Temperature aside, plants are often challenged by high levels of solar radiation. The portion of the light spectrum that is usable by plants, between 400 and 700 nm, is referred to as photosynthetically active radiation (PAR), and its quantity is referred to as photosynthetic photon flux density (PPFD, µmol photons m−2 s−1). Additionally, the daily light integral (DLI, mol m−2 d−1), is used to convey the total sum of photons available over the course of a day. When PPFD exceeds the photosynthetic capacity of the plant, photoinhibition occurs, requiring the plant to expend resources on physical or biochemical responses [13]. In the worst cases, photobleaching and tissue damage result; in the best cases, excess light is re-radiated as light or heat, reducing light use efficiency for photosynthesis [14,15]. In dwarf tomato, average photosynthetic efficiency has been found to be optimal around 300 PPFD, while the greatest overall growth may be achieved around 700 PPFD [16,17]. However, radiation use efficiency declines at this level, and thus there may be an economic trade-off to consider when using artificial light. Optimal PPFD ranges for non-dwarf, commercial varieties are less well defined due to variation in growth habit, fruit size, etc., although tomato is generally considered to have a very high light requirement of around 30 DLI [18], or roughly 1000 PPFD for 14 h per day. In lettuce, optimal PPFD likely falls between 100 and 650, depending on temperature [19]. Generally, as PPFD increases, photosynthetic efficiency steadily declines [17,20,21]. On a typical summer day in the southeastern US, the average PPFD is near 900 [22], with maximum instantaneous PPFD exceeding 2000. In short, much of the solar energy to which a plant is exposed is not used optimally and is often detrimental.
The balance between >300 PPFD and yield is critical: even if the energy conversion efficiency is half maximum at 600 PPFD, the additional photons are still supplying biochemical energy and a net benefit to the plant. Thus, agrivoltaic trials using conventional solar indicate a direct tradeoff between the fraction of shading and total crop yield, particularly for warm-season vegetables [20]. Yet, in contrast to total yield, marketable yield is frequently improved or at least maintained via shade cloth, often even at 50% captured light [20]. Indeed, of two plants with the same marketable yield, the one with higher total yield can actually cost more to harvest, due to added picking and sorting labor. This rationale might partly explain the seeming paradox of shade cloth usage, even when net marketable yield in shaded and unshaded environments is equivalent.
The impact of shading pattern also appears to play a role in both total and marketable yield. Given the optimal light intensities described above [21,23], more work is needed to disentangle the relationship between temperature, total available light, and the balance of light and shade that a plant encounters through the day.
Semi-transparent organic photovoltaics (OPVs) offer consistent light regimes comparable to shade cloth, as opposed to the all-or-none hard shading patterns resulting from conventional silicon PV panels. OPVs are also lighter, more flexible, more sustainable, and theoretically more scalable given that they are amenable to roll-to-roll production [24]. Though currently much less efficient than silicon PVs, recent work has demonstrated 13.5% power conversion efficiency with 21% light transmittance—offering roughly half the power per meter of conventional, completely opaque solar [25]. However, OPV technology may be less durable than conventional PV panels, though long-term testing is required to quantify the durability in an agrivoltaic use case. The vast majority of work on OPVs has revolved around greenhouse production [26,27,28]. In contrast, low impact structures such as HTs and hoop-houses have received far less attention, in spite of the fact that off-grid power production is typically more important in these applications. Recent work in HTs demonstrates that OPVs can be employed with minimal effects on yield [26,29]. Importantly, these studies focused on arid locations where disease consequences of high humidity are diminished, and light and temperature are far more consistent. Configurations have not been tested or optimized for subtropical deployment.
Understanding the genetics of crop performance in agrivoltaic conditions is also still in its infancy. Recent work suggests there is a differential transcriptional response, albeit small in certain species, to variability in light quality related to PV applications [30]. The degree to which these genetic differences manifest in a field setting is unknown, although modeling results offer clues into the most efficient combination of light and genetic response [31]. As a first pass, measuring consistent genotype-by-environment (GxE) interaction among commercial cultivars is a critical first step toward assessing breeding improvement potential and determining the best approach.
In 2023 and 2024, we evaluated organic tomato and lettuce performance in open-field conditions, open HTs, unshaded HTs, and HTs fitted with internally installed overhead OPV panels. Tomato is a high-value, high-light crop, while lettuce is a high-value, low-light crop; these crops allowed us to test a range of light requirements in crops that are important to growers. Our explicit objective was to determine if the model crops experienced significant yield penalties due to the presence of the solar panels. Our HT design was modified to include gable fans and enclosed with insect mesh on the sides and ends in order to maintain comparable air temperatures across all three environments and to reduce stem moisture in enclosed structures, critical for subtropical conditions. We also examined the GxE effects on differential performance for tomato and lettuce varieties across conditions.
Since OPVs remain prohibitively expensive for applied deployment, we further sought to determine whether lower-cost conventional PV panels, configured to produce equivalent shade levels, would yield similar agronomic outcomes. In 2025, we followed up our OPV experiments with an additional experiment wherein conventional PVs were substituted for the OPVs while keeping all other HT design aspects unchanged, in an attempt to find the limit of PV shade for tomato. For the 2025 experiment, we tested only two tomato genotypes that demonstrated potential GxE in the earlier experiments. Finally, we developed an open-source app to evaluate the cost–benefit of agrivoltaic additions, and we analyzed the value proposition of OPV and conventional PV solar panels in typical HT applications.
2. Materials and Methods
2.1. Plant Material, Cultivation, and Harvest
All experiments were carried out at the University of Georgia Durham Horticulture Farm (Watkinsville, Georgia, USA; lat. 33.88689° N, long. 83.41941° W; Koppen Climate Class Cfa [humid subtropical]; soil type Cecil sandy loam) over three growing seasons: 2023, 2024 (OPV experiments), and 2025 (conventional PV experiment). Cultivation followed USDA organic vegetable production standards [32]. For the OPV experiments, 11 tomato (Solanum lycopersicum) cultivars and 6 lettuce (Lactuca sativa) cultivars were tested (Table A1). Seeds were acquired from Johnny’s Selected Seeds (https://www.johnnyseeds.com/; Winslow, Maine, USA), except for tomato cultivar M82, which was obtained from a collaborator. Seeds were germinated in 128-well Styrofoam trays in a greenhouse approximately 4 weeks prior to transplanting in the field. Seedlings were fertilized with fish emulsion after the emergence of the first set of true leaves, approximately 2 weeks post-germination. Prior to transplanting into the treatment plots, the plots were tilled, beds were shaped, and 10-8-2 (N-P2O5-K2O) granulated organic fertilizer was incorporated into the soil at a rate of 112 g m−2. After fertilizing, plastic ground cover was applied to beds with the white side up. Tomato seedlings were transplanted into the treatment plots on 24 April 2023 and 8 May 2024. In 2023, 6 seedlings of each tomato cultivar were transplanted into each HT and field plot; while in 2024, 5 seedlings of each tomato cultivar were transplanted into each HT. Lettuce seedlings were transplanted on 24 September 2023 and 3 October 2024. For lettuce, 9 seedlings per cultivar per plot were transplanted in both years. Both plant species were transplanted to a final within-row spacing of 45 cm. Due to limited space in the HTs, border rows were not utilized. Irrigation was applied by a single line of 0.5 GPH/100’ drip tape for 2 h every other day across the 2023 season. In 2024, irrigation was applied for a period of 2 h every other day but was increased to 3 h every other day on 7 June 2024 due to the high temperatures. For lettuce, both seasons received irrigation at a rate of 1 h every other day. The main leader stem of all tomato plants was supported by a Florida weave trellis applied as needed throughout both growing seasons. During the week of 28 May 2023, suckers and side stems of tomato plants were pruned to maintain a minimum of 15 cm of ground clearance to reduce disease pressure and increase air flow. In 2024, tomato side stems were rarely pruned but trellised instead. To reset the HTs and field plots after the tomato experiments, irrigation was withheld, and whole tomato plants were subsequently harvested at the soil surface. Prior to the lettuce experiments, the ground plastic was removed and the plots were tilled; 10-8-2 organic fertilizer was applied at 112 g m−2; and plots were re-tilled. Plots were weeded by hand during lettuce cultivation.
Tomatoes were harvested 5 times each year (5 July 2023–10 August 2023; 4 July 2024–14 August 2024) Although all varieties were determinate, each variety had different growth and fruiting timelines, necessitating multiple harvests. Fruits were harvested and in the field divided into marketable and unmarketable categories, weighted, and counted. Marketable fruits were those that met U.S. No. 1 or U.S. No. 2 requirements set by the USDA Tomato Grades and Standards [33]. Unmarketable fruits were those that did not meet this standard, most often due to blossom end rot, sunscald, or armyworm damage. All fruits were harvested at “breaker” stage [33]. Marketable and unmarketable yields were totaled for each plant at the end of the season. Total yield was calculated as the sum of marketable and unmarketable fruits. In 2024, above-ground biomass measurements were obtained by cutting 3 of the 5 innermost cultivar replicates (i.e., replicates near the ends of the HTs were excluded) of tomato plants at the ground level and weighing each plant after removing remaining unripe fruits. Lettuce plants were harvested on 14 November 2023, and 13 November 2024, when head widths were greater than 22 cm on average. Whole lettuce plants were cut at the soil surface, and the ground-level and damaged leaves were removed before weighing in the field.
For the 2025 conventional PV experiment, the same cultivation methods were employed as in the 2023/2024 seasons (i.e., plant germination, seedling care, bed preparation, fertilization, irrigation, and trellising). Cultivars ‘Jolene’ and ‘BHN589’ were each planted in 3 blocks of 8 plants within each HT, for a total of 24 plants per cultivar, per HT. Seedlings were transplanted on 26 April 2025. Uncovered HTs were not utilized in this experiment. Again, tomatoes were harvested 5 times (4 July 2025–6 August 2025), and harvesting methods were identical to the 2023/2024 experiments. Lettuce was not tested in 2025.
2.2. Agrivoltaic High Tunnel Design
The agrivoltaic HT design aimed to provide on-site energy production sufficient to mitigate increased temperatures common to HT environments through the use of exhaust fans. Essentially, standard HTs were retrofitted with internally hung solar panels covering a portion of the HT footprint. In 2023, four HTs and an open-field site were used (Figure 1). The open-field site was used due to limited HTs available in 2023 (n = 4), and the minimum experimental unit for statistical tests was n = 2 for the OPV and non-OPV treatments. The HTs were oriented approximately 45° off the north–south axis. The field site, located approximately 100 m away, was similarly oriented. Each HT measured 4.88 m × 10.97 m × 3.2 m and was covered in Sun Selector 6 mm clear poly film (applied approximately one week after transplanting in 2023 and left in place for 2024 season). Side walls were covered with 40-mesh screen to promote ventilation while limiting insect intrusion, while the end walls were left open until the lettuce experiment, when they were covered approximately 1 m from the ground up to discourage rodent herbivory. In 2024, two additional, uncovered HTs adjacent to the original four were used instead of the field plots as controls. This change was made as the two new HTs became available to us and were more appropriate comparisons than the field plots. The two new HTs were tilled twice to incorporate a buckwheat cover crop, followed by the same preparation steps as the other HTs. Equipment and coverings from one of the 2023 HTs (not containing OPV panels) were transferred to one of the two new HTs, and the original non-OPV HT was left uncovered as a control. One of the new HTs served as the second uncovered control. In 2024, the insect mesh was used to enclose the entirety of all the HTs except the open control plots.
Figure 1.
Overview of OPV high tunnel design and experimental plots. (a,b) HTs with OPV panels installed. (a) In 2023, the ends of the HTs were left open, while in (b) 2024, the ends were enclosed by insect mesh. (c) Custom fabricated OPV panels. Panels measured 2.1 m by 0.6 m and were composed of a wood frame with OPV film attached by high-strength double-sided tape. Panels were hung approximately three meters above the soil surface and oriented to maximize light interception. (d) Four HTs used in 2023 season, with OPV panels not yet installed. In 2024, two additional HTs approximately 10 m to the left (as pictured) of these HTs were added to the experimental design. (e) Dimensions and layout of OPV HT. Gray boxes with brown outlines represent OPV panels. The red circle depicts the location of the PAR and temperature sensors directly underneath the center OPV panel. The sensors were mounted approximately 2 m above the soil surface.
In 2023, OPV panels were installed 5 weeks after transplantation, generally matching when shade cloth would be installed to reduce temperature and prevent skin blemish. Hereafter, these HTs are referred to as “OPV HTs,” while covered HTs without OPV panels are referred to as “non-OPV HTs,” and the uncovered control plots are referred to as “uncovered” to distinguish from the 2023 “field” plots. To amplify shading effects and maximize power production, OPV panels were installed prior to transplanting in 2024. Between 2023 and 2024, the OPV panels were taken down, stored indoors over winter, and cleaned prior to reinstalling in the HTs. Fans (51 cm 12 V DC, Western Harmonics, Tucson, AZ, USA) were installed 1.83 m to the inside of both gable end walls, for two fans per HT (Figure 1a). The southern fan was directed parallel to the ground and blew directly out of the gable end. The northern fan blew into the HT at a 20-degree downward angle. Fans were set to high (5.6 amps). For tomato cultivation, fans were triggered by morning light, ran until 8:00, and then from 11:00 to 18:00. For lettuce cultivation, running was restricted from 11:00 to 18:00. Additionally, 100 W external panels were installed to add power to HTs with fans (two per OPV HTs and three per non-OPV HTs). For each HT, a Grape Solar COMET (Eugene, OR, USA) charging system and 12 V 100 AH Sealed Lead Acid Deep Cycle AGM battery were used to maintain fan power over the specified range.
OPV modules were produced by the ASCA corporation (www.asca.com, Kitzingen, Germany). Each module was 2.1 m × 0.32 m and, in full zenith sunlight, produced ~12 V DC across an open circuit. For our purposes, two modules were connected in series to form a panel producing ~24 V DC. Two OPV modules were anchored to wooden frames using 3M (St. Paul, MN, USA) VHB Heavy Duty Mounting Tape, similarly to prior methods [34], forming a single OPV panel (Figure 1a–c). In each year, two HTs were assigned to the OPV treatment level. For each OPV HT, seven OPV panels were hung equally spaced from secondary roof purlins (Figure 1c). For all HTs, supplemental power, when needed, was supplied by external 100 W conventional solar panels. For tomato cultivation, panels were oriented 5 degrees off horizon with a southern bias (Figure 1b). For lettuce, cultivation panels were rotated and angled to orient tangentially to the southern zenith.
For the 2025 conventional PV experiment, the OPV panels were removed, and conventional PV panels, a mix of Renogy (Ontario, CA, USA) 200 W panels (RNG-100D-SSx2), and HQST 100 W panels (HSP100P-1) were installed end-to-end along the center of the HTs with approximately 0.25 m gaps between. All other HT design aspects were the same as in the 2024 season (i.e., insect mesh-enclosed sides and ends and gable end exhaust fan orientation).
2.3. Temperature and Photosynthetic Photon Flux Density Measurements
Four temperature data-loggers (HOBO Pro v2, U23-004, LI-COR Inc., Lincoln, NE, USA) were installed in the center of each HT at a height of 120 cm with a 20 cm × 20 cm sun-screen mounted 3 cm above. In the 2023 lettuce season and both tomato seasons, two OPV HTs, one non-OPV HT, and an adjacent, unused, uncovered plot were monitored for temperature. In the 2024 lettuce season, the temperature sensor was removed from the uncovered plot and installed in a non-OPV HT. In 2023, temperature was monitored from 1 August 2023 to 29 August 2023 (the last month of tomato cultivation) and 28 September 2023 to 31 October 2023, through lettuce growth and harvest. In 2024, temperature was monitored for the entirety of the growing season. In both years, hourly measurements were taken, and the highest and lowest five measurements for each day were averaged to represent the daily maximum and minimum temperatures for each condition (Figure 2).
Figure 2.
Effects of OPV panels on HT solar radiation and temperature in 2024. (a,e) Instantaneous PPFD over a representative week during the 2024 tomato and lettuce growing seasons, respectively, plotted as 15 min bin averages. The PAR sensors were placed directly below the center OPV panel in both OPV HTs; (b,f) Mean daily light interval (DLI) across the 2024 tomato and lettuce growing seasons, respectively. DLI was calculated per day according to LI-COR. Bars represent 95% confidence intervals; (c,g) 2024 season-long temperatures for tomato and lettuce seasons, respectively. For each day, the maximum and minimum temperatures plotted are the means of the five highest and lowest time points per day. The black line in the tomato plot reflects the 10-year average temperature recorded at the research site weather station. (d,h) Mean maximum temperatures across the tomato and lettuce growing seasons. For each line plot, the colors directly correspond to the treatment colors indicated in the adjacent box plots’ legends. OPV: OPV HTs, gOPV: geometric mean DLI of OPV HTs, aOPV: area-weighted average DLI of OPV HTs, nOPV: non-OPV HTs, Unc: uncovered HTs.
In 2024 and 2025 photosynthetic photon flux density (PPFD, μmol m−2 s−1) was monitored with HOBO Photosynthetic Light (PAR) Smart Sensors (S-LIA-M003, LI-COR Inc., Lincoln, NE, USA). PAR was not monitored in 2023 due to equipment limitations. In 2024, five of the six HTs (two OPV HTs, two non-OPV HTs, and one uncovered HT) were monitored, while in 2025 PPFD was monitored in all 4 HTs used, plus an unused adjacent, uncovered HT. The PAR sensors measured solar radiation in the range of 400–700 nm wavelengths. The PAR sensors were mounted in the center of each HT (directly underneath the center OPV/PV panel in HTs A and D to capture maximum shade from the OPV panels) at a height of approximately 2 m. Each PAR sensor was leveled during installation with a HOBO Light Sensor Level (M-LLA, LI-COR Inc., Lincoln, NE, USA) and adjusted periodically throughout the growing season. Instantaneous PPFD measurements were taken every 10 s for the duration of the growing seasons. Daily light integral (DLI, mol m−2 d−1) was calculated according to LI-COR [35]. Due to the non-uniform shading pattern cast by the solar panels, precise estimation of the average light experienced by a given plant is not feasible; however, we estimated the effective DLI across the OPV/PV HTs (i.e., the DLI any given plant in the HT is likely to have experienced) by calculating the area-weighted average. Because of the central bias of the panels, we also calculated the geometric mean DLI of the OPV/PV and non-OPV/non-PV HTs. Total transmittance of the OPV film was calculated from the average instantaneous PPFD measurements at noon during the week of the 2024 summer solstice (17–24 June). To estimate the effect of the solar panels on temperature and DLI, a linear mixed model of the form,
was fit using the ‘lme’ function in the R package nlme version 3.1.168 [36]. For each measurement, Yij represented the measured value for the i-th treatment and the j-th high tunnel. μ is the overall mean, αi is the fixed effect of the i-th treatment, bj is the random effect of the j-th high tunnel, and εij is the residual error modeled using an AR (1) correlation structure. This model accounts for the repeated-measures aspect of the light measurements. Estimated marginal means and 95% confidence intervals were obtained from the linear mixed model using the emmeans version 1.11.2 [37] package implemented in R version 4.4.3 [38].
2.4. Experimental Design and Yield Statistical Analysis
2.4.1. Tomato
For both years of the OPV experiments, the experimental design was a randomized complete block design (here, “blocks” refer to HTs or control equivalent), with blocks nested in treatments. Five individual plants from each cultivar were randomly allocated to each plot. Therefore, in 2023 and 2024, 10 replicates per cultivar per treatment were planted, except in 2023, when 24 to 28 replicates of each cultivar were planted randomly in the open-field control plot. The field plot was subdivided into 4 equal plots such that each subplot contained equal numbers of replicates as the HTs. Each year was examined independently, due to the change in control plot location and the aberrantly cool, wet 2023 season (Figure A1). To assess overall productivity of the agrivoltaic design on tomato yield parameters, the weights of marketable and unmarketable fruits from all plants harvested over the season were summed within each plot. Only values for plants having >100 g total yield and >0 marketable yield were retained for downstream analysis (60 plants removed; Table A1).
For the per-plant analyses (i.e., the average yield of a given plant across the growing season), linear mixed models were used, where the experimental units were the HTs. Individual plants yielding less than 100 g due to biotic pressures (mainly armyworm herbivory and late blight disease) were removed from the dataset. Furthermore, the 2023 field plots were not used in these analyses due to extreme abiotic pressures (mainly field flooding) unique to the field plots (Figure A2). This decision avoids penalization due to extraneous variables which would obscure the effect of the solar treatments on plant growth and yield. Therefore, for 2023, comparisons and tests were only conducted between the OPV and non-OPV HTs. Furthermore, in the linear models that follow, year was not included as a factor, due to the high variability and incomplete treatment replication across years. Thus, the results presented below are not generalizable across years and are interpreted independently. To estimate the effect of the solar treatments on marketable yield, total yield, and marketable fraction at the species level under the solar treatments, a linear mixed model of the form
was fit using the ‘lmer’ function in the R package lmerTest version 3.1.3 [39] (this and all following models). For each trait, Yijk represented the measured value for the i-th treatment, j-th cultivar, and k-th block within treatment i and k-th observation. μ is the overall mean, αi is the fixed effect of the i-th treatment, βj is the fixed effect of the j-th cultivar, and (αβ)ij is the interaction effect between the i-th treatment and the j-th cultivar. bk(i) is the random effect of block k nested within treatment i. εijk is the residual error, assumed to be independent and identically distributed: εijk∼N(0, σ2). Estimated marginal means and group statistical comparisons (averaging over the genotype level) were obtained from the linear mixed model using emmeans (this and all following models). To test for genotype by environment (GxE) interactions among the cultivars, as well as the effect on above-ground biomass accumulation, the field and uncovered plots were ignored, and the same model was used.
In 2025, the experimental design was a split-plot randomized complete block design (RCBD), with blocks nested within whole plots. In contrast 2023 and 2024 experiments, two genotypes (‘BHN 589’ and ‘Jolene’) were planted in blocks of 8 plants, with two blocks per row. Thus, three blocks per cultivar per HT were planted. During this experiment, HTs experienced substantial late blight pressure, which resulted in very low yields from some plants and a strongly bimodal distribution. Therefore, all plants yielding less than 2 kg were removed from the dataset (total of 60 plants removed, mainly from OPV HT D; Table A2).
As above, to estimate the effect of the solar treatments on marketable yield, total yield, marketable fraction, and GxE, a linear mixed model of the form
was fit. For each trait, Yijkl represented the measured value for the i-th treatment for the j-th cultivar in the k-th HT in the l-th block. μ is the overall mean, αi is the fixed effect of the i-th treatment, βj is the fixed effect of the j-th cultivar, and (αβ)jj is the interaction between the i-th treatment and the j-th cultivar. bk(i) is the random effect of the k-th HT nested within the i-th treatment, and cl(k) is the random effect of the l-th block nested within the k-th HT. εijkl is the residual error, assumed to be independent and identically distributed: εijkl∼N(0, σ2).
2.4.2. Lettuce
For lettuce, similar methods as those used in the tomato analyses were employed. To assess overall productivity of the agrivoltaic design on lettuce yield, total yield harvested over the season was summed. For the per-plant analyses, individual plants yielding less than 50 g due to biotic pressures (mainly mammal herbivory) were filtered from the data set (100 plants removed; Table A1). Again, the 2023 field plots were not used in these analyses, due to aforementioned difficulties with those plots. To estimate the effect of the solar treatments on marketable yield at the species level under the solar treatments, a linear mixed model of the form
was fit. For each trait, Yijk represented the measured value for the i-th treatment, j-th cultivar, and k-th block within the treatment i and k-th observation. μ is the overall mean, αi is the fixed effect of the i-th treatment, βj is the fixed effect of the j-th cultivar, and (αβ)ij is the interaction effect between the i-th treatment and the j-th cultivar. bk(i) is the random effect of block k nested within treatment i. εijk is the residual error, assumed to be independent and identically distributed: εijk∼N(0, σ2). To test for GxE interactions among the cultivars, the field and uncovered plots were ignored, and the same model was used. All R code used in the above analyses is available at https://github.com/rick-field/agrivoltaics (accessed on 26 February 2025).
2.5. Energy Production—Modelling and Cross-Validation
The OPV array, the two supplemental external 100 W silicon panels, and the two exhaust fans in each OPV high tunnel shared a common Grape Solar COMET charge controller and a 12 V deep-cycle battery (Section 2.2). Because the OPV array and the supplemental panels were tied to the same charge-controller input, the energy contribution of the OPV array alone could not be directly metered separately from the supplemental contribution at any point downstream of the panels. We therefore report modelled OPV-attributable energy production, anchored in site-specific climate data and the manufacturer-rated module performance. On-site wattmeter readings of the OPV component were used as bounding cross-checks.
2.5.1. Modelling Approach
Hourly direct–normal, diffuse–horizontal, and global–horizontal irradiance measures for the site (33.88689° N, 83.41941° W) were obtained from the NREL NSRDB v4 GOES-aggregated database for the five years 2019–2023. Plane of array (POA) irradiance on the OPV panels was computed using the Hay–Davies model (pvlib version 0.11, [40]) at the as-installed panel tilt and azimuth specified in Section 2.2 (5° tilt with southern bias during the tomato season; ~45° tilt south during the lettuce season, oriented tangentially to the southern zenith). POA irradiance was reduced by the 78% HT-plastic PAR transmittance (Section 3.2) to obtain the irradiance incident on the OPV active surface, and a Sandia Array Performance Model cell temperature derate was applied [41]. Wavelength-resolved OPV response was modelled with the characteristic P3HT:PCBM external quantum efficiency (EQE) digitized from Ismail et al. [42]; the chemistry assignment is supported by Magadley et al. [34], who characterized an ASCA-class P3HT:PCBM panel fabricated by ambient roll-to-roll, the same manufacturing process used by ASCA. The peak EQE was calibrated such that the implied STC power conversion efficiency (with P3HT:PCBM Voc = 0.61 V and FF = 0.625 from the literature [43]) reproduces the manufacturer-rated array output of ~300 W per HT at solar zenith (Section 4.7):
This calibration yields peak EQE = 71.3% and Jsc = 9.04 mA/cm2 under AM1.5G, at the upper end of optimized P3HT:PCBM lab cells [43] and representing the highest plausible OPV output consistent with the manufacturer specification. Figure A3 shows the EQE shape overlaid on the modelled UGA Durham Horticulture Farm solar spectra (clear-sky summer and autumn noon) and the HT plastic transmittance spectrum.
To project the deployed module’s site-specific output, we compute a spectral mismatch factor (SMM) as the ratio of the in-band (EQE-weighted, post-plastic) irradiance fraction at the site to the same fraction under AM1.5G:
The site spectrum Gsite(λ, θz) was generated using the SMARTS atmospheric model [44] for the UGA Durham Horticulture Farm site pressure (990 mbar) over a grid of nine solar zenith angles (5° to 85° in 10° steps); per-hour spectra were obtained by linear interpolation in zenith. Figure A4 shows SMM as a continuous function of zenith. Above θz ≈ 75°, Rayleigh scattering removes the short-wavelength tail to which P3HT:PCBM is responsive and SMM drops below 1; for the bulk of daylight hours SMM > 1, reflecting the fact that the Watkinsville humid–subtropical spectrum is enriched in the 350–650 nm band where P3HT:PCBM absorbs.
2.5.2. Cross-Validation Against On-Site Readings
Manual wattmeter readings were taken on clear-sky days at noon throughout the tomato growing season while fans were active. The wattmeter was wired in series on the array feed immediately upstream of the COMET charge-controller PV input. Values averaged approximately 78 W. Both the OPV array and the two supplemental panels feed this single input, so the meter records their combined power into the controller. This value is below the output expected from the two supplemental silicon panels alone at solar noon, indicating that the controller was curtailing harvest because the battery was charged rather than the array being supply-limited; a charge controller draws from the array only what the battery and load can absorb. The reading therefore reflects system demand—not array generation capacity—and bounds the OPV array’s delivered contribution from above rather than its potential output:
A complementary lower bound is supplied by the uninterrupted operation of the fans during scheduled hours across both growing seasons: at every operating moment, POPV(t) + Psupplemental(t) ≥ Pfan,draw, which combined with the supplemental power (2 × 100 W per OPV HT) bounds the minimum OPV contribution required to maintain operation under partial supplemental support. Consistent with this, the metered noon throughput is far below the array’s modelled clear-sky noon output, as expected when a battery-buffered array that generates more than the load requires (Section 3.8) is curtailed by the controller for much of the day; the on-site readings therefore corroborate the modelled surplus qualitatively rather than bounding its magnitude.
2.5.3. Supplemental Panel Accounting
Two external 100 W silicon panels per OPV HT operated under unshaded ambient conditions outside the HT envelope. Their seasonal energy contribution was modelled identically to the OPV array (Hay–Davies POA, SAPM cell-temperature derate) but with the panels assumed to be south-facing at latitude tilt (33.9°) under full ambient insolation, with 18% STC efficiency and a −0.40%/°C temperature coefficient typical of crystalline–silicon modules. The active silicon area is 2 × 100 W/(1000 W m2 × 0.18) = 1.11 m2 per OPV HT. Across the five NSRDB years, the supplemental panels contributed 102 ± 1 kWh per HT during the tomato season and 41 ± 3 kWh per HT during the lettuce season. These values are deducted from the upper-bound system-level wattmeter readings when interpreting cross-validation and reported alongside the modelled OPV output in Section 3.8, so the OPV-attributable share is explicit.
2.5.4. Fan Demand
Fan energy demand was computed from the manufacturer-rated draw (51 cm 12 V DC axial fan, 5.6 A × 12 V = 67.2 W; two fans per HT, 134.4 W total) and the daily run schedule documented in Section 2.2 (~10 h per day during the tomato season; ~7 h per day during the lettuce season). Modelling and integration were performed in Python version 3.12; the code is deposited at the project repository (opv_climate_sweep.py, opv_spectral_model.py).
3. Results
3.1. Agrivoltaic High Tunnel Design Reduces Ambient Temperature to Near-Outdoor Levels
Our agrivoltaic HT design (Figure 1), which utilized gable end exhaust fans powered via captured solar energy, combined with insect mesh-enclosed sides and ends, resulted in lower average maximum (Figure 2c,d; Supplementary Table S12) and mean temperatures during the 2024 tomato growing season than are typically observed within enclosed HTs, which can increase between 2 °C and 12 °C above outside temperatures [2,6,45,46]. During the 2024 tomato season, the average maximum temperature inside the non-OPV HT was 35.1 °C (95% CI [30.9, 39.2]; Figure 2d), approximately 2.4 °C greater than the uncovered plot (32.7 °C, 95% CI [31.7, 33.8]). Shade provided by the OPV panels contributed to an average maximum temperature of 33.5 °C (95% CI [30.6, 36.4]) in OPV HTs, approximately 1.6 °C lower than the non-OPV HT. These maximum averages are much lower than the maximum temperatures recorded in previous research carried out in the same HTs used here when fully enclosed with plastic film (~40 °C) [46]. Minimum daily temperatures (i.e., nighttime temperatures) were nearly identical between all the treatments (Supplemental Table S12), and therefore the differences between mean daily temperatures were not as wide, and all treatments fell within the ideal temperature range for cultivating tomatoes commercially (26–28 °C, Supplemental Table S12) [47].
During the 2024 lettuce growing season, the cooling effect of the OPV panels was less pronounced, as expected. In the non-OPV HTs, average maximum temperature was 26.2 °C (95% [25.1, 27.2]; Figure 2g,h), while in the OPV HTs, it was 25.6 °C (95% CI [24.5, 26.8]). Average minimum and mean temperatures were again essentially indistinguishable between the OPV and non-OPV HTs (Supplemental Table S13).
3.2. Solar HT Design Maintains Adequate Light Requirements for Tomato and Lettuce
OPV technology is semi-transparent, transmitting a portion of incoming light and providing the dual benefits of (1) harvesting solar radiation for on-farm power generation and (2) providing shade to crops. The OPV panels deployed in our experiment transmitted approximately 30% of incoming PPFD, while the Solar Selector poly film covering the HTs transmitted approximately 78%. Thus, total instantaneous PPFD reaching a plant directly under both the HT plastic and the OPV panel at noon was 24%, representing the minimum instantaneous shade a plant could have experienced.
Daily light integral (DLI) is the total amount of photons intercepted by a plant over the course of a day, given in mol m−2 d−1 [35], and is a more useful measure in light experiments because it integrates PPFD over a 24 h period. DLI is commonly used by growers to guide cultivation practices. Tomato is considered a high-light crop, requiring DLI in the range of 25–30 for optimal yield [48,49]. During the 2024 tomato season, the average DLI in the uncovered HT was 44 (95% CI [39.8, 48.1]. The average DLI in the non-OPV HTs (34.7, 95% CI [31.8, 37.6]) was more than double the average unadjusted DLI received by the PAR sensors underneath the central OPV panel in the OPV HTs (17, 95% CI [14.5, 19.4]; Figure 2b; Supplementary Table S1). It is important to note that the OPV panels covered approximately 16.5% of the HT footprint with ~0.6 m gaps in between the panels (Figure 1e). Thus, all of the plants were not shaded for the entirety of a given day but rather experienced variable periods of OPV shade. Considering this, we calculated the area-weighted average DLI and the geometric mean DLI between OPV and non-OPV HTs to estimate the effective DLI experienced in the OPV HTs. The area-weighted average DLI was 31.8 (95% CI [28.9, 34.7]), while the geometric mean was 26.6 (95% CI [23.7, 29.5]), representing an approximate reduction of 8–23% compared to the non-OPV HTs. Considering these two measures as near the upper and lower bounds of effective DLI experienced across the entire HT, the available light was within the range of accepted DLI required for optimal tomato growth. In other words, the average plant in an OPV HT was exposed to at least 60% DLI relative to the uncovered controls.
During the 2024 lettuce season, average DLI was predictably lower than during the tomato season due to less available light later in the year, with average DLI of 24.7 (95% CI [17.6, 31.8]; Figure 2f; Supplementary Table S2) in the uncovered HT and 18.7 (95% CI [14.6, 22.9]) in the non-OPV HTs. Average unadjusted DLI in the OPV HTs was 10.7 (95% CI [5.7, 15.7]), while the area-weighted average DLI in the OPV HTs was 17.5 (95% CI [12.5, 22.5]), and the geometric mean was 15.1 (95% CI [10.1, 20.1]). Thus, on average, lettuce plants in the OPV HTs experienced an approximate DLI reduction of 6–19% compared to those in the non-OPV HTs. These upper and lower bounds of DLI again represent an acceptable range for lettuce, considered a low-light crop [18,50].
3.3. Variation in Yearly Weather and Degree of Enclosure Strongly Impacted Tomato Marketability and Collective Yields Across Growth Environments
In 2023, climate and pest pressures substantially impacted marketable yield (Figure 3). Field plots experienced intermittent flooding early in the season due to an unseasonably cool, wet spring (Figure A1), which led to substantial blight pressure and plant death. Though less impacted by the damp conditions seen in the field plots, the HTs in 2023 suffered multiple armyworm infestations, particularly in the OPV HTs (Figure A2). These pressures resulted in a lower-than-expected marketable yield (i.e., fruits meeting US No. 1 or No. 2 criteria [33]) and marketable fraction (the percent of all fruits that were of marketable quality) across all treatments in 2023.
Figure 3.
Total productivity across two growing seasons. (a) Tomato. Total per-plot marketable yield and total productivity. Opaque bars represent the marketable fruit weight portion of total fruit weight, while transparent bars represent the unmarketable portion. (b) Lettuce. All lettuce harvested was considered marketable. Bars with asterisks indicate plots wherein herbivory substantially impacted per-condition yield totals.
In 2024, end walls of enclosed HTs were also netted to minimize wind-driven rain entry and herbivory. Regardless, in both years, the average marketable productivity was greatest from the non-OPV treatment (2023 = 141.51 kg, 2024 = 213.2 kg), followed by the OPV treatment (2023 = 88.35 kg and 183.64 kg), and finally the field (2023 = 50.25 kg) and uncovered (2024 = 168.32 kg) control treatments (Supplementary Table S3). Average total productivity (i.e., the sum of all marketable and unmarketable yield) was also greatest from the non-OPV treatment in both years (2023 = 240.71 kg, 2024 = 235.25 kg), and in 2023, the OPV treatment outperformed the control (189.35 kg and 87.9 kg, respectively; Supplementary Table S3). However, in 2024, after moving the control plots to directly comparable, uncovered HTs, average total productivity was greater in the uncovered treatment than in the OPV treatment (221.22 kg and 201.75 kg, respectively; Supplementary Table S3), suggesting that light availability may have reduced basic yield capacity and was somewhat uncoupled for marketable yield.
3.4. OPV HTs Maintain Per-Plant Marketable Yields in Typical Growth Conditions but Suffered Under Increased Cloud Cover and Reduced Temperatures
As described above, biotic, abiotic, and experimental differences were considerable between the 2023 and 2024 tomato seasons (Figure 3); therefore, in what follows, tests of differences of means for marketable yield, total fruit yield, and marketable fraction were conducted independently within years, and the 2023 field plots were not used in the analyses.
Though we report total yields across an entire growth environments (Figure 3), such assessments obscure the central focus of this study, namely, the impact of variable shade conditions on per-plant yields. For example, tomato blight is common in subtropical environments. The disease is difficult to statistically block due to localized past infestations and non-random spread, creating strong violations from normally distributed yields. Therefore, in the following analyses, dead or missing plants were deemed lost and encoded as ‘NA’ (as opposed to 0 yield) (see methods). In 2023, 1% of plants were lost for non-OPV conditions, 2% for OPV, and 17% for uncovered. In 2024, 0% of plants were lost for non-OPV conditions, 2% for OPV, and 14% for uncovered. Both years speak to the utility of the HT environment in general.
For per-plant marketable yield, in 2023, the non-OPV mean was significantly greater than the OPV treatment (0.903 kg plant−1, p = 0.023; Figure 4a; Supplementary Table S4). In 2024, all treatment means were statistically equivalent. For total yield, in 2023, similarly to the marketable yield results, the non-OPV mean was significantly greater than the OPV mean (0.901 kg plant−1, p = 0.037; Figure 4c; Supplementary Table S4). In 2024, all treatment means were statistically equivalent.
Figure 4.
Effect of OPV panels on yield parameters of tomato and lettuce. (a) Tomato marketable yield. (b) Lettuce marketable yield. (c) Tomato total fruit weight. (d) Tomato marketable fraction. (e) Tomato whole-plant biomass (fresh weight, 2024 only). All values are based on per-plant measurements and ignore dead or diseased plants. Because of substantial seasonal differences between years, analyses were conducted within years, and therefore the significance indicators reflect within-year comparisons (n.s. = p > 0.1, * = p < 0.05, ** = p < 0.01). Black dots indicate datapoints above or below 1.5× interquartile range.
In 2023, the marketable fraction was generally lower than expected, with a grand mean of 53%, and both OPV and non-OPV treatment means were statistically equivalent (Figure 4d; Supplementary Table S4). In 2024, the marketable fraction was improved, with a grand mean of 83.8%. Non-OPV and OPV treatments were statistically equivalent, with both outperforming the uncovered controls (non-OPV estimate = 15.4%, p < 0.008; OPV estimate = 13.4%, p < 0.012). Finally, in 2024, above-ground biomass accumulation was unaffected by either the HTs or the OPV panels (Figure 4e; Supplementary Table S4).
3.5. Limited Genotype-by-Environment Interactions Observed for Mutliple Cultivars
To determine if any genetic differences exist across cultivated tomato varieties, we used a linear mixed-model approach to detect evidence of interactions between the genetic background of each cultivar and the OPV treatment and compared treatment means within each tomato line independently. Again, due to the year-over-year differences described earlier, each season was examined independently. In 2023, although ‘BHN589,’ ‘Gold Nugget,’ ‘M82,’ ‘Marglobe,’ ‘Reverend Morrow’s Long Keeper,’ ‘Sunrise,’ and ‘Washington Cherry’ all had significantly greater marketable yields in the non-OPV treatment (Figure 5a, Supplementary Table S5); only a weak gene-by-environment (GxE) interaction was detected in cultivar ‘Sunrise’, wherein a GxE coefficient (p < 0.093) for the non-OPV treatment was detected at the p < 0.1 significance level (Supplementary Table S6). In 2024, ‘BHN 589’ was the only cultivar in which the treatment means were statistically different, and ‘Jolene’ was the only cultivar in which a significant GxE coefficient for marketable yield was returned (p < 0.005, Supplementary Table S6). ‘BHN 871’ demonstrated a weak GxE interaction at p < 0.1 (Figure 5b).
Figure 5.
Effect of OPV panels on marketable yield of tomato and lettuce cultivars. (a) Tomato cultivars. (b) Lettuce cultivars. For both species, means comparisons were conducted within years; therefore, significance indicators reflect only within-year and within-cultivar comparisons (n.s. = p > 0.1, * = p < 0.05, ** = p < 0.01, *** = p < 0.001). Black dots indicate datapoints above or below 1.5× interquartile range.
Similar results were obtained for total yield. In 2023, no significant GxE coefficients for total yield were returned for any of the cultivars (Supplementary Table S6), although ‘Marglobe,’ ‘Sunrise,’ and ‘Mountain Fresh’ all had significantly greater yields in the non-OPV treatments (p < 0.014, p < 0.002, and p < 0.015, respectively; Supplementary Table S5). In 2024, again, ‘Jolene’ was the only cultivar in which a significant GxE coefficient for total yield was returned for the non-OPV treatments (p < 0.013; Supplementary Table S6). Cultivar ‘Mountain Fresh’ returned a weak GxE coefficient in the non-OPV treatment (p < 0.08). ‘BHN 589’ and ‘Gold Nugget’ both had significantly different means (both p < 0.05; Supplementary Table S5). For biomass, no cultivars demonstrated significant GxE (Supplementary Table S6).
3.6. OPVs Have Little Effect on Lettuce Yield and GxE
Lettuce is considered a low-light, cool-season crop and is frequently grown under shade netting to protect from heat and excess PAR that can reduce yields [4,19,51,52]. As expected, all six varieties of lettuce we tested performed well under the OPV shade. At the species level, neither the non-OPV, OPV, or control means were statistically distinguishable in either year (Figure 4b; Supplementary Table S7). In 2024, a single cultivar (‘Chalupa’) exhibited a significantly greater yield in the non-OPV treatment (p < 0.028, Supplementary Table S7) and a significant GxE interaction (p < 0.019; Supplementary Table S8).
3.7. Conventional PV Panels with Total Radiation Comparable to OPVs Exhibit Equivalent Tomato Yields
OPVs are currently far too costly to deploy in an applied setting. In addition, they alter the transmitted light spectrum. To examine a more realistic agrivoltaic scenario and contrast with the OPV results, we matched the total solar radiation from our OPV experiments with a properly sized conventional silicon–PV overhead installation (Figure 6a). Average DLI in 2025 was similar to that of the 2024 experiment using OPV panels. Average DLI in the uncovered HTs was 53.2 (95% CI [44.7, 61.6]; Figure 6b; Supplementary Table S9), while in the non-OPV HTs, it was 40.4 (95% CI [34.5, 46.4]). Average unadjusted DLI in the PV HTs was 19.0 (95% CI [13.9, 24.1]. The area-weighted average DLI was 36.9 (95% CI [30.9, 42.9]), and the geometric mean DLI was 30.6 (95% CI [24.6, 36.5]). Thus, on average, plants in the PV HTs experienced an approximate DLI reduction of 8–24% DLI compared to the non-PV HTs. Again, it is important to note that the conventional PVs covered approximately 12.5% of the HT footprint and were oriented along the length of the HTs, as opposed to across the HTs as the OPV panels were in 2023 and 2024. Finally, due to equipment malfunction, we were only able to record incoming PAR from 7 May 2025 through to 23 June 2025, and thus estimates of PPFD and DLI may be slightly biased.
Figure 6.
Design and effect of PV panels on yield parameters of tomato. (a) Conventional PV panels were installed end to end along the length of the HTs. (b) Average DLI across treatments. Bars represent 95% confidence intervals. (c) Marketable yield. (d) Total yield. (e) Marketable yield of ‘BHN 589’ and ‘Jolene’. PV: PV HTs, gPV: geometric mean, aPV: area-weighted average DLI of PV HTs, nPV: non-PV HTs, Unc: uncovered HTs, (n.s. = p > 0.1). Black dots indicate datapoints above or below 1.5× interquartile range.
To simplify our genotypic variation and focus on key varieties seen above, we tested only tomato cultivars ‘BHN 589’ and ‘Jolene’ in a more traditional split-plot RCB design in 2025. Marketable yield, total yield, and marketable fraction were all statistically equivalent between the PV and non-PV HTs (Figure 6c,d; Supplementary Table S10). While marketable yield, total yield, and marketable fraction means were indistinguishable within cultivars, GxE interaction was detected in the linear mixed model; a significant interaction coefficient was returned for marketable yield (p < 0.001; Supplementary Table S11), total yield (p < 0.01), and marketable fraction (p < 0.002).
3.8. Energy Production
3.8.1. Modelled OPV Output
Modelled OPV-attributable energy production, with the spectral mismatch factor applied to the broadband climate-sweep result, totalled 210 ± 4 kWh per HT during the tomato season (98 days, range 197–215 kWh across the 2019–2023 NSRDB years) and 74 ± 6 kWh per HT during the lettuce season (42 days, range 66–79 kWh); 284 kWh per HT per year, or 568 kWh across the two OPV HTs combined. Scheduled fan demand totalled 132 kWh per HT (tomato) and 40 kWh per HT (lettuce), or 344 kWh across both OPV HTs. Modelled OPV generation thus exceeded scheduled fan demand in every modelled year (mean coverage 160% in tomato season, 188% in lettuce season, Figure 7). After the ~10% Year-1 efficiency decline reported in Section 4.7, Year-2 mean coverage remained above 100% in both seasons (144% tomato, 169% lettuce).
Figure 7.
Five-year (2019–2023) modelled seasonal OPV generation per high tunnel. For the tomato (red) and lettuce (green) seasons, the broadband (pale) and spectrally-corrected (saturated) estimates are compared to the scheduled fan demand (dashed lines). The spectral correction adds approximately 5.7% (tomato) and 4.6% (lettuce) on top of the broadband baseline. Year-to-year variability in modelled generation is approximately 2% of the mean.
3.8.2. Bounded Cross-Validation
The combined OPV + supplemental modelled output totalled 312 kWh per HT during the tomato season (210 kWh OPV + 102 kWh supplemental) and 115 kWh per HT during the lettuce season (74 kWh + 41 kWh). On-site spot wattmeter readings at the charge-controller PV input averaged ~78 W at solar noon, far below this modelled combined output (clear-sky solstice noon ~420 W combined per HT; POPV,rated ≈ 300 W plus Psupplemental,rated = 200 W derated by latitude tilt POA cosine losses), because the controller curtails harvest once the battery is charged (Section 2.5.2); together with the uninterrupted scheduled operation of the fans throughout both seasons, this confirms the array met demand in practice while operating below capacity. The OPV-attributable share of total seasonal generation was 67% (tomato) and 64% (lettuce); the higher lettuce-season OPV share is driven by the panel reorientation to ~45° south for that season (Section 2.2), which closely matches the optimum tilt for autumn insolation at the site latitude.
3.9. Plant-Facing Spectrum, R–FR, and Phytochrome Photostationary State
Using the spectral pipeline described in Section 2.5, we computed the spectrum transmitted through the OPV onto the leaf surface across the year under clear-sky conditions and integrated PAR-band PPFD, red-to-far-red photon flux ratio (R–FR, 655–665 nm/725–735 nm), and the phytochrome photostationary state proxy R/(R + FR). At clear-sky solar noon during the 2024 tomato season, modelled non-OPV HT PPFD was approximately 1731 µmol/m2/s and modelled under-OPV PPFD was 537 µmol/m2/s, corresponding to 69% PAR interception by the OPV panels, consistent with the directly measured 30% OPV PPFD transmittance reported in Section 3.2 (Figure 8).
Figure 8.
Plant-facing transmitted spectrum at clear-sky summer noon (solar zenith 10°). Outside spectrum (grey), the spectrum reaching plants in the non-OPV HT (green, plastic only), and the spectrum reaching plants under the OPV (red, plastic + OPV). Red and far-red bands used for the R–FR computation are shaded. The P3HT:PCBM cutoff at 650 nm leaves both red (655–665 nm) and far-red (725–735 nm) bands largely transmitted, preserving the spectral quality of light reaching the crop.
The R–FR ratio was 1.22 in the non-OPV HT (close to open daylight, ~1.15) and 1.15 under the OPV, representing a 6% decrease driven entirely by the slight asymmetry between OPV absorption near the cutoff edge at 655–665 nm and the post-cutoff transmittance at 725–735 nm. The phytochrome photostationary state proxy dropped only marginally (0.54 → 0.52). These findings place the OPV optical signal firmly in the neutral-density-shade regime rather than the canopy-shade regime: closed-canopy R–FR is typically 0.1–0.4 with R/(R + FR) ≤ 0.40 [53], well below the modelled under-OPV values. Figure A5 reports the seasonal trajectory of noon clear-sky PPFD and R–FR under the OPV versus the non-OPV control across the full calendar year. The under-OPV R–FR remains within 6% of the non-OPV control throughout, and both stay above the closed-canopy threshold by a factor of three or more. This is consistent with and predictive of the absence of strong shade-avoidant phenotypes in the tomato yield and biomass results (Section 3.4), and with similar OSC-filter spectroradiometric measurements reported by Charles et al. [30], who observed minimal R–FR shifts across three semi-transparent organic solar cell formulations.
4. Discussion
4.1. Ventilated Design Is Effective in Reducing Temperature
HTs allow growers in certain climates to extend the growing season by trapping ambient heat, which can increase the internal ambient temperature by as much as 12 °C when fully enclosed [2,6]. In cold and temperate climates, this effect is desirable because it allows growers to cultivate earlier and later in the year. However, in subtropical climates, very high daytime temperatures can negatively impact yields, and thus HT usage requires additional considerations [46,54]. In this study, we utilized solar-powered exhaust fans coupled with open-air ventilation practices (Figure 1), wherein the sides were covered by insect cloth, and the ends were left either completely open (2023) or also covered with insect netting (2024 and 2025). In each year, the experimental unit for the statistical analyses was the HT; therefore, this research was inherently limited in the number of replicates per treatment each year (n = 2), although research in the agrivoltaics space is often limited by available infrastructure [26,28,55,56,57]. This limitation manifests as a reduced ability to confidently define the microclimate parameters (i.e., DLI and temperature) and to detect small differences in treatments’ effects on yield parameters. Research in this space will benefit from larger-scale experiments with more experimental units across varying sites.
This design mitigated the potentially detrimental warming effect typical of HTs in subtropical environments, where all HT conditions registered temperatures lower than the 12 °C increase often experienced in unventilated conditions. However, in these experiments, temperature monitoring was limited to four temperature sensors at a time (i.e., two OPV HTs, one non-OPV HT, and one uncovered HT), thus precluding statistical testing. Therefore, the results presented here are only descriptive estimates of the effect on temperature. During the 2024 tomato growing season, ambient temperatures were highest in the non-OPV HTs, with some days’ mean maximum temperature reaching over 40 °C, and the season average maximum temperature reaching 35.1 °C. The OPV HTs demonstrated the cooling effect of the shade cast by OPV panels, with an average maximum temperature of 33.5 °C, representing a reduction of approximately 1.6 °C compared to the non-OPV HT. The average maximum temperature of the uncovered HT recorded was 32.7, which was lower than both the non-OPV and OPV HTs, a difference of approximately 2.4 °C and 0.8 °C, respectively. Nighttime temperatures were very similar across all HT treatments, which supports the conclusion that, during the day, the HTs trapped solar irradiance, in turn elevating internal temperatures, and the OPV panels partially mitigated this effect by absorbing a portion of the solar irradiance as electrical energy instead of heat. However, research using more extensive temperature monitoring reported a similar, albeit smaller, reduction in the ambient temperature effect in the OPV-shaded section of a greenhouse without ventilated sides and ends. The cooling effect of OPV shade during the lettuce experiment was negligible, due to lower ambient temperatures in the later growing periods.
4.2. Daily Light Integrals Between Conditions Span the Full Range of Proposed Optimal Light Levels
In 2024 and 205, when PAR was monitored, the unadjusted mean DLI measurements in the OPV and PV HTs was substantially lower than the non-solar HTs; however, this measure does not capture the complexities of the discrete and incomplete shading patterns cast by the center-hung solar panels. Therefore, we relied on the area-weighted average DLI and the geometric mean DLI to approximately quantify the shading levels across the HT footprints by the OPV and PV panels. We considered the geometric mean DLI for each treatment to be near the lower bound of average DLI across the HTs. In the 2024 tomato experiment, the geometric mean was much lower than the non-OPV; however, at 26.6, this result approaches the recommended DLI for tomato production [18]. This inference is supported by the results of the yield analyses, wherein we detected limited effects of the OPV panels on tomato marketable and total yield and none in lettuce. This result suggests that our agrivoltaic HT design intercepted only excess PAR and, therefore, the tomato and lettuce plants were likely not light-limited. Future work testing additional levels of OPV shading is recommended to determine the optimal percent of OPV panel coverage. Because the high tunnel, rather than the individual plant, was treated as the experimental unit in this analysis (Section 2.3), the similarity of area-weighted DLI between solar and non-solar tunnels reflects a treatment-level effect and is not an artefact of within-tunnel pseudoreplication. Moreover, the modelled plant-facing spectrum (Section 3.9) indicates that the panels acted as a near-neutral-density filter, lowering the red-to-far-red ratio by only ~6% and leaving it well within the open-canopy regime, so neither the quantity nor the spectral quality of the transmitted light approached the threshold expected to elicit a strong shade-avoidance response. Finally, we were unable to measure PAR in 2023 due to equipment limitations, though we do not expect substantial differences in average DLI would have been detected.
Plants respond to the amount of available light in multiple ways. During vegetative growth and development, plants undergo significant morphological changes to adapt to perceived light amount, quality, and direction [48,58,59]. The classical shade avoidance response (SAR) involves a suite of morphological changes that serve to maximize light interception, such as alterations to leaf surface area, internode length, and chlorophyll concentration [49,59,60]. Importantly, SAR is energetically costly; thus, obtaining optimum shade levels in a controlled environment is critical to maximize yields. To glean hints of the impact of SAR under OPV panels, we measured above-ground tomato biomass accumulation in 2024 and failed to detect a significant differences on a per-plant basis and only identified a single cultivar (‘Mountain Fresh’) that exhibited a GxE interaction. Again, this result suggests that our agrivoltaic HT design intercepted only excess light and did not meaningfully alter the R–FR ratio; however, we did not measure additional components of the SAR response (e.g., leaf-area index, chlorophyl concentration, photosynthetic gas exchange, etc.); therefore, future work should focus on obtaining these measurements for a better understanding of SAR in OPV shading conditions.
4.3. OPV and Conventional PV Solar Panels Generally Do Not Reduce Tomato or Lettuce Yield on a Per-Plant Basis
Tomato is one of the most important crops grown worldwide commercially and recreationally. It is also an important agronomic model that has been used extensively to study the effect of light on yield in various field and controlled environment studies [48,61,62,63,64]. Given that plants in our OPV HTs experience an average reduction of 8–23% DLI compared to the non-OPV HTs, with a maximum possible reduction of 51% DLI (i.e., a plant located directly underneath an OPV panel), the lack of statistical difference in marketable and total fruit weight in 2024 is in line with other tomato shade research. However, these experiments were limited by the number of available HTs (two per treatment), and therefore, future research would benefit from additional replicates of the OPV and PV treatments. The improved marketable fraction in the OPV and non-OPV HTs is in line with HT research demonstrating the improved marketability of tomatoes grown in HTs [3,8,54]. Furthermore, these results support similar findings in other tomato agrivoltaic research that found negligible or no impact of OPV shading or shading that approximates OPV panels. Waller et al. tested OPV shading covering between 38.8 and 48.5% of their greenhouse and observed a significant delay in fruit ripening that contributed to a slight reduction in yield early in the season; however the effect dissipated by mid-season and yields equilibrated [28]. Ezzaeri et al. observed equivalent total yields between OPV-shading covering approximately 10% of growing area footprint and unshaded tomatoes in a canarian greenhouse, which is similar to the style of HT used here [55]. A recent study by Teitel et al. did not observe statistical difference in yields between control and OPV shading covering 27% of the greenhouse footprint [27]. Combined with the results presented here, current research suggests that OPV shading between 10% and 48.5% of the growing area footprint is not likely to significantly impact tomato yields and may in fact protect yields (i.e., enhancing profits by improving marketable fraction) through reduction in temperature and excess light.
Our conventional PV experiment demonstrated no reduction in yield parameters as an effect of shade covering approximately 12.5% of the HT footprint. This cost-effective configuration suggests that excess light can be captured by cheap and readily available “off-the-shelf” solar panels without impacting tomato yield. Although we did not test lettuce under the conventional PV treatment, we suspect that lettuce would also not be negatively impacted, as the light requirement for lettuce is less than that of tomato. These results are encouraging as they suggest that growers can utilize agrivoltaic designs to harvest excess solar radiation, offsetting production costs and reducing overhead. Still, more agrivoltaic research at a regional level should focus on (1) finer ranges of shading percentages, (2) the importance of shading pattern as it relates to house orientation and sun path, and (3) more variation in climates, to elucidate the limits of conventional and OPV shading in different growing regions. Again, future research would benefit from more treatment replicates of the OPV and PV shade.
4.4. Lettuces Are Ideal Candidates for Agrivoltaic Applications
Lettuce is a low-light crop that is sensitive to high temperatures, which often precludes its cultivation in warmer climates during the summer season [2]. Fully enclosed unshaded HTs can raise the internal air temperature in the summer season by as much as 12 °C [2]; however, in the typical cooler lettuce growing season, this effect is likely dampened or completely abated. Indeed, we did not detect a significant impact on lettuce yields in any treatment across either of the growing seasons, which suggests that lettuce yield was neither limited by available light, nor was it impacted by excess temperatures. These results are comparable with research that found no significant differences in the yields of lettuce, basil, and arugula when grown in HTs with additional shade in Northeast Georgia [51] or in red-leaf lettuce grown under semi-transparent organic solar cells [57] and suggest that the OPV panels can be used as intermittent shading and power generation in Northeast Georgia without reducing lettuce yields. It is possible that lettuce plants compensated for the reduced available light by increasing radiation interception efficiency as demonstrated in Marrou et al. 2013 [65]; however, this effect was detected at much higher PV shade levels (50% and 70%) than in our experiment, and thus, its effect was likely diminished in our work. Future work employing increased OPV coverage in HTs could test this hypothesis.
4.5. High Tunnels, Irrespective of Solar Panel Configuration, Provide Tomato Yield Protection via Increased Marketable Fraction
Marketable fraction is the percent of marketable fruits to unmarketable fruits and is critical for growers to optimize, especially growers on small organic farms. Time spent harvesting unmarketable fruits cuts into profitability, and thus much effort is expended to maximize marketability [20,54,66,67]. In 2023, tomato marketable fraction was lower than anticipated across all treatments (grand mean = 55%), due to aforementioned biotic and abiotic pressures, although it was comparable to results from similar research on tomatoes and artificial shading [20,68], and differences between the treatments were undetectable. However, in 2024, management practices and weather conditions were improved. Additionally, the uncovered plots were moved to uncovered HTs adjacent to the other four HTs, resulting in more comparable control conditions, and in turn marketable fraction improved greatly across 2024 (grand mean = 84%). Marketable fraction was statistically equivalent in both the OPV and non-OPV HTs and significantly greater than the uncovered control plots, suggesting that the HT structures provided yield protection for the tomatoes, while the OPV panels did not affect marketable fraction. Thus, the OPV panels likely do not negatively impact tomato marketability. In 2025, under conventional PV solar panel shade, the marketable fraction was equivalent between treatments across cultivars, again demonstrating that conventional PV shade, like OPV shade, does not negatively impact marketable fraction.
4.6. Genotype-by-Shade Interactions May Occur in Tomato, Though Primarily in Adverse Seasons
Generally, very little work has been done exploring the genetics of marketable yield under shade or in HTs [69,70]. If agrivoltaics is to be a viable cultivation paradigm, this component of the technology will need to be addressed. In addition, OPV solar film is a unique form of shading that may alter the incoming solar radiation spectrum differently from traditional shade cloth [30]. As such, it may be possible to develop tomato lines specifically attuned to growing under OPV shade.
We detected limited potential GxE among the tomato cultivars we tested and no GxE in any of the lettuce cultivars we tested. These results are in line with other attempts to detect a genetic background that benefits from HT, shading, or a combination of the two [69]. The finding of three tomato cultivars hinting at inverted GxE across the 2023 and 2024 OPV experiments is encouraging as it suggests that there may be underlying genetic differences that could be leveraged in a breeding program to optimize tomato for growing in OPV-shaded HTs. ‘BHN 871’ and ‘Jolene’ are similar tomato types (i.e., “slicers”) with a similar direction of effect, demonstrating higher marketable yield under OPV shade. ‘Sunrise’ is a different tomato type (i.e., “paste”) from ‘BHN 871’ and ‘Jolene’ and exhibits a marketable yield penalty under the OPV shade. In our 2025 follow up experiment, where we tested the effect of completely opaque conventional PV solar panel shade, GxE was detected between Jolene’ and ‘BHN 589,’ which again suggests that the genetic background of ‘Jolene’ may harbor alleles that could shed light on the response of tomato to solar panel shading, be it OPV or conventional PV. Again, the research presented here was limited to only 2 HTs per treatment, with room for approximately 60 plants per HT; future work would greatly benefit from additional, larger HTs to increase the power to detect stronger evidence of GxE among tomato cultivars.
4.7. Silicon PV Substitution Results in Positive Value Proposition
As installed, the OPV array per HT was designed to produce ~300 W at solar zenith when shade was factored in. Per area, this output is <20% of that produced by conventional silicon panels for a similar surface area. The OPV output also declined ~10% over the course of 1 year deployment, although this is an improvement over degradation seen in exterior applications [34]. Power generated was consumed by two exhaust fans (134.4 W total) scheduled to run during peak heat. In average conditions, the array was sufficient to drive power needs and battery charging for intermittent cloud cover. Supplemental conventional panels were also installed outside to assure running times were consistent across conditions (see Methods). OPVs are still in the prototyping phase of technology development. Given their cost and poor efficiency, it is currently impossible to justify OPV installation in a commercial setting. As described in the introduction, as OPVs are adopted more frequently in the building industry for glass treatment; these improvements could make the OPV value proposition plausible. In the meantime, one option is to substitute OPVs with conventional silicon–PVs at a comparable shade level.
To enable the analysis below, we developed a web application: https://gbru-ars.shinyapps.io/AgrivoltaicValueCalculator/ (accessed on 26 February 2025). Though we have used results from our experiment as default parameters, all variables can be manipulated by the user to evaluate the cost recovery and profitability when varying these estimates. Indeed, we have designed the tool in such a way as to allow growers to be able enter empirical values, assuming that they can run a small alteration test prior to applying it to their entire operation.
Effective rates of return are a way to conceptualize the value of energy productivity improvements like solar power. The approach assumes minimal decline in the “principal” investment relative to inflation; for example, solar panels last for >30 years at >90% production capacity and so might even beat inflation in some cases when resold or sold as part of a property. Once established, the effective rate of return can then be compared with other monetary investments.
The HTs in this study cost ~USD 1500 without active ventilation. Without this addition, internal temperature can reach detrimental levels and substantially reduce yields. Thus, for this study, we added two fans to each house, at an additional cost of USD 300. In this configuration, the HTs had a nearly 100% survival rate compared with ~15% loss across years for uncovered plots; at our plot scales, this resulted in a sum loss of 45 kg in tomato marketable yield. In addition, HTs enable a third growing season. Thus, ignoring additional power installation costs, the ventilated HT has an effective rate of return approaching 20%. Unfortunately, the required external power installation and use could run to an additional USD 1000 or more per HT, reducing return to 14.2%. Instead, this power can be supplied from internal PVs at a cost of ~USD 800 per HT. Conventional static PVs at this latitude are expected to produce on average 0.62 kw-hours day−1 m−2 over the year (https://pvwatts.nlr.gov/pvwatts.php, accessed on 26 February 2025). Thus, in our 1 kW conventional PV configuration (Figure 6), each HT produces surfeit energy that can add additional value, returning the rate to 18.9%, even after factoring in the small impact of shade on yield (present in 2023, absent in 2024) and reductions from plastic opacity. These estimates are derived using the default parameters in the Agrivoltaic Value Calculator web application described above.
External installation of PV panels adjacent to the HT would avoid losing light to plastic covering as well as losing any crop yield due to shade. We have emphasized internal overhead installation for the following reasons:
- Shade can protect marketable fraction, an important component of net profitability.
- The HT structure is instantaneously available as a support for panels with essentially no cost or installation effort.
- The HT covering offers equipment protection from wind and rain and reduces the risk of theft.
- The space around HTs needs regular mowing/upkeep in subtropical regions. Cluttering this space with mounting supports and photovoltaic equipment is problematic. Moreover, shared-gutter HT designs eliminate this border space altogether, making internal installation inevitable.
- If HTs are mobile, internal installation dramatically simplifies relocation.
- Though not explored in this study, artificial illumination can increase yield and do so at optimal photosynthetic efficiency (see the Introduction section). Internal panels provide an obvious substrate to anchor and wire such lights.
Overhead panels mounted above the HT (externally) would render some of these benefits while avoiding the small penalty in power production lost to plastic covering. Still, it remains very challenging to integrate roof mounting with plastic application and maintenance. This complication as well as the ease of internal installation and protection afforded to equipment outweigh these small power gains.
Finally, we have estimated electricity value based on commodity rates. Whether that rate translates to real value depends on the capacity to use that electricity as well as the presence/absence of alternatives. Beyond the fans used in this experiment, obvious outlets are irrigation pumps and night heating/light. These systems, particularly in the summer, would likely still leave much power unused. Electric farm equipment is being continuously developed, ranging from hand-held tools to large-scale robotics and tractors. With battery switching, these tools could be used continuously through the day, saving utility power—if even available—and the time required to return to centralized power supplies.
5. Conclusions
HT vegetable production is a well-established practice used to extend the growing season and increase the marketable fraction of a crop. However, in the southeast United States and similar subtropical climates, internal ambient temperatures can exceed the optimal range of many crops. Therefore, farms typically need to manage temperatures through air exhaustion and shading. In our study, we demonstrated that shade provided by semi-transparent OPV film, combined with solar power generation used to power exhaust fans, reduced ambient temperatures near to outdoor levels. We further demonstrated that tomato marketability (ie, marketable fraction) was either unaffected (in 2023) or improved (in 2024) by the HT environment, while marketable and total yields on a per-plant basis were not impacted across years. For lettuce production, OPV panels did not impact yield, while the HT structures improved yield.
Marketability is an often underappreciated metric for cultivar value in that a large total yield with a small marketable yield has a hidden labor cost relative to a comparable marketable yield that approaches total yield. It is encouraging that OPV shade maintains the marketability improvement imparted by the HTs, on a per-plant basis, in some years. Anecdotally, humidity and surface moisture under increased shade may disproportionally increase insect and pathogen pressure in subtropical climates, as demonstrated by the lower (but not significant) marketable fraction in tomatoes in 2023. Though we did not characterize unmarketable causes, anecdotal evidence supports all of these possibilities.
Our results and derived estimates indicate that silicon–PVs could substitute for OPVs, in the near term, to create a positive value proposition. Our HT design featured discrete sections of shading as opposed to uniform shade coverage. Silicon–PV substitution would further enhance the contrast between light and shade, though, at ~30% transmittance, OPVs were already quite opaque. Still, direct substitution needs more testing. Increases in plastic transmittance (or stronger, thinner films) would make the value proposition even more positive, but we find this effect fairly small. More importantly, the improved genetics of yield under shade could substantially improve the value proposition. Three tomato cultivars characterized in this study showed genotype-specific behavior and will be useful to interrogate those genetics further.
Based on this work and work reviewed herein, there is currently no technological limit to making vegetable farms nearly self-sustaining from an energy perspective. This conclusion is especially relevant in developing, or otherwise “off-grid” subtropical regions in which electrical power is unreliable or unavailable. Growers can use the Agrivoltaic Value Calculator web application detailed here to estimate the return on investment of an agrivoltaic design like the one presented here.
Supplementary Materials
The following supporting information can be downloaded at: https://www.mdpi.com/article/10.3390/agronomy16131299/s1, Table S1: Mean DLI during 2024 tomato season; Table S2. Mean DLI during 2024 lettuce season; Table S3. Total productivity for 2023/2024 tomato seasons; Table S4. Means contrasts for 2023/2024 tomato seasons; Table S5. Means contrasts of tomato cultivars for 2023/2024 tomato seasons; Table S6. Results linear mixed modeling of tomato cultivars responses for 2023/2024 tomato seasons; Table S7. Means contrasts of lettuce cultivars for 2023/2024 lettuce seasons; Table S8. Results linear mixed modeling of lettuce cultivars responses for 2023/2024 lettuce seasons; Table S9. Mean DLI during 2025 tomato season; Table S10. Means contrasts of tomato cultivars for 2025 tomato season; Table S11. Results linear mixed modeling of tomato cultivars responses for 2025 tomato season; Table S12: Temperature summary for 2024 tomato season; Table S13: Temperature summary for 2024 lettuce season.
Author Contributions
Conceptualization, J.V.; methodology, R.F., K.C.-D. and J.V.; high tunnel design and implementation, B.A. and J.V.; plant cultivation and harvest, R.F. and J.V.; analysis, R.F.; energy modeling and light spectra analysis, E.R.; writing—original draft preparation, R.F. and J.V.; writing—review and editing, E.R., K.C.-D. and J.V.; funding acquisition, J.V. All authors have read and agreed to the published version of the manuscript.
Funding
This research was funded by the USDA ARSx program for the project entitled “The Solar-Ag Synergy: Semi-transparent photovoltaics for sheltered fruit and vegetable production”.
Data Availability Statement
Raw and processed data, as well as statistical code, can be found at https://github.com/rick-field/agrivoltaics (accessed on 26 February 2025).
Acknowledgments
We thank Jackson Martin for assistance with plant care and harvesting. We thank Keo Korak for manuscript draft review. We thank Andrew McCalla for discussion of solar configuration. We thank Brendan O’Connor for advising on OPV options for our design. We thank Maddilyn Johnson for her critical support in administering this project.
Conflicts of Interest
The authors declare no conflicts of interest.
Abbreviations
The following abbreviations are used in this manuscript:
| DLI | Daily Light Integral |
| GxE | Genotype by Environment |
| OPV | Organic Photovoltaic |
| PAR | Photosynthetically Active Radiation |
| PPDF | Photosynthetic Photon Flux Density |
Appendix A
Figure A1.
Distribution of precipitation during 2023 and 2024 growing seasons. Average daily precipitation in 2023 was substantially higher in 2023, contributing to the field plots flooding (see Figure A2 below).
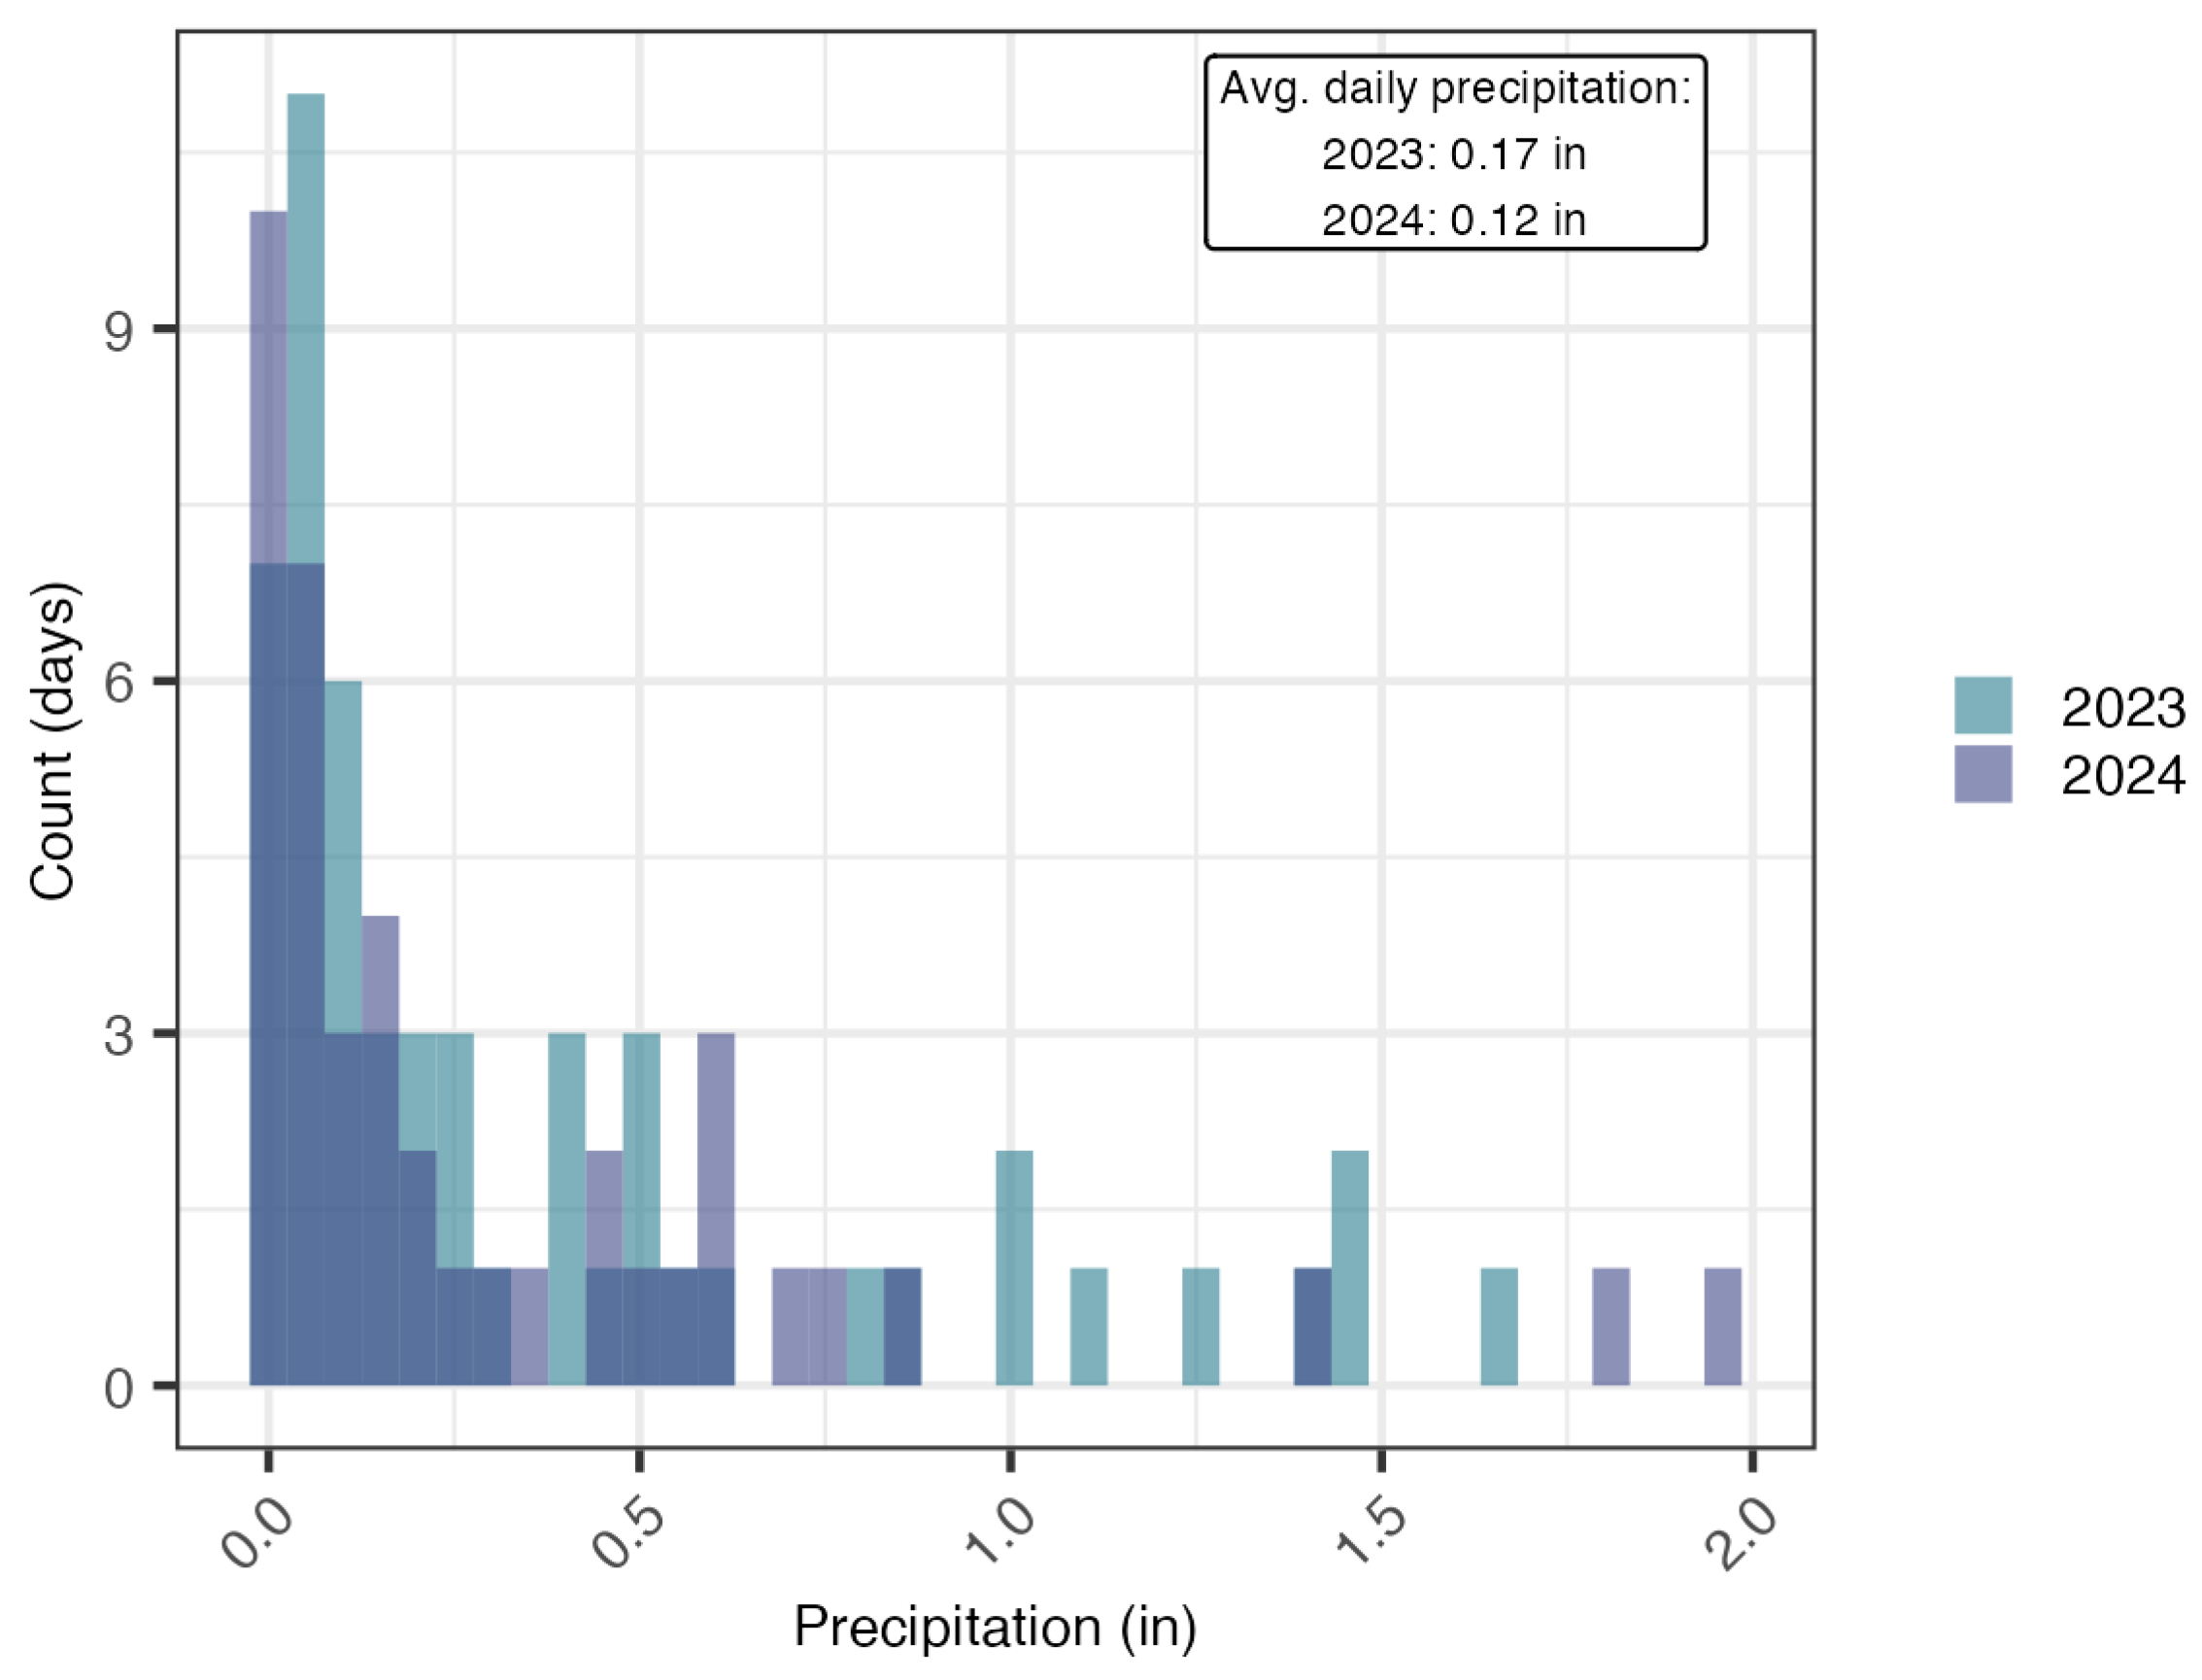
Figure A2.
Distribution of total productivity for 2023 and 2024 tomato experiements. In 2023, the field plots (top-left) experienced significant flooding and late blight, leading to a large proportion of plants with zero or low yield.
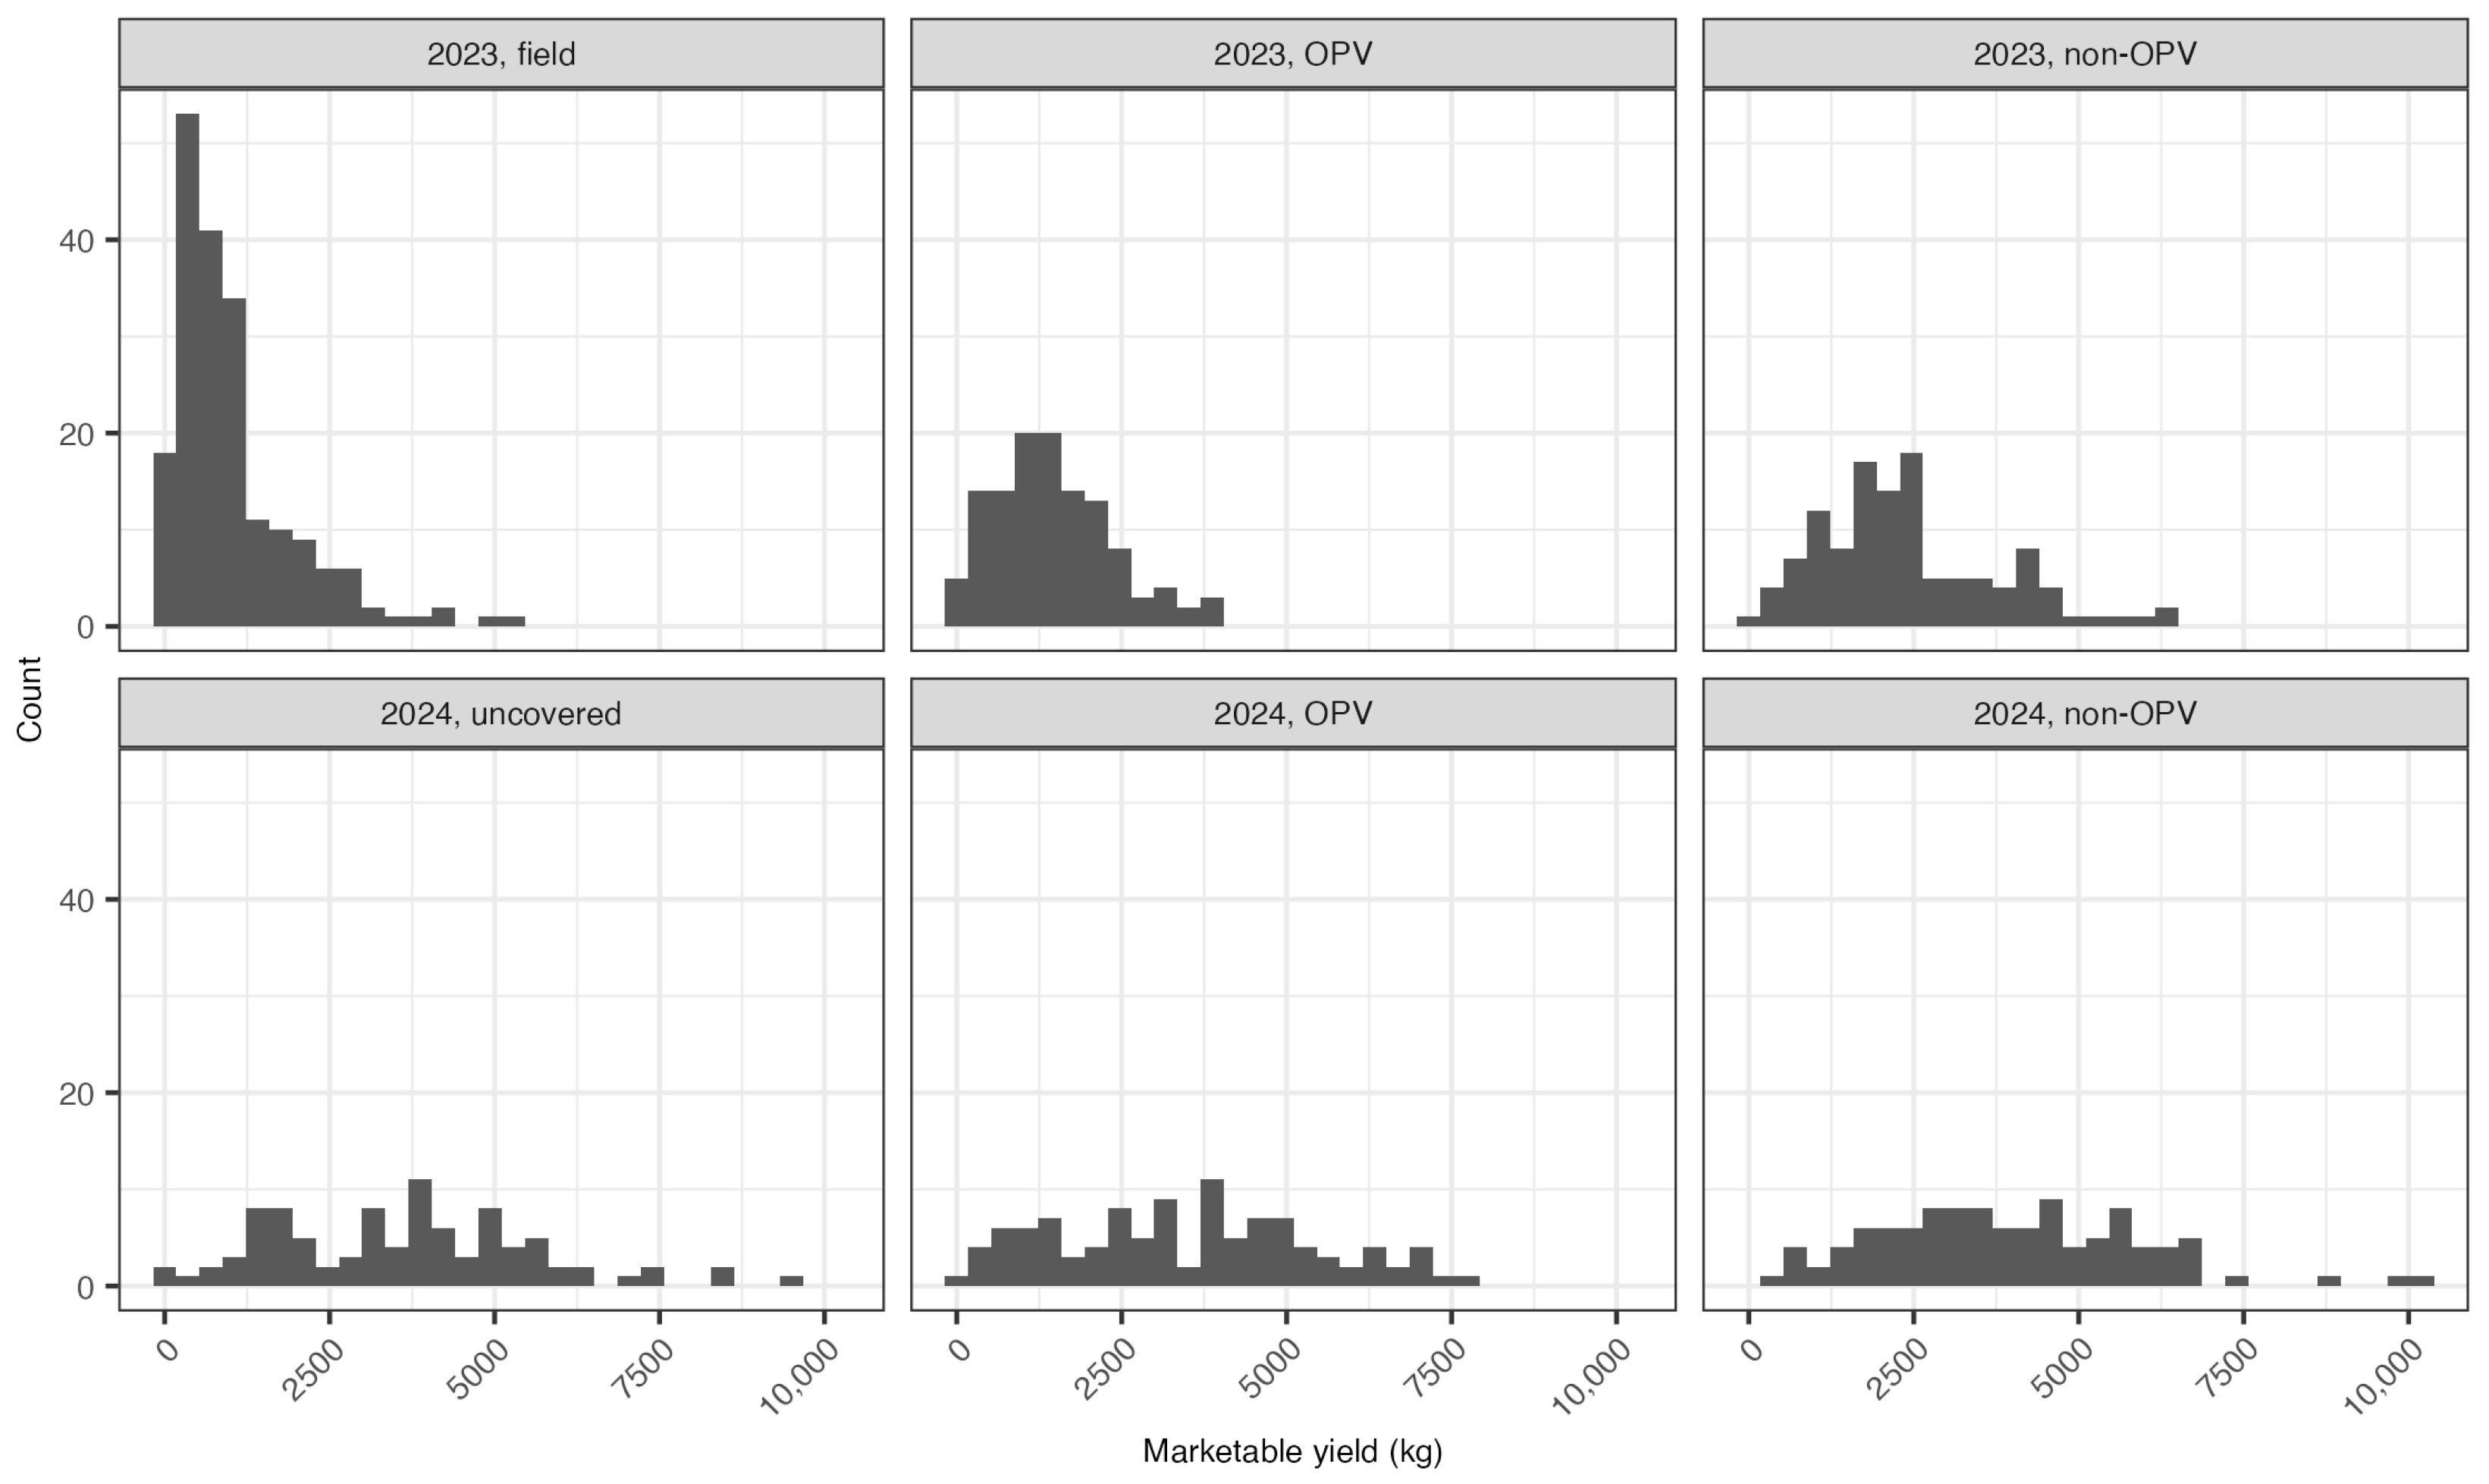
Figure A3.
ASTM G173-03 AM1.5G reference spectrum (grey), modelled UGA Durham Horticulture Farm clear-sky spectra at solar zenith 10° (solid blue; summer noon) and 45° (dashed blue; autumn noon), and the P3HT:PCBM external quantum efficiency (red, right axis) and HT plastic transmittance (green dotted, right axis) used to compute the spectral mismatch factor. Yellow band marks the photosynthetically active radiation (PAR) range, 400–700 nm.
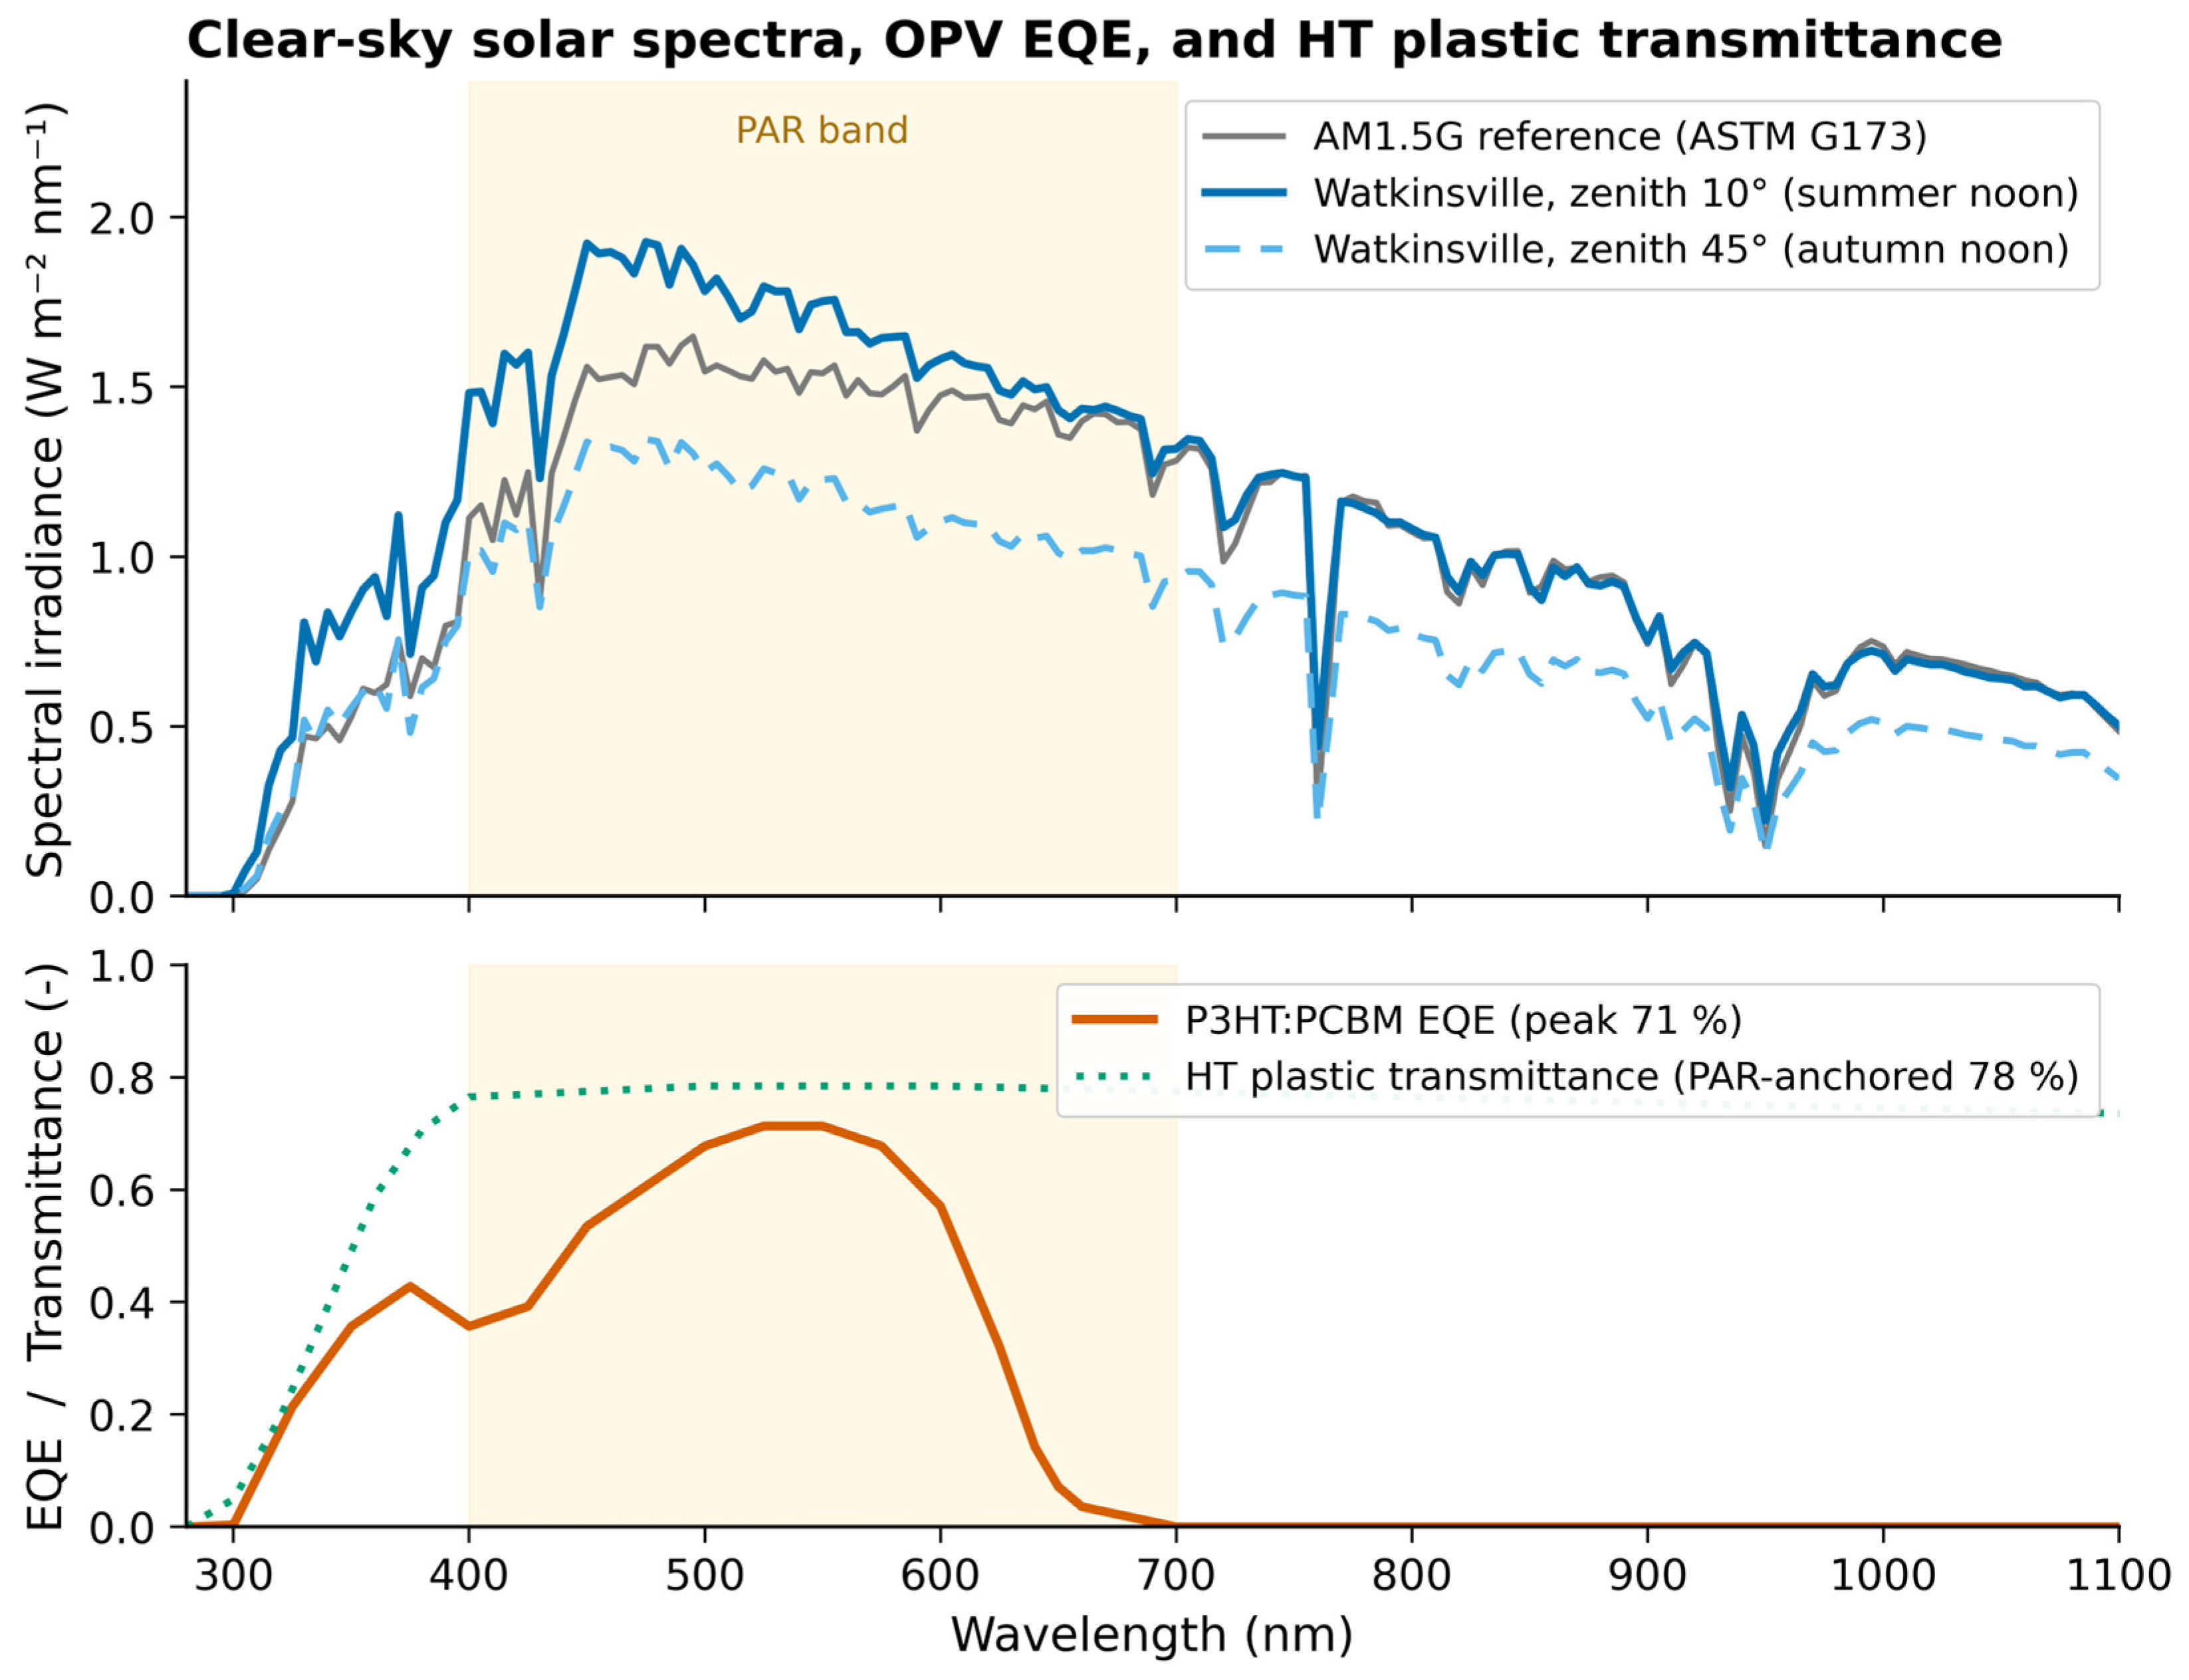
Figure A4.
P3HT:PCBM spectral mismatch (SMM) factor relative to AM1.5G as a function of solar zenith angle, after passing through the HT plastic. SMM > 1 (blue shading): site spectrum richer in OPV-absorbing wavelengths than AM1.5G. SMM < 1 (red shading, θz > 75°): morning/evening spectrum shifted away from the OPV absorption window.
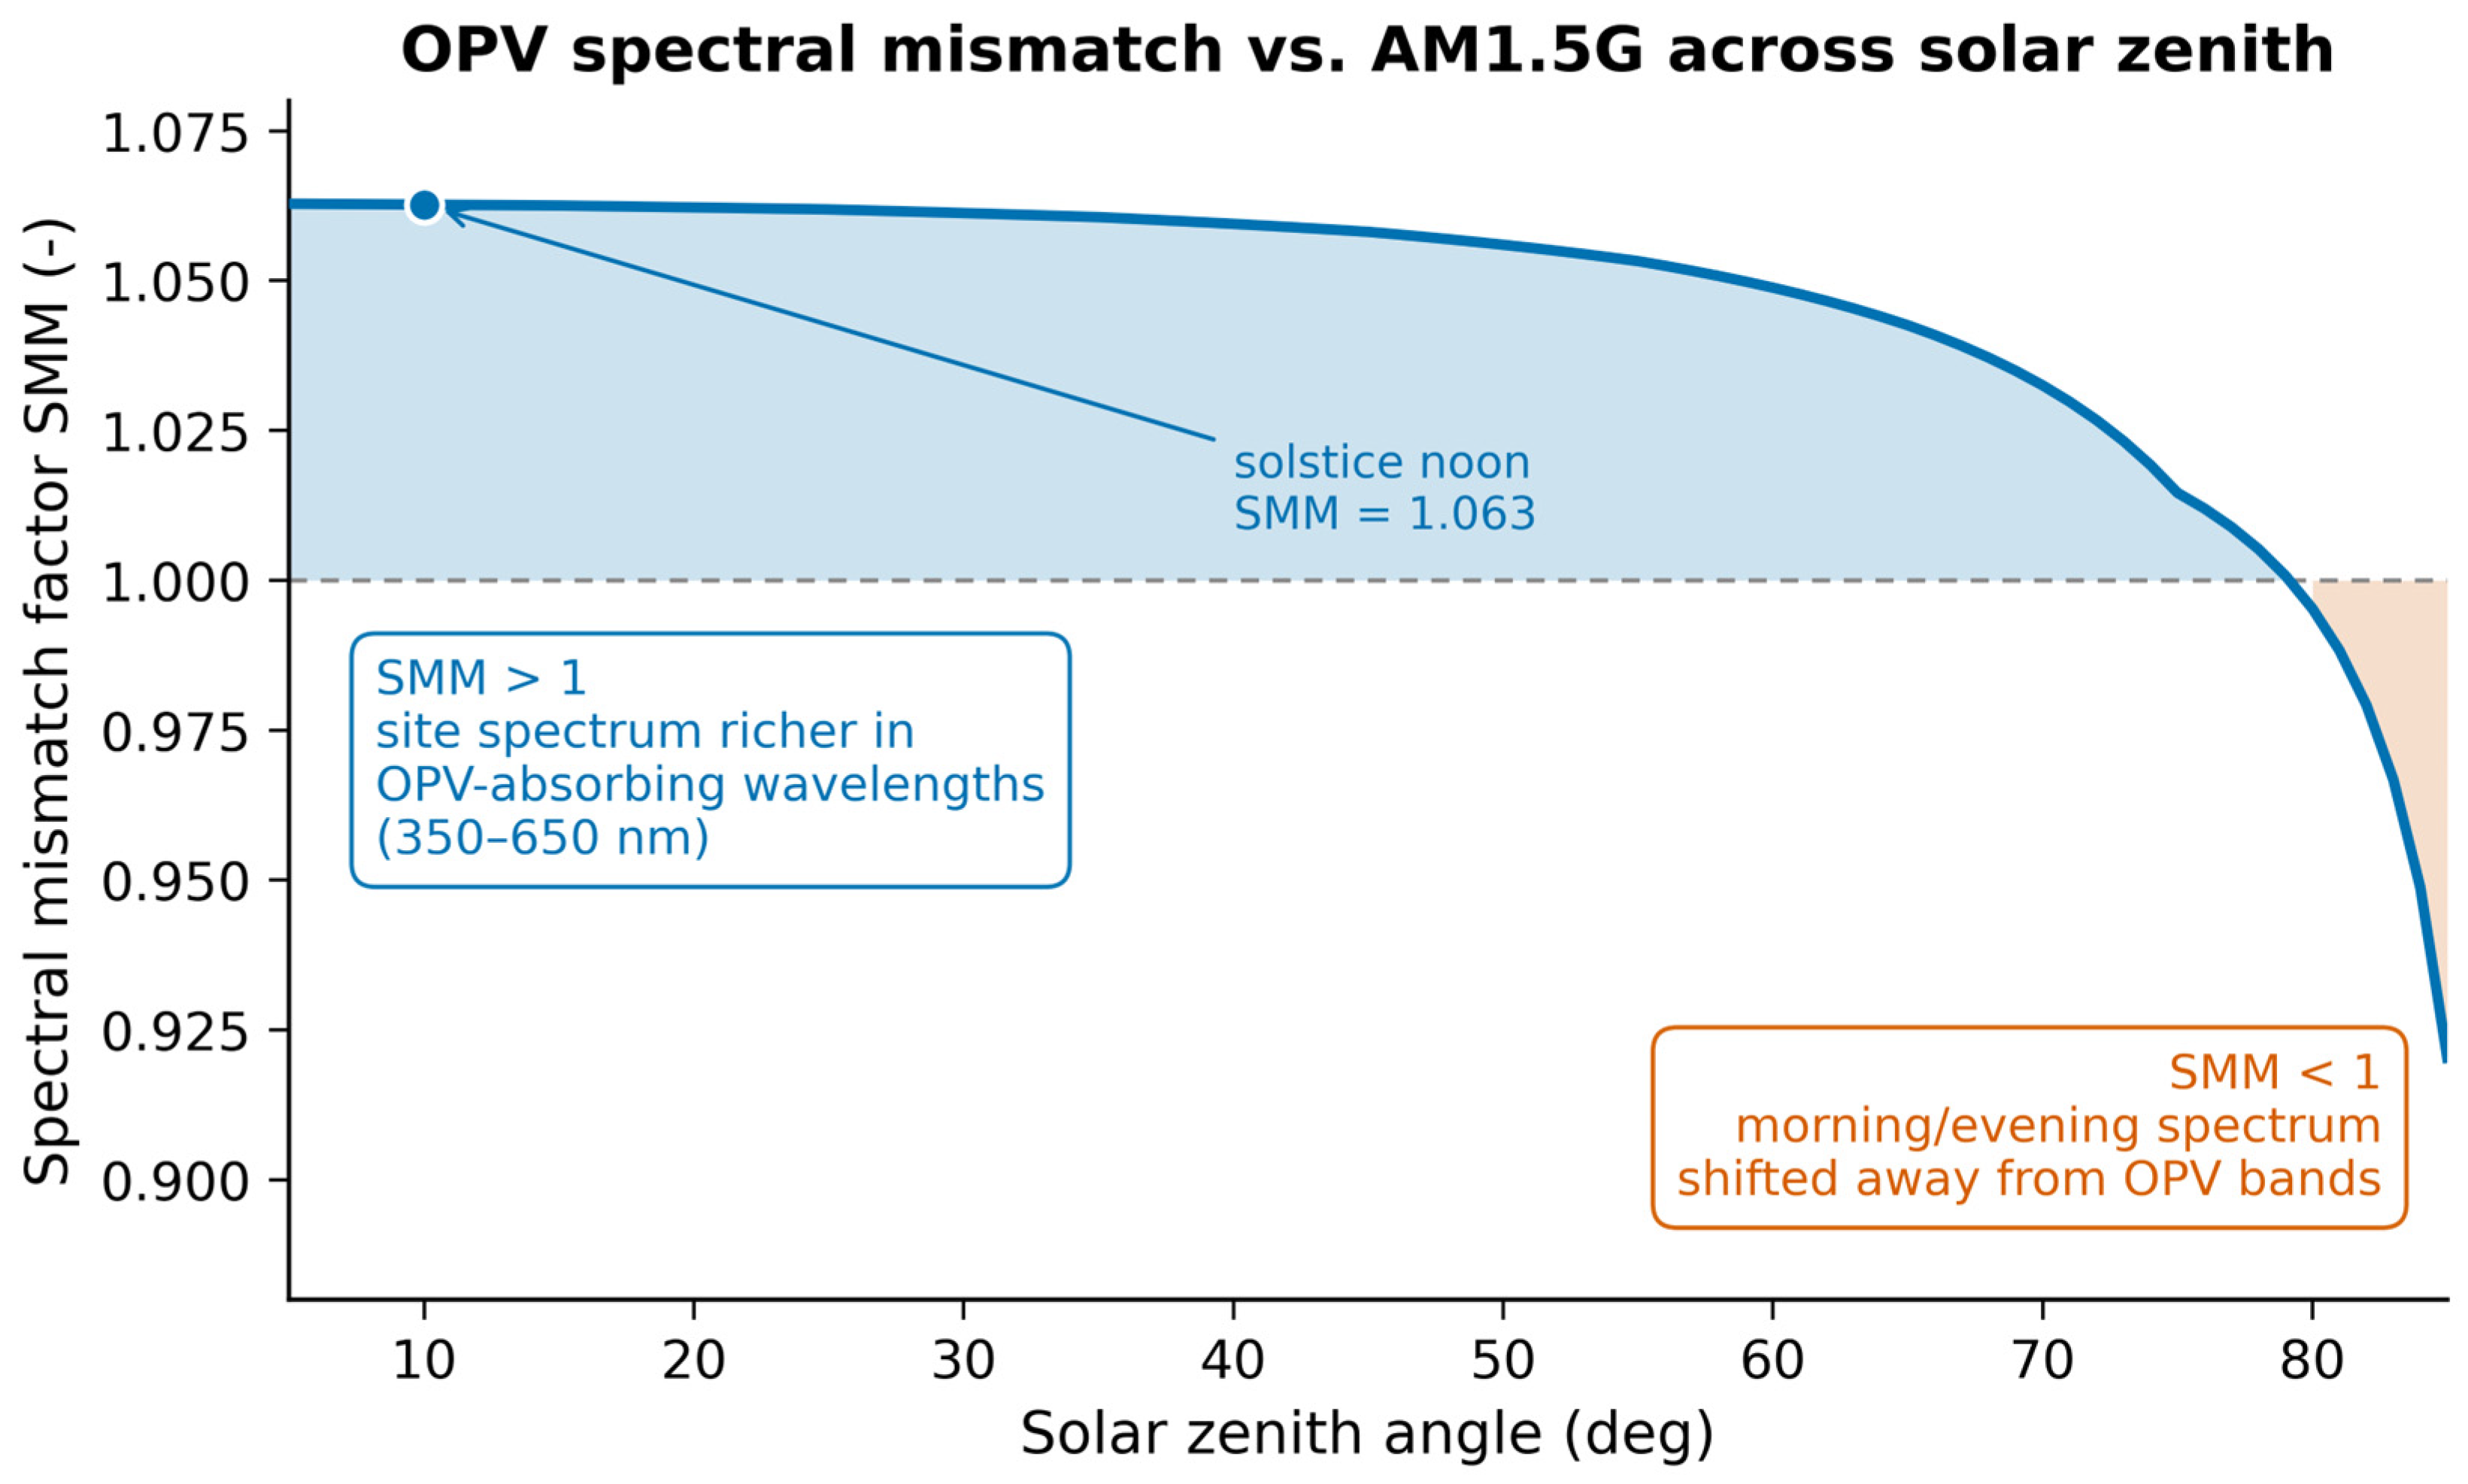
Figure A5.
Modelled noon clear-sky plant-facing light across the calendar year. (Top) PPFD and (Bottom) R–FR ratio reaching plants in the non-OPV HT (green) versus under the OPV (red). Tomato season is shaded orange and lettuce season green. The under-OPV R–FR stays within 6% of the non-OPV control across the year—a neutral-density-shade signature consistent with the absence of strong shade-avoidance phenotypes observed in the yield and biomass data.
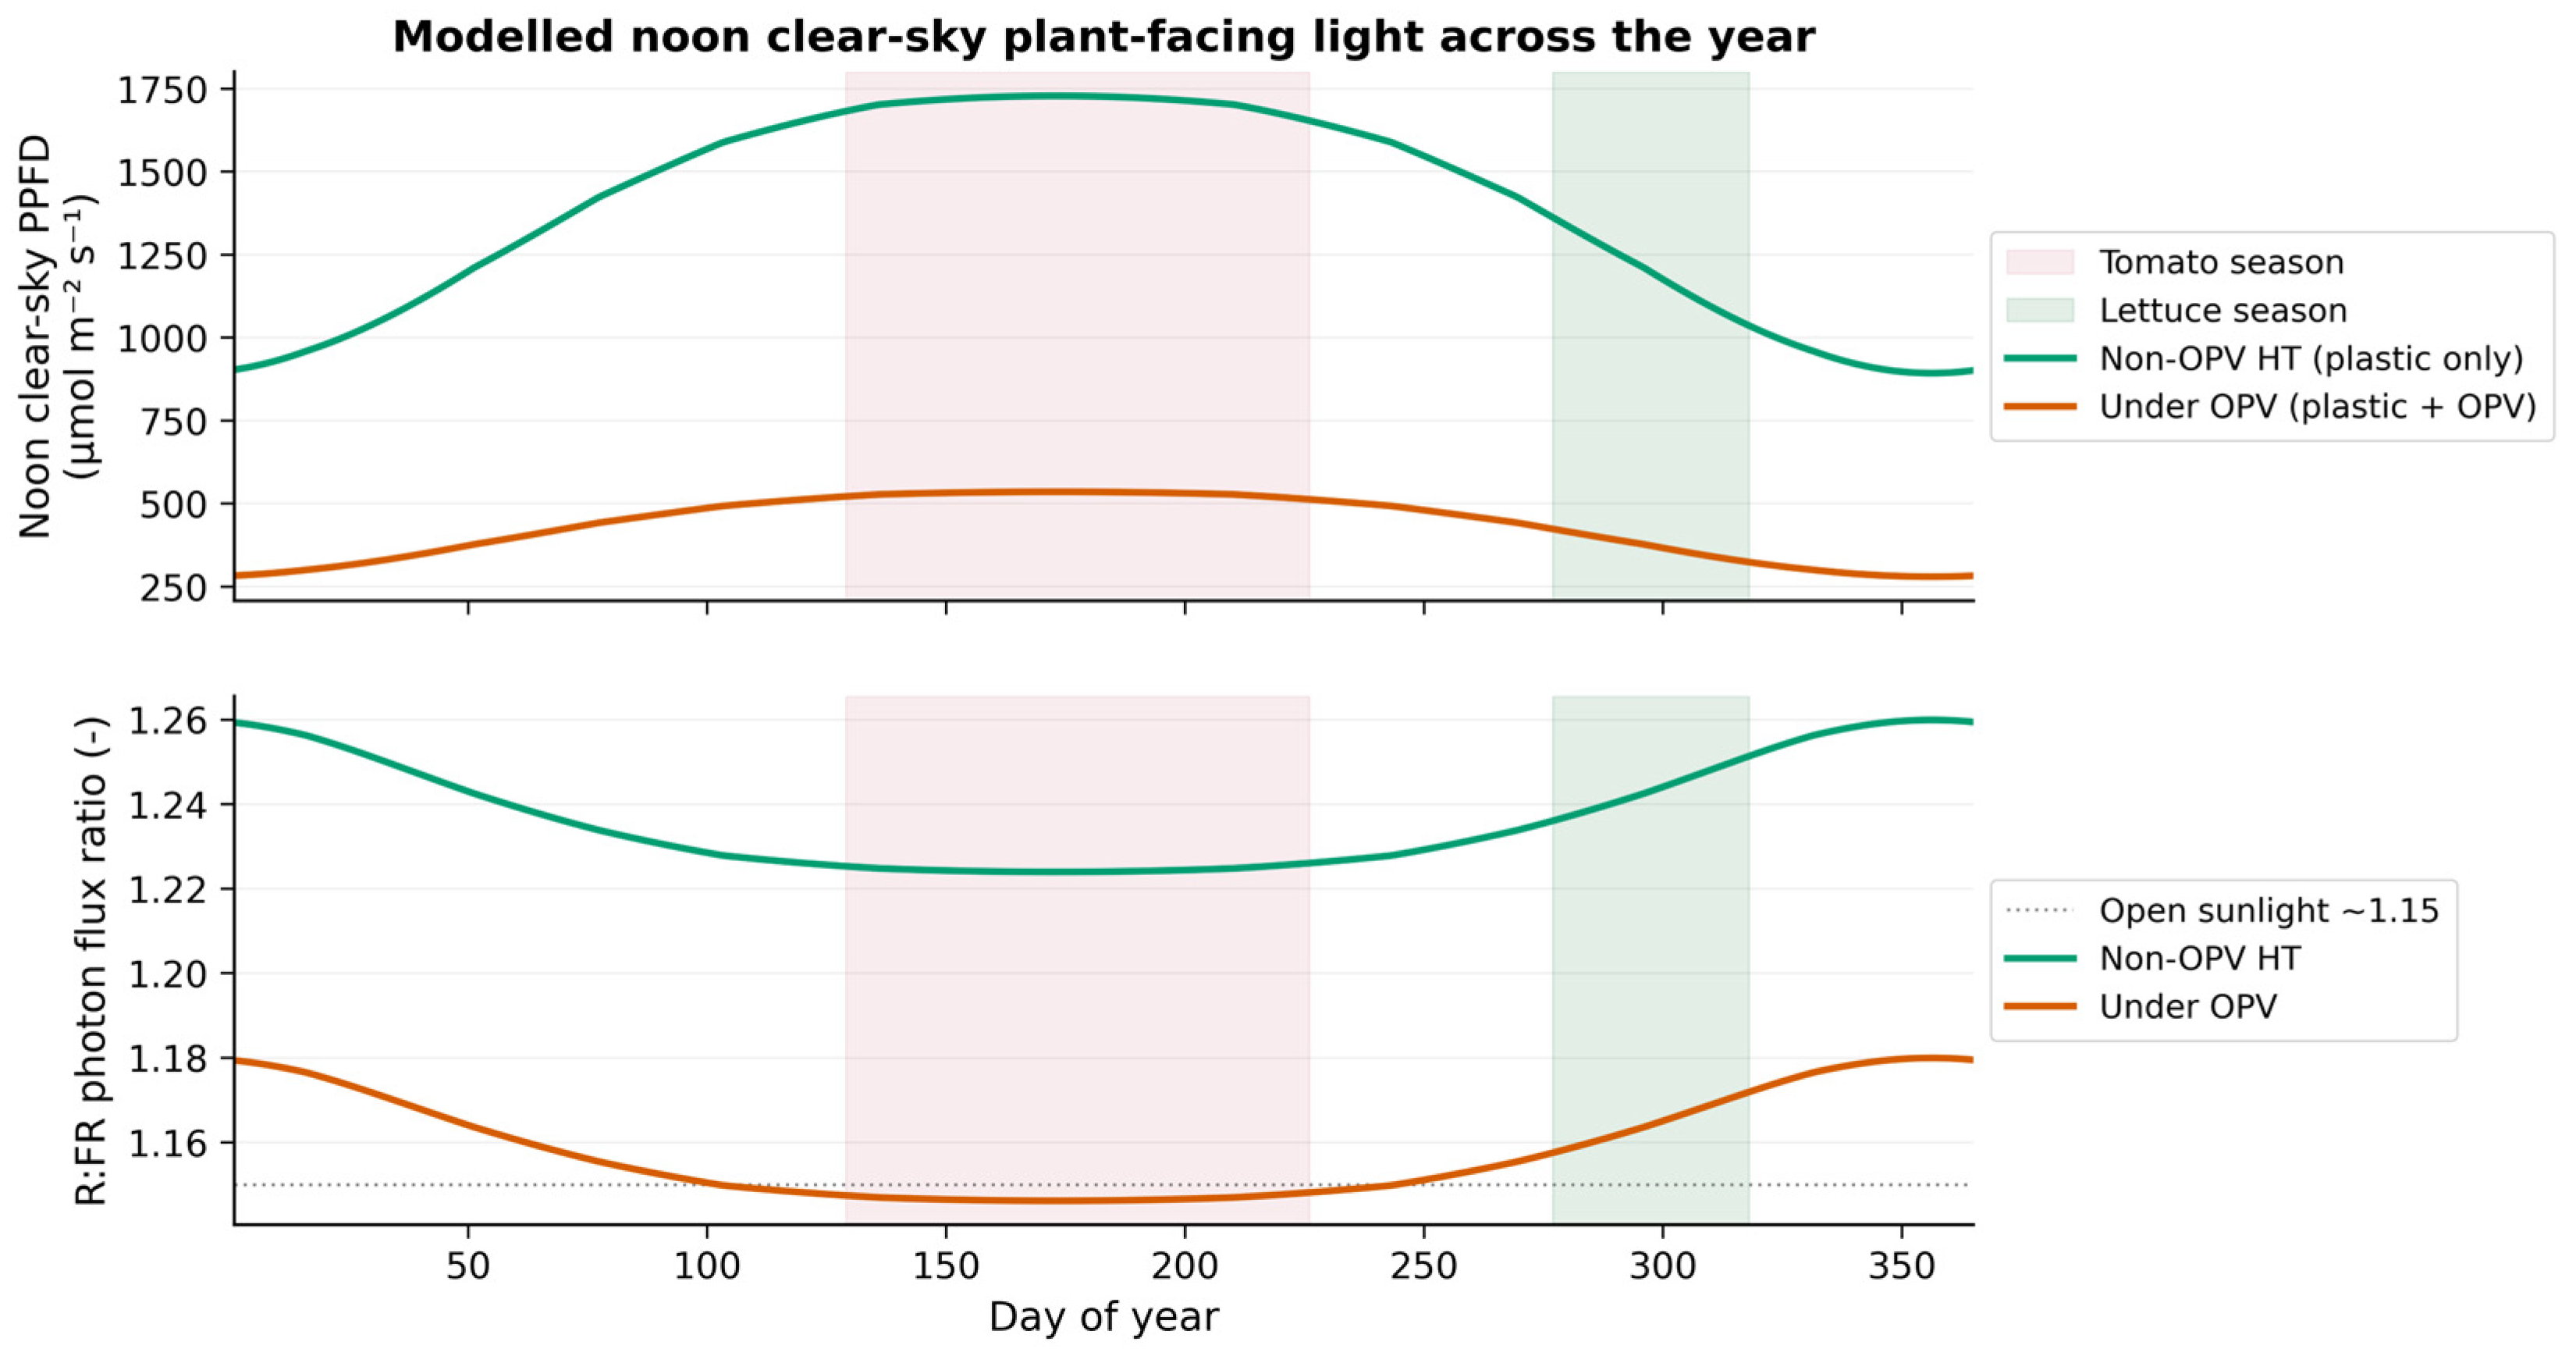
Figure A6.
Spectrum reaching the OPV active layer at clear-sky summer noon: incident on the high tunnel (blue), after passage through the HT plastic (green), and absorbed by the OPV through convolution with the EQE (red). The narrow P3HT:PCBM absorption window (~350–650 nm) captures the region where the Watkinsville solar spectrum is enriched relative to AM1.5G.
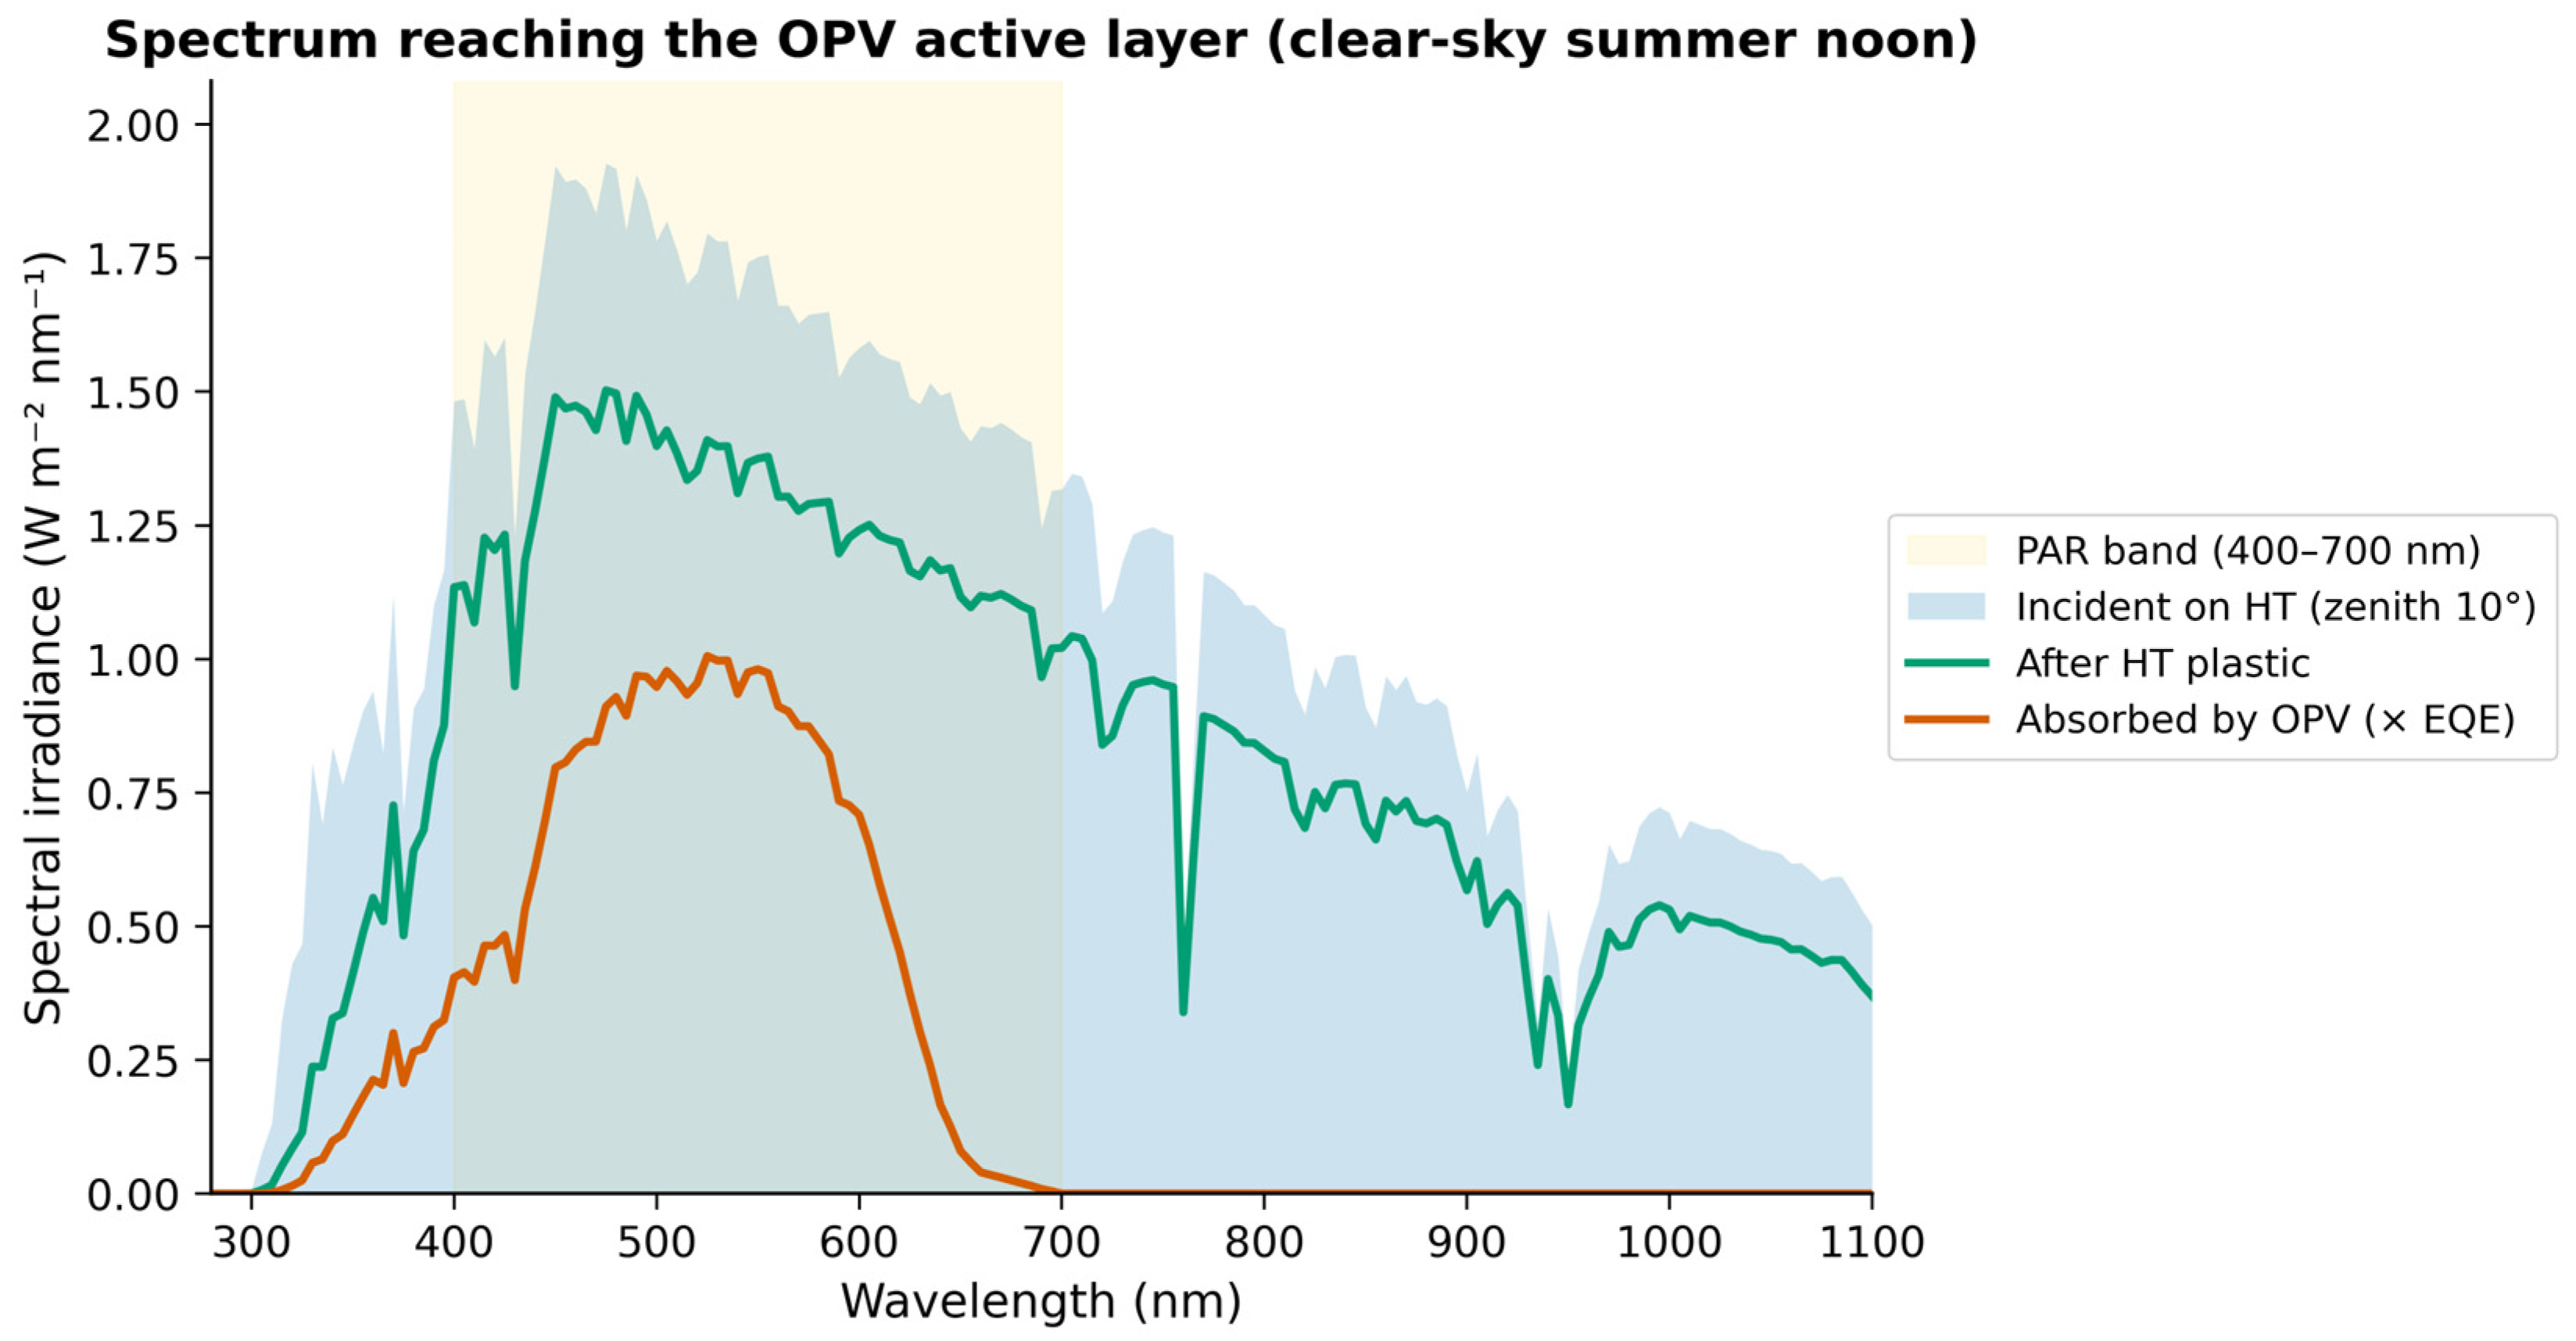
Figure A7.
Daily irradiance-weighted spectral mismatch (SMM) factor across five NSRDB years (2019–2023). Tomato and lettuce experimental windows are shaded. Inter-annual variation in daily SMM is typically less than 1% (dashed line), indicating the spectral correction is robust to climate-year variability.
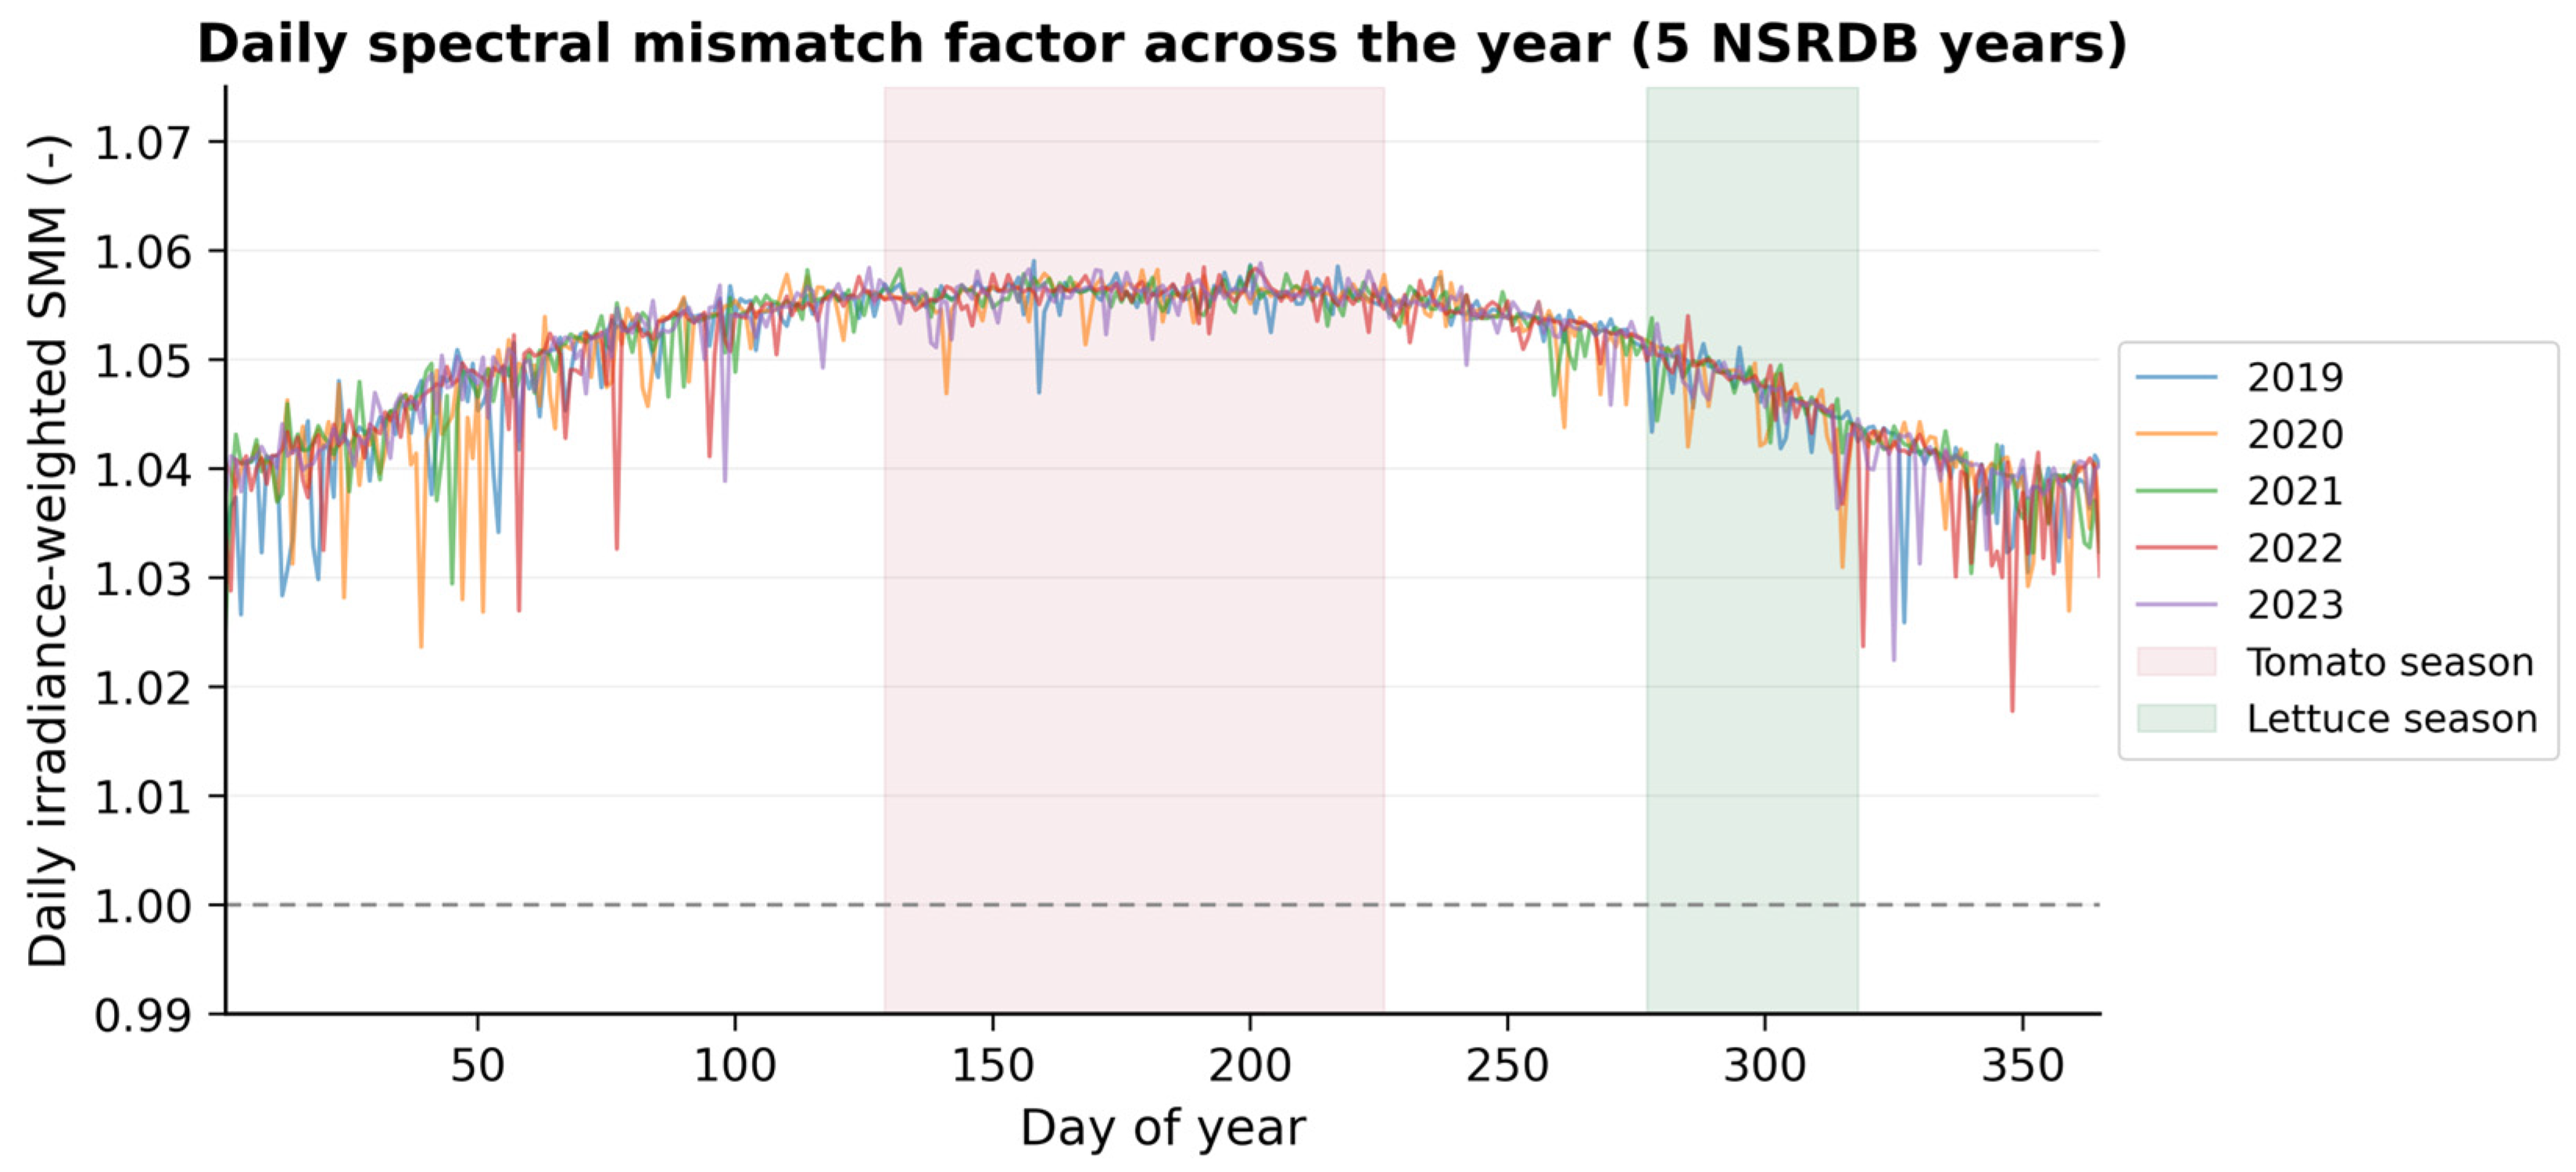
Table A1.
Tomato and lettuce cultivars and replicates for per-plant analyses in OPV experiments.
Table A2.
Tomato cultivars and replicates for per-plant analyses in PV experiments.
References
- Bruce, A.B.; Maynard, E.T.; Farmer, J.R. Farmers’ Perspectives on Challenges and Opportunities Associated with Using High Tunnels for Specialty Crops. HortTechnology 2019, 29, 290–299. [Google Scholar] [CrossRef]
- Janke, R.R.; Altamimi, M.E.; Khan, M. The Use of High Tunnels to Produce Fruit and Vegetable Crops in North America. Agric. Sci. 2017, 8, 692–715. [Google Scholar] [CrossRef]
- Frey, C.J.; Zhao, X.; Brecht, J.K.; Huff, D.M.; Black, Z.E. High Tunnel and Grafting Effects on Organic Tomato Plant Growth and Yield in the Subtropics. HortTechnology 2020, 30, 492–503. [Google Scholar] [CrossRef]
- Jayalath, T.C.; Boyhan, G.E.; Little, E.L.; Tate, R.I.; O’Connell, S. High Tunnel and Field System Comparison for Spring Organic Lettuce Production in Georgia. HortScience 2017, 52, 1518–1524. [Google Scholar] [CrossRef]
- Allardyce, C.S.; Fankhauser, C.; Zakeeruddin, S.M.; Grätzel, M.; Dyson, P.J. The Influence of Greenhouse-Integrated Photovoltaics on Crop Production. Sol. Energy 2017, 155, 517–522. [Google Scholar] [CrossRef]
- Kadir, S.; Carey, E.; Ennahli, S. Influence of High Tunnel and Field Conditions on Strawberry Growth and Development. HortScience 2006, 41, 329–335. [Google Scholar] [CrossRef]
- Waterer, D. Yields and Economics of High Tunnels for Production of Warm-Season Vegetable Crops. HortTechnology 2003, 13, 339–343. [Google Scholar] [CrossRef]
- Sydorovych, O.; Rivard, C.L.; O’Connell, S.; Harlow, C.D.; Peet, M.M.; Louws, F.J. Growing Organic Heirloom Tomatoes in the Field and High Tunnels in North Carolina: Comparative Economic Analysis. HortTechnology 2013, 23, 227–236. [Google Scholar] [CrossRef]
- Akrami, M.; Salah, A.H.; Javadi, A.A.; Fath, H.E.S.; Hassanein, M.J.; Farmani, R.; Dibaj, M.; Negm, A. Towards a Sustainable Greenhouse: Review of Trends and Emerging Practices in Analysing Greenhouse Ventilation Requirements to Sustain Maximum Agricultural Yield. Sustainability 2020, 12, 2794. [Google Scholar] [CrossRef]
- Aroca-Delgado, R.; Pérez-Alonso, J.; Callejón-Ferre, Á.J.; Velázquez-Martí, B. Compatibility between Crops and Solar Panels: An Overview from Shading Systems. Sustainability 2018, 10, 743. [Google Scholar] [CrossRef]
- Dinesh, H.; Pearce, J.M. The Potential of Agrivoltaic Systems. Renew. Sustain. Energy Rev. 2016, 54, 299–308. [Google Scholar] [CrossRef]
- Barron-Gafford, G.; Pavao-Zuckerman, M.; Minor, R.; Sutter, L.; Barnett-Moreno, I.; Blackett, D.; Thompson, M.; Dimond, K.; Gerlak, A.; Nabhan, G.; et al. Agrivoltaics Provide Mutual Benefits across the Food–Energy–Water Nexus in Drylands. Nat. Sustain. 2019, 2, 848–855. [Google Scholar] [CrossRef]
- Takahashi, S.; Bauwe, H.; Badger, M. Impairment of the Photorespiratory Pathway Accelerates Photoinhibition of Photosystem II by Suppression of Repair But Not Acceleration of Damage Processes in Arabidopsis. Plant Physiol. 2007, 144, 487–494. [Google Scholar] [CrossRef] [PubMed]
- Li, Z.; Wakao, S.; Fischer, B.B.; Niyogi, K.K. Sensing and Responding to Excess Light. Annu. Rev. Plant Biol. 2009, 60, 239–260. [Google Scholar] [CrossRef] [PubMed]
- Ruberti, I.; Sessa, G.; Ciolfi, A.; Possenti, M.; Carabelli, M.; Morelli, G. Plant Adaptation to Dynamically Changing Environment: The Shade Avoidance Response. Biotechnol. Adv. 2012, 30, 1047–1058. [Google Scholar] [CrossRef] [PubMed]
- Ke, X.; Yoshida, H.; Hikosaka, S.; Goto, E. Optimization of Photosynthetic Photon Flux Density and Light Quality for Increasing Radiation-Use Efficiency in Dwarf Tomato under LED Light at the Vegetative Growth Stage. Plants 2021, 11, 121. [Google Scholar] [CrossRef] [PubMed]
- Cruz, S.; Gómez, C. Effects of Daily Light Integral on Compact Tomato Plants Grown for Indoor Gardening. Agronomy 2022, 12, 1704. [Google Scholar] [CrossRef]
- Torres, A.P.; Lopez, R. Commercial Greenhouse Production: Measuring Daily Light Integral in a Greenhouse. Available online: https://www.extension.purdue.edu/extmedia/ho/ho-238-w.pdf (accessed on 26 February 2025).
- Zhou, J.; Li, P.; Wang, J.; Fu, W. Growth, Photosynthesis, and Nutrient Uptake at Different Light Intensities and Temperatures in Lettuce. HortScience 2019, 54, 1925–1933. [Google Scholar] [CrossRef]
- Gent, M.P.N. Effect of Degree and Duration of Shade on Quality of Greenhouse Tomato. HortScience 2007, 42, 514–520. [Google Scholar] [CrossRef]
- Tani, A.; Shiina, S.; Nakashima, K.; Hayashi, M. Improvement in Lettuce Growth by Light Diffusion under Solar Panels. J. Agric. Meteorol. 2014, 70, 139–149. [Google Scholar] [CrossRef]
- National Ecological Observatory Network (NEON). Photosynthetically Active Radiation (PAR) (DP1.00024.001): RELEASE-2025. Available online: https://data.neonscience.org/data-products/DP1.00024.001/RELEASE-2025 (accessed on 26 February 2025).
- Carreño-Ortega, A.; do Paço, T.A.; Díaz-Pérez, M.; Gómez-Galán, M. Lettuce Production under Mini-PV Modules Arranged in Patterned Designs. Agronomy 2021, 11, 2554. [Google Scholar] [CrossRef]
- Emmott, C.J.M.; Röhr, J.A.; Campoy-Quiles, M.; Kirchartz, T.; Urbina, A.; Ekins-Daukes, N.J.; Nelson, J. Organic Photovoltaic Greenhouses: A Unique Application for Semi-Transparent PV? Energy Environ. Sci. 2015, 8, 1317–1328. [Google Scholar] [CrossRef]
- Zhao, Y.; Li, Z.; Deger, C.; Wang, M.; Peric, M.; Yin, Y.; Meng, D.; Yang, W.; Wang, X.; Xing, Q.; et al. Achieving Sustainability of Greenhouses by Integrating Stable Semi-Transparent Organic Photovoltaics. Nat. Sustain. 2023, 6, 539–548. [Google Scholar] [CrossRef]
- Friman Peretz, M.; Geoola, F.; Yehia, I.; Ozer, S.; Levi, A.; Magadley, E.; Brikman, R.; Rosenfeld, L.; Levy, A.; Kacira, M.; et al. Testing Organic Photovoltaic Modules for Application as Greenhouse Cover or Shading Element. Biosyst. Eng. 2019, 184, 24–36. [Google Scholar] [CrossRef]
- Teitel, M.; Grimberg, R.; Ozer, S.; Vitoshkin, H.; Yehia, I.; Magadley, E.; Levi, A.; Ziffer, E.; Gantz, S.; Levy, A. Effects of Organic Photovoltaic Modules Installed inside Greenhouses on Microclimate and Plants. Biosyst. Eng. 2023, 232, 81–96. [Google Scholar] [CrossRef]
- Waller, R.; Kacira, M.; Magadley, E.; Teitel, M.; Yehia, I. Semi-Transparent Organic Photovoltaics Applied as Greenhouse Shade for Spring and Summer Tomato Production in Arid Climate. Agronomy 2021, 11, 1152. [Google Scholar] [CrossRef]
- Friman-Peretz, M.; Ozer, S.; Geoola, F.; Magadley, E.; Yehia, I.; Levi, A.; Brikman, R.; Gantz, S.; Levy, A.; Kacira, M.; et al. Microclimate and Crop Performance in a Tunnel Greenhouse Shaded by Organic Photovoltaic Modules—Comparison with Conventional Shaded and Unshaded Tunnels. Biosyst. Eng. 2020, 197, 12–31. [Google Scholar] [CrossRef]
- Charles, M.; Edwards, B.; Ravishankar, E.; Calero, J.; Henry, R.; Rech, J.; Saravitz, C.; You, W.; Ade, H.; O’Connor, B.; et al. Emergent Molecular Traits of Lettuce and Tomato Grown under Wavelength-Selective Solar Cells. Front. Plant Sci. 2023, 14, 1087707. [Google Scholar] [CrossRef] [PubMed]
- Camporese, M.; Abou Najm, M. Not All Light Spectra Were Created Equal: Can We Harvest Light for Optimum Food-Energy Co-Generation? Earth’s Future 2022, 10, e2022EF002900. [Google Scholar] [CrossRef]
- Diver, S.; Born, H. Organic Tomato Production. National Center for Appropriate Technology. 2012. Available online: https://attradev.ncat.org/wp-content/uploads/2022/06/organic-tomato-production.pdf (accessed on 26 February 2025).
- Tomato Grades and Standards|Agricultural Marketing Service. Available online: https://www.ams.usda.gov/grades-standards/tomato-grades-and-standards (accessed on 26 February 2025).
- Magadley, E.; Kabha, R.; Yehia, I. Outdoor Comparison of Two Organic Photovoltaic Panels: The Effect of Solar Incidence Angles and Incident Irradiance. Renew. Energy 2021, 173, 721–732. [Google Scholar] [CrossRef]
- Calculating Daily Light Integral (DLI) with LI-COR Quantum Sensors and Dataloggers. Available online: https://licor.app.boxenterprise.net/s/pgfoukyy5lqxkyz3vfhqfz6go55ytiso (accessed on 19 February 2025).
- Pinheiro, J.; Bates, D. Nlme: Linear and Nonlinear Mixed Effects Models. 2026. Available online: https://CRAN.R-project.org/package=nlme (accessed on 19 February 2025).
- Lenth, R.V.; Banfai, B.; Bolker, B.; Buerkner, P.; Giné-Vázquez, I.; Herve, M.; Jung, M.; Love, J.; Miguez, F.; Piaskowski, J.; et al. Emmeans: Estimated Marginal Means, Aka Least-Squares Means. 2025. Available online: https://CRAN.R-project.org/package=emmeans (accessed on 19 February 2025).
- R Core Team. R: A Language and Environment for Statistical Computing; R Foundation for Statistical Computing: Vienna, Austria, 2025. [Google Scholar]
- Kuznetsova, A.; Brockhoff, P.B.; Christensen, R.H.B. lmerTest Package: Tests in Linear Mixed Effects Models. J. Stat. Softw. 2017, 82, 1–26. [Google Scholar] [CrossRef]
- Anderson, K.S.; Hansen, C.W.; Holmgren, W.F.; Jensen, A.R.; Mikofski, M.A.; Driesse, A. Pvlib Python: 2023 Project Update. J. Open Source Softw. 2023, 8, 5994. [Google Scholar] [CrossRef]
- King, D.L.; Boyson, W.E.; Kratochvil, J.A. Photovoltaic Array Performance Model; SAND2004–3535; Sandia National Laboratories: Albuquerque, NM, USA, 2004; p. 919131. [Google Scholar]
- Ismail, Y.A.M.; Soga, T.; Jimbo, T. Effect of Composition on Conjugation Structure and Energy Gap of P3HT:PCBM Organic Solar Cell. Int. J. New Horiz. Phys. 2015, 2, 87–93. [Google Scholar]
- Vandewal, K.; Tvingstedt, K.; Gadisa, A.; Inganäs, O.; Manca, J.V. Relating the Open-Circuit Voltage to Interface Molecular Properties of Donor:Acceptor Bulk Heterojunction Solar Cells. Phys. Rev. B 2010, 81, 125204. [Google Scholar] [CrossRef]
- Gueymard, C.; Gueymard, C.A. SMARTS, A Simple Model of the Atmospheric Radiative Transfer of Sunshine; Florida Solar Energy Center: Cocoa, FL, USA, 1995. [Google Scholar]
- Kumari, P.; Ojha, R.K.; Abhivyakti, J.; Wadood, A.; Rajesh, R.P. Microclimatic Alteration through Protective Cultivation and Its Effect on Tomato Yield. J. Agrometeorol. 2014, 16, 172–177. [Google Scholar] [CrossRef]
- Ogden, A.B.; Iersel, M.W. van Southern Highbush Blueberry Production in High Tunnels: Temperatures, Development, Yield, and Fruit Quality During the Establishment Years. HortScience 2009, 44, 1850–1856. [Google Scholar] [CrossRef]
- Hochmuth, G.; Hochmuth, R. Production of Greenhouse Tomatoes—Florida Greenhouse Vegetable Production Handbook, Vol 3: HS788/CV266, Rev. 1/2012; EDIS: Gainesville, FL, USA, 2012; p. 7. [Google Scholar] [CrossRef]
- Chitwood, D.H.; Kumar, R.; Ranjan, A.; Pelletier, J.M.; Townsley, B.T.; Ichihashi, Y.; Martinez, C.C.; Zumstein, K.; Harada, J.J.; Maloof, J.N.; et al. Light-Induced Indeterminacy Alters Shade-Avoiding Tomato Leaf Morphology. Plant Physiol. 2015, 169, 2030–2047. [Google Scholar] [CrossRef] [PubMed]
- Sessa, G.; Carabelli, M.; Possenti, M.; Morelli, G.; Ruberti, I. Multiple Pathways in the Control of the Shade Avoidance Response. Plants 2018, 7, 102. [Google Scholar] [CrossRef] [PubMed]
- Fausey, B.A.; Heins, R.D.; Cameron, A.C. Daily Light Integral Affects Flowering and Quality of Greenhouse-Grown Achillea, Gaura, and Lavandula. HortScience 2005, 40, 114–118. [Google Scholar] [CrossRef]
- Paz, M.; Fisher, P.R.; Gómez, C. Minimum Light Requirements for Indoor Gardening of Lettuce. Urban Agric. Reg. Food Syst. 2019, 4, 190001. [Google Scholar] [CrossRef]
- Alves, C.M.L.; Chang, H.-Y.; Tong, C.B.S.; Rohwer, C.L.; Avalos, L.; Vickers, Z.M. Artificial Shading Can Adversely Affect Heat-Tolerant Lettuce Growth and Taste, with Concomitant Changes in Gene Expression. J. Am. Soc. Hortic. Sci. 2022, 147, 45–52. [Google Scholar] [CrossRef]
- Smith, H. Phytochromes and Light Signal Perception by Plants—An Emerging Synthesis. Nature 2000, 407, 585–591. [Google Scholar] [CrossRef] [PubMed]
- O’Connell, S.; Rivard, C.; Peet, M.M.; Harlow, C.; Louws, F. High Tunnel and Field Production of Organic Heirloom Tomatoes: Yield, Fruit Quality, Disease, and Microclimate. HortScience 2012, 47, 1283–1290. [Google Scholar] [CrossRef]
- Ezzaeri, K.; Fatnassi, H.; Bouharroud, R.; Gourdo, L.; Bazgaou, A.; Wifaya, A.; Demrati, H.; Bekkaoui, A.; Aharoune, A.; Poncet, C.; et al. The Effect of Photovoltaic Panels on the Microclimate and on the Tomato Production under Photovoltaic Canarian Greenhouses. Sol. Energy 2018, 173, 1126–1134. [Google Scholar] [CrossRef]
- Marucci, A.; Zambon, I.; Colantoni, A.; Monarca, D. A Combination of Agricultural and Energy Purposes: Evaluation of a Prototype of Photovoltaic Greenhouse Tunnel. Renew. Sustain. Energy Rev. 2018, 82, 1178–1186. [Google Scholar] [CrossRef]
- Ravishankar, E.; Charles, M.; Xiong, Y.; Henry, R.; Swift, J.; Rech, J.; Calero, J.; Cho, S.; Booth, R.E.; Kim, T.; et al. Balancing Crop Production and Energy Harvesting in Organic Solar-Powered Greenhouses. Cell Rep. Phys. Sci. 2021, 2, 100381. [Google Scholar] [CrossRef]
- Carriedo, L.G.; Maloof, J.N.; Brady, S.M. Molecular Control of Crop Shade Avoidance. Curr. Opin. Plant Biol. 2016, 30, 151–158. [Google Scholar] [CrossRef] [PubMed]
- Franklin, K.A. Shade Avoidance. New Phytol. 2008, 179, 930–944. [Google Scholar] [CrossRef] [PubMed]
- Smith, H.; Whitelam, G. The Shade Avoidance Syndrome: Multiple Responses Mediated by Multiple Phytochromes. Plant Cell Environ. 1997, 20, 840–844. [Google Scholar] [CrossRef]
- Fan, X.-X.; Xu, Z.-G.; Liu, X.-Y.; Tang, C.-M.; Wang, L.-W.; Han, X. Effects of Light Intensity on the Growth and Leaf Development of Young Tomato Plants Grown under a Combination of Red and Blue Light. Sci. Hortic. 2013, 153, 50–55. [Google Scholar] [CrossRef]
- Adams, S.R.; Cockshull, K.E.; Cave, C.R.J. Effect of Temperature on the Growth and Development of Tomato Fruits. Ann. Bot. 2001, 88, 869–877. [Google Scholar] [CrossRef]
- Cagnola, J.I.; Ploschuk, E.; Benech-Arnold, T.; Finlayson, S.A.; Casal, J.J. Stem Transcriptome Reveals Mechanisms to Reduce the Energetic Cost of Shade-Avoidance Responses in Tomato. Plant Physiol. 2012, 160, 1110–1119. [Google Scholar] [CrossRef] [PubMed]
- Ilić, Z.S.; Milenković, L.; Šunić, L.; Fallik, E. Effect of Coloured Shade-Nets on Plant Leaf Parameters and Tomato Fruit Quality. J. Sci. Food Agric. 2015, 95, 2660–2667. [Google Scholar] [CrossRef] [PubMed]
- Marrou, H.; Wery, J.; Dufour, L.; Dupraz, C. Productivity and Radiation Use Efficiency of Lettuces Grown in the Partial Shade of Photovoltaic Panels. Eur. J. Agron. 2013, 44, 54–66. [Google Scholar] [CrossRef]
- Tomato Cultivar Evaluation: Marketable Yield. Available online: https://extension.psu.edu/tomato-cultivar-evaluation-marketable-yield (accessed on 20 November 2025).
- Optimizing Fruit Quality in Fresh Market Tomato. Available online: https://www.canr.msu.edu/resources/optimizing_fruit_quality_in_fresh_market_tomato_e2927 (accessed on 20 November 2025).
- Masabni, J.; Sun, Y.; Niu, G.; Valle, P.D. Shade Effect on Growth and Productivity of Tomato and Chili Pepper. HortTechnology 2016, 26, 344–350. [Google Scholar] [CrossRef]
- Healy, G.K.; Emerson, B.J.; Dawson, J.C. Tomato Variety Trials for Productivity and Quality in Organic Hoop House versus Open Field Management. Renew. Agric. Food Syst. 2017, 32, 562–572. [Google Scholar] [CrossRef]
- Sulistyowati, D.; Chozin, M.A.; Syukur, M.; Melati, M.; Guntoro, D. Selection of Shade-Tolerant Tomato Genotypes. J. Appl. Hortic. 2016, 18, 154–159. [Google Scholar] [CrossRef]
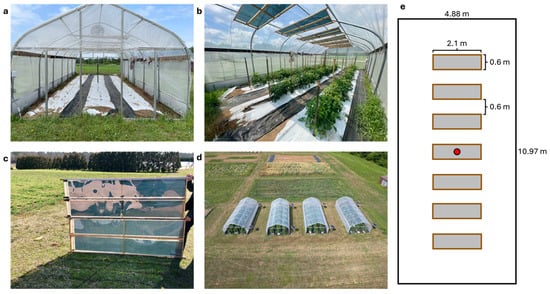
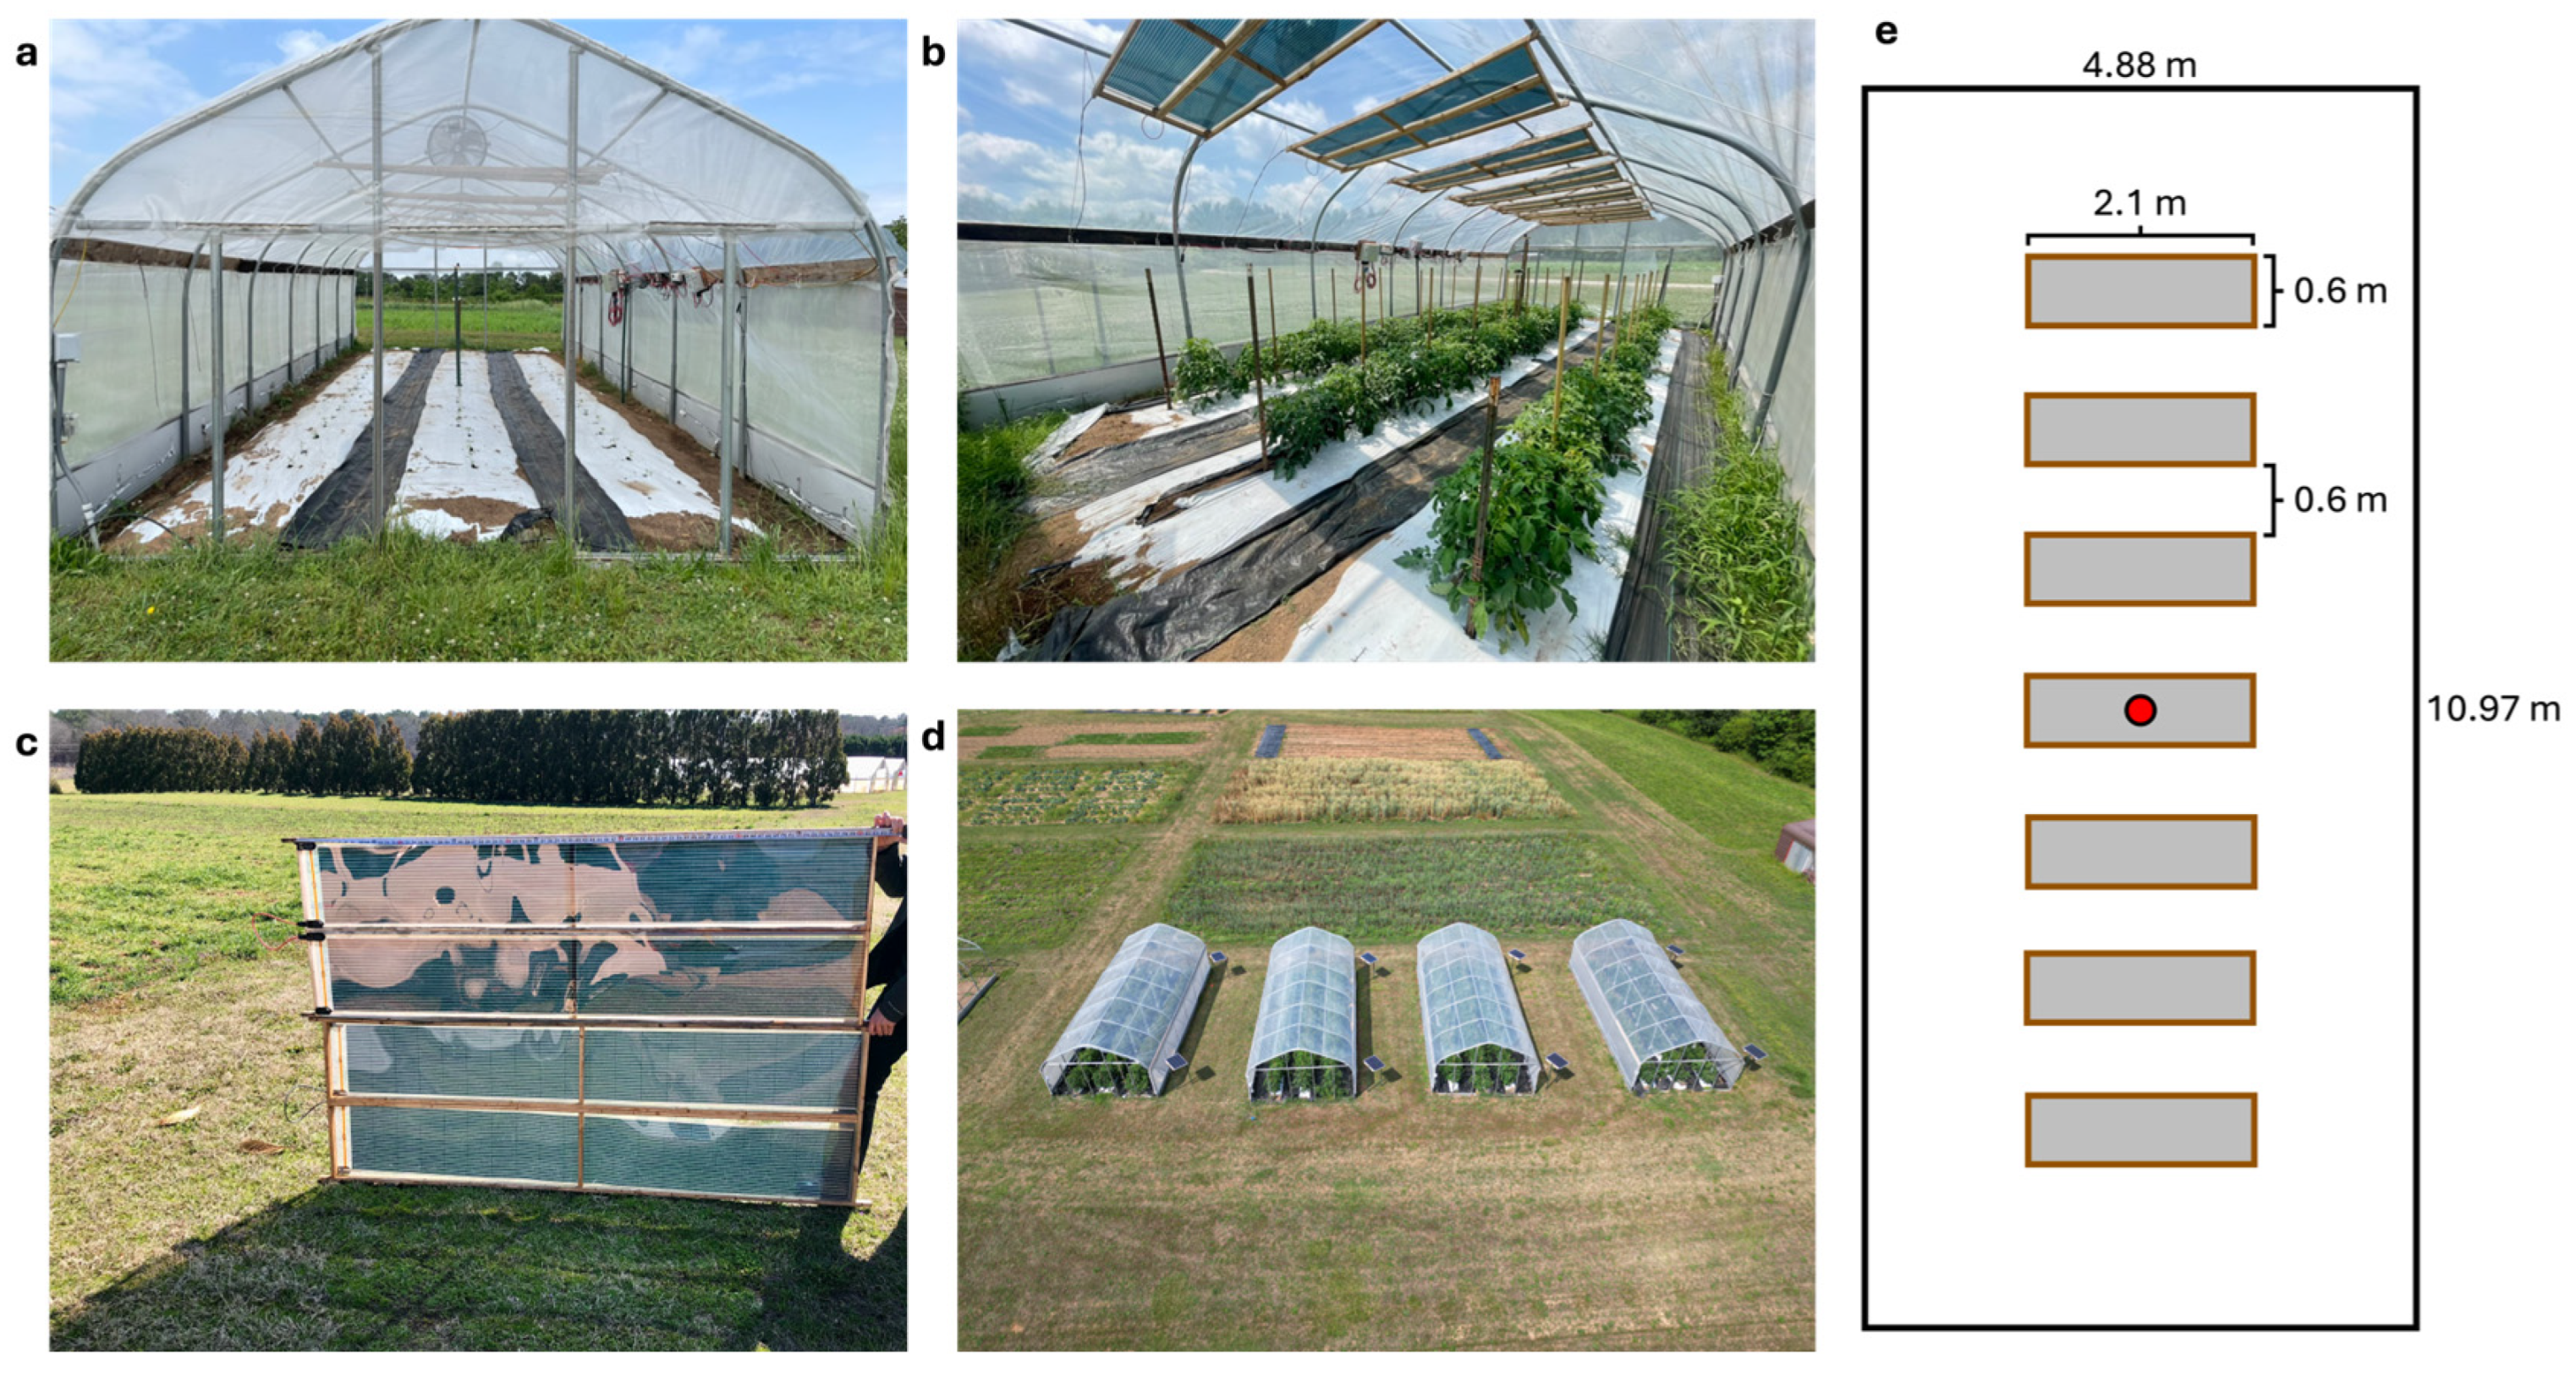
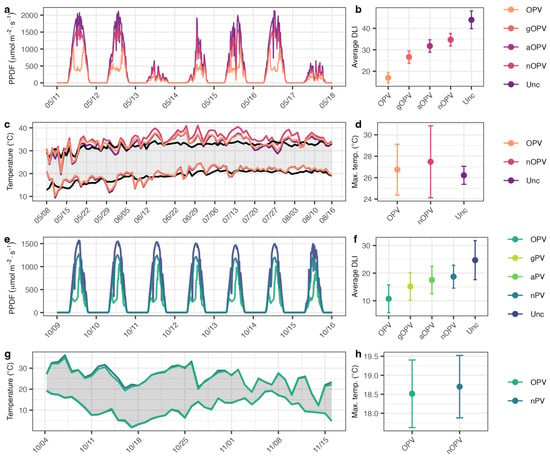
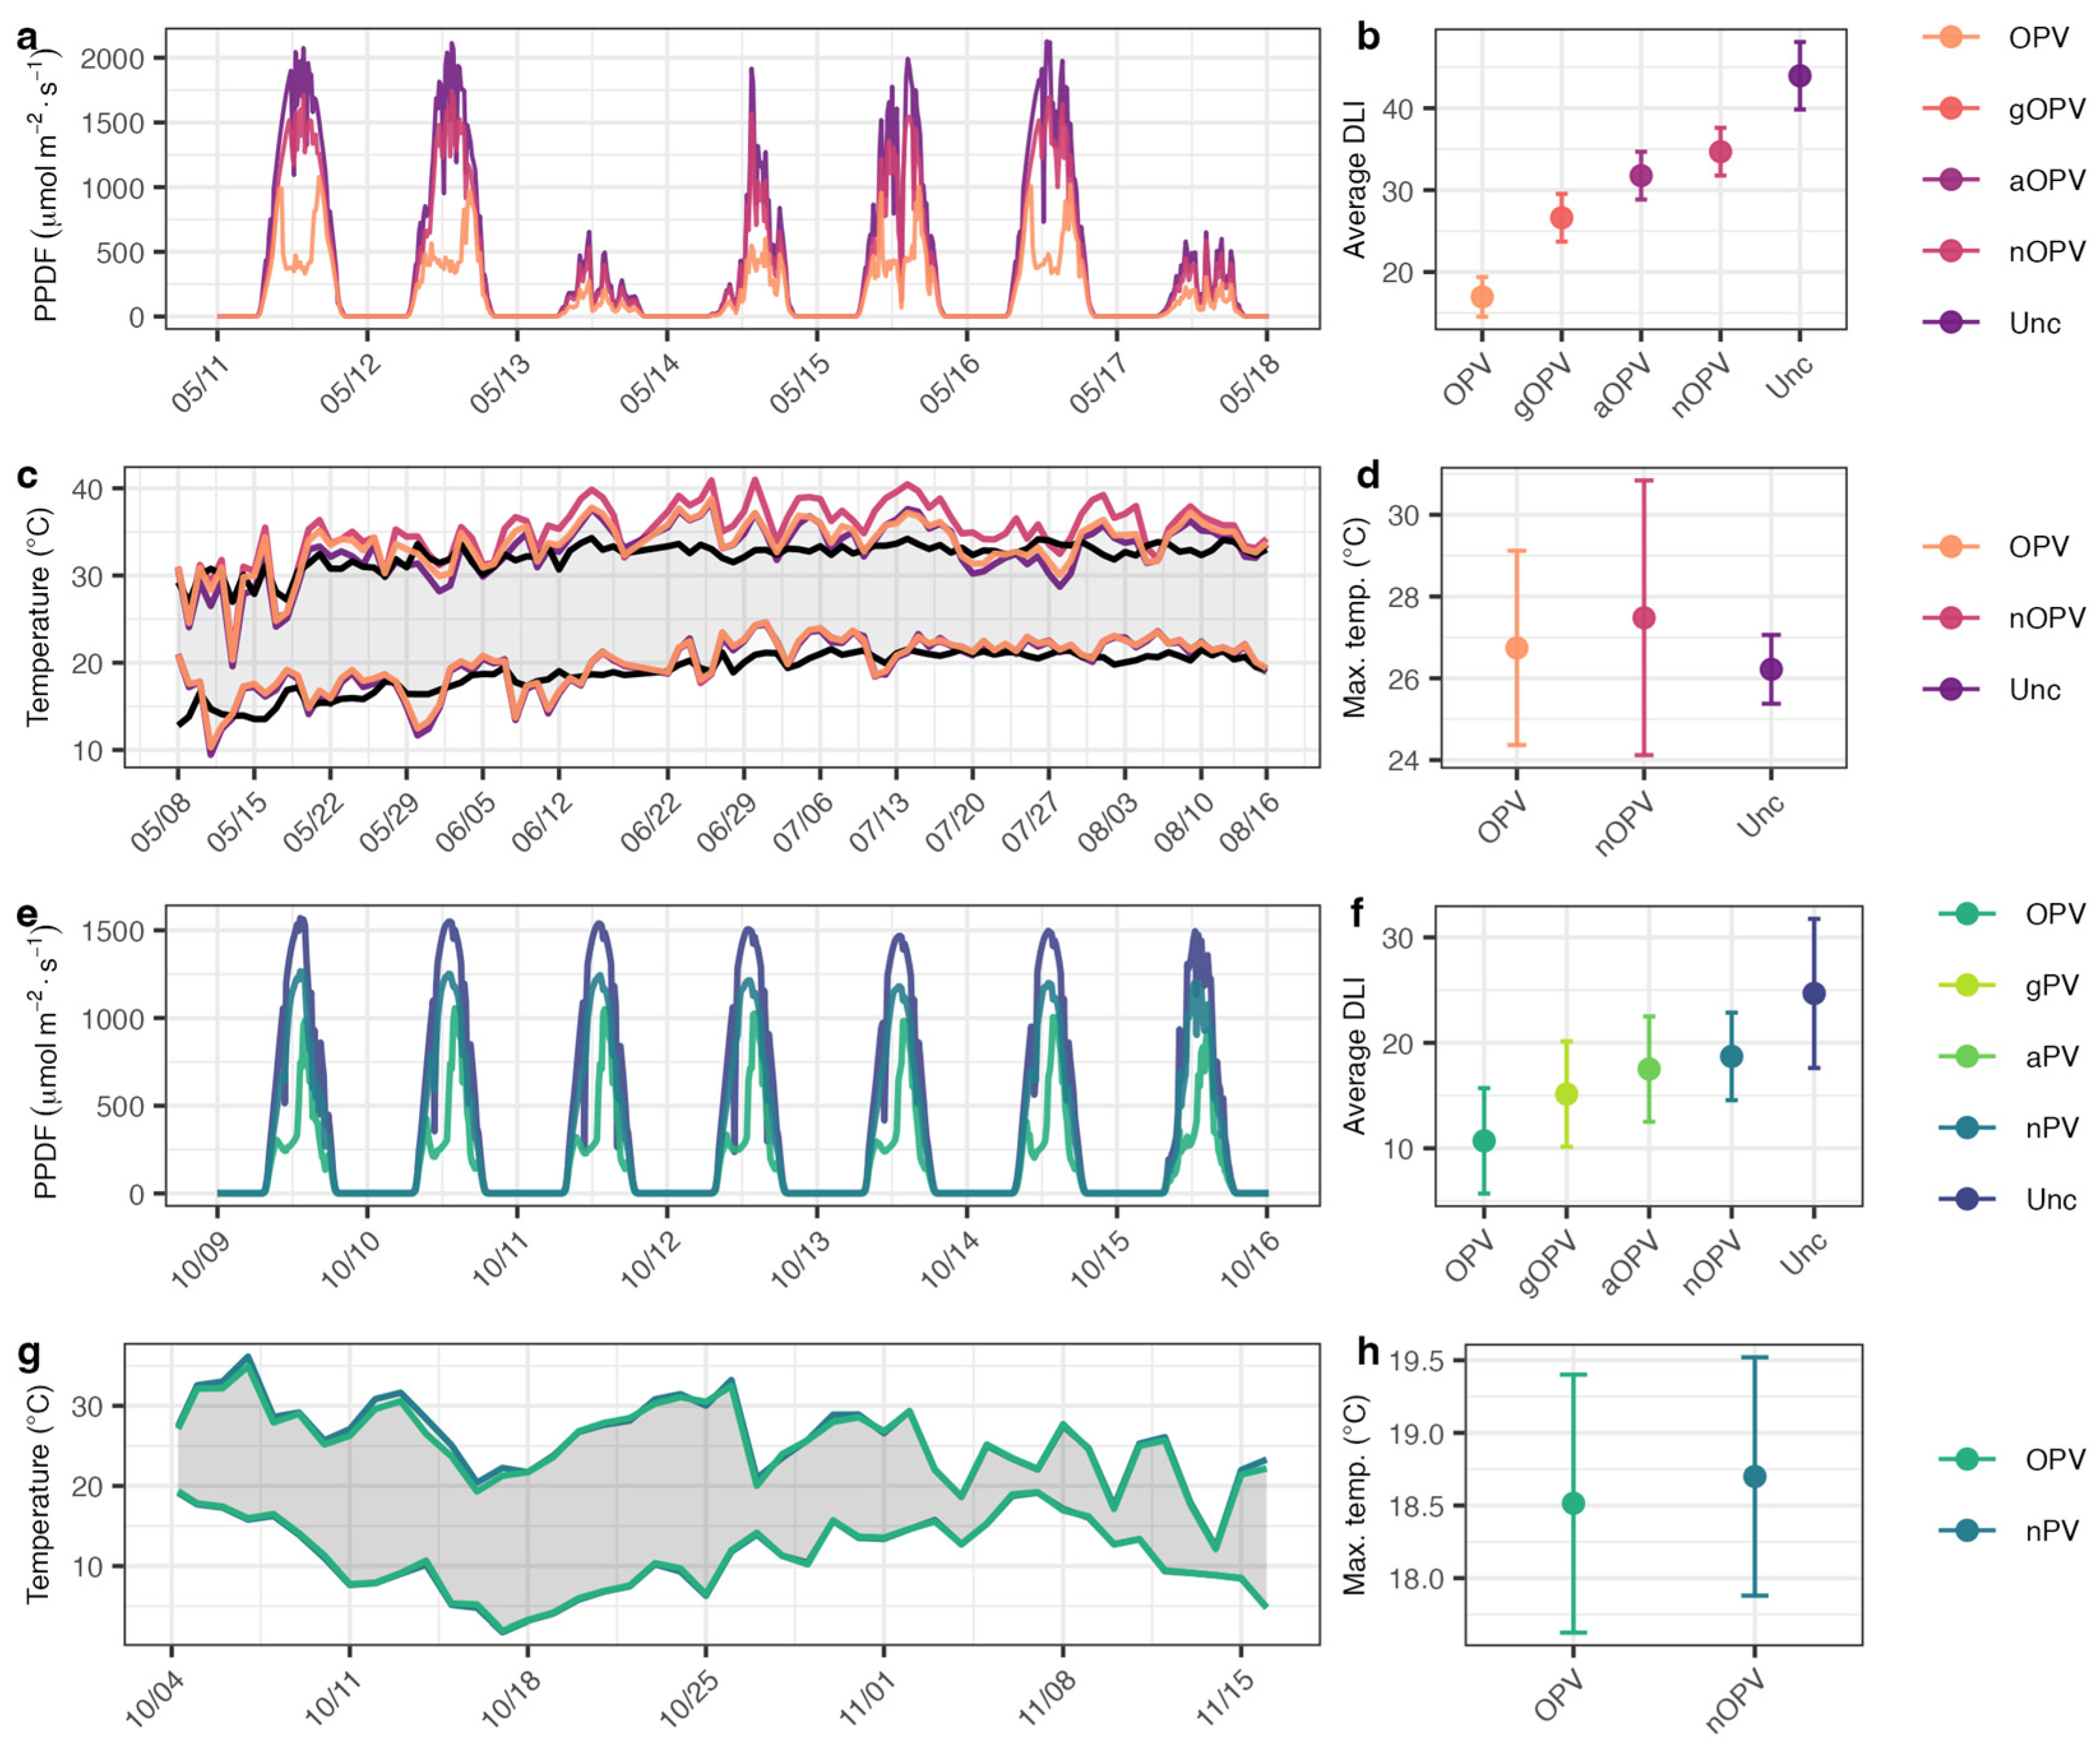
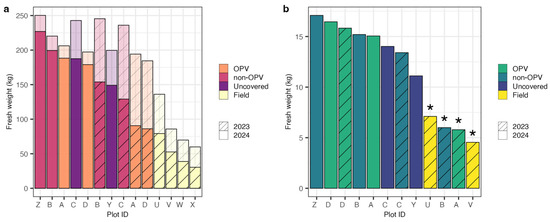
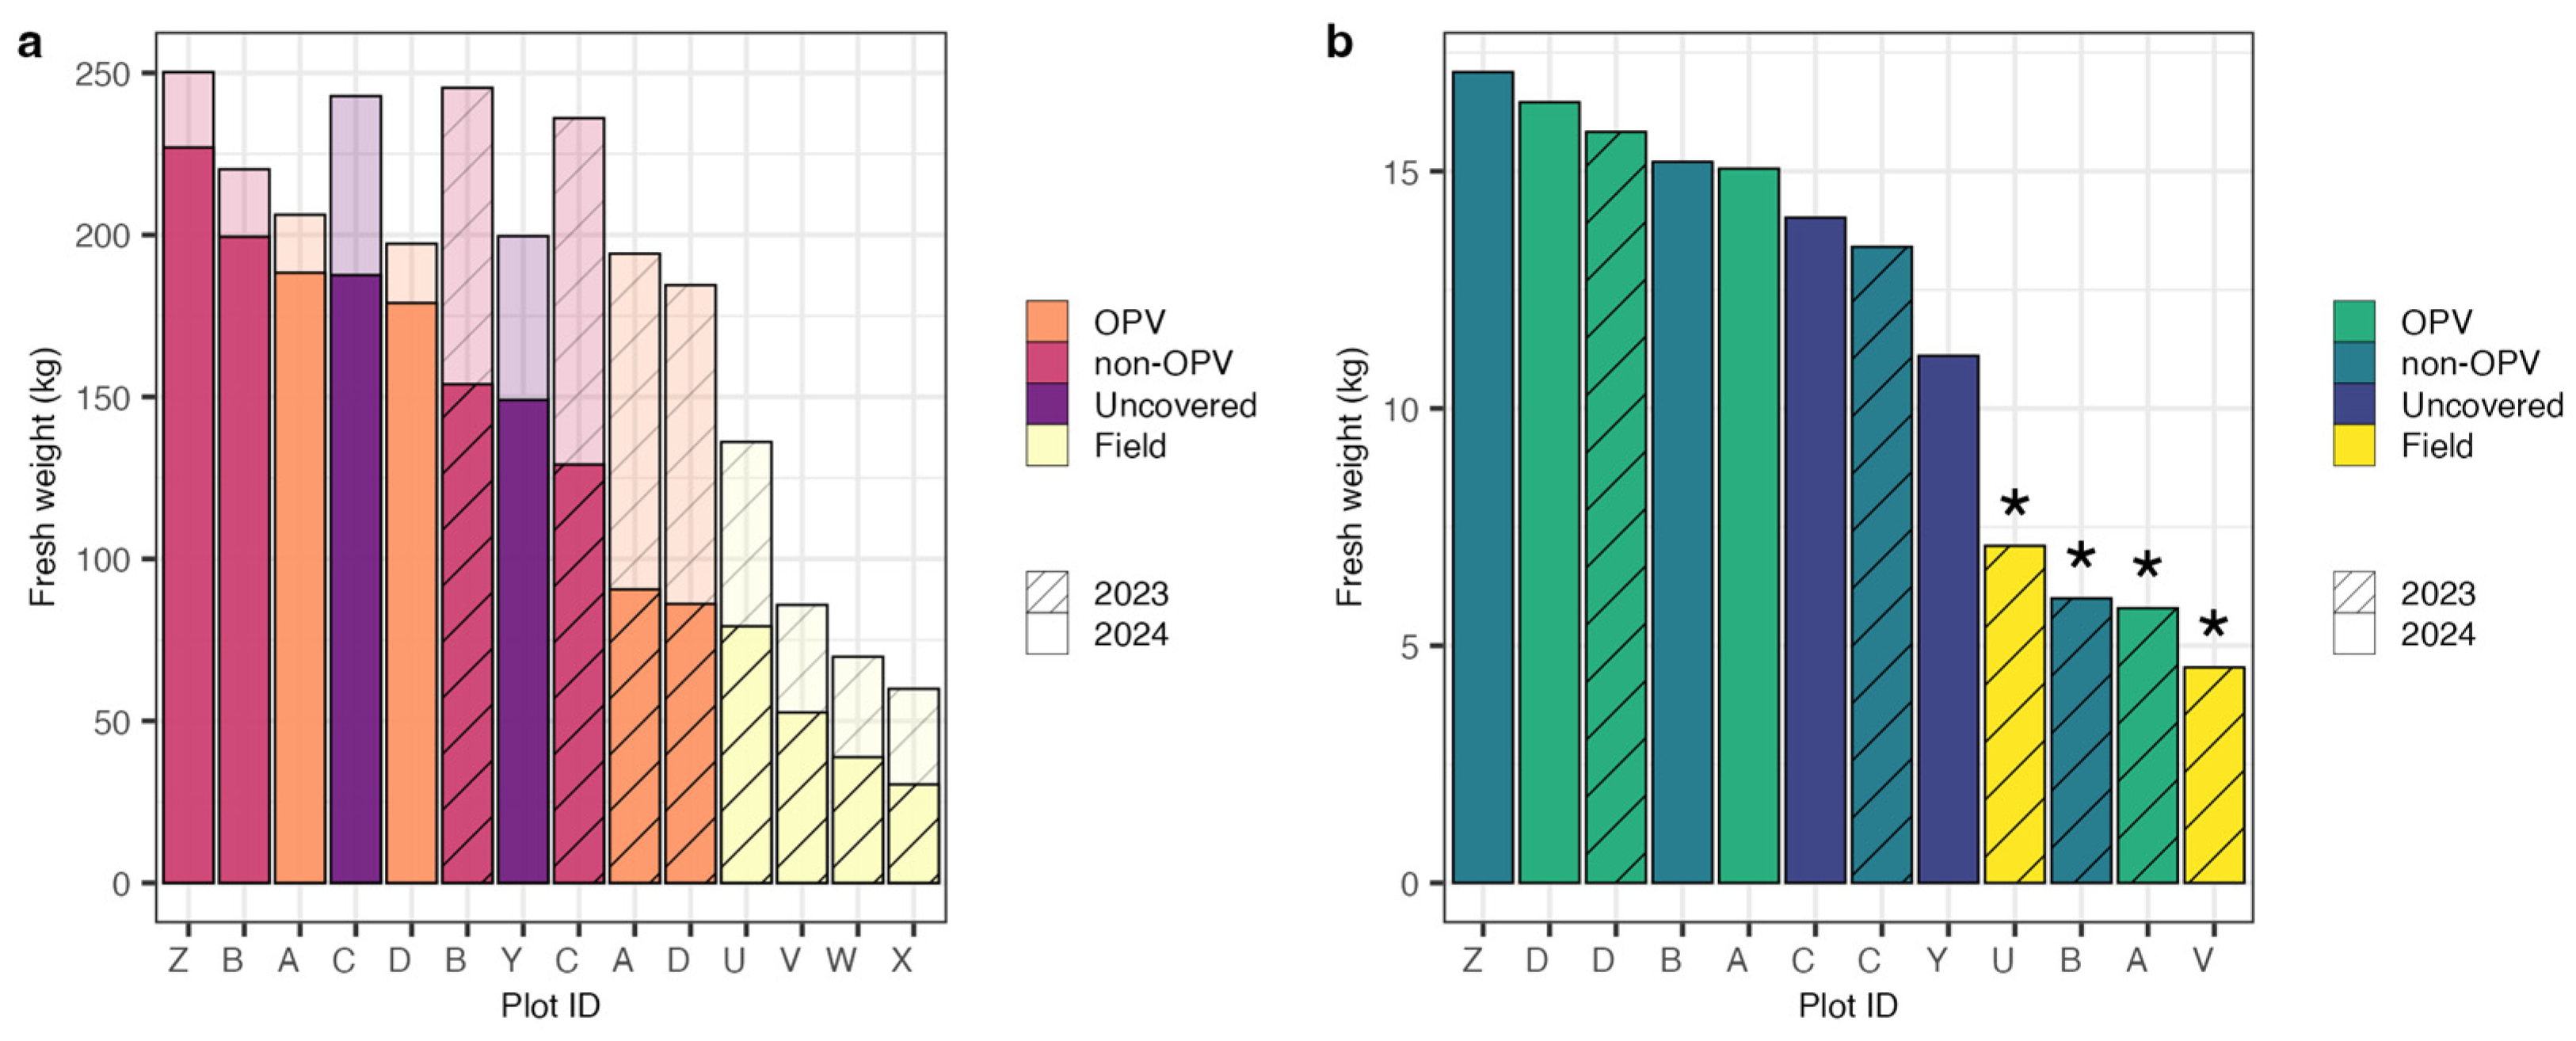
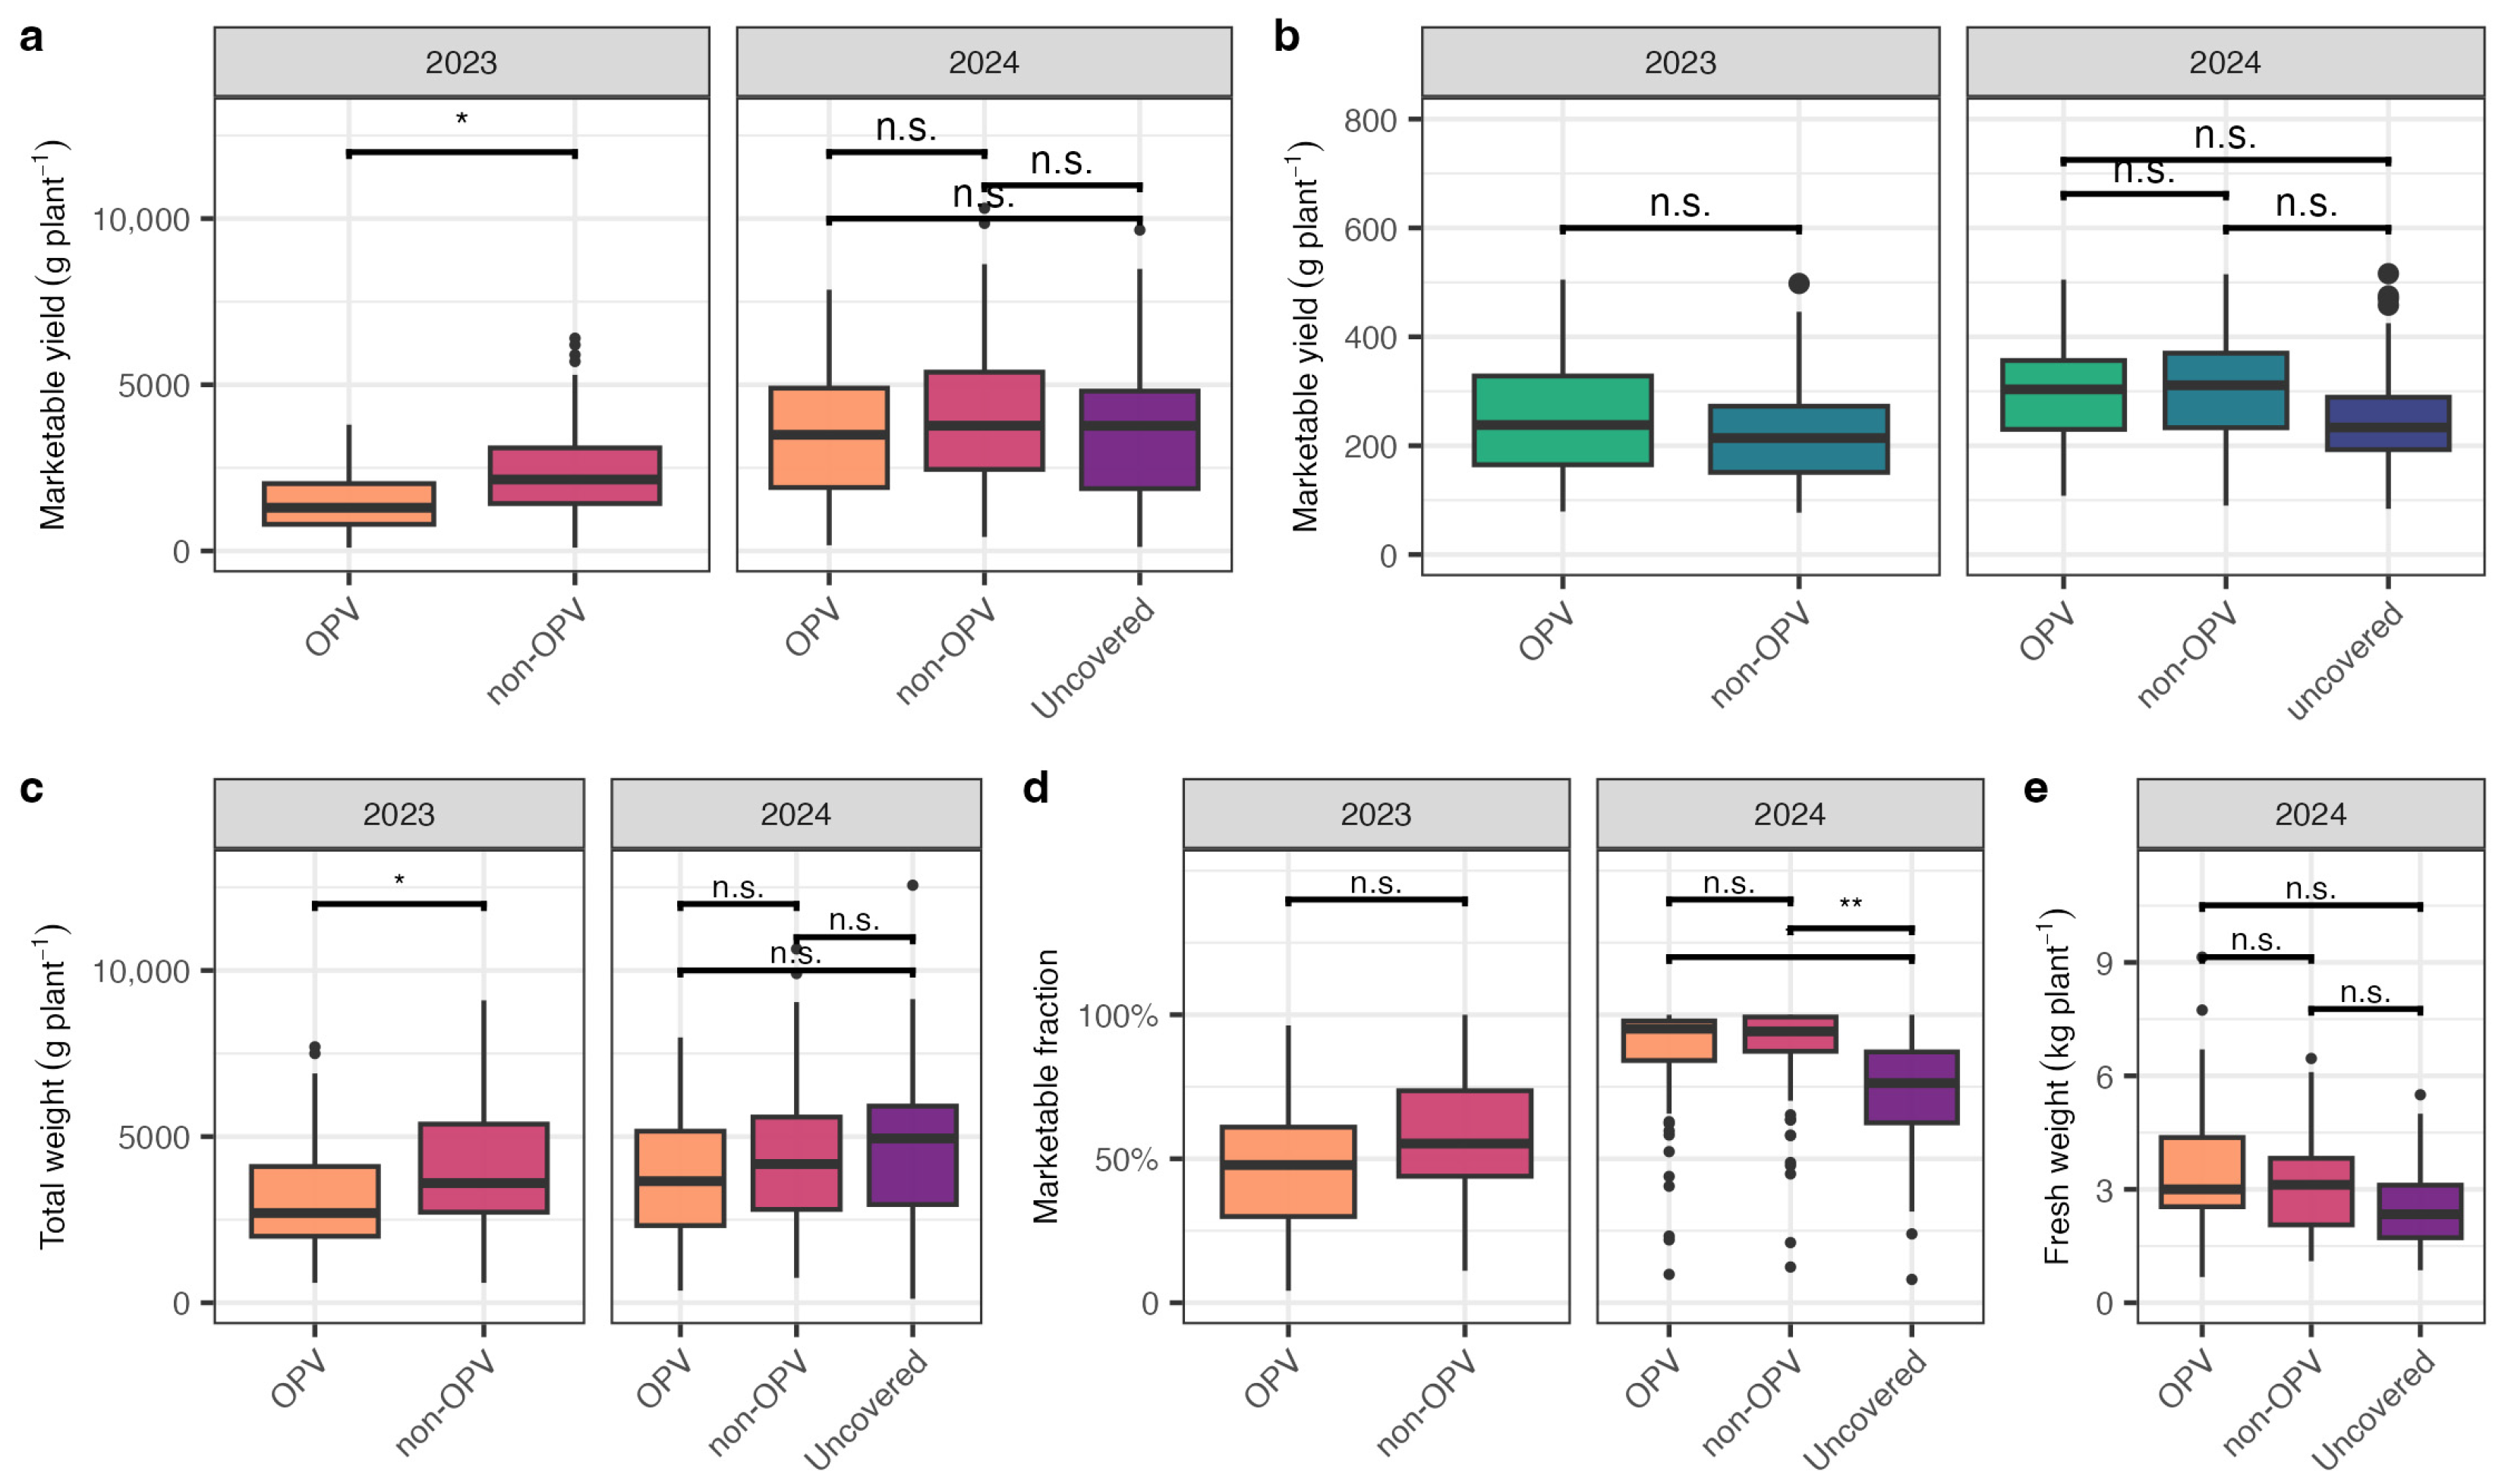
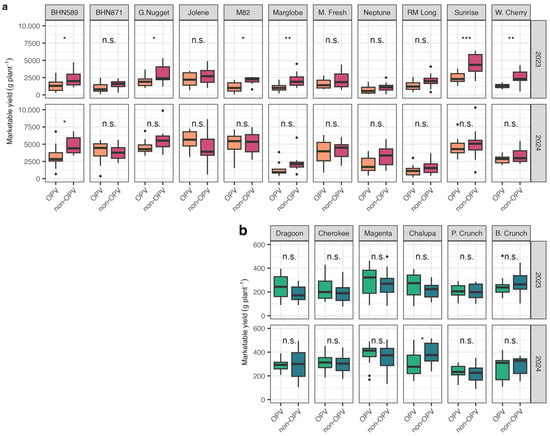
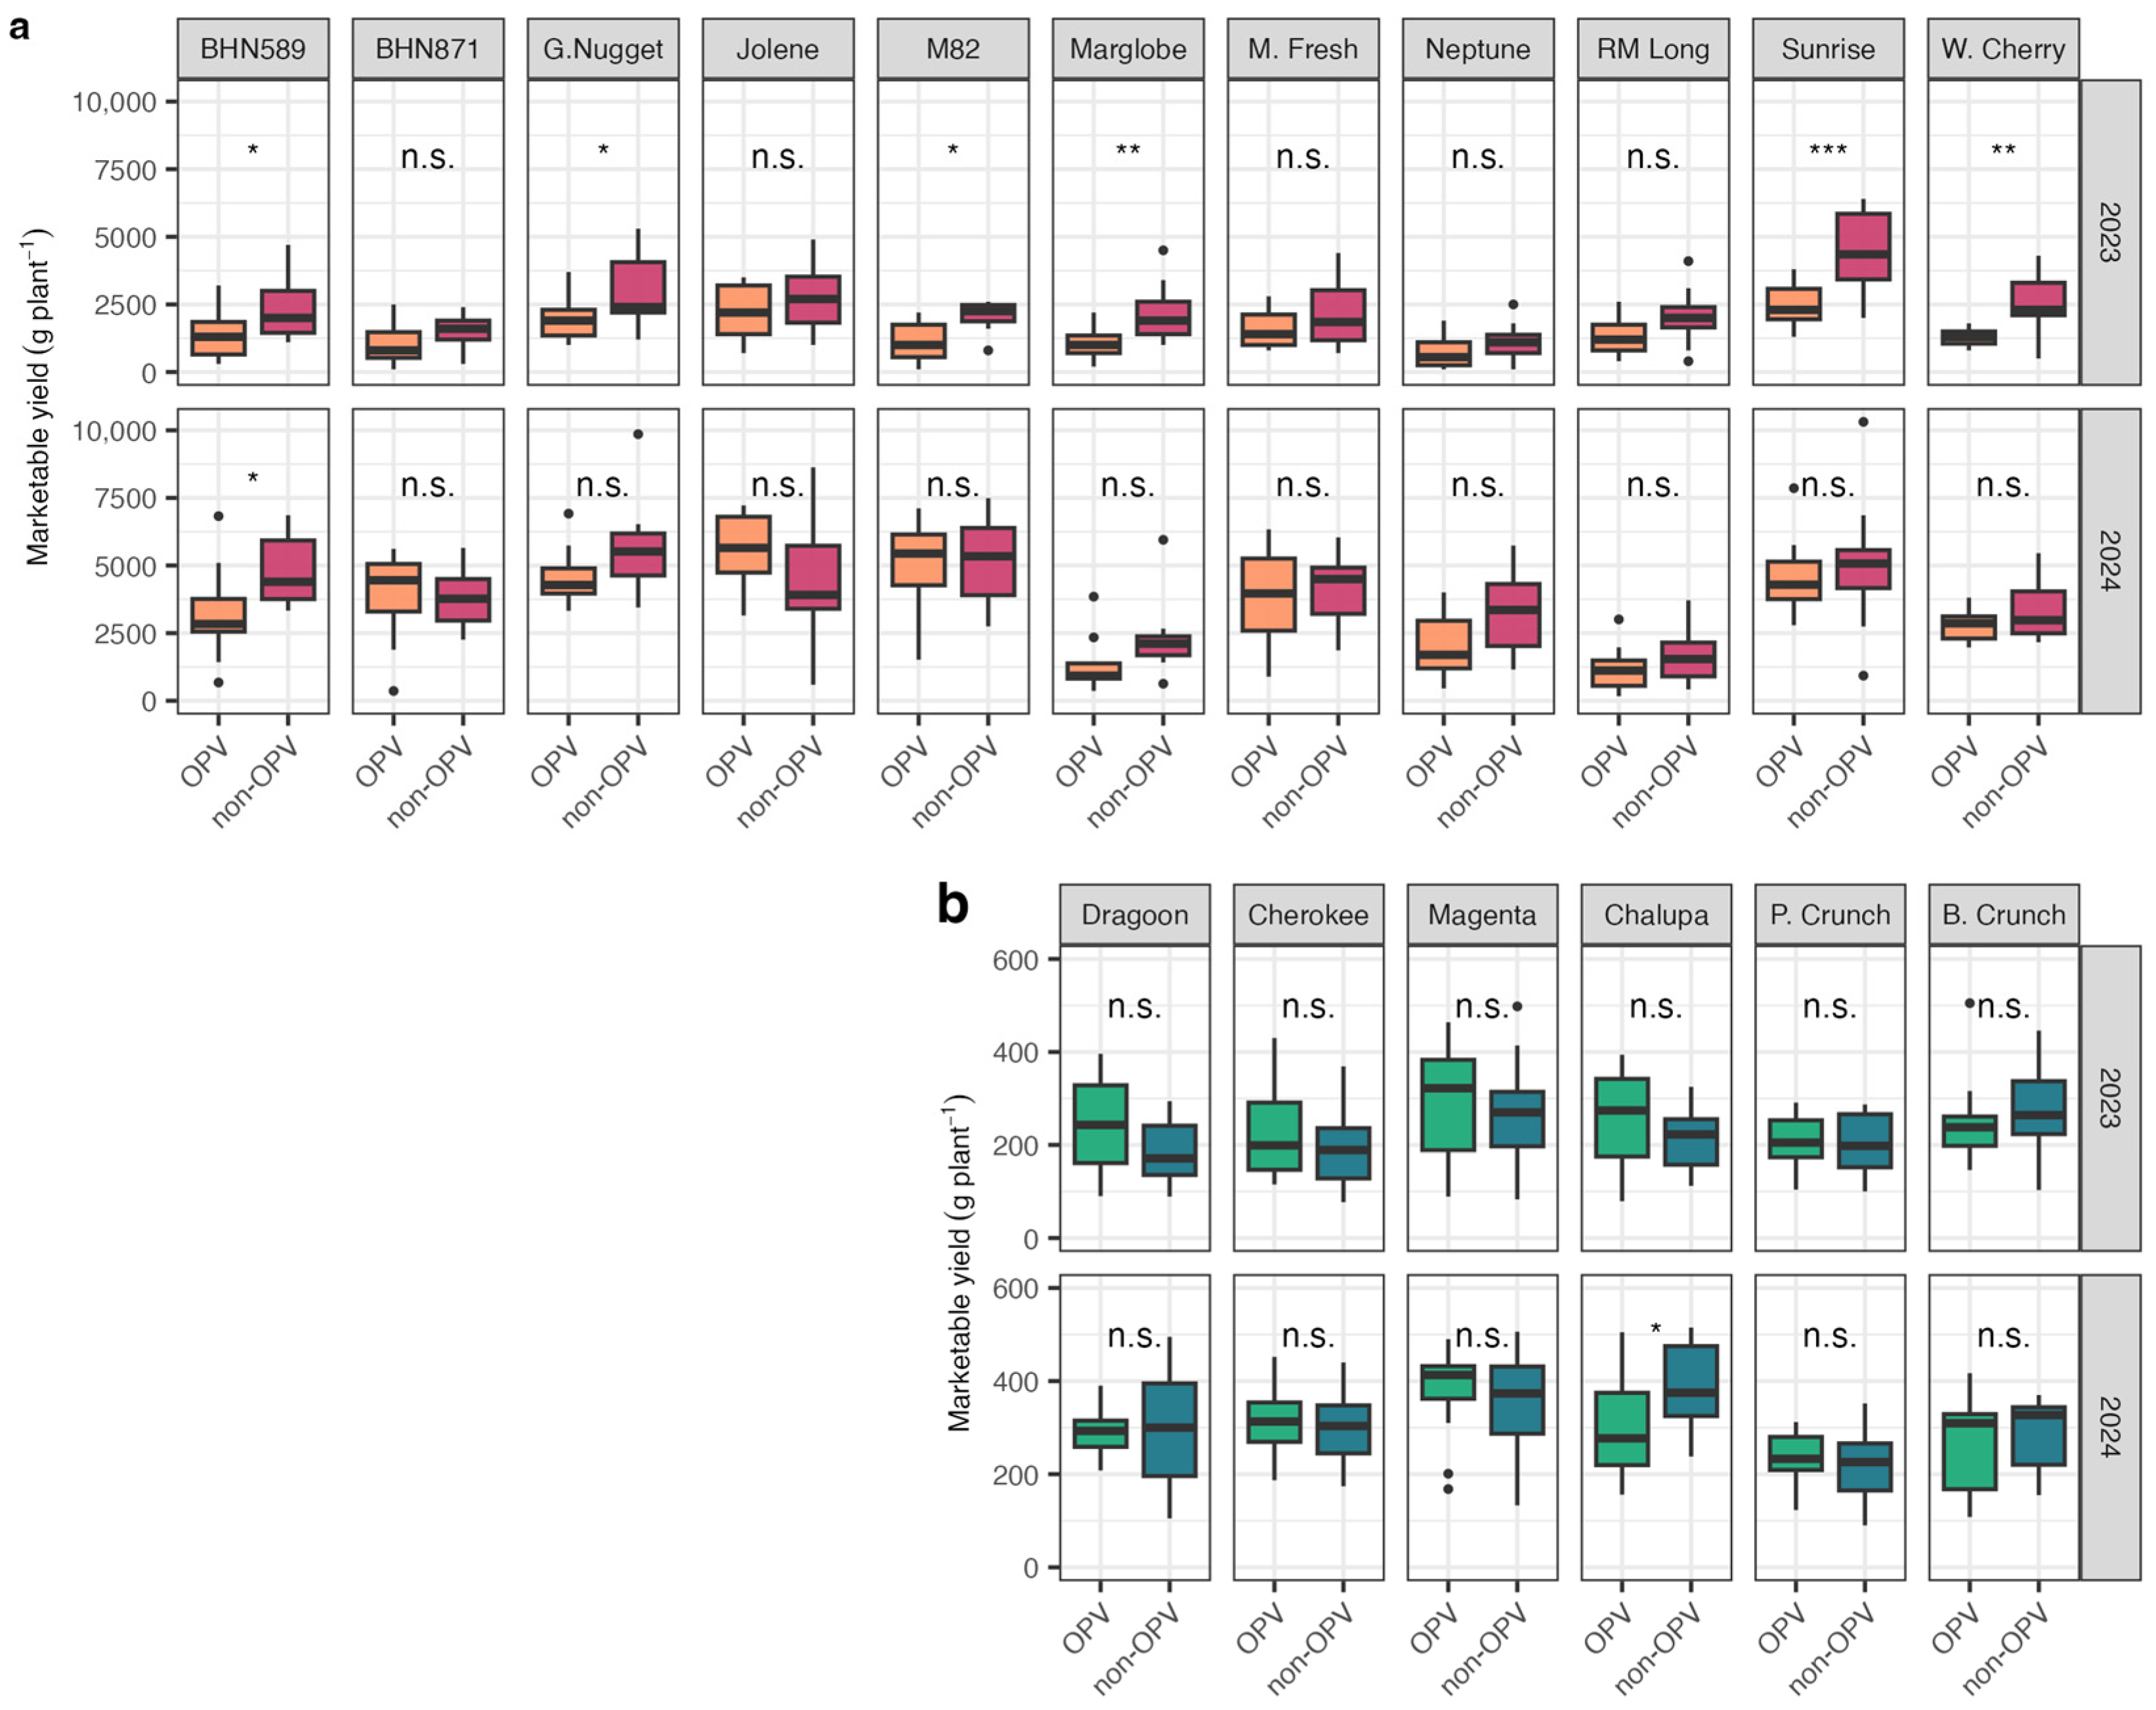
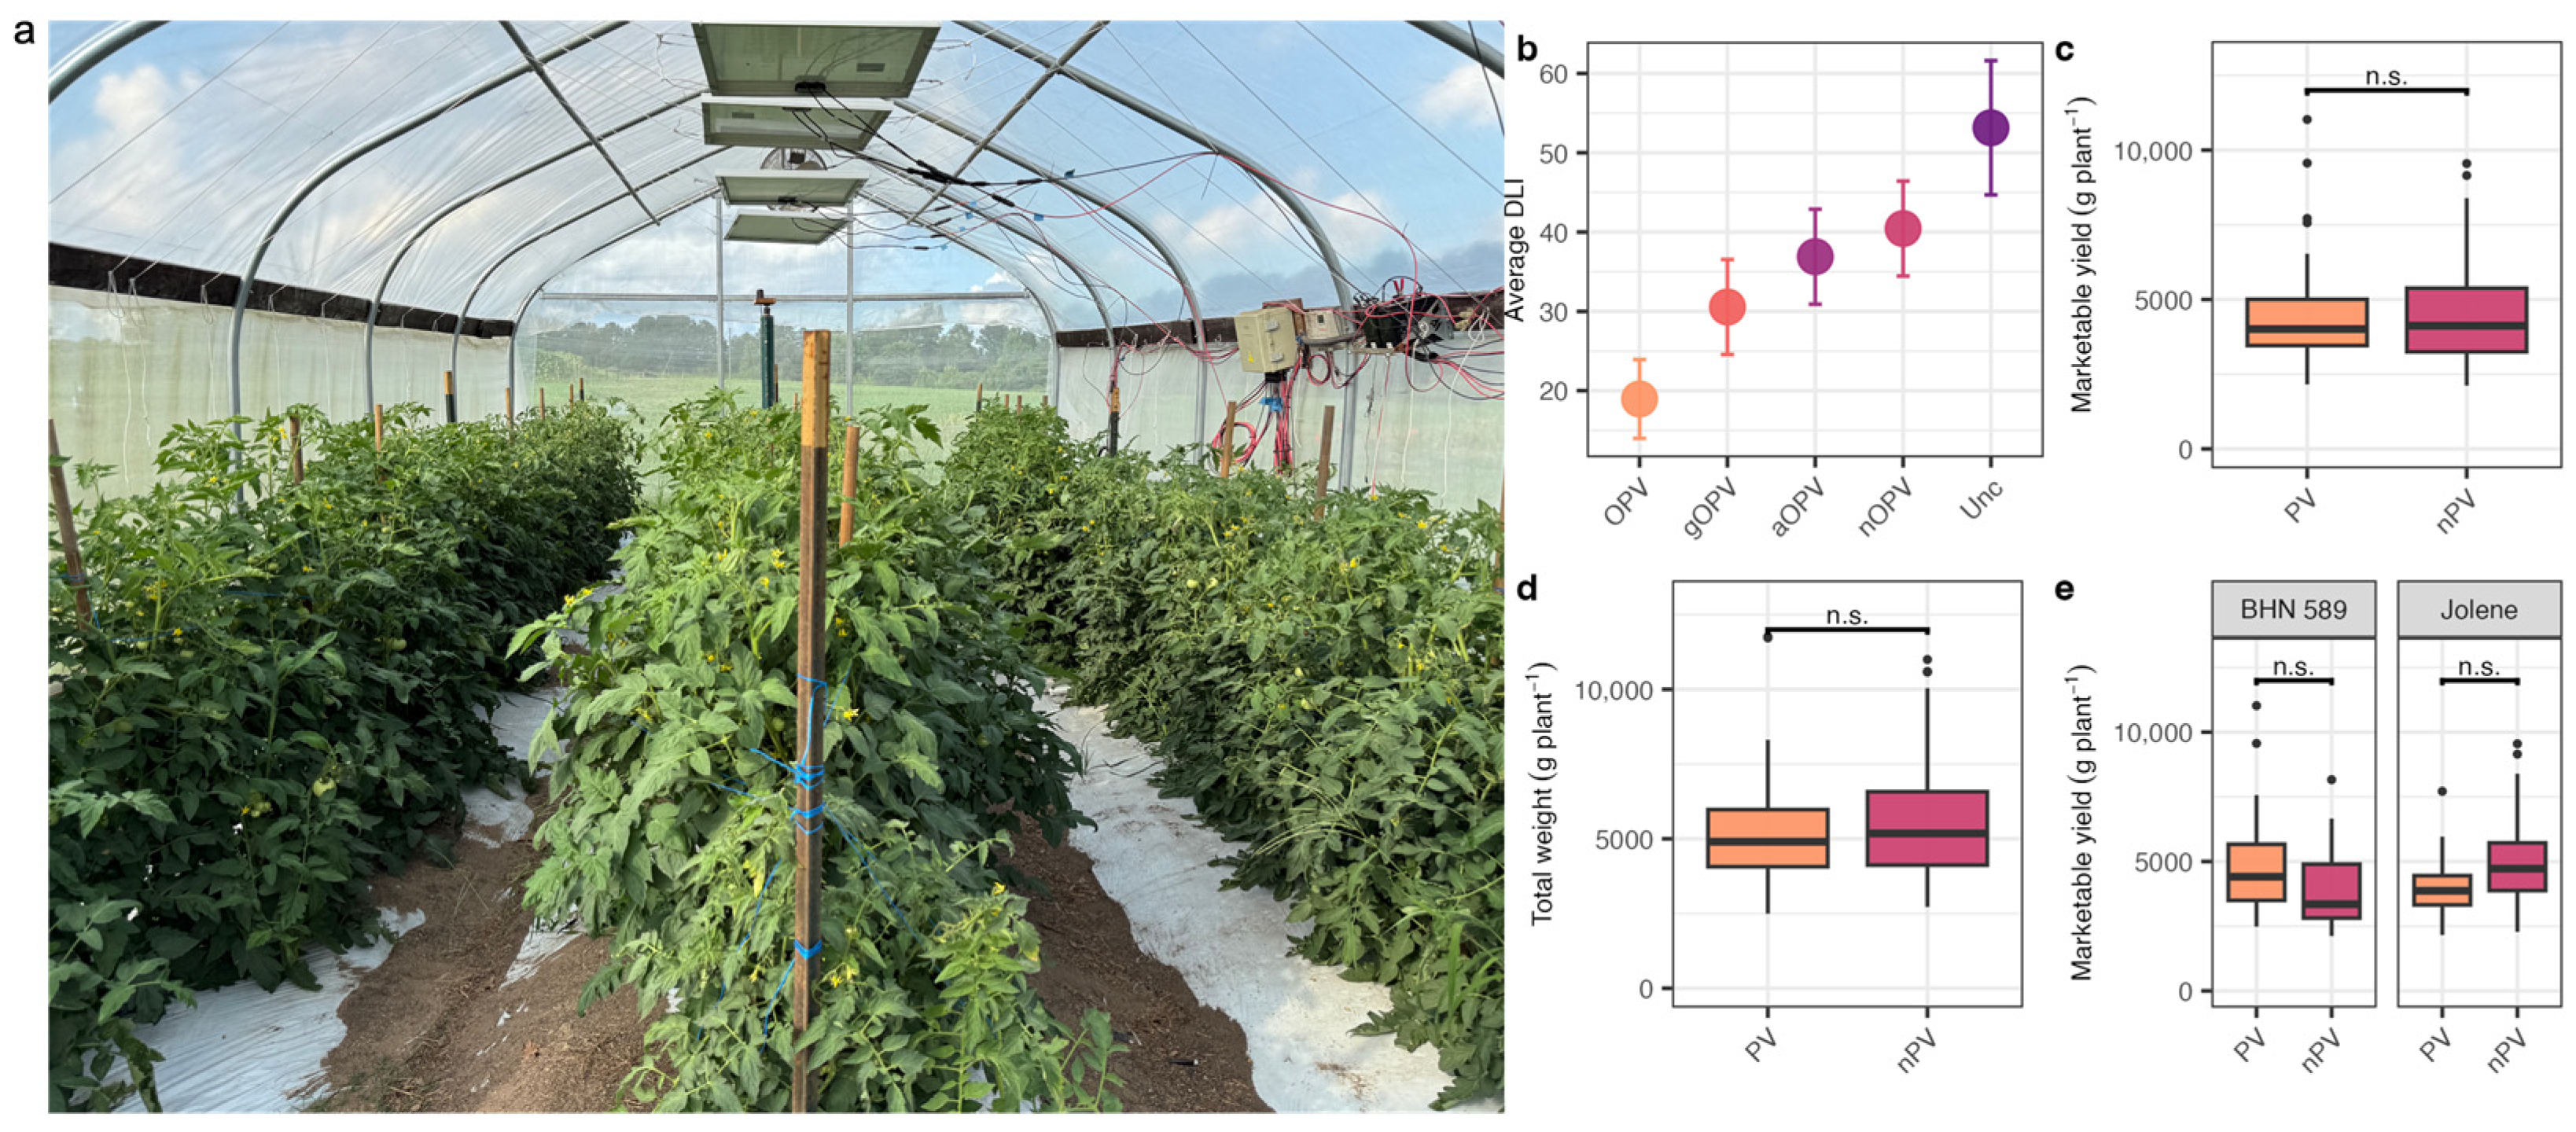
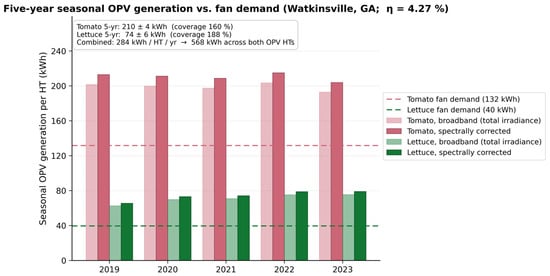
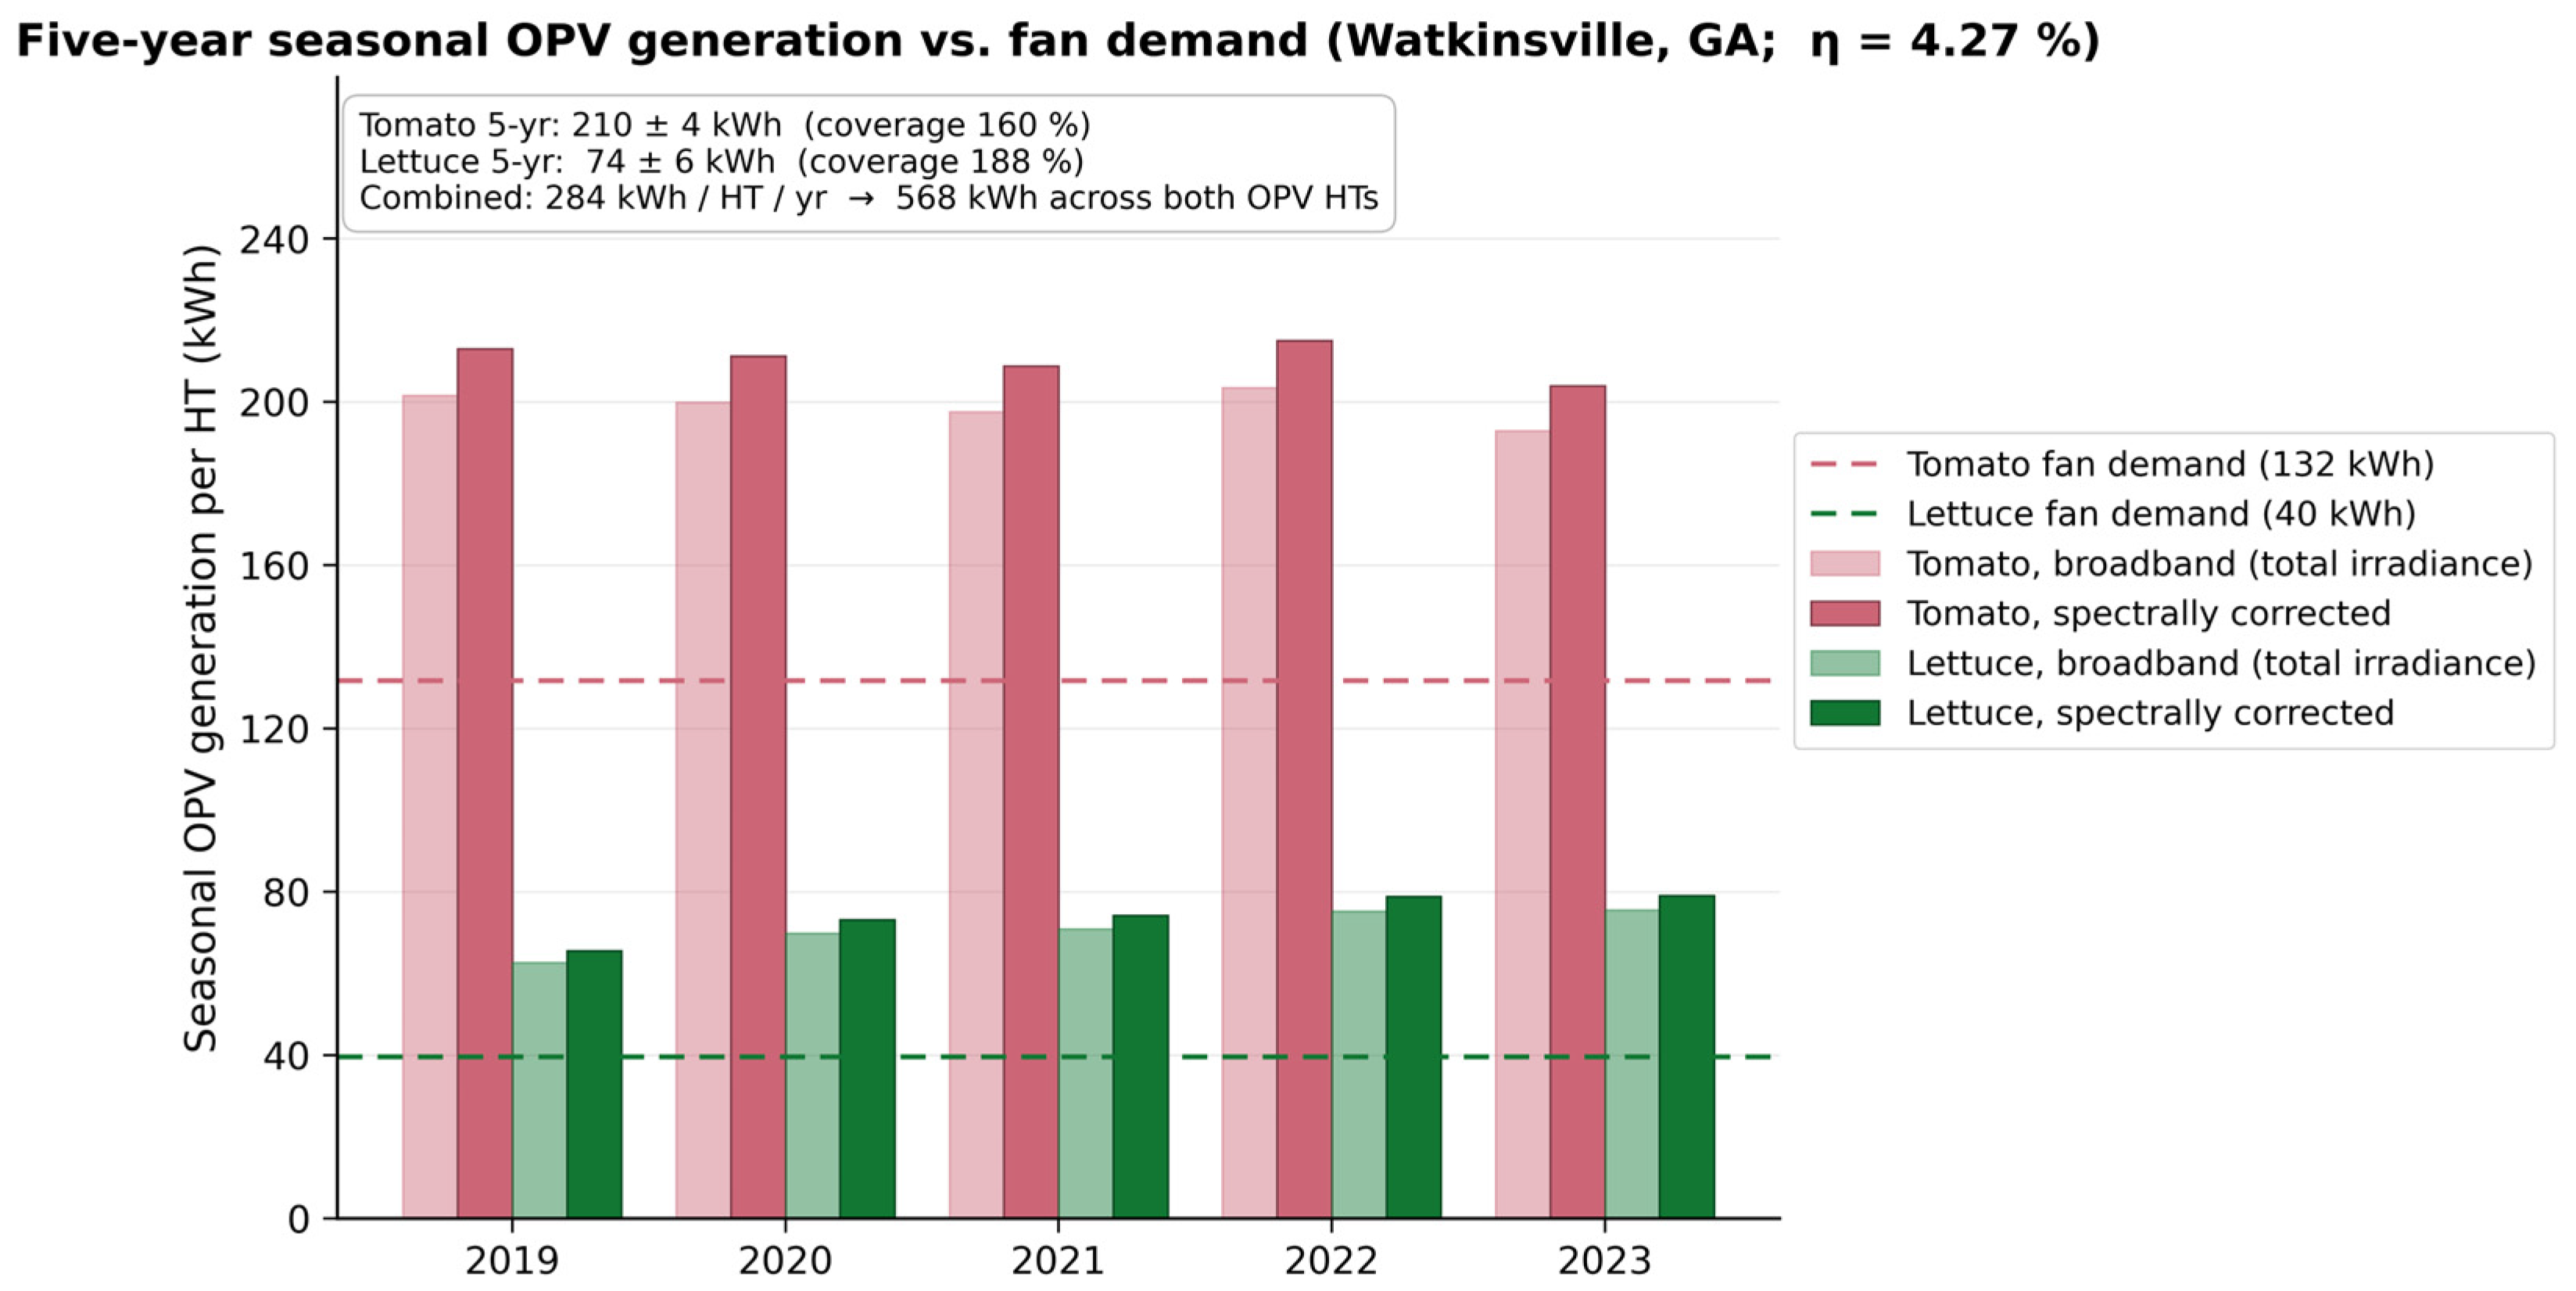
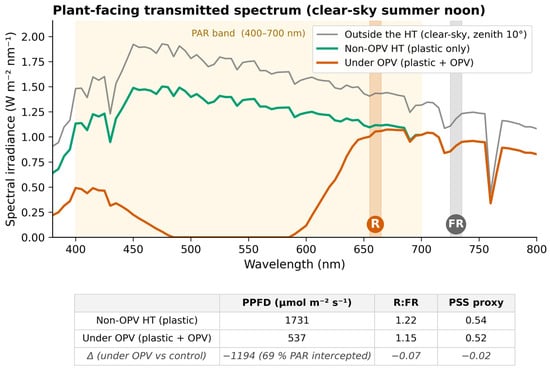
Disclaimer/Publisher’s Note: The statements, opinions and data contained in all publications are solely those of the individual author(s) and contributor(s) and not of MDPI and/or the editor(s). MDPI and/or the editor(s) disclaim responsibility for any injury to people or property resulting from any ideas, methods, instructions or products referred to in the content. |
© 2026 by the authors. Licensee MDPI, Basel, Switzerland. This article is an open access article distributed under the terms and conditions of the Creative Commons Attribution (CC BY) license.