


Abstract
The grassland ecosystem plays a crucial role in providing ample forage resources for grassland animal husbandry, ensuring its development. Identifying grassland forage is essential for understanding forage resources and cultivating high-quality forage. To address the low accuracy of forage image identification and the issue of some features being ignored during image preprocessing, we have proposed a novel forage identification model, Dual-attention Auto-Encoding Dense Convolution Network (DAEDN), which has not been applied to forage identification before. DAEDN simultaneously calculates the weighted features of both channels and spaces, and utilizes Auto-Encodings to better capture the data, thereby enhancing the feature extraction capability and identification classification performance for grassland forage data. Additionally, it enhances the analysis of edge, texture, and other detailed features by leveraging the feature reuse and direct connection of each layer in the dense convolution structure. We evaluated the model performance through six evaluation parameters including overall accuracy (OA) and average accuracy (AA) and verified the effectiveness of the model by comparing it with popular convolutional neural network models. Experimental results show that the identification accuracy of DAEDN is 98.31%. Experiments proved that DAEDN enhanced ability to extract forage features, improved identification accuracy, and offered a new approach for the identification research of forage hyperspectral images.
1. Introduction
Grasslands play a crucial role in China’s economic development through climate regulation, water conservation, and soil protection [1,2]. In addition, grasslands provide abundant forage resources for livestock, thereby supporting animal husbandry. Within grassland ecosystems, forage plants represent a diverse array of plant resources [3,4], characterized by strong regenerative capacity and high contents of trace elements and vitamins. They serve as an important feed source for animal husbandry. Forage plants also contribute to improving the grassland ecological environment by preventing soil erosion, maintaining soil moisture, conserving water resources, and combating desertification [5].
Currently, global forage research focuses on improving quality and yield, intelligent monitoring, ecological conservation, and integrated crop–livestock systems, forming a multidisciplinary and multi-scenario research framework [6,7]. In temperate pastoral regions, efforts emphasize ecological improvement of forested pastures, optimizing forage community structures, and enhancing feed quality. Tropical forage research centers on intelligent monitoring and mixed cropping, utilizing multispectral remote sensing combined with machine learning models to non-destructively and accurately predict forage biomass and nutritional quality, thereby establishing a comprehensive intelligent decision-making system for grazing nutrition. Global forage research is characterized by intelligence, ecological sustainability, and precision, driving further development of grassland animal husbandry [8,9].
The cultivation and research of high-quality forage seeds in China began relatively late, resulting in a shortage of superior forage varieties and a heavy reliance on imports. Facing a shortage of over 40 million tons of high-quality forage, China urgently needs to address key issues related to forage germplasm resources, breeding, genetics, and other critical areas. It is essential to develop high-yielding, high-quality forage varieties that are well suited to the country’s diverse regions and environmental conditions. Accurate forage identification is critical for this endeavor, as different forage varieties exhibit distinct growth habits and nutritional values. By accurately identifying forage germplasm resources, researchers can gain insights into the characteristics, growth requirements, genetic factors, and other essential information of different forage varieties [10]. This knowledge enables targeted improvement, breeding, and cultivation practices to enhance forage quality and yield, increase the utilization rate of high-quality forage, and meet the demands of the livestock industry [11,12]. Currently, forage identification relies heavily on manual experience and traditional methods, resulting in low accuracy and inefficiency in the rapid assessment of large forage areas. Therefore, rapid and accurate identification of grassland forage is of great significance for the research, development, cultivation, and planting of forage resources.
Hyperspectral imagery (HSI) has become an important tool in agricultural monitoring and analysis. Hyperspectral images combine spatial and spectral information, providing continuous, high-resolution, multi-band image data [13,14,15]. HSI can capture spatial information in the X and Y dimensions, as well as spectral information in the Z dimension, thereby enhancing the detection and identification of objects [16,17]. It has been widely used in food safety [18], agricultural development [19], aerospace [20], environmental monitoring [21], and other fields. Xu [22] introduced the MSR-3DCNN model, which expanded the concepts of multi-scale features and convolution by incorporating the spectral dimension. This model used three-dimensional convolution and residual connections, effectively leveraging spectral band information. Qing [23] proposed the 3DSA-MFN model, which integrated spatial and spectral features of feature maps through three-dimensional multi-head self-attention. By enhancing the three-dimensional multi-head self-attention mechanism, they achieved superior results on public datasets. Xue [24] employed partial least squares discriminant analysis (PLS-DA) and support vector machine (SVM) modeling to analyze hyperspectral samples of sandalwood-like rosewood. The classification model, which combined SVM with normalized preprocessing, achieved a prediction accuracy of more than 99.8%.
Deep learning learns feature representations and data patterns by constructing deep neural network models. It has been successfully applied in various fields, such as image processing, speech recognition, and natural language processing [25,26,27,28]. Dense convolutional network, or DenseNet, is a neural network architecture in which each layer is connected to other layers in a feed-forward manner. Each layer receives additional input from all preceding layers and passes its features to all subsequent layers, ensuring maximum information flow throughout the network [28,29,30]. Kuang [31] used DenseNet to develop a model for single-image super-resolution tasks. This model can learn the mapping relationship between low-resolution and high-resolution images and generate high-resolution images from low-resolution inputs. The study demonstrated promising results across various datasets. Liu [32] presented a cloud detection method for remote sensing images that incorporates an attention mechanism. After augmenting samples with cloud labels and applying preprocessing, they used DenseNet as the model and incorporated dilated convolutions to enlarge the receptive field. The detection accuracy for remote sensing cloud images exceeded 95%. Liang [33] proposed a novel classification approach based on a multi-scale densely connected convolutional network and a bidirectional recurrent neural network with an attention framework. DenseNet was used to extract multi-scale spatial information and exploit spatial feature correlations within convolutional layers, while the recurrent network captured spectral correlations across the continuous spectrum.
The attention mechanism focuses on information that is most relevant to the current task. It can efficiently learn feature weights, focus on important information, and guide the network toward regions that require greater attention [34,35,36]. Numerous studies have integrated attention mechanisms with DenseNet to strengthen feature extraction capabilities and improve image recognition accuracy. Zhang [37] combined DenseNet and an attention mechanism within a CNN, using multi-scale convolution and three-dimensional convolution for feature extraction, followed by dense analysis and weighted feature processing. Zhang et al. [38] proposed a Transformer-CNN-based method for alpine meadow condition recognition. The proposed framework integrates UAV imagery with the Am-mask segmentation model to automatically identify grassland terrain, vegetation abundance, and degradation conditions. Wang [39] proposed the Gradient Aggregated Residual Dense Block, which incorporates Sobel and Laplacian operators to preserve both strong and weak texture features. They then introduced spatial and channel attention mechanisms to refine the channel and spatial information of feature maps, thereby enhancing the model’s ability to capture information. Peng [40] proposed Siamese NestedUNet with Attention Feature Fusion (SNAFF), a network based on dense connections and attention feature fusion. This architecture extracts multi-level dual-sequential features through a Siamese network and combines global and local information for effective feature fusion. Finally, a deep supervision strategy is implemented to address issues related to vanishing gradients and slow convergence.
Currently, hyperspectral datasets dedicated specifically to forage research remain scarce. Researchers aiming to study forage hyperspectral images must therefore rely on publicly available datasets or satellite remote sensing images, such as the Indian Pines, Pavia University, and WHU-Hi datasets [41,42,43]. However, these datasets contain a variety of land-cover types in addition to forage, including buildings, streets, and crops, and can thus only be used for general land-cover identification and classification, offering limited practical value for forage research. Moreover, although satellite remote sensing images may provide high spatial resolution, they are unsuitable for the detailed identification of forage characteristics because they are acquired from a considerable distance above the ground. Forage plants are typically small, and the areas where they grow often contain multiple species. Hyperspectral images with high spatial resolution are therefore necessary to accurately capture the color, shape, and other features of forage. To address these issues, we collected near-ground hyperspectral images of forage in the field and established a dedicated forage HSI dataset.
Existing studies on hyperspectral images generally require image preprocessing to mitigate noise and atmospheric interference [44,45]. However, preprocessing can lead to information loss, hindering the analysis of edges and fine details and consequently reducing identification accuracy. In view of these limitations, and building upon the near-ground forage HSI images we acquired in the field, we propose a novel Dual-attention Auto-Encoding Dense Convolution Network (DAEDN) for forage HSI image identification. This attention encoding mechanism can effectively enhance the feature extraction ability of the data and improve the learning and recognition performance of forage grass data. DAEDN not only improves the accuracy of grassland forage identification and classification efficiency, but also provides theoretical methods and technical support for forage variety breeding and improvement, as well as a data foundation and technical support for grassland monitoring.
DAEDN first computes feature weights along the channel and spatial dimensions and then ranks the weighted features. The encoder is subsequently employed to analyze the nonlinear structure of the data, reconstruct the data, reduce dimensionality, and eliminate noise. This integration enables preprocessing to be embedded within the model, thereby improving data utilization efficiency. Subsequently, the dense connections and feature reuse mechanism of the model are leveraged to reduce the number of network parameters and computational cost, enhance network efficiency, and support high-precision identification of forage HSI.
Our main contributions are as follows:
- We acquired high-resolution forage HSI images in the field and constructed a forage hyperspectral dataset.
- We propose a novel method that integrates preprocessing into the network. By calculating feature importance, reducing data dimensionality, and removing noise, the proposed method achieves preprocessing effects within the model.
- DAEDN not only exploits the advantages of dense connections and feature reuse but also enhances search capability and data utilization efficiency through the attention-based encoder mechanism. Furthermore, it strengthens data representation in both channel and spatial dimensions.
2. Experiment Data
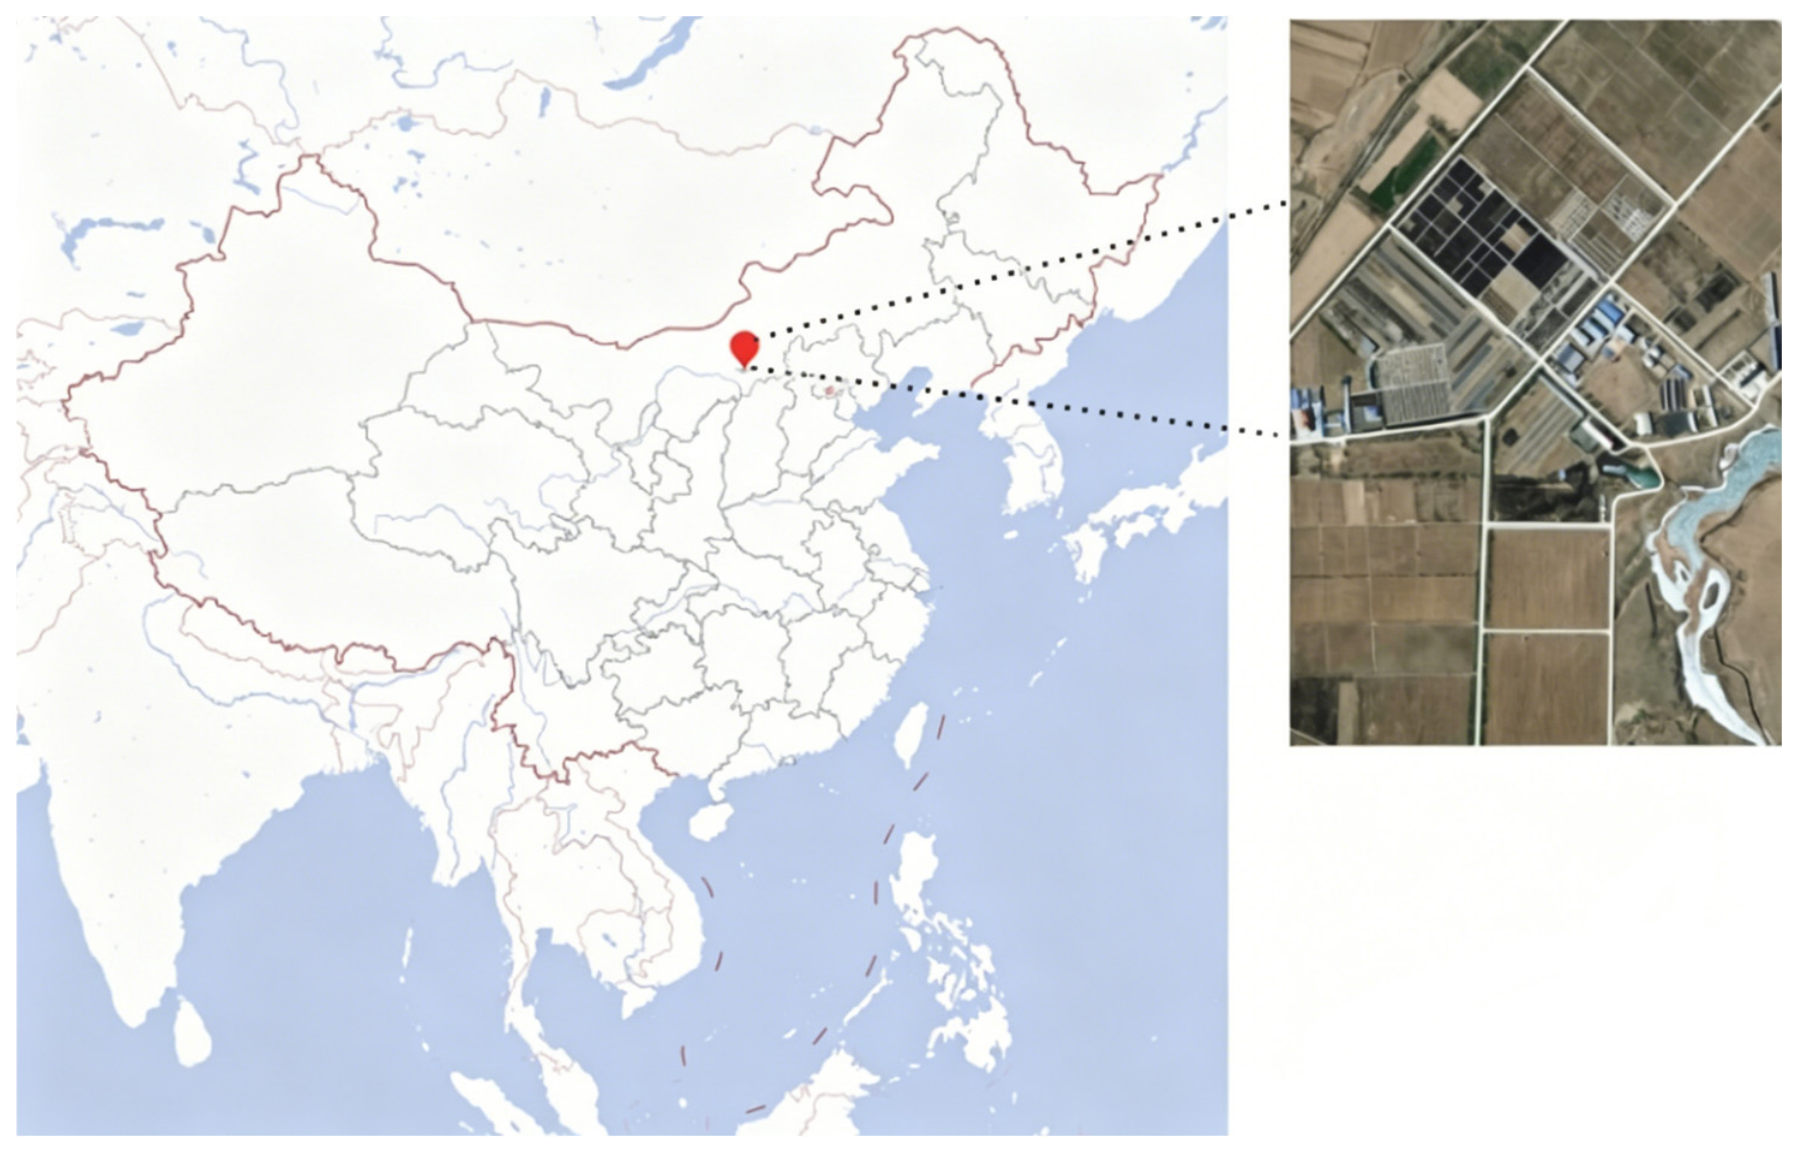
Field near-ground forage hyperspectral images were captured from August 2020 to August 2022 at the Chinese Academy of Agricultural Sciences Grassland Research Institute (CAAS), Hohhot, China (40°34′ N, 111°45′ E, Figure 1). This location spans 371.27 hectares and is characterized by forages, legumes, crops, and forests, with an altitude of 1044 m. The average annual precipitation is 500 mm, with an average annual temperature of approximately 6 °C.
Figure 1.
Study area.
The forage types collected encompass 10 varieties, including Agropyron mongolianum and Old wheat awn. The Opti HyperSpec®PTU-D48E hyperspectral imager (Hohhot, China)was utilized to capture near-ground images, operating within a spectral range of 400 nm to 1000 nm. The imager was mounted on a tripod during the image acquisition process. Prior to capturing images, equipment parameters were configured, setting the initial lens angle to 35°, exposure time to 300 ms, and scan length to 25°. The distance between the lens and the grass ranged from 50 cm to 100 cm, with each image containing only one type of grass. Subsequently, an image W was taken, and the collected absolute image I was transformed into a hyperspectral image X (Equation (1)).
Each image takes approximately 4 min to capture and is scanned frame by frame from left to right. The quality of the imaging process can be affected by weather conditions such as lighting and wind speed. As a result, we conduct the shooting between 9–14 o’clock when there is minimal wind and ample natural light available. Thus, image quality is effectively enhanced, and the impact of weather conditions and climate is reduced. At the same time, since we use ground-based equipment to collect data, interference from other factors is minimal, resulting in higher imaging quality.
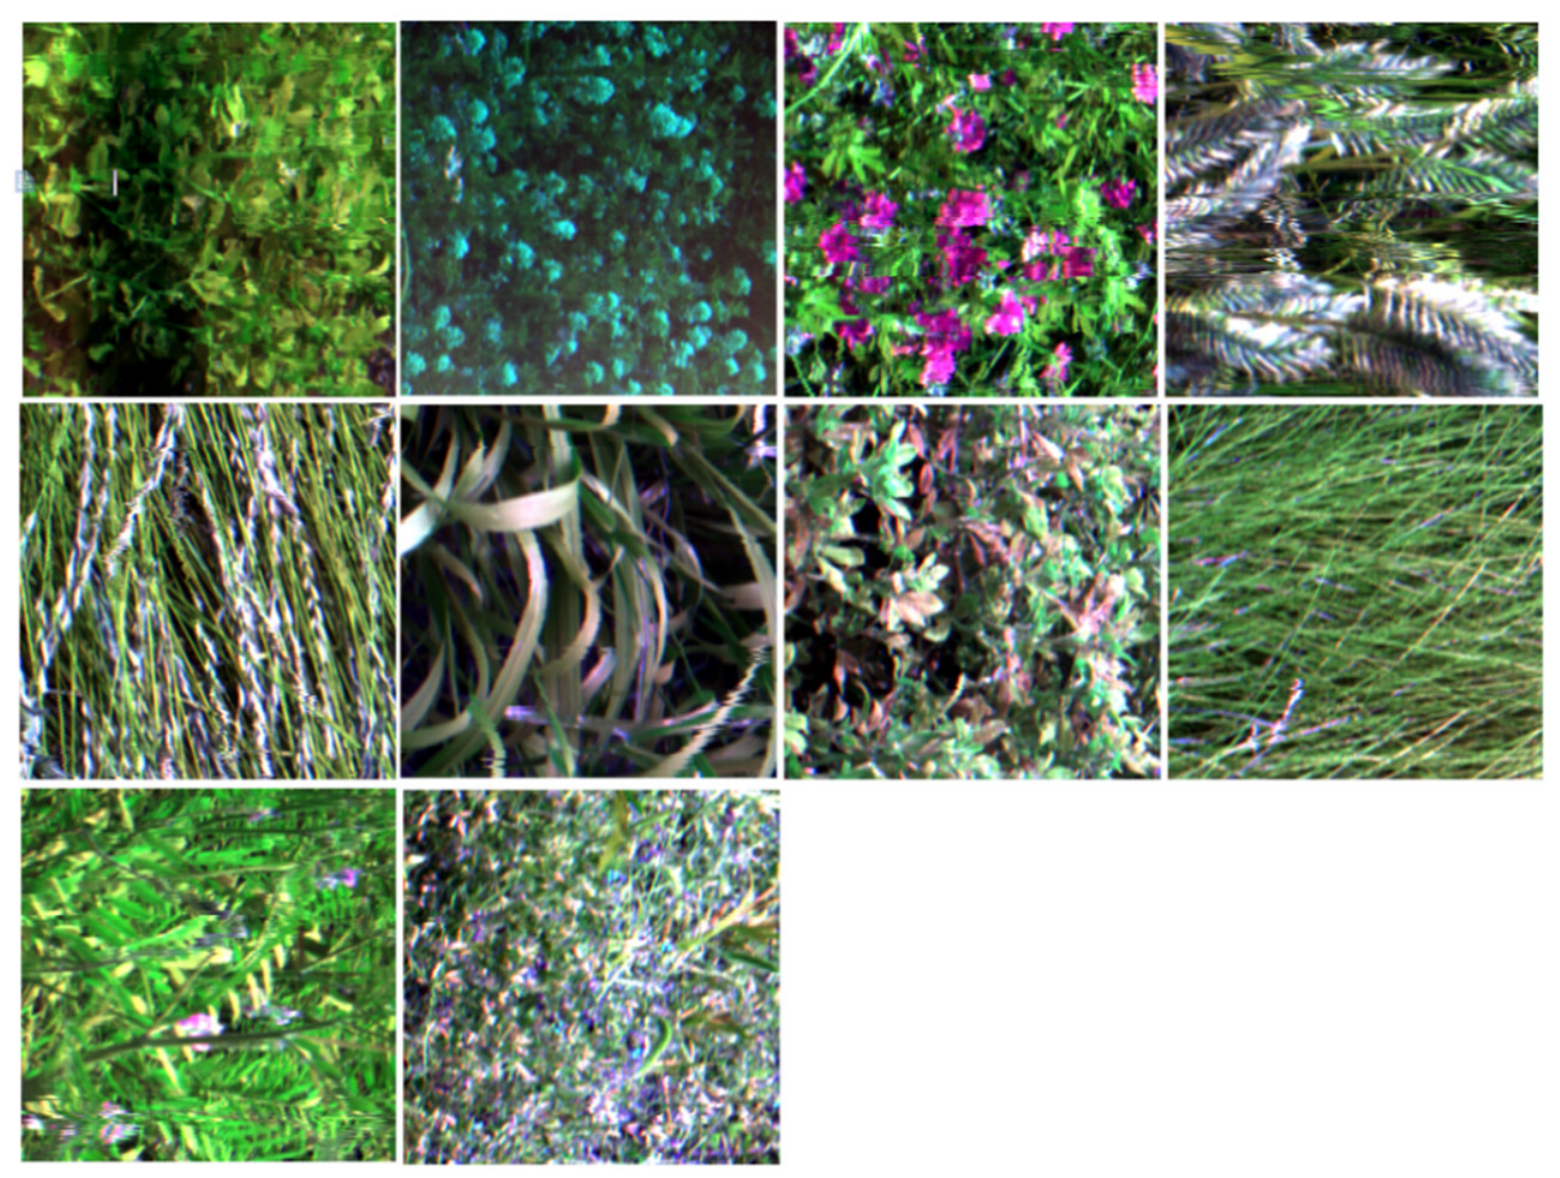
Prior to capturing the images, it is essential to calibrate the initial black and white striped image. This involves setting the exposure time to 300 ms and identifying relatively clear black stripes as the initial DN value. Subsequently, adjustments can be made to the exposure time and focus to enhance the clarity of the stripes. Once the black stripes are distinctly visible and the DN value falls below 3000, the images can be acquired. Following numerous iterations of adjustments, a total of 75 hyperspectral images of near-ground grass were obtained, each with dimensions of 1004 × 972 × 125. Here, 1004 represents the width, 972 denotes the height, and 125 signifies the number of bands. The spatial resolution of these images is recorded at 6.5 cm. Figure 2 illustrates a false color image showcasing 10 different types of forage.
Figure 2.
Hyperspectral pseudocolor images of forage.
Current research on hyperspectral images has primarily focused on pixels, while some studies have delved into image appearance and other characteristics. Our specific focus is on extracting texture, color, size, and other relevant features from forage images. Given that our images are near-ground hyperspectral images, each image can only capture one type of forage, limiting the number of available samples. To address this limitation, we employed cropping and rotation operations to enhance sample size. We established a cropping frame of size 40 × 40 and randomly cropped 1000 images from each of the 10 types of forage, resulting in a total of 10,000 forage hyperspectral images. Subsequently, we selected 10 forage images and performed 90° and 180° rotations, generating a total of 20,000 forage hyperspectral images sized 40 × 40 × 125, where 40 represents the width and height of the image, and 125 denotes the number of bands. The forage data information is detailed in Table 1.
Table 1.
Information table of forage hyperspectral image.
We use Principal Component Analysis (PCA) as the preprocessing method. PCA identifies the primary directions of change within the data and projects the data along these directions, effectively reduces the dimensionality of the dataset while preserving a significant amount of the original information, eliminating redundant data and noise, and maintains the integrity of the original data as much as possible.
3. Methods
In traditional HSI identification and classification research, preprocessing plays a vital role in removing redundancy and suppressing interference. However, this process may also result in the loss of certain features, potentially leading to reduced accuracy. All forage images used in this study were acquired in the field. Because these images were captured at close range, noise and forage features are difficult to separate, even in the absence of other major interference factors. To address these issues, we propose a dual-attention Auto-Encoding dense convolution network (DAEDN) that enhances the connections between channel and spatial information. The proposed network computes weights along both dimensions, strengthens the feature representation capability of channel and spatial information, suppresses unimportant information, and integrates the preprocessing steps into the model.
3.1. Dual-Attention Auto-Encoding Dense Convolution Network
The Dual-attention Auto-Encoding Dense Convolution Network (DAEDN) incorporates dual attention mechanisms for both channel and spatial features. It simultaneously calculates feature weights in the channel and spatial dimensions and improves feature performance by outputting weighted features. In addition, the network uses an Auto-Encoding to learn nonlinear manifold data, which helps capture the underlying structure of the data and facilitates data reconstruction. The Auto-Encoding also assists in dimensionality reduction and denoising, serving as a preprocessing step to enhance data utilization efficiency.
Subsequently, the processed images are fed into dense convolution layers for further feature extraction, focusing on detailed characteristics such as edges and textures. The dense convolutional structure enables direct connections between layers, improving data transmission and feature reuse while reducing model parameters. Overall, DAEDN enhances generalization ability by effectively learning and aggregating information within the target area.
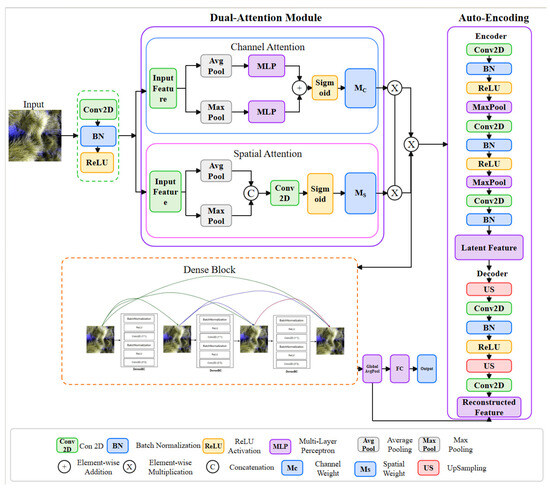
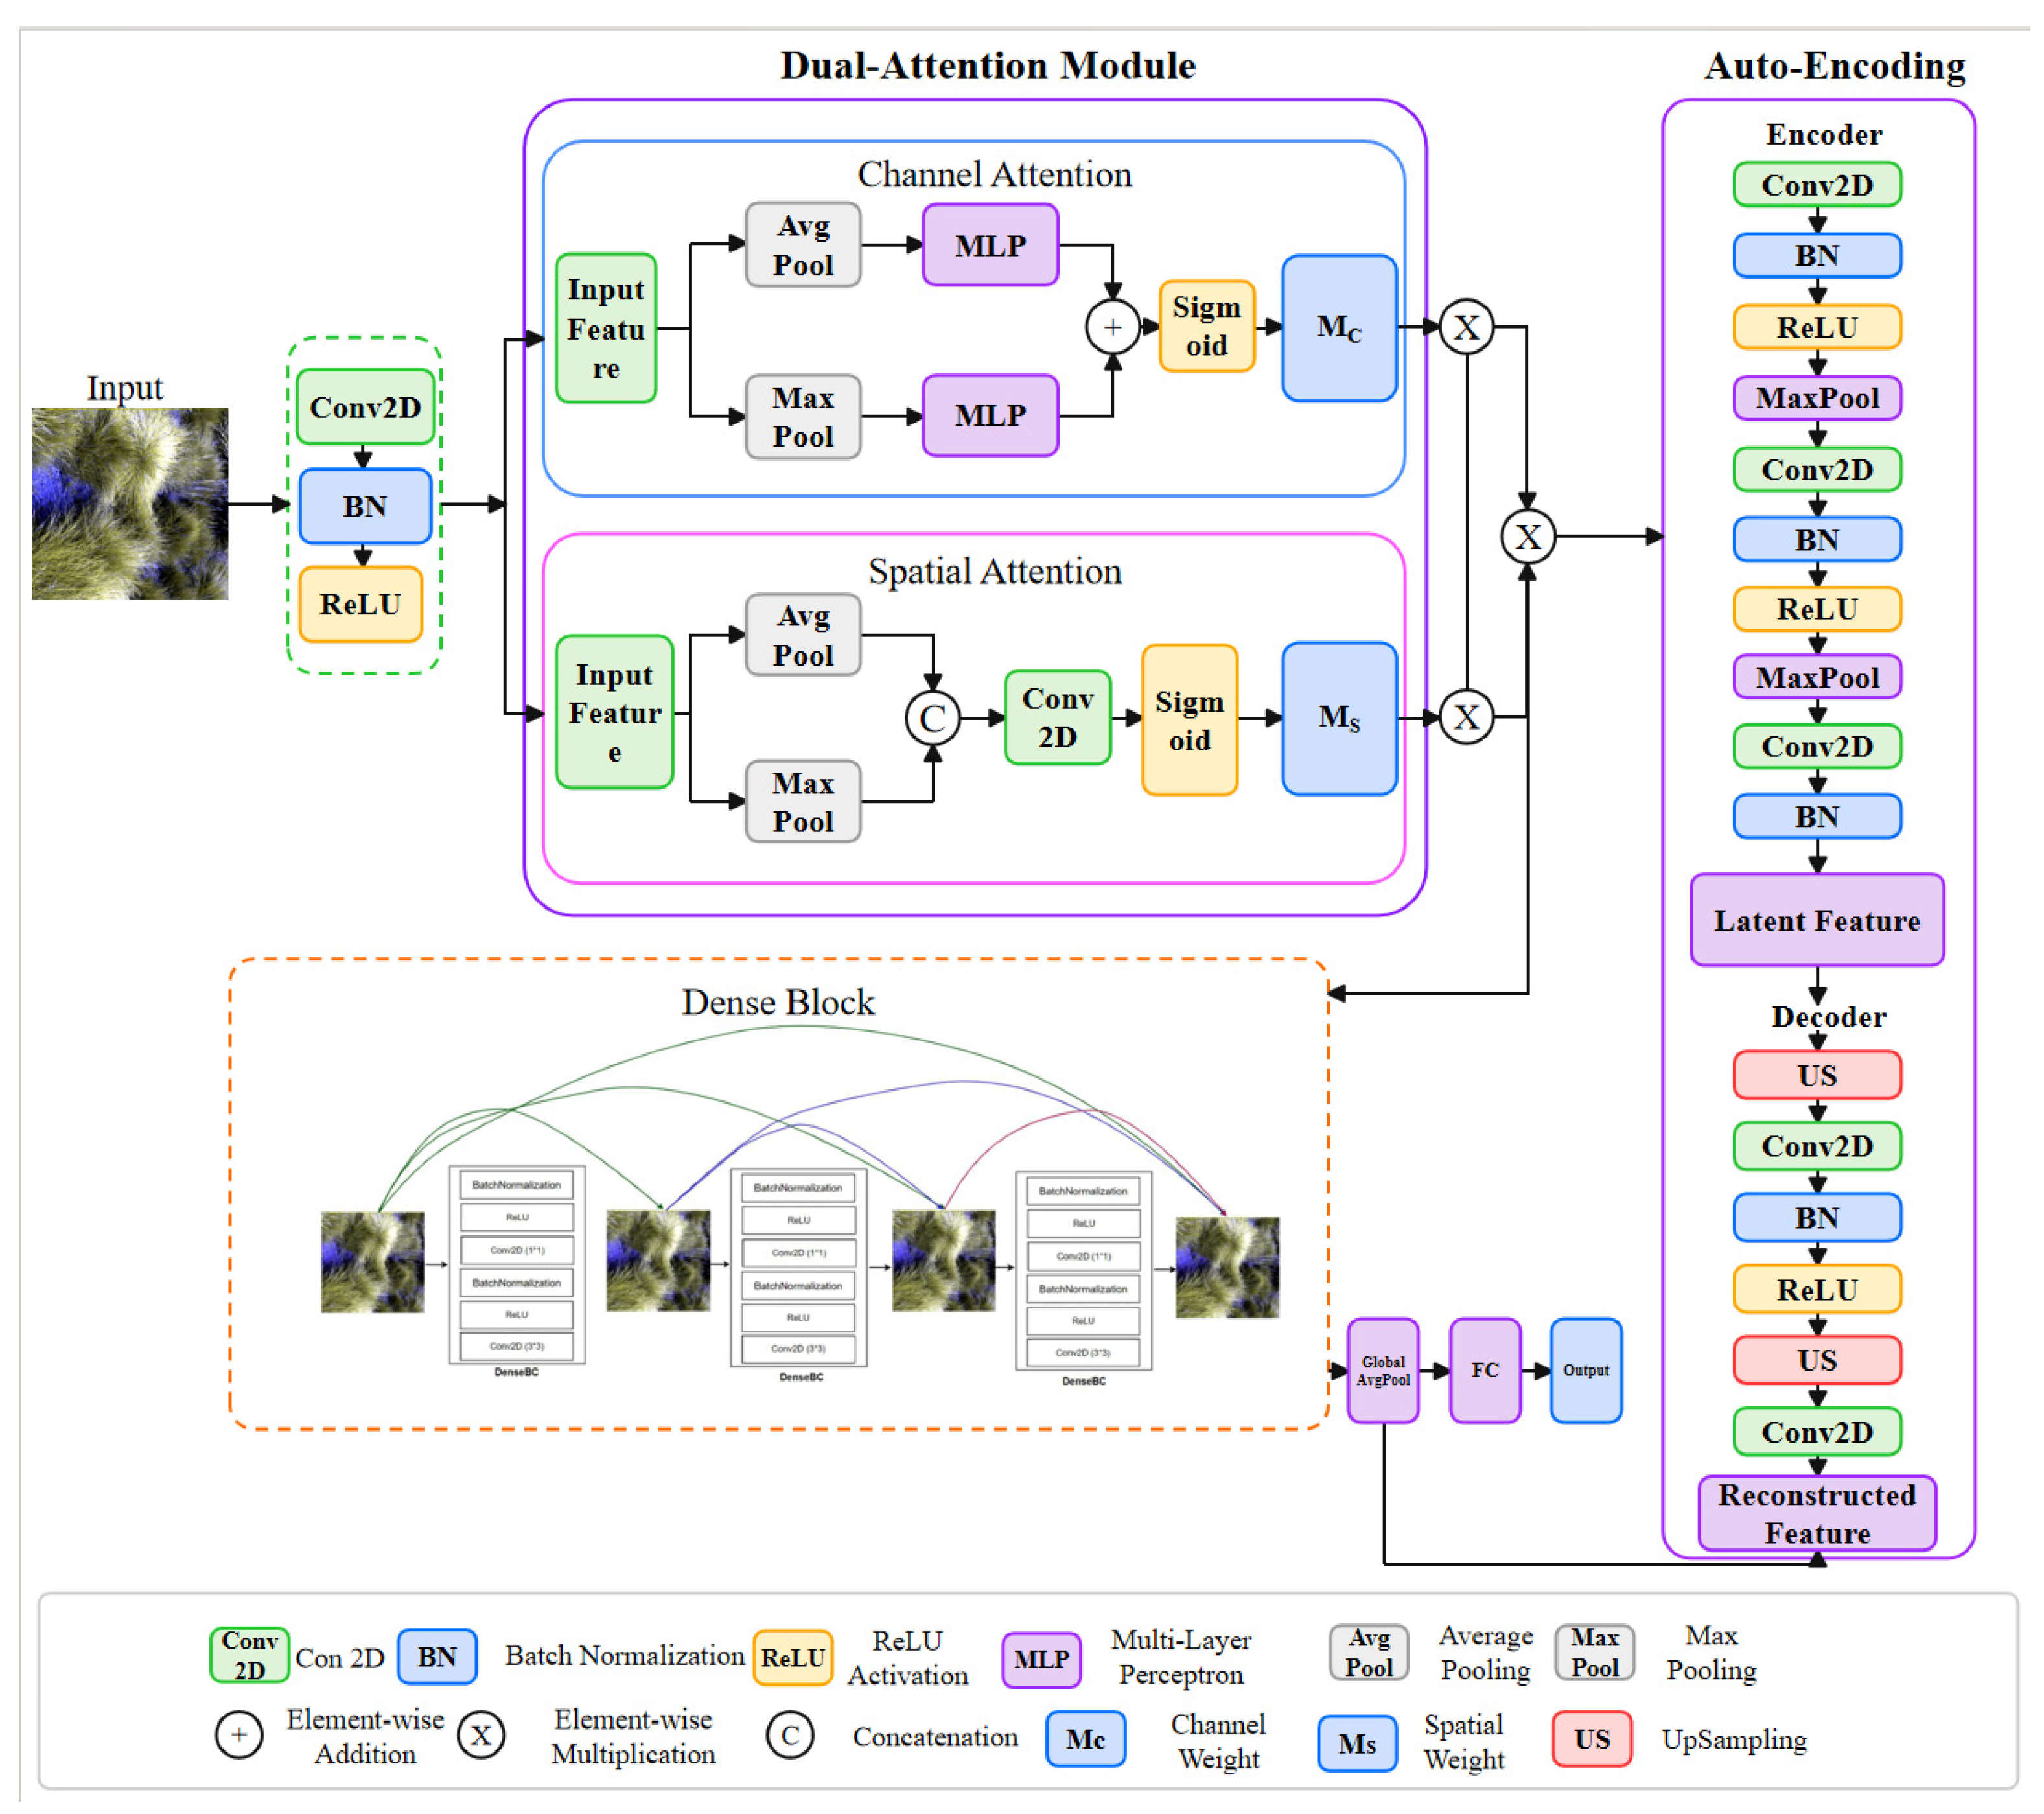
As shown in Figure 3, DAEDN first uses a 2D convolution layer to extract image features. This layer does not perform dimensionality reduction or compression, ensuring that the shape and dimensions of the output data remain consistent with those of the input data. Subsequently, channel attention is applied to obtain weighted channel features, followed by the generation of features with different dimensions through max pooling and average pooling. The data are then fed into a multi-layer perceptron (MLP) to learn dependencies between channels and output channel-weighted features.
Figure 3.
Schematic diagram of DAEDN.
Meanwhile, the data undergo spatial attention to generate weighted spatial features. The spatial weights of the feature maps are normalized and multiplied by the feature maps to obtain spatially weighted features. The weighted channel and spatial features are then integrated, and the data are reconstructed and dimensionally reduced by the Auto-Encoding through a 7 × 7 convolution layer. The use of a larger convolution kernel at the beginning of the network provides a larger receptive field, thereby reducing the computational burden while extracting image features.
Finally, Dense Blocks are used to extract weighted features, followed by Transition layers for downsampling. This approach enables the network to focus on key features for classification, enhance feature representation, and suppress unnecessary information. The Dense Block uses dense connections to facilitate direct feature transfer between layers and improve transmission efficiency. Each Dense Block follows a BN + ReLU + 1 × 1 Conv + BN + ReLU + 3 × 3 Conv structure. Finally, the classification results are obtained through the softmax layer.
3.1.1. Dual-Attention Mechanism
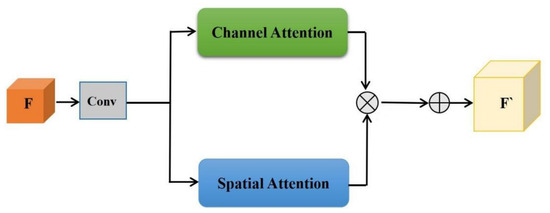
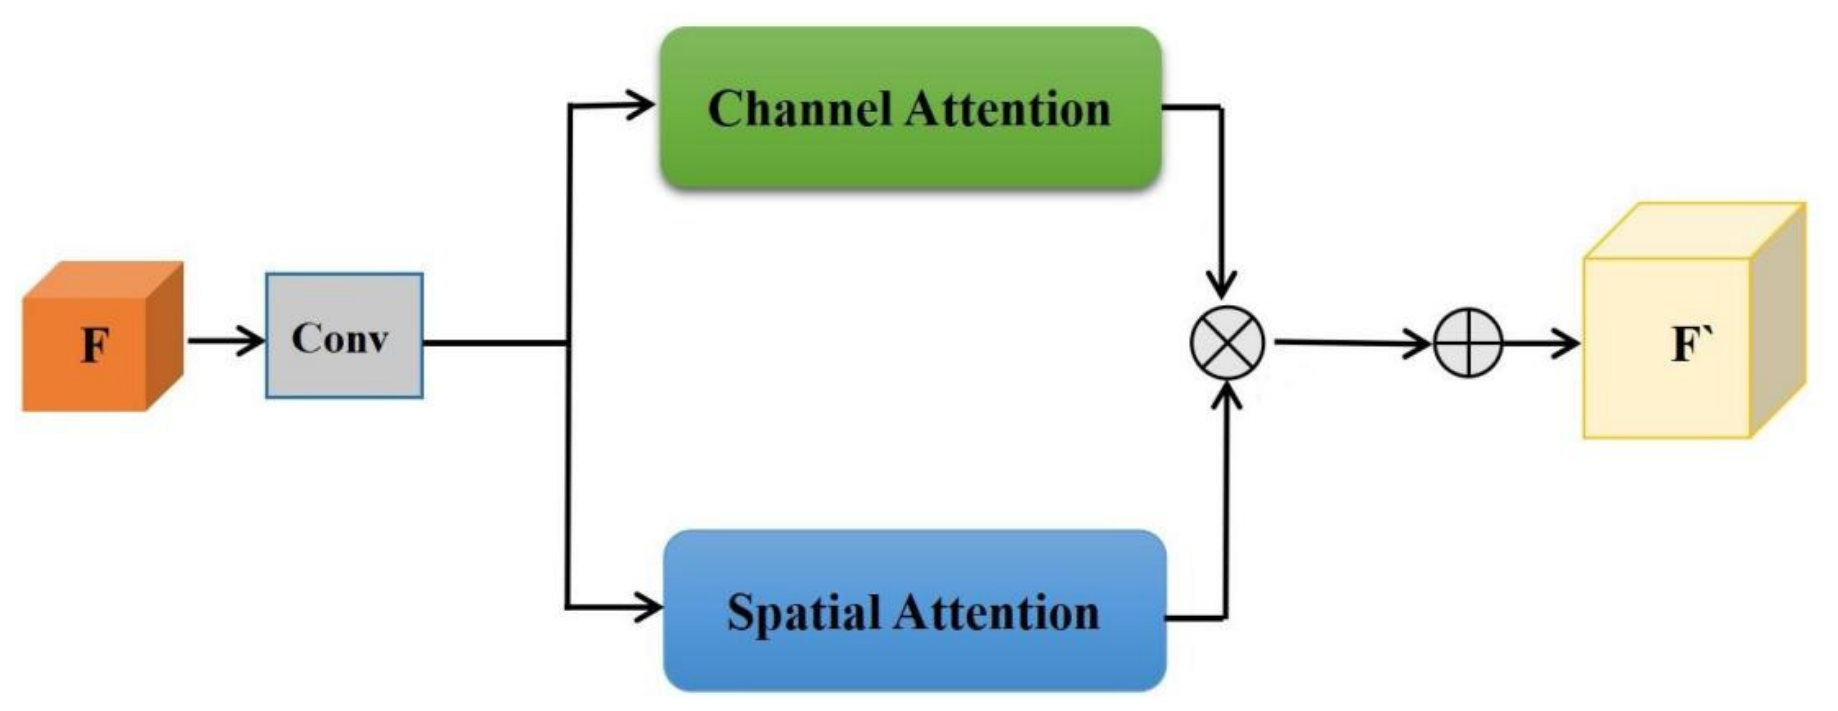
The dual-attention mechanism (Figure 4) is a lightweight structure that incorporates both channel attention and spatial attention. It calculates weights along the channel and spatial dimensions in parallel and then multiplies these weights with the feature maps to effectively refine features [46,47]. Yin [48] introduced a hybrid CNN-Transformer architecture called CTCANet, which embeds image features into a token sequence and passes them through a cascade decoder that combines shallow fine-grained features. Zhang [49] proposed a DFL-UNet + CBAM model that integrates the CBAM mechanism to adjust the weight relationships among features in the effective feature layer extracted by the backbone network and the initial upsampling result. These models generally follow a sequential structure from channel attention to spatial attention by connecting the two attention mechanisms in series.
Figure 4.
CBAM schematic.
In contrast, we connect the two mechanisms in parallel. From the perspectives of channel and spatial information, this design improves information complementarity and captures key information more comprehensively and accurately. The dual attention mechanism reduces the computational burden of convolutions by using a limited number of pooling layers and feature fusion operations. Spatial attention enables the neural network to prioritize crucial regions within the image for classification, while channel attention facilitates the allocation of feature channels. By integrating feature information from different dimensions, the model can capture image details more comprehensively and accurately, thereby enhancing its expressive and generalization capabilities.
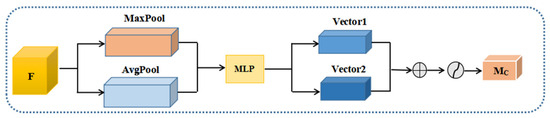
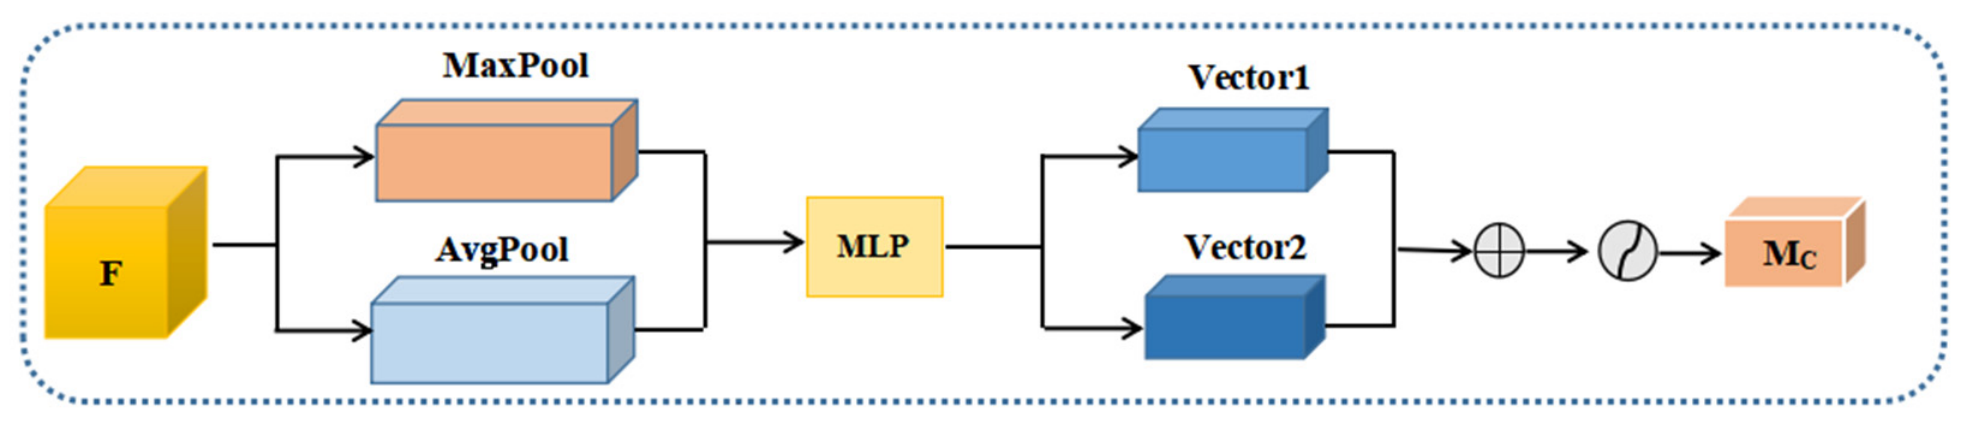
The channel attention mechanism (Figure 5) initially conducts MaxPool and AvgPool operations on the features F, followed by passing them through a MLP to capture channel dependencies. The final step involves multiplying the weights and features by the sigmoid function σ to derive the channel weighted feature Mc.
Figure 5.
Schematic diagram of channel attention mechanism.
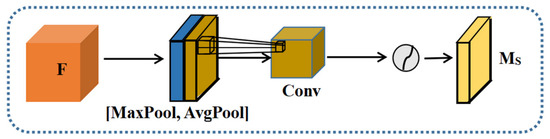
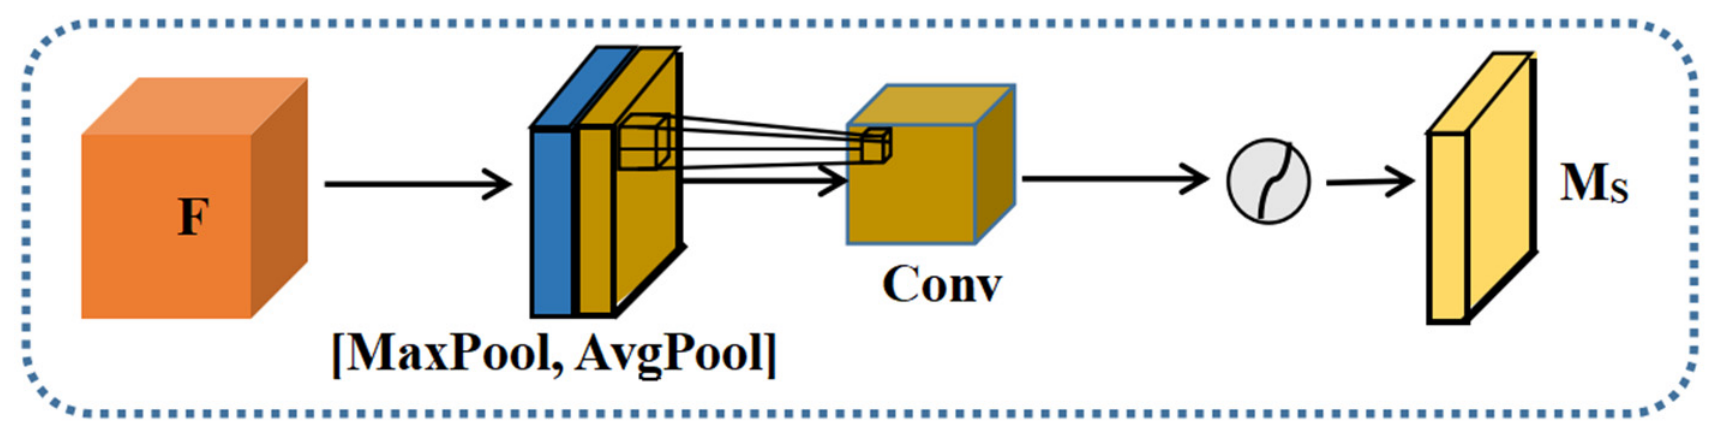
The spatial attention mechanism (Figure 6) also performs MaxPool and AvgPool operations to stack the two pooled feature maps in the spatial dimension and then uses a 7 × 7 convolution kernel to reduce the dimension to a single-channel feature map. The spatial dimension weight Ms is obtained by multiplying the input feature map with the weight.
Figure 6.
Schematic diagram of spatial attention mechanism.
3.1.2. Auto-Encoding
Auto-Encodings [50,51] consist of an encoder and a decoder. The encoder transforms input data into a low-dimensional space by using hidden layers to capture features at different levels. The decoder maps the low-dimensional representation back to the original input space, thereby reconstructing the data. To effectively leverage the weighted features obtained from the attention mechanism, this study incorporates an Auto-Encoding to reduce data dimensionality and remove noise. The encoder analyzes the sorted weighted features, captures features at different dimensions, and reduces data dimensionality. The subsequent network structure is then used to extract image features without increasing dimensionality or reconstructing the data. Therefore, the encoder serves as the key component of the Auto-Encoding module.
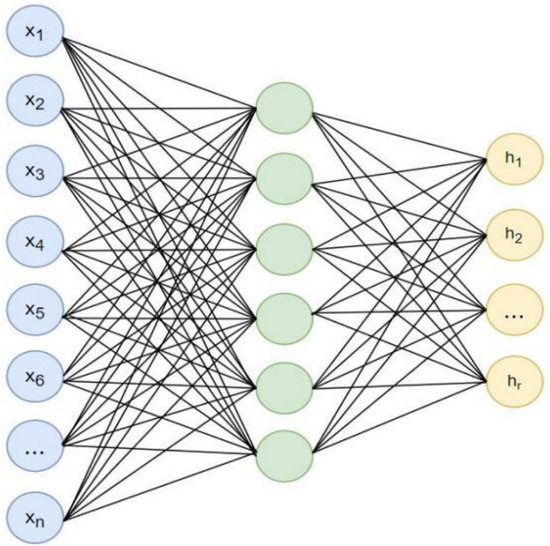
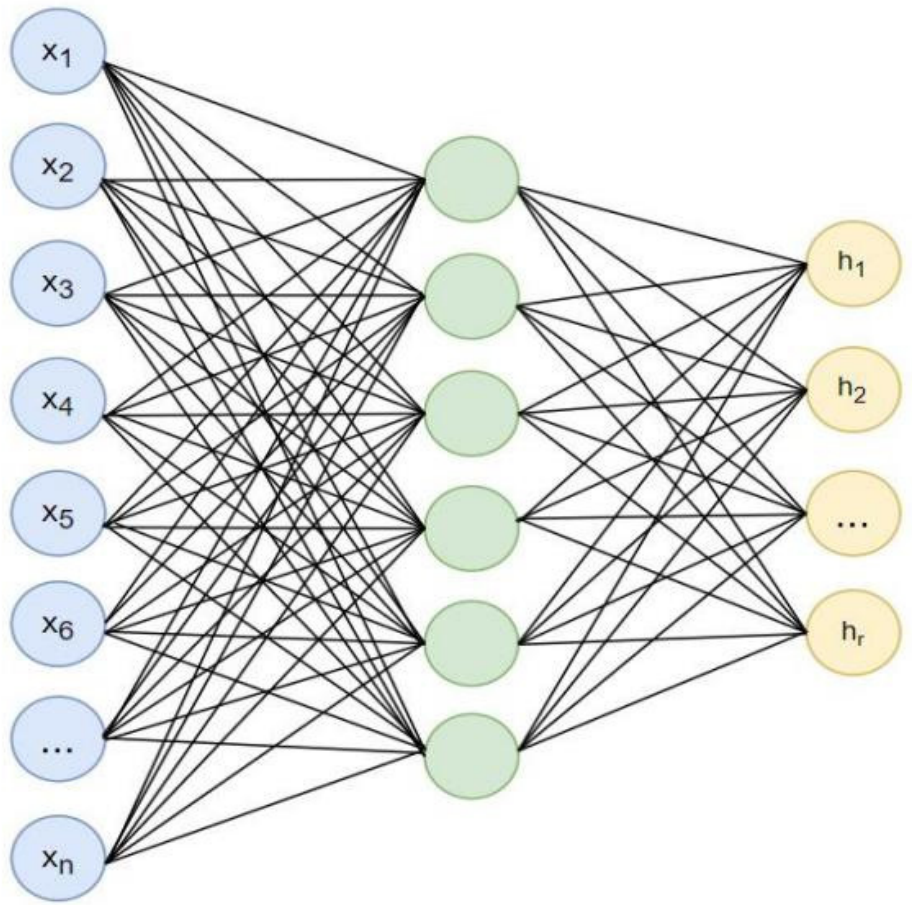
The encoder (Figure 7) consists of a multi-layer convolution neural network. Through forward propagation, it linearly combines weight matrices and bias terms to generate new feature representations. These representations are passed through a nonlinear activation function to produce a low-dimensional representation in the hidden space. The final output captures the encoded important features.
Figure 7.
Encoder diagram.
3.1.3. Dense Block
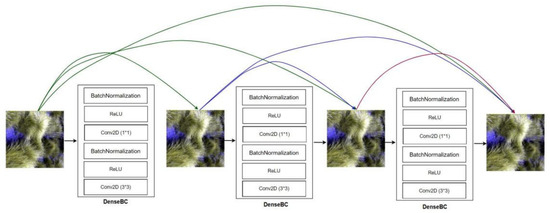
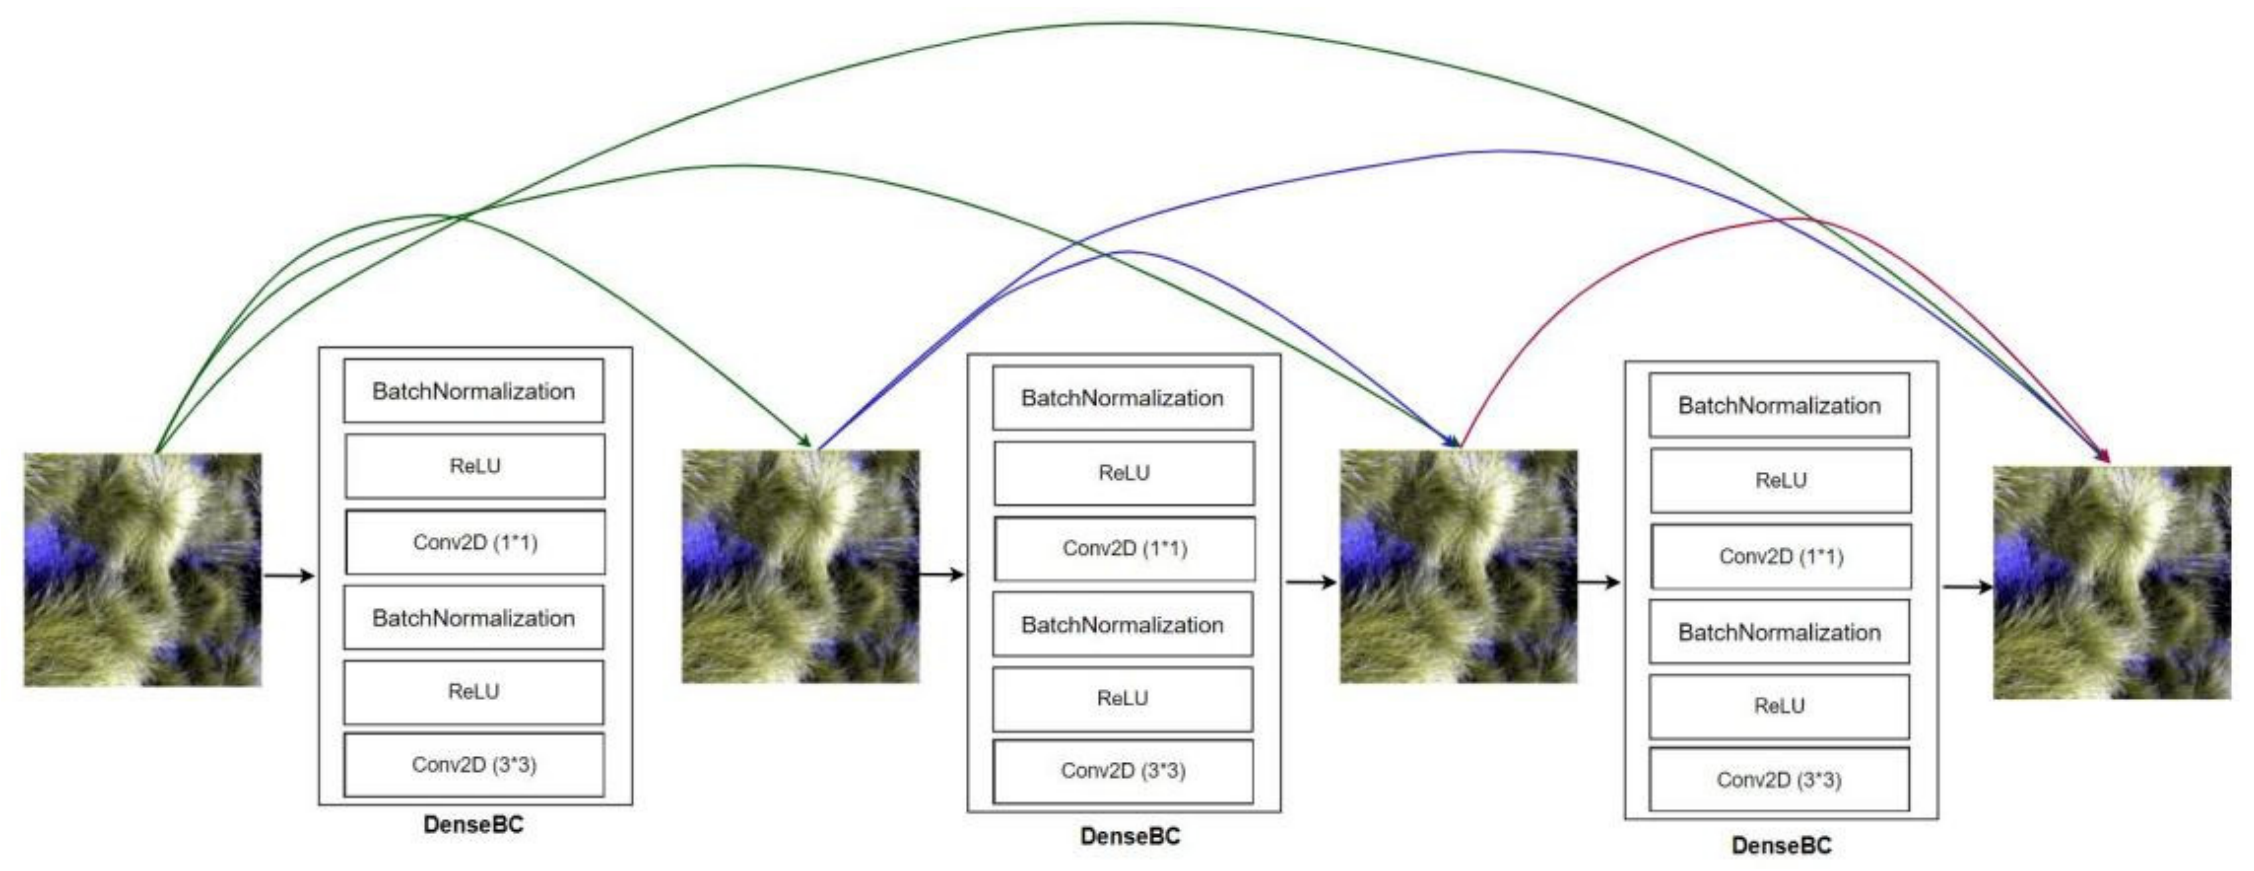
Each layer of Dense Block can obtain additional input from all previous layers and pass features to all subsequent layers, ensuring the maximum information flow between each layer. Dense Block improves information flow and gradients through dense connections and feature reuse. Each layer has direct access to the loss function and the gradient of the original input signal, which facilitates the training of deep networks.
Dense Block adopts DenseBC structure (Figure 8) and is connected by Transition. DenseBC consists of BN + ReLU + 1 × 1 Conv + BN + ReLU + 3 × 3 Conv. A 1 × 1 convolution is added to each original structure, reducing the number of feature maps. Transition consists of 1 × 1Conv + AvgPooling, and the parameters are further compressed through downsampling transition connections. Assuming that the number of feature channels obtained by Transition through the previous Dense Block is m, the Transition layer can generate θ m features, and θ ϵ (0,1] represents the compression coefficient.
Figure 8.
Dense BC diagram.
Dense Block also has an important hyperparameter growth rate: K. Each layer uses K convolution kernels. Assuming that the number of feature channels in the input layer is k0, the number of channels in the Lth layer is k0 + k (L − 1), so the L layer has concat connection. Dense Block is calculated as shown in Equation (4), x is the input information, and Hl is the composite function.
3.2. Comparison Method
The experiment compared four convolutional neural network models: 3DCNN [52], VGG-16 [53], 3DSECNN [54] and CBAM-DenseNet [55]. 3DCNN can extract features in three dimensions, with each feature connected to multiple adjacent features in the previous layer. This enables the model to better capture spectral and spatial features and improves its ability to utilize feature information.
VGGNet increases the number of network layers to 16 or 19, thereby enhancing the expressive capacity of the network. It also replaces large convolutional kernels with multiple smaller convolutional kernels, which improves feature learning capability. 3DSECNN integrates 3DCNN with channel attention to enhance the model’s feature extraction capability. By calculating channel weights, the model highlights channels with higher weights, thereby improving its ability to identify crucial features.
CBAM-DenseNet combines channel attention, spatial attention, and DenseNet. The channel and spatial attention mechanisms are connected sequentially, enhancing the model’s ability to identify important features while leveraging the advantages of dense convolution networks.
3.3. Experimental Evaluation Parameters
The experimental equipment uses Lenovo Savior Y9000P, Inter(R) Core i7-12700H, 32 GB memory, and 64-bit Windows 11 operating system. We train for 100 epochs. Adam optimizer was chosen due to its good interpretability for hyperparameters and ability to adapt to changing learning rates based on both the mean and squared gradient values. The evaluation of the experiment included 6 indicators: overall accuracy (OA), average classification accuracy (AA), Precision, Recall, Kappa, and Time.
OA represents the ratio of correctly classified samples divided by the number of test sample, where TP represents True Positives, FN represents False Negatives, FP represents False Positives, and TN represents True Negatives.
AA represents the average of all classification accuracy rates, C is the total number of categories, Ni+ is the total number of samples of the i-th category, and Nii represents the number of samples that actually belong to the i-th category and are predicted to be the i-th category.
Precision represents the proportion of the true results in the correct samples.
Recall represents the number of correct predictions among samples whose true values are correct.
The Kappa coefficient represents the statistical consistency, po represents OA, pe is the expected accuracy value of random classification, N is the total number of samples, and N+i is the total number of samples predicted to be the i-th category. Time is the training time.
4. Experiment Results and Discussion
4.1. Dataset and Parametric Analysis
4.1.1. Dataset Division
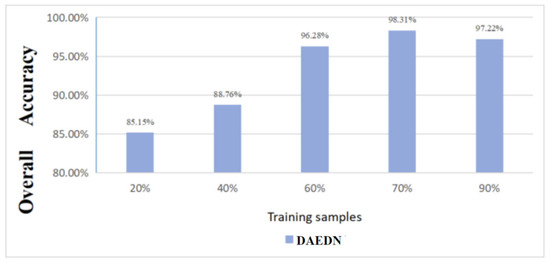
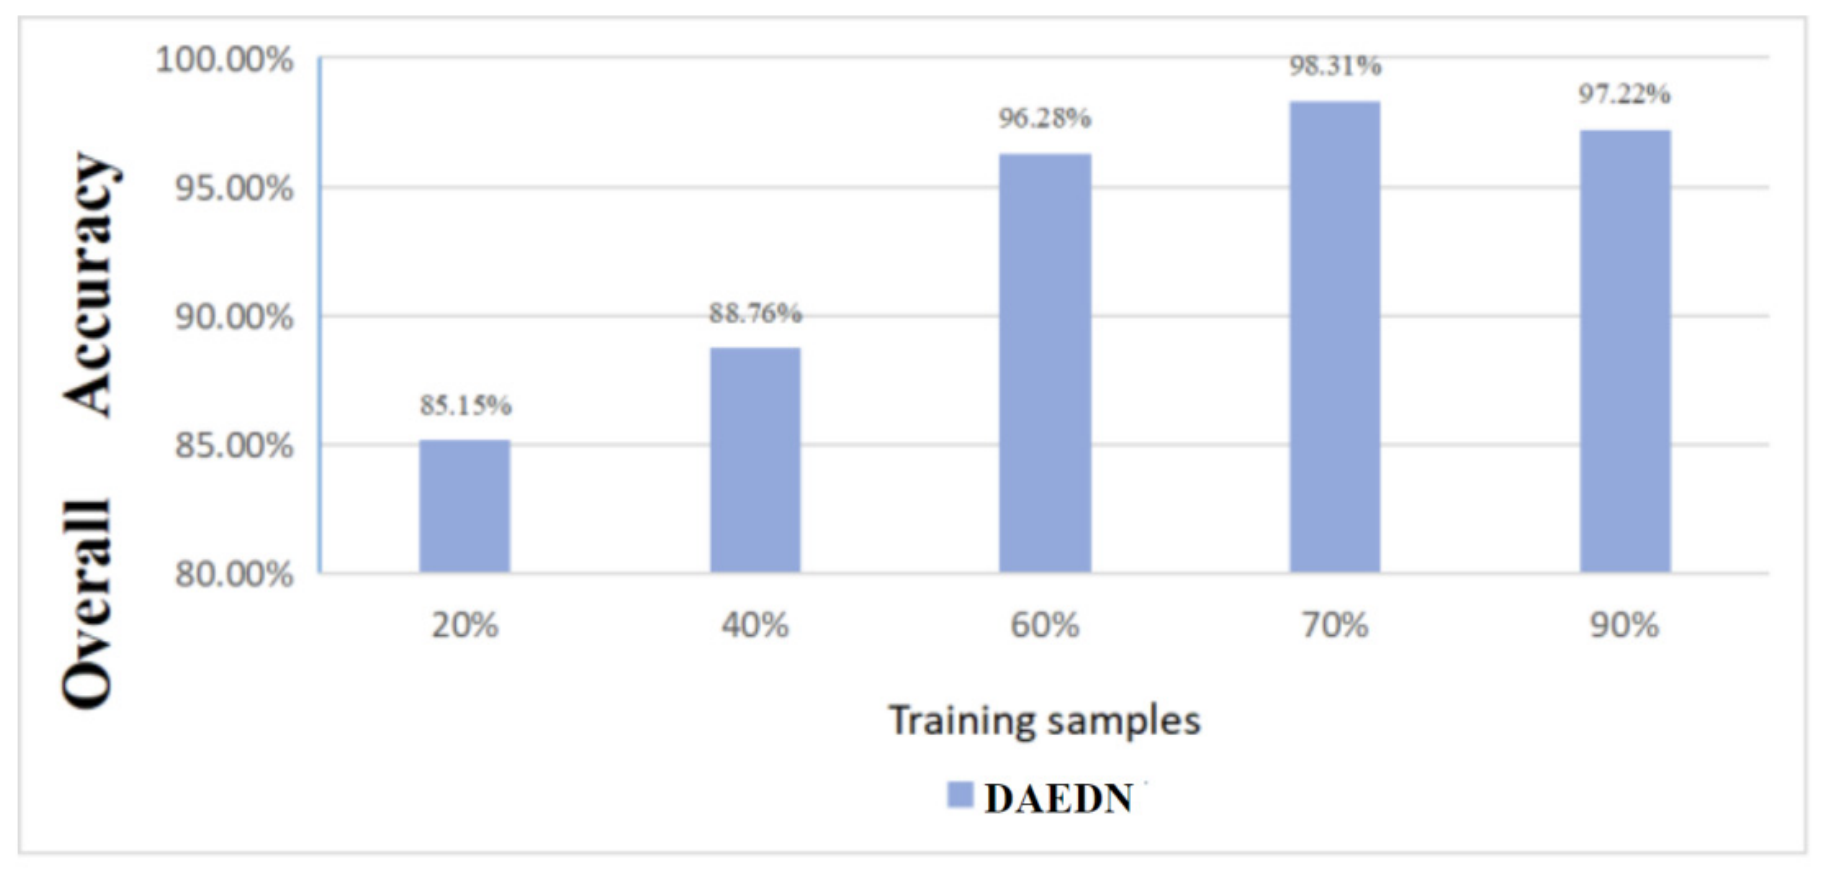
Partitioning the dataset is an important step in evaluating the generalization ability of the model. It is also one of the important factors affecting the experimental results. we divided the dataset into training sets of 20%, 40%, 60%, 70% and 90%, respectively, and conducted experiments to compare their differences. The results (Figure 9) demonstrated that inadequate training samples lead to an inability to effectively train on a large dataset and extract necessary features, resulting in decreased accuracy. Conversely, an excess of training samples significantly slows down the model’s speed, as the surplus data burdens the model and leads to reduced experimental accuracy. Optimal results were achieved when the training set comprised 70% of the dataset, reaching the highest accuracy level. Therefore, we are setting the training set to 70% of the dataset.
Figure 9.
Experimental results of different training ratio data.
4.1.2. Learning Rate
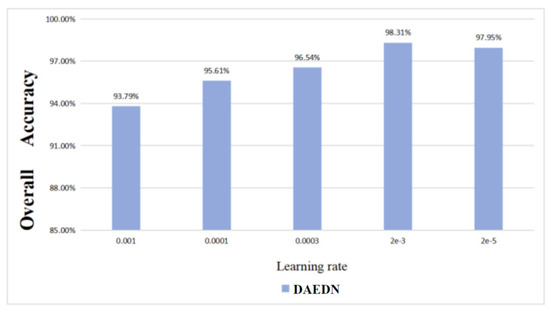
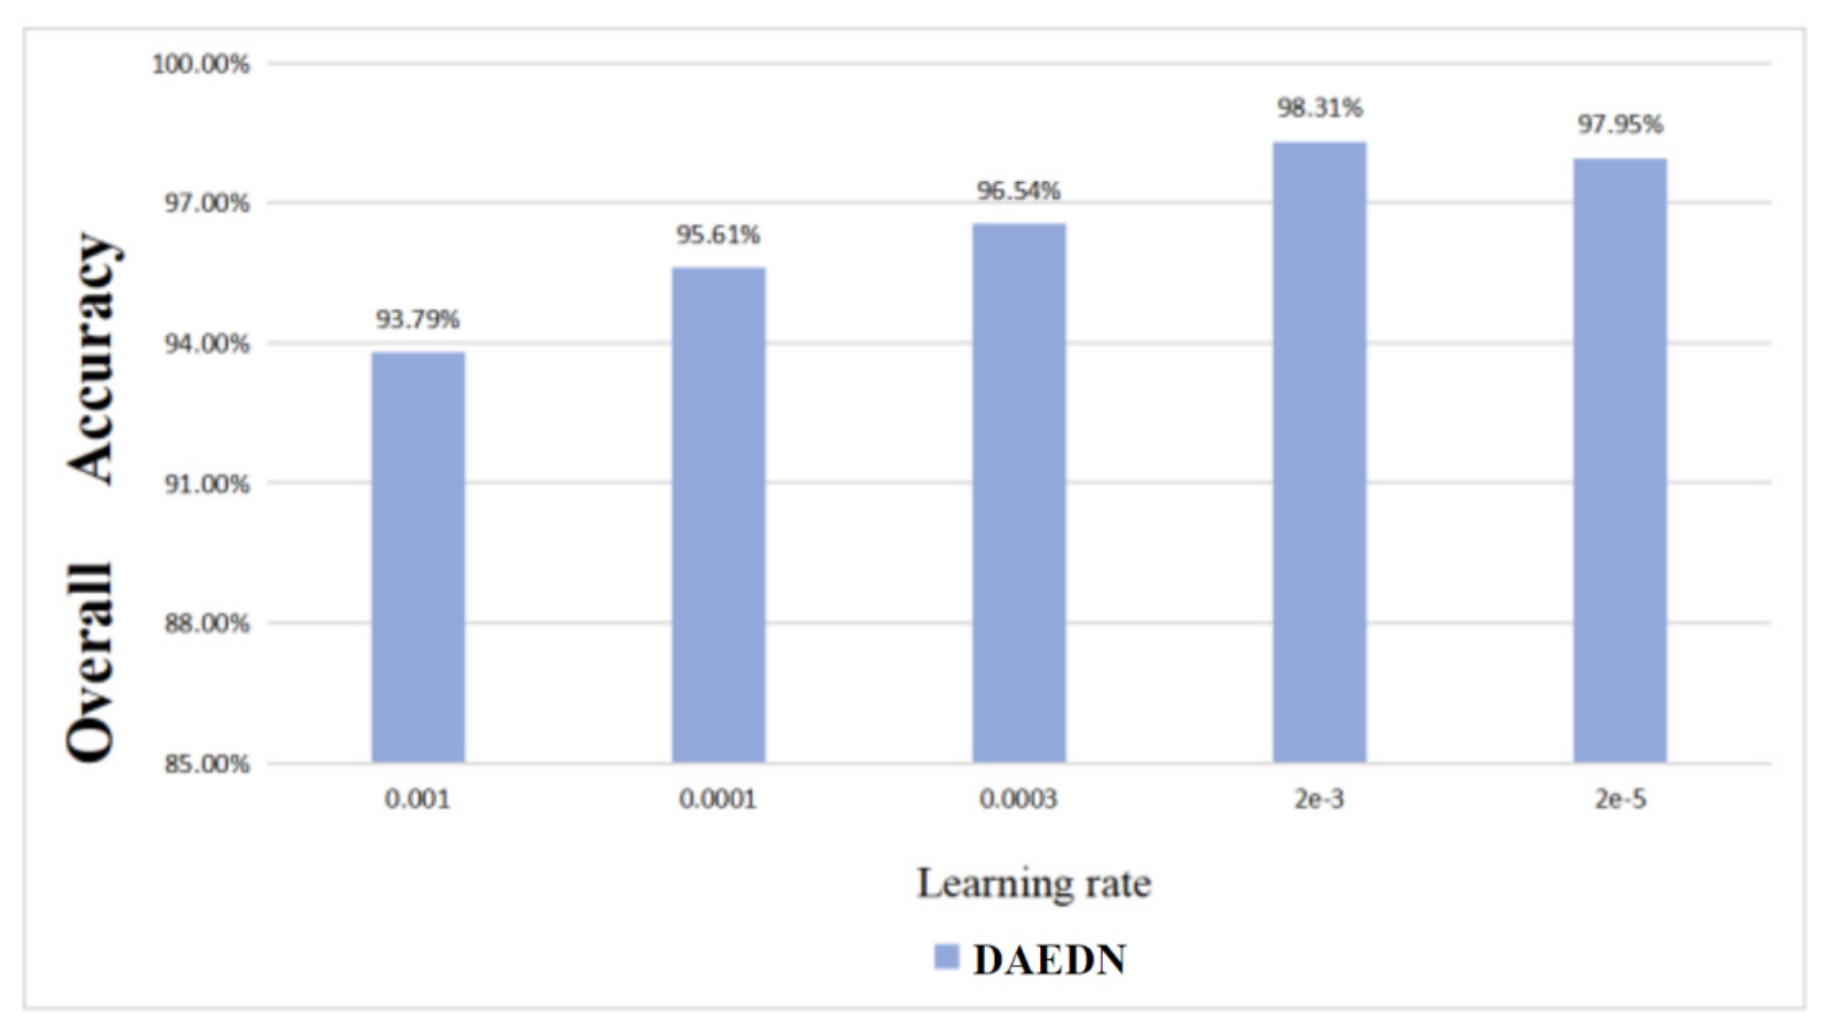
The learning rate determines how quickly the model’s weights are updated during training. If set too high, the model may become unstable or fail to converge, while a too low learning rate can lead to slow training and it will fall into a local optimal solution. Therefore, selecting the appropriate learning rate is essential for model training. In this study, learning rates of 0.001, 0.0001, 0.0003, 2 × 10⁻³, and 2 × 10⁻⁵ were tested. The experimental results (Figure 10) demonstrate that setting the learning rate to 2 × 10⁻³ yielded the best performance and highest identification rate.
Figure 10.
Experimental results of learning rates.
4.1.3. Batch Size
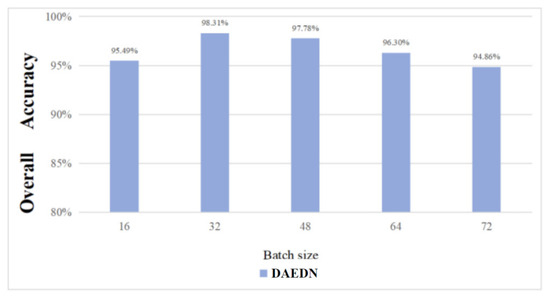
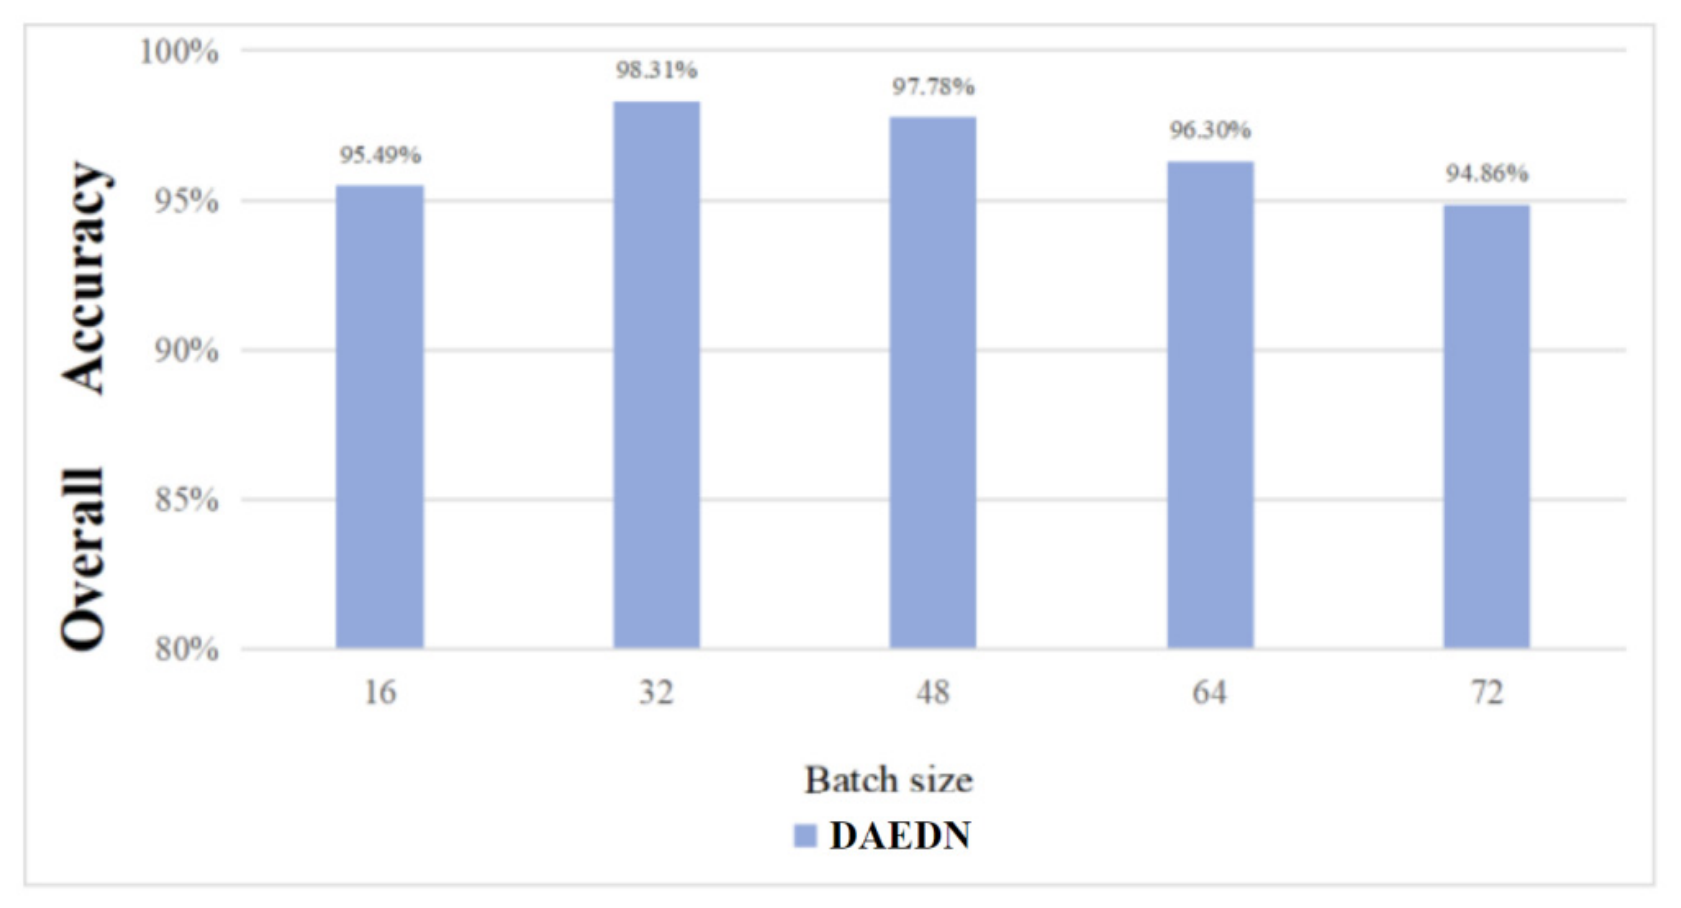
Batch size plays a crucial role in the training process, model performance, and computational efficiency. Selecting an appropriate batch size allows for optimal utilization of hardware resources and efficient parallel computing. We experimented with batch sizes of 16, 32, 48, 64, and 72. The experimental results are shown in Figure 11. Smaller batch sizes result in more frequent gradient updates. Larger batch sizes lead to slower experiment speeds and increased memory consumption. A batch size of 32 offers the fastest training speed and the best experimental results.
Figure 11.
Experimental results of batch size.
4.2. Experiment Results
The experiment results are shown in Table 2 The classification accuracy of DAEDN is 98.31%. Notably, the identification outcomes for 10 types of forage were highly good, with an identification accuracy of 100% for 3 types. The experiments revealed that the incorporation of the channel and space dual-attention mechanism enhanced feature extraction across both channel and spatial domains, subsequently reconstructing these weighted features through an Auto-Encoding. Such a strategy proved beneficial for learning pertinent information, showcasing remarkable data dimensionality reduction and denoising capabilities. By leveraging dual attention parallelism in conjunction with the encoder, DAEDN effectively enhances the performance of key features and reduces data dimensionality. Consequently, this enables the identification of crucial information with greater precision.
Table 2.
Experimental results of five models (%).
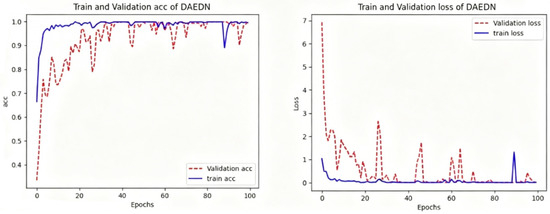
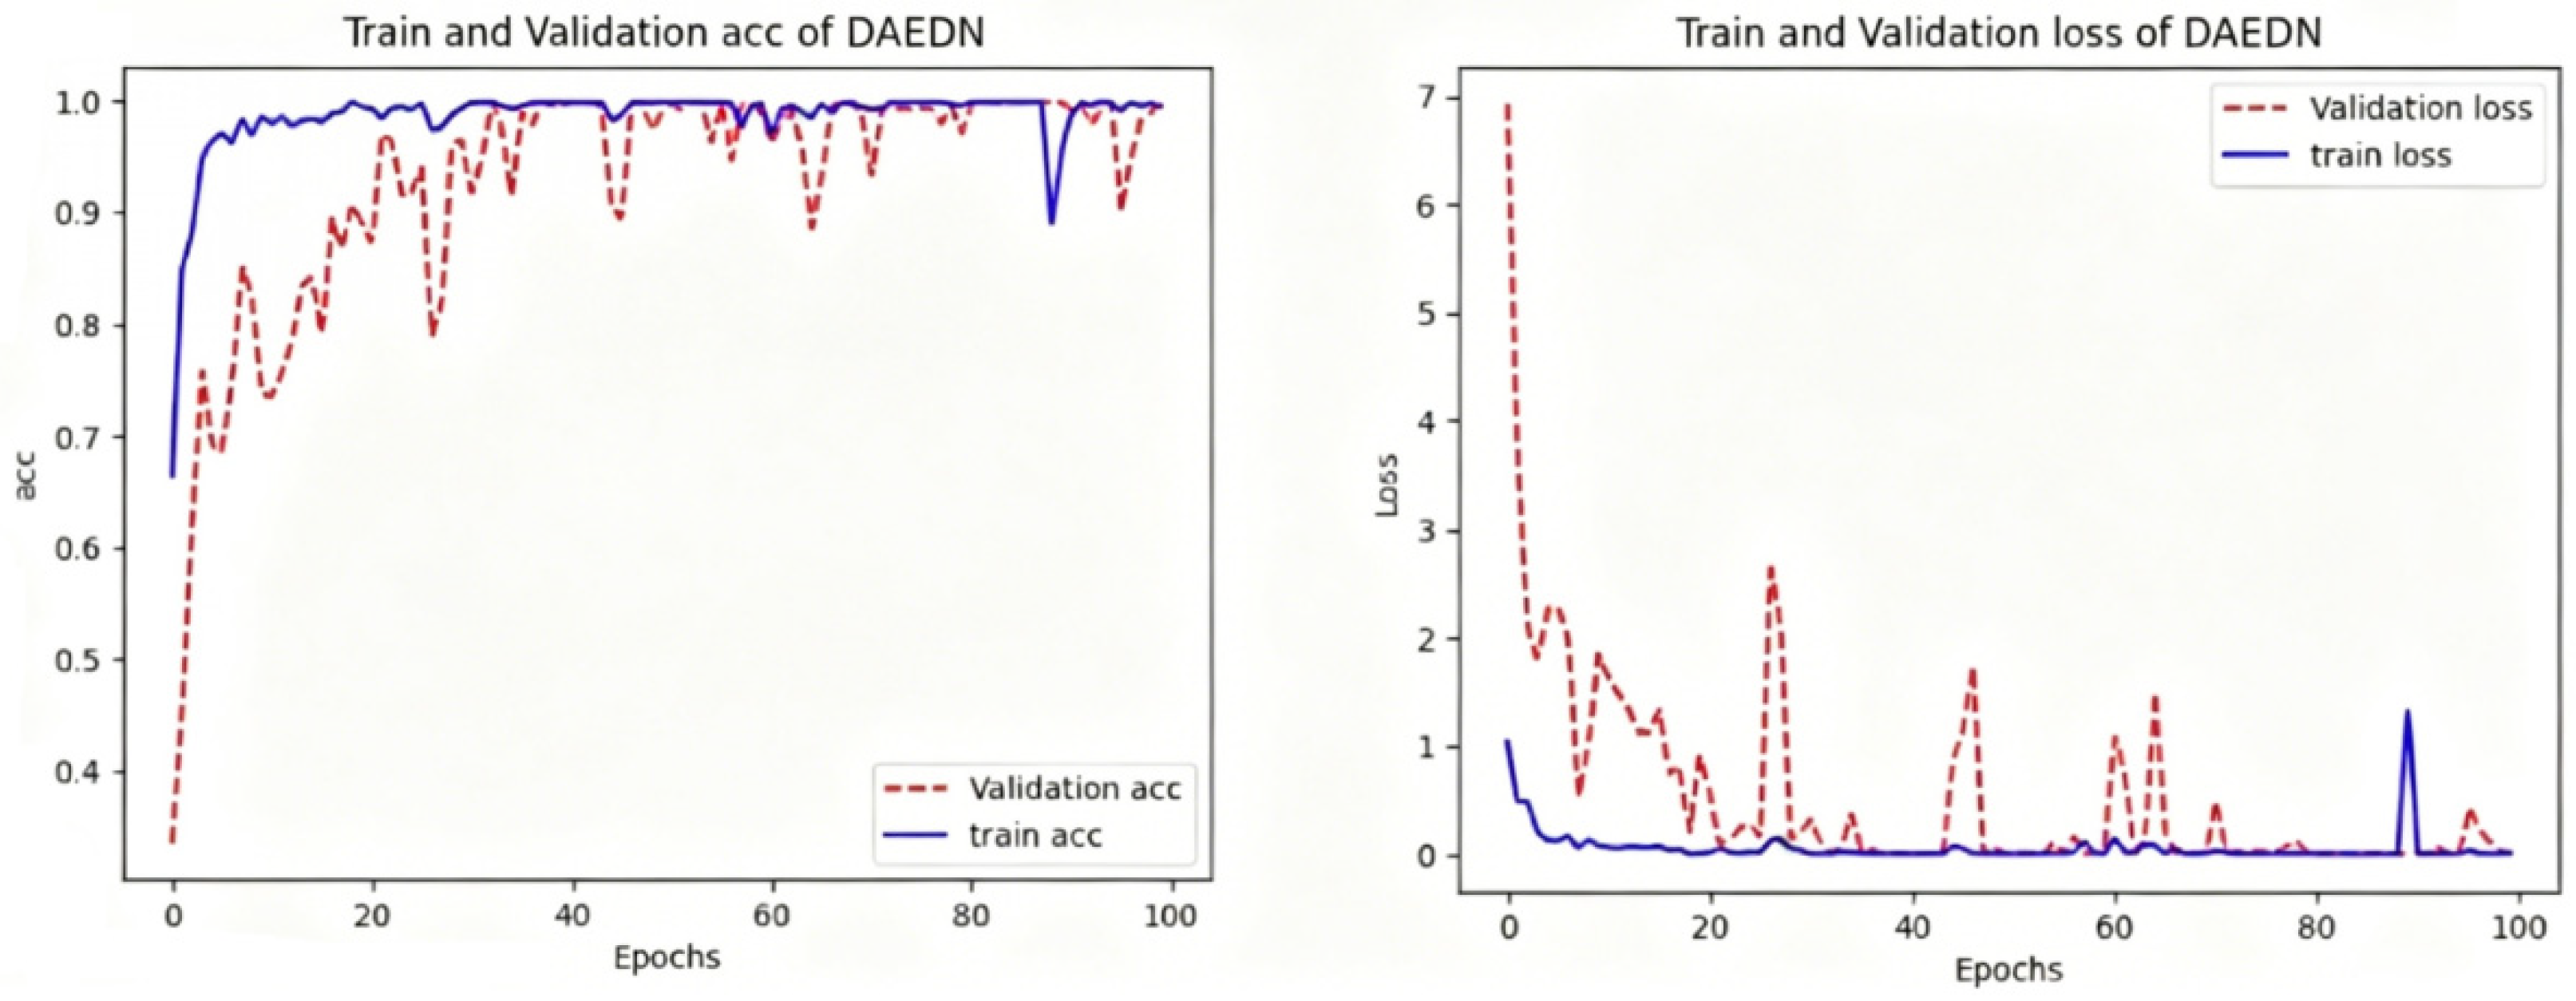
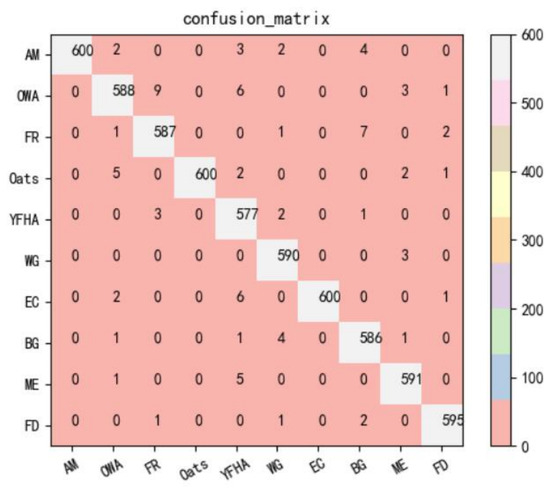
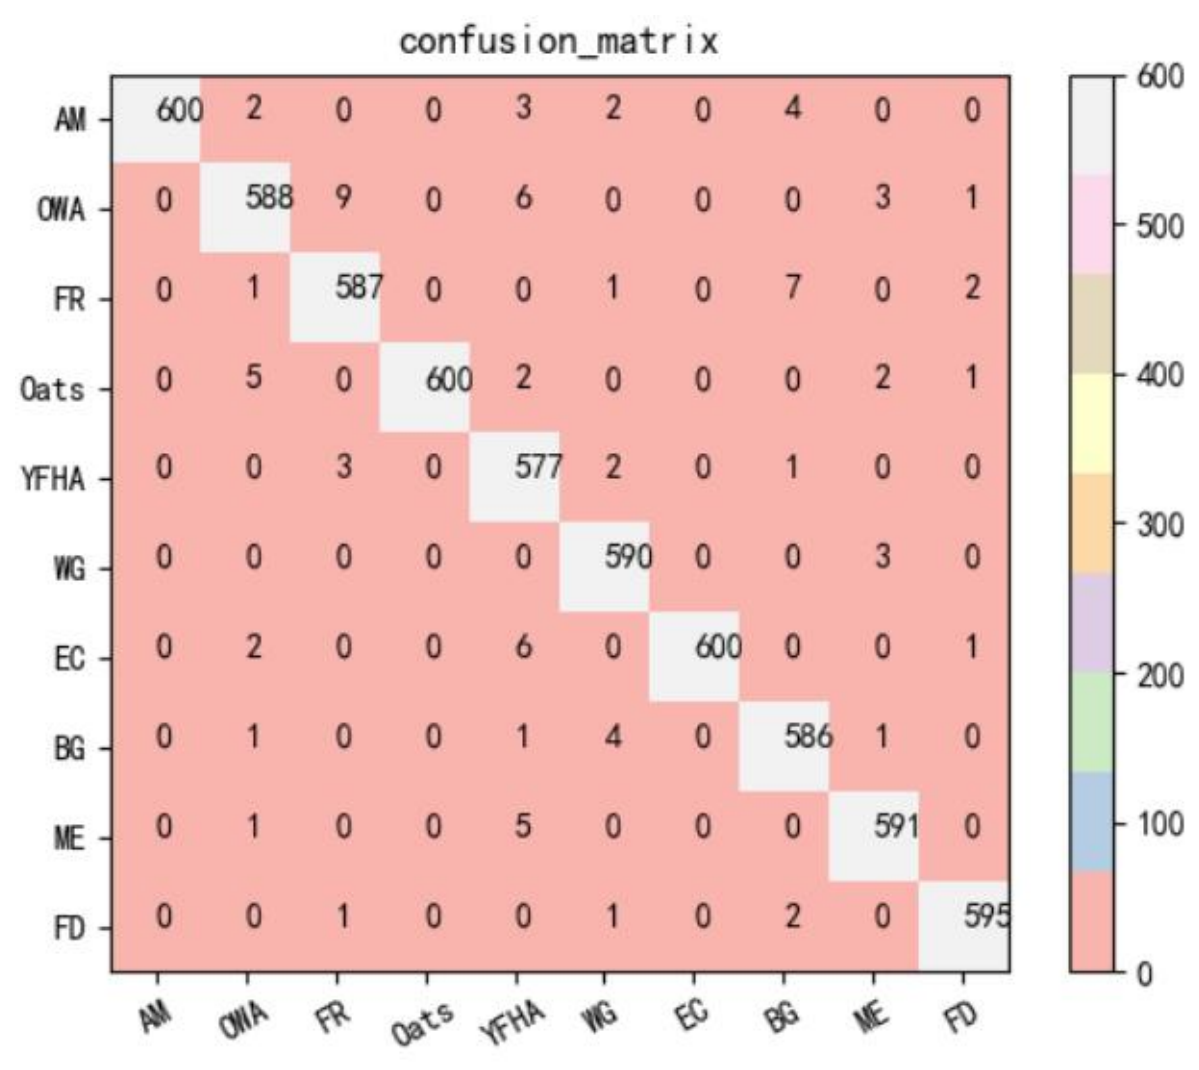
The training process changes as shown in Figure 12. The confusion matrix is shown in Figure 13. The x-axis represents the predicted value, and the y-axis represents the true value; abbreviations of the x and y axes are the name abbreviations of the 10 forage species, and a scale of 0–500 indicates the color change corresponding to the number of correctly classified samples.
Figure 12.
Relationship between accuracy, loss and training times of DAEDN.
Figure 13.
Confusion matrix of DAEDN.
4.3. Comparative Analysis of the Convolution Neural Network Models
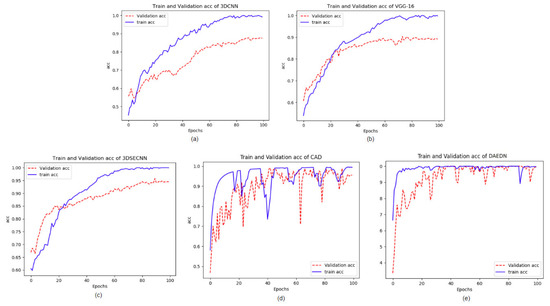
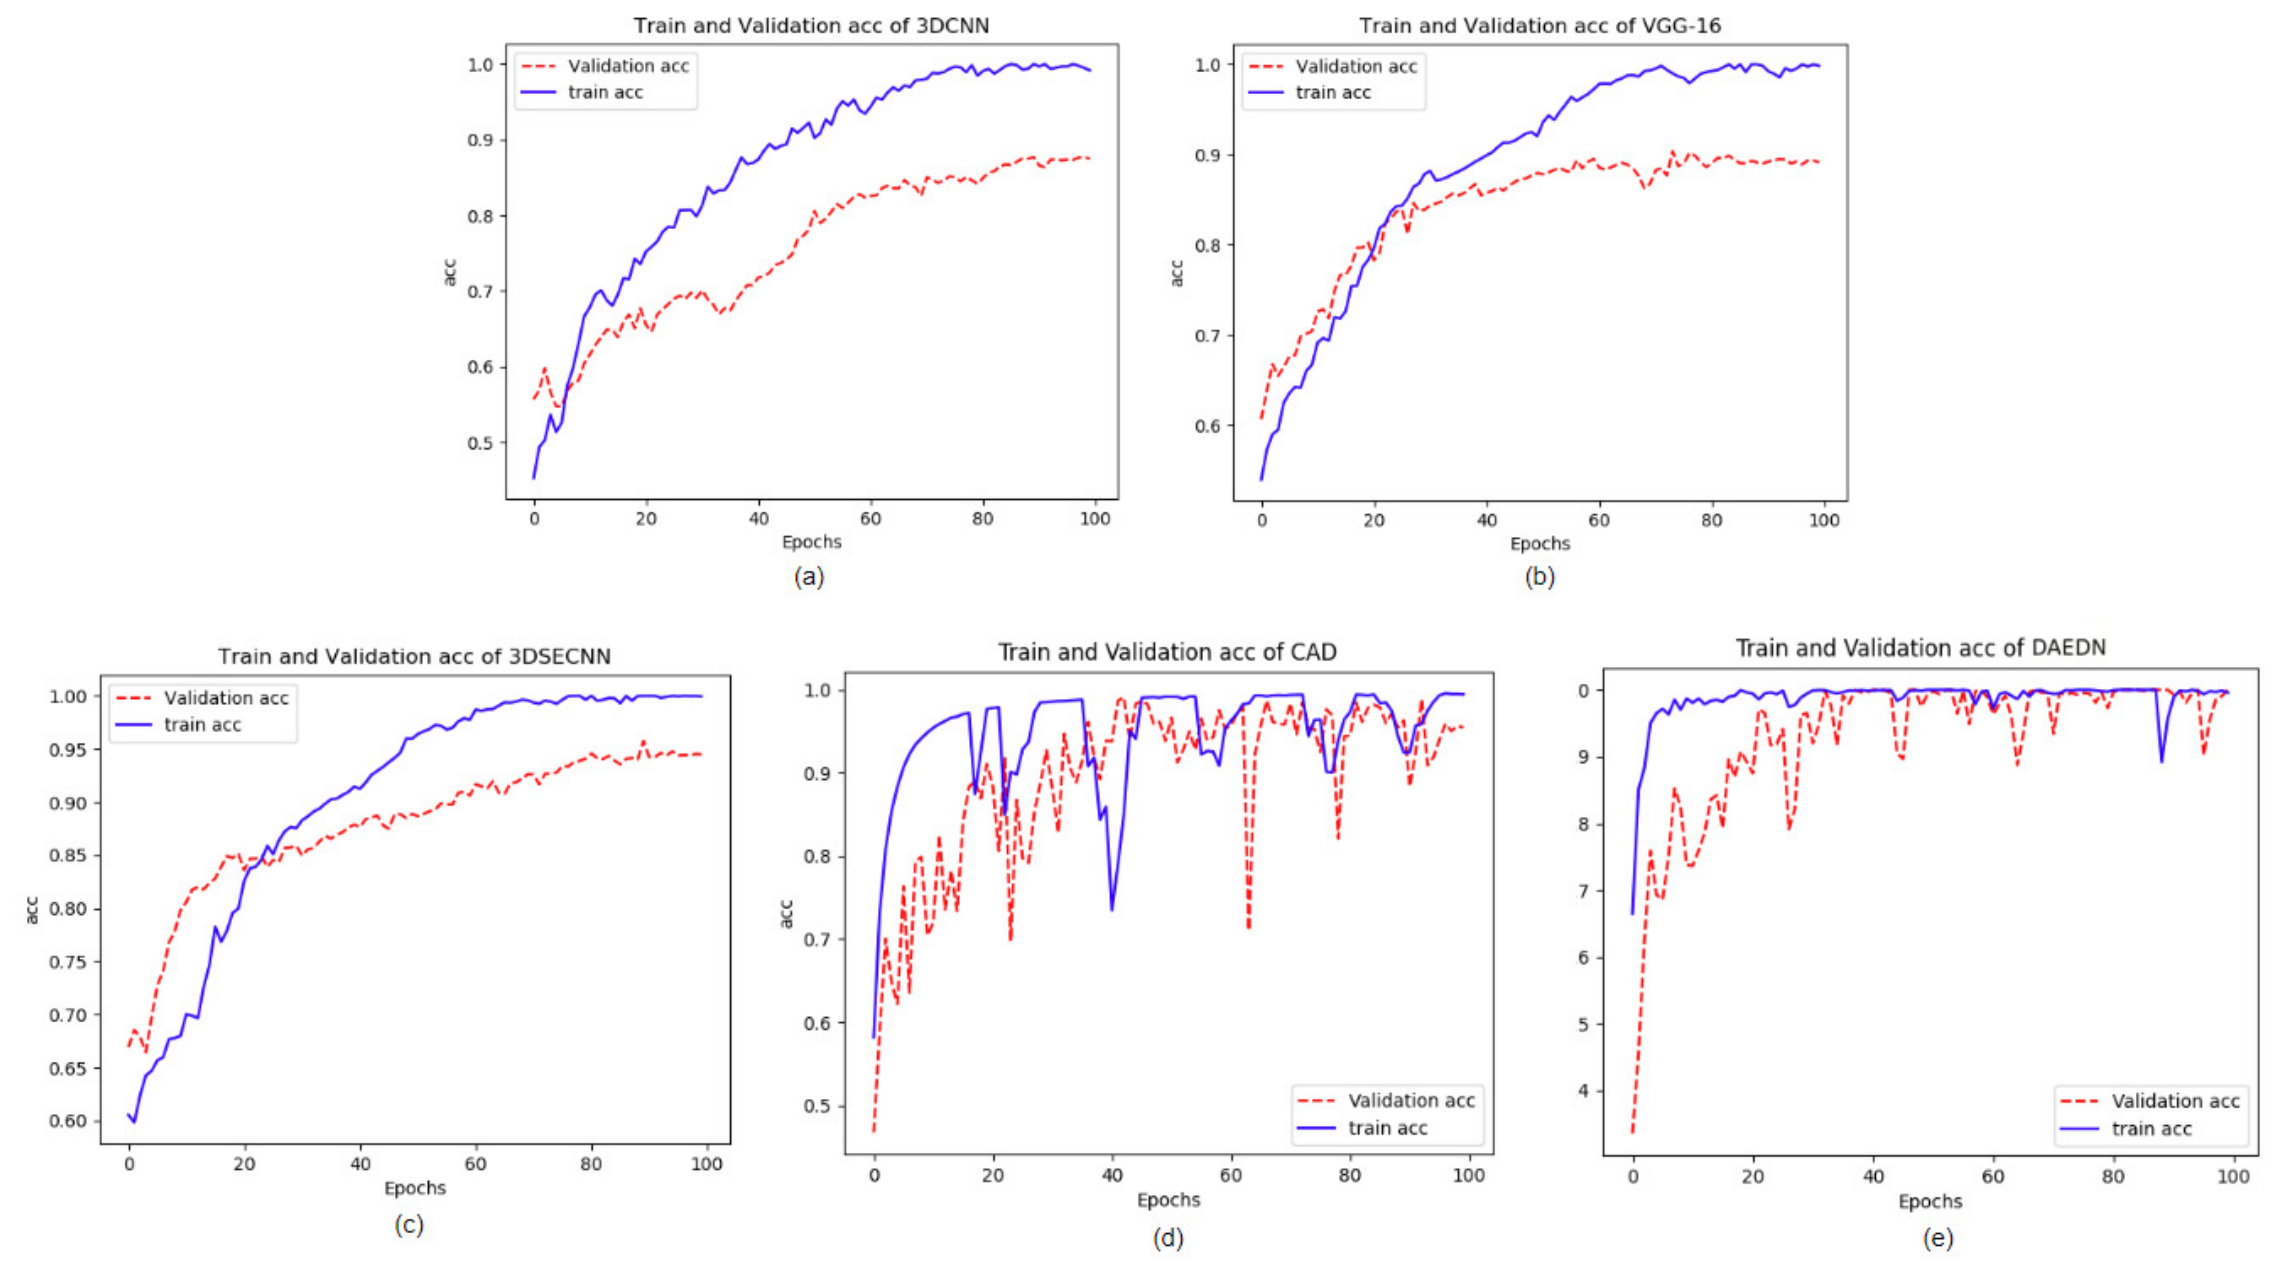
To better verify the feasibility of this research, we compared DAEDN with four models: 3DCNN, 3DSECNN, VGG-16, and CBAM-DenseNet (CAD). The performance of each model was evaluated using six experimental indicators. The experimental results are shown in Table 2, and the training processes of the five models are shown in Figure 14. The classification accuracy and overall performance of DAEDN are superior to those of the other methods.
Figure 14.
Results of accuracy changes of five methods. (a) 3DCNN, (b) VGG-16, (c) 3DSECNN, (d) CAD, (e) DAEDN.
The experimental results demonstrate the following: (1) 3DCNN has limited feature extraction capabilities and weak feature analysis abilities, resulting in low identification accuracy. (2) VGG-16 increases network depth and enhances data analysis and feature mining capabilities. However, it does not sufficiently improve the utilization of spatial features, resulting in lower performance than the other models. (3) Both 3DSECNN and CAD incorporate attention mechanisms into the network. 3DSECNN uses a channel attention mechanism, whereas CAD incorporates both channel and spatial attention mechanisms, enabling weighted calculations of channel and spatial features for more comprehensive feature analysis. In addition, CAD uses deeper network layers to enhance feature extraction and analysis capabilities, resulting in better performance than 3DSECNN. (4) Both CAD and DAEDN use channel and spatial attention mechanisms. Deep networks are also helpful for analyzing extracted features. However, DAEDN not only computes weighted features but also reduces dimensionality and reconstructs these features, thereby enhancing the model’s ability to learn complex features and reducing computational costs. As a result, DAEDN achieves the best experimental results and the highest identification accuracy.
Among the five models, DAEDN demonstrates the highest identification accuracy and the shortest training time. Additional evaluation metrics further support the model’s exceptional experimental outcomes. These results indicate that the approach proposed excels in capturing crucial features and enables precise identification research in forage hyperspectral imaging.
5. Conclusions
Based on the problem that HSI images lose some features after preprocessing operations and the low accuracy of identifying forage hyperspectral images, this paper proposes the idea of integrating preprocessing operations into the network and proposes DAEDN to verify this idea. Experimental results demonstrate that DAEDN achieves an identification accuracy of 98.31%, significantly improving the identification of forage to a high level. This study contributes to high-precision identification research on forage hyperspectral images.
The main work of this paper is as follows: (1) Captured high-resolution forage HSI images in the field and established a forage hyperspectral dataset. (2) Proposed a new data processing method, which utilized the attention mechanism and Auto-Encoding for feature sorting, removal of low-weight data, dimensionality reduction, and denoising to achieve preprocessing effects. (3) Proposed DAEDN verification. DAEDN highlights the advantages of direct interconnection of each layer of the dense convolutional network, strengthens the efficiency of feature utilization, and improves the efficiency of analyzing features through the attention mechanism combined with the Auto-Encoding. In the future, we will strengthen research on forage, continue to deeply explore the rich feature information of hyperspectral images, and improve the accuracy and efficiency of forage identification.
Author Contributions
Conceptualization, Y.L.; methodology, X.P.; software, C.C.; validation, Y.L., R.W.; formal analysis, Y.L.; investigation, J.L.; resources, J.L.; data curation, X.P.; writing—original draft preparation, Y.L.; writing—review and editing, C.C.; visualization, R.W.; supervision, X.P.; project administration, Y.L.; funding acquisition, J.L. All authors have read and agreed to the published version of the manuscript.
Funding
This research was supported by Inner Mongolia Autonomous Region Key Research and Development Program as well as Technology Transfer Program under Grant 2025YFHH0278, 2026YFSH0015; Basic Research Project of Directly Affiliated Universities of Inner Mongolia Autonomous Region—Fund for Enhancing the Research Ability of Young Teachers under Grant BR230151; National Key Research and Development Program under Grant 2023YFD1600702-04; Science Research Project of Higher Education Institutions in Inner Mongolia Autonomous Region under Grant NJZY21491; Natural Science Foundation of Inner Mongolia Autonomous Region of China under Grant 2025MS06054, 2025MS06046, 2025MS06020; Innovation and Entrepreneurship Support Program for Returnees from Inner Mongolia Who Have Studied Abroad under Grant 202223; Research startup funds for high-level, outstanding doctoral talents to be introduced in 2025 under Grant RK2600001366; Capacity Building Project of Key Laboratory for Research and Application of Big Data in Agriculture and Animal Husbandry of Inner Mongolia Autonomous Region under Grant RZ2600001074.
Data Availability Statement
The dataset used in this study is too large to be uploaded and can be obtained by contacting the corresponding author.
Conflicts of Interest
The authors declare no conflicts of interest.
References
- Qu, P.; Dong, G.; Chen, J.; Xiao, J.; De Boeck, H.J.; Chen, J.; Jiang, S.; Batkhishig, O.; Legesse, T.G.; Xin, X.; et al. Soil environmental anomalies dominate the responses of net ecosystem productivity to heatwaves in three Mongolian grasslands. Sci. Total Environ. 2024, 944, 173742. [Google Scholar] [CrossRef] [Scilit] [PubMed]
- Zhang, J.; Zhang, L.; Liu, X.; Yang, X. Quantitative evaluation of soil water balance under a ridge-furrow rainwater harvesting system in Chinese rainfed agroecosystem. J. Sci. Food Agric. 2024, 104, 8201–8211. [Google Scholar] [CrossRef] [Scilit] [PubMed]
- Pirnajmedin, F.; Jaškūnė, K.; Majidi, M. Adaptive strategies to drought stress in grasses of the poaceae family under climate change: Physiological, genetic and molecular perspectives: A review. Plant Physiol. Biochem. 2024, 213, 108814. [Google Scholar] [CrossRef] [Scilit] [PubMed]
- Zang, Z.; Li, Y.; Tang, F.; Zhao, W. Microbial network complexity supersedes diversity in predicting soil multifunctionality during dryland grassland restoration: Implications for degraded calcareous ecosystems. Agric. Ecosyst. Environ. 2026, 411, 110588. [Google Scholar] [CrossRef] [Scilit]
- Li, T.; Cui, L.; Xu, Z.; Hu, R.; Joshi, P.; Song, X.; Tang, L.; Xia, A.; Wang, Y.; Guo, D.; et al. Quantitative Analysis of the Research Trends and Areas in Grassland Remote Sensing: A Scientometrics Analysis of Web of Science from 1980 to 2020. Remote Sens. 2021, 13, 1279. [Google Scholar] [CrossRef] [Scilit]
- Beebe, G.; Knapp, P.L.; Crouch, D.C.; Maddox, D.; Davidson, B.; Stambaugh, M.; Dey, D.C. Goats and oaks: Applicability of targeted browsing to promote forage quality and conservation outcomes in woodland communities in the Central Hardwood Region of the United States. Agrofor. Syst. 2026, 100, 152. [Google Scholar] [CrossRef] [Scilit]
- Dias, M.C.; Borba, A. Precision Tools for Forage Assessment and Nutritional Decision Support in Grazing-Ruminant Systems: A Narrative Review. Agriculture 2026, 16, 1198. [Google Scholar] [CrossRef] [Scilit]
- Culqui, T.J.; Marin, A.N.; Fernandez, G.D.; Taboada-Mitma, V.H.; Cruz-Luis, J.; Neyra, H.; Anchayhua, J.Y.; Quichua-Baldeon, R.; Sánchez-Fuentes, T.; Olano, Y.M.; et al. Prediction of biomass and nutritional quality of tropical pastures using multispectral analysis and machine learning models. Smart Agric. Technol. 2026, 14, 102229. [Google Scholar] [CrossRef] [Scilit]
- Villegas, M.D.; Trujillo, C.; Rao, M.I.; Murgueitio, E.; Chará, J.; Rivera, J.E.; Moorby, J.; Sotelo, M.; Cardoso, J.A.; Oberson, A.; et al. Forage production and nitrogen dynamics in silvopastoral systems with Leucaena diversifolia in Urochloa grass-based pastures. Agric. Ecosyst. Environ. 2026, 410, 110546. [Google Scholar] [CrossRef] [Scilit] [PubMed]
- Indu, I.; Kumar, B.; Shashikumara, P.; Gupta, G.; Dikshit, N.; Chand, S.; Yadav, P.K.; Ahmed, S.; Singhal, R.K. Forage crops: A repository of functional trait diversity for current and future climate adaptation. Crop Pasture Sci. 2022, 74, 961–977. [Google Scholar] [CrossRef] [Scilit]
- Dong, S.; Shang, Z.; Gao, J.; Boone, R. Enhancing sustainability of grassland ecosystems through ecological restoration and grazing management in an era of climate change on Qinghai-Tibetan Plateau. Agric. Ecosyst. Environ. 2022, 287, 106684. [Google Scholar] [CrossRef] [Scilit]
- Ragalzi, C.M.; de Oliveira, R.G.; Ribeiro, A.G.; Pereira, C.H.; Jank, L.; Santos, M.F.; Resende, R.T. A spatial-based approach applied to early selection stages in a forage breeding program. Euphytica 2023, 219, 58. [Google Scholar] [CrossRef] [Scilit]
- Wang, J.; Cai, Z.; Jin, C.; Peng, D.; Zhai, Y.; Qi, H.; Bai, R.; Guo, X.; Yang, J.; Zhang, C. Species classification and origin identification of Lonicerae japonicae flos and Lonicerae flos using hyperspectral imaging with support vector machine. J. Food Compos. Anal. 2024, 132, 106356. [Google Scholar] [CrossRef] [Scilit]
- Yang, C.; Kong, Y.; Wang, X.; Cheng, Y. Hyperspectral Image Classification Based on Adaptive Global–Local Feature Fusion. Remote Sens. 2024, 16, 1918. [Google Scholar] [CrossRef] [Scilit]
- Zhu, C.; Zhang, T.; Wu, Q.; Li, Y.; Zhong, Q. An Implicit Transformer-based Fusion Method for Hyperspectral and Multispectral Remote Sensing Image. Int. J. Appl. Earth Obs. Geoinf. 2024, 131, 103955. [Google Scholar] [CrossRef] [Scilit]
- Ali, K.M.; Amin, B.; Maud, R.A.; Bhatti, F.A.; Sukhia, K.N.; Khurshid, K. Hyperspectral target detection using self-supervised background learning. Adv. Space Res. 2024, 74, 628–646. [Google Scholar] [CrossRef] [Scilit]
- Xiao, T.; Yang, L.; Zhang, D.; Cui, T.; Zhang, X.; Deng, Y.; Li, H.; Wang, H. Early detection of nicosulfuron toxicity and physiological prediction in maize using multi-branch deep learning models and hyperspectral imaging. J. Hazard. Mater. 2024, 474, 134723. [Google Scholar] [CrossRef] [Scilit] [PubMed]
- Siripatrawan, U.; Makino, Y. Assessment of food safety risk using machine learning-assisted hyperspectral imaging: Classification of fungal contamination levels in rice grain. Microb. Risk Anal. 2024, 27–28, 100295. [Google Scholar] [CrossRef] [Scilit]
- Liu, Y.; Zhao, X.; Song, Z.; Yu, J.; Jiang, D.; Zhang, Y.; Chang, Q. Detection of apple mosaic based on hyperspectral imaging and three-dimensional Gabor. Comput. Electron. Agric. 2024, 222, 109051. [Google Scholar] [CrossRef] [Scilit]
- Dmitriev, V.; Kozoderov, V.; Dementyev, O.; Safonova, A.N. Combining Classifiers in the Problem of Thematic Processing of Hyperspectral Aerospace Images. Optoelectron. Instrum. Data Process. 2018, 54, 213–221. [Google Scholar] [CrossRef] [Scilit]
- Corbari, L.; Capodici, F.; Ciraolo, G.; Topouzelis, K. Marine plastic detection using PRISMA hyperspectral satellite imagery in a controlled environment. Int. J. Remote Sens. 2023, 44, 6845–6859. [Google Scholar] [CrossRef] [Scilit]
- Xu, H.; Yao, W.; Cheng, L.; Li, B. Multiple Spectral Resolution 3D Convolutional Neural Network for Hyperspectral Image Classification. Remote Sens. 2021, 13, 1248. [Google Scholar] [CrossRef] [Scilit]
- Qing, Y.; Huang, Q.; Feng, L.; Qi, Y.; Liu, W. Multiscale Feature Fusion Network Incorporating 3D Self-Attention for Hyperspectral Image Classification. Remote Sens. 2022, 14, 742. [Google Scholar] [CrossRef] [Scilit]
- Xue, X.; Chen, Z.; Wu, H.; Gao, H.; Nie, J.; Li, X. Identification of EightPterocarpusSpecies and TwoDalbergiaSpecies Using Visible/Near-Infrared (Vis/NIR) Hyperspectral Imaging (HSI). Forests 2023, 14, 1259. [Google Scholar] [CrossRef] [Scilit]
- Zhang, Q.; Sun, Z.; Shu, H. Research on Vehicle Lane Change Warning Method Based on Deep Learning Image Processing. Sensors 2022, 22, 3326. [Google Scholar] [CrossRef] [Scilit] [PubMed]
- Bae, H.S.; Lee, H.J.; Lee, S.G. Voice Recognition-Based on Adaptive MFCC and Deep Learning for Embedded Systems. J. Inst. Control Robot. Syst. 2016, 22, 797–802. [Google Scholar] [CrossRef] [Scilit]
- Segarra, D.A.; Paredes, G.A.L. Deep Learning-based Natural Language Processing Methods Comparison for Presumptive Detection of Cyberbullying in Social Networks. Int. J. Adv. Comput. Sci. Appl. 2021, 12, 796–803. [Google Scholar] [CrossRef] [Scilit]
- Zhang, C.; Li, G.; Du, S.; Tan, W.; Gao, F. Three-dimensional densely connected convolutional network for hyperspectral remote sensing image classification. J. Appl. Remote Sens. 2019, 13, 016519. [Google Scholar] [CrossRef] [Scilit]
- Ma, H.; Celik, T. FER-Net: Facial expression recognition using densely connected convolutional network. Electron. Lett. 2019, 55, 184–186. [Google Scholar] [CrossRef] [Scilit]
- Li, H.; Zhou, H.; Pan, L.; Du, Q. Gabor feature-based composite kernel method for hyperspectral image classification. Electron. Lett. 2018, 54, 628–630. [Google Scholar] [CrossRef] [Scilit]
- Kuang, P.; Ma, T.S.; Chen, Z.W.; Li, F. Image super-resolution with densely connected convolutional networks. Appl. Intell. 2019, 49, 125–136. [Google Scholar] [CrossRef] [Scilit]
- Liu, G.; Wang, G.; Bi, W.; Liu, H.; Yang, H. Cloud detection algorithm for remote sensing images based on DenseNet and attention mechanism. Remote Sens. Nat. Resour. 2022, 34, 88–96. [Google Scholar]
- Liang, L.; Li, J.; Zhang, S. Hyperspectral Image Classification Method Based on Multi-scale Densenet and Bi-RNN Joint Network. IOP Conf. Ser. Earth Environ. Sci. 2021, 783, 012087. [Google Scholar] [CrossRef] [Scilit]
- Li, S.; Wang, M.; Cheng, C.; Gao, X.; Ye, Z.; Liu, W. Spectral-Spatial-Sensorial Attention Network with Controllable Factors for Hyperspectral Image Classification. Remote Sens. 2024, 16, 1253. [Google Scholar] [CrossRef] [Scilit]
- Zhang, H.; Tu, K.; Lv, H.; Wang, R. Hyperspectral Image Classification Based on 3D–2D Hybrid Convolution and Graph Attention Mechanism. Neural Process. Lett. 2024, 56, 117. [Google Scholar] [CrossRef] [Scilit]
- Sun, Q.; Sun, Y.; Pan, C. AIDB-Net: An Attention-Interactive Dual-Branch Convolutional Neural Network for Hyperspectral Pansharpening. Remote Sens. 2024, 16, 1044. [Google Scholar] [CrossRef] [Scilit]
- Zhang, L.; Lin, H.; Zeng, F. Attention-based DenseNet network for multi-source remote sensing classification. IOP Conf. Ser. Earth Environ. Sci. 2021, 865, 012002. [Google Scholar] [CrossRef] [Scilit]
- Zhang, Y.; Wang, T.; You, Y.; Wang, D.; Gao, J.; Liang, T. A transformer-based image detection method for grassland situation of alpine meadows. Comput. Electron. Agric. 2023, 210, 107919. [Google Scholar] [CrossRef] [Scilit]
- Wang, Y.; Pu, J.; Miao, D.; Zhang, L.; Zhang, L.; Du, X. SCGRFuse: An infrared and visible image fusion network based on spatial/channel attention mechanism and gradient aggregation residual dense blocks. Eng. Appl. Artif. Intell. 2024, 132, 107898. [Google Scholar] [CrossRef] [Scilit]
- Peng, D.; Zhai, C.; Zhang, Y.; Guan, H. High-resolution optical remote sensing image change detection based on dense connection and attention feature fusion network. Photogramm. Rec. 2023, 38, 498–519. [Google Scholar] [CrossRef] [Scilit]
- Li, S.; Deng, M.; Justin, L.; Ayan, S.; George, B. Imaging through glass diffusers using densely connected convolutional networks. Optica 2018, 5, 803–813. [Google Scholar] [CrossRef] [Scilit]
- Yang, W.; Liu, C.; Zeng, S.; Duan, X.; Zhang, C.; Tao, W. Rapid identification of moldy peanuts based on three-dimensional hyperspectral object detection. J. Food Compos. Anal. 2024, 133, 106400. [Google Scholar] [CrossRef] [Scilit]
- Zhong, Y.; Hu, X.; Luo, C.; Wang, X.; Zhao, J.; Zhang, L. WHU-Hi: UAV-borne hyperspectral with high spatial resolution (H2) benchmark datasets and classifier for precise crop identification based on deep convolutional neural network with CRF. Remote Sens. Environ. 2020, 250, 112012. [Google Scholar] [CrossRef] [Scilit]
- He, J.; He, J.; Liu, G.; Li, W.; Li, Z.; Li, Z. Inversion analysis of soil nitrogen content using hyperspectral images with different preprocessing methods. Ecol. Inform. 2023, 78, 102381. [Google Scholar] [CrossRef] [Scilit]
- Martinez-Vega, B.; Tkachenko, M.; Matkabi, M.; Ortega, S.; Fabelo, H.; Balea-Fernandez, F.; La Salvia, M.; Torti, E.; Leporati, F.; Callico, G.M.; et al. Evaluation of Preprocessing Methods on Independent Medical Hyperspectral Databases to Improve Analysis. Sensors 2022, 22, 8917. [Google Scholar] [CrossRef] [Scilit] [PubMed]
- Pang, B. Classification of images using EfficientNet CNN model with convolutional block attention module (CBAM) and spatial group-wise enhance module (SGE). In International Conference on Image, Signal Processing, and Pattern Recognition (ISPP 2022); SPIE: Bellingham, WA, USA, 2022. [Google Scholar] [CrossRef] [Scilit]
- Cao, W.; Feng, Z.; Zhang, D.; Huang, Y. Facial Expression Recognition via a CBAM Embedded Network. Procedia Comput. Sci. 2020, 174, 463–477. [Google Scholar] [CrossRef] [Scilit]
- Yin, M.; Chen, Z.; Zhang, C. A CNN-Transformer Network Combining CBAM for Change Detection in High-Resolution Remote Sensing Images. Remote Sens. 2023, 15, 2406. [Google Scholar] [CrossRef] [Scilit]
- Zhang, X.; Li, D.; Liu, X.; Sun, T.; Lin, X.; Ren, Z. Research of segmentation recognition of small disease spots on apple leaves based on hybrid loss function and CBAM. Front. Plant Sci. 2023, 14, 1175027. [Google Scholar] [CrossRef] [Scilit] [PubMed]
- Zheng, Z.; Zhang, S.; Song, H.; Yan, Q. Deep clustering using 3D attention convolutional autoencoder for hyperspectral image analysis. Sci. Rep. 2024, 14, 4209. [Google Scholar] [CrossRef] [Scilit] [PubMed]
- Zhou, B.; Zhang, X.; Chen, X.; Ren, M.; Feng, Z. HyperRefiner: A refined hyperspectral pansharpening network based on the autoencoder and self-attention. Int. J. Digit. Earth 2023, 16, 3268–3294. [Google Scholar] [CrossRef] [Scilit]
- Li, W.; Chen, H.; Liu, Q.; Liu, H.; Wang, Y.; Gui, G. Attention Mechanism and Depthwise Separable Convolution Aided 3DCNN for Hyperspectral Remote Sensing Image Classification. Remote Sens. 2022, 14, 2215. [Google Scholar] [CrossRef] [Scilit]
- Wei, X.; Yang, J.; Lv, M.; Chen, W.; Ma, X.; Long, M.; Xia, S. ISAR High-Resolution Imaging Method With Joint FISTA and VGGNet. IEEE Access 2021, 9, 86685–86697. [Google Scholar] [CrossRef] [Scilit]
- Liu, Y.; Liu, J.; Zhao, X.; Pan, X.; Yan, W. Research on identification and classification of grassland forage based on deep learning and attention mechanisms. IET Image Process. 2023, 17, 2628–2639. [Google Scholar] [CrossRef] [Scilit]
- Liu, Y.; Pan, X.; Liu, J.; Zhang, S.; Yan, W. Research on near-ground forage hyperspectral imagery classification based on fusion preprocessing process. Int. J. Digit. Earth 2023, 16, 4707–4725. [Google Scholar] [CrossRef] [Scilit]

Disclaimer/Publisher’s Note: The statements, opinions and data contained in all publications are solely those of the individual author(s) and contributor(s) and not of MDPI and/or the editor(s). MDPI and/or the editor(s) disclaim responsibility for any injury to people or property resulting from any ideas, methods, instructions or products referred to in the content. |
© 2026 by the authors. Licensee MDPI, Basel, Switzerland. This article is an open access article distributed under the terms and conditions of the Creative Commons Attribution (CC BY) license.