


Abstract
Visual injury estimates are criticized for their subjective nature. Thus, a quantitative method might improve glyphosate injury assessment. This study aimed to develop a quantitative method to determine glyphosate injury on two bermudagrass [Cynodon dactylon (L.) Pers.] cultivars, ‘Greenfield’ and ‘Goodwell’, based on a Canopeo-based green canopy cover reduction (GCCR) method. The experimental design was a completely randomized factorial containing the two bermudagrass cultivars and five glyphosate rates (0.39, 0.53, 1.06, 1.54, and 3.08 kg a.i. ha−1) plus a nontreated control. Visual green canopy cover and GCCR ratings were measured at 8, 16, and 24 days after glyphosate application (DAG). The commonly used visual rating and the Canopeo-based GCCR method correlated. Bland–Altman analysis showed that at low glyphosate rates (0.39 and 0.53 kg a.i. ha−1), the GCCR method overestimated injury compared to visual ratings, while at higher rates (1.54 and 3.08 kg a.i. ha−1), GCCR underestimated injury values by over 30% for Greenfield and 40% for Goodwell. Despite these inconsistencies, both methods yielded similar conclusions. Further research is needed to validate the Canopeo-based GCCR method for other weed species in addition to traditional visual ratings.
1. Introduction
Bermudagrass [Cynodon dactylon (L.) Pers.] is known as the primary warm-season grass for pastures in the southern United States [1]. Bermudagrass can be considered either a weed or a desirable plant [2]. The wide integration of rhizomes and stolons can harden the process of bermudagrass control during pasture renovation or crop production [3]. Bermudagrass is commonly controlled with multiple glyphosate [N-(phosphonomethyl) glycine] applications totaling up to 4.5 kg a.i. ha−1 [2,4]. However, previous research indicated that physiologically active bermudagrass may have tolerance to glyphosate at certain rates [5], and genetic factors may play an important role in bermudagrass’s response to the herbicide [6,7,8]. The previously cited studies assessing bermudagrass injury to glyphosate used a visual rating system. This commonly used method entails a scale of 0 to 100 where 0 = no visual injury compared to the nontreated control and 100 = complete kill (plant death or necrosis). This method relies on the observer’s judgment and is a qualitative, subjective measurement [9]. Although the visual rating system has been accepted as a standard method, visual estimates have been criticized for their subjectivity and the need for properly trained observers [10,11]. Furthermore, visual rating protocols and standards may vary among researchers; consequently, the lack of standardization of this method makes data comparison across studies nearly impossible [12].
Affordable digital cameras and mobile devices have popularized the use of digital images. Moreover, interactive, simple, and accurate tools capable of quantifying fractional green canopy cover (FGCC), such as the app Canopeo (http://www.canopeoapp.com), are available to the public at no cost. Fractional green canopy cover is a nondestructive measurement that estimates canopy cover development. Its use has extended to forest land cover and the green and senescing fractions of the soybean canopy [Glycine max (L.) Merr.], percent land cover in turf, and weed growth rates after tillage, etc., [11,13,14,15,16]. Recent agricultural studies [17,18,19,20] show that fractional green canopy cover is most reliable in relatively uniform canopies such as barley, wheat, oats, sorghum, cowpea, and several forage crops, where image-based estimates often correlate well with visual assessments or yield outcomes. In contrast, performance is less stable in structurally complex systems, especially maize or corn and multi-cut forage stands with residue, where correlations can weaken or even become inconsistent across methods. These findings suggest that FGCC is valuable for rapid, nondestructive assessment of crop status, stand density, and yield potential, but it should be interpreted cautiously because accuracy depends on crop architecture, growth stage, and surface background conditions. A recent remote-sensing study further supports its agricultural utility by showing that FGCC can be mapped from high-resolution thermal and optical imagery, extending its use for crop monitoring and highlighting its sensitivity to calibration and spatial resolution. No literature has cited the application of FGCC to herbicide injury. In practice, herbicide injury evaluation partly involves monitoring discoloration in the green canopy. Therefore, Canopeo might be a useful standardized and quantifiable tool for this task.
Thus, the objectives of this study were to (1) contrast the proposed Green Canopy Cover Reduction (GCCR) quantitative method (that relies on the Canopeo app tool) against the visual rating system (that is commonly adopted), and (2) to evaluate the tolerance of ‘Greenfield’ and ‘Goodwell’ forage bermudagrass cultivars to different glyphosate rates using the GCCR system.
2. Materials and Methods
2.1. Site Description
A greenhouse study was conducted at the Controlled Environmental Research Lab (CERL) at Oklahoma State University in Stillwater, OK (36.12° N, 97.06° W). During the fall of 2017, bermudagrass cv. ‘Greenfield’ and ‘Goodwell’ were sprigged into co-extruded polypropylene pots (0.15 m tall, 0.17 m diameter), which were filled with appropriate potting mix, fertilized, watered daily, and clipped monthly until a 100% sod cover was present in every pot. During the experiment, the applied photoperiod was extended to 14 h using supplemental lighting from a combination of metal-halide and high-pressure sodium lamps. Temperature maintained inside the greenhouse was controlled by a wall-mounted evaporative cooling pad system (Acme’s Koll-Cel, USGR, Houston, TX, USA) and monitored by a data logger (TP425, The Dickson Company, Addison, IL, USA). The average day and night temperatures observed during the experiment period were 29.0 ± 7.8 and 21.3 ± 5.1 °C, respectively.
2.2. Glyphosate Treatments
In the early spring of 2018, the following five rates of glyphosate (Roundup PowerMAX, Monsanto, St. Louis, MO, USA) plus a nontreated control were applied to bermudagrass pots three weeks after clipping (2.5 cm stubble height) using a spray chamber: 0.39, 0.53, 1.06, 1.54, and 3.08 kg a.i. ha−1 (Generation III Research Sprayer, DeVries Mfg., Hollandale, MN, USA). The sprayer chamber had an 80001 EVS nozzle calibrated to deliver 140 L ha−1 to achieve appropriate spray coverage. Five pots of each cultivar were sprayed at once for each glyphosate rate, and two runs were conducted, totaling ten pots per rate per cultivar. Four hours after glyphosate application, once the leaves were dry, the pots were returned to the CERL, where moisture was monitored daily, and watering was provided as needed.
2.3. Estimating Green Canopy Cover Reduction with Canopeo
The Canopeo app version 2.0 (Oklahoma State University, Stillwater, OK, USA) is an Automatic Color Threshold (ACT) image analysis software based on the red–green–blue (RGB) color system [19]. Using this system, all digital image pixels are analyzed and classified based on the ratios of red/green, blue/green, and the excess green index, resulting in a binary black-and-white image. Pixels classified as white are predominantly in the green band (~500–750 nm), which corresponds to the green canopy, and pixels classified as black correspond to the non-green canopy. Then, FGCC is calculated from the white-to-black pixel ratio, ranging from 0 (no green canopy) to 1 (100% green canopy) [21].
Each bermudagrass pot was placed at the center of a white square panel (0.5 m × 0.5 m), and pictures were taken at a height of 1.5 m, parallel to the ground, using a 12-megapixel camera (iPhone 7, Apple Inc., Cupertino, CA, USA). Then, the pictures’ excess borders were precisely cropped at the edges of the white panel to a standardized size of 1000 × 1000 pixels using Adobe Photoshop CC 2018 (Adobe Inc., San Jose, CA, USA). These image treatments standardized the relative plant size across all images, enabling comparison of FGCCs across different images of the same pot at different time points. Then, the FGCC for each individual picture was calculated using the Canopeo Matlab app version 2.0. Finally, green canopy cover reduction (GCCR) was calculated using Equation (1):
where FGCC0 = FGCC at day zero (at glyphosate application, %), FGCCn = FGCC at a given day n after glyphosate application (%), and GCCRn is the percentage of green cover at day n relative to its initial FGCC0. The GCCRn values > 0 reflect the percentage reduction in green canopy area, while values < 0 reflect the percentage increase in green canopy area cover relative to day zero.
GCCRn = [1 − (FGCCn/FGCC0)] × 100
2.4. Data Collection
Based on the methodology described above, pictures of each bermudagrass pot were taken on the same day prior to glyphosate application (0 DAG) and then at 8, 16, and 24 DAG. Green canopy cover reduction was calculated for each pot on all evaluated days using FGCC values from the Canopeo software. The GCCR values reflected the glyphosate injury to the bermudagrass canopy. This assumes that canopy discoloration (i.e., deviation from green color band, ~500–750 nm) was caused by glyphosate application. In this case, the greater the GCCR, the greater the glyphosate injury. Recent studies using RGB, thermal, chlorophyll fluorescence, and hyperspectral imaging indicate that glyphosate application causes measurable canopy discoloration, chlorosis, and declines in green index or pigment-sensitive signals, thereby supporting the assumption that deviation from the green spectral band reflects glyphosate injury [22,23,24].
A visual injury (VI) rating for each bermudagrass pot was performed (by a single observer) simultaneously with pictures at 8, 16, and 24 DAG. Rates were based on a scale of 0 to 100, where 0 = no herbicide injury, and 100 = complete plant death or necrosis.
2.5. Canopeo Settings
Based on recommendations for Canopeo settings [19], the ratios of Red to Green (R/G) and Blue to Green (B/G) should be both at 0.97 for Corn and Forage Sorghum, 0.99 for Turf, and 1.1 for Switchgrass. Thus, image batches of the two tested bermudagrasses (Goodwell and Greenfield) were evaluated at R/G and B/G ratios of 0.99, given their dense sod, as in turf grasses, to generate the GCCR data. Then, the results from the proposed quantitative GCCR method were compared to the commonly adopted visual rating system.
2.6. Experimental Design and Statistical Analysis
The experimental design was a factorial arrangement in a completely randomized design, in which the two forage bermudagrass cultivars, Greenfield and Goodwell, and the five glyphosate application rates, plus the nontreated control, were randomly assigned to pots. The GCCR was calculated as a function of the untreated controls, as explained in item 2.3. Thus, the untreated controls were not included in the statistical analysis. There were two runs of five subjects each; thus, ten subjects per cultivar/rate combination. The ten subjects were included as a random effect in the analysis. These were the subjects on which the three repeated measures (8, 16, and 24 DAG) were evaluated. Cultivar, rate, and DAG were treated as fixed effects in the linear mixed-effects model for repeated measures in SAS 9.4 [25].
The 1:1 plot and the coefficient of correlation (r) for the visual (x-axis) vs. GCCR (y-axis) methods were generated in SAS 9.4 [25] to assess the correlation between the two methods for each cultivar. F-tests for the slope equal to one and intercept equal to zero were constructed in SAS 9.4 using the REG procedure [25]. In addition, Bland–Altman plots [26] of each cultivar were developed in Excel 2023 (Microsoft©, Redmond, WA, USA) to illustrate the agreement between the two methods. The limits of agreement were set at 1.96 ± SD, the common value adopted in biological and medical studies [27]. The distribution of the individual difference values between GCCR and visual system methods was considered normally distributed based on visual inspection of box plots and Shapiro–Wilk tests (p > 0.05) performed in SAS 9.4 [25]. There were two runs of five subjects each, for a total of 10 subjects per cultivar/rate combination. A linear mixed-effects model for repeated measures was used to analyze the GCCR responses in a 2 × 5 factorial design, with 10 random subjects per cultivar/rate combination and three repeated measures per subject. All tests were conducted at the nominal 0.05 level of significance.
3. Results
3.1. Green Canopy Cover Reduction vs. Visual Injury Method
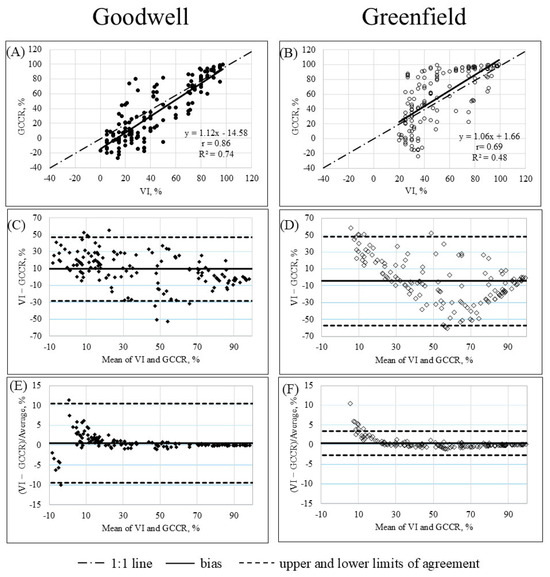
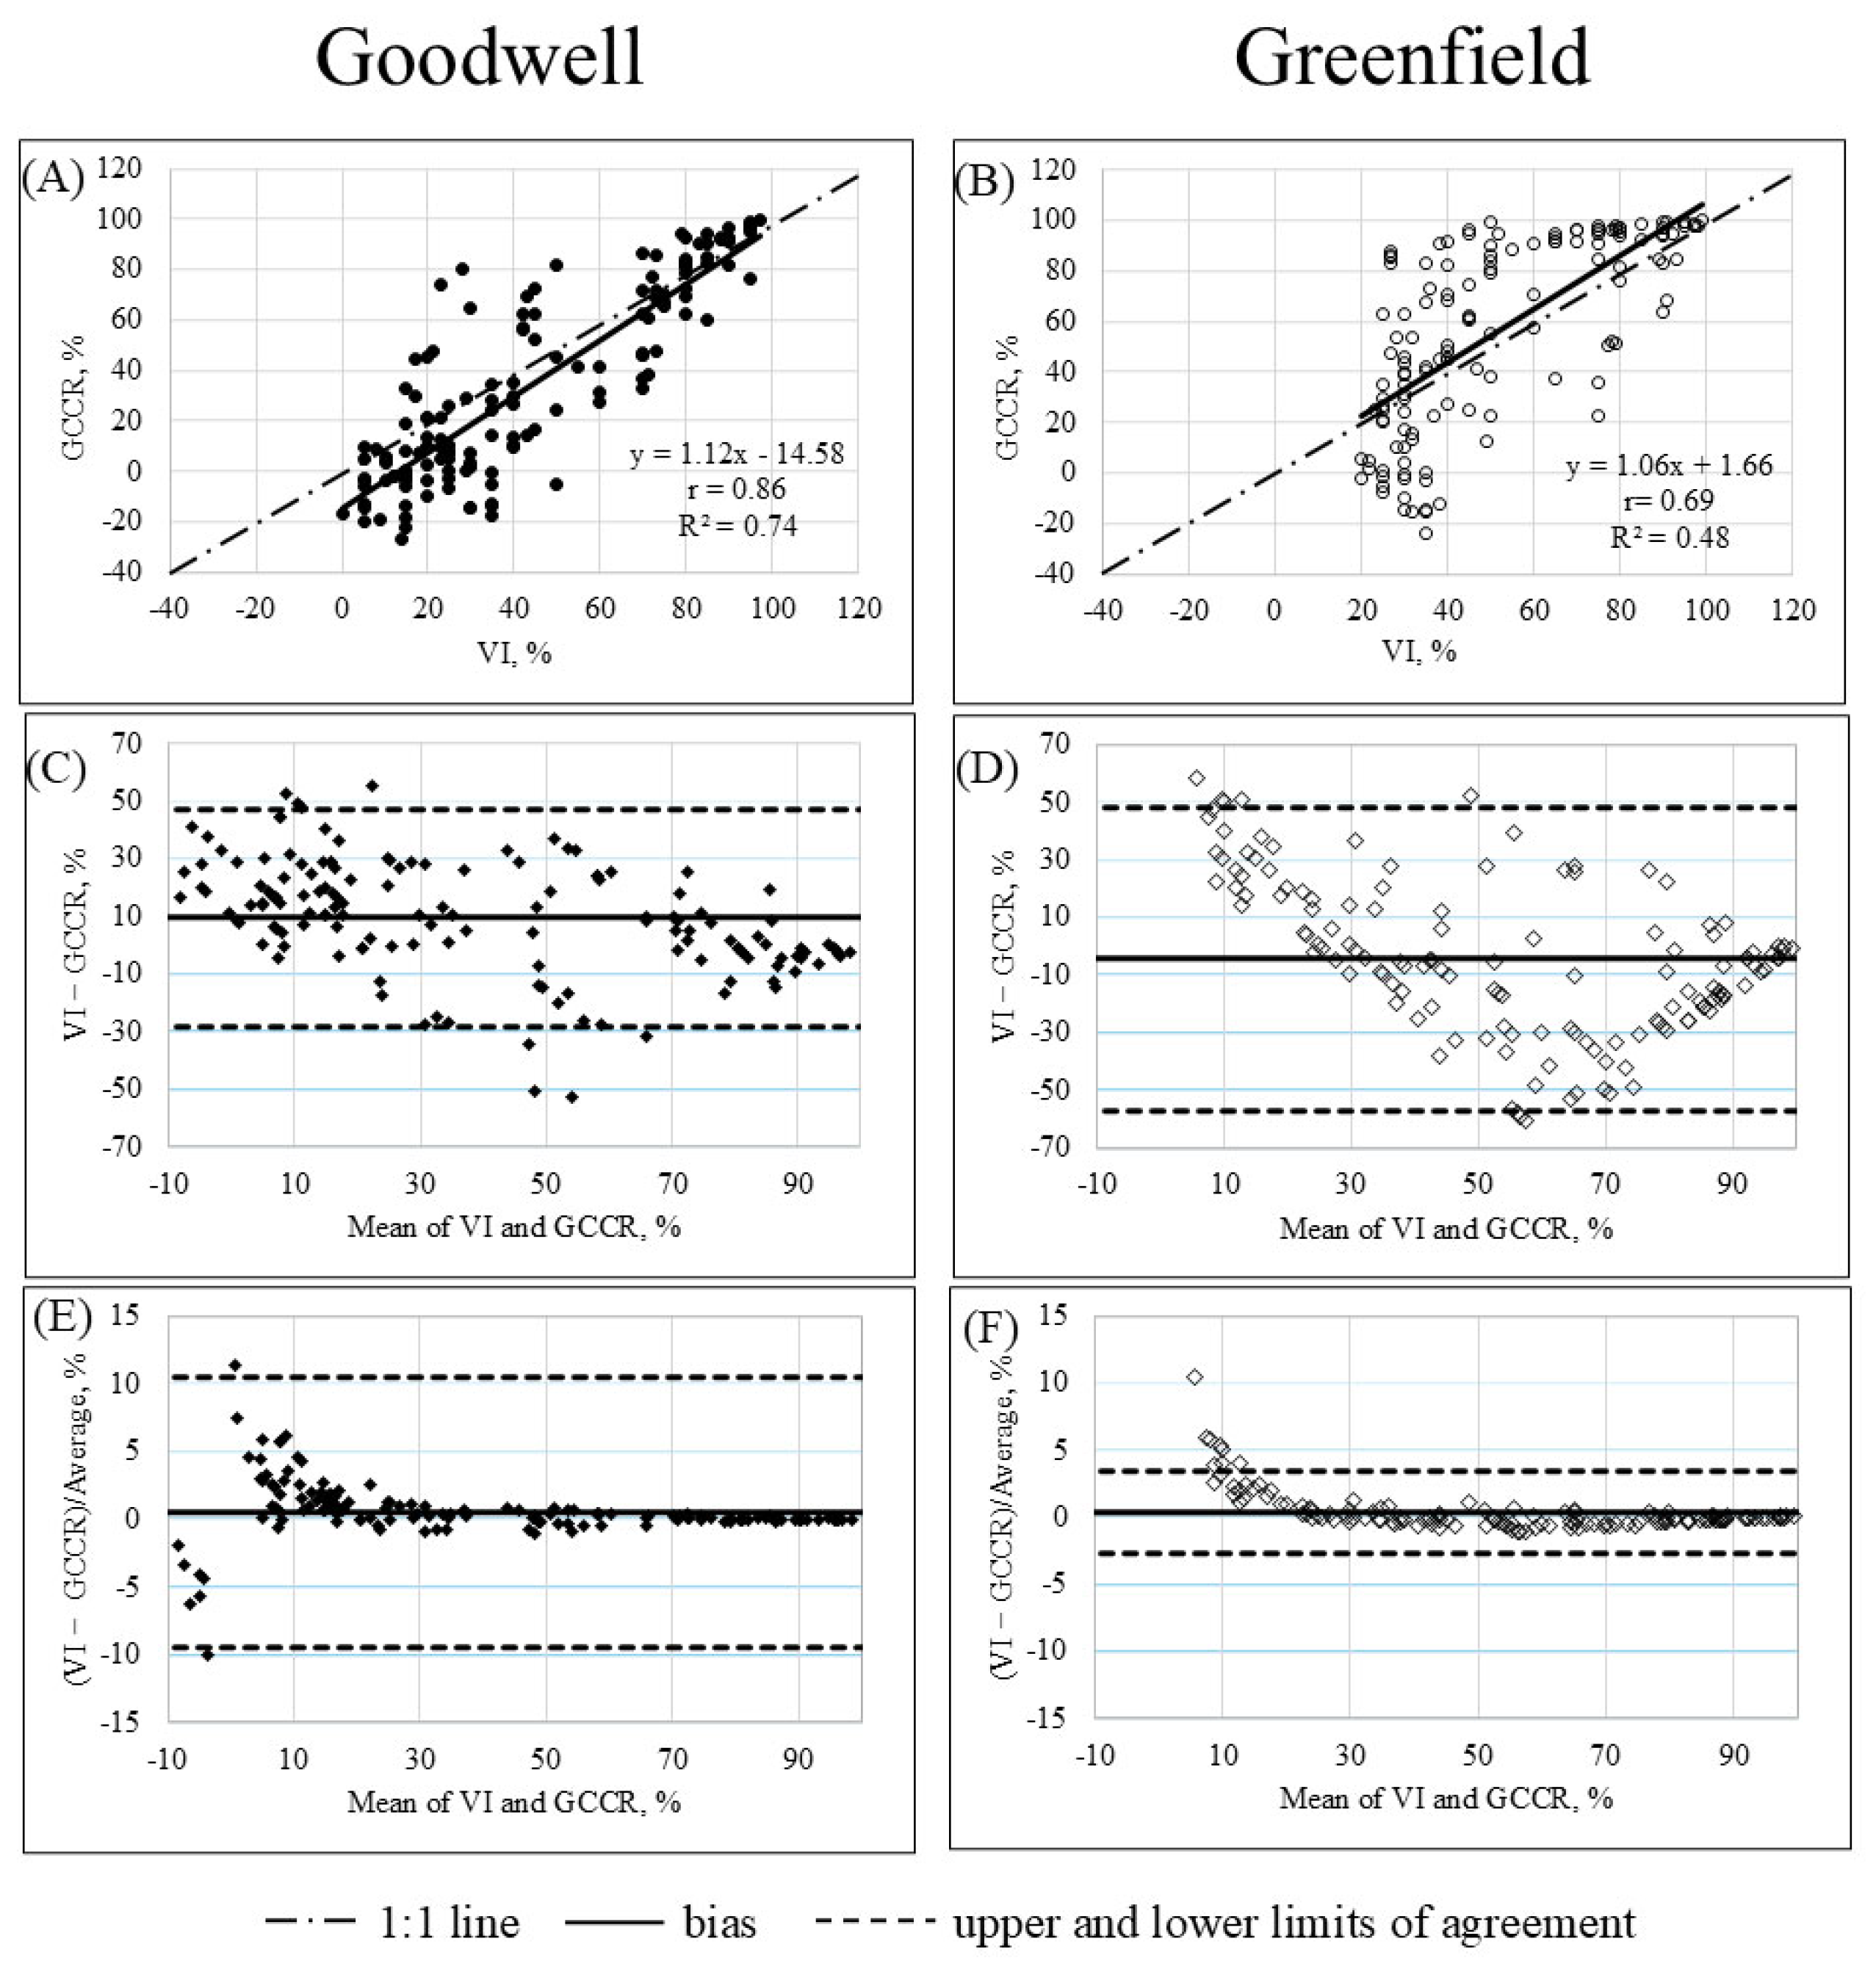
In the GCCR vs. visual rating methods comparison for the Goodwell cultivar, the linear regression had an intercept (β0 = −14.58, p-value < 0.01) and a slope (β1 = 1.12, p-value = 0.04) that were different from zero and one, respectively (Figure 1A). In addition, its correlation (r) value was 0.86. For the Greenfield cultivar, the linear regression had an intercept (β0 = 1.66, p-value = 0.7637) and a slope (β1 = 1.06, p-value = 0.55) that were not different from zero and one, respectively (Figure 1B). Also, its correlation (r) value was 0.69.
Figure 1.
A comparison between visual injury and green canopy cover reduction collected from Goodwell (A) and Greenfield (B) bermudagrass cultivars; Bland–Altman plots for Goodwell (C) and Greenfield (D); and Bland and Altman mean differences for Goodwell (E) and Greenfield (F).
Further visual inspection using Bland–Altman plots for each cultivar (Figure 1C,D) revealed that in more than 95% of glyphosate injury estimates, values from both methods were within the limits of agreement, with biases of 9.48 and −4.55 for Goodwell and Greenfield, respectively. Thus, both methods were considered fairly equivalent for both cultivars. However, visual trends were found in both cases. For the Goodwell cultivar, the GCCR tended to reproduce lower glyphosate injury values than the visual rating method for injuries of less than 40% in most cases, whereas the opposite was true for injuries greater than 40% (Figure 1C). A similar but more pronounced trend was observed in the Greenfield cultivar (Figure 1D), in which all GCCR%-based estimates of glyphosate injury were lower than the corresponding visual ratings at injury levels below 30%. Moreover, most GCCR-estimated values exceeded the visual rating-estimated values; however, GCCR-overestimated values tended to be smaller as glyphosate injury levels increased from 70 to 100%. Finally, the Bland and Altman plots expressing differences as percentages (Figure 1E,F) demonstrated that Goodwell and Greenfield’s biases (mean differences) were 0.54 and 0.37, which were nearly constant across all estimated glyphosate injury values, except for very low values.
3.2. Linear Mixed Model Analysis of Green Canopy Cover Reduction
Although numerical differences between the greatest glyphosate rate (3.08 kg a.i. ha−1) and its half rate (1.54 kg a.i. ha−1) applied in Goodwell cultivar plants were substantial in magnitude—18.8, 12.23, and 29.25 percent units at 8, 16, and 24 DAG—both rates were not significantly different from each other (Table 1). However, these two top glyphosate rates were greater than all others (0.39, 0.53, and 1.06 kg a.i. ha−1) in all evaluated periods. Greenfield also showed the greatest numerical GCCR values at the greatest glyphosate rate, which were substantially different in magnitude from its half rate—17.49, 16.12, and 20.79 percent units at 8, 16, and 24 DAG; and, like Goodwell, no statistical differences were found between the top two glyphosate rates at all evaluated periods. Greenfield’s top glyphosate rate injury values exceeded 1.06, 0.53, and 0.39 kg a.i. ha−1 at 8 DAG, 0.39 kg a.i. ha−1 at 16 DAG, and 0.53 and 0.39 kg a.i. ha−1 at 24 DAG, respectively.
Table 1.
Green Canopy Cover Reduction (GCCR) in ‘Goodwell’ and ‘Greenfield’ bermudagrass cultivars following different glyphosate rates applications at 8, 16, and 24 days after application (DAG).
The numerical GCCR peak was observed at 16 DAG for both cultivars treated with all glyphosate rates. However, Greenfield was the only cultivar that showed significant differences. Greenfield plants treated with all glyphosate rates, except for 1.54 kg a.i. ha−1, had GCCR values at 8 DAG that were lower than at later dates. Greenfield also had higher GCCR values than the Goodwell cultivar at 1.06, 0.53, and 0.39 kg a.i. ha−1 at 16 and 24 DAG.
4. Discussion
GCCR and visual rating were correlated for both cultivars; however, Greenfield was the only cultivar that followed a 1:1 linear trend. The proposed GCCR method overestimated glyphosate injury values of less than 30% and 40% compared to the commonly adopted visual rating method for the Greenfield and Goodwell cultivars, respectively. As expected, the lower the glyphosate rate applied, the smaller the glyphosate injury observed. Thus, most GCCR-overestimated injury values were derived from low glyphosate rates, such as 0.39, 0.53, and 1.06 kg a.i. ha−1. Glyphosate acts in plants by altering physiological processes, including photosynthesis, chlorophyll biosynthesis, photochemical reactions, and plant mineral nutrition, leading to gradual wilting and yellowing (chlorosis), which can progress to necrosis [28,29,30]. These color variations (green-brown) fall into the hue range from 5G to 5YR in the Munsell color system, where yellowing is classified as the intermediate hue 10 GY and 5 GY [31]. Greater difficulty in visually assessing yellowish canopies, due to a mix of color tones (green and yellow), might have led the visual rating individual to consistently categorize yellowish plant tissues as no injured plant tissue. In contrast, the Canopeo-based GCCR method consistently categorized them as having “no green–injured plant tissue”. This issue was also noted by Webster [32] in a study of human color hue identification among 51 individuals. The authors argued that ambient lighting can significantly affect an individual’s color hue rating and that human color perception is subjective due to differences in the proportions of cone receptors among individuals. Even though Canopeo was initially developed using visual estimates [21], the software’s estimates were at the pixel level, eliminating subjectivity associated with “unzoomed images” or visual ratings.
Conversely, the GCCR method underestimated glyphosate injury values of greater than 30 and 40% compared to the visual rating method for the Greenfield and Goodwell cultivars, respectively. Most GCCR-overestimated injury values derived from high glyphosate rates, such as 1.54 and 3.08 kg a.i. ha−1. At these high rates, most plant tissues turned necrotic rather than yellowish green, drastically reducing visual rating individual color hue variation biases (which led to overestimation at low rates, as previously discussed). Furthermore, bermudagrass is a resilient plant that can regrow quickly from physical and chemical damage due to its wide integration of rhizomes and stolons that store great amounts of energy reserves and contain new growing points [33]. Thus, the visual rating of an individual might not have properly accounted for newly formed green plant tissues captured by the Canopeo-based GCCR method. New plant tissue growth also occurred at low glyphosate rates; however, the reduction in green area in these cases was relatively small, so the new green growth had a minor effect on the final injury value.
It is interesting to note that Greenfield GCCR’s overestimated values tended to be smaller in magnitude as glyphosate injury values increased from 70 to 100%. Greenfield is a grazing type with prostrate growth. Its leaves and stems are relatively small compared to other cultivars, and it grows slowly and steadily throughout the season [34]. Greenfield’s steady, slow growth was greatly reduced at high glyphosate rates, narrowing the new sward growth bias between the two evaluated methods. Conversely, Goodwell is a hay type with increased leaf and stem growth rates, resulting in taller swards than grazing types [35]. Thus, Goodwell, unlike Greenfield, maintained the new sward growth bias at high glyphosate rates.
The GCCR linear mixed model analysis presented in this article yielded inferences similar to those from the analog visual injury linear mixed model analysis presented in [36]. Overall, both methods, i.e., GCCR and visual rating, indicated that glyphosate injury in Goodwell was predominantly established and highly noticeable by 8 DAG, whereas in Greenfield, the injury developed steadily from the application day through 16 DAG. Regardless of the rate of glyphosate injury development, peak visual injury values for both cultivars were recorded at 16 DAG across all glyphosate rates. Finally, both methods detected reductions in glyphosate injury at 24 DAG.
5. Conclusions
The commonly adopted visual rating and the proposed Canopeo-based GCCR method were correlated; however, Greenfield cultivar was the only one that followed a 1:1 linear trend. A meticulous analysis using the Bland–Altman method demonstrated that at low glyphosate rates (0.39 and 0.53 kg a.i. ha−1), the GCCR-estimated injury values tended to overestimate glyphosate injury when compared with the visual rating method. The reverse was true. At high glyphosate rates (1.54 and 3.08 kg a.i. ha−1), the GCCR method tended to underestimate glyphosate injury values exceeding 30 and 40% for Greenfield and Goodwell, respectively. We speculate that the challenge of visually assessing yellowish canopies, which mix green and yellow tones, may have led the evaluator to consistently classify yellowish tissues as unaffected. Moreover, the individual may not have adequately considered the newly identified green plant tissues by the Canopeo-based GCCR method. Further research must validate the use of the Canopeo-based GCCR method for other weed species as a complementary method to the commonly adopted visual rating system.
Author Contributions
Writing—original draft, A.C.R. and L.F.A.; Data curation, L.F.A., A.C.R. and C.L.G.; Formal analysis, C.L.G.; Funding acquisition, A.C.R.; Investigation, L.F.A., A.C.R. and M.R.M.; Methodology, A.C.R. and M.R.M.; Project administration, A.C.R.; Resources, A.C.R. and M.R.M.; Supervision, A.C.R. and M.R.M.; Visualization, A.C.R.; Writing—review and editing, J.A.A. and A.C.R. All authors have read and agreed to the published version of the manuscript.
Funding
This work was supported by the Oklahoma Agriculture Experimental Station (OAES), Oklahoma State University. The funding sources did not play any role in the design of the study, the collection and analysis of data, the decision to publish, or the preparation of the manuscript.
Data Availability Statement
Data are available upon reasonable request.
Conflicts of Interest
Author Misha R. Manuchehri was employed by the company Department of R&D—Weed Management, BASF, Research Triangle Park. The remaining authors declare that the research was conducted in the absence of any commercial or financial relationships that could be construed as a potential conflict of interest.
References
- Hill, G.M.; Gates, R.N.; West, J.W. Advances in bermudagrass research involving new cultivars for beef and dairy production. J. Anim. Sci. 2001, 79, E48–E58. [Google Scholar] [CrossRef] [Scilit]
- Teuton, T.C.; Unruh, J.B.; Brecke, B.J.; Miller, G.L.; Mueller, T.C. Hybrid Bermudagrass (Cynodon dactylon (L.) Pers. × C. transvaalensis Burtt-Davy) Control with Glyphosate and Fluazifop. Appl. Turfgrass Sci. 2005, 2, 1–6. [Google Scholar] [CrossRef] [Scilit]
- Ferrell, J.A.; Murphy, T.R.; Bridges, D.C. Postemergence Control of Hybrid Bermudagrass (Cynodon transvaalensis Burtt-Davy × Cynodon dactylon). Weed Technol. 2005, 19, 636–639. [Google Scholar] [CrossRef] [Scilit]
- Munshaw, G.C.; Philley, H.W.; Beasley, J.S. No-till strategies for converting common bermudagrass (Cynodon dactylon L.) to improved seeded cultivars. Int. Turfgrass Soc. Res. J. 2009, 11, 427–436. [Google Scholar]
- Johnson, B. Glyphosate and Sc-0224 for bermudagrass (Cynodon spp.) cultivar control. Weed Technol. 1988, 2, 20–23. [Google Scholar] [CrossRef] [Scilit]
- Bryson, C.; Wills, G. Susceptibility of bermudagrass (Cynodon dactylon) biotypes to several herbicides. Weed Sci. 1985, 33, 848–852. [Google Scholar] [CrossRef] [Scilit]
- Webster, T.; Bednarz, C.; Hanna, W. Sensitivity of triploid hybrid bermudagrass cultivars and common bermudagrass to postemergence herbicides. Weed Technol. 2003, 17, 509–515. [Google Scholar] [CrossRef] [Scilit]
- Webster, T.M.; Hanna, W.W.; Mullinix, B.G., Jr. Bermudagrass (Cynodon spp.) dose–response relationships with clethodim, glufosinate and glyphosate. Pest Manag. Sci. 2004, 60, 1237–1244. [Google Scholar] [CrossRef] [Scilit] [PubMed]
- Johnson, B.J. Purple nutsedge control by bentazon and perfluidone in turfgrasses. Weed Sci. 1975, 23, 349–353. [Google Scholar] [CrossRef] [Scilit]
- Leinauer, B.; VanLeeuwen, D.M.; Serena, M.; Schiavon, M.; Sevostianova, E. Digital image analysis and spectral reflectance to determine turfgrass quality. Agron. J. 2014, 106, 1787–1794. [Google Scholar] [CrossRef] [Scilit]
- Richardson, M.D.; Karcher, D.E.; Purcell, L.C. Quantifying Turfgrass Cover Using Digital Image Analysis. Crop Sci. 2001, 41, 1884–1888. [Google Scholar] [CrossRef] [Scilit]
- Krans, J.V.; Morris, K. Determining a profile of protocols and standards used in the visual field assessment of turfgrasses: A survey of national turfgrass evaluation program-sponsored university scientists. Appl. Turfgrass Sci. 2007, 4, 1–6. [Google Scholar] [CrossRef] [Scilit]
- Karcher, D.E.; Richardson, M.D. Batch analysis of digital images to evaluate turfgrass characteristics. Crop Sci. 2005, 45, 1536–1539. [Google Scholar] [CrossRef] [Scilit]
- Korhonen, L.; Korhonen, K.T.; Rautiainen, M.; Stenberg, P. Estimation of forest canopy cover: A comparison of field measurement techniques. Silva Fenn. 2006, 40, 577–588. [Google Scholar] [CrossRef] [Scilit]
- Purcell, L.C. Soybean canopy coverage and light interception measurements using digital imagery. Crop Sci. 2000, 40, 834–837. [Google Scholar] [CrossRef] [Scilit]
- Rasmussen, J.; Mathiasen, H.; Bibby, B.M. Timing of post-emergence weed harrowing. Weed Res. 2010, 50, 436–446. [Google Scholar] [CrossRef] [Scilit]
- Govindasamy, P.; Mahawer, S.K.; Sarangi, D.; Halli, M.M.; Das, T.K.; Raj, R.; Pooniya, V.; Muralikrishnan, L.; Kumar, S.; Chandra, A. The comparison of Canopeo and samplepoint for measurement of green canopy cover for forage crops in India. MethodsX 2022, 9, 101916. [Google Scholar] [CrossRef] [Scilit] [PubMed]
- McGlinch, G.J.; Jacqumin, S.J. Evaluating Winter Malting Barley Grain Yield with Fractional Green Canopy Cover. Crop Forage Turfgrass Manag. 2021, 7, e20079. [Google Scholar] [CrossRef] [Scilit]
- Reed, V.; Arnall, D.B.; Finch, B.; Souza, J.L.B. Predicting Winter Wheat Grain Yield Using Fractional Green Canopy Cover (FGCC). Int. J. Agron. 2021, 2021, 1443191. [Google Scholar] [CrossRef] [Scilit]
- He, Y.; Dosanjh, M.; Shang, J.; Liu, J.; Drury, C.F.; Yang, X.; Yang, J.; Dao, P.D.; Axiotis, A.; Proctor, C. Mapping crop fractional green canopy cover using high spatial resolution thermal and optical remote sensing in southern Ontario, Canada. Geomatica 2021, 75, 116–129. [Google Scholar]
- Noh, T.k.; Yook, M.J.; Kim, D.S. Rapid diagnosis of herbicidal activity and mode of action using spectral image analysis and machine learning. Plant Phenomics 2025, 7, 100038. [Google Scholar] [CrossRef] [Scilit] [PubMed]
- Jeong, S.M.; Noh, T.K.; Kim, D.S. Hrbicide Bioassay Using a Multi-Well Plate and Plant Spectral Image Analysis. Sensors 2024, 24, 919. [Google Scholar] [CrossRef] [Scilit] [PubMed]
- Soto Valencia, M.A. Hyperspectral Indicators and Characterization of Glyphosate-Induced Stress in Common Lambsquarters (Chenopodium album L.). Master’s Thesis, University of Arkansas-Fayetteville, Fayetteville, AR, USA, 2025. Available online: https://scholarworks.uark.edu/etd/6019 (accessed on 1 March 2026).
- Giavarina, D. Understanding bland altman analysis. Biochem. Medica 2015, 25, 141–151. [Google Scholar] [CrossRef] [Scilit]
- Patrignani, A.; Ochsner, T.E. Canopeo: A powerful new tool for measuring fractional green canopy cover. Agron. J. 2015, 107, 2312–2320. [Google Scholar] [CrossRef] [Scilit]
- Haghayegh, S.; Kang, H.-A.; Khoshnevis, S.; Smolensky, M.H.; Diller, K.R. A comprehensive guideline for Bland–Altman and intra class correlation calculations to properly compare two methods of measurement and interpret findings. Physiol. Meas. 2020, 41, 055012. [Google Scholar] [CrossRef] [Scilit] [PubMed]
- Littell, R.C.; Milliken, G.A.; Stroup, W.W.; Wolfinger, R.D. SAS System for Mixed Models; SAS Inst. Inc.: Cary, NC, USA, 1996; pp. 31–63. [Google Scholar]
- Fernandez, C.; Bayer, D. Penetration, translocation, and toxicity of glyphosate in bermudagrass (Cynodon dactylon). Weed Sci. 1977, 25, 396–400. [Google Scholar] [CrossRef] [Scilit]
- Gomes, M.P.; Smedbol, E.; Chalifour, A.; Hénault-Ethier, L.; Labrecque, M.; Lepage, L.; Lucotte, M.; Juneau, P. Alteration of plant physiology by glyphosate and its by-product aminomethylphosphonic acid: An overview. J. Exp. Bot. 2014, 65, 4691–4703. [Google Scholar] [CrossRef] [Scilit] [PubMed]
- Mahakhode, R.H.; Somkuwar, S.R. Morphoanatomical and structural alterations in Psoralea corylifolia (L.) induced by glyphosate. Int. J. Pharm. Sci. 2015, 30, 136–140. [Google Scholar]
- Malacara, D. Color Vision and Colorimetry: Theory and Applications; SPIE: Bellingham, WA, USA, 2011. [Google Scholar]
- Webster, A.W.; Miyahara, E.; Malkoc, G.; Raker, V.E. Variations in normal color vision. II. Unique hues. J. Opt. Soc. Am. 2000, 17, 1545–1555. [Google Scholar] [CrossRef] [Scilit] [PubMed]
- Barker, D.J.; MacAdam, J.W.; Butler, T.J.; Sulc, R.M. Chapter 2—Forage and Biomass Planting. In Conservation Outcomes from Pastureland and Hayland Practices: Assessment, Recommendations, and Knowledge Gaps; Allen Press: Lawrence, KS, USA, 2012; pp. 41–110. [Google Scholar]
- Elder, W.C. Greenfield Bermuda-Grass 1955; Bulletin No. 455; Oklahoma Agricultural Experiment Station: Stillwater, OK, USA, 1955. [Google Scholar]
- Abreu, L.F.; Rocateli, A.C. Selecting an Appropriate Bermudagrass Variety for Pastures, Oklahoma State University. Available online: https://extension.okstate.edu/fact-sheets/selecting-an-appropriate-bermudagrass-variety-for-pastures (accessed on 1 March 2026).
- Abreu, L.F.; Rocateli, A.C.; Manuchehri, M.R.; Arnall, D.B.; Goad, C.L.; Antonangelo, J.A. Assessing forage bermudagrass cultivar tolerance to glyphosate application. Crop Forage Turfgrass Manag. 2020, 6, e20072. [Google Scholar] [CrossRef] [Scilit]

Disclaimer/Publisher’s Note: The statements, opinions and data contained in all publications are solely those of the individual author(s) and contributor(s) and not of MDPI and/or the editor(s). MDPI and/or the editor(s) disclaim responsibility for any injury to people or property resulting from any ideas, methods, instructions or products referred to in the content. |
© 2026 by the authors. Licensee MDPI, Basel, Switzerland. This article is an open access article distributed under the terms and conditions of the Creative Commons Attribution (CC BY) license.