


Abstract
Understanding how weed species interact over long timescales is essential for predicting community dynamics and developing sustainable weed management strategies. This study analyzes the structure and stability of competitive interactions within a weed community composed of Descurainia sophia, Fumaria spp., Papaver rhoeas and Veronica hederifolia using a 20-year dataset from a long-term cereal–legume rotation experiment conducted under conventional and no-tillage systems in central Spain. Intra- and interspecific interactions were quantified using discrete-time, density-dependent population models based on Lotka–Volterra competition theory, and the extent to which crop phase and tillage system altered competitive relationships was evaluated. Results indicated that competitive structures remained stable as neither tillage nor crop phase modified the estimated coefficients. This suggests that management primarily affected population densities rather than the strength of the interactions. Competitive hierarchies were characterized by asymmetric effects among species, with Fumaria spp. exerting strong suppressive effects on weaker competitors. Overall, the findings support the prominent role of density-dependent regulation, particularly intraspecific competition, in shaping long-term weed community dynamics. These results provide a basis for more targeted weed management by helping to identify species that may require active control versus those that could be tolerated under specific conditions, potentially supporting reduced herbicide inputs and more sustainable agroecosystem management.
1. Introduction
Weeds represent the foremost biotic limitation to global agricultural productivity, as they compete with crops for essential resources such as light, water and nutrients [1]. It has been estimated that approximately 1800 weed species reduce global crop production by more than 30%, resulting in substantial economic losses of nearly USD 30 billion per year [2]. In extreme cases, inadequate weed control may lead to complete crop failure. Understanding the ecological mechanisms that regulate weed population dynamics is therefore central to the development of effective and sustainable weed management strategies.
Historically, research on weed interference has focused on specific species and short-term experiments, often using manipulative designs such as replacement or additive series experiments that evaluate pairs of species under controlled conditions [3]. While these approaches have provided valuable insights into the competitive mechanisms, they rarely capture the complexity of real agricultural systems, where weed communities consist of multiple interacting species subject to repeated disturbance and temporal variability. Under field conditions, weed communities function as assemblages of multiple interacting species that differ markedly in abundance, competitive ability, and demographic responses, and where population dynamics cannot be inferred by the behavior of an individual species in isolation.
Different studies have demonstrated that weed species differ substantially in their competitive impacts and responses, often resulting in asymmetric or hierarchical interaction structures within communities [4]. Such asymmetries may strongly influence coexistence, dominance patterns, and long-term population trajectories. However, assessments of multispecies weed competition remain limited, largely due to the scarcity of long-term datasets. As a result, the role of interspecific interactions in structuring weed communities over decadal time scales remains insufficiently understood.
From a community-ecology perspective, density dependent regulation is considered a central mechanism governing population dynamics and community stability [5,6]. In agricultural systems, both intra and interspecific density dependence may be further influenced by management induced disturbance regimes [7]. According to resource competition theory, differences in resource availability, disturbance intensity, and temporal heterogeneity can potentially modify competitive hierarchies by altering species’ relative performance [8]. Management activities such as crop rotation and tillage intensity are examples of disturbance regimes that have the capacity to affect resource availability [9,10]. Empirical evidences, however, remains contradictory, with some studies reporting management driven shifts in weed competitiveness, while others suggesting remarkable stability in interaction patterns over time [9,11].
Identifying whether management practices modify only weed abundances or also alter the underlying strength of competitive interactions represents a central challenge in weed ecology, with direct implications for integrated weed management. From an applied perspective, this distinction is critical. If interaction strengths remain stable across management regimes, population-based multispecies models can function as robust and transferable decision support tools. Conversely, if management practices actively reshape competitive coefficients, effective weed control must rely on more adaptive, species specific, and context dependent strategies, explicitly accounting for community composition and management history. Addressing this issue requires long-term, multispecies datasets, which remain scarce in weed science.
This evidence underscores a key gap in the field: the competitive dynamics of weed communities cannot be reliably understood or predicted without explicitly considering how management influences species interactions through time. Progress toward more intelligent and ecologically grounded integrated weed management systems therefore depends on identifying species-specific competitive strengths and quantifying intra-and interspecific interactions [12]. Incorporating this information into management frameworks would enable a shift toward more precise and adaptive agricultural practices, in which interventions are guided not only by weed abundance but also by the competitive profile of each species and its responsiveness to management actions.
The present study investigates the structure and stability of competitive interactions within a weed community using a 20-year time series from a long-term cereal–legume rotation experiment conducted under two tillage systems in central Spain. Focusing on four dominant annual broadleaf species, a density-dependent population modeling framework based on realized per capita growth rates is used to quantify the relative contributions of intraspecific and interspecific competition to population dynamics. Specifically, we assess whether crop phase and tillage system modify the strength and structure of competitive interactions, or whether these interactions remain stable despite pronounced temporal variation in species abundances. Accordingly, we address three questions:
- (i)
- To what extent are weed population dynamics regulated by intra versus interspecific density dependence?
- (ii)
- Do competitive interactions exhibit asymmetric or hierarchical structures within the community?
- (iii)
- Are these interaction structures stable across contrasting crop phases and tillage regimes?
2. Materials and Methods
2.1. Experimental Information
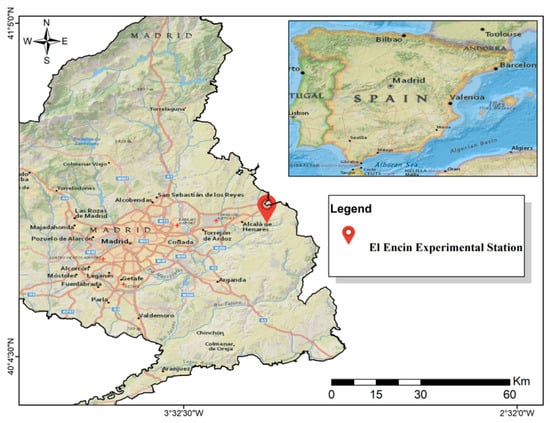
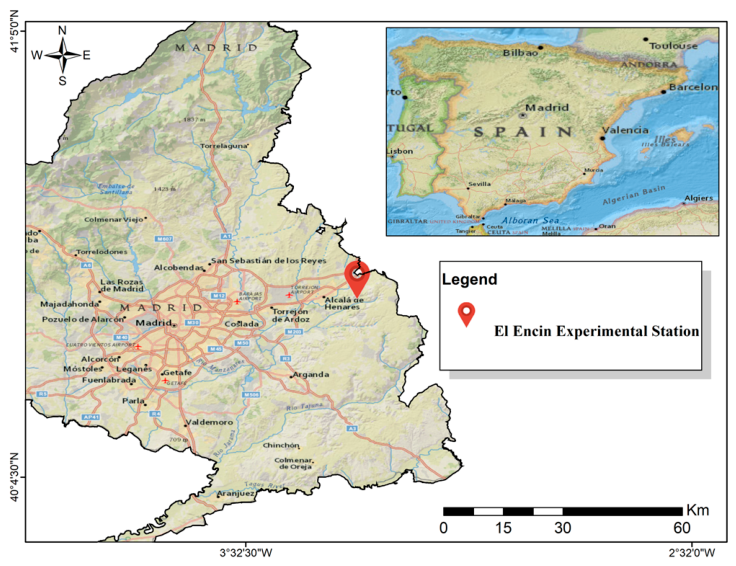
This study is based on a long-term field experiment conducted at the El Encin Experimental Station located at Alcalá de Henares, Madrid, Spain (Figure 1). The region is at an altitude of 610 m.a.s.l. and has a mediterranean climate, with mild, wet winters and warm to hot, dry summers. The soil is classified as an alfisol xeralf of the caciortic–molic subgroup, with a pH of 7.8 and 1.2% organic matter. The average annual rainfall in the study period was 430 mm (ranging from 230 to 765 mm), and the average annual temperature was 13.8 °C (ranging from 11.9 to 15.5 °C).
Figure 1.
Geographical location of El Encín Experimental Station within the Iberian Peninsula in central Spain (latitude 40°31′15.6″ N, longitude 3°17′24.5″ W).
The experiment consisted in a biennial rotation of winter wheat (Triticum aestivum L.) and vetch (Vicia sativa L.) under three tillage systems: conventional, no tillage and minimum tillage. Cereal–legume rotations are widely used in Mediterranean cropping systems in Spain, particularly in low-input or organic systems where herbicide use is limited. The cereal planting dates ranged from 30 November to 19 December, while the legume planting dates spanned from 24 December to 19 January. In the wheat rotation phase, fertilizers were applied at relatively high rates (76 kg N ha−1, 120 kg P ha−1, 40 kg K ha−1), and post-emergence herbicides were used to control dicotyledonous weeds at the tillering stage. In the vetch crop, fertilizers were applied at planting, averaging 27 kg N, 22 kg P, and 22 kg K ha−1, without post-emergence herbicides.
The trial was established in four blocks of approximately 20 m × 30 m, arranged in a randomized form. Weed density was recorded annually. An M-shaped sampling pattern within each plot was used. Samples were taken with a distance of approximately 15 m between each other’s and at least 3 m from the plot edges. In the first three years, five destructive samples (30 cm × 33 cm) were taken. This quantity was double in the rest of the years. Exceptionally, 20 samples were collected once. Sampling took place between February and April (mid-tillering in wheat and stem elongation in legumes) prior to herbicide application to ensure a standardized assessment of early-season weed communities.
The collected material was kept in plastic bags and transported to the laboratory, where individual species were identified and counted. A total of 44 species generally found in cereal or leguminous fields in central Spain were recorded between 1986 and 2017, with the exception of 1990 and 1997 [13]. The majority were species of autumn emergence and flowering in early spring, though some were species that typically emerge in early spring. The present study focuses on Descurainia sophia L. (DESSO), Fumaria spp. (1FUMG), Papaver rhoeas L. (PAPRH), and Veronica hederifolia L. (VERHE). They conform to the core of most abundant species, and their persistent seed banks make them good candidates for the study of long-term population dynamics and trends.
2.2. Weed Time Series
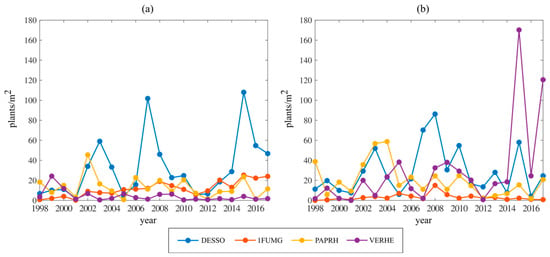
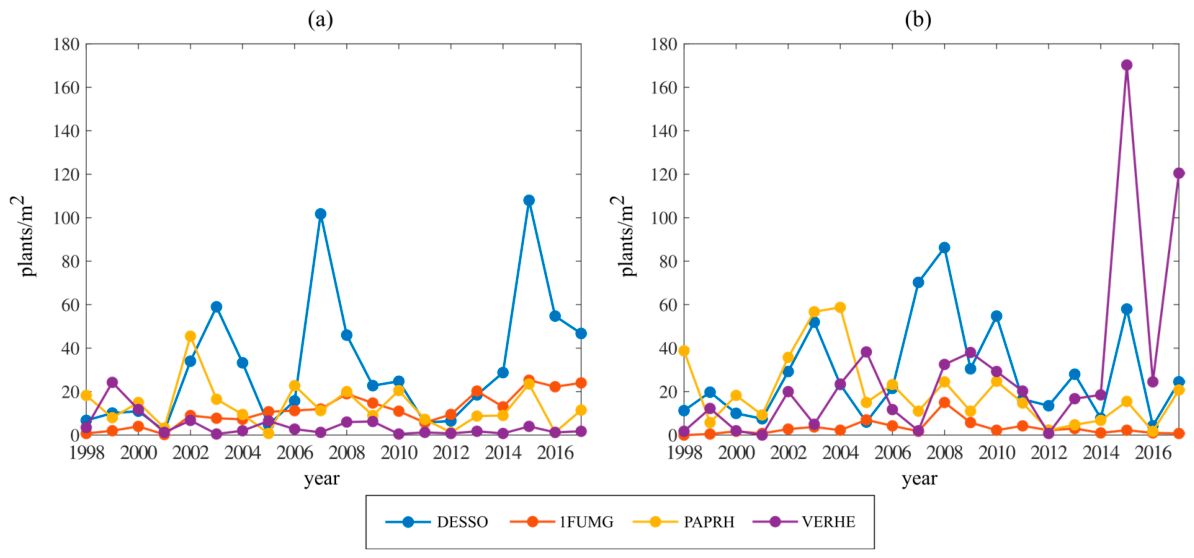
The analysis focused on conventional tillage (CT) and no-tillage (NT) since they represent contrasting disturbance regimes and provide sufficient temporal continuity for modeling. Preliminary inspection of the time series revealed transient dynamics during the early years of the experiment. To avoid confounding these transitional dynamics with the long-term density-dependent processes of interest, the analysis was restricted to the most recent and temporally continuous period (1998–2017), which provides the longest uninterrupted sequence of observations (Figure 2).
Figure 2.
Time series of weed community species under different tillage management from 1998 to 2017. Values represent mean densities across replicate plots in a long-term winter wheat–vetch rotation experiment. (a) Conventional Tillage (CT); (b) No-Tillage (NT).
2.3. Weed Population Dynamics Modeling
Weed population dynamics arise from the combined effects of endogenous feedback processes, such as density-dependent regulation and interspecific competition, and exogenous influences such as crop type or tillage system. To evaluate the extent to which the density of one species influences the population growth of others, and to determine whether these effects depend on crop type or tillage system, we analyzed weed dynamics using a population-ecology framework based on the realized per capita growth rates and competition coefficients [14].
The realized per capita growth rate (r) of each weed species was calculated as,
where represents the density of species i in year t. This transformation provides a symmetric scale for population increase and decline, enables linear interpretation of density-dependent effects, and improves the normality and homoscedasticity of residuals [11]. Hereafter, N1,t, N2,t, N3,t, and N4,t denote the annual densities of DESSO, 1FUMG, PAPRH and VERHE, respectively.
A linear mixed-effects formulation based on the discrete-time Lotka–Volterra competition model was used to describe the population dynamics of each weed species:
where
- is the density of the focal species and () are the densities of competing species. Densities were included in their original units to preserve the biological interpretability of the competition coefficients.
- is the intercept, representing the expected per capita growth rate when species densities approach zero and in the reference levels of the categorical variables.
- represents the base effect of species k on the growth rate of species i when the binary variables are zero. The coefficient corresponds to the intraspecific competition for and the interspecific competition for .
- includes fixed effects associated with management factors (crop phase, tillage system, and their interactions when applicable),
- represents random effects,
- is the residual error term, assumed to be independent and homoscedastic.
- The experimental factors considered were
- Crop rotation: included as a binary variable (Crop = 0 for vetch; Crop = 1 for wheat);
- Tillage system: also coded as a binary variable (Tillage = 0 for CT; Tillage = 1 for NT).
This modeling framework assumes that density dependent interactions act additively on the realized per capita growth rates and that observed temporal changes in population abundance reflect the combined effects of intrinsic growth, interspecific interactions, and management context. In contrast to previous contributions [15], all observations of the experiment were unified into a single dataset. Thus, density-dependent interactions and management effects were evaluated simultaneously within the same model. This approach allowed direct comparison of interaction coefficients across treatments while preserving the full variability present in the long-term dataset.
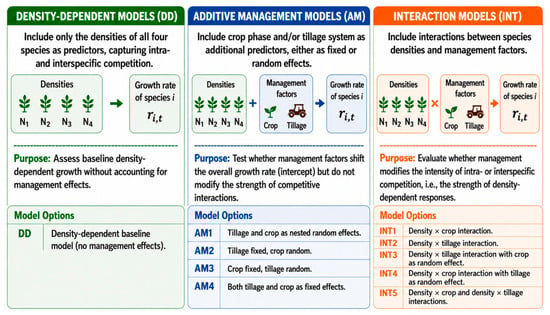
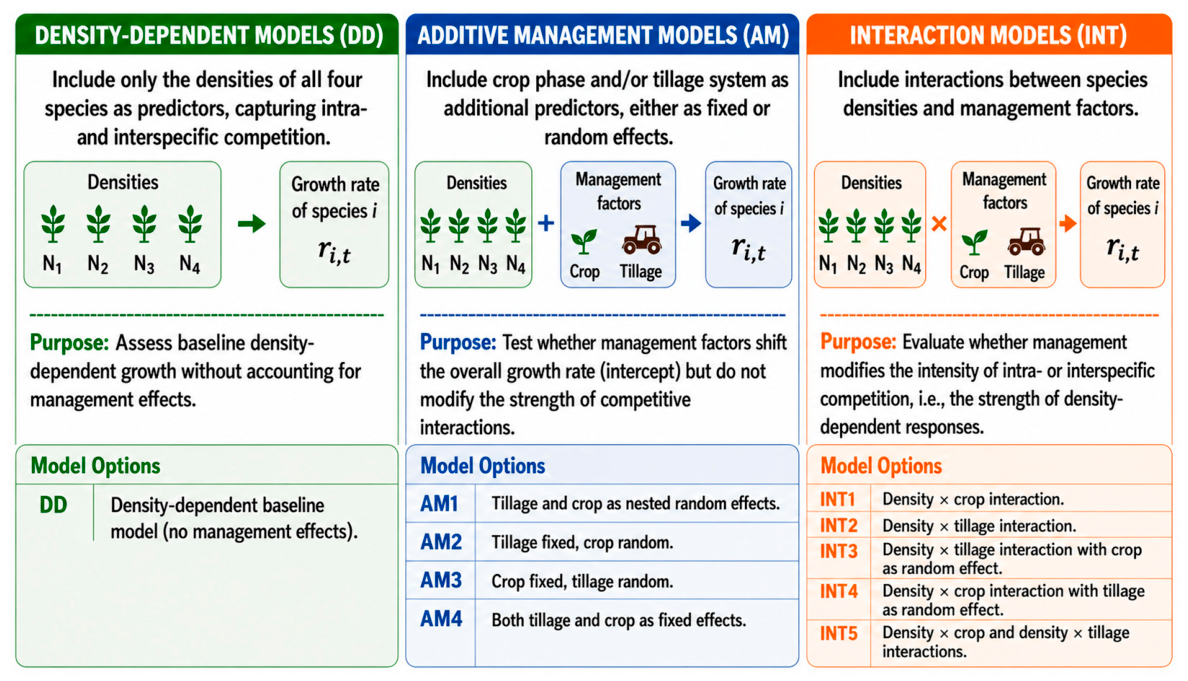
Based on this general framework, a series of candidate models were fitted separately for each species. All the possible formulations designed to test three ecological hypotheses regarding how crop and tillage influence population dynamics are depicted in Figure 3. Models share a common density-dependent baseline including intra- and interspecific effects.
Figure 3.
Conceptual scheme the candidate model families evaluated to describe interannual population growth dynamics, grouped according to how management factors were incorporated into the density-dependent structure. In this figure, ChatGPT v. 5.5 was used to improve visual presentation.
2.4. Model Fitting and Selection
Parameters of the linear mixed-effects models were estimated for each species by using maximum likelihood (ML), implementing fitlme function in MATLAB R2018a. This approach ensures valid comparison among candidate models differing in their fixed-effects structure [16]. An information-theoretic approach was then used for model performance [17]. Given the relatively small sample size in relation to the number of estimated parameters, the Akaike Information Criterion corrected for small sample size () was calculated for model selection. The formula is given by
where n is the number of observations and k is the number of estimated parameters, which varies according to the model. Compared to the standard AIC, incorporates an additional penalty for model complexity, reducing the tendency to favor overparameterized models under limited data conditions [17]. Although the models include random effects, remains a widely used and accepted criterion for comparing mixed-effects models fitted by maximum likelihood.
Once all the alternative models were fitted, differences relative to the best-model were calculated as. Then, Akaike weights were computed as:
Within this subset, models with ≤ 2 were treated as statistically indistinguishable, whereas remaining models were ranked according to their Akaike weights (). The model with the lowest and highest Akaike weight was selected.
Root mean square error (RMSE) was used to quantify model fit for all models. For the selected model, goodness-of-fit and model assumptions were further assessed by visually inspecting observed-versus-predicted values and quantile–quantile (Q–Q) plots of residuals.
2.5. Competition Coefficients and Interaction Matrix
Once the model that best described the population dynamics of all species was identified, the analysis focused on the intra- and interspecific competition coefficients within the weed community. In the baseline density-dependent model (DD), these coefficients represent constant effects of species densities on the logarithmic growth rates of each population and correspond to the in Equation (2). In more complex model formulations, such as those including management effects or interaction terms, these coefficients may incorporate additional terms defined in the general model allowing the strength of competition to vary depending on crop phase or tillage system. In particular, interaction models allow the intensity of intra- and interspecific competition to change across management conditions. For simplicity, the resulting competition coefficients are consistently denoted as .
The estimated parameters were organized into a coefficient matrix, where each row corresponds to a focal species. The first column contains the intercept, while the remaining columns correspond to coefficients , representing the effect of species Nk on the growth rate of species Ni. Diagonal elements () represent intraspecific competition, with negative values indicating density-dependent self-regulation or saturation due to resource limitation. Off-diagonal elements (, ) represent interspecific interactions, where negative values indicate competitive effects. Positive values were interpreted cautiously, as they may reflect indirect effects or mechanisms of coexistence. Depending on the model structure, this matrix may vary with crop phase or tillage system.
Finally, to facilitate comparison of interaction strengths across species, a normalized interaction matrix was constructed by scaling the coefficients by the magnitude of each species’ intraspecific competition in the form
The normalized coefficients were arranged with the same structure as the original coefficient matrix, where each row corresponds to a focal species and columns represent the effects of species Nk on species Ni. This normalization expresses interspecific effects relative to the strength of self-regulation, providing a dimensionless measure of interaction intensity while preserving the ecological sign of effect. Thus, indicates a competitive effect whereas suggests a facilitating effect. In turn, implies that the interspecific influence exceeds the magnitude of the self-regulatory effect and suggests that species Nk has no influence on species Ni.
Similar ratios based on intraspecific competition are commonly used in ecological theory to compare interaction strengths [18]. Here, the absolute value of intraspecific coefficients was used to retain the ecological interpretation of interaction signs. This approach allowed direct comparison across species despite differences in their intrinsic growth dynamics. The resulting normalized interaction matrix provided a basis for discussing qualitative properties of the system, such as the relative strength and asymmetry of interactions, even without performing a full dynamical analysis.
3. Results
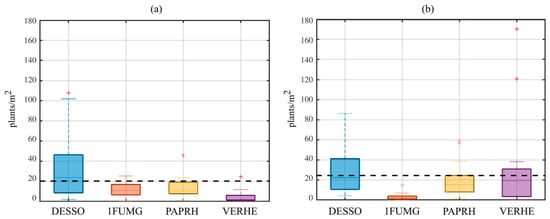
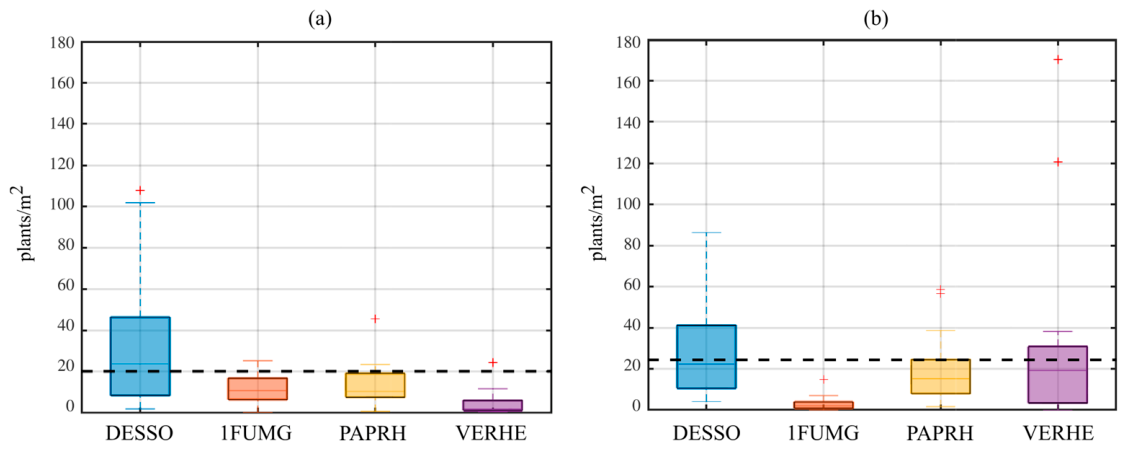
Figure 4 presents the boxplots of species densities under each tillage system, allowing the identification of dominant and subordinate species in terms of abundance and interannual variability. Under CT and NT, DESSO dominated numerically the community structure, exhibiting the highest median density and a markedly larger interquartile range compared to the other species. The third quartile aroused from considering the density values of all species within each tillage system was used as a dominance threshold. In both cases, this reference line further supports the identification of DESSO as the dominant species. In CT, 1FUMG and PAPRH showed intermediate densities, whereas VERHE presented lower abundance, generally below the central tendency of the other species. The community structure under NT becomes more heterogeneous. PAPRH and VERHE exhibited wider interquartile ranges, indicating greater variability than under CT. 1FUMG was the least abundant species.
Figure 4.
Boxplots showing the distribution of weed community species under different tillage management. The horizontal dashed line in each panel represents the third quartile calculated from the density values of all species within the corresponding tillage system. (a) Conventional Tillage (CT); (b) No-Tillage (NT).
These time series revealed that DESSO was numerically dominant in terms of its greater abundance and inter-annual persistence. However, such descriptive characterization does not necessarily imply stronger competitive influence. A species may be abundant without exerting strong regulatory effects on others, and conversely, species with moderate densities may exert disproportionate competitive impacts.
The realized growth rate was calculated between consecutive years of the 20-year experiment and for the two types of tillage, resulting in n = 38 observations. Based on these data, ten candidate models were fitted for each species, and then compared using AICc (Table 1). Across all cases, the density-dependent model (DD) consistently yielded the lowest AICc value and the highest , indicating that density-dependent processes alone captured the main structure of the observed population dynamics. When evaluated using RMSE, models including additional fixed or random effects associated with crop sequence and tillage system occasionally achieved slightly lower values. However, these reductions in prediction error were not sufficient to offset the penalty associated with their increased number of parameters. In consequence, DD was selected as the common model structure for all species. This unified formulation ensures consistent estimation and interpretation of intra- and interspecific competition coefficients across the community, facilitates direct comparison of interaction strengths among species, and avoids confounding biological differences with differences in model specification.
Table 1.
Performance of the different competition models fitted for each species and ordered according to the AICC value. For each species, the model with the lowest AICc is highlighted in bold.
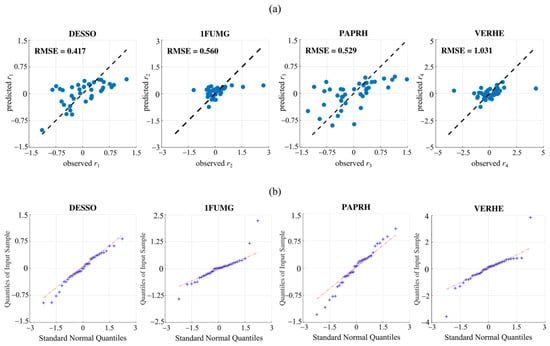
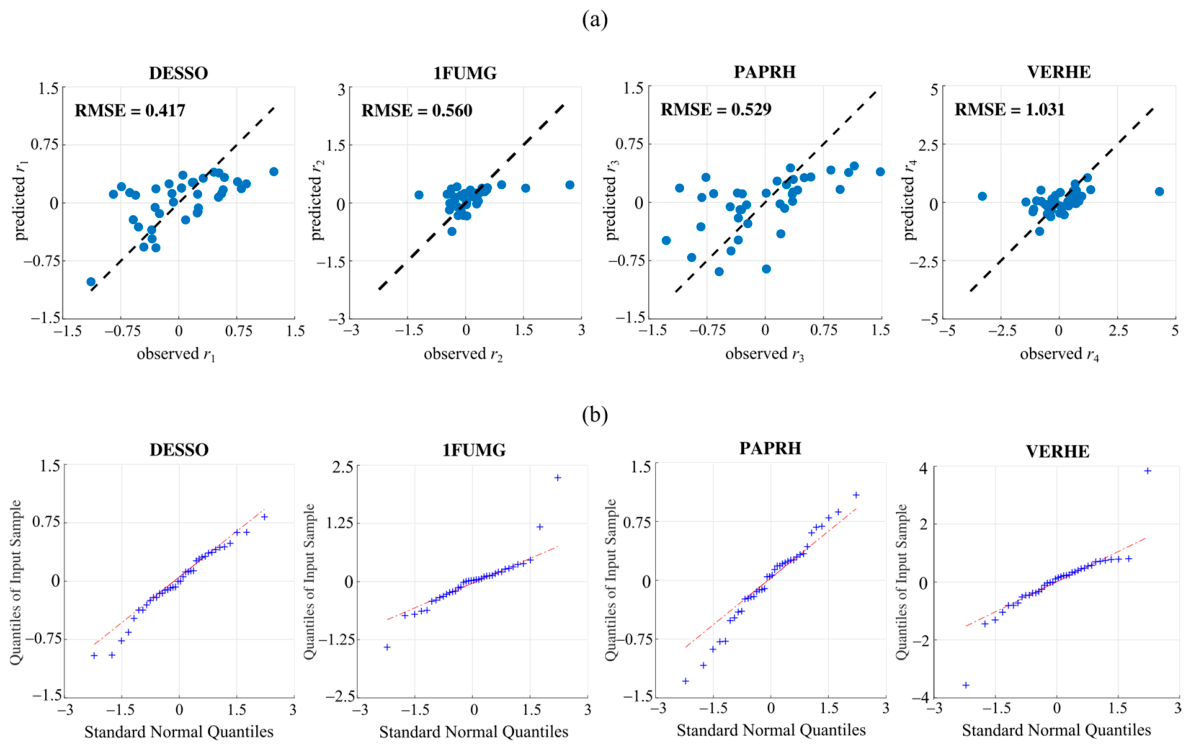
Observed and predicted realized growth rates were compared for all species to evaluate the predictive performance of the selected DD model (Figure 5a). The close agreement between observed and predicted values indicates that the model adequately reproduced the main patterns of population dynamics across species. Additional residual diagnostics showed no major departures from model assumptions (Figure 5b) as residuals were generally aligned with the reference line, with only minor deviations in the distribution tails associated with a small number of extreme observations. Together, these results support the use of the DD model as a parsimonious representation of the competitive interactions within the weed community.
Figure 5.
Evaluation of the predictive performance of the DD model. (a) Observed versus predicted realized growth rates (ri) for each species. The dashed line indicates the 1:1 relationship. RMSE values are also included. (b) Quantile–quantile (QQ) plot of model residuals for each species. The dashed line indicates the theoretical quantiles expected under a normal distribution.
The competition coefficients αii and () of the DD model were estimated (Equation (2)). The matrix with the results is outlined in Table 2, showing how the density of the species itself and the density of competing species affect the growth rate of each population.
Table 2.
Estimated parameters of the selected model (DD) describing the realized per capita growth rate () of the four species.
All intraspecific competition coefficients were negative, indicating strong self-regulation across species. In contrast, interspecific coefficients showed greater variability in both magnitude and sign, suggesting heterogeneous interaction patterns within the group. For better evaluation, the normalized interaction matrix was constructed (Table 3), normalizing the coefficients of the model of each species with respect to the magnitude of its intraspecific competition coefficient (Equation (5)). Thus, the coefficients are expressed on the same dimensionless scale, preserving the ecological sign of each effect.
Table 3.
Normalized interaction matrix.
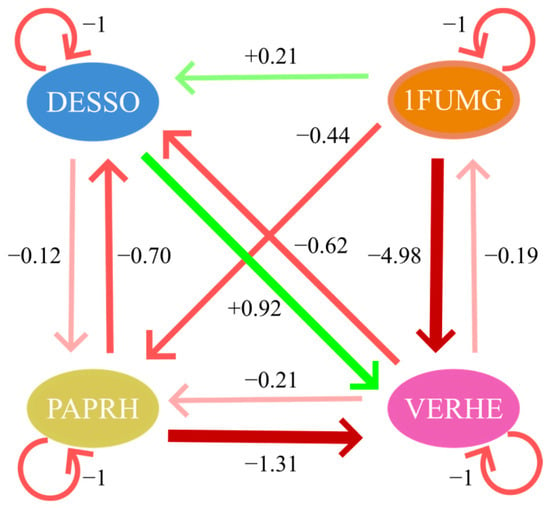
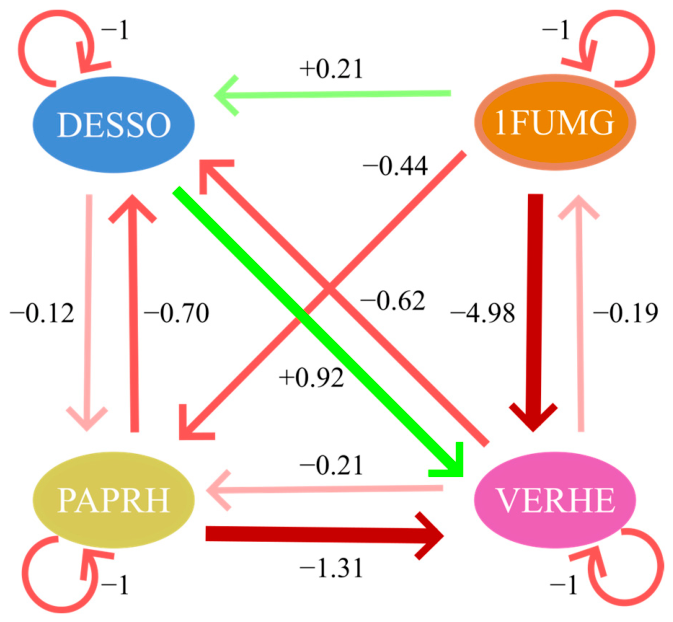
According to obtained matrix (Table 3), DESSO was negatively affected by PAPRH and VERHE, with a weak positive response to 1FUMG. 1FUMG showed a generally weak response to the rest of the community, except for a moderate negative effect exerted by VERHE. In contrast, PAPRH was negatively affected by all other species, particularly by 1FUMG, indicating strong competitive pressure from the rest of the community. VERHE showed the strongest interaction responses, being significantly suppressed by 1FUMG and, to a lesser extent, by PAPRH. Although VERHE also showed a positive response to DESSO, its magnitude was small compared with the dominant negative intra- and interspecific interactions within the community. Overall, while intraspecific competition was consistently strong and negative, interspecific interactions were highly heterogeneous and clearly asymmetric, with large differences in interaction strength across species pairs.
Figure 6 summarizes the most relevant interactions derived from the normalized matrix, highlighting differences in the strength and direction of species effects. In the figure, each species exhibits self-regulation, indicating density-dependent control that contributes to local stability. Interactions among species include both negative (competitive or inhibitory) and positive (facilitative) effects, as represented by red and green arrows, respectively. The structure of this network suggests a locally stable weed community in which species coexist through a balance of competition, facilitation, and self-regulation.
Figure 6.
Representation of the main interactions derived from the normalized matrix. Arrows indicate the direction of the effect (from species j to species i), and line thickness and tone illustrate interaction strength. Circular arrows represent intraspecific competition. In red: negative coefficient (competitive effect); in green: positive coefficient (suggesting facilitation or indirect effects).
4. Discussion
Understanding the biology and ecology of weeds is fundamental for developing effective long-term management strategies [19]. Theoretical and empirical studies indicate that density-dependent regulation is a key mechanism shaping weed population trajectories [20]. Consistent with this framework, our results show that the DD model, containing only intra- and interspecific density effects, received the strongest statistical support with respect to candidate models that include additional effects associated with crop rotation and tillage system. These outcomes suggest that long-term population dynamics are largely structured by intraspecific competition, with interspecific interactions playing generally a minor role, although some strong asymmetric interactions were observed between specific species pairs. This pattern is consistent with the meta-analysis of Adler et al. [6], where the intraspecific competition was, on average, stronger than interspecific competition.
The negative normalized intraspecific coefficients estimated for most species suggest strong self-regulation within the weed community, a condition widely recognized as central to population stability and stable coexistence [5,21]. These results suggest that community dynamics were primarily governed by species-specific density-dependent interactions rather than by systematic shifts in competitive relationships driven by external agronomic factors. The interaction coefficients estimated by the DD model reveal a largely stable competitive structure, dominated by persistent and asymmetric weed–weed interactions across management systems.
In agroecosystems, strong intraspecific competition may arise due to shared responses to resource limitation, crop interference, and management induced synchronization of life cycles [22]. In the present study, the predominance of intraspecific competition may be partially attributed to the legume rotation. The low initial growth rate of vetch [23] can facilitate the rapid growth of weed species, intensifying intraspecific density competition during early establishment. The occasional very weak positive interaction coefficients estimated by the model should be interpreted with caution, as they were close to zero or considerably smaller than the dominant negative intra- and interspecific interaction coefficients. Rather than indicating true positive effects among species, they may reflect several underlying processes, including indirect associations driven by shared responses to environmental conditions, microclimatic buffering, temporal niche differentiation, complementary resource use, or other forms of facilitation. Given their small magnitude, these interpretations remain speculative and cannot be disentangled within the present modeling framework.
Despite substantial differences between wheat and vetch in terms of nitrogen availability, canopy structure, and resource supply, competitive relationships among weed species remained remarkably stable. Within the temporal and ecological scope of this study, neither crop phase nor tillage system showed clear evidence of modifying the structure or magnitude of interaction coefficients. Instead, these findings suggest that management factors appeared to operate mainly through ecological filters, affecting population densities rather than per capita interaction strengths. Similar patterns have been reported in long-term cropping studies, where management affects demographic parameters such as emergence and early survival more strongly than species interaction structure [24]. This suggests that competitive hierarchies within the weed community appear to be largely conserved across contrasting agronomic conditions, even when species abundances fluctuate markedly.
The normalized interaction matrix shows that 1FUMG emerged as one of the most competitive species in the weed community, exerting the strongest negative effect on VERHE (I24 = −4.978). Several ecological traits contribute to its competitive role, 1FUMG typically exhibits early emergence and rapid initial growth, allowing effective pre-emption of resources during critical establishment phases, a strategy widely recognized as conferring a competitive advantage in annual weed species [4]. In addition, its high phenotypic plasticity enables 1FUMG to exploit temporal and spatial niches efficiently, particularly in cereal systems characterized by recurrent disturbance and variable resource availability. In contrast, VERHE is a relatively weak competitor, which is associated with its low canopy structure and short life cycle. As shown in Table 3, the interaction pattern reflects a highly asymmetric competitive behavior, in which 1FUMG strongly suppresses weaker competitors while showing limited or negligible effects on other species. Such interaction patterns are consistent with theoretical theory (e.g., [25]) and with evidence from long-term Mediterranean field experiments, where 1FUMG has been identified as a key structuring species through disproportionate competitive effects rather than generalized dominance [4].
Although PAPRH displayed a more evenly distributed competitive effect across species, the magnitude of the interference exerted by 1FUMG on VERHE supports its classification as a dominant, yet selective competitor within the system, operating under a hierarchical and context-dependent competitive framework. It is also important to highlight the low competitive effect of DESSO, despite its high abundance. Nevertheless, this species is not considered an aggressive competitor [26]. Competitive influence is not necessarily related to field abundance or biomass, but rather to the interaction strength and niche positioning [25,27].
Overall, the interaction structure revealed by this analysis indicates the importance of asymmetric competitive interactions and context dependent in shaping weed community dynamics. Rather than being characterized by relatively balanced competitive relationships among species, the community shows a hierarchical interaction structure dominated by 1FUMG, which exerts disproportionately strong effects on the population dynamics of the other species, especially VERHE. Importantly, this finding reinforces the ecological insight that competitive impact within plant communities is not necessarily proportional to abundance but instead depends on niche overlap and the strength of the interactions [8,28]. Furthermore, our results are consistent with those reported for the same agroecosystem using an alternative analytical approach [15].
From a practical perspective, this study provides valuable insight into the relative roles of intra- and interspecific competition and helps identify weed species that are weak or strong competitors under specific crop conditions (e.g., wheat versus legumes). This information can support crop choice and the design of species-specific management strategies within precision agriculture or biodiversity-oriented frameworks, potentially allowing reduced management intensity for less competitive weeds [12,29]. Such approaches may contribute to lower herbicide use, reduced costs, minimized environmental impacts, enhanced agroecosystem biodiversity and ecosystem services, while maintaining crop productivity.
Some ecological, climatic and agronomic factors that may influence weed dynamics, including temperature, crop species, crop cultivar, seed predation, and allelopathic interactions among crops and weeds, were not explicitly considered in the analyses. However, these processes are part of the complex set of interactions occurring under field conditions and are therefore indirectly reflected in the observed population dynamics. Further studies specifically designed to evaluate these factors would help clarify their relative contribution to weed community responses.
Overall, this work highlights the value of long-term, multispecies approaches for understanding weed community dynamics and improving weed management. By combining interaction matrices with rigorous model selection procedures, we provide a robust framework for quantifying competitive hierarchies and assessing the stability of multispecies assemblages. Elucidating the processes governing weed interactions can therefore support the development of more ecologically based, predictive, and sustainable weed management strategies.
5. Conclusions
This study shows that long-term weed community dynamics in a Mediterranean cereal–legume rotation are primarily structured by density-dependent processes, with intraspecific competition acting as the main regulatory mechanism. Although species abundances varied across time and management regimes, the strength and structure of competitive interactions remained largely stable. The interaction matrix revealed consistent asymmetries among species, indicating that competitive impact is not necessarily related to field abundance. Neither crop phase nor tillage system alter competition coefficients, suggesting that management practices mainly influence weed dynamics by affecting population sizes rather than underlying per capita interaction strengths. Overall, these findings support the use of population-based, multispecies approaches to identify key regulatory processes in weed communities and to inform more ecologically grounded and sustainable weed management strategies.
Author Contributions
Conceptualization, G.L.C., M.B.D. and J.L.G.-A.; methodology, G.L.C., M.B.D. and B.M.; software, G.L.C.; validation, G.L.C. and J.L.G.-A.; formal analysis, B.M.; investigation, G.R.C. and J.L.G.-A.; resources, M.B.D.; data curation, J.L.G.-A.; writing—original draft preparation, G.L.C., M.B.D., G.R.C. and J.L.G.-A.; writing—review and editing, G.L.C., M.B.D., B.M., G.R.C. and J.L.G.-A.; visualization, M.B.D.; supervision, M.B.D.; project administration, J.L.G.-A.; funding acquisition, M.B.D., G.R.C. and J.L.G.-A. All authors have read and agreed to the published version of the manuscript.
Funding
J.L.G.-A. was supported by the Spanish National Research Council (CSIC) through its Intramural Projects program (project 202440E145). M.B.D., G.L.C. and G.R.C. also appreciate the funding from SGCyT (UNS) under Grant Agreement No. PGI 24/K097 and PGI 24/A279.
Data Availability Statement
The original contributions presented in this study are included in the article. Further inquiries can be directed to the author Jose L. Gonzalez-Andujar.
Acknowledgments
We gratefully acknowledge the members of the Weed Science Group at the El Encin Experimental Station for their dedicated management of the long-term experiment, and Luis Navarrete for providing access to the dataset. During the preparation of this work, ChatGPT v. 5.5 was used for writing and graphical revision purposes. The authors reviewed and edited the output content and take full responsibility for the accuracy and integrity of this publication.
Conflicts of Interest
The authors declare no conflicts of interest.
Abbreviations
The following abbreviations are used in this manuscript:
| DESSO | Descurainia sophia L. |
| 1FUMG | Fumaria spp. |
| PAPRH | Papaver rhoeas L. |
| VERHE | Veronica hederifolia L. |
| CT | conventional tillage |
| NT | no-tillage |
| DD | Density-dependent baseline model (no management effects) |
| AM1 | Tillage and crop as nested random effects |
| AM2 | Tillage fixed, crop random |
| AM3 | Crop fixed, tillage random |
| AM4 | Both tillage and crop as fixed effects |
| INT1 | Density × crop interaction |
| INT2 | Density × tillage interaction |
| INT3 | Density × tillage interaction with crop as random effect |
| INT4 | Density × crop interaction with tillage as random effect |
| INT5 | Density × crop and density × tillage interactions |
| AICc | Akaike Information Criterion corrected for small sample size |
| RMSE | Root mean square error |
References
- Zimdahl, R.L. Weed–Crop Competition: A Review, 2nd ed.; Blackwell Publishing: Ames, IA, USA, 2004; 220p. [Google Scholar] [CrossRef] [Scilit]
- Kubiak, A.; Wolna-Maruwka, A.; Niewiadomska, A.; Pilarska, A. The problem of weed infestation of agricultural plantations vs. the assumptions of the European biodiversity strategy. Agronomy 2022, 12, 1808. [Google Scholar] [CrossRef] [Scilit]
- Swanton, C.; Nkoa, R.; Blackshaw, R. Experimental methods for crop–weed competition studies. Weed Sci. 2015, 63, 2–11. [Google Scholar] [CrossRef] [Scilit]
- Torner, C.; Sanchez del Arco, M.J.; Satorre, E.H.; Fernandez-Quintanilla, C.C. A comparison of the growth patterns and the competitive ability of four annual weeds. Agronomie 2000, 20, 147–156. [Google Scholar] [CrossRef] [Scilit]
- May, R.M. Stability and Complexity in Model Ecosystems; Princeton University Press: Princeton, NJ, USA, 1974. [Google Scholar] [CrossRef] [Scilit]
- Adler, P.B.; Smull, D.; Beard, K.H.; Choi, R.T.; Furniss, T.; Kulmatiski, A.; Meiners, J.M.; Tredennick, A.T.; Veblen, K.E. Competition and coexistence in plant communities: Intraspecific competition is stronger than interspecific competition. Ecol. Lett. 2018, 21, 1319–1329. [Google Scholar] [CrossRef] [Scilit] [PubMed]
- Garcia de Leon, D.; Freckleton, R.; Lima, M.; Navarrete, L.; Castellanos, E.; Gonzalez-Andujar, J.L. Identifying the effect of density-dependence, agricultural practices and climate variables on the long-term dynamics of weed populations. Weed Res. 2014, 54, 556–564. [Google Scholar] [CrossRef] [Scilit]
- Tilman, D. Resource Competition and Community Structure; Princeton University Press: Princeton, NJ, USA, 2020. [Google Scholar] [CrossRef] [Scilit]
- Weisberger, D.; Nichols, V.; Liebman, M. Does diversifying crop rotations suppress weeds? A meta-analysis. PLoS ONE 2019, 14, e0219847. [Google Scholar] [CrossRef] [Scilit] [PubMed]
- Diop, M.; Beniaich, A.; Cicek, H.; Ouabbou, H.; El Gharras, O.; Tanji, A.; Bamouh, A.; Dahan, R.; Zine El Abidine, A.; El Gharous, M.; et al. Effects of occasional tillage on soil physical and chemical properties and weed infestation in a 10-year no-till system. Front. Environ. Sci. 2024, 12, 1431822. [Google Scholar] [CrossRef] [Scilit]
- Gonzalez-Andujar, J.L.; Plaza, E.H.; Navarrete, L.; Kozak, M. Tillage system did not affect weed diversity in a 23-year Mediterranean dryland experiment. Agric. Ecosyst. Environ. 2011, 140, 102–105. [Google Scholar] [CrossRef] [Scilit]
- Storkey, J.; Westbury, D.B. Managing arable weeds for biodiversity. Pest Manag. Sci. 2007, 65, 517–523. [Google Scholar] [CrossRef] [Scilit] [PubMed]
- Gonzalez-Andujar, J.L.; Saavedra, M. Spatial distribution of annual grass weed populations in winter cereals. Crop Prot. 2003, 22, 629–633. [Google Scholar] [CrossRef] [Scilit]
- Royama, T. Animal Population Ecology: An Analytical Approach; Cambridge University Press: Cambridge, UK, 2021. [Google Scholar]
- Gonzalez-Andujar, J.L.; Aguilera, M.J.; Van Acker, R. Quantifying and disentangling weed community competition in along-term cereal–legume rotation. Agronomy 2023, 13, 1432. [Google Scholar] [CrossRef] [Scilit]
- Pinheiro, J.C.; Bates, D.M. Mixed-Effects Models in S and S-PLUS.; Springer: New York, NY, USA, 2000. [Google Scholar]
- Burnham, K.P.; Anderson, D.R. Model Selection and Multimodel Inference; Springer: New York, NY, USA, 2002. [Google Scholar]
- Landi, P.; Minoarivelo, H.O.; Brännström, A.; Hui, C.; Dieckmann, U. Complexity and stability of ecological networks: A review of the theory. Popul. Ecol. 2018, 60, 319–345. [Google Scholar] [CrossRef] [Scilit]
- Van Acker, R.C. Weed biology serves practical weed management. Weed Res. 2009, 49, 1–5. [Google Scholar] [CrossRef] [Scilit]
- Bagavathiannan, M.V.; Beckie, H.J.; Chantre, G.R.; Gonzalez-Andujar, J.L.; Leon, R.G.; Neve, P.; Poggio, S.L.; Schutte, B.J.; Somerville, G.J.; Werle, R.; et al. Simulation models on the ecology and management of arable weeds: Structure, quantitative insights, and applications. Agronomy 2020, 10, 1611. [Google Scholar] [CrossRef] [Scilit]
- Xu, L.; Klausmeier, C.A.; Zakem, E. Density dependence promotes species coexistence and provides a unifying explanation for distinct productivity–diversity relationships. Ecol. Lett. 2025, 28, e70292. [Google Scholar] [CrossRef] [Scilit] [PubMed]
- Liebman, M.; Mohler, C.L.; Staver, C.P. Ecological Management of Agricultural Weeds; Cambridge University Press: Cambridge, UK, 2016. [Google Scholar] [CrossRef] [Scilit]
- Holderbaum, J.F.; Decker, A.M.; Meisinger, J.J.; Mulford, F.R.; Vough, L.R. Fall-seeded legume cover crops for no-tillage corn in the humid East. Agron. J. 1990, 82, 117–124. [Google Scholar] [CrossRef] [Scilit]
- Smith, R.G.; Gross, K.L.; Robertson, G.P. Effects of crop diversity on agroecosystem function. Ecosystems 2010, 11, 355–366. [Google Scholar] [CrossRef] [Scilit]
- Freckleton, R.P.; Watkinson, A.R. Asymmetric competition between plant species. Funct. Ecol. 2001, 15, 615–623. [Google Scholar] [CrossRef] [Scilit]
- Berti, A.; Zanin, G. Density equivalent: A method for forecasting yield loss caused by mixed weed populations. Weed Res. 1994, 34, 327–332. [Google Scholar] [CrossRef] [Scilit]
- Goldberg, D.E.; Landa, K. Competitive effect and response: Hierarchies and correlated traits in the early stages of competition. J. Ecol. 1991, 79, 1013–1030. [Google Scholar] [CrossRef] [Scilit]
- Levine, J.M.; HilleRisLambers, J. The importance of niches for the maintenance of species diversity. Nature 2009, 461, 254–257. [Google Scholar] [CrossRef] [Scilit] [PubMed]
- Esposito, M.; Westbrook, A.S.; Maggio, A.; Cirillo, V.; DiTommaso, A. Neutral weed communities: The intersection between, crop productivity, biodiversity, and weed ecosystem services. Weed Sci. 2023, 71, 301–311. [Google Scholar] [CrossRef] [Scilit]

Disclaimer/Publisher’s Note: The statements, opinions and data contained in all publications are solely those of the individual author(s) and contributor(s) and not of MDPI and/or the editor(s). MDPI and/or the editor(s) disclaim responsibility for any injury to people or property resulting from any ideas, methods, instructions or products referred to in the content. |
© 2026 by the authors. Licensee MDPI, Basel, Switzerland. This article is an open access article distributed under the terms and conditions of the Creative Commons Attribution (CC BY) license.