


Abstract
The non-specific lipid transfer proteins (nsLTPs) are able to bind various hydrophobic compounds and facilitate the transport of fatty acids between intracellular membranes, and nsLTPs are found in rice endosperm and embryo during seed development. However, whether nsLTPs function as lipid carriers and thereby affect lipid metabolism in rice grains remains unclear. To elucidate whether nsLTPs influence fatty acid distribution in rice, we generated OsLTP10-OE (OsLTP10 overexpression) and OsLTP10-CR (OsLTP10 CRISPR/Cas9) lines. Phenotypic and metabolic analyses indicated that OsLTP10 expression is closely associated with fatty acid (FA) profiles and grain appearance. In general, total fatty acid content in the brown rice of OsLTP10-OE was higher than that in wildtype, but OsLTP10-CR was lower than wildtype. While FA accumulation was altered in both tissues, the endosperm (milled grain) was more severely affected than the bran, with individual FAs in the milled grains of OsLTP10-OE expanding by 31.87–52.00%. Additionally, key grain quality traits were substantially altered; OsLTP10-CR lines displayed a significantly enlarged white-belly chalkiness area alongside a 19.50% reduction in amylose content, whereas OsLTP10-OE lines showed decreased chalkiness and a 7.80% increase in amylose. Overall, the fatty acid content and composition, chalkiness, brown rice size, and amylose were influenced by OsLTP10.
1. Introduction
Rice (Oryza sativa L.) is a staple food providing essential nourishment for over half of the world’s human population [1]. Rice grains are predominantly composed of storage compounds (starch, protein and lipids), among which lipids rank as the third most abundant nutrient in rice grains. Lipids are mainly accumulated in embryos and aleurone layers, accounting for approximately 2% of brown rice dry weight and less than 1% in milled rice [2]. Fatty acids (FAs), the core building blocks of most cellular lipids, play essential roles in maintaining membrane integrity, supplying energy for metabolic processes, and forming surface barriers against abiotic and biotic stresses [3]. Lipid metabolism is indispensable for normal plant growth and development, and plants adapt to adverse environments via remodeling membrane lipid composition through altering FA content and profile [4,5,6,7]. Alterations in FAs composition usually lead to pleiotropic phenotypes, including impaired seed development, modified seed oil content, and defective stress responses [8,9].
Rice grain quality is a complex agronomic trait encompassing appearance, milling, eating, cooking and nutritional qualities, in which lipids are vital for maintaining the structure of seed storage substances and determining rice quality and food texture. During rice seed development, storage lipids rapidly accumulate at 5–12 days after flowering, accompanied by a significant increase in palmitic, oleic and linoleic acids, while α-linolenic acid content remains at a low level. The profile of crude FAs (including palmitic, stearic, oleic, linoleic and linolenic acids) is a key determinant of rice appearance and eating quality [2,10]. Lipid metabolites accumulated in high-quality rice cultivars have been proven to improve rice eating and nutritional quality, and metabolomics analysis revealed dynamic changes of lipid profiles during rice grain development [11,12]. For example, RNAi-mediated silencing of OsLTPL36, a rice non-specific lipid transfer protein (nsLTP) gene, reduced seed FA content and resulted in chalky endosperm, and lipidomics studies further confirmed the close association between lipid metabolism and physical–textural quality of rice grain [13,14].
Plant lipid biosynthesis is compartmentalized: fatty acid de novo synthesis occurs in plastids, while lipid assembly takes place in the endoplasmic reticulum, requiring efficient intermembrane lipid transport systems [8,15]. Non-specific lipid transfer proteins (nsLTPs) are small, ubiquitous polypeptides that bind fatty acids and phospholipids, and facilitate their intermembrane transfer in vitro [16,17,18,19]. They participate in diverse biological processes, including seed development and stress responses [20,21,22,23,24]. In rice, nsLTPs are highly expressed in developing endosperm and embryo, and show differential expression between translucent and chalky endosperm, suggesting potential roles in grain quality formation [25]. Among nsLTP family members, OsLTP10 and OsLTP24 were reported to be upregulated more than 2-fold in response to high temperature during grain filling [26]. Notably, our previous transcriptomic study positioned OsLTP10 as one of the key candidate downstream genes in the ABA-mediated transcriptional regulatory network that induces chalkiness [27], and our preliminary screening showed it was stably expressed in filling grains. We therefore sought to investigate the potential involvement of OsLTP10 in modifying lipid transport and fatty acid distribution in rice grains.
In this study, we generated OsLTP10 overexpression (OsLTP10-OE) and CRISPR/Cas9-mediated knockout (OsLTP10-CR) transgenic lines to systematically investigate the function of OsLTP10 in regulating FA content, composition and tissue distribution in rice grains and further evaluated its effects on key grain quality traits. Our results provide genetic evidence that OsLTP10 is involved in grain FA accumulation and multiple rice quality traits, providing a potential candidate gene that warrants future multi-environment evaluation to assess its feasibility for the genetic improvement of rice nutritional and appearance quality.
2. Materials and Methods
2.1. Plant Materials and Growth Conditions
The overexpression and CRISPR/Cas9 transgenic lines were obtained from Zhenshan 97B (ZS97, indica rice). Thus, ZS97 was used as the wildtype control for all morphological and molecular analyses. Experimental plants were grown in the field or in the greenhouse under standard management practices at Hunan Agricultural University, Changsha, Hunan (28.12° N, 112.59° E), China. Leaves, stems, and different developing panicles (0, 5, 10, 15, 20, and 25 days after pollination) of the WT were frozen in liquid nitrogen upon collection and stored at −80 °C for further usage. Fully filled grains were used to measure grain quality, brown rice length, width, thickness, and weight.
2.2. Plasmid Construction and Plant Transformation
The CDS of OsLTP10 (LOC_Os11g24070) was cloned from the wildtype ZS97 using the ubiquitin promoter in an overexpression vector pOsLTP10. The pOsLTP10 vector was transferred into WT via Agrobacterium-mediated genetic transformation. The positive T0 plants were screened using real-time-polymerase chain reaction (RT-PCR; primers shown in Table S1) using the RNA samples.
The OsLTP10 was knocked out in Zhenshan 97 using the CRISPR/Cas9 system. The target sequence of CGTTGGCCCCTGCCTCACCTACG for gene editing was present from 101 bp to 124 bp on the CDS. To minimize potential off-target effects, the single guide RNA (sgRNA) spacer sequence was rigorously screened using the online tool CRISPR-P 2.0 to ensure high targeting specificity within the rice genome, showing no mismatch alignments within the core 15 bp seed region of any non-target loci. Sequencing analysis confirmed that CR-1 and CR-2 represented two completely independent mutation events (Figure S1), effectively ruling out the possibility that the observed phenotypes were artifacts of identical off-target mutations.
The regenerated plants were screened for mutations at the target sites, and homozygous mutants were confirmed by sequencing. These lines were propagated to the T3 generation, with WT as the negative control. Genomic DNA was extracted from seedlings. PCR was performed using OsLTP10-specific primers (F: 5′-CTGGATCGATCGAGATGGCCC-3′; R: 5′-CAGTCGATGGAAGCGCTGATG-3′). PCR products were separated on 1.5% agarose gels and verified by sequencing. The sequencing results confirming the mutations are presented in Figure S1.
Two independent lines with distinct mutation genotypes (OsLTP10-CR1 and OsLTP10-CR2) and two independent overexpression lines (OsLTP10-OE1 and OsLTP10-OE2) were selected. Homozygous T2 generation lines were used for all subsequent phenotypic, physiological, and metabolic evaluations to ensure phenotypic stability and rule out potential positional effects.
2.3. RNA Isolation and Quantitative Real-Time PCR Analyses
Total RNA was extracted from different tissues using the TRIzol reagent (Invitrogen, Carlsbad, CA, USA). Oligonucleotides (dT) were used as primers to synthesize the first-strand cDNA (Invitrogen). Quantitative PCR was performed on the synthesized cDNA using specific primers and SYBR Green PCR Master Mix (Invitrogen) in a CFX96 Real-Time System (Bio-Rad, Hercules, CA, USA). The relative expression of the genes was calculated using the 2−ΔΔCt method with OsActin (LOC_Os03g50885) as the reference gene. The primers used for RT-PCR analysis are listed in Table S1.
2.4. Determination of Lipid Content and Fatty Acid Composition
Solvents and chemicals were purchased from Sigma-Aldrich (St. Louis, MO, USA). Fatty acid content and composition were determined by Xiao et al. [28] using a one-step acid-catalyzed methylation followed by GC-MS methods, assaying fatty acid methyl esters (FAMEs), as previously described with some modifications. Twelve FAs (C14:0, C16:0, C16:1, C17:0, C18:0, C18:1, C18:2, C18:3, C20:2, C20:1, C20:2 and C22:1) were quantitatively analyzed using a mixed FA standard solution containing 37 methylated FAs (Sigma-Aldrich, 18919-1AMP). A calibration curve was constructed using a standard solution of 37 mixed methylated FAs at 7 different concentrations ranging from 0.8 to 25 μg/μL (0.8, 1, 2, 4, 8, 10, and 25 μg/μL). A concentration-peak area standard curve was established using a mixed standard of fatty acid methyl esters with known concentrations.
Briefly, 50 mg of each sample (whole-grain, milled-grain, or bran fraction, collected and sieved through a 150 µm sieve) was placed into a 10 mL round bottom capped glass tube, then 2.0 mL sulfuric acid with methanol (5%, v/v) was added, and the mixture was incubated at 60 °C for 8 h with vortexing for 30 s every 30 min in the dark. Then, 2.0 mL of hexane was added to the mixture, vortexed for 30 s, and centrifuged at a speed of 12,000 rpm at 4 °C for 5 min (Megafuge 8R, Thermo Scientific, Heraeus, Germany). Finally, the supernatant of the organic phase was collected and filtered through a 0.45 μm organic syringe filter for GC-MS analysis.
Fatty acids were identified and quantified using a GC MS-Tq8050 (Shimadzu Corporation, Kyoto, Japan) equipped with an SH-Rt-2560 column sized at 100 m × 0.25 mm × 0.25 μm (Shimadzu Corporation, Kyoto, Japan). The GC inlet temperature was set at 240 °C. The total flow rate, column flow rate, linear velocity, and purge flow rate were 100.0 mL/min, 1.50 mL/min, 25.2 cm/s, and 3.0 mL/min, respectively. The FAMEs separation was performed at an initial column temperature of 125 °C, increased to 180 °C at a rate of 10 °C/min, held for 2 min, then programmed to 200 °C at a rate of 3 °C/min, held for 20 min, and finally increased to 230 °C at 5 °C/min for 10 min. The ion source (electron ionization, EI) detector temperature was maintained at 240 °C, and the solvent delay was set at 12 min. The MS system ran in a scan mode of acquisition for the selection of appropriate EI mass fragments for each analysis. Identification and quantification were conducted by comparing the chromatograph with 37 standards of fatty acid methyl esters (Sigma-Aldrich, 18919-1AMP). Fatty acid composition was expressed as the percentage of total FAs, and each content was obtained from the analysis of three replicates, measured as the mean of peak height intensities along with standard deviation. Fatty acid contents were quantified using the area normalization method based on peak area ratios relative to external standards.
2.5. Analysis of Rice Grain Agronomic Traits
The seeds of the WT, OsLTP10-OE, and OsLTP10-CR were dried and stored at room temperature for 2 months in order to investigate phenotype. The 1000-grain weight was determined by weighing 1000 grains of a single plant. Three different plants of each variety were weighed as replicates. Fully filled grains, which were shelled, were used to measure width, length, thickness, and weight. For grain appearance and chalkiness evaluation, 100 fully filled brown rice grains per replicate were randomly selected and aligned. The chalkiness rate (%) and white-belly area (%) were quantified using a rice appearance quality analyzer (SC-E, Hangzhou, China) according to national standard methods.
2.6. Measurements of the Starch
The starch content of amylose and amylopectin was measured using the iodine colorimetric method according to the procedure described Wu et al. [29] with slight modifications. Approximately 100 mg of rice flour (filtered through a 100 mesh sieve) was prepared for each sample in a test tube and wetted with 500 µL of aqueous ethanol (95% vol/vol). After that, 4.5 mL NaOH (1.0 M) was added, then the tubes were stirred with a vortex mixer and placed in boiling water for 10 min. After cooling, the solution in each tube was diluted to 10 mL with distilled water and mixed thoroughly. An aliquot of 100 µL of sample solution was added with 100 µL acetic acid (1.0 M) and 50 µL iodine reagent (0.2% iodide and 2% potassium iodide) and then diluted to 2.0 mL with distilled water. The absorbance was measured at 536 nm, 595 nm, and 969 nm for each sample. The content of amylose or amylopectin was calculated using a calibration curve developed with amylose or amylopectin standards, respectively. Amylose or amylopectin content was expressed as the percentage (w/w) on a dry weight basis. Analysis was performed with three replications.
2.7. Statistical Analysis
The values of grain agronomic traits, relative expression of genes, and the content of fatty acid and starch for each sample were represented as mean ± SD, based on three biological replicates. One-way analysis of variance (ANOVA) was first used to test for overall significant differences among all experimental groups (wildtype ZS97, two independent OsLTP10-OE lines, and two independent OsLTP10-CR lines). When significant differences were detected (p < 0.05), Duncan’s multiple range test was conducted for post-hoc pairwise comparisons between groups.
3. Results
3.1. Characterization of OsLTP10 Gene
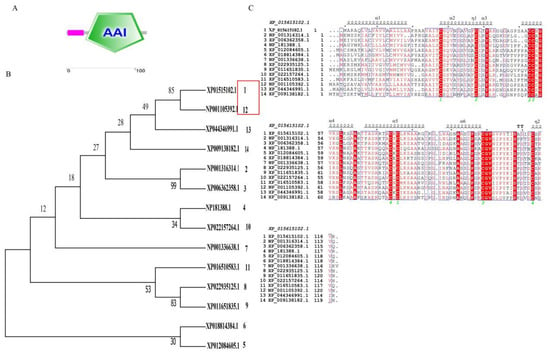
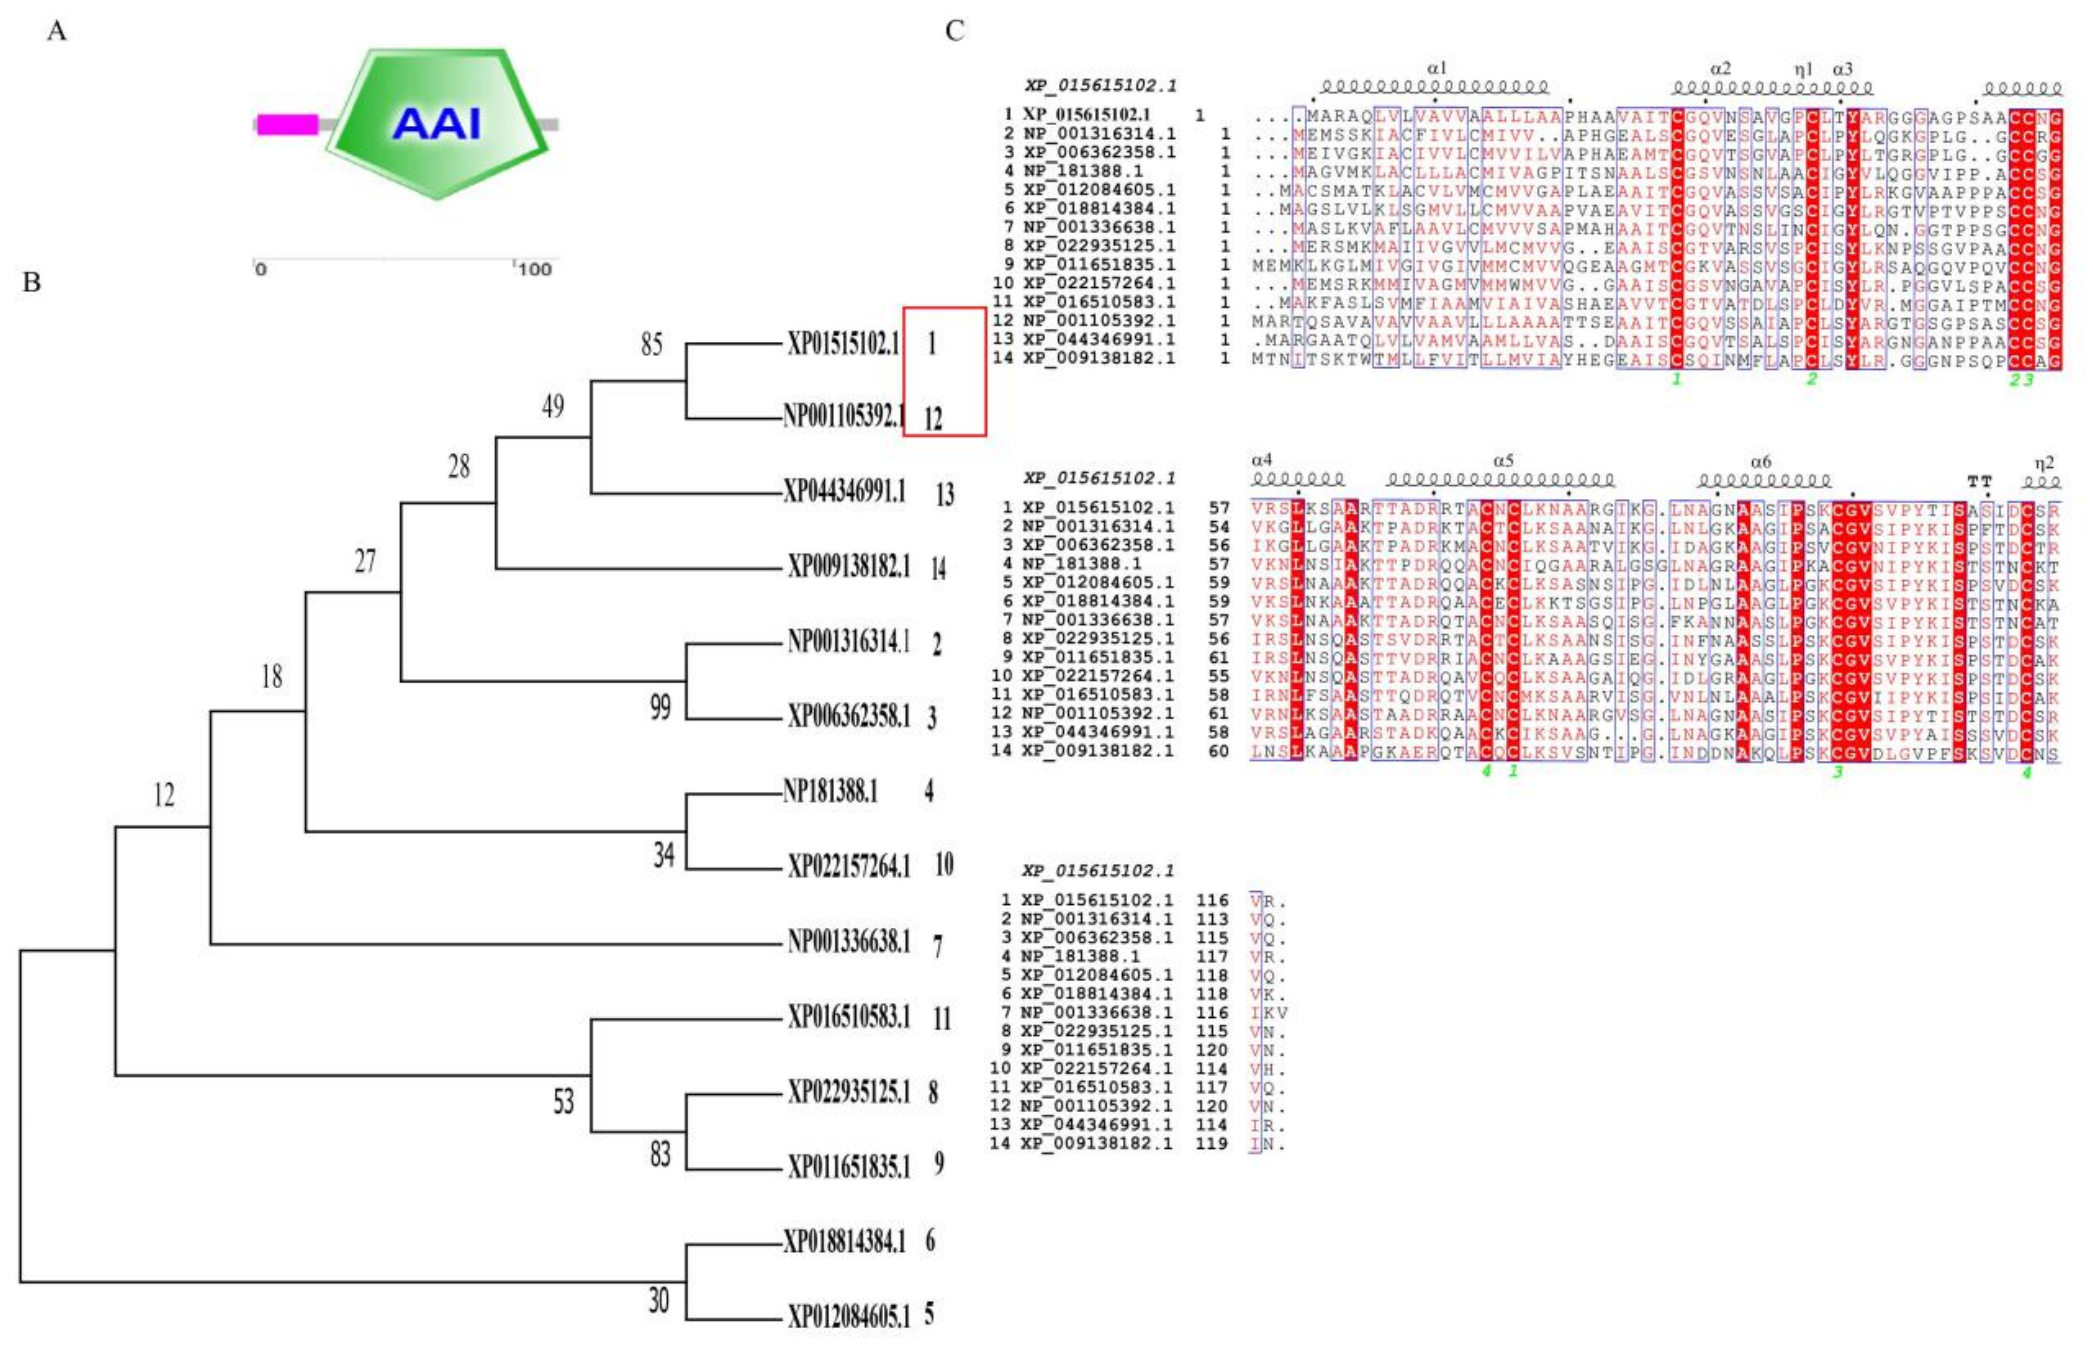
InterPro was used to predict and analyze the conserved domains of OsLTP10, while functional annotation was performed using the Pfam protein sequence search platform and conserved domains (https://www.ebi.ac.uk/interpro, accessed on 1 June 2026). It is shown that it belongs to the nsLTP1 gene family and is a type of lipid transport protein. OsLTP10 was predicted to contain one AAI domain by the SMART tool (http://smart.embl.de/, accessed on 1 June 2026) (Figure 1A). The AAI domain (amino acids 28–113) is annotated as a plant lipid transfer protein (Figure 1A). To compare the homologous evolutionary relationships of OsLTP10, protein BLAST (https://www.ncbi.nlm.nih.gov/blast/, accessed on 1 June 2026) analysis was performed via the Phytozome website to download sequences of OsLTP10 homologous genes from 14 species, which are Zea mays, Triticum aestivum, Brassica rapa, Solanum lycopersicum, Solanum tuberosum, Arabidopsis thaliana, Momordica charantia, Glycine max, Nicotiana tabacum, Cucurbita moschata, Cucumis sativus, Juglans regia, Jatropha curcas. Protein sequence alignment was performed using muscle/3.8.1551, and sequence trimming was conducted using Gblocks/0.91b to construct a phylogenetic tree. Analysis of the homologous evolutionary relationship of the OsLTP10 gene revealed high homology with Zea mays ZmLTP10 (Figure 1B). Meanwhile, the amino acid sequences of these 14 species were subjected to multiple sequence alignment using MUSCLE, and sequence visualization analysis was performed https://espript.ibcp.fr/ESPript/ESPript/index.php (accessed on 1 June 2026). In the amino acid sequences of OsLTP10 homologous genes from different species, the highly conserved C-Xn-C-Xn-CC-Xn-CXC-Xn-CXn-C motif containing 8 cysteines was found, but also other highly conserved sites (C-Xn-C-Xn-Y-Xn-CCXG-Xn-L-Xn-A-Xn-CXC-Xn-A-XnP-Xn-CGV-Xn (“X” represents any amino acid, and “n” represents the number of amino acid residues) (Figure 1C). Simultaneously, the physicochemical properties of OsLTP10 were analyzed using the online software ProParam. The results showed that OsLTP10 consists of 117 amino acids with a molecular weight of 11.57 kDa; alanine, glycine, and valine account for 21.4%, 9.4%, and 9.4% of the composition, respectively. The isoelectric point is 9.93.
Figure 1.
Sequence analysis of OsLTP10. (A) Predicted domain of OsLTP10 by SMART. (B) Analysis of the evolutionary tree of OsLTP10 and its homologous proteins. (C) Amino acid sequence alignment of OsLTP10 and its homologous proteins. Red background indicates conserved amino acids, 1: Oryza sativa; 2: Solanum lycopersicum; 3: Solanum tuberosum; 4: Arabidopsis thaliana; 5: Jatropha curcas; 6: Juglans regia; 7: Glycine max; 8: Cucurbita moschata; 9: Cucumis sativus; 10: Momordica charantia; 11: Nicotiana tabacum; 12: Zea mays; 13: Triticum aestivum; 14: Brassica rapa.
3.2. Expression and Subcellular Localization of OsLTP10
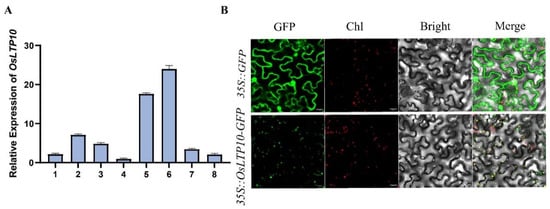
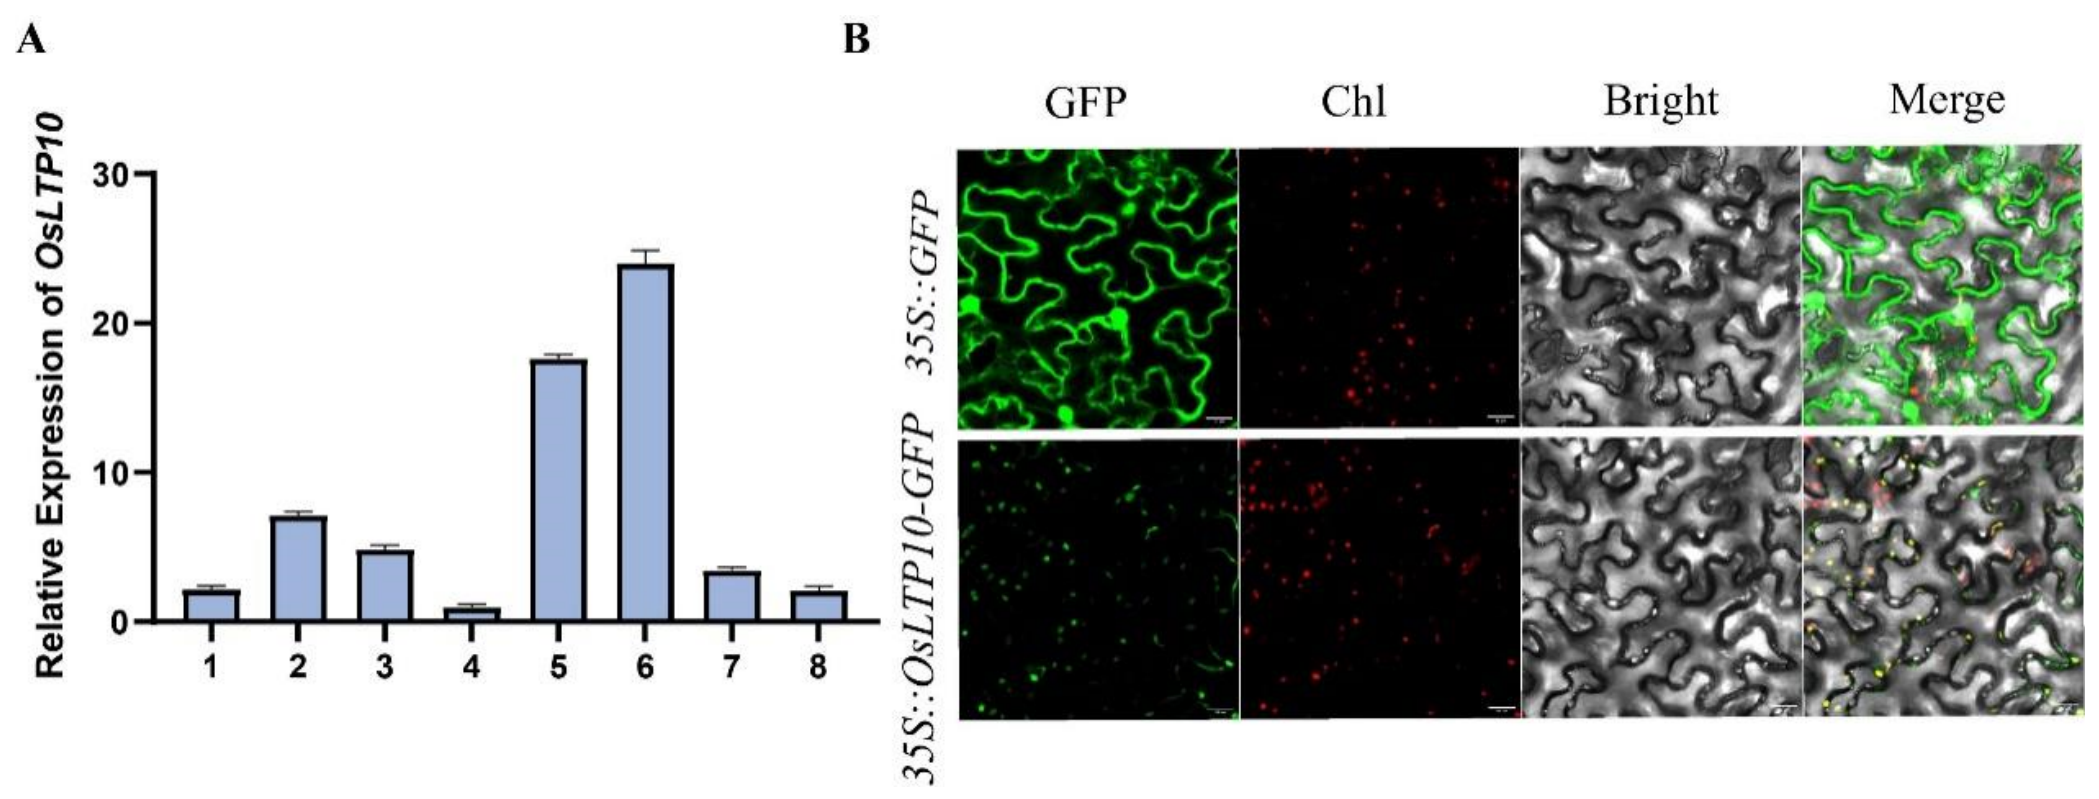
To better characterize the function of OsLTP10 in rice, we examined the expression level of OsLTP10 across various rice organs, including the stem, leaf, panicle, and seeds of WT, and at different developmental stages by quantitative real-time PCR (qRT-PCR). These results showed that OsLTP10 is predominantly expressed in the developing seeds of rice, with a high expression at 15 days after pollination (Figure 2A). In short, OsLTP10 was abundant in immature seeds, and its expression patterns were similar to those of genes involved in the production of rice grain storage substances.
Figure 2.
Expression and subcellular localization of OsLTP10. (A) Expression of OsLTP10 in different organs determined by qRT-PCR analysis. 1: Leaf (three-leaf period), 2: stem (three-leaf period), and 3–8 according to developing seeds of 0, 5, 10, 15, 20, and 25 days after pollination. (B) OsLTP10 subcellular localization in Nicotiana benthamiana leaves. 35S: GFP: empty negative control; 35S: OsLTP10-GFP: Transient expression of fusion proteins in tobacco mesophyll cells; Bright, bright-field. Merged, merged image of GFP, Chl and Bright. Bars = 20 um. Data are mean ± SE from three different lines.
To determine the subcellular localization of the OsLTP10 protein, the constructed 35S: OsLTP10-GFP fusion vector was transformed into ‘Nicotiana benthamiana’ leaves. The results showed that the green fluorescence signal of 35S: OsLTP10-GFP substantially overlapped with the red chlorophyll autofluorescence signals, suggesting that OsLTP10 may be predominantly targeted to or associated with chloroplasts (Figure 2B). However, due to the lack of organelle-specific membrane markers, this putative plastidial localization remains preliminary and warrants further biochemical validation.
3.3. OsLTP10 Increases Lipid Content and Influences Fatty Acid Composition in Brown Rice Seeds
In order to elucidate the function of OsLTP10 in rice, we obtained two independent homozygous knockout lines (OsLTP10-CR1 and OsLTP10-CR2, harboring distinct mutation patterns as shown in Figure S1) and two independent overexpression lines (OsLTP10-OE1 and OsLTP10-OE2).
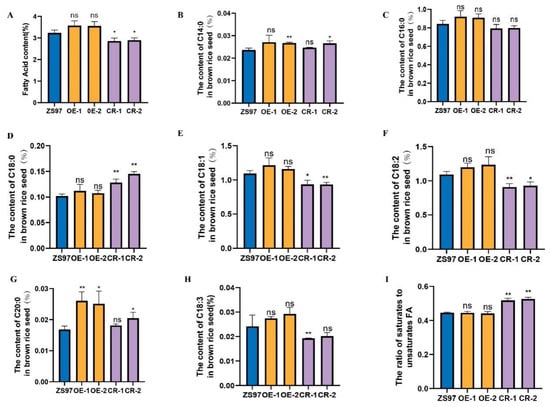
Given that OsLTP10 encodes a putative lipid transport protein, we want to verify whether OsLTP10 gene affects lipid content and/or fatty acid accumulation in brown rice grains. Fatty acids in brown rice from WT, OsLTP10-CR, and OsLTP10-OE lines were analyzed via GC-MS, and a total of 12 distinct fatty acids were identified, including myristic acid (C14:0), palmitic acid (C16:0), palmitoleic acid (C16:1), heptadecanoic acid (C17:0), stearic acid (C18:0), oleic acid (C18:1), linoleic acid (C18:2), linolenic acid (C18:3), arachidic acid (C20:0), eicosenoic acid (C20:1), behenic acid (C22:0), and lignoceric acid (C24:0). The total lipid content of the OsLTP10-CR1, OsLTP10-CR2 was significantly lower compared with WT (p < 0.05), while the OsLTP10-OE1 and OsLTP10-OE2 were higher than that in WT (p > 0.05) (Figure 3A).
Figure 3.
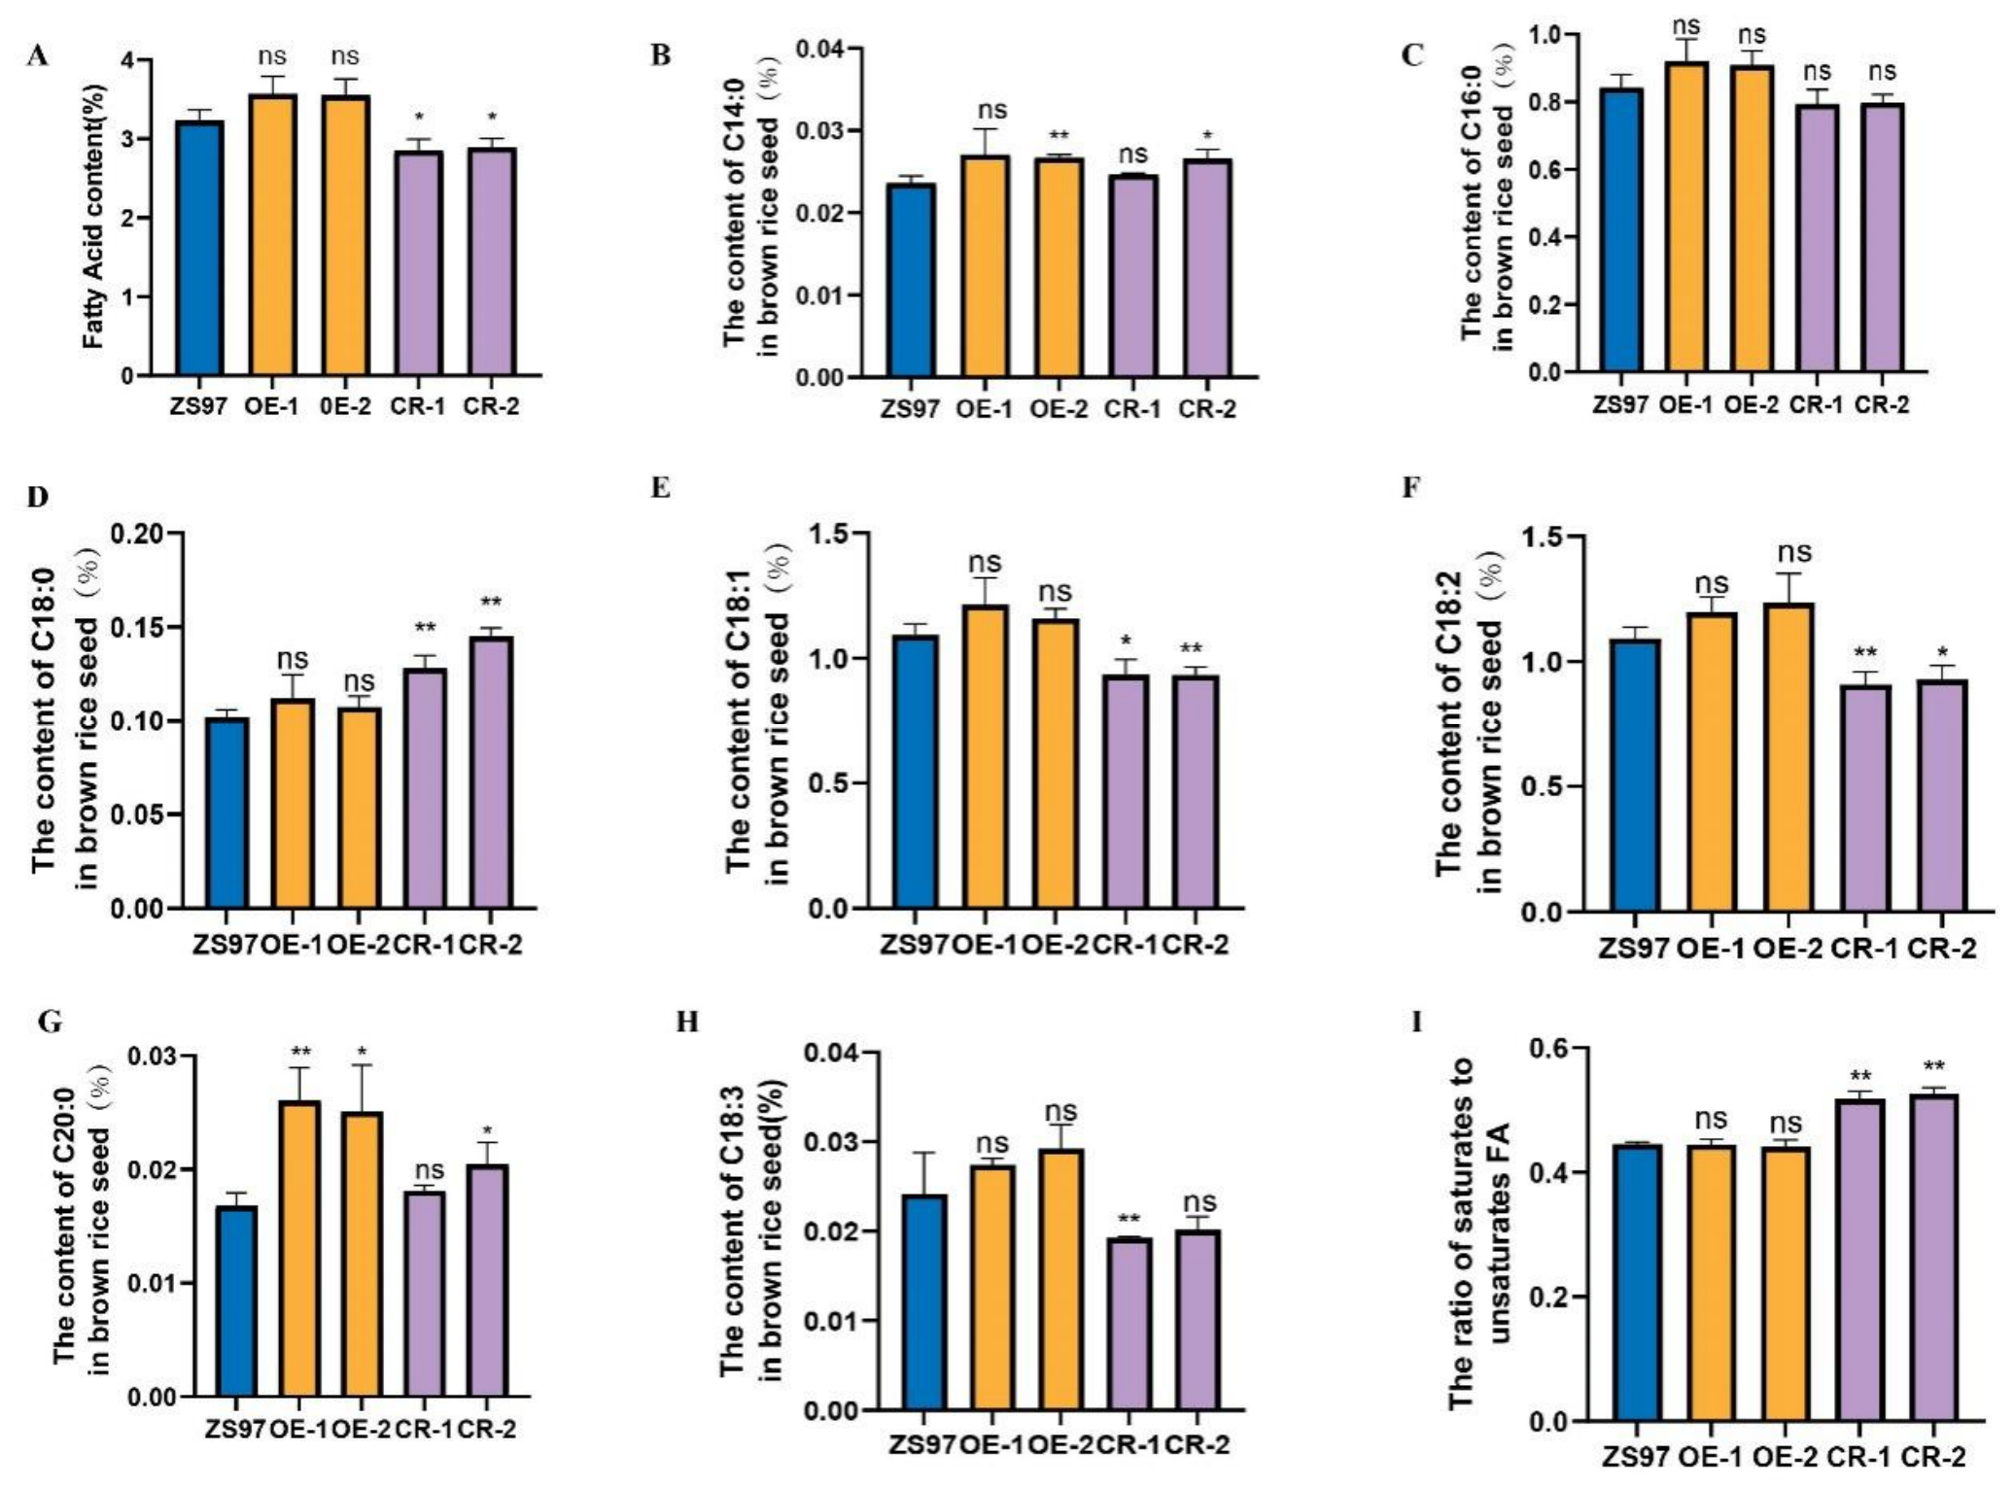
Analysis of differences in fatty acid content and composition in brown rice of ZS97, OsLTP10-OE, and OsLTP10-CR. (A) The total lipid content in brown rice was influenced by OsLTP10. (B–H) Analysis of differences in C14:0, C16:0, C18:0, C18:1, C18:2, C20:0, and C18:3 contents in brown rice of ZS97, OsLTP10-OE, and OsLTP10-CR; (I) The ratio of saturated fatty acids to unsaturated fatty acids in the major fatty acids in brown rice of ZS97, OsLTP10-OE, and OsLTP10-CR lines. ZS97: ZS97, WT; OE1, OE2: OsLTP10 overexpression lines; CR1, CR2: OsLTP10 CRISPR/Cas9 edited lines. Data are presented as mean ± SD from three independent biological replicates. Statistical significance was determined using one-way ANOVA followed by Duncan’s multiple range test (* p < 0.05, ** p < 0.01; ns, not significant).
Secondly, we analyzed whether OsLTP10 alteration changes fatty acid composition in brown rice grains from WT, OsLTP10-CR, and OsLTP10-OE. It was found that seven major fatty acids, including C14:0, C16:0, C18:0, C18:1, C18:2, C18:3 and C20:0, accounted for approximately 99% of the total fatty acids in all tested lines. Therefore, only these seven distinct fatty acids were further analyzed across different OsLTP10 transgenic lines. Compared with wildtype, OsLTP10-CR lines showed a consistent trend of reduced unsaturated fatty acid content and increased saturated fatty acid content, with the exception of C16:0. Specifically, the content of C18:1, C18:2 and C18:3 was reduced, while C18:0 and C20:0 were increased when compared with WT (Figure 3B–H).
The levels of C14:0, C16:0, C18:0, C18:1, C18:2, and C18:3 in OsLTP10-OE were higher than that in WT (p > 0.05) (Figure 3B–H). Further analysis revealed that C20:0 also significantly increased in OsLTP10-OE compared with WT, with an average increase of 24.51%. On the other hand, the total saturated fatty acids were relatively higher in OsLTP10-CR. The ratio of saturated to unsaturated fatty acids in OsLTP10-CR was higher than that in WT and OsLTP10-OE (Figure 3I).
3.4. OsLTP10 Influence Fatty Acid Components Distribution in Bran and Milled Rice
Lipids typically accumulate primarily in embryos and aleurone layers, which are removed as rice bran after milling. This leads us to postulate that changes in fatty acid content and composition in the endosperm play a more prominent role in rice quality than changes in the bran. In order to know whether OsLTP10 is involved in fatty acid distribution in different parts of rice grain, we separately examined the fatty acids in bran and milled rice (endosperm), both isolated from the same brown grains. There are clear differences in the content of individual fatty acids between rice bran and endosperm. In bran, the C16:0, C18:2, and C18:1 were sequentially the highest concentrations, followed by C18:0, C20:0, and C18:3 at less than 4%. C24:0, C20:1, C22:0, C14:0, C16:1, C22:1, and C17:0 had even lower content, less than 1%. In milled rice, C18:2 was the principal fatty acid, followed by C18:1, C16:0, C18:0, C18:3, C14:0, C20:0, C20:1, C24:0, C16:1, C22:0, and C17:0, with lower content. Notably, C22:1 was only detected in bran and was absent from milled grains (Table S2).
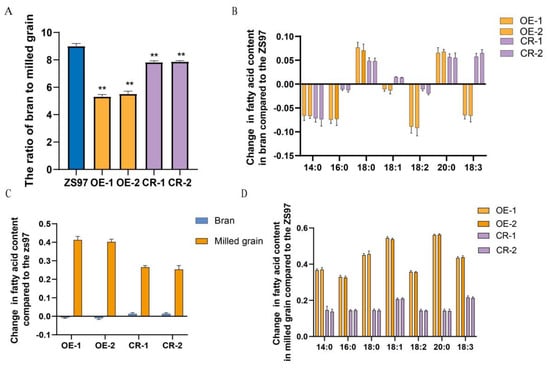
The total fatty acid content in rice bran of OsLTP10-OE was approximately 5.4 times as much as that in the endosperm, while the ratio of bran to milled grains in OsLTP10-CR was more pronounced, reaching about 7.9 times, indicating that OsLTP10 can raise the content of fatty acid in rice endosperm (Figure 4A). Compared with WT, fatty acids in both bran and milled grain of OsLTP10-OE and OsLTP10-CR were affected, but their variation ranges were noticeably different. The fatty acid content in the bran of OsLTP10-OE and OsLTP10-CR was almost the same as that in wildtype. However, it increased in the milled grain (Figure 4C). The changing trends of the main fatty acids was different in bran and milled grains (Figure 4B–D). Compared with the WT, there was little difference in C14:0, C16:0, C18:0, C18:1, C18:2, C20:0, and C18:3 levels in bran in both OsLTP10-OE and OsLTP10-CR (Figure 4B). However, the difference in milled grains was obvious, increasing by 31.87–52.00% in OsLTP10-OE. Surprisingly, the levels of seven major FAs in OsLTP10-CR also increased by 12.53–22.00% (Figure 4D).
Figure 4.
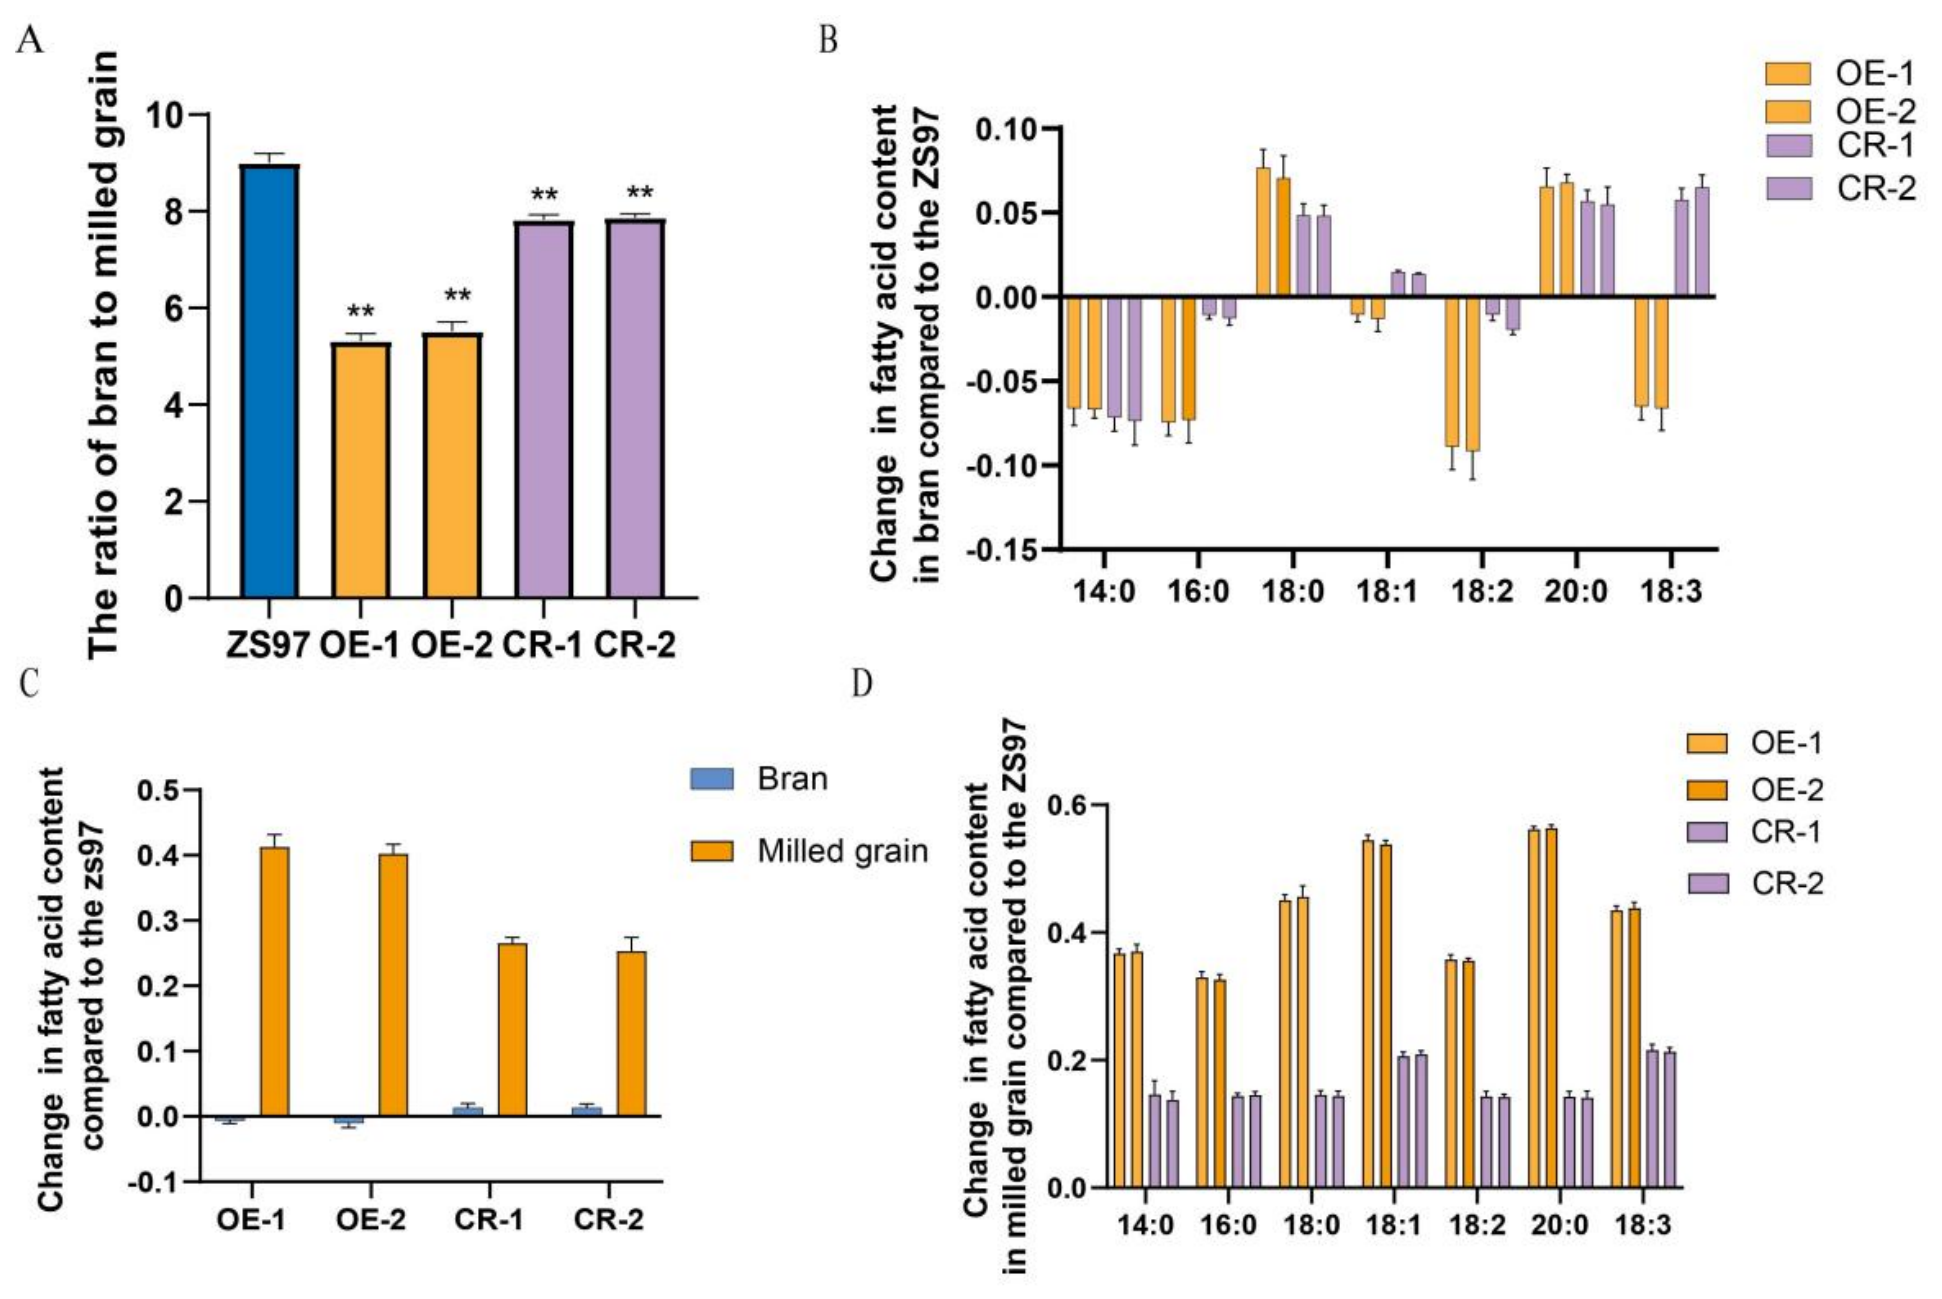
The total FAs and different FA ratio of bran to milled grain. (A) The total FA ratio of bran to milled grain was influenced by OsLTP10. (B) The change in fatty acid content of OsLTP10-OE, OsLTP10-CR to ZS97 in bran. (C) The change (%) in fatty acid content of OsLTP10-OE, OsLTP10-CR to ZS97 in bran and milled grain, respectively. (D) The change (%) in the main fatty acid content of OsLTP10-OE, OsLTP10-CR to ZS97 in milled grain. ZS97: Zhenshan97, WT; OE1, OE2: OsLTP10 overexpression lines; CR1, CR2: OsLTP10 CRISPR/Cas9 edited lines. Data are presented as mean ± SD from three independent biological replicates. Statistical significance was determined using one-way ANOVA followed by Duncan’s multiple range test ( ** p < 0.01).
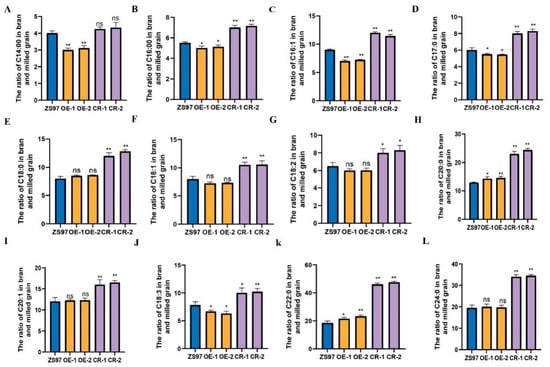
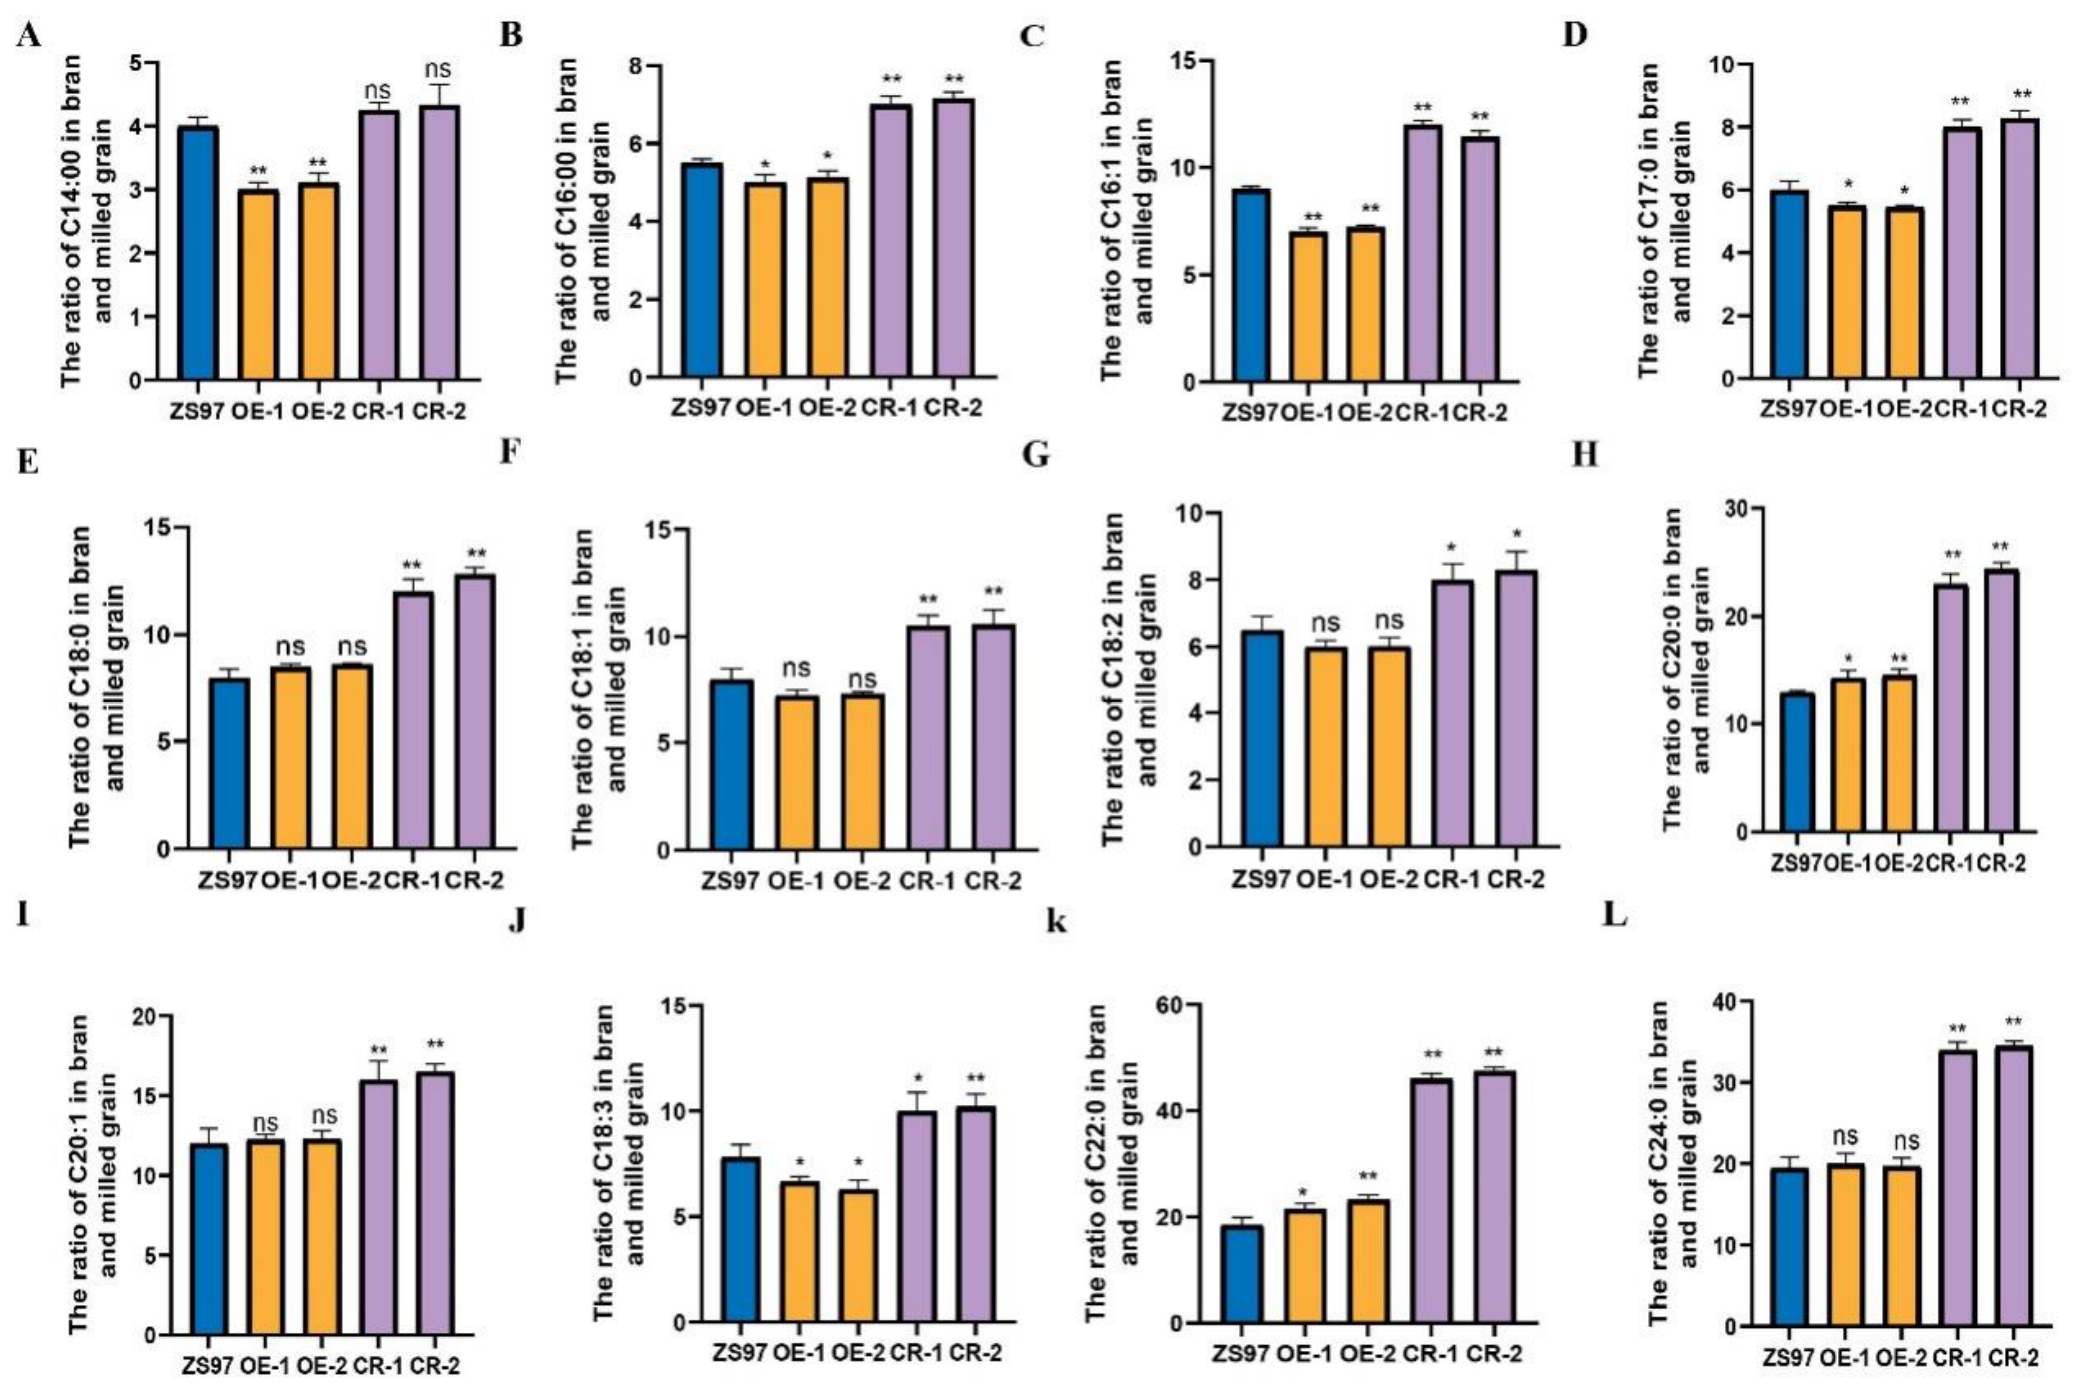
When different individual fatty acids were examined, substantial variation was observed in the bran-to-endosperm ratio, with the ratio ranging from 2.89 to 48.33 across different lines (Figure 5A–L). Specifically, when comparing OsLTP10-OE with the WT, all unsaturated FAs showed a lower bran-to-milled ratio, while saturated FAs exhibited little to no difference. However, the bran-to-milled rice ratio for all FAs in OsLTP10-CR was higher than that in the WT (Figure 5A–L).
Figure 5.
The content of fatty acid in bran and milled grain was influenced by OsLTP10. The (A–L) represent the ratio of C14:0, C16:0, C16:1, C17:0, C18:0, C18:1, C18:2, C18:3, C20:0, C20:1, C22:0, C24:0, respectively. Data are presented as mean ± SD from three independent biological replicates. Statistical significance was determined using one-way ANOVA followed by Duncan’s multiple range test (* p < 0.05, ** p < 0.01; ns, not significant).
3.5. Effects of OsLTP10 on Rice Grain Properties
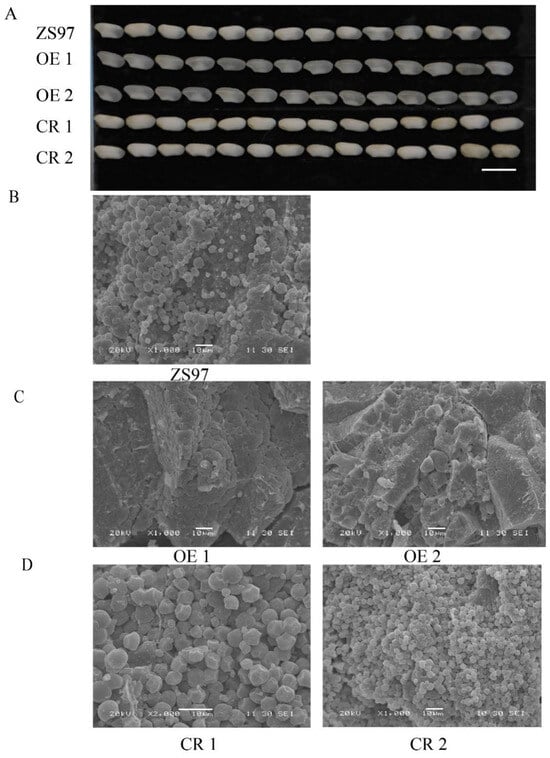
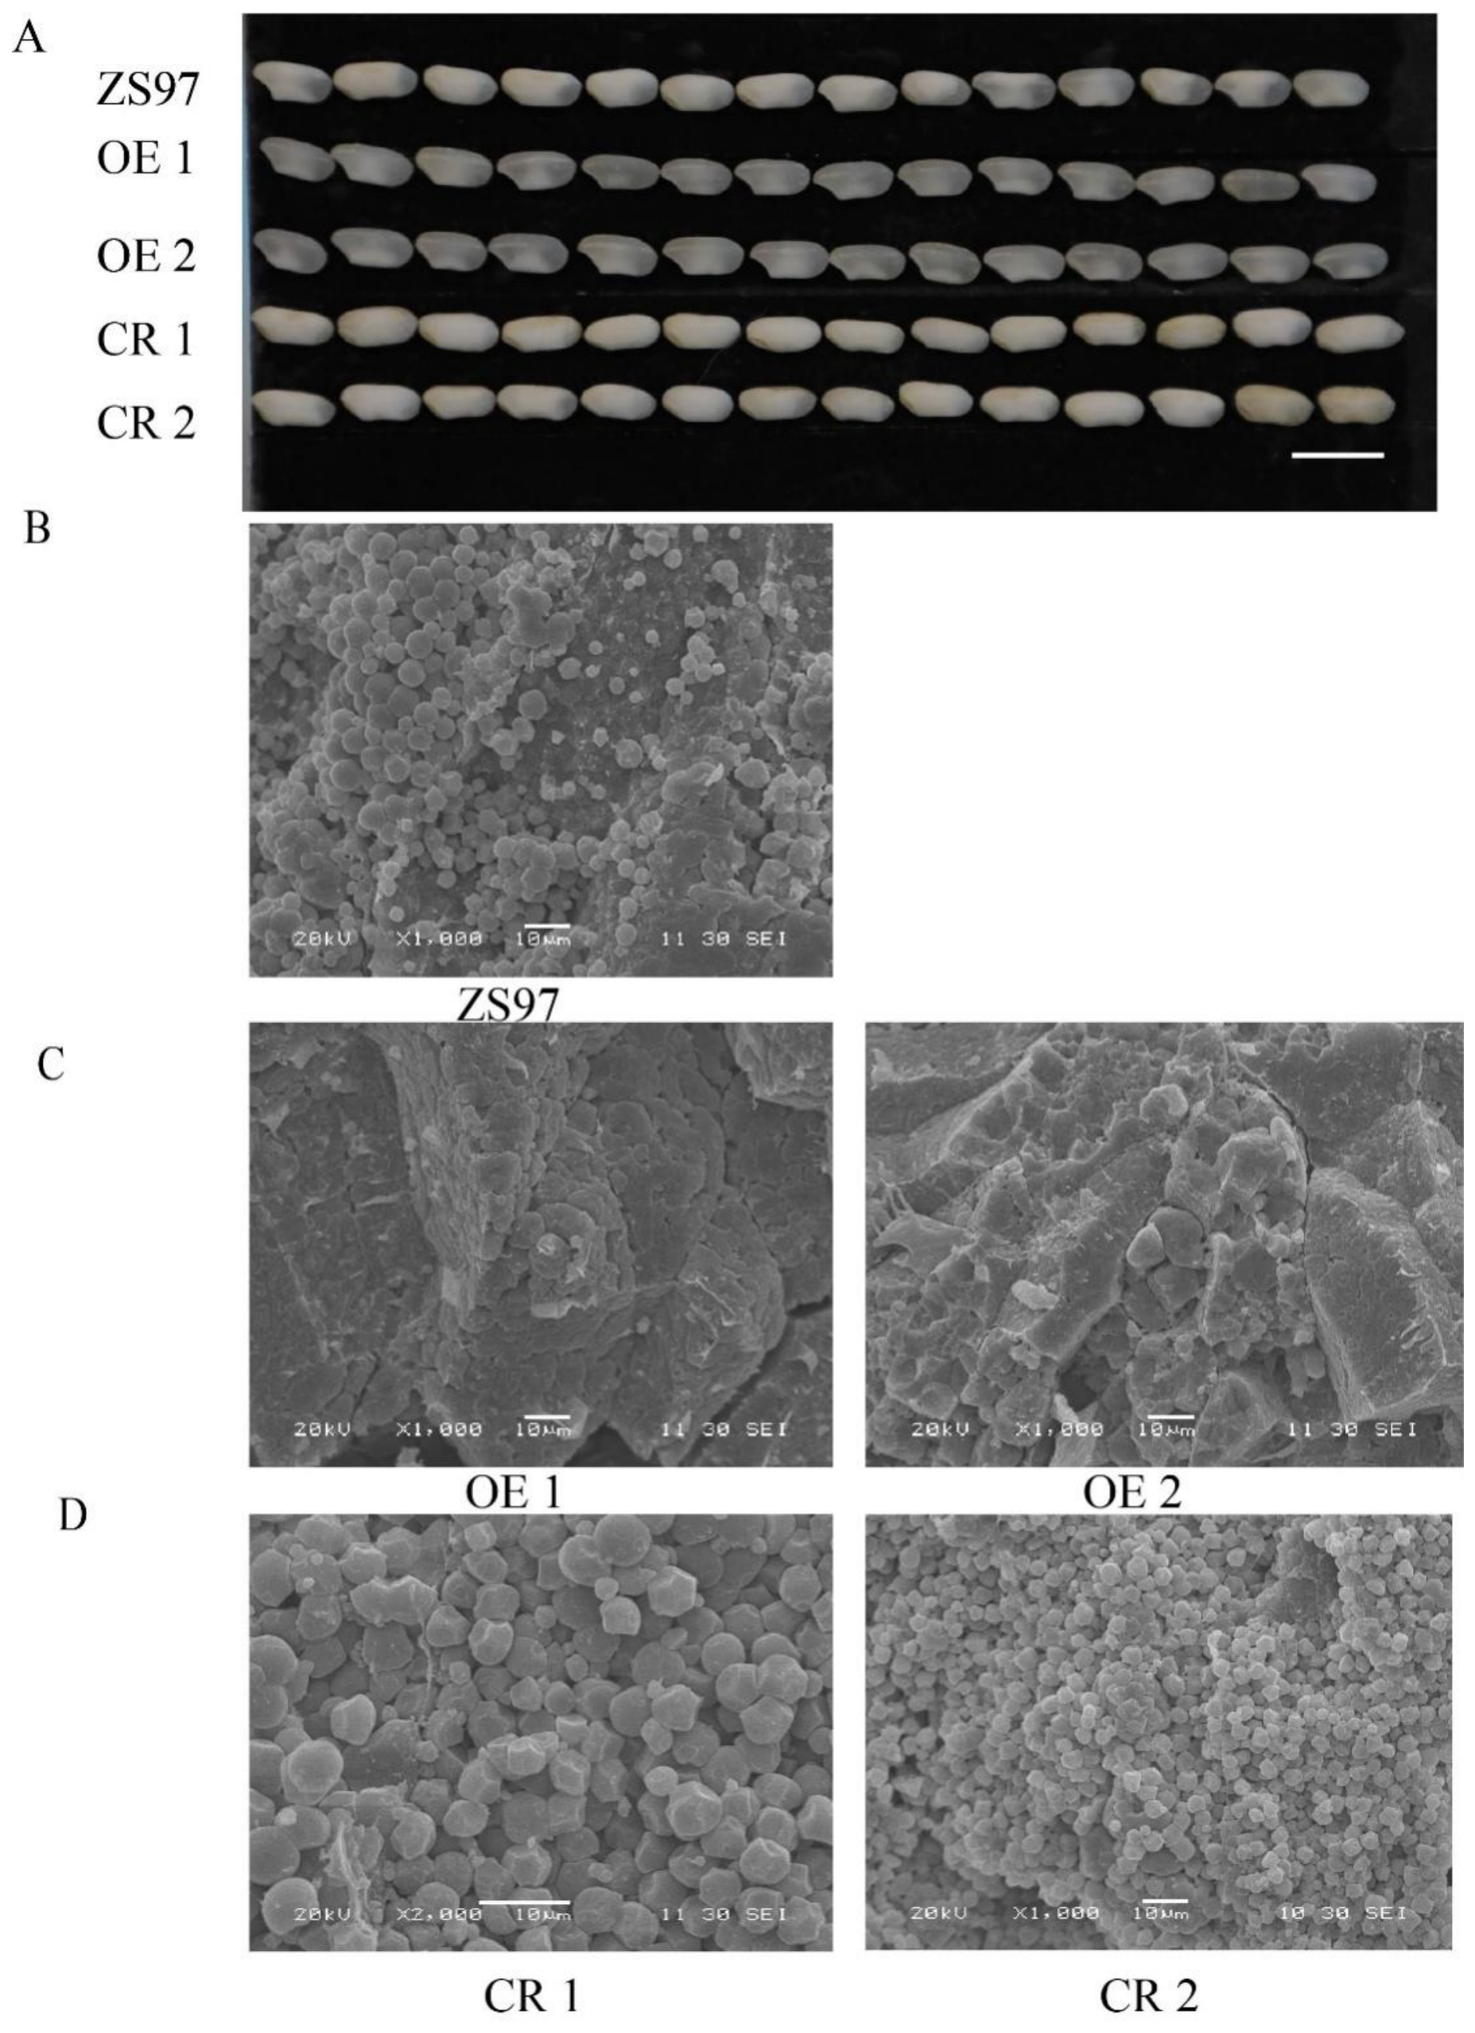
Chalkiness, as an important factor that determines rice appearance and eating quality, was investigated among the OsLTP10-OE, OsLTP10-CR, and WT. White-belly is the primary chalky type in all experimental materials (Figure 6A). We observed that OsLTP10-CR displayed a large chalkiness area. In contrast, the OsLTP10-OE showed a lower chalkiness rate compared with the WT (Figure 6A). The caryopses of WT, OsLTP10-OE, and OsLTP10-CR were observed by SEM. SEM examinations showed that endosperms of WT and OsLTP10-CR carried round, small, and loosely packed starch granules with intergranular air spaces, while the endosperms of OsLTP10-OE were filled with large and tightly packed starch granules (Figure 6B–D). The average diameter of individual compound starch granules in the OsLTP10-CR lines significantly decreased by 15.3% (from 4.21 μm in WT to 3.56 μm in CR-1), whereas no significant size alteration was observed in OE lines.
Figure 6.
The chalkiness was influenced by OsLTP10. (A) The chalkiness among ZS97, OsLTP10-OE, and OsLTP10-CR. (B–D) The starch granules in endosperms examined by SEM in WT, OE1, OE2 (OsLTP10-OE) and CR1, CR2 (OsLTP10-CR). Scale bars: 10 μm.
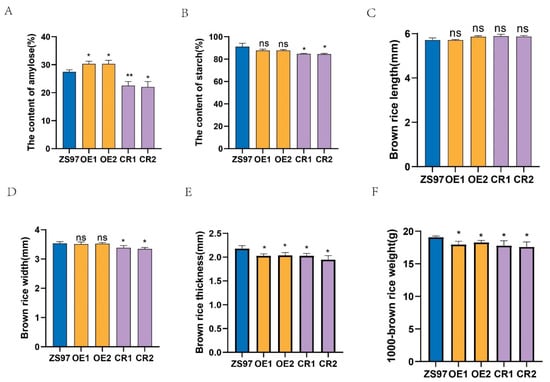
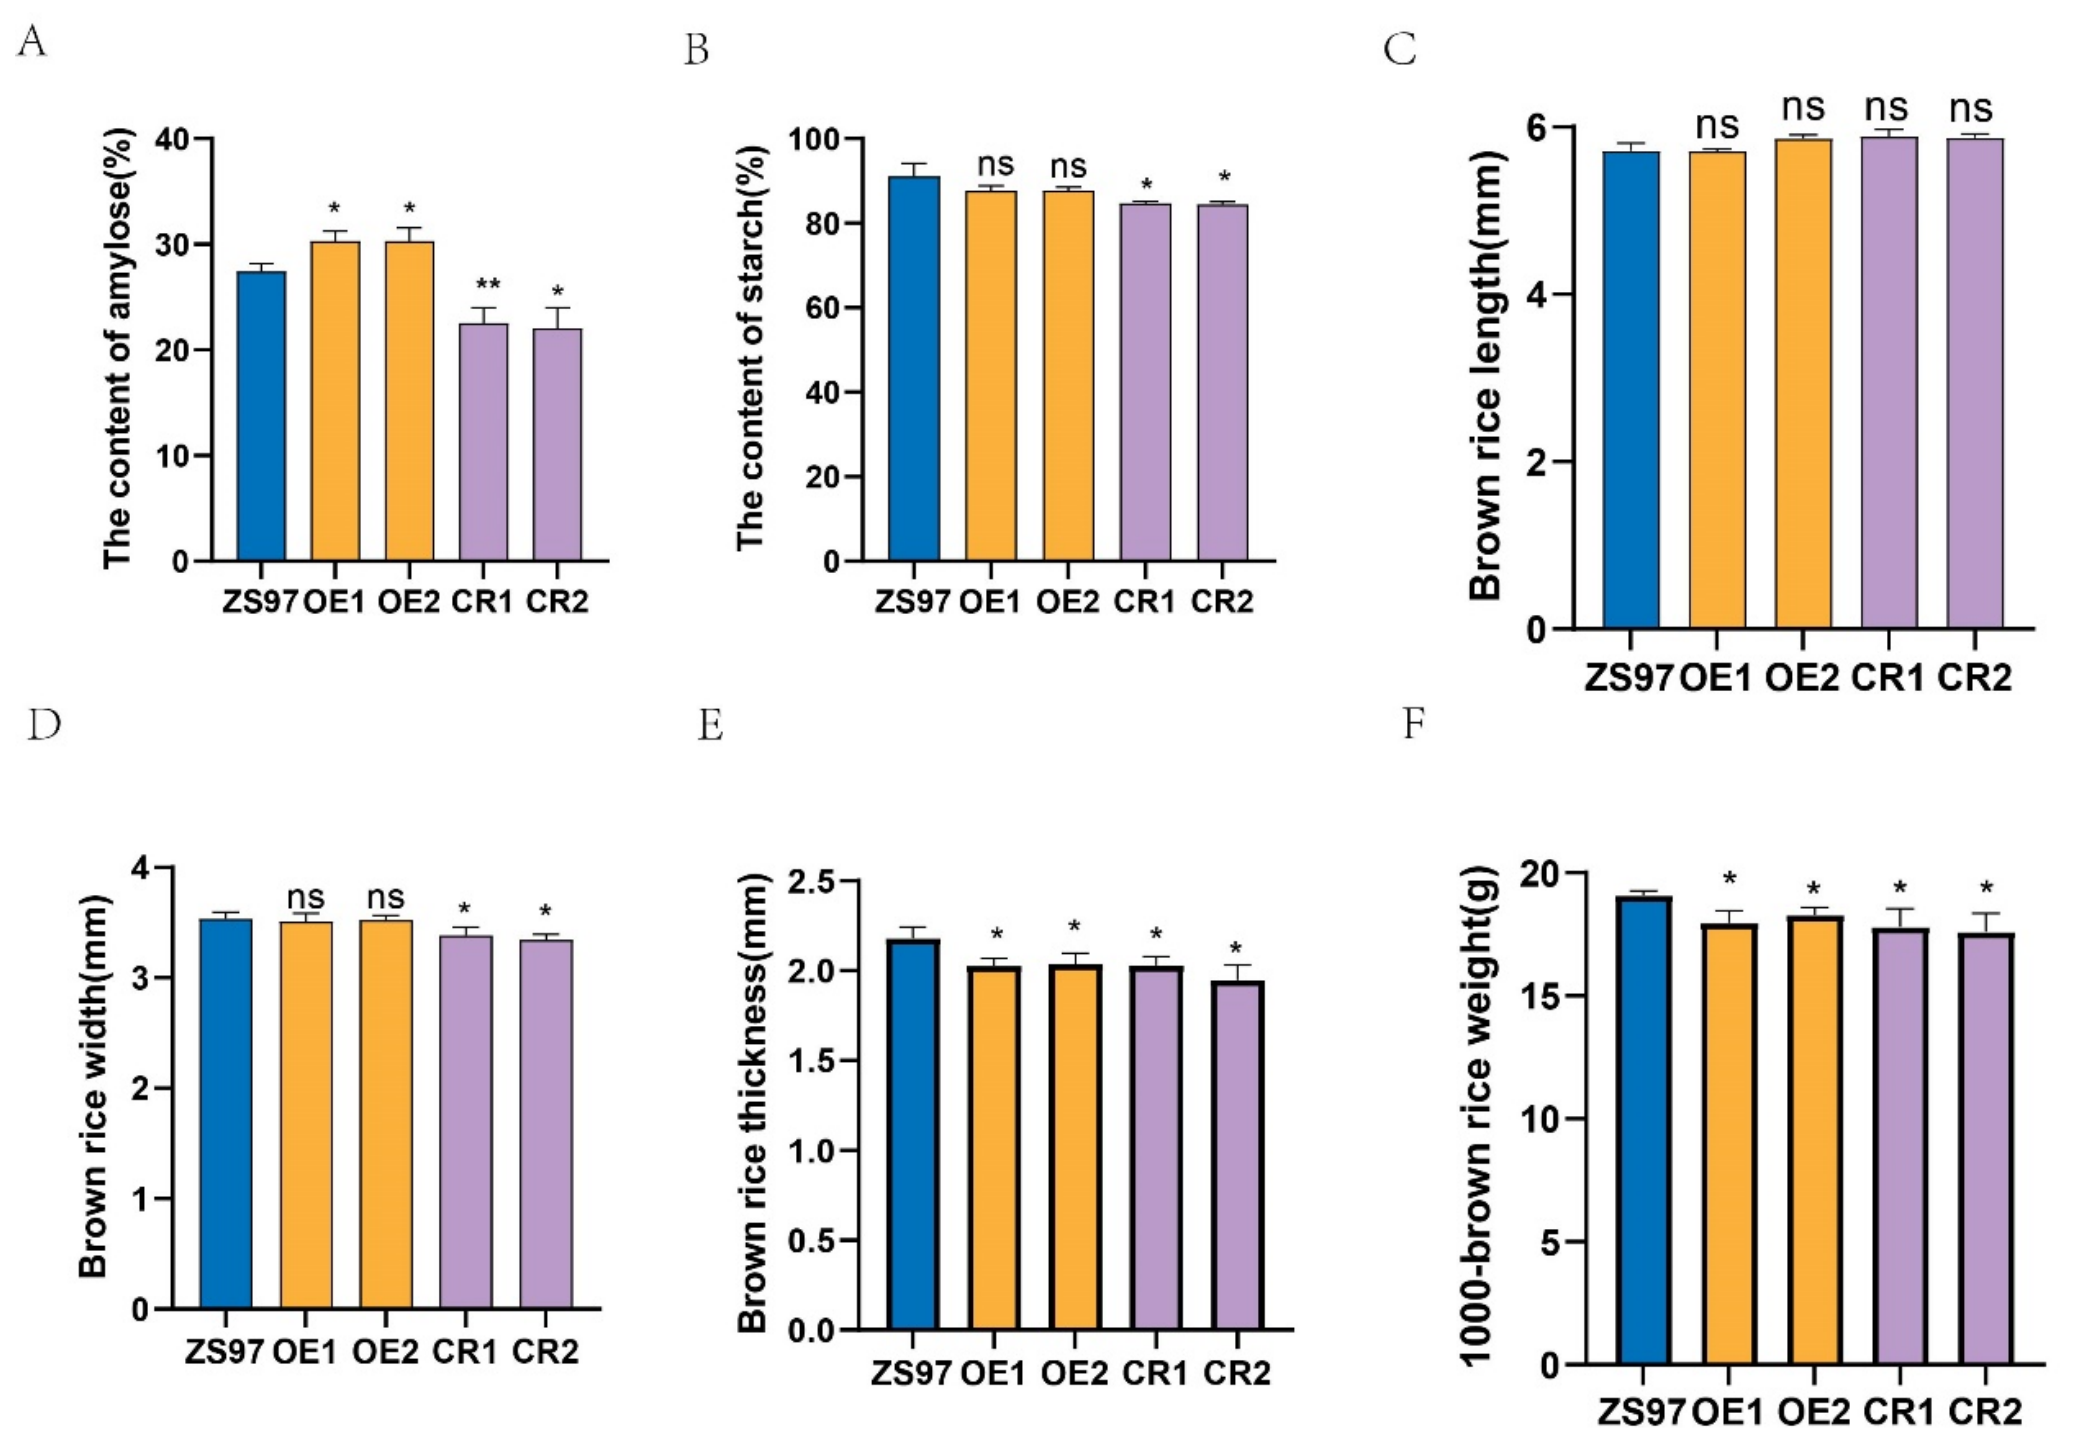
At the same time, the contents of amylose and starch also differed between OsLTP10-OE and OsLTP10-CR lines. The amylose content in OsLTP10-OE was increased by 7.80%, but OsLTP10-CR showed a reduction of 19.50% compared to the WT (Figure 7A). Total starch content was lower in both OsLTP10-OE and OsLTP10-CR than that in WT, although this reduction was not statistically significant in OsLTP10-OE (Figure 7B).
Figure 7.
The influence of OsLTP10 on rice physical traits. (A) The content of amylose; (B) the content of starch; (C) the brown rice length; (D) the brown rice width; (E) the brown rice thickness; (F) 1000-brown rice weight. ZS97: WT; OE1, OE2: OsLTP10 overexpression lines; CR1, CR2: OsLTP10 CRISPR/Cas9 edited lines. Data are presented as mean ± SD from three independent biological replicates. Statistical significance was determined using one-way ANOVA followed by Duncan’s multiple range test (* p < 0.05, ** p < 0.01; ns, not significant).
There were no visible differences in plant morphology, panicle length, and brown rice length among the WT, OsLTP10-OE, and OsLTP10-CR (Figure 7C). However, variation was observed in brown rice width, brown rice thickness, and 1000-grain weight. The brown rice width of OsLTP10-CR was significantly reduced compared with WT, and there was no obvious difference between the WT and OsLTP10-OE (Figure 7D). Brown rice thickness analysis indicated that grain thickness was significantly reduced in both OsLTP10-OE and OsLTP10-CR (Figure 7E). The 1000-grain weight of OsLTP10-OE and OsLTP10-CR was also significantly reduced compared with WT (Figure 7F).
4. Discussion
In plants, de novo fatty acid (FA) synthesis occurs in plastids, requiring efficient transport to the endoplasmic reticulum (ER) for modification, lipid assembly, and triacylglycerol (TAG) accumulation [7,8,9]. Non-specific lipid transfer proteins (nsLTPs), characterized by an internal hydrophobic cavity stabilized by eight conserved cysteine residues [30,31,32], are prime candidates for conveying these hydrophobic lipids across hydrophilic intracellular spaces [33,34]. Beyond their diverse roles in cuticle integrity and stress responses [19,22], nsLTPs are increasingly recognized as critical regulators of seed development and grain quality [13]. For instance, OsLTPL36 in rice [13] and SiLTPI.23/28 in sesame [35,36,37] have been validated as essential factors driving oil accumulation and seed properties. In our study, OsLTP10 signals co-localized with chlorophyll autofluorescence (Figure 2B). Given that FA synthesis is restricted to plastids, this potential chloroplast association—although requiring definitive stroma/envelope marker validation—leads us to speculate that OsLTP10 might be involved in mediating the initial export of newly synthesized acyl chains from plastids to the ER, thereby influencing subsequent fatty acid distribution and appearance quality in rice grains. However, we strongly emphasize that this plastid-to-ER transport mechanism remains purely speculative at this stage and requires direct functional transport assays for validation.
In this paper, we investigated the possible functions of OsLTP10 in lipid transport and fatty acid distribution in rice grains, particularly in milled rice grains, and their consequent effects on rice grain quality by a reverse genetics approach. In all experimental rice grains, the C18:1, C18:2, C16:0, C18:0, C20:0, C18:3, and C24:0 ranked the high content of fatty acid components, with C17:0 being the lowest in both bran and milled rice. Consistent with previous reports, the primary saturated fatty acids identified in both rice bran and milled grain were C16:0 and C18:0, with C18:1 and C18:2 being the major monounsaturated fatty acids and polyunsaturated fatty acids, respectively. However, the detailed lipid components differed between the bran and milled rice. Among all identified fatty acids, C18:1 ranked the highest in content in rice bran, while C18:2 was predominant in milled grain (Table S2). These results agree with previous reports that oleic, linoleic, and palmitic acid were the major FAs, and unsaturated fractions constituted more than 74% of the total FAs in rice [14,38]. Further analysis indicated that there are differences in FA content (Figure 3A) and FA composition in OsLTP10 CRISPR/Cas9 edited lines, as well as OsLTP10 overexpression lines, compared to the WT. The ratio of saturated to unsaturated fatty acids in OsLTP10 CRISPR/Cas9 edited lines was higher than that in WT or overexpression lines (Figure 3I).
The lipid content of rice not only constitutes a crucial nutritional component but also contributes to the appearance, cooking, and storage qualities of rice. Nutrient components, including starch, protein, lipids, and micronutrients, make a big difference in determining rice grain quality [2]. Previous studies have reported that high lipid metabolites help improve the eating quality and nutritional value of rice cultivars with superior eating quality [11]. Physical traits such as grain length, grain width, and chalkiness are also significantly correlated with rice quality [39]. It has been documented that mutation of OsPLDa1, a phospholipase D encoding gene, can increase lysophospholipid content and further enhance the cooking and eating quality of rice. Compared with the WT, knockout of OsPLDα1 leads to a ~15% increase in lysophospholipid content, resulting in lower apparent amylose content, setback viscosity, gelatinization onset, peak temperature, retrogradation percentage, and a higher breakdown of brown rice flour [40].
Consistent with these previous findings, our results showed that OsLTP10 plays roles in rice grain length, width, or thickness (Figure 4). Regarding chalkiness, OsLTP10 CRISPR/Cas9 edited lines exhibited significantly higher chalkiness, while overexpression lines displayed a visible reduction in chalkiness compared with the wildtype (Figure 6A). Similar chalkiness phenotypic results were presented in OsLTPL36 transgenic rice lines [13]. Another nutrient component, starch, also showed variation in different OsLTP10 transgenic lines. For example, amylose content increased in OsLTP10 overexpression lines while decreased in OsLTP10 CRISPR/Cas9 edited lines when compared with the wildtype (Figure 7A).
These results indicate that it is possible to improve rice grain quality through genetically manipulating OsLTP10, which alters nutrient components such as FA composition and amylose content. Overall, our analysis of different transgenic lines confirms that OsLTP10 contributes to influencing seed lipid content as well as grain quality-related traits, including fatty acids, grain size, total starch, and chalkiness. These findings afford a clue that OsLTP10 expression is linked to grain physical traits. Although the present data showing synchronized alterations in lipid profiles and starch granule structure (Figure 6 and Figure 7) remain largely correlative, it provides a genetic basis for further investigating lipid–starch interaction mechanisms.
In fact, due to the lack of direct lipid-binding and functional transport assays in this study, the exact biochemical mechanism and direct substrates of OsLTP10 remain to be fully elucidated. However, our genetic and phenotypic results suggest that OsLTP10 holds great potential to improve grain size and fatty acid composition in rice. However, since our study was conducted in a single location and lacks commercial milling, cooking, or sensory taste panel data, the practical value of OsLTP10 remains to be rigorously validated. Future multi-environment trials are necessary to confirm the stability of these quality traits. Hence, while OsLTP10 offers a preliminary baseline for investigating the nutritional value of edible milled rice via genetic engineering, its actual agronomic value and breeding utility remain inconclusive without comprehensive multi-location field trials to test environmental stability.
5. Conclusions
In summary, this study provides preliminary functional evidence that OsLTP10, a member of the Type I non-specific lipid transfer protein (nsLTP) family, plays a role in fatty acid content and composition in rice developing endosperm. Our results reveal that alterations in OsLTP10 expression not only disrupt lipid homeostasis but also significantly influence grain appearance, specifically regarding chalkiness and transparency. These phenotypic changes reflect a strong correlation between modified lipid profiles and the arrangement and packing of starch granules during grain filling, though the underlying biochemical pathways driving this co-regulation require deeper functional dissection. Collectively, our findings suggest a potential link between OsLTP10-mediated lipid homeostasis and grain physical properties. However, any direct role for OsLTP10 in intracellular lipid transport remains speculative based on our current data and warrants further rigorous functional validation. Although OsLTP10 presents an interesting subject for further functional investigation, its stability across multiple environments and its impact on final industrial/eating quality require systematic field validation.
Supplementary Materials
The following supporting information can be downloaded at: https://www.mdpi.com/article/10.3390/agronomy16131269/s1, Figure S1: Identification of OsLTP10 homozygous knockout lines and overexpression lines. (A) Phenotypes of knockout and overexpression lines compared to wildtype at maturity. (B) Identification of OsLTP10 overexpression lines. (C) Identification of OsLTP10 homozygous knockout lines. CR-1: Insert a “T” and have a deletion of 18 bp at the target sites, CR-2: Insert an “A” at the target sites. ZS97: Zhenshan97, WT; OE-1, OE-2: OsLTP10 overexpression lines, CR-1, CR-2: OsLTP10 CRISPR/Cas9 edited lines, LTP10-CR. The data are the mean value from three different lines and statistical significance was determined using Student’s t-test (** p < 0.01). Table S1: The primer sequences for real-time PCR. Table S2: Fatty acid profile of rice bran and milled grain in different lines. Table S3. The mutation information of OsLTP10 in different CRISPR/Cas9 editing lines.
Author Contributions
T.L., Q.L. and P.S. performed most of the experiments. Q.X. performed vector construct and transgenic lines analysis. Z.L. and H.L. supported lipid analysis. Y.S., F.C. and H.Z. supported chalkiness analysis. T.L., Y.T., Z.H., Y.Z. and R.W. evaluated data. L.X. and Q.L. designed the research and wrote the manuscript with contributions from all authors. All authors have read and agreed to the published version of the manuscript.
Funding
This work was jointly supported by the Hunan Provincial Natural Science Foundation of China: (Grant No. 2023J50472, 2024JJ7270, 2026JJ50134), Hunan Science Foundation (Grant No. 2024NK1010), National Natural Science Foundation of China (Grant No. 32261143733) and Youth Project of Scientific Research Fund of Hunan Provincial Department of Education: 23B0820.
Institutional Review Board Statement
Not applicable.
Informed Consent Statement
Not applicable.
Data Availability Statement
Data were contained within the article.
Acknowledgments
We express our sincere gratitude to all individuals who participated in the experiment of this study.
Conflicts of Interest
The authors declare that there were no conflicts of interest.
References
- Xiong, Y.; Ren, Y.; Li, W.; Wu, F.; Yang, W.; Huang, X.; Yao, J. NF-YC12 is a key multi-functional regulator of accumulation of seed storage substances in rice. J. Exp. Bot. 2019, 70, 3765–3780. [Google Scholar] [PubMed]
- Zhou, Z.; Robards, K.; Helliwell, S.; Blanchard, C. Composition and functional properties of rice. Int. J. Food Sci. Technol. 2002, 37, 849–868. [Google Scholar] [CrossRef] [Scilit]
- Vazquez-Hernandez, M.; Blanch, M.; Sanchez-Ballesta, M.T.; Merodio, C.; Escribano, M.I. High CO2 alleviates cell ultrastructure damage in Autumn Royal table grapes by modulating fatty acid composition and membrane and cell oxidative status during long-term cold storage. Postharvest Biol. Technol. 2020, 160, 111037. [Google Scholar] [CrossRef] [Scilit]
- Bhatnagar, T.; Banik, S.; Sinha, K.; Joshi, P.; Ishita Majumdar, S.; Singh, N.; Bhunia, R.K.; Dutta, D. The lipid partners of plant membrane transporters in salinity stress response. Plant Physiol. Biochem. 2025, 229, 110437. [Google Scholar] [CrossRef] [Scilit] [PubMed]
- Li, R.; Liu, Y.; Wei, R.; Liu, Z.; Cui, M.; Liu, X.; Liu, J.; Wei, H.; Xu, K.; Dai, Q.; et al. Salt stress reduces rice yield by altering leaf membrane lipid metabolism and physiological traits (in salt-tolerant genotype). Plant Physiol. Biochem. 2025, 229, 110375. [Google Scholar] [CrossRef] [Scilit] [PubMed]
- Reszczyńska, E.; Hanaka, A. Lipids composition in plant membranes. Cell Biochem. Biophys. 2020, 78, 401–414. [Google Scholar] [CrossRef] [Scilit] [PubMed]
- Schnurr, J.A.; Shockey, J.M.; Boe, G.-J.D.; Browse, J.A. Fatty acid export from the chloroplast. molecular characterization of a major plastidial Acyl-Coenzyme A synthetase from Arabidopsis. Plant Physiol. 2002, 129, 1700–1709. [Google Scholar] [CrossRef] [Scilit] [PubMed]
- Li, N.; Xu, C.; Li-Beisson, Y.; Philippar, K. Fatty acid and lipid transport in plant cells. Trends Plant Sci. 2016, 21, 145–158. [Google Scholar] [CrossRef] [Scilit] [PubMed]
- Zhao, H.; Kosma, D.K.; Lü, S. Functional role of long-chain Acyl-CoA synthetases in plant development and stress responses. Front. Plant Sci. 2021, 12, 640996. [Google Scholar] [CrossRef] [Scilit] [PubMed]
- Ying, J.-Z.; Shan, J.-X.; Gao, J.-P.; Zhu, M.-Z.; Shi, M.; Lin, H.-X. Identification of quantitative trait loci for lipid metabolism in rice seeds. Mol. Plant 2012, 5, 865–875. [Google Scholar] [CrossRef] [Scilit] [PubMed]
- Gong, R.; Huang, D.; Chen, Y.; Li, H.; Wang, Z.; Zhou, D.; Zhao, L.; Pan, Y.; Chang, Y.; Xiang, Y.; et al. Comparative metabolomics analysis reveals the variations of eating quality among three high-quality rice cultivars. Mol. Breed. 2020, 40, 112. [Google Scholar] [CrossRef] [Scilit]
- Hu, C.; Tohge, T.; Chan, S.-A.; Song, Y.; Rao, J.; Cui, B.; Lin, H.; Wang, L.; Fernie, A.R.; Zhang, D.; et al. Identification of conserved and diverse metabolic shifts during rice grain development. Sci. Rep. 2016, 6, 20942. [Google Scholar] [CrossRef] [Scilit] [PubMed]
- Wang, X.; Zhou, W.; Lu, Z.; Ouyang, Y.O.C.S.; Yao, J. A lipid transfer protein, OsLTPL36, is essential for seed development and seed quality in rice. Plant Sci. 2015, 239, 200–208. [Google Scholar] [PubMed]
- Concepcion, J.C.T.; Calingacion, M.; Garson, M.J.; Fitzgerald, M.A. Lipidomics reveals associations between rice quality traits. Metabolomics 2020, 16, 54. [Google Scholar] [CrossRef] [Scilit] [PubMed]
- Hurlock, A.K.; Roston, R.L.; Wang, K.; Benning, C. Lipid trafficking in plant cells. Traffic 2014, 15, 915–932. [Google Scholar] [CrossRef] [Scilit] [PubMed]
- Missaoui, K.; Gonzalez-Klein, Z.; Pazos-Castro, D.; Hernandez-Ramirez, G.; Garrido-Arandia, M.; Brini, F.; Diaz-Perales, A.; Tome-Amat, J. Plant non-specific lipid transfer proteins: An overview. Plant Physiol. Biochem. 2022, 171, 115–127. [Google Scholar] [CrossRef] [Scilit] [PubMed]
- Wong, L.H.; Čopič, A.; Levine, T.P. Advances on the transfer of lipids by lipid transfer proteins. Trends Biochem. Sci. 2017, 42, 516–530. [Google Scholar] [CrossRef] [Scilit] [PubMed]
- Pagnussat, L.; Burbach, C.; Baluška, F.; Canal, L.D. An extracellular lipid transfer protein is relocalized intracellularly during seed germination. J. Exp. Bot. 2012, 63, 6555–6563. [Google Scholar] [CrossRef] [Scilit] [PubMed]
- DeBono, A.; Yeats, T.H.; Rose, J.K.C.; Bird, D.; Jetter, R.; Kunst, L.; Samuels, L. Arabidopsis LTPG is a glycosylphosphatidylinositol-anchored lipid transfer protein required for export of lipids to the plant surface. Plant Cell 2009, 21, 1230–1238. [Google Scholar] [CrossRef] [Scilit] [PubMed]
- Jacq, A.; Pernot, C.; Martinez, Y.; Domergue, F.; Payré, B.; Jamet, E.; Burlat, V.; Pacquit, V.B. The Arabidopsis lipid transfer protein 2 (AtLTP2) is involved in cuticle-cell wall interface integrity and in etiolated hypocotyl permeability. Front. Plant Sci. 2017, 8, 263. [Google Scholar] [CrossRef] [Scilit] [PubMed]
- Chae, K.; Gonong, B.J.; Kim, S.-C.; Kieslich, C.A.; Morikis, D.; Balasubramanian, S.; Lord, E.M. A multifaceted study of stigma/style cysteine-rich adhesin(SCA)-like Arabidopsis lipid transfer proteins (LTPs) suggests diversified roles for these LTPs in plant growth and reproduction. J. Exp. Bot. 2010, 61, 4277–4290. [Google Scholar] [CrossRef] [Scilit] [PubMed]
- Gao, S.; Guo, W.; Feng, W.; Liu, L.; Song, X.; Chen, J.; Hou, W.; Zhu, H.; Tang, S.; Hu, J. LTP3 contributes to disease susceptibility in Arabidopsis by enhancing abscisic acid (ABA) biosynthesis. Mol. Plant Pathol. 2016, 17, 412–426. [Google Scholar] [PubMed]
- Guo, L.; Yang, H.; Zhang, X.; Yang, S. Lipid transfer protein 3 as a target of MYB96 mediates freezing and drought stress in Arabidopsis. J. Exp. Bot. 2013, 64, 1755–1767. [Google Scholar] [CrossRef] [Scilit] [PubMed]
- Safi, H.; Saibi, W.; Alaoui, M.M.; Hmyene, A.; Masmoudi, K.; Hanin, M. A wheat lipid transfer protein (TdLTP4) promotes tolerance to abiotic and biotic stress in Arabidopsis thaliana. Plant Physiol. Biochem. 2015, 89, 64–75. [Google Scholar] [CrossRef] [Scilit] [PubMed]
- Lin, Z.; Wang, Z.; Zhang, X.; Liu, Z.; Li, G.; Wang, S.; Ding, Y. Complementary Proteome and Transcriptome Profiling in Developing Grains of a Notched-Belly Rice Mutant Reveals Key Pathways Involved in Chalkiness Formation. Plant Cell Physiol. 2017, 58, 560–573. [Google Scholar] [CrossRef] [Scilit] [PubMed]
- Yamakawa, H.; Hirose, T.; Kurod, M.; Yamaguchi, T. Comprehensive expression profiling of rice grain filling-related genes under high temperature using DNA microarray. Plant Physiol. 2007, 144, 258–277. [Google Scholar] [CrossRef] [Scilit] [PubMed]
- Xie, Q.; Xu, J.; Huan, K.; Su, Y.; Tong, J.; Huang, Z.; Huan, C.; Wei, M.; Lin, W.; Xiao, L. Dynamic formation and transcriptional regulation mediated by phytohormones during chalkiness formation in rice. BMC Plant Biol. 2021, 21, 308. [Google Scholar] [CrossRef] [Scilit] [PubMed]
- Xiao, S.; Li, H.-O.; Xu, M.-W.; Huang, K.; Luo, Z.-F.; Xiao, L.-T. A high-throughput method for profiling fatty acids in plant seeds based on one-stepacid-catalyzed methylation followed by gas chromatography-mass spectrometry. Biotechnol. Biotechnol. Equip. 2021, 35, 1076–1085. [Google Scholar] [CrossRef] [Scilit]
- Wu, B.; Yun, P.; Zhou, H.; Xia, D.; Gu, Y.; Li, P.; Yao, J.; Zhou, Z.; Chen, J.; Liu, R.; et al. Natural variation in WHITE-CORE RATE 1 regulatesredox homeostasis in rice endosperm to affect grain quality. Plant Cell 2022, 34, 1912–1932. [Google Scholar] [CrossRef] [Scilit] [PubMed]
- Arondel, V.; Vergnolle, C.; Cantrel, C.; Kader, J.-C. Lipid transfer proteins are encoded by a small multigene family in Arabidopsis thaliana. Plant Sci. 2000, 157, 1–12. [Google Scholar] [CrossRef] [Scilit]
- Wang, H.W.; Hwang, S.-G.; Karuppanapandian, T.; Liu, A.; Kim, W.; Jang, C.S. Insight into the molecular evolution of non-specific lipid transfer proteins via comparative analysis between rice and sorghum. DNA Res. 2012, 19, 179–194. [Google Scholar] [CrossRef] [Scilit] [PubMed]
- Lei, L.; Chen, L.; Shi, X.; Li, Y.; Wang, J.; Chen, D.; Xie, F.; Li, Y. A nodule-specific lipid transfer protein AsE246 participates in the transport of plant-synthesized lipids to the symbiosome membrane and is essential for nodule organogenesis in Chinese Milk Vetch. Plant Physiol. 2014, 164, 1045–1058. [Google Scholar] [PubMed]
- Kader, J.-C. Lipid-transfer proteins in plants. Annu. Rev. Plant Physiol. Plant Mol. Biol. 1996, 47, 627–654. [Google Scholar] [CrossRef] [Scilit] [PubMed]
- Pii, Y.; Astegno, A.; Peroni, E.; Zaccardelli, M.; Pandolfini, T.; Crimi, M. The Medicago truncatula N5 gene encoding a root-specific lipid transfer protein is required for the symbiotic interaction with Sinorhizobium meliloti. Mol. Plant-Microbe Interact. 2009, 22, 1577–1587. [Google Scholar] [CrossRef] [Scilit] [PubMed]
- Liao, J.; Zhou, H.; Peng, Q.; Zhong, P.; Zhang, H.; He, C.; Huang, Y. Transcriptome changes in rice (Oryza sativa L.) in response to high night temperature stress at the early milky stage. BMC Genom. 2015, 16, 18. [Google Scholar] [CrossRef] [Scilit]
- Zhu, L.; Chen, Z.; Li, H.; Sun, Y.; Wang, L.; Zeng, H.; He, Y. Lipid metabolism is involved in male fertility regulation of the photoperiod- and thermo sensitive genic male sterile rice line Peiai 64S. Plant Sci. 2020, 299, 110581. [Google Scholar] [CrossRef] [Scilit] [PubMed]
- Song, S.; You, J.; Shi, L.; Sheng, C.; Zhou, W.; Dossou, S.S.K.; Dossa, K.; Wang, L.; Zhang, X. Genome-wide analysis of nsLTP gene family and identification of SiLTPs contributing to high oil accumulation in Sesame (Sesamum indicum L.). Int. J. Mol. Sci. 2021, 22, 5291. [Google Scholar] [PubMed]
- Yu, L.; Li, G.; Li, M.; Xu, F.; Beta, T.; Bao, J. Genotypic variation in phenolic acids, vitamin E and fatty acids in whole grain rice. Food Chem. 2016, 197, 776–782. [Google Scholar] [CrossRef] [Scilit] [PubMed]
- Bridgemohan, P.; Bridgemohan, R.S.H. Crop nutrition studies on grain filling and chalkiness in rice. J. Plant Breed. Crop Sci. 2014, 6, 144–152. [Google Scholar] [CrossRef] [Scilit]
- Khan, M.S.S.; Basnet, R.; Ahmed, S.; Bao, J.; Shu, Q. Mutations of OsPLDa1 Increase Lysophospholipid Content and Enhance Cooking and Eating Quality in Rice. Plants 2020, 9, 390. [Google Scholar] [CrossRef] [Scilit] [PubMed]
Disclaimer/Publisher’s Note: The statements, opinions and data contained in all publications are solely those of the individual author(s) and contributor(s) and not of MDPI and/or the editor(s). MDPI and/or the editor(s) disclaim responsibility for any injury to people or property resulting from any ideas, methods, instructions or products referred to in the content. |
© 2026 by the authors. Licensee MDPI, Basel, Switzerland. This article is an open access article distributed under the terms and conditions of the Creative Commons Attribution (CC BY) license.