1. Introduction
Global land-use change and its interactions with the carbon cycle constitute an important pathway through which human activities influence terrestrial carbon storage and ecosystem functioning, although they represent only one component of broader climate-change mitigation and environmental management strategies [
1,
2,
3]. Farmland, as a critical component of the terrestrial carbon pool, undergoes continuous changes that can alter the global soil carbon budget [
4,
5]. In hilly agroecosystems, fragmented terrain, slope-related erosion, and constraints on mechanized cultivation can further modify vegetation recovery and soil carbon dynamics [
6,
7,
8,
9]. Surface soil organic carbon (SOC), the most dynamic component of soil carbon pools, plays a critical role in maintaining soil fertility, mitigating greenhouse effects, and ensuring ecosystem stability [
10,
11,
12,
13,
14]. Therefore, understanding how farmland abandonment affects surface SOC under hilly conditions is essential for interpreting soil carbon responses and supporting differentiated land-management decisions.
The precise identification of abandoned farmland is a prerequisite for assessing its ecological and environmental effects. Early studies relied mainly on field surveys and questionnaires administered to farmers, which, though providing details, were constrained by high costs, limited timeliness, and insufficient spatial coverage [
15]. With advancements in Earth observation technology, remote sensing-based monitoring methods have become the dominant approach for the large-scale extraction of farmland abandonment data [
16,
17], among which land-use trajectory tracking offers significant advantages. By reconstructing the temporal sequences of land plots, this method captures the timing, duration, and spatial patterns of farmland abandonment transitions with high precision [
18]. Despite extensive research on the spatiotemporal features of farmland abandonment in hilly and mountainous regions, studies focusing on the hilly region of South China remain insufficient. Existing studies have analyzed the socioeconomic driving factors of farmland abandonment, but studies leveraging long-term, high-resolution remote sensing data combined with trajectory-tracking methods are still scarce [
19,
20,
21]. Furthermore, the unique fragmented terrain of this region has hindered comprehensive empirical research on the mechanism of “abandonment spatiotemporal trajectory–soil carbon pool response”, making it challenging to accurately assess regional carbon budget changes.
Through reshaping the coupled “vegetation–soil” carbon cycling mechanisms, land-use changes profoundly affect the carbon source and carbon sink pattern of the soil carbon pool [
22,
23]. Currently, scholars have widely explored the carbon effects associated with farmland transitions to forest, grassland, and abandoned land [
24]. It is generally accepted that the cessation of agricultural activities and subsequent restoration of natural vegetation cause the sequestration of organic carbon by the receipt of additional biomass and stabilization of soil respiration rate [
25,
26,
27,
28]. However, SOC responses after abandonment are not spatially uniform or necessarily persistent over time. They are jointly affected by vegetation succession, soil biota, soil physicochemical properties, climate, and topographic conditions, which together regulate organic carbon input, decomposition, redistribution, and stabilization. Specifically, even if the existing literature largely confirms the positive role of farmland abandonment in promoting carbon accumulation, empirical research under the typical acidic red soil conditions of the hilly region of South China remains inadequate [
29,
30]. More critically, existing studies often focus on static comparisons between pre- and post-abandonment conditions, lacking refined quantitative analyses that integrate key covariates such as abandonment duration and initial soil physicochemical properties (e.g., pH, texture), which hinders the exploration of the intrinsic driving mechanisms and evolution patterns of SOC sequestration in the study area.
The hilly region of South China is situated in a subtropical monsoon climate zone, characterized by widespread acidic red soils with notable features including rapid organic matter decomposition, strong nutrient leaching, and low buffering capacity against disturbances [
31,
32,
33,
34]. While the warm and humid conditions favor rapid vegetation biomass accumulation, they also accelerate microbial respiration and carbon dissipation, thereby creating a complex interplay between SOC sequestration and loss. However, research on SOC in this region has predominantly focused on agricultural management practices such as fertilization, crop rotation, or no-tillage, neglecting the increasingly prevalent and impactful land-use change type, i.e., farmland abandonment [
35,
36]. In terms of research methodology, existing studies often adopt the static comparative approach of “space-for-time” substitution, which lacks dynamic coupling analyses between abandonment processes and carbon pool evolution based on high-resolution trajectory data [
37,
38,
39]. Due to the limited integration of long-time series, high-precision land-use data with measured soil carbon datasets, the precision in quantifying the carbon effects of abandonment remains insufficient, hindering the formulation of evidence-based regional land-use carbon management and ecological restoration policies.
The core innovation of this study is its breakthrough in addressing the limitations of traditional static comparative research by integrating high-resolution land-use datasets with long-term soil organic carbon datasets. This study also applies the method of land-use trajectory tracking for the refined identification of abandoned farmland in the hilly region of South China. Additionally, by incorporating key covariates such as abandonment duration and terrain complexity, it aims to address the research gap on the dynamic evolution mechanisms of carbon effects under typical acidic red-soil conditions. The main aim of this study was to assess how farmland abandonment affects surface SOC dynamics in the hilly red-soil region of South China and to identify the natural and anthropogenic factors associated with SOC redistribution and stabilization across abandonment durations. Based on this aim, three research objectives were set as follows. First, to accurately characterize the spatiotemporal distribution and spatial patterns of varying abandonment durations in the hilly region of South China by identifying farmland abandonment trajectories from the Chinese Land Cover Dataset (CLCD, 2000–2023) using trajectory-tracking techniques and integrating SOC and environmental datasets available through 2023. Second, to quantitatively assess the perturbation amplitude of farmland abandonment on surface SOC and systematically reveal the nonlinear effects of abandonment duration and initial soil carbon conditions on SOC dynamics. Finally, to investigate the key mechanisms that drive the reconfiguration of surface SOC pools through integrating vegetation recovery features and soil physicochemical property changes, thereby providing evidence for the spatially differentiated management of abandoned farmland.
2. Materials and Methods
The study area is dominated by acidic red and yellow soils developed under warm and humid subtropical conditions. These soils are generally characterized by strong leaching, relatively low buffering capacity, and active organic matter turnover, making surface SOC sensitive to changes in vegetation inputs, disturbance intensity, erosion, and soil physicochemical conditions.
2.1. Study Area Overview
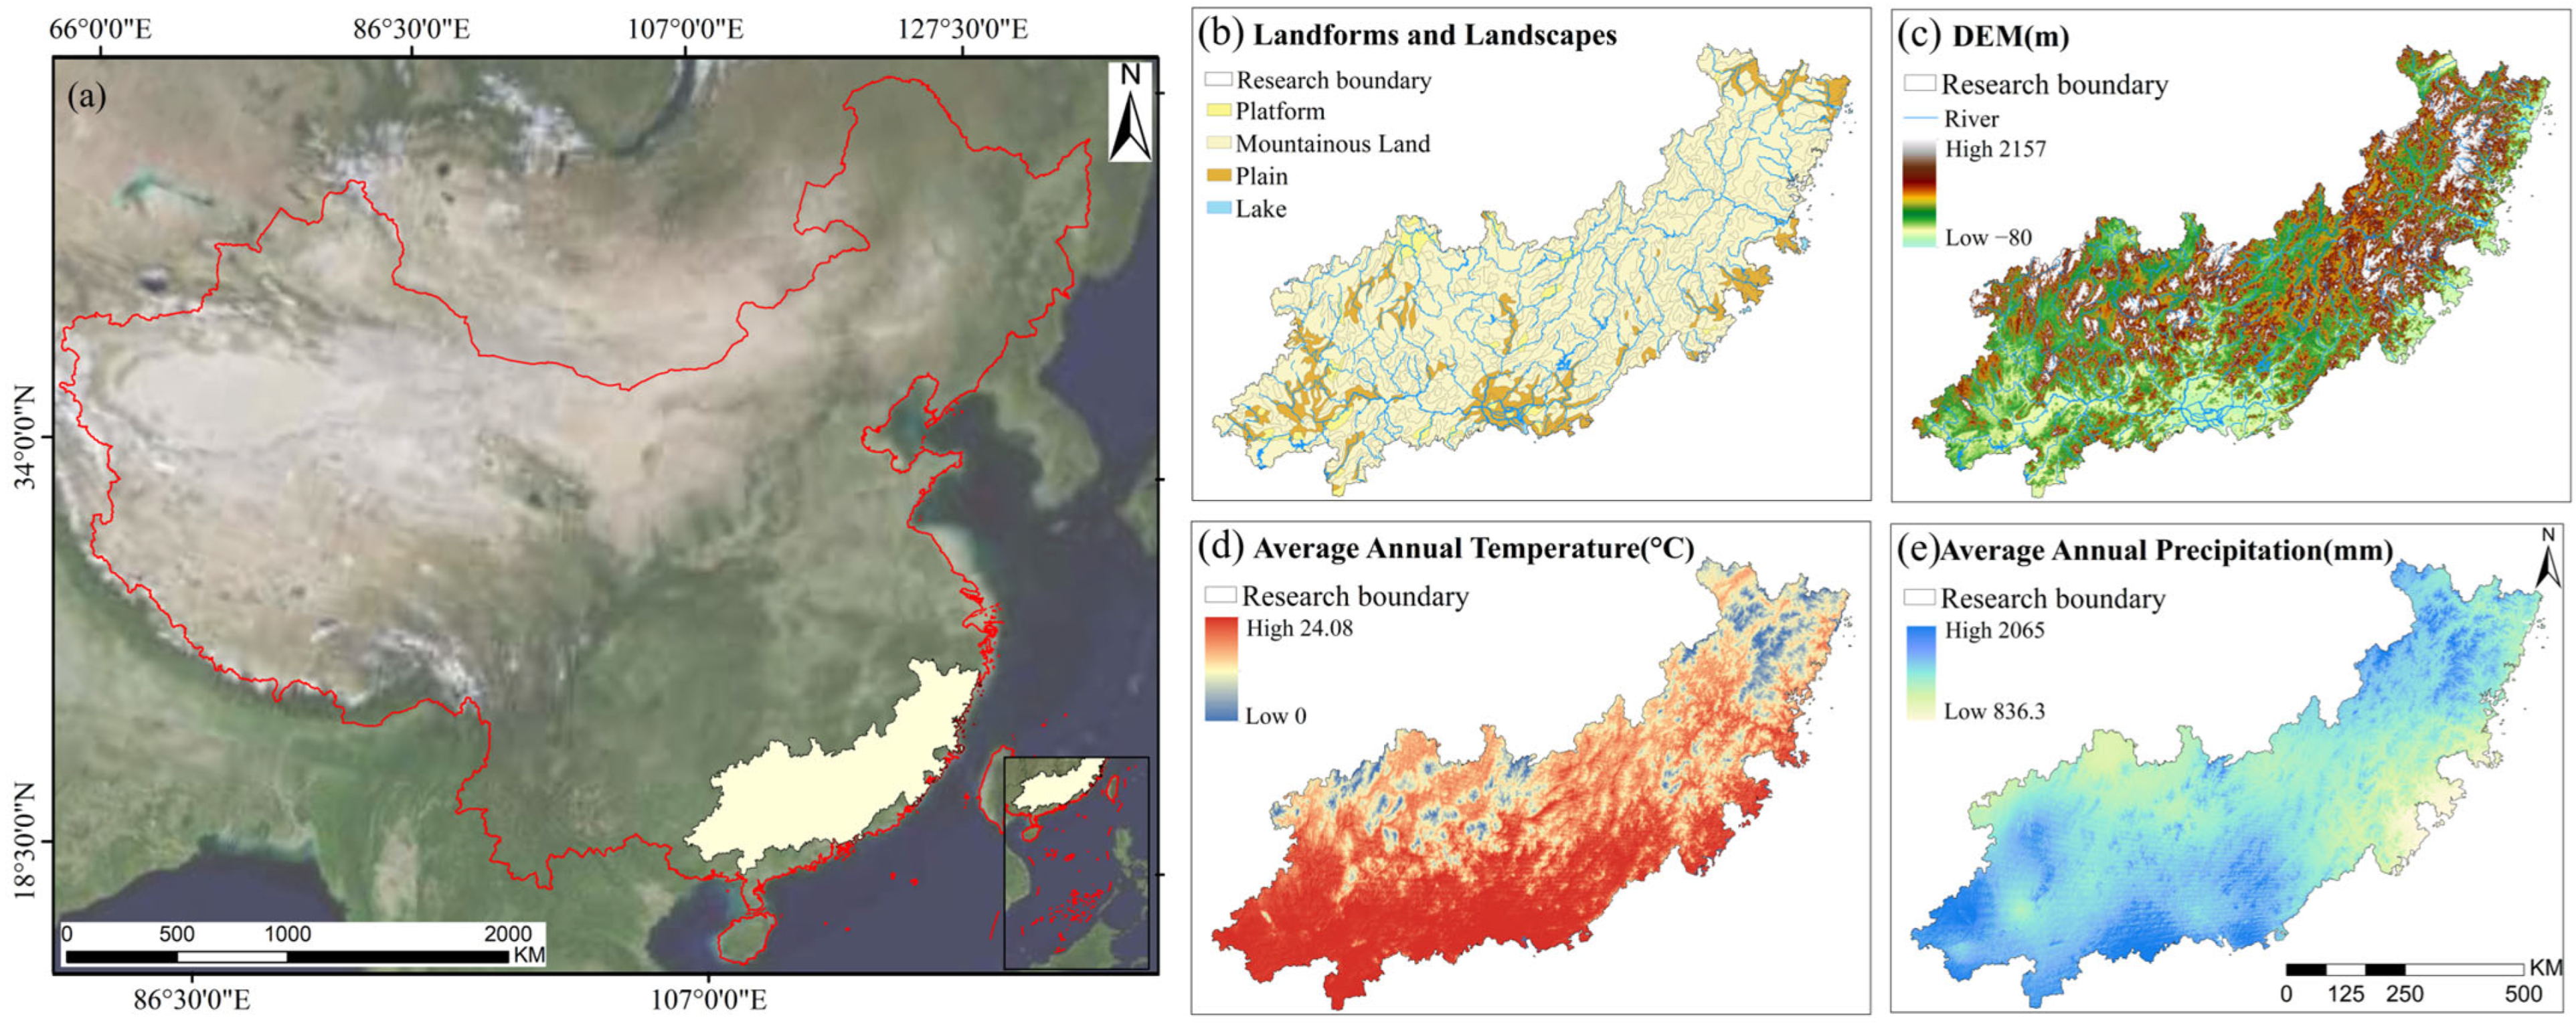
This study focuses on the hilly region of South China (18°~29° N, 104°~122° E), covering the administrative regions of Guangdong, Guangxi, Fujian, and the southern parts of Hunan and Jiangxi Provinces (
Figure 1). This area is primarily composed of low-altitude mountains and hills, with fragmented and undulating landscapes and widespread acidic red and yellow soils [
40]. Given a subtropical monsoon climate, this area experiences an annual average temperature of 0–24 °C and precipitation ranging from 800 to 2000 mm, with abundant water and heat resources yet uneven seasonal distribution. Historically, this region was a major production base for double-cropping rice, sugarcane, and tea. However, rapid urbanization, coupled with the outflow of young rural laborers, as well as the fragmented nature of hilly terrain, has led to declining agricultural comparative benefit and increasing farmland abandonment [
41,
42]. Its unique red soil land and intense land-use transitions make this region an ideal case study of the carbon effects of farmland abandonment. Analysis of the CLCD (2000–2020) revealed that the region’s land-use matrix is dominated by forest and farmland, with the two interspersed. Nevertheless, driven by rapid urbanization and “Grain for Green” policies, farmland area has shown a continuous decline over the past 20 years, with its spatial distribution becoming increasingly fragmented [
43,
44]. Furthermore, complex terrain poses significant constraints on agricultural mechanization, resulting in rising costs in agricultural production. As the gap between urban and rural labor income grows, more rural laborers transfer to secondary and tertiary industries, coupled with the persistently low comparative benefits of agriculture, which has become the primary driving force behind farmland abandonment. The interaction between the challenges of farming due to topographical constraints and the rising opportunity costs of labor has led to a prioritization of abandonment on sloped farmland and remote plots in the region, which provides a representative environmental context for investigating the evolution of abandoned farmland and its associated carbon sink effects across different topographical gradients.
2.2. Methods
2.2.1. Identification of Abandoned Farmland
This study used the 30 m annual China Land Cover Dataset (CLCD), a Landsat-derived land-cover product generated on the Google Earth Engine platform. The CLCD integrates Landsat Thematic Mapper (TM) and Enhanced Thematic Mapper Plus (ETM+) surface reflectance observations before 2013 and Landsat 8 Operational Land Imager (OLI) observations thereafter. Annual land-cover maps were generated using a random forest classifier based on spectral, phenological, topographic, and geographic features and were further refined through spatial–temporal filtering and logical consistency checks. Following and adapting the annual land-use trajectory tracking approach proposed by Song et al. [
43], abandoned farmland was identified at the pixel scale based on the annual CLCD sequence. This approach reconstructs the annual land-cover trajectory of each pixel and identifies persistent cropland-to-non-cropland transitions, thereby distinguishing sustained farmland abandonment from short-term fallow and temporary land-cover fluctuations. In the present study, the trajectory-based framework was further adapted by introducing annual dynamic farmland boundaries derived from the CLCD dataset. Although the annual CLCD dataset covered the period from 2000 to 2023, the confirmed farmland abandonment dynamics were reported for 2000–2020. The land-cover observations from 2021 to 2023 were used as a subsequent confirmation window to verify whether cropland-to-non-cropland transitions occurring in 2020 and earlier persisted for at least three consecutive years. This temporal design ensured that the identified abandonment events represented sustained land-use transitions rather than short-term fallow, temporary land-cover changes, or classification fluctuations.
The specific steps were as follows. First, pixels classified as cropland in each year were delineated as the dynamic farmland boundary and defined as the initial cultivated state for subsequent trajectory analysis. Then, farmland abandonment was determined when a pixel classified as cropland in year (t) converted to a non-cropland category in year (t + 1), including unused land or natural vegetation cover such as forest, shrubland, or grassland, and remained continuously non-cropland for at least three consecutive years without reverting to cropland during the confirmation period [
43,
44,
45]. The three-year persistence criterion was used to exclude short-term fallow, crop rotation, and temporary classification fluctuations. The first year of the continuous cropland-to-non-cropland transition was recorded as the onset year of abandonment, whereas the number of consecutive years during which the pixel remained in a non-cropland state was used to characterize abandonment duration. Accordingly, 2020 was the latest year for which an abandonment event could be fully confirmed using the available CLCD observations through 2023.
Based on the above, abandonment rate (
Pi) was used to quantify the intensity of annual farmland abandonment within a specific unit, defined as the proportion of new abandoned farmland area in a given year (
Anew,i) relative to the total farmland area of the previous year (
Sprev,i) [
46]. The formula is as follows:
where
Pi represents the farmland abandonment rate (%) of unit
i,
Anew,i denotes the newly abandoned farmland area (km
2) in year
i, and
Sprev,i is the total farmland area (km
2) in year
i − 1. The value of
Pi ranges from 0 to 100%, with a larger value indicating a higher farmland abandonment rate, while
Pi = 0 signifies intensive farmland utilization with no abandonment identified.
2.2.2. Identification of Abandoned Agricultural Lands and Assessment of Their Associated Carbon Effects
To identify abandoned agricultural lands and assess their associated carbon effects on surface SOC, this study employed an integrated approach combining land-use trajectory tracking, paired sample comparisons, and temporal gradient analyses.
(1) Paired Sample Construction
Following the principle of homogeneity equivalence, in this study, abandoned farmland samples were paired with nearby non-abandoned ones within the same topographic unit, following the consistency in slope, aspect, soil type, and initial farming practices. To ensure comparability, this study minimized confounding variables other than “abandonment” [
47], with 2.98 × 10
6 valid paired samples constructed.
(2) Quantitative Analysis of SOC Responses
SOC content data for all paired samples were extracted from the 90 m resolution raster dataset of surface
SOC provided by the National Earth System Science Data Center. In addition, the carbon effect of farmland abandonment was quantified by calculating the differences (
SOCdiff) and change rates (
SOCrate) in
SOC content between abandoned and control farmland. Meanwhile, the statistical significance of these differences was tested using paired
t-tests [
48]. The formulas for
SOC difference and change rate are as follows:
where
SOCaban and
SOCnon-aban represents the
SOC content of abandoned farmland and of control farmland respectively,
SOCdiff represents the difference in
SOC content between abandoned and control farmland, and
SOCrate denotes the change rate of
SOC content.
(3) Temporal Gradient Analysis
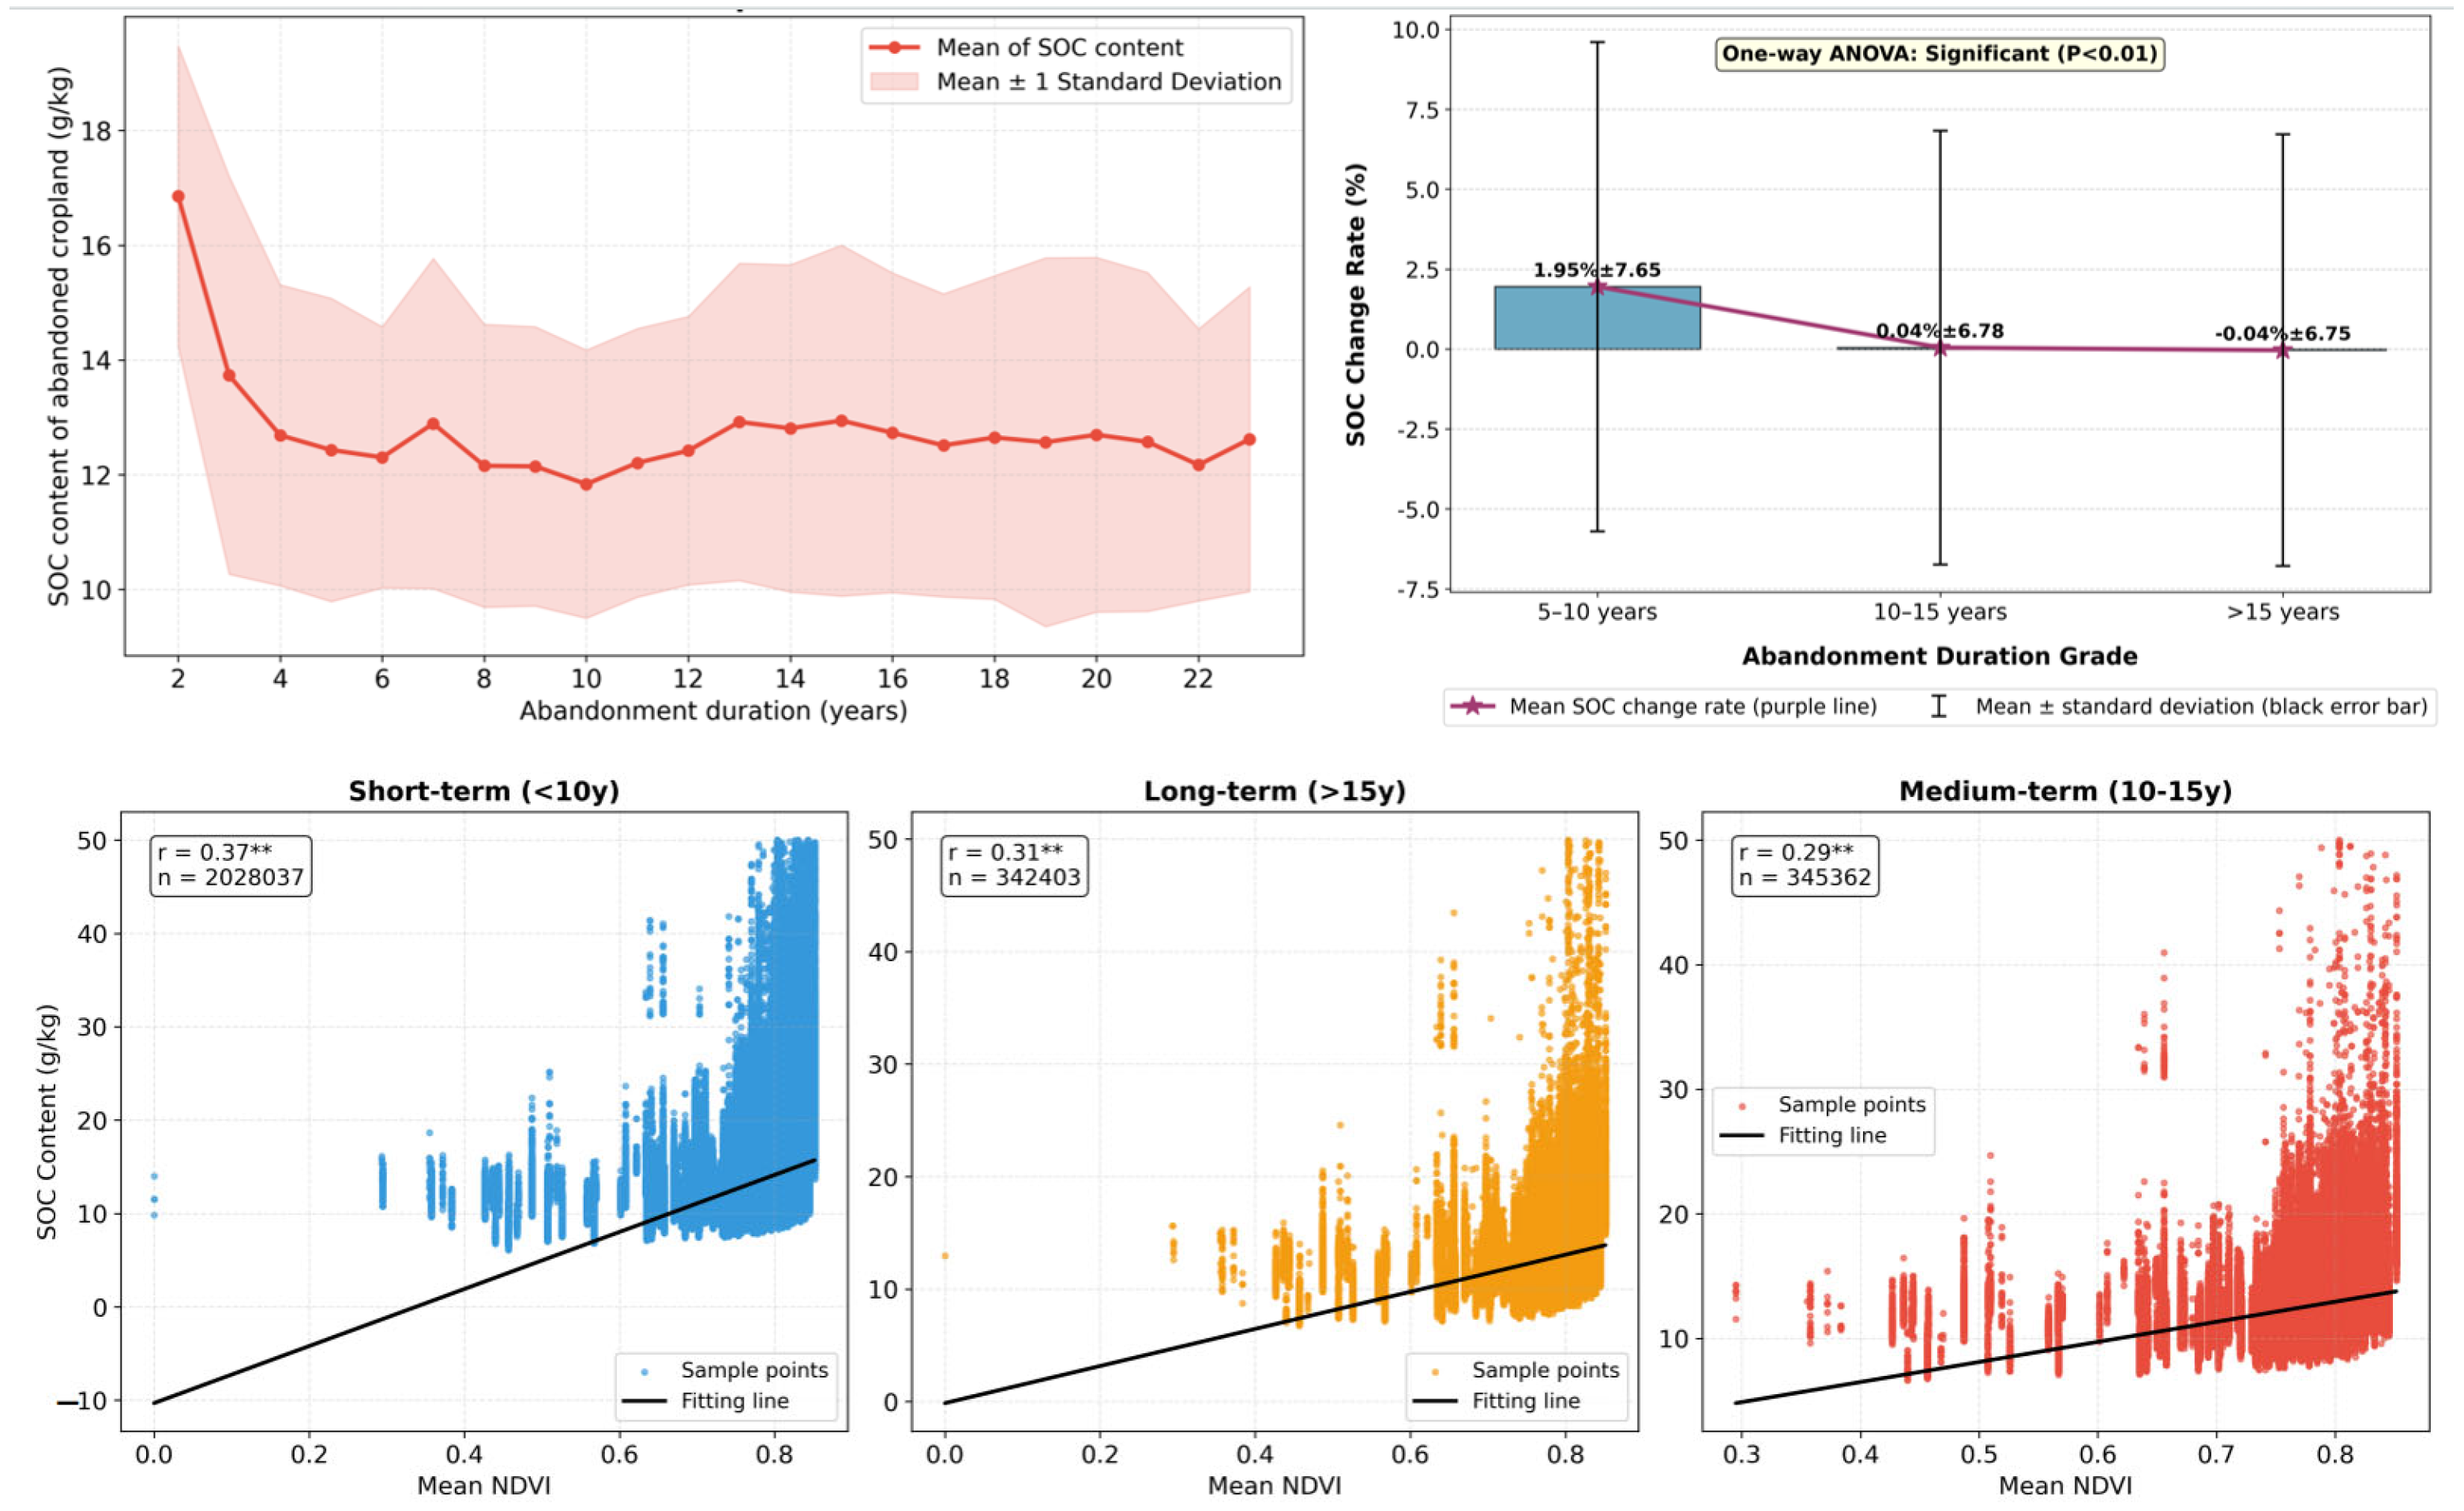
According to the duration of abandonment, all samples were categorized into four gradient groups: 0–5 years, 5–10 years, 10–15 years, and over 15 years. Mean, standard deviation, and change rates of surface SOC content were calculated for each gradient group to analyze the temporal evolution pattern of carbon effects. Based on the statistics, one-way ANOVA was combined to test the significance of SOC differences across the gradient groups, revealing the temporal features of the carbon effects of farmland abandonment.
A 5-year interval was adopted rather than the 4-year criterion commonly used in socio-economic assessments of farmland abandonment [
49]. In the subtropical hilly region of South China, the first five years after abandonment represent a critical ecological transition phase in which vegetation communities shift from ruderal herbaceous species to early-successional shrubs and tree regeneration, accompanied by substantial changes in litter quality and root biomass allocation. This 5-year window thus aligns with a major vegetation succession boundary that directly influences the soil carbon input pathways. Furthermore, preliminary examination of the abandonment duration distribution in our dataset indicated that a 5-year grouping yielded a balanced sample size across all four gradient groups, ensuring the robustness of subsequent one-way ANOVA and gradient analyses.
2.2.3. Semivariance Analysis
In this study, a combination of the coefficient of variation (CV) and semivariance function was adopted to analyze the spatial variation features of SOC content in abandoned farmland, identifying the types of variation and the dominant factors.
The
CV was used to quantitatively represent the overall spatial dispersion of
SOC content [
50], calculated as:
where
S is defined as the standard deviation of SOC content and represents the arithmetic mean of
SOC content, with a higher
CV value indicating higher spatial dispersion.
The semivariance function, as a core geostatistical metric, was used to reveal the structural and random features of
SOC spatial variation, calculated as:
where
γ(
h) is defined as the semivariance function value,
h represents the spatial distance between sample points,
N(
h) represents the number of sample pairs separated by
h, and
Z(
xi) and
Z(
xi +
h) serve as the
SOC content at points xi and xi + h, respectively. According to the results, key parameters such as nugget value (
C0), sill value (
C0 +
C), and nugget-to-sill ratio (
C0/(
C0 +
C)) were derived, with nugget-to-sill ratios of ≤0.25, 0.25–0.75, and ≥0.75 indicating dominant structural variation, mixed variation, and dominant random variation, respectively.
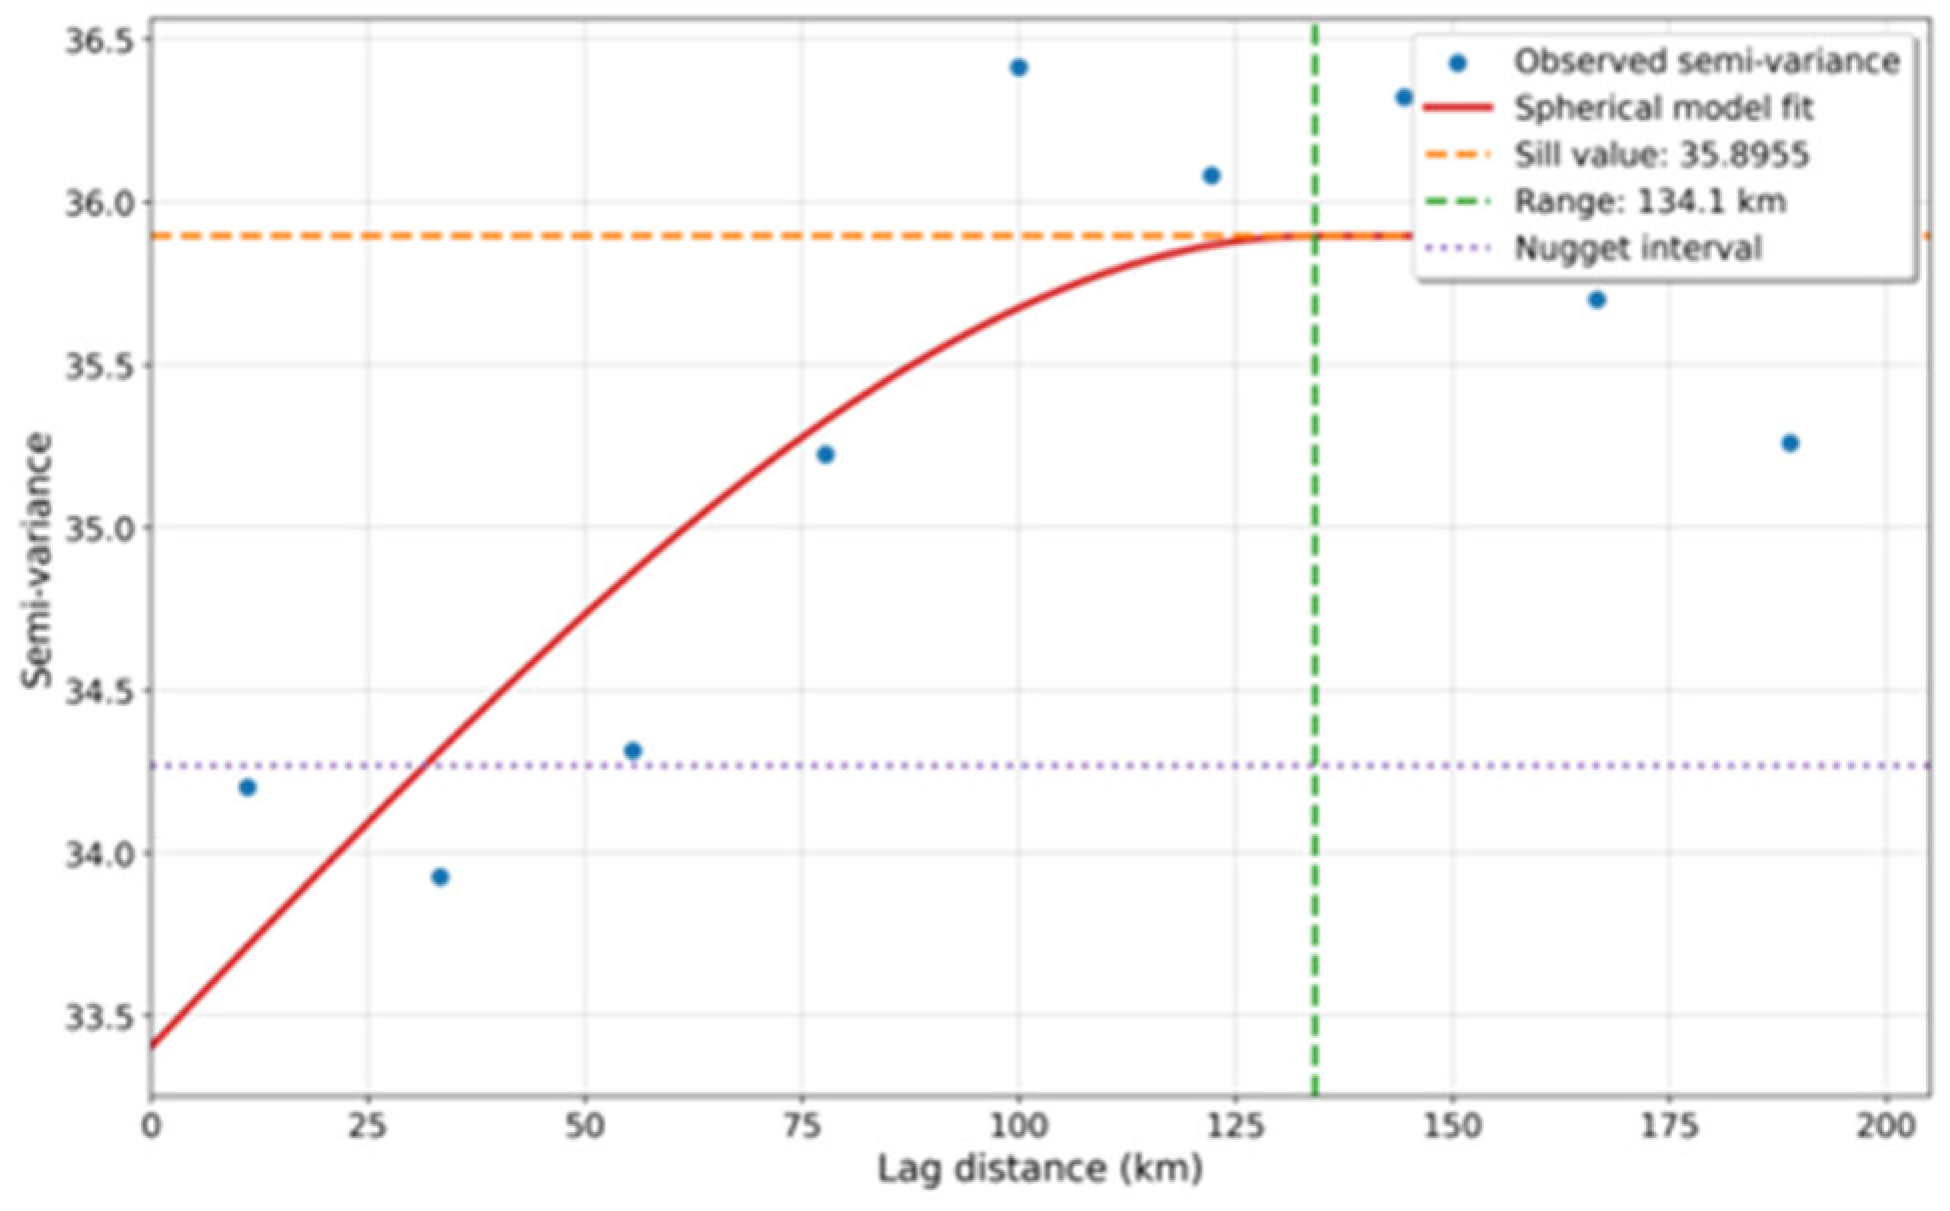
In practice, the experimental semivariogram was calculated using the isotropic approach, as no significant directional anisotropy was detected in the preliminary exploratory analysis of the SOC change rate data. The lag distance was set to 10 km, with a lag tolerance of 5 km, and the maximum lag distance was limited to 150 km to ensure stable estimation. The experimental semivariogram was fitted using weighted least squares (WLS) to three theoretical models, namely the spherical, exponential, and Gaussian models. The optimal model was selected based on the highest coefficient of determination (R2) and the lowest residual sum of squares (RSS), combined with visual inspection of the fitting curves.
2.2.4. Geodetector Model
The Geodetector model was employed to quantify the explanatory ability of various factors influencing the spatial heterogeneity of carbon effects, identify dominant factors, and analyze the interaction between factors [
51]. The model calculates the
q-value to represent the explanatory ability of a factor, as follows:
where
q represents the explanatory ability of a factor (0–1), with larger values indicating stronger explanatory ability,
L is the number of factor levels,
Nh is the sample size in level
h, and
σh2 is the variance of
SOC within level
h, with
N as the total sample size and
σ2 as the variance of
SOC for the entire dataset.
In this study, factors such as abandonment duration, initial SOC content, slope, aspect, and normalized difference vegetation index (NDVI) were selected as variables. Additionally, significant factors (
p < 0.05) were identified via F-tests. Meanwhile, interaction effects between factors were evaluated by calculating combined
q-values [
52,
53].
2.2.5. Geographically Weighted Regression (GWR)
After the identification of significant factors by the Geodetector model, a GWR model was constructed to reveal the intensity and spatial differentiation of each factor’s influence on carbon effects to address the limitations of traditional global regression models in reflecting local spatial variations [
54], as follows:
where (
ui,
vi) is the geographic coordinates of sample
i,
yi is defined as the carbon effect value (i.e., SOC change rate) for sample i,
β0(
ui,
vi) is the intercept at location (
ui,
vi),
p is the number of influencing factors,
βk(
ui,
vi) represents the local regression coefficient for factor k at location (
ui,
vi),
xik is the value of factor k for sample
i, and
ϵi denotes the random error term, assumed to follow a normal distribution.
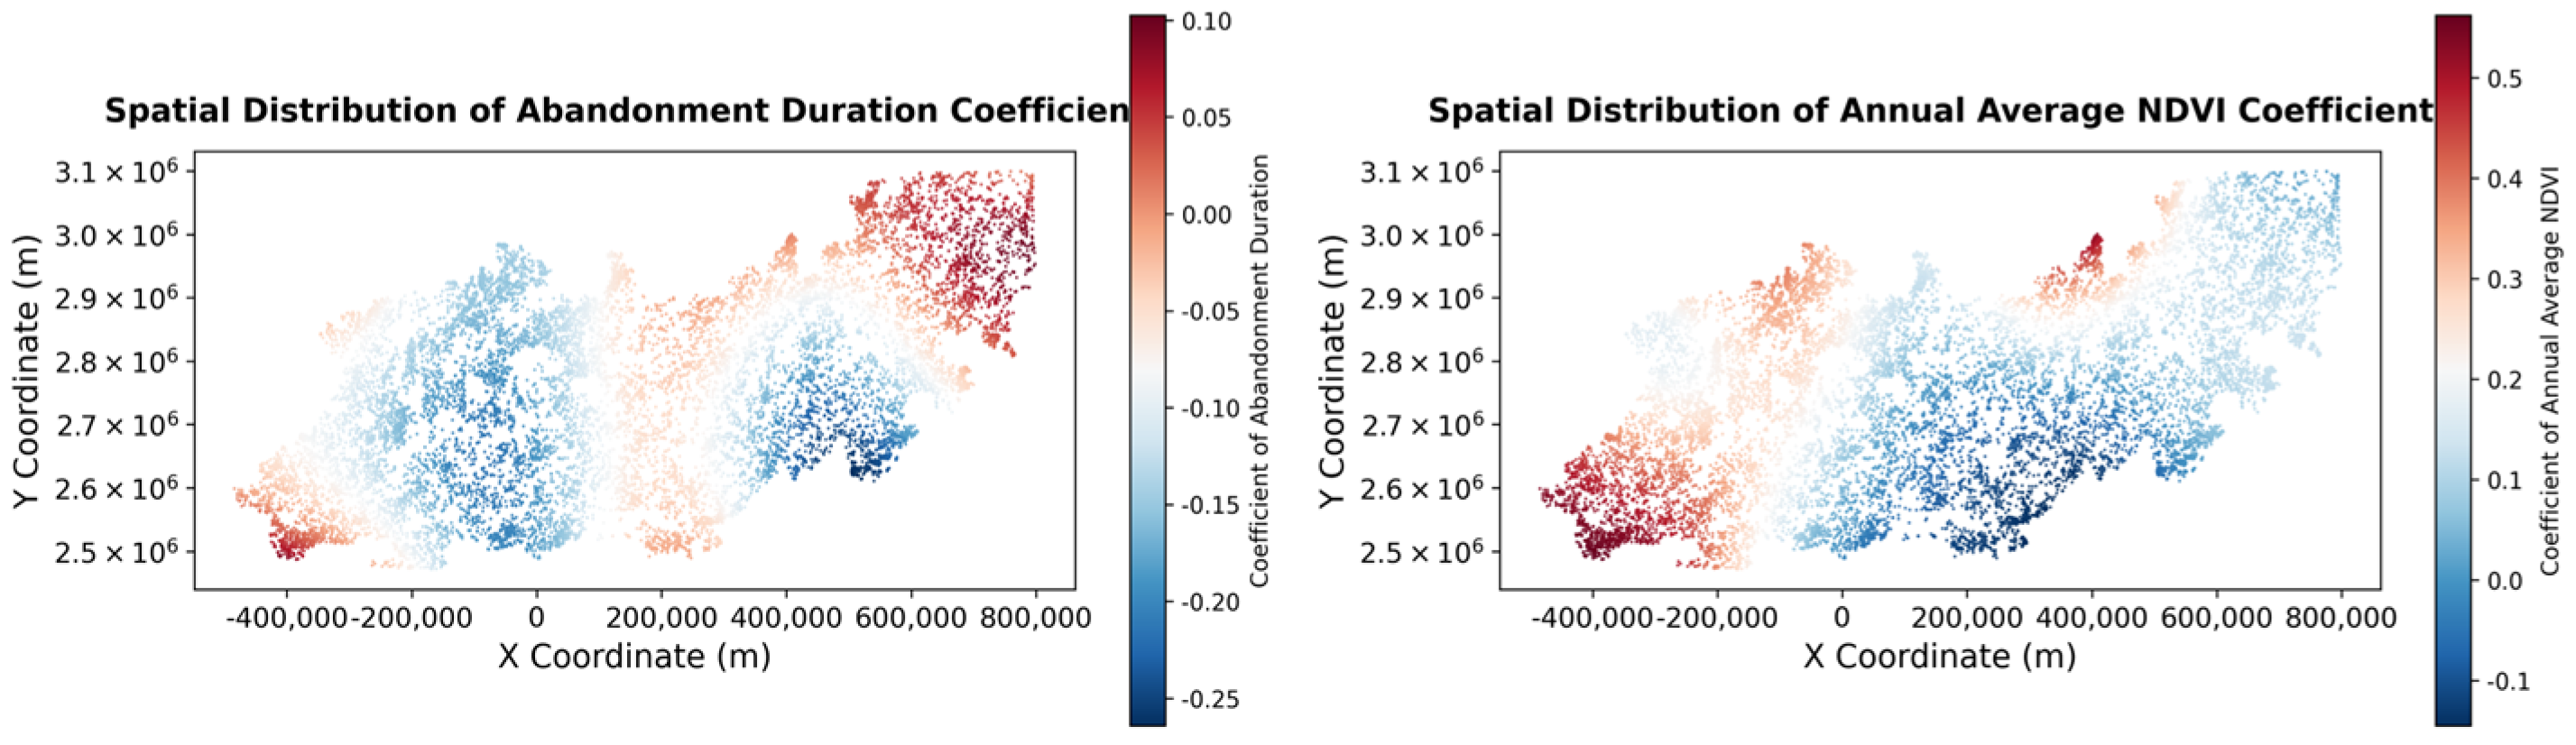
This model adopts a Gaussian kernel function as the spatial weight function, with the optimal bandwidth determined by the corrected Akaike information criterion (AICc), so as to evaluate the model’s fit by adjusted R2 and residual sum of squares. Then, spatial distribution maps of local regression coefficients for the factors were generated to identify dominant factors across regions.
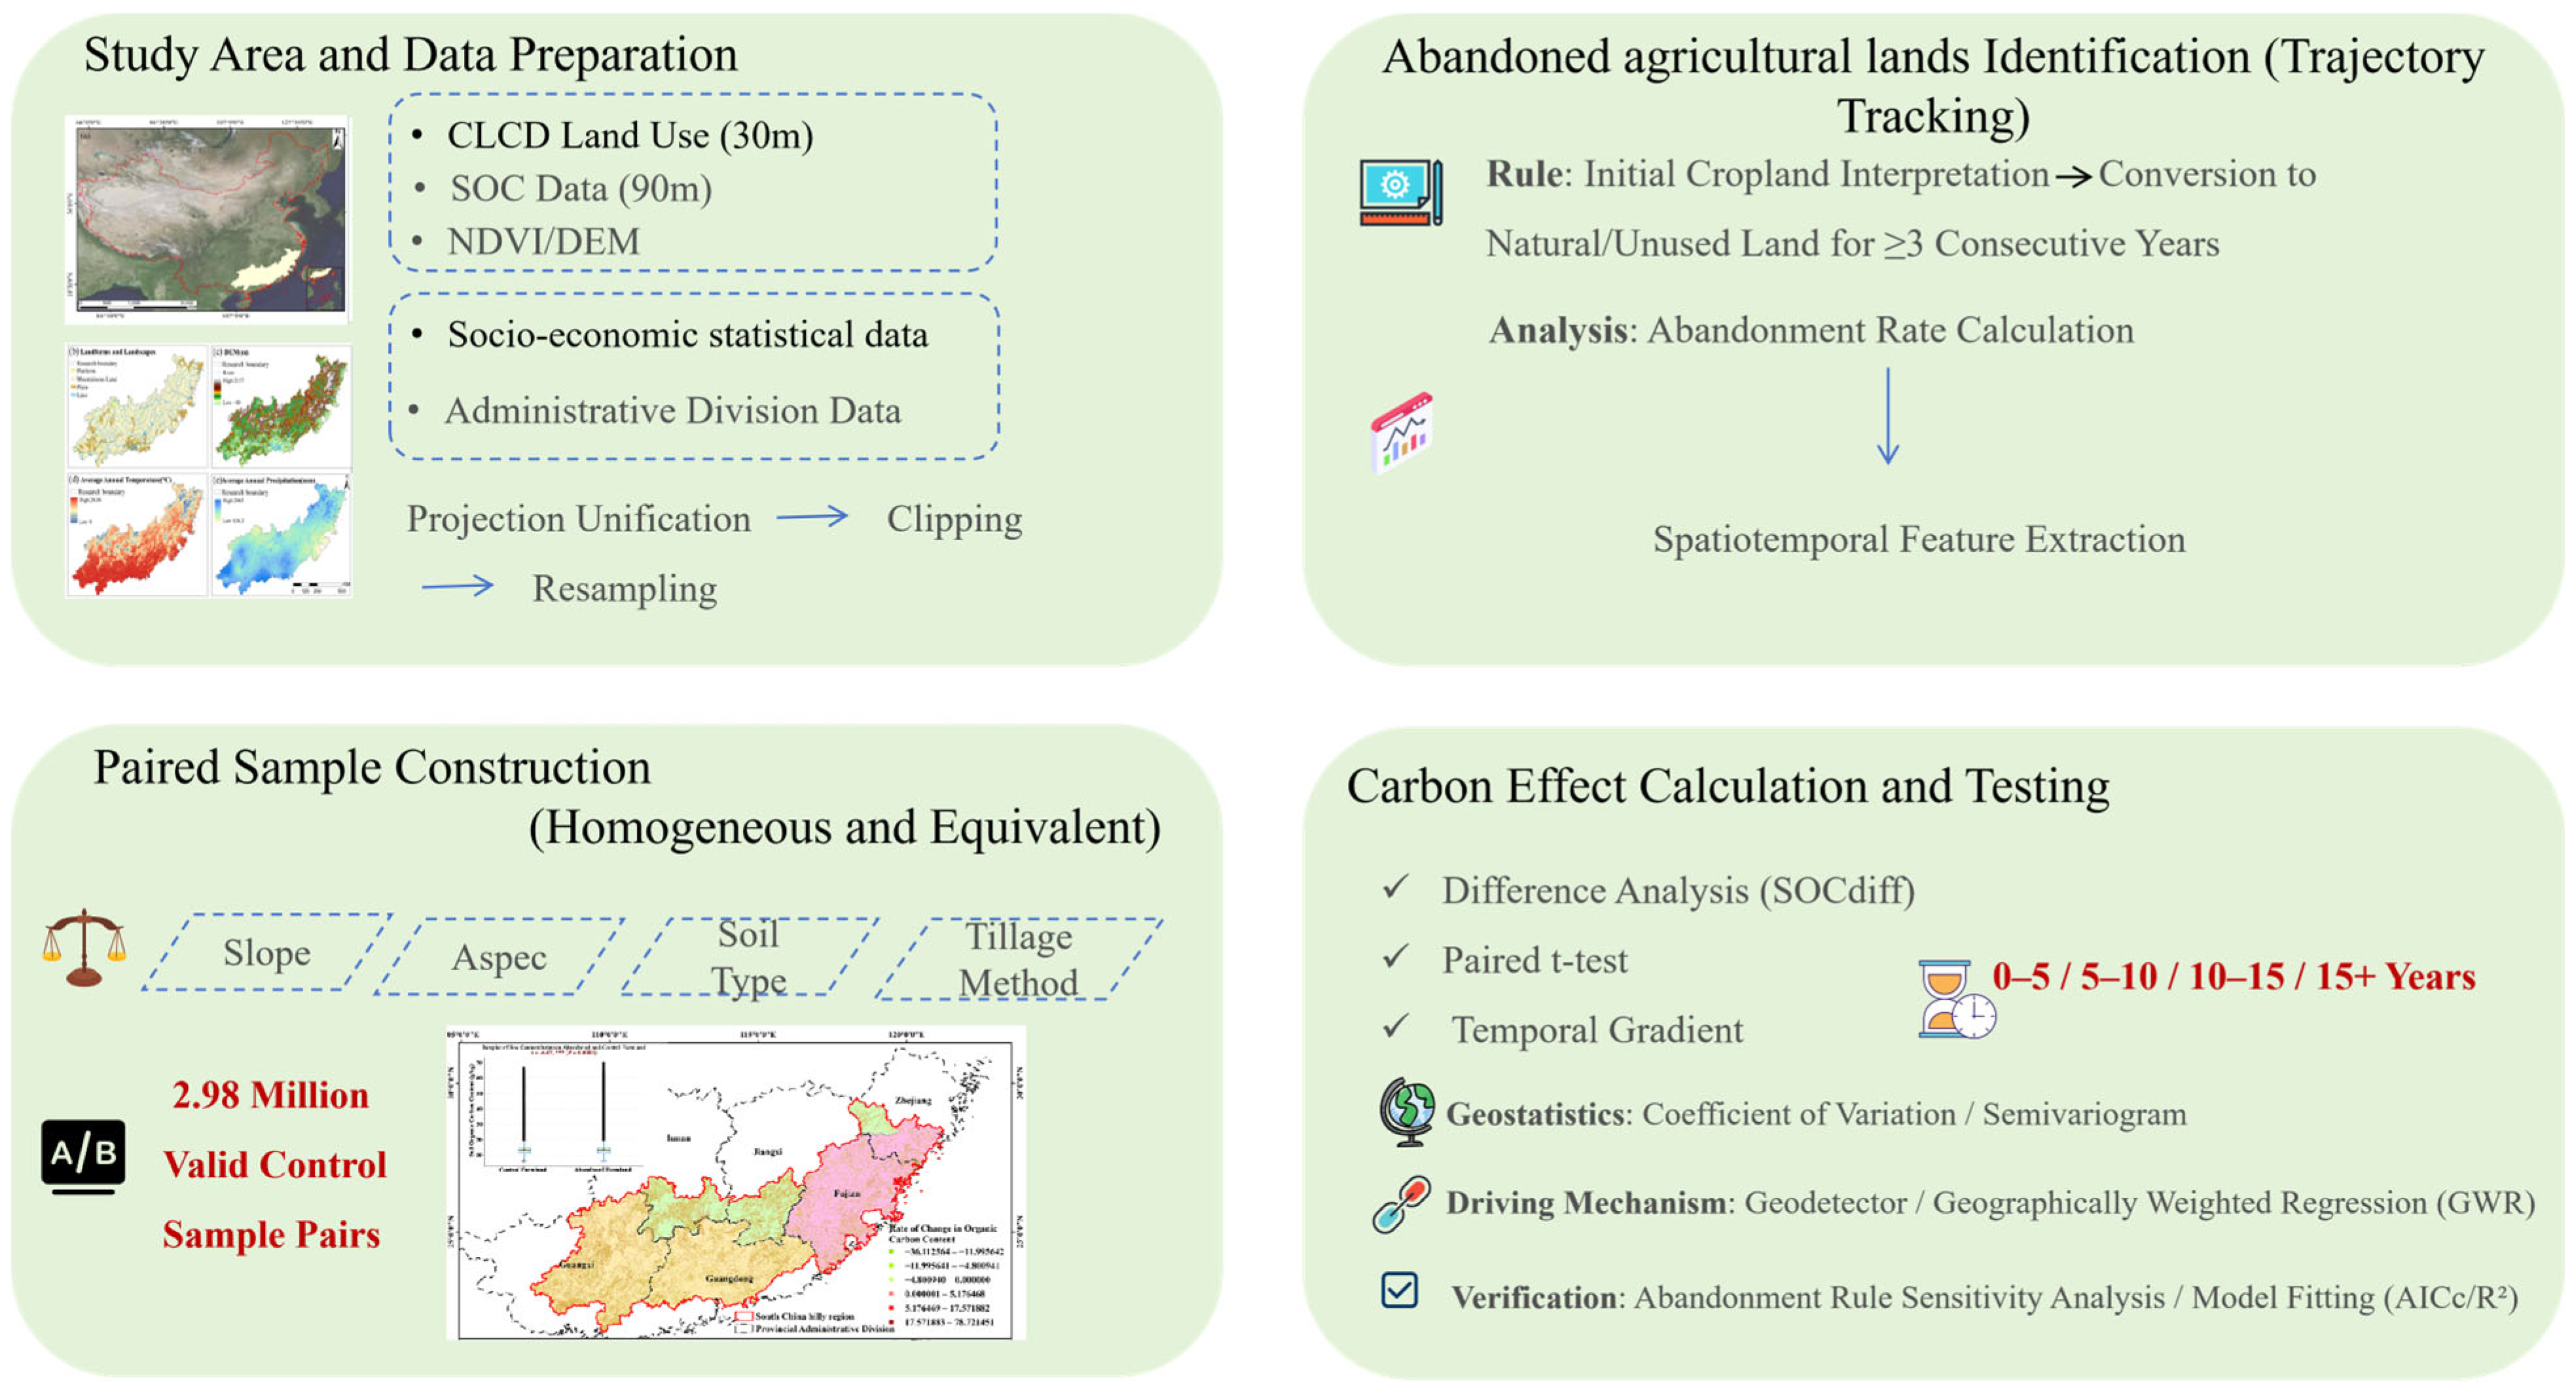
The research roadmap is presented in
Figure 2 as follows:
2.3. Data Sources and Preprocessing
This study utilized multiple datasets, including land-use data, surface soil organic carbon (SOC) data, normalized difference vegetation index (NDVI) data, digital elevation model (DEM) data, and socioeconomic statistical data obtained from various sources (
Table 1).
The land-use data were derived from the annual 30 m China Land Cover Dataset (CLCD) developed by Wuhan University, covering the period from 2000 to 2023. The dataset was generated using Landsat TM, ETM+, and OLI surface reflectance imagery on the Google Earth Engine platform through random forest classification combined with spatial–temporal consistency correction. Based on 5463 visually interpreted validation samples, the CLCD achieved an overall classification accuracy of 79.31%. The annual land-cover layers were clipped to the study area and standardized in terms of spatial projection, spatial resolution, pixel alignment, and land-cover coding before analysis. These annual land-cover data were further used to reconstruct farmland-use trajectories and identify abandoned farmland through trajectory-tracking analysis.
Surface SOC data were obtained from the National Earth System Science Data Center, with a spatial resolution of 90 m. Considering the resolution difference between the SOC and land-use datasets, all analyses were conducted at the matched spatial scale following spatial alignment and resampling procedures to ensure consistency among datasets. The SOC dataset was primarily used to quantify the carbon effects associated with farmland abandonment and to analyze their spatial heterogeneity.
NDVI data were acquired from the Google Earth Engine platform using annual Landsat 5, Landsat 7, Landsat 8, and Landsat 9 observations. Cloud and shadow contamination were removed through quality-control procedures, and annual NDVI composites were generated using all valid observations available within each year. DEM data were obtained from the Geospatial Data Cloud Platform (ASTER GDEM Version 2) with a spatial resolution of 30 m and were used to derive topographic variables such as elevation and slope.
In addition, socioeconomic statistical data were collected from official statistical yearbooks and governmental statistical departments. These data mainly included population and economic indicators aggregated at administrative-unit levels and were used to characterize the socioeconomic background and support the interpretation of farmland abandonment patterns and associated carbon effects.
It is important to clarify the temporal logic underlying the integration of the SOC and land-use datasets used in this study. The SOC raster data (CSDLv2) represent a static spatial soil property map rather than a time-series observational dataset. As documented in the dataset’s description paper [
55], CSDLv2 was constructed using 11,209 multi-source legacy soil profiles—including the Second National Soil Survey of China (1970s–1980s) and more recent surveys from the 2010s—to produce high-resolution (90 m) spatial predictions of soil properties across China. The time label “2010–2018” in the data source documentation refers to the period during which the more recent source soil profiles were collected, not to a temporal sequence of SOC measurements.
In our analytical framework, this SOC dataset serves as a static background layer for spatial paired comparisons between abandoned farmland and adjacent non-abandoned control farmland. For each paired sample, SOC values for both the abandoned and control pixels are extracted from the same static raster layer. Because both members of each pair are derived from the identical spatial layer at the same point in time, the calculated difference (SOC_diff = SOC_abandoned − SOC_control) is not contingent upon the absolute timing of the SOC measurement. This “space-for-time” substitution approach—comparing neighboring plots that share similar topographic and soil-forming conditions but differ in land-use status—is a standard and widely accepted strategy in regional-scale studies of land-use effects on soil properties when long-term in situ monitoring data are unavailable. The land-use trajectory tracking (based on CLCD 2000–2023) provides the temporal dimension of our analysis by identifying the timing and duration of abandonment events, while the SOC data provide the spatial soil property dimension for cross-sectional comparison between land-use states.
4. Discussion
4.1. Spatiotemporal Features of Farmland Abandonment in the Hilly Region of South China and Its Regional Response Mechanisms
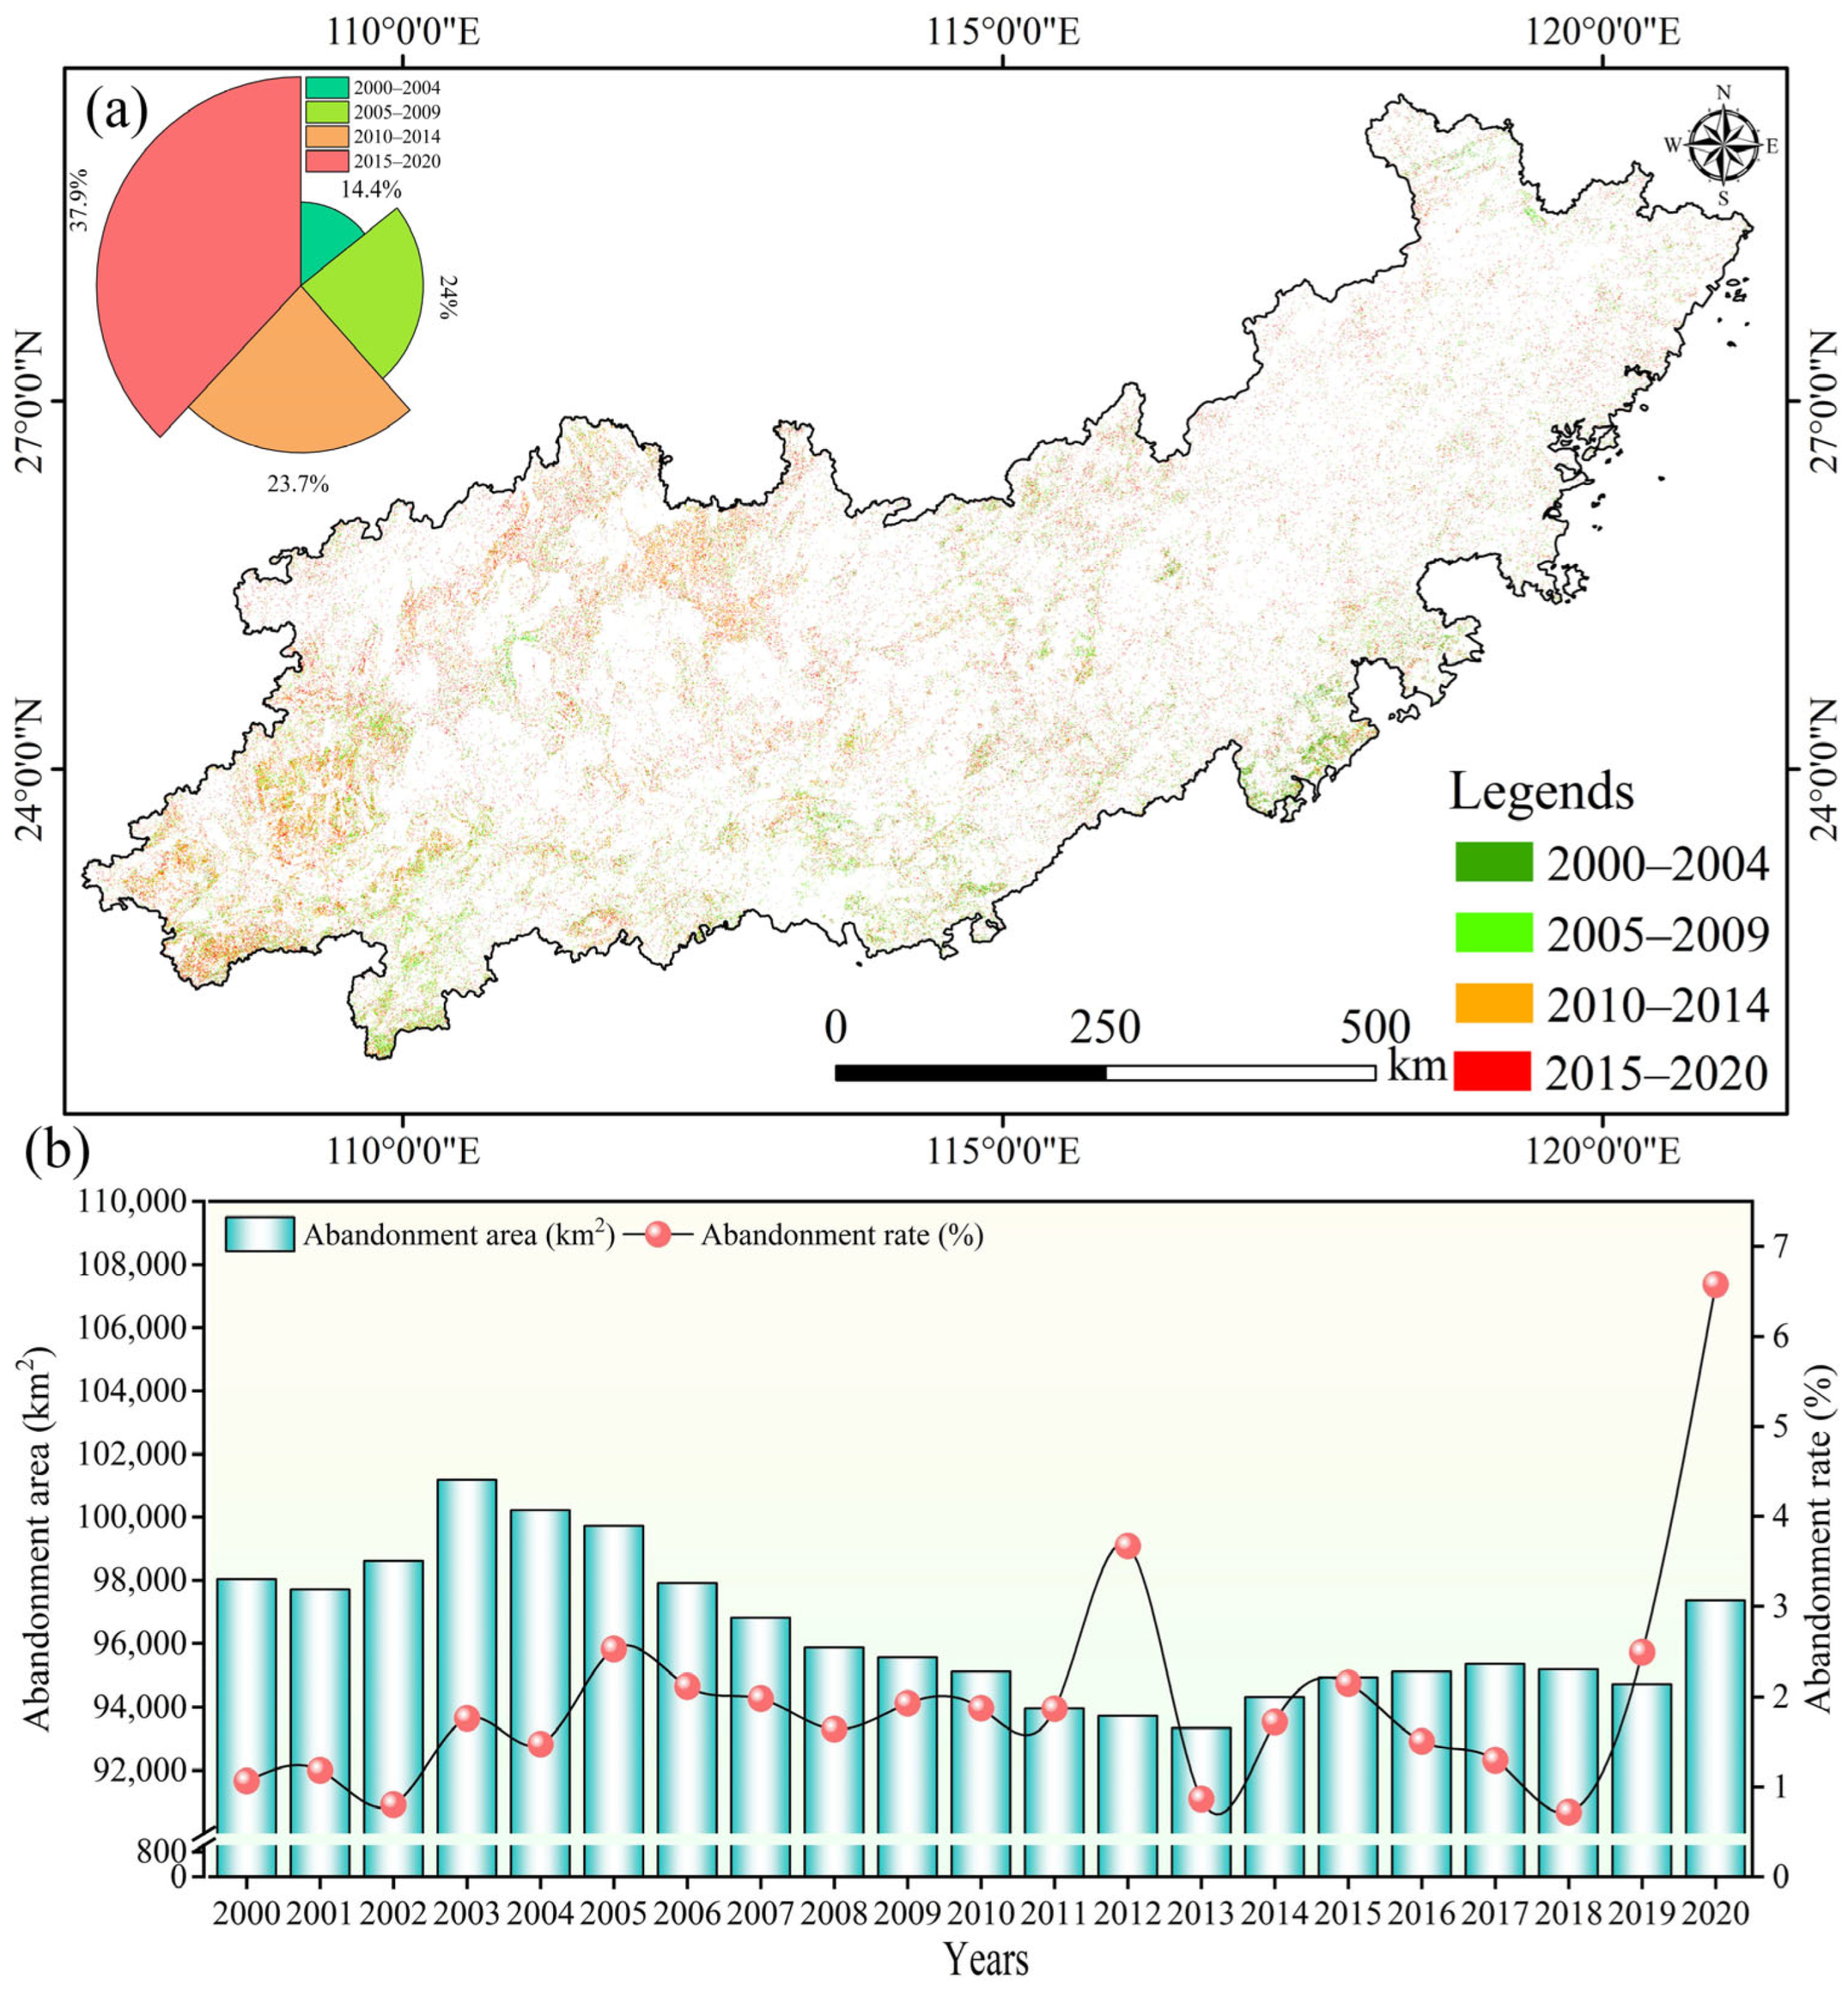
The spatiotemporal dynamics of farmland abandonment in the hilly region of South China exhibit significant regional differences compared to the northern Loess Plateau and the southwestern Karst regions of China, and these differences result from the combined effects of natural environmental conditions and socioeconomic driving factors. This study found that the overall abandonment rate in the study area from 2000 to 2020 ranged from 0.7% to 6.6%, with 37.91% of the cumulative abandonment events occurring between 2015 and 2020. Additionally, the abandonment rate in this region was lower than that of the southwestern Karst region (25–30%) but higher than that of the northern Loess Plateau (10–15%). This can be explained by the fact that in the southwestern Karst region, severe rocky desertification, low soil fertility, and poor farmland quality create a weak agricultural foundation, leading to greater abandonment. In contrast, although the northern Loess Plateau features undulating terrain, its farmland is more contiguous, making mechanization easier to adopt, and its agricultural production is dominated by rainfed crops with low input costs, resulting in a relatively low abandonment rate. As for the hilly region of South China, this region benefits from abundant water and heat resources yet is constrained by fragmented terrain and farmland, so its abandonment rate for farmland plots smaller than 0.05 ha exceeds 40%, placing its abandonment level between that of the northern and southern hilly regions of China [
56,
57,
58]. From a driving mechanism perspective, urbanization-induced outmigration of young and middle-aged rural laborers is the primary cause of farmland abandonment [
59,
60], with a 0.72 correlation coefficient between rural labor transfer rates and abandonment rates in the study area. Rising opportunity costs for labor have led to a continuous decline in the comparative benefit of agriculture, with grain farming generating only one-fifth of the income from off-farm employment, making it a direct economic driving factor of abandonment. Additionally, the challenges of mechanized farming in hilly mountainous areas and the high cost of agricultural production further exacerbate the abandonment. However, farmland protection policies and agricultural subsidies have helped curb uncontrolled increases in abandonment rates.
The land-use trajectory tracking method used in this study, based on 30 m-resolution CLCD, offers significant technical advantages in identifying abandoned farmland. Compared to traditional single-time remote sensing classification or field survey methods, this approach reconstructs temporal sequences of land plots to precisely capture the start time, duration, and spatial distribution of farmland abandonment, achieving an identification accuracy of 92%. This approach effectively addresses limitations in previous studies, such as vague definitions of abandonment and inaccurate spatiotemporal information extraction, providing a robust data foundation for subsequent analyses of the coupling relationship between abandonment duration and soil carbon effects. However, this method still has limitations. The resolution constraint of remote sensing data hinders the identification of small abandoned areas less than 30 m in size, potentially leading to a slight underestimation of the abandonment area. In addition, this method can only identify natural vegetation as the post-abandonment land cover type and fails to distinguish between herbaceous, shrub, tree, and other vegetation types, which differ significantly in carbon input efficiency, creating errors in the refined analysis of carbon effects. Furthermore, sensitivity analysis of the abandonment definition rules showed that adjusting the continuous abandonment duration threshold from 3 years to 2 or 4 years resulted in only a 5–8% change in abandonment area, indicating that the study’s definition of abandonment—“land converted to natural vegetation or unused land for ≥3 consecutive years without re-cultivation”—is stable and reliable, which also provides a valuable reference for future studies.
4.2. Impact Patterns of Farmland Abandonment on SOC Content and Analysis of Underlying Mechanisms
Before examining the underlying mechanisms, it is essential to reconcile the apparent contradiction between the statistically significant
t–test (
p < 0.001) and the near-zero negative mean difference (−0.020 g/kg). This paradox arises primarily from the exceptionally large sample size (n = 2.98 × 10
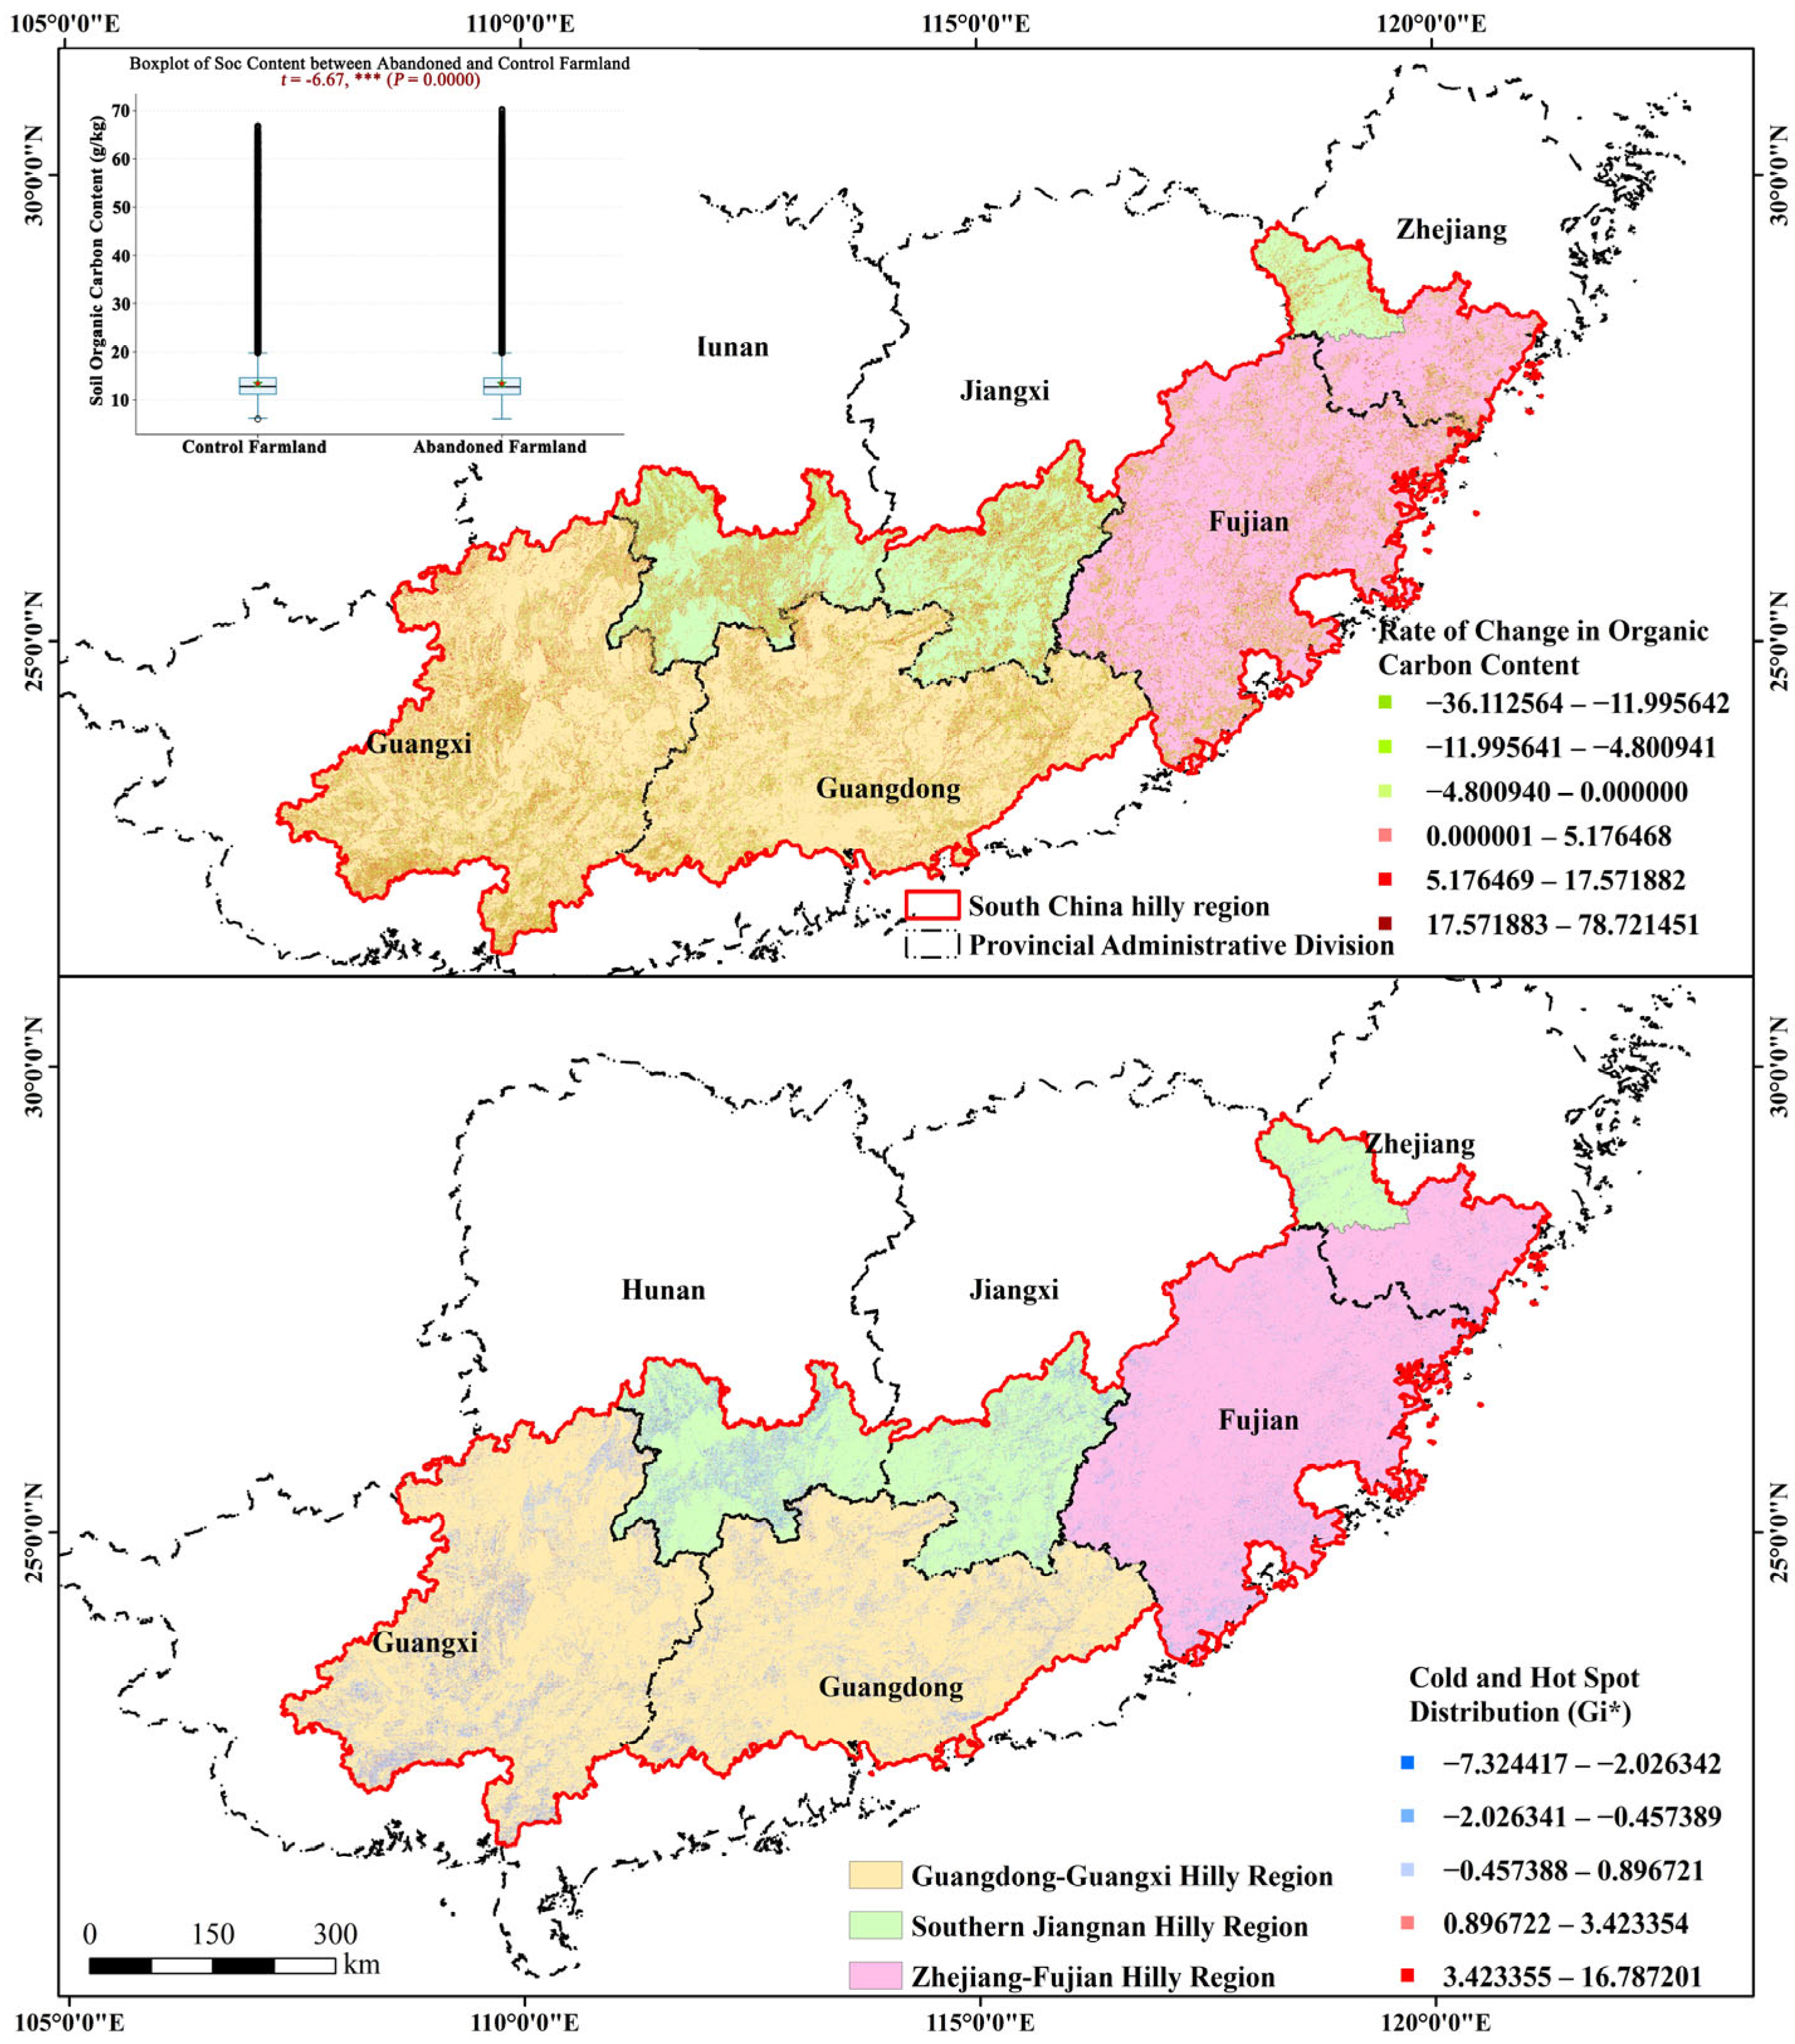
6), which inflates statistical power to the extent that even ecologically negligible differences become statistically significant. More importantly, the nearly equal proportions of positively (43.76%) and negatively (46.59%) responding samples, together with the high standard deviation (0.982 g/kg), indicate that the regional mean is a poor summary statistic for the underlying ecological processes. Rather than indicating a consistent regional carbon sink, these statistics reveal a strong spatial compensation phenomenon: local SOC gains and losses systematically offset each other across the study area. Consequently, the core scientific question shifts from ‘whether abandonment increases SOC at the regional scale’ to ‘what determines whether a specific plot gains or loses carbon’. This spatial compensation is further corroborated by the geostatistical results (
Section 3.4.1), which show that the spatial variation in SOC change rates is predominantly structural, implying that the opposing local responses are governed by spatially organized environmental factors rather than random noise.
Based on the study results, the effects of farmland abandonment on SOC cannot be interpreted as a simple carbon accumulation process. Instead, abandonment initiates divergent carbon trajectories, generating both SOC gains and SOC losses across space and ultimately producing the observed spatial compensation pattern. Therefore, two contrasting ecological mechanisms can be identified.
The first mechanism corresponds to areas exhibiting positive SOC responses, where farmland abandonment promotes carbon accumulation through a “cessation of disturbance–vegetation recovery–carbon input enhancement” pathway. After farmland abandonment, human agricultural disturbances such as plowing, fertilization, and tillage cease. This alters the disturbed state of the soil [
61,
62], reduces soil aggregate destruction caused by tillage, and decreases the exposure of protected organic carbon to oxygen, thereby reducing SOC mineralization and carbon loss. Simultaneously, abandonment triggers natural vegetation recovery and significantly increases the NDVI. Through litter decomposition, root turnover, and belowground carbon allocation, recovering vegetation continuously supplies organic matter to the soil carbon pool. During the early stages of abandonment, vegetation generally shifts from cultivated crops to herbaceous communities, resulting in rapid biomass accumulation and substantial carbon inputs. As succession proceeds, vegetation gradually develops toward shrub- and tree-dominated communities, producing more stable organic matter inputs and facilitating long-term SOC stabilization. Under the combined effects of increased carbon inputs and reduced carbon loss, SOC accumulation becomes more likely in environmentally favorable locations.
The second mechanism corresponds to areas exhibiting negative SOC responses, where farmland abandonment does not necessarily enhance SOC and may even lead to net carbon losses. In some locations, rapid vegetation recovery may stimulate microbial activity and accelerate the decomposition of pre-existing soil organic matter through a priming effect, partially offsetting newly added carbon inputs. Topographic conditions may further amplify SOC losses. High-slope areas experience stronger runoff and soil erosion, promoting the physical export of organic carbon from surface soils and weakening the carbon accumulation effects. In addition, the acidic red soils that dominate the hilly region of South China are characterized by strong nutrient leaching and relatively low buffering capacity [
31,
32,
33,
34], which may limit the stabilization efficiency of newly accumulated organic matter. Under warm and humid subtropical climatic conditions, enhanced microbial respiration can further accelerate SOC turnover and carbon release. Consequently, despite vegetation recovery, some abandoned plots may exhibit declining SOC content.
The balance between these opposing pathways is further regulated by abandonment duration, topography, climate conditions, and initial SOC status. Abandonment duration determines vegetation succession and carbon-input dynamics. During the early stages of abandonment, vegetation recovery is rapid and carbon accumulation tends to be more pronounced, whereas carbon accumulation gradually stabilizes as vegetation communities mature. Topography regulates the magnitude of carbon effects by influencing erosion intensity and soil moisture conditions. Initial SOC content influences the upper limit of carbon increases through the carbon saturation effect, whereby soils with high initial SOC content have limited potential for further accumulation, whereas carbon-deficient red soils often possess greater sequestration potential. Therefore, whether farmland abandonment functions as a carbon sink or a carbon source depends on the combined effects of vegetation succession, soil properties, climatic conditions, and topographic settings rather than abandonment itself.
4.3. Limitations and Future Perspectives
This study provides new insights into the spatially heterogeneous carbon effects of farmland abandonment in the hilly region of South China. Nevertheless, several limitations related to data availability, methodological design, and process interpretation should be acknowledged.
First, limitations remain in the datasets used. The SOC data were derived from secondary raster products, resulting in a spatial resolution mismatch between the 90 m SOC dataset and the 30 m land-use dataset. Although the large sample size enabled robust regional-scale analysis, the relatively coarse resolution of SOC data may have constrained the detection of fine-scale carbon responses associated with farmland abandonment. In addition, the absence of long-term field observations and measured SOC datasets limited the validation of remote-sensing-based assessments and restricted the characterization of long-term carbon dynamics.
Second, methodological uncertainties remain. Although the paired-sample comparison approach minimized major environmental differences between abandoned and non-abandoned farmland, some unobserved heterogeneity associated with microtopography, microclimate, and historical management practices may still exist. Furthermore, farmland abandonment was treated primarily as a land-use transition process, whereas differences in post-abandonment vegetation succession trajectories were not explicitly incorporated into the analysis. Since abandoned farmland may develop into herbaceous-, shrub-, or tree-dominated communities, variations in vegetation composition and succession pathways may contribute substantially to the observed spatial heterogeneity of SOC responses.
Third, the mechanisms underlying SOC dynamics require further investigation. The present study primarily focused on the spatial patterns and environmental controls of SOC change at the regional scale. However, the observed coexistence of SOC gains and SOC losses suggests that multiple ecological processes operate simultaneously following abandonment. Future studies should further investigate the interactions among vegetation succession, climatic conditions, soil physicochemical properties, microbial community dynamics, and carbon stabilization processes to better explain the divergent carbon trajectories identified in this study.
To address these limitations, future research should focus on the following aspects: (1) establishing long-term monitoring networks and field observation systems to obtain measured SOC data and improve the accuracy of carbon dynamic assessments; (2) integrating high-resolution remote sensing, ecological succession information, and process-based carbon models to quantify SOC responses under different vegetation recovery pathways; (3) incorporating climate variables, soil physicochemical indicators, and microbial functional characteristics into multi-scale analytical frameworks to improve the mechanistic understanding of SOC dynamics following farmland abandonment; and (4) evaluating the ecological and carbon consequences of abandonment under different land management and restoration scenarios to support region-specific policy design.
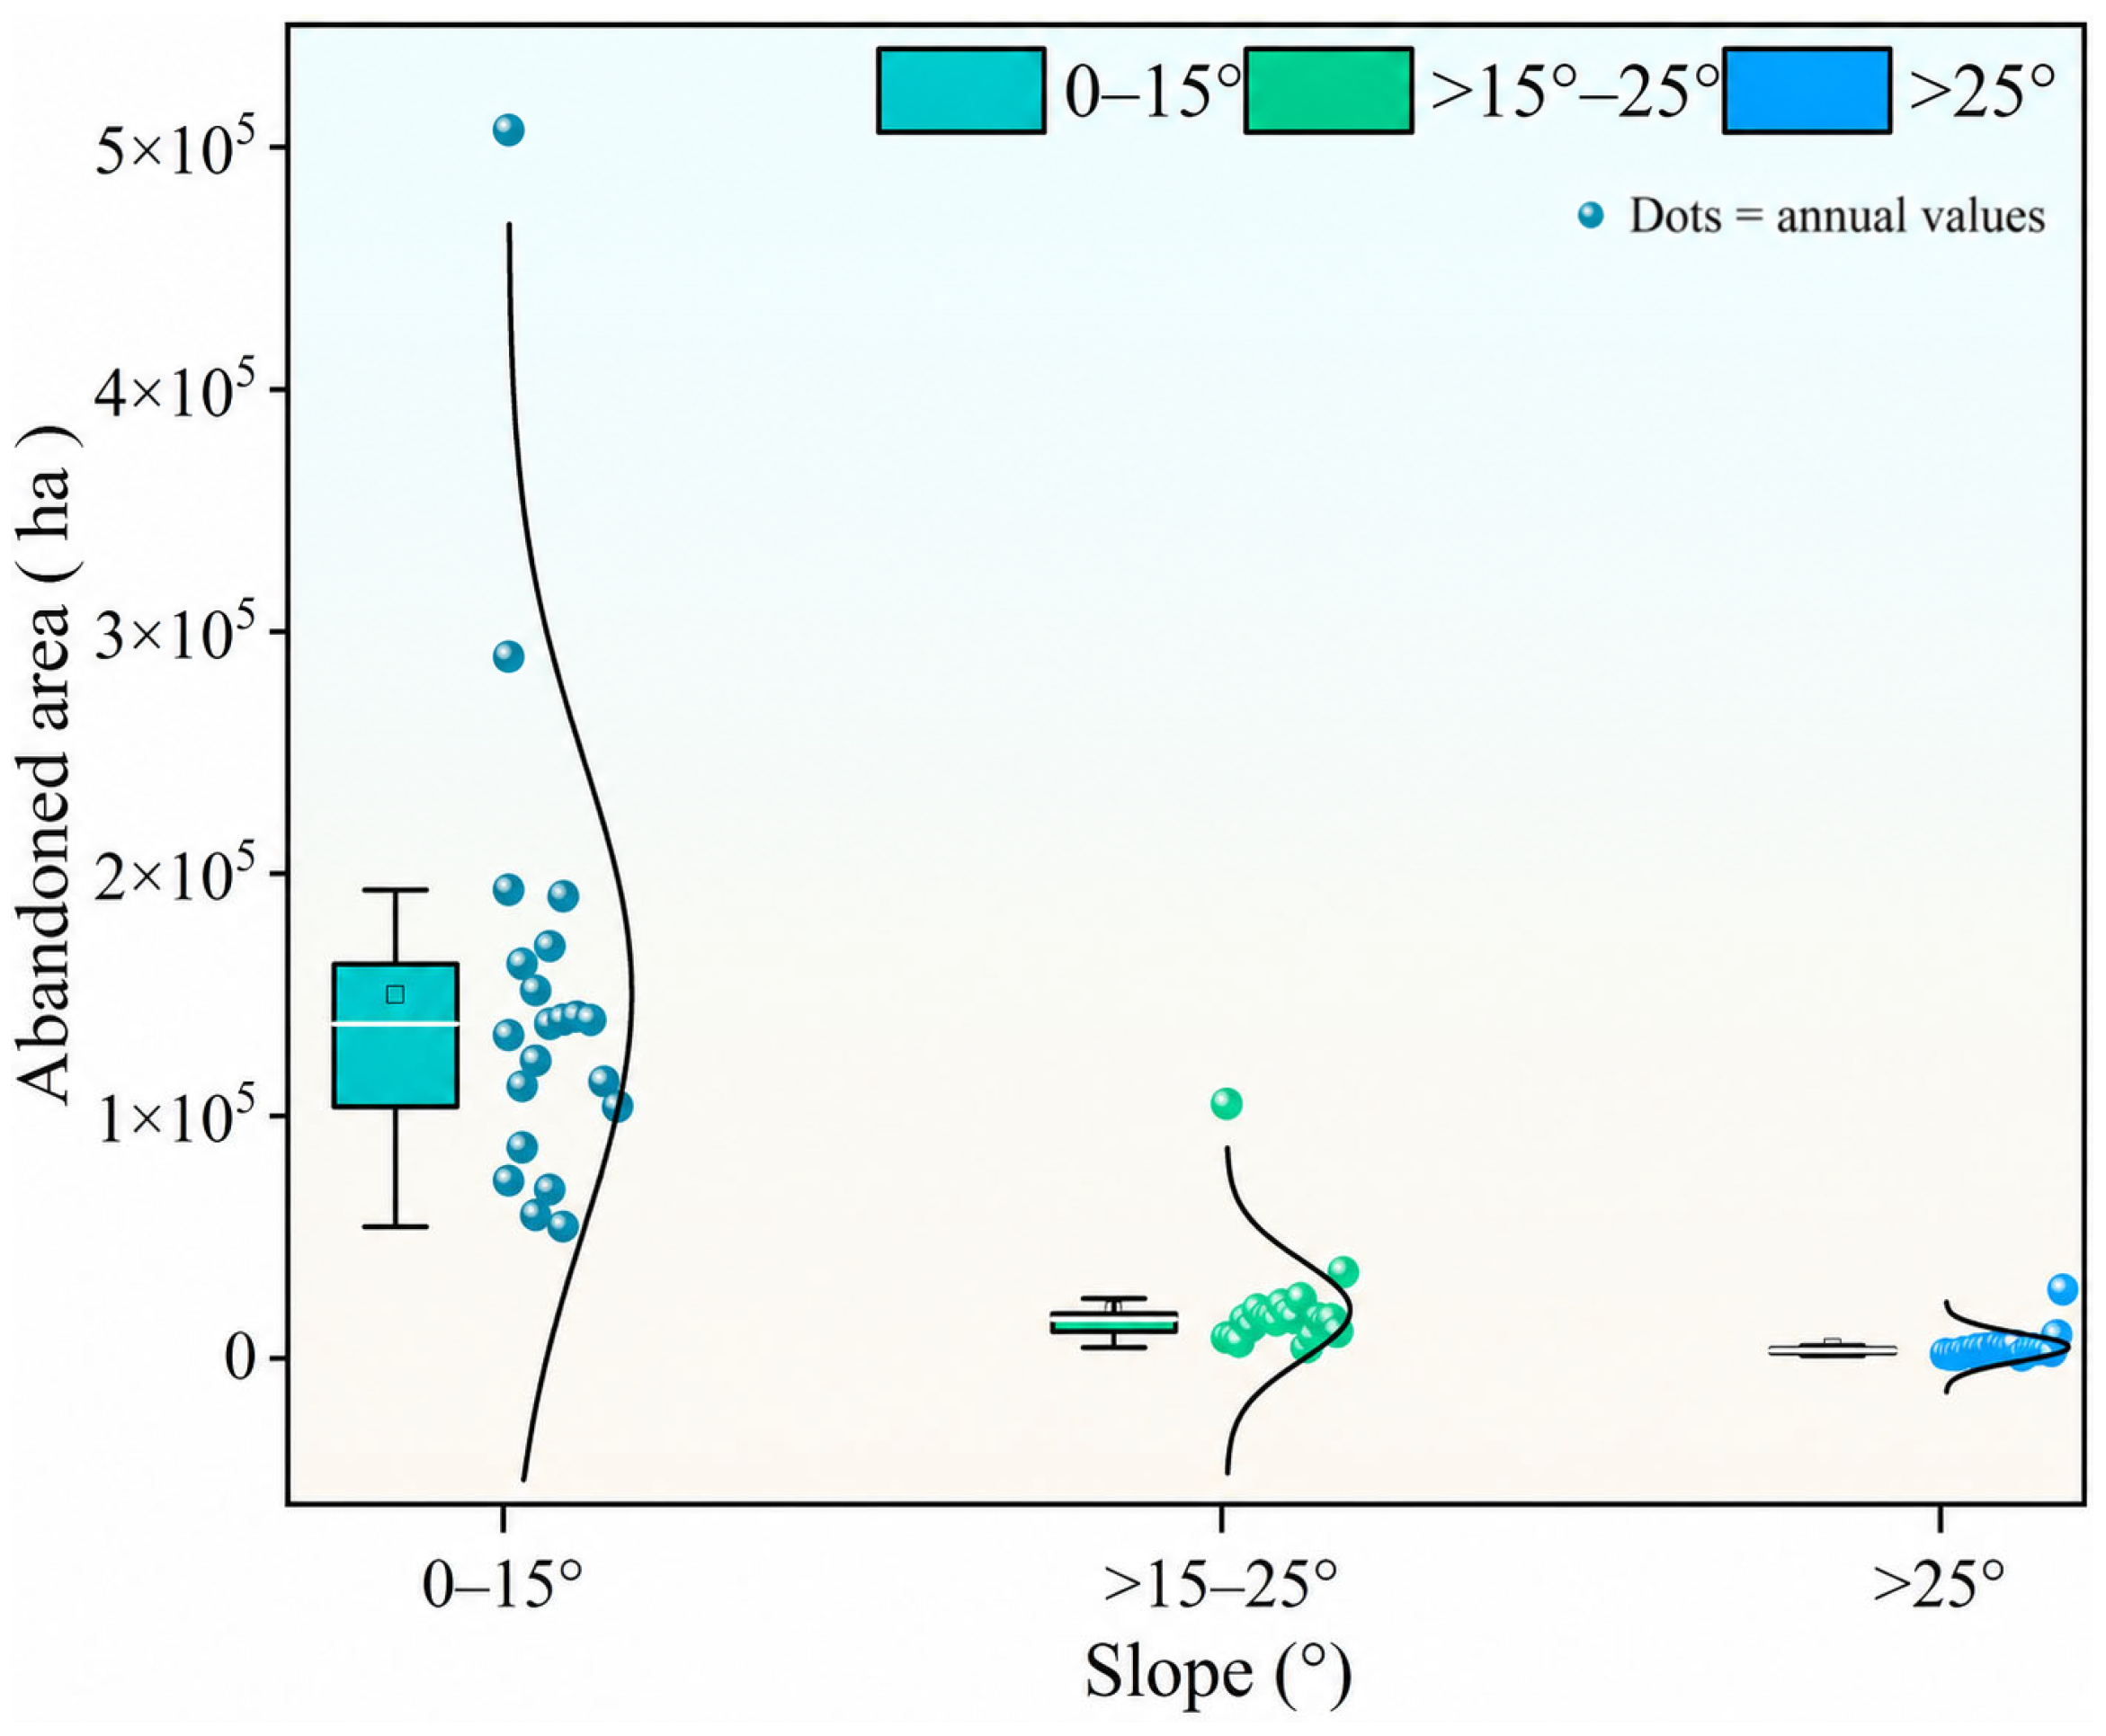
From a policy perspective, differentiated management strategies should be developed according to local environmental conditions. In steep-slope areas (>25°), ecological restoration-oriented abandonment may facilitate vegetation recovery and reduce erosion risks. In low-slope areas (0–15°) experiencing short-term abandonment, rotational cultivation or fallow management may help balance agricultural production and ecological benefits. Meanwhile, targeted agricultural support policies should be strengthened to improve land-use efficiency and promote the coordinated achievement of food security, ecological sustainability, and carbon-neutrality goals.
It should be noted that the temporal gradient analysis in this study employed a 5-year interval grouping, which differs from the 4-year criterion recommended by the OECD for cross-national comparisons of farmland abandonment rates in socio-economic contexts. Our choice of a 5-year interval was ecologically motivated—aligning with the major vegetation succession phases observed in the subtropical hilly region of South China, where the shift from herbaceous to shrub-dominated communities occurs approximately within the first five years post-abandonment and constitutes a key driver of soil carbon input changes. While the OECD standard facilitates comparability with socio-economic monitoring studies, its applicability to ecological process analysis—particularly in regions with rapid vegetation turnover and distinct successional thresholds—remains limited. Future studies aiming to bridge ecological and socio-economic assessments of abandonment effects may benefit from adopting a harmonized temporal framework that accommodates both vegetation succession stages and policy-relevant reporting intervals.
5. Conclusions
This study integrated long-term land-use and soil organic carbon (SOC) datasets and employed a trajectory-tracking approach to identify abandoned farmland in the hilly region of South China. Combined with paired-sample comparisons, temporal gradient analysis, geostatistics, and geographically weighted regression, the study systematically examined farmland abandonment trajectories during 2000–2020 and evaluated their impacts on surface SOC using datasets available through 2023.
The results showed that the area and rate of farmland abandonment fluctuated between 6.8 × 10⁴ and 6.4 × 10⁵ ha and between 0.7% and 6.6%, respectively. Abandonment became increasingly concentrated in later periods, with 37.91% of all abandonment events occurring during 2015–2020. Spatially, abandonment was highly concentrated in gently sloping areas (0–15°), accounting for approximately 87% of the total abandoned area. At the regional scale, farmland abandonment did not produce a consistent enhancement of surface SOC. Instead, it generated a bidirectional response characterized by the coexistence of SOC gains and SOC losses, resulting in a near-balanced regional outcome. Distinct spatial heterogeneity was observed, with carbon accumulation hotspots mainly distributed in eastern Fujian and coastal Guangdong, whereas carbon-loss hotspots were concentrated in western Guangxi. Abandonment duration exhibited a clear nonlinear effect on SOC dynamics, with the strongest carbon accumulation occurring during the 5–10 year abandonment stage, followed by gradual stabilization in later stages. The spatial variability of carbon effects was primarily controlled by structural environmental factors, particularly abandonment duration and annual mean NDVI, both of which exhibited significant spatial heterogeneity in their influences.
The results suggest that farmland abandonment triggers divergent carbon trajectories through the combined effects of vegetation succession, soil properties, climatic conditions, and topographic settings. In areas favorable for vegetation recovery, reduced anthropogenic disturbance and increased organic matter inputs promote SOC accumulation. Conversely, in environmentally constrained areas, processes such as soil erosion, enhanced decomposition, and limited carbon stabilization may offset or exceed the carbon gains, resulting in SOC declines. These contrasting responses generate the pronounced spatial compensation pattern observed across the study region.
This study overcomes the limitations of traditional static comparative approaches by integrating long-term land-use trajectories with SOC dynamics and provides new evidence regarding the spatially heterogeneous carbon effects of farmland abandonment in subtropical acidic red-soil regions. Rather than functioning as a universally positive carbon sink, the carbon consequences of farmland abandonment depend strongly on local environmental conditions and succession processes. These findings provide a scientific basis for differentiated land-use management, ecological restoration, and regional carbon-sink enhancement strategies in the hilly region of South China and contribute to the coordinated realization of ecological sustainability, food security, and carbon-neutrality objectives.