Article

Differential Responses of Soil Thermal Conductivity, Microbial Carbon Use Efficiency, and Soil Organic Carbon to Feedstock-Specific Biochar Under Alternate Drying–Wetting Cycles

1
Inner Mongolia Key Laboratory of Soil Quality and Nutrient Resources, College of Resources and Environment, Inner Mongolia Agricultural University, Hohhot 010018, China
2
Key Laboratory of Agricultural Ecological Security and Green Development, Universities of Inner Mongolia Autonomous, Hohhot 010018, China
3
Inner Mongolia Minzu University, Huolinghe Street 536, Tongliao 028000, China
4
Institute of Agricultural Resources and Environment, Xinjiang Academy of Agricultural Sciences, Urumqi 830091, China
5
Center for Agricultural Water Research in China, China Agricultural University, Beijing 100083, China
6
Key Laboratory of Agricultural Soil and Water Engineering in Arid and Semiarid Areas, Ministry of Education/Northwest A&F University, Yangling 712100, China
7
Department of Plant and Soil Sciences, Oklahoma State University, Stillwater, OK 74078, USA
8
Department of Plant and Environmental Sciences, Faculty of Science, University of Copenhagen, Højbakkegaard Alle 13, 2630 Taastrup, Denmark
*
Authors to whom correspondence should be addressed.
These authors contributed equally to this work.
Agronomy 2026, 16(13), 1262; https://doi.org/10.3390/agronomy16131262
Submission received: 19 May 2026 / Revised: 25 June 2026 / Accepted: 25 June 2026 / Published: 30 June 2026
(This article belongs to the Section Soil and Plant Nutrition)

Abstract

Biochar can alter soil physical conditions, microbial carbon processing, and soil organic carbon (SOC) responses under fluctuating moisture, yet how these changes are coordinated remains insufficiently understood. We conducted a two-season greenhouse pot experiment to examine the initial (first-year) and residual (second-year) effects of wheat-straw biochar (WSB) and softwood biochar (SWB) under conventional deficit irrigation (CDI) and alternate drying–wetting cycles (DWC). Compared with unamended soil, biochar amendment improved water-dispersible microaggregate-size distribution, mean microaggregate size, and water-holding capacity, which contributed to reduced soil thermal conductivity (STC) by 6.0–14.2%. Biochar application also improved microbial carbon use efficiency (CUE) by 41.1–52.3%, with WSB generally showing stronger and more persistent effects than SWB. Relative to CDI, DWC increased soil respiration rate by 14.9–48.8% but decreased CUE by 7.4–10.2% and SOC by 3.0–10.3%, indicating a shift toward greater respiratory carbon loss under repeated moisture fluctuations. Biochar amendment increased SOC across both seasons, particularly under WSB, and partially alleviated the DWC-associated reductions in CUE and SOC. Correlation analyses showed that lower STC was associated with higher CUE and SOC, but these relationships should be interpreted as coordinated associations rather than direct evidence of a causal thermal-regulation mechanism. Principal component and random forest analyses further highlighted STC as a prominent variable associated with variation in CUE and SOC among the measured soil attributes. These findings indicate that biochar-mediated changes in soil physical conditions are closely associated with microbial CUE and SOC responses under drying–wetting cycles, wherein soil thermal properties may represent an important physical dimension of these carbon responses.

1. Introduction

Soil organic carbon (SOC) is one of the largest terrestrial carbon pools and plays a central role in ecosystem productivity, climate regulation, and agroecosystem resilience [1]. In water-limited agricultural systems, SOC dynamics are increasingly exposed to recurrent fluctuations in soil moisture, shifts in soil physical conditions, and intensified carbon mineralization under variable environmental regimes [2,3,4,5]. Although SOC responses are often interpreted from the perspective of carbon inputs, the persistence of soil carbon also depends on how efficiently microorganisms assimilate available substrates and allocate them to biomass rather than releasing them as CO2 through respiration [6]. This balance is commonly expressed as microbial carbon use efficiency (CUE), defined as the proportion of assimilated carbon retained for microbial growth relative to total carbon uptake [7]. Because microbial biomass and residues contribute substantially to the formation of persistent soil organic matter, changes in CUE are closely relevant to SOC accumulation and loss [8,9,10,11].
The importance of microbial CUE becomes more pronounced under fluctuating moisture. Repeated drying and rewetting can disrupt microbial metabolism, alter substrate accessibility, and induce respiration pulses after rewetting, often leading to inefficient carbon use and greater CO2 release [12,13,14,15]. Such responses are particularly relevant in water-limited croplands, where rainfall variability and water-saving irrigation can generate recurrent drying–wetting cycles (DWC) [16]. However, microbial carbon processing under these conditions is not governed by water supply alone [17,18]. The soil physical environment, including pore architecture, aggregation, particle arrangement, and water-holding characteristics, can influence microbial habitat continuity, substrate diffusion, and the balance between carbon assimilation and respiration [19,20]. Yet, compared with the well-recognized effects of moisture availability, how broader soil physical changes are coordinated with microbial CUE and SOC accumulation under fluctuating moisture remains less clearly understood.
Biochar is a relevant candidate for examining this possibility because it can substantially modify the soil physical environment while also affecting microbial habitat quality. Produced by the pyrolysis of biomass, biochar has been widely reported to improve soil water retention, reduce bulk density, promote aggregation, and increase carbon sequestration potential [21,22,23,24]. These physical effects are closely related to changes in soil heat transfer, as thermal conductivity is shaped by particle contact, pore continuity, water distribution within the soil matrix, and the intrinsic thermal conductivity of solid constituents [25,26,27]. At an amendment level sufficient to change soil composition, biochar can also alter STC by changing the relative contribution of mineral particles and low-density carbonaceous particles in the solid phase [28]. Within this context, STC may provide a useful integrative physical descriptor, because variation in STC can reflect combined changes in soil structure, pore-water distribution, solid-phase composition, and the intrinsic thermal conductivity of mineral and carbonaceous particles. However, this thermal dimension of biochar-induced soil physical change has rarely been considered together with microbial CUE and SOC responses under drying–wetting cycles. Thus, whether STC is closely associated with microbial CUE and SOC responses following biochar amendment remains insufficiently resolved.
The magnitude and persistence of these responses may depend on biochar feedstock. Biochars produced from contrasting raw materials differ markedly in ash content, pore structure, mineral composition, and surface characteristics, which can shape their effects on soil aggregation, water retention, and microbial functioning [29,30]. Wheat-straw biochar (WSB), for example, generally contains more mineral ash and can exhibit a more developed porous structure than softwood biochar (SWB), potentially leading to stronger effects on the soil physical environment [31,32]. In addition, the ash content and mineral composition of biochar can influence nutrient availability and cation exchange dynamics, which may further affect microbial metabolism [33,34]. Such differences may become especially consequential under DWC, when soil structure, water redistribution, and microbial carbon-use strategies are repeatedly challenged. Despite growing interest in biochar-mediated carbon responses, few studies have jointly examined feedstock-dependent changes in multiple soil physical attributes, microbial CUE, and SOC under practical irrigation-related moisture fluctuations, particularly across both the initial and residual phases of biochar effects.
To address this gap, we conducted a two-season factorial pot experiment using two contrasting biochars, WSB and SWB, under conventional deficit irrigation (CDI) and alternate drying–wetting cycles (DWC), representing the initial and residual effects of biochar amendment. We aimed to determine: (1) whether WSB and SWB differ in their capacity to modify soil physical conditions, including water-dispersible microaggregate-size characteristics, aggregation, water-holding capacity, and STC; (2) how DWC and biochar amendment influence soil CO2 efflux, CUE, and SOC accumulation across growing seasons; and (3) whether variation in soil physical attributes is associated with CUE and SOC accumulation, with particular attention to the relative prominence of STC within this broader physical framework. We further expected that WSB would exert stronger and more persistent effects than SWB, that DWC would decrease CUE and SOC relative to CDI, and that biochar would partly alleviate these responses. By integrating soil physical, microbial, and carbon-related measurements, this study seeks to clarify how biochar-mediated changes in the soil physical environment are linked to microbial CUE and SOC responses under fluctuating moisture conditions.

2. Materials and Methods

2.1. Biochar and Soil Preparation

The biochars used in this study were produced from mixed softwood (SWB) and wheat-straw (WSB) at the UK Biochar Research Centre. Both biochars were produced by pyrolysis of the respective feedstocks at a peak temperature of 550 °C, with a heating rate of 1.3 °C s−1, using a pilot-scale rotary kiln system [35]. More details about the production protocols, analytical methods, and characteristics of the biochars are available in previous reports [35,36]. The pelletized biochar was milled to pass through a 0.45 mm sieve prior to application.
The soil was collected from the top 25 cm of a farm field in Yangling, China (34°15′ N, 108°04′ E), and it was a silty loam, consisting of 8% clay, 85% silt, and 7% sand [37]. After air-drying, soil samples were passed through a 5 mm sieve. Biochars were mixed with the soil at 2% (w/w) for the experiment. The volumetric soil water content (θ, vol. %) of the unamended soil was 30.0% at field capacity and 5.0% at the permanent wilting point. Upon incorporation of either SWB or WSB, pot capacity increased to 32.0% (vol. %). The bulk density was 1.40 g cm−3 in the unamended soil and decreased to 1.30 g cm−3 after biochar incorporation. Key physicochemical properties of the soil and biochar materials are summarized in Table 1.

2.2. Experimental Design and Treatments

A full-factorial pot experiment was conducted with 6 treatment combinations and three independent pot replicates per treatment, giving a total of 18 pots. The treatment factors were biochar amendment (control, SWB, and WSB) and irrigation regime (conventional deficit irrigation, CDI, and alternate drying–wetting cycles, DWC). Biochar effects were evaluated over the 2021 season (April–July), representing the first-year effect (hereafter referred to as the initial effect), and the 2022 season (April–July), representing the second-year effect (hereafter referred to as the residual effect for convenience); thus, growth season was treated as an additional set of independent treatment combinations. Maize (Zea mays L., cv. Shaan Dan 650) seeds were obtained from the College of Agronomy, Northwest A&F University. Uniform seedlings at the four-leaf stage were transplanted into 8 L pots containing 9 kg of air-dried soil or biochar-amended soils. Before transplanting, biochar and basal fertilizer (2 g N, 4.6 g P2O5, and 4.4 g K2O per pot) were thoroughly mixed with the soil, and the soil was allowed to equilibrate for 7 days. The pots were maintained under natural light in a greenhouse at Northwest A&F University, Yangling, China.
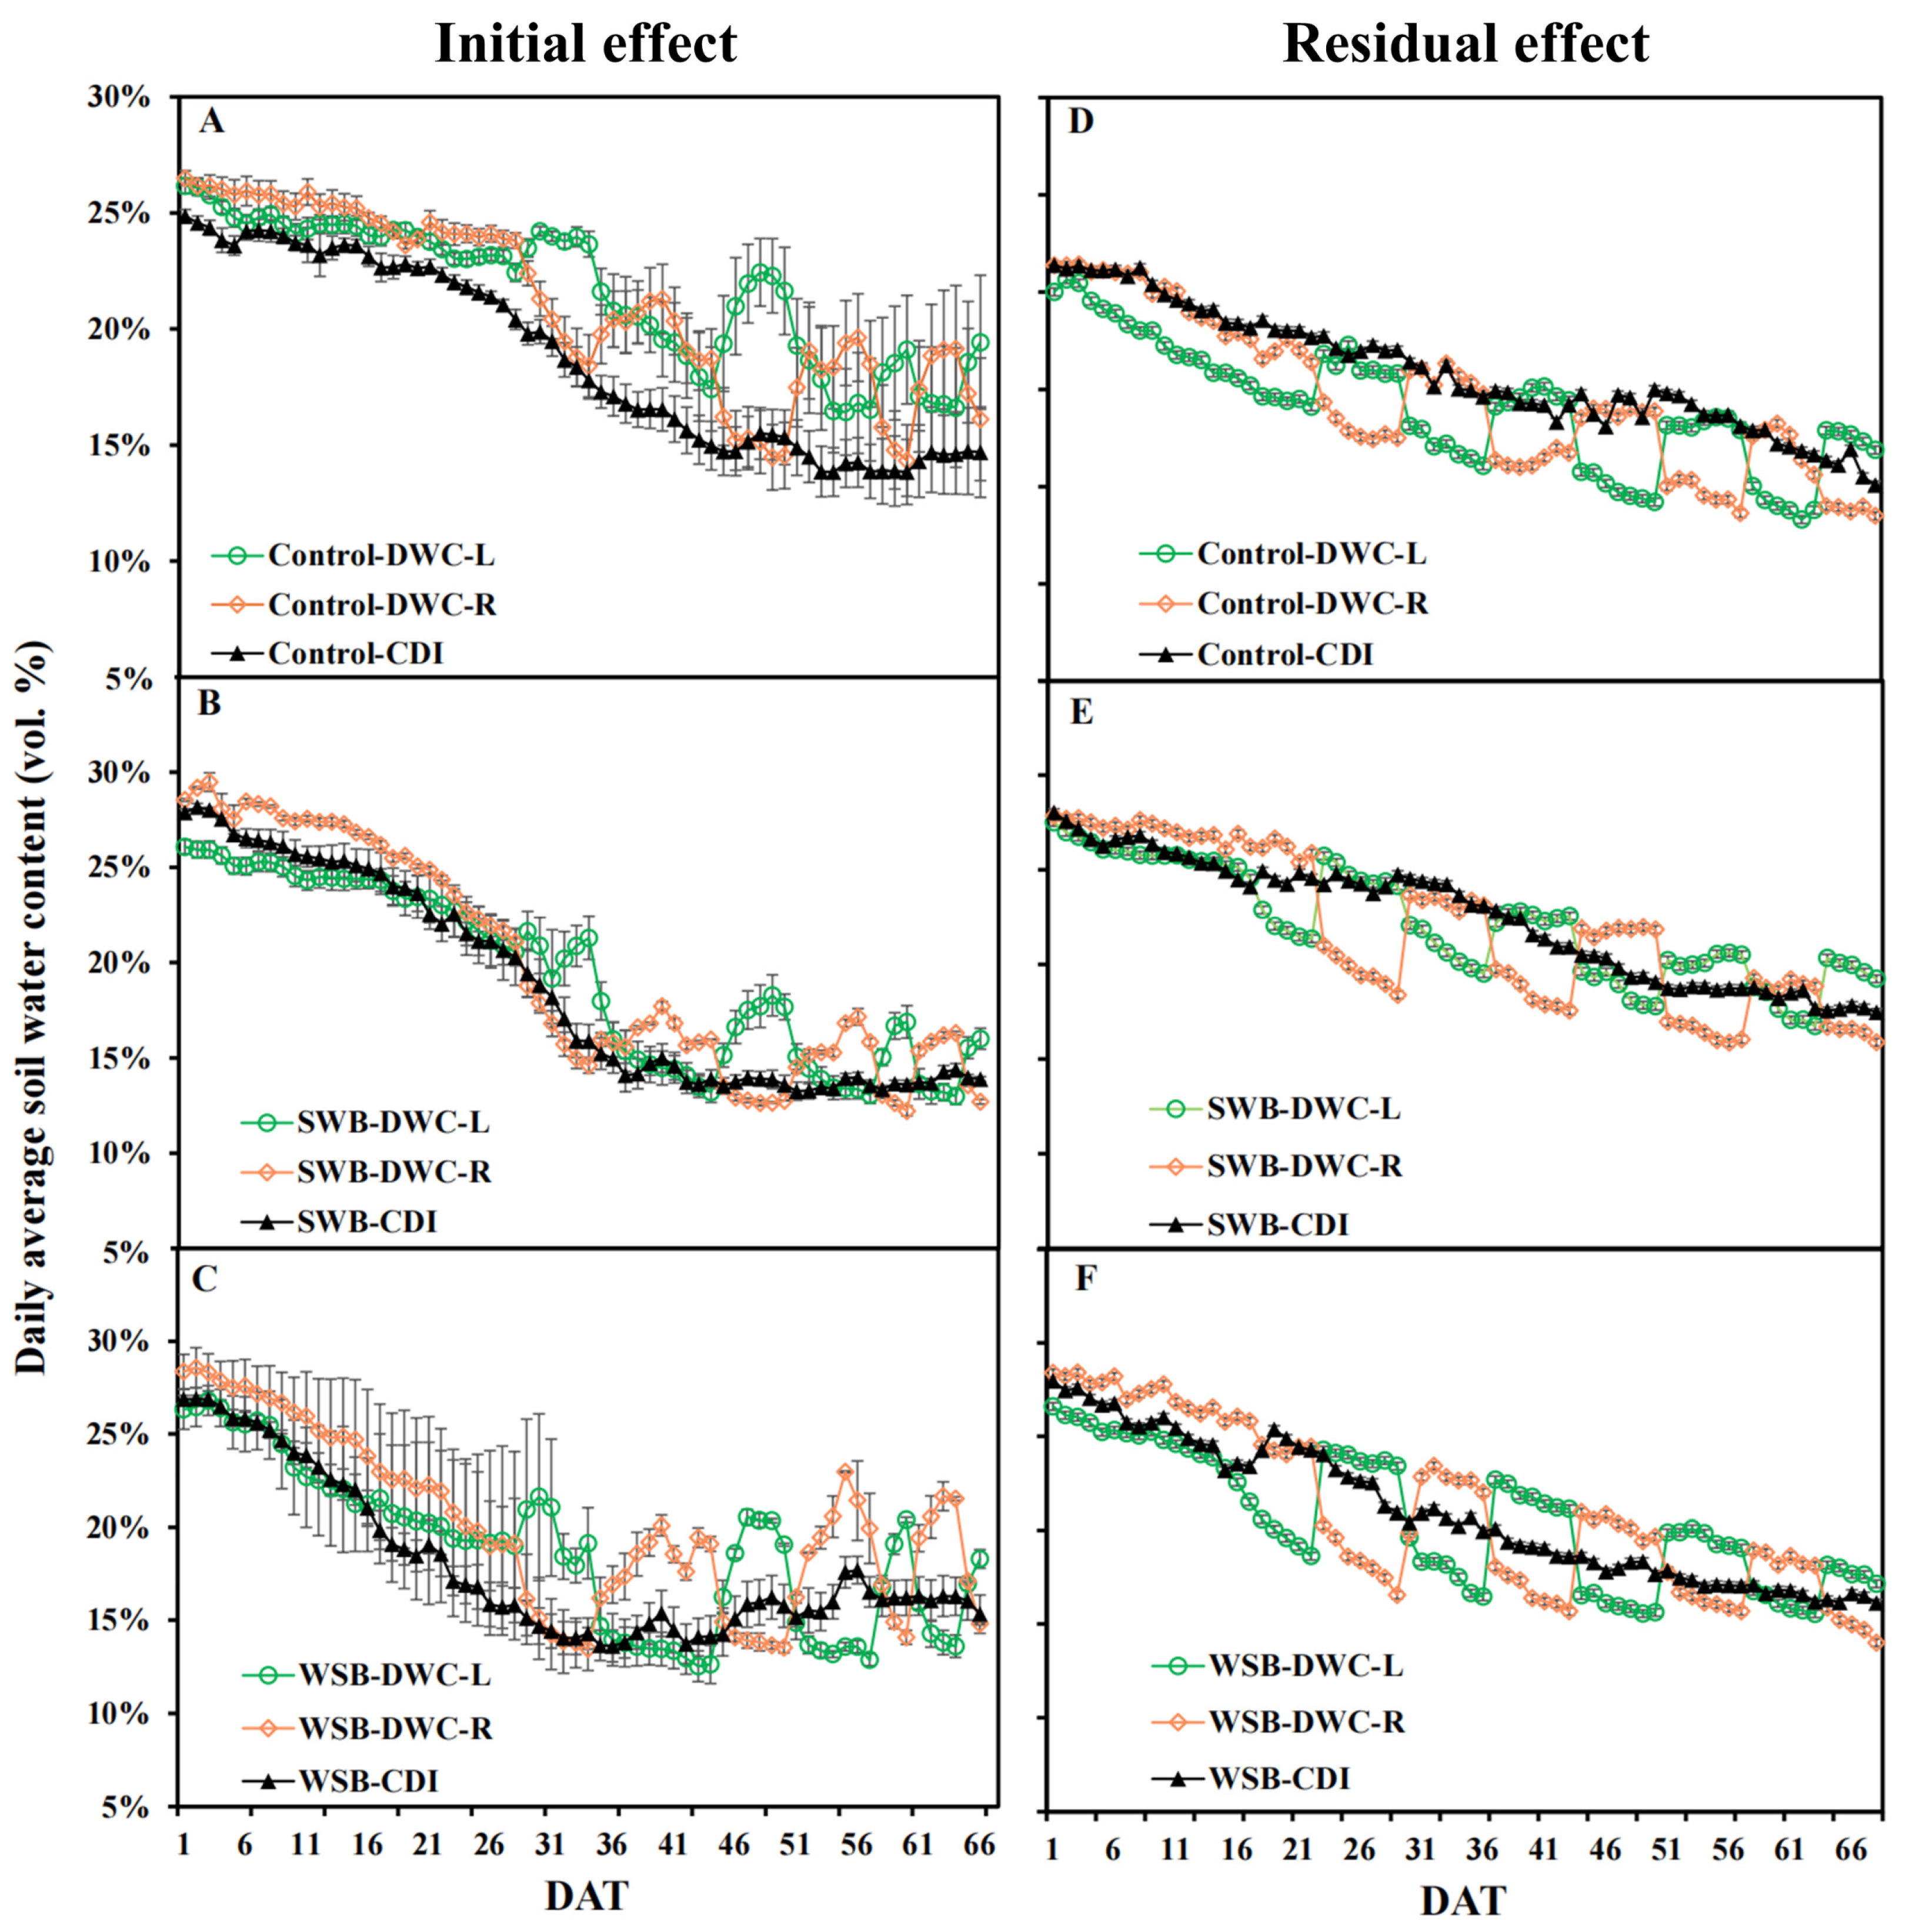
During the first 30 days after transplanting, all pots were irrigated daily to maintain favorable and uniform water conditions at approximately 90% of pot water-holding capacity, and irrigation treatments were not imposed during this establishment period. Thereafter, two reduced irrigation regimes were imposed. In the CDI treatment, irrigation water was evenly supplied to the whole root zone, with the total amount of water matched to that used in the DWC treatment. In the DWC treatment, the split root zone was divided into two compartments; one compartment was irrigated to maintain soil water content at approximately 20% (v/v), whereas the opposite compartment was allowed to dry until its soil water content declined to approximately 12% (v/v), after which irrigation was switched to the previously dry compartment. Soil moisture dynamics were monitored daily at 16:00 using TDR sensors (25 cm; TRASE, Soil Moisture Equipment Corp., Santa Barbara, CA, USA) installed in each root compartment (Figure 1).
Figure 1. Daily means of soil water content (θ, %) in the pots of plants amended with biochar under conventional deficit irrigation (CDI) and alternate drying–wetting cycle (DWC) treatments in 2021 (first-year effect, hereafter termed the initial effect) and 2022 (second-year effect, hereafter termed the residual effect). (AC) represent Control, softwood biochar (SWB), and wheat-straw biochar (WSB) under different irrigation treatments in 2021, respectively; (DF) represent Control, SWB, and WSB under different irrigation treatments in 2022, respectively. DWC-L and DWC-R represent the left and right soil compartments of DWC pots, respectively. Values are the mean ± standard error (n = 3).
Agronomy 16 01262 g001
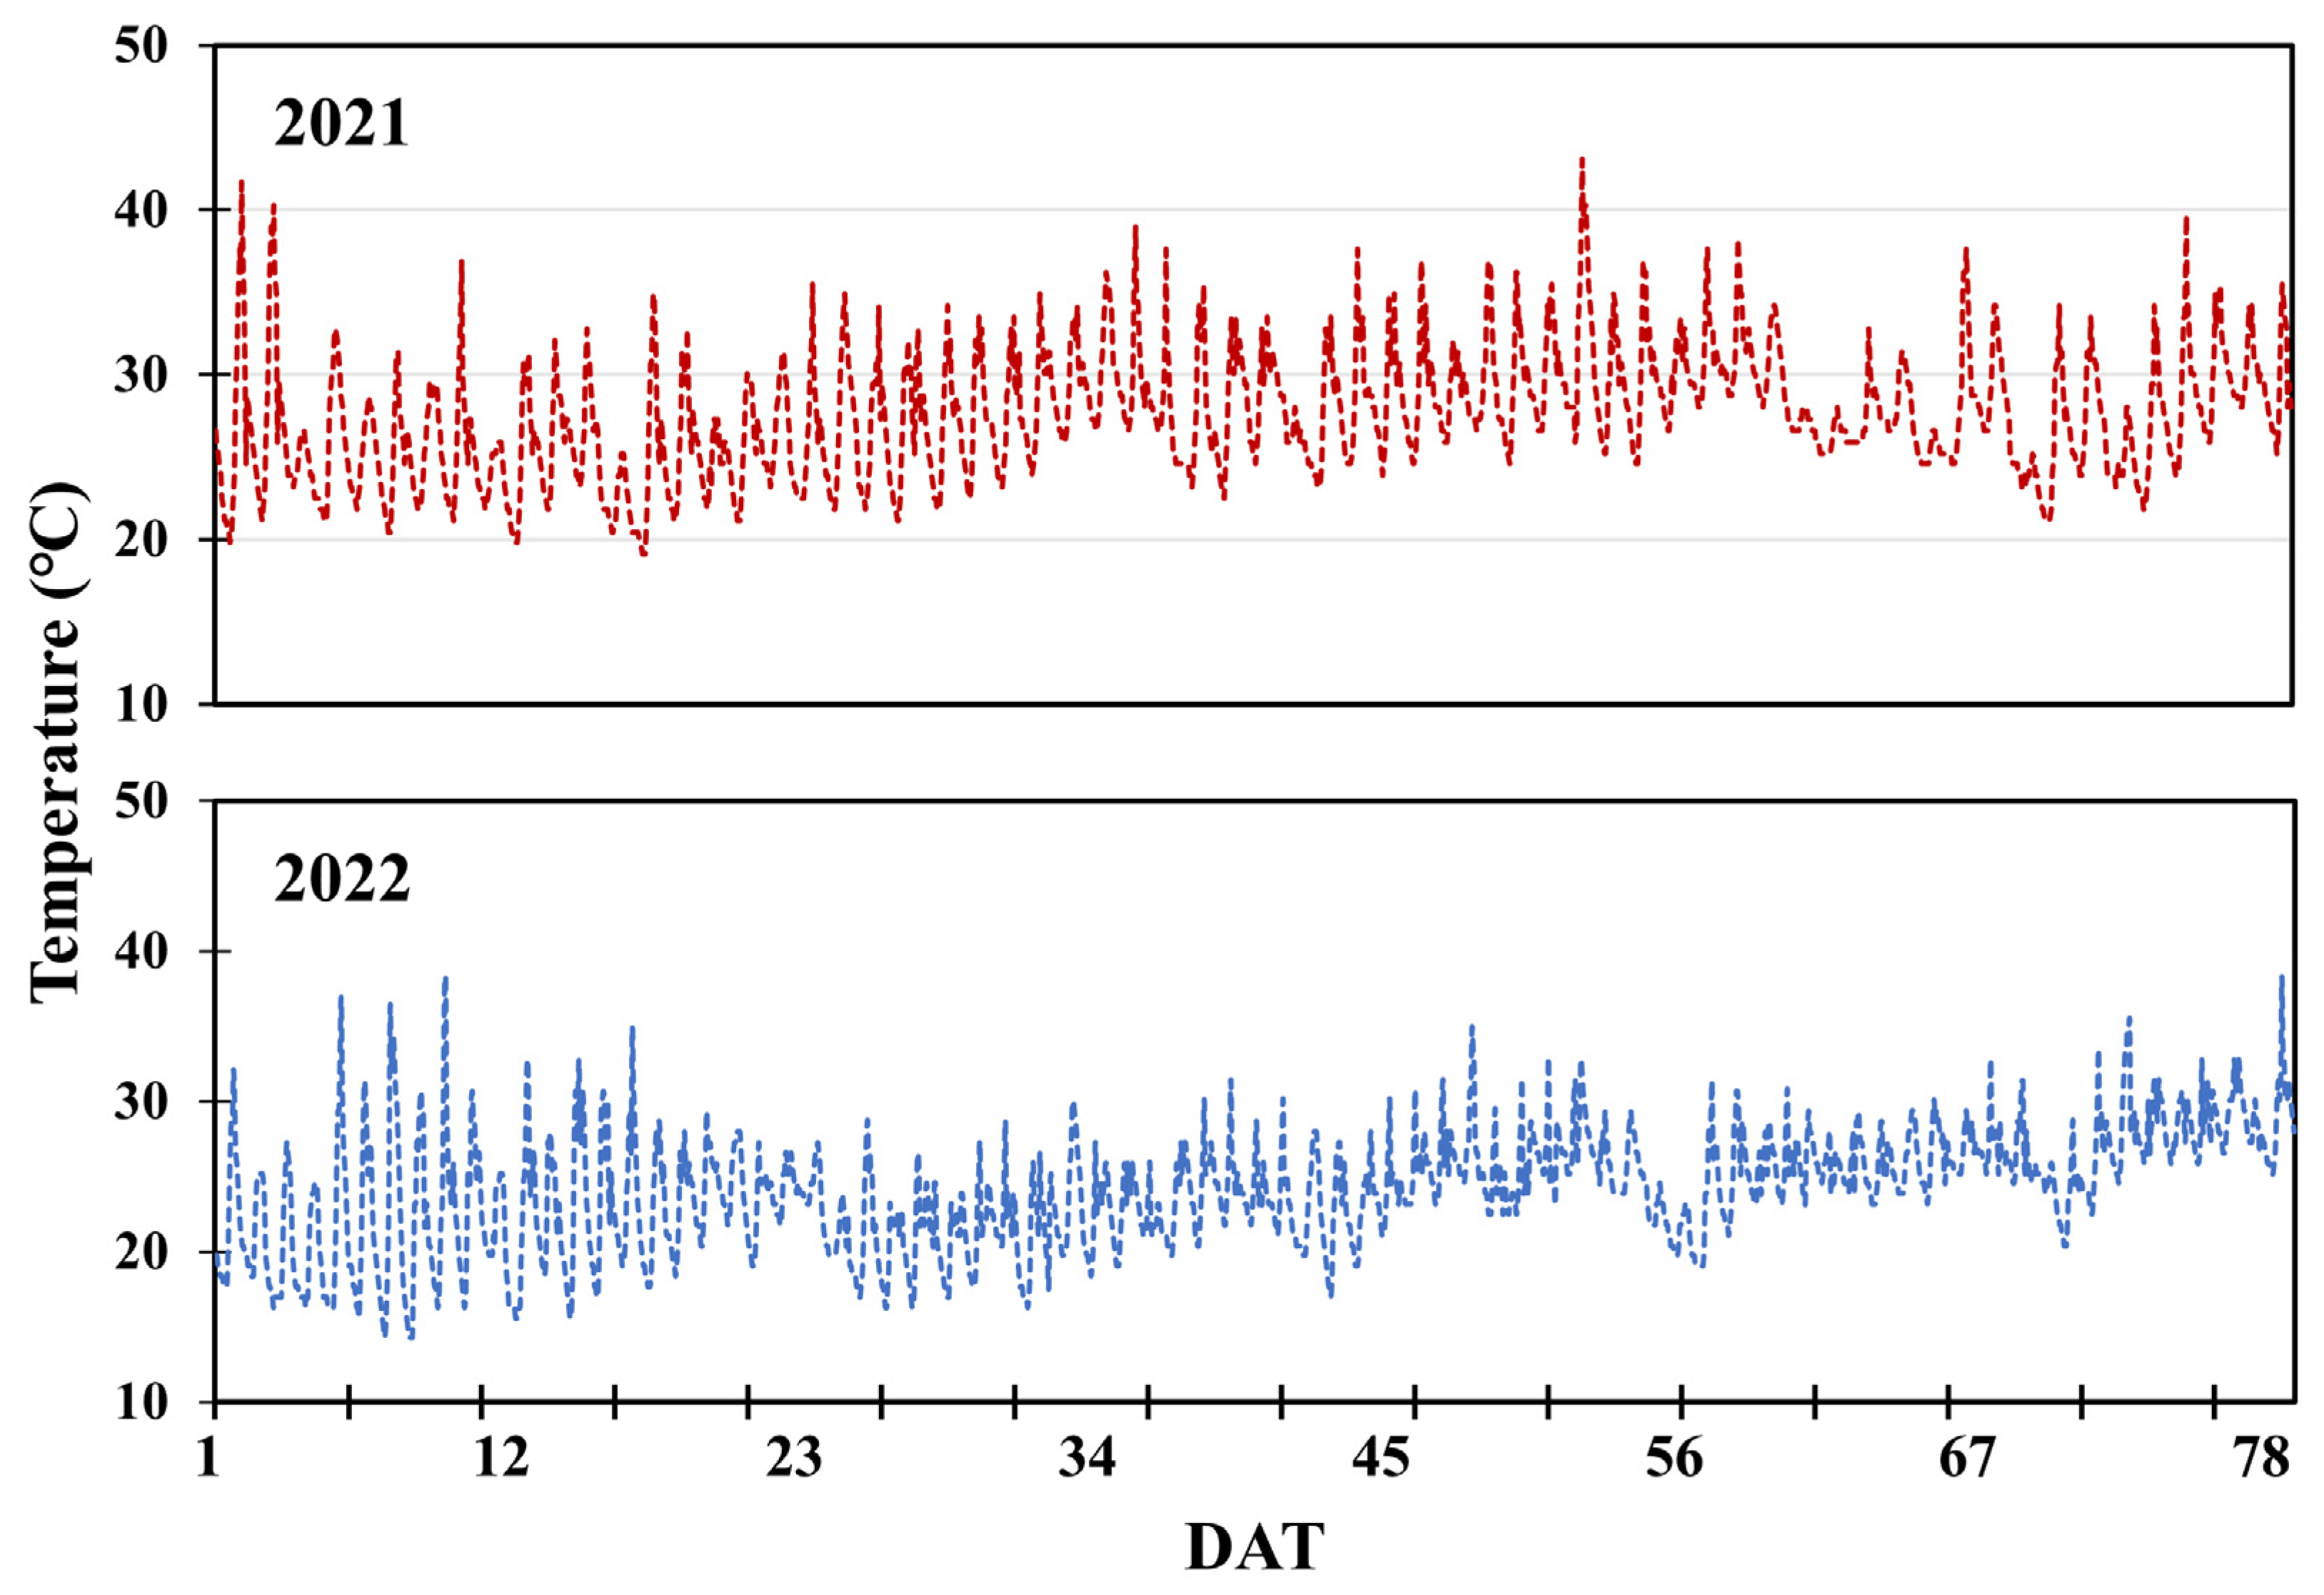
Greenhouse environmental parameters were continuously monitored over the two growing seasons. Average temperatures were 24.5 °C and 27.5 °C, relative humidity was 73.3% and 81.3%, and vapor pressure deficits were 0.8 and 0.7 kPa in 2021 and 2022, respectively. To provide the thermal background relevant to soil thermal conductivity, daily greenhouse temperature dynamics are shown in Figure 2. At harvest, maize plants were collected for biomass determination and separated into shoots and roots, oven-dried to constant weight, and weighed. To avoid unequal soil mass after soil sampling, additional treatment-matched pots were prepared and managed under the same treatment conditions. After the 2021 harvest and soil sampling, soils from the same treatment were thoroughly homogenized, and an equal dry-mass equivalent of treated soil was reweighed for each pot before the second cropping season. No additional biochar was applied in 2022, allowing the residual effects of the original biochar amendment to be evaluated.

2.3. Measurement and Analysis

2.3.1. Biochar Surface Morphology and Crystalline Structure

Biochar surface morphology was examined by scanning electron microscopy (SEM; TESCAN MIRA, TESCAN, Brno, Czech Republic) after gold sputter-coating, using an accelerating voltage of 15 kV [39]. Crystalline phase composition of the original soil, biochar, and soil–biochar mixtures was determined by X-ray diffraction (XRD; X’Pert Pro MPD, PANalytical, Almelo The Netherlands) with Cu-Kα radiation operated at 40 kV and 30 mA over a 2θ range of 5–90° [32]. SEM was conducted on the original biochar materials prior to soil incorporation, whereas XRD was performed both before biochar incorporation and after each harvest.

2.3.2. Chemical Composition and Functional Group Analysis

Elemental composition was determined by X-ray fluorescence spectroscopy (XRF; Axios, PANalytical, Almelo, The Netherlands) [40]. Major surface functional groups were identified by Fourier-transform infrared spectroscopy (FTIR; Nicolet iS5, Thermo Scientific, Waltham, MA, USA) using KBr pellets over the range 4000–400 cm−1 at a resolution of 2 cm−1 [41]. Both XRF and FTIR were performed on the original biochar materials prior to soil incorporation and repeated after each harvest.

2.3.3. Soil pH and Zeta Potential

Soil pH was determined in a 1:2.5 soil-to-water suspension using a calibrated pH meter (Model 60, Jenco Instruments Inc., San Martin, CA, USA) [42]. Soil zeta potential (SZP) was determined in deionized water using a Zetasizer Nano ZS90 (Malvern Instruments, Worcestershire, UK) [43]. Both soil pH and zeta potential were measured before transplanting and after each harvest.

2.3.4. Water-Dispersible Microaggregate-Size Distribution and Water-Holding Capacity

Water-dispersible microaggregate-size distribution was measured by laser diffraction (Mastersizer 2000, Malvern Instruments, Malvern, Worcestershire, UK) after dispersion in deionized water [44]. Water-holding capacity (WHC) was determined gravimetrically after saturation and free drainage, and was calculated as [45]:
WHC = Wet   soil   weight - Dry   soil   weight Dry   soil   weight × 100 %
WHC was determined before transplanting, whereas water-dispersible microaggregate-size distribution was measured before transplanting and repeated after each harvest.

2.3.5. Soil Thermal Conductivity and Respiration Rate

Soil thermal conductivity (STC) was measured after each harvest using a transient plane source thermal analyzer (TPS2500S, Hot Disk Instruments, Göteborg, Sweden). Before measurement, soil samples were air-dried, sieved, and pressed into 30 mm discs at 20 MPa to minimize moisture-related differences among treatments. The sensor probe was sandwiched between two pressed discs, and measurements were conducted at ambient laboratory temperature after the signal reached a stable value [46]. Soil respiration rate (SRR) was measured at the vegetative and grain-filling stages using an LI-6800 portable photosynthesis system equipped with a soil chamber (6800-09, LI-COR Biosciences, Lincoln, NE, USA) [47]. The SRR values reported for each treatment represent the mean of the two measurements. Because measurements were conducted in planted pots, SRR represents total soil CO2 efflux, including both autotrophic root respiration and heterotrophic microbial respiration.

2.3.6. Soil Total Carbon, Total Nitrogen, Mineral Nitrogen, and Organic Carbon

Total carbon (TC) was determined by dry combustion using an elemental analyzer (vario PYRO cube, Elementar, Langenselbold, Germany) [48]. Total nitrogen (TN) was measured using the Kjeldahl method [49]. Mineral N (NO3-N and NH4+-N) was extracted with 1 M KCl and quantified using a continuous flow analyzer (AutoAnalyzer 3, Bran + Luebbe, Norderstedt, Germany) [50]. Soil organic carbon (SOC) was determined by the Walkley–Black dichromate oxidation method [51]. All of these measurements were conducted after each harvest.

2.3.7. Microbial Carbon Use Efficiency Assessment

Soil samples were collected at both vegetative and grain-filling stages under each irrigation treatment (CDI and DWC). For DWC, samples were taken separately from the wet and dry zones to capture microbial responses to heterogeneous moisture conditions. Subsequently, samples were passed through a 2 mm sieve and stored at 4 °C to preserve microbial integrity. For each treatment, 30 g of samples was placed into aerated containers with drainage. Moisture levels were adjusted using deionized water to reflect in situ conditions: 12% (dry-zone, DWC), 20% (wet-zone, DWC), and 20% (CDI). Samples were pre-incubated for two weeks to allow microbial communities to equilibrate. For treatment-level comparison and ANOVA, the two compartment-level values were then averaged with equal weight to obtain one pot-level DWC value, because the wet and dry compartments represented equal proportions of the split-root pot.
Microbial carbon use efficiency (CUE) was determined using a substrate-independent method based on in vivo equilibration with 18O-enriched water vapor [4]. Briefly, 400 mg of fresh soil was sealed in 2 mL screw-cap vials, which were then placed inside 27 mL incubation vessels. To avoid direct contact between H218O and the soil, labelled water was added to the bottom of the incubation vessel, resulting in approximately 20% 18O enrichment in soil water. The vials were incubated for 48 h, and headspace CO2 concentration was measured to estimate microbial respiration. Microbial CUE was calculated as:
Microbial   CUE = C Growth C Growth + C Respiration
where Cgrowth represents microbial growth derived from 18O incorporation during incubation, and Crespiration represents cumulative CO2 released during the same incubation period.

2.3.8. Microbial Biomass Carbon and Nitrogen

Microbial biomass carbon (MBC) and nitrogen (MBN) were determined using the chloroform fumigation–extraction method [52]. Extractable C and N in fumigated and non-fumigated soils were measured with a Multi N/C 3000 analyzer (Elementar, Langenselbold, Germany), and MBC and MBN were calculated using conversion factors of 0.45 and 0.54, respectively. Both MBC and MBN were measured after each harvest. For DWC treatment, wet- and dry-compartment soils were extracted separately; the two compartment-level values were then averaged with equal weight to obtain one pot-level DWC value for statistical analysis.

2.4. Statistical Analysis

Statistical analyses were conducted using IBM SPSS Statistics 23.0 (IBM Corp., Armonk, New York, USA) and R (v4.2.2). The pot was used as the experimental unit, and the experiment included 18 independent pots followed across two cropping seasons. Biochar amendment (B) and irrigation regime (I) were treated as fixed treatment factors, whereas growth season (Y) was considered a repeated temporal factor representing the initial and residual phases of the same pots. Main effects and interactions were tested, and Tukey’s multiple comparison test was applied following one-way ANOVA to identify significant differences among treatment means (p < 0.05) [53]. Pearson’s correlation analysis was performed in R to assess relationships between microbial CUE and soil physicochemical or microbiological parameters, as well as between SOC and microbial CUE or soil C turnover-related indicators [54]. A random forest model (RFM) was implemented using the “randomForest” package (v4.7.1.1) [55] to explore the relative importance of measured predictors for microbial CUE and SOC. For the CUE model, candidate predictors included STC, WHC, MMS, soil pH, TC, TN, C/N ratio, mineral N, SRR, MBC, and MBN; for the SOC model, candidate predictors included STC, CUE, SRR, MBC, MBN, TC, TN, C/N ratio, mineral N, WHC, and MMS. Each model was constructed with 500 trees, and variable importance was assessed based on the increase in mean square error (MSE). Model stability was evaluated using 10-fold cross-validation based on 36 season-level observations derived from 18 pots. Because the number of independent experimental units was modest, random forest outputs were used as exploratory rankings of relative variable importance rather than as evidence of causal effects. Principal component analysis (PCA) was performed on min–max normalized data for all measured parameters using ORIGIN-Pro 2021 (OriginLab Corp., Northampton, MA, USA) [56].

3. Results

3.1. Biochar Structures, Soil Mineral Composition, and Functional Groups

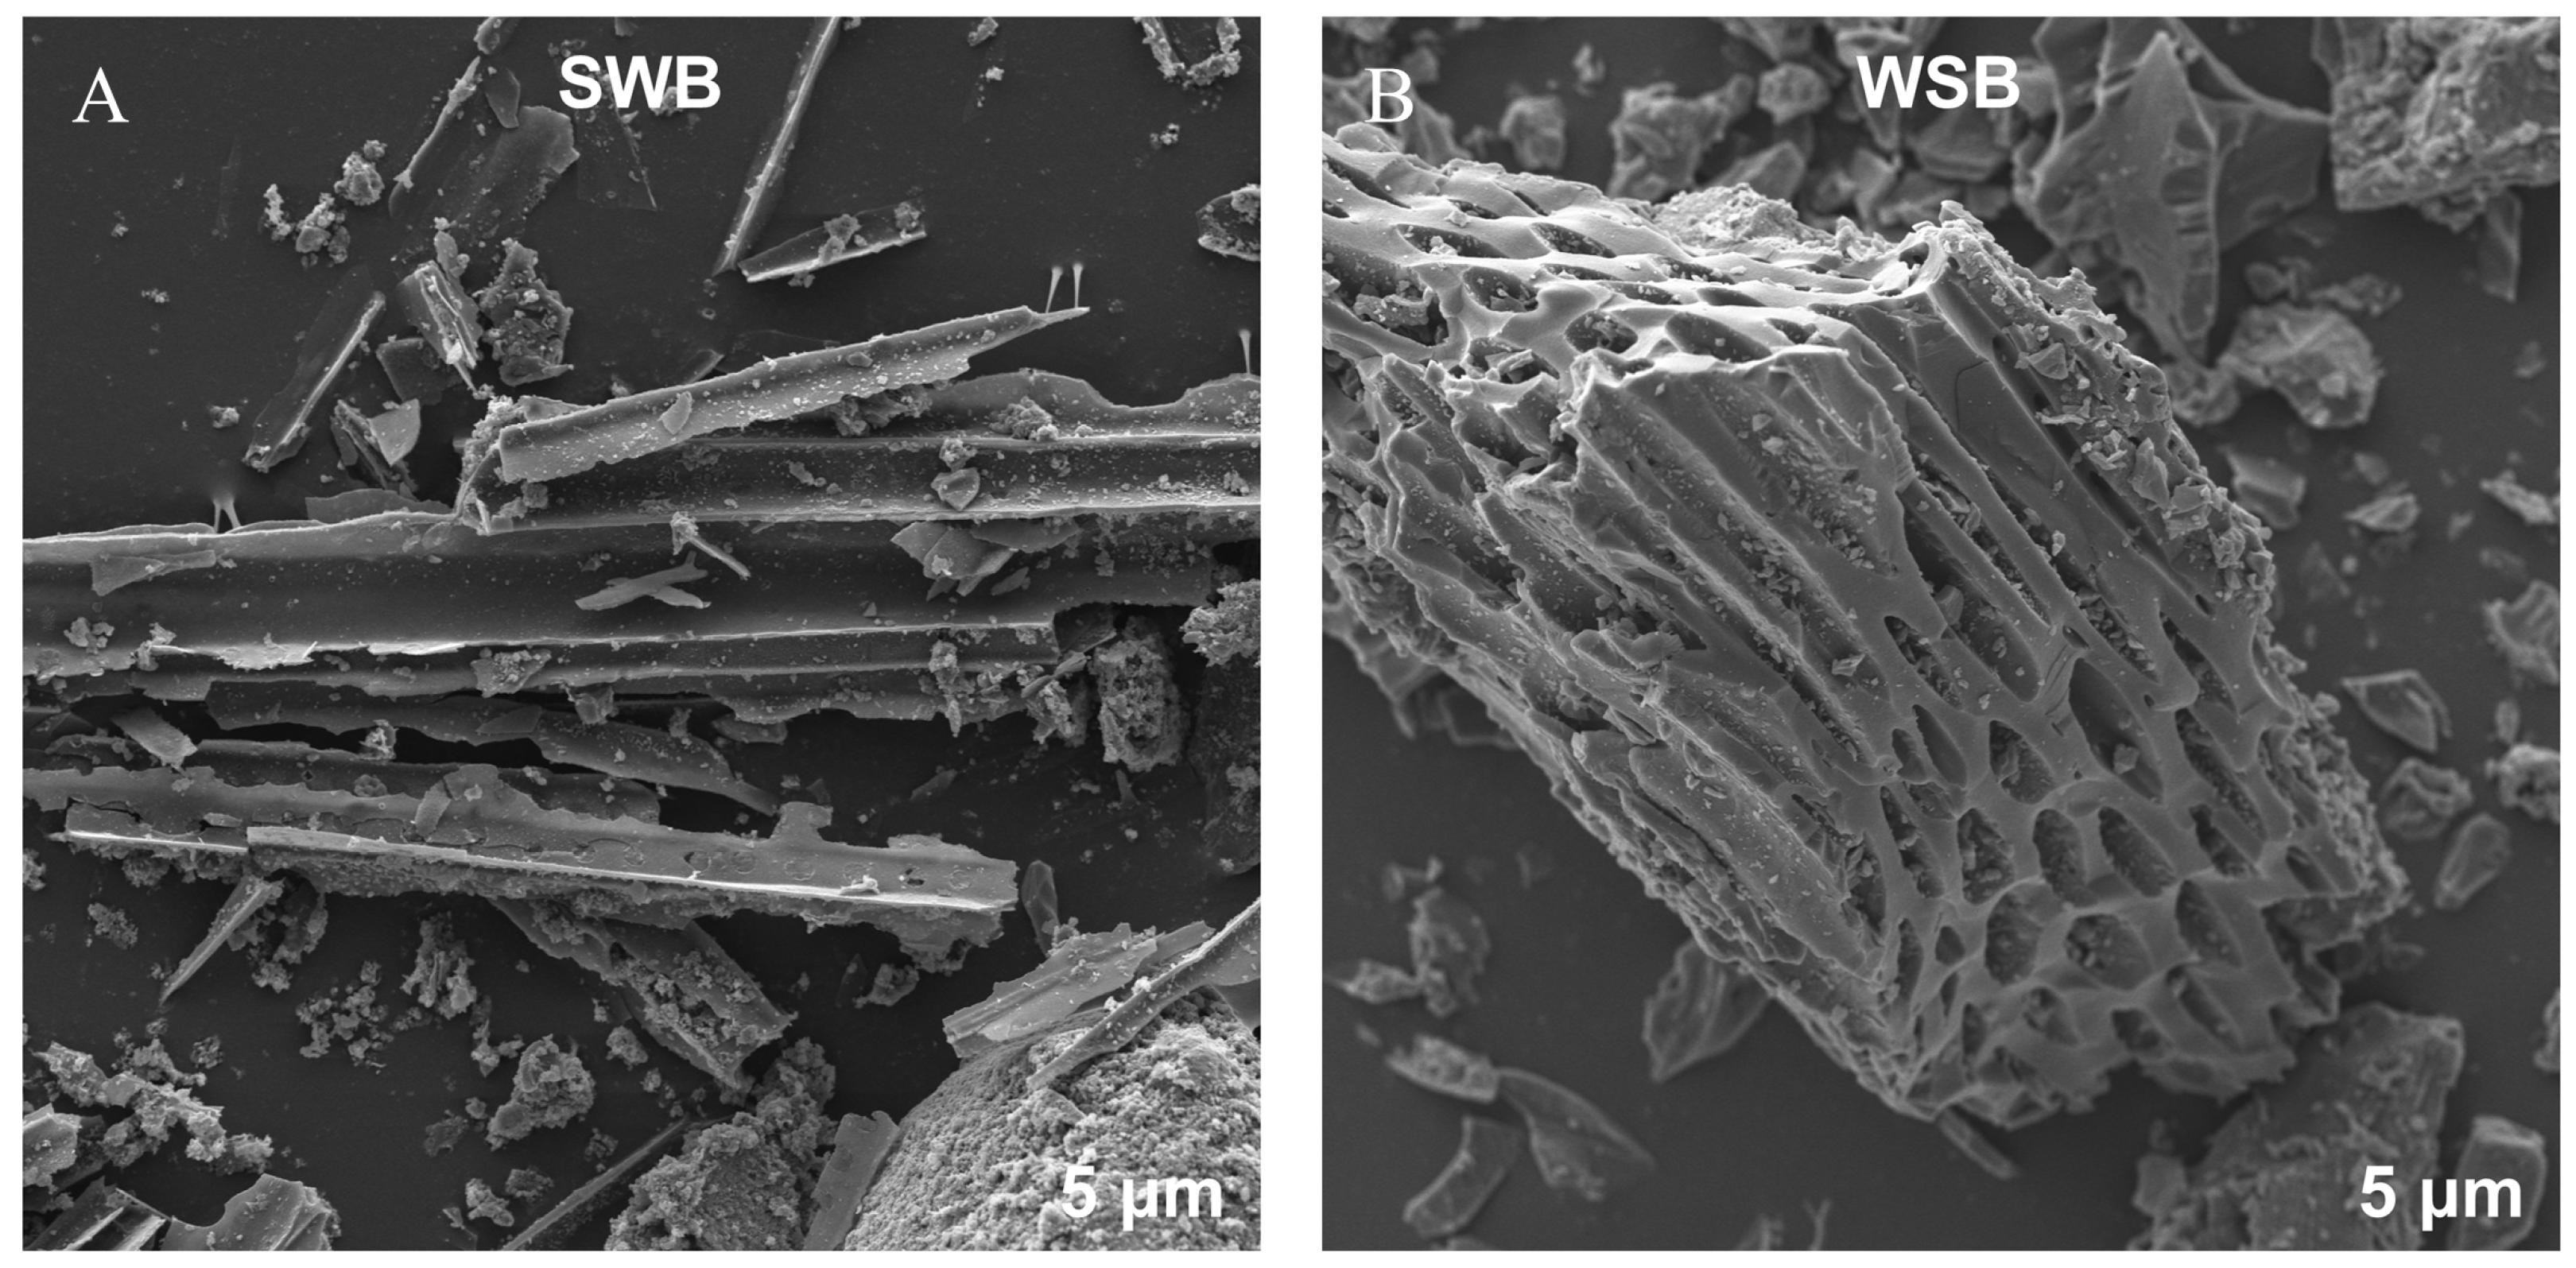
To provide a basis for interpreting treatment effects on microbial CUE and SOC, we first characterized the structural and chemical properties of the two biochars and their effects on soil mineral and functional-group composition. SEM showed clear morphological differences between SWB and WSB. SWB displayed a fibrous and layered structure, whereas WSB exhibited a more porous architecture (Figure 3).
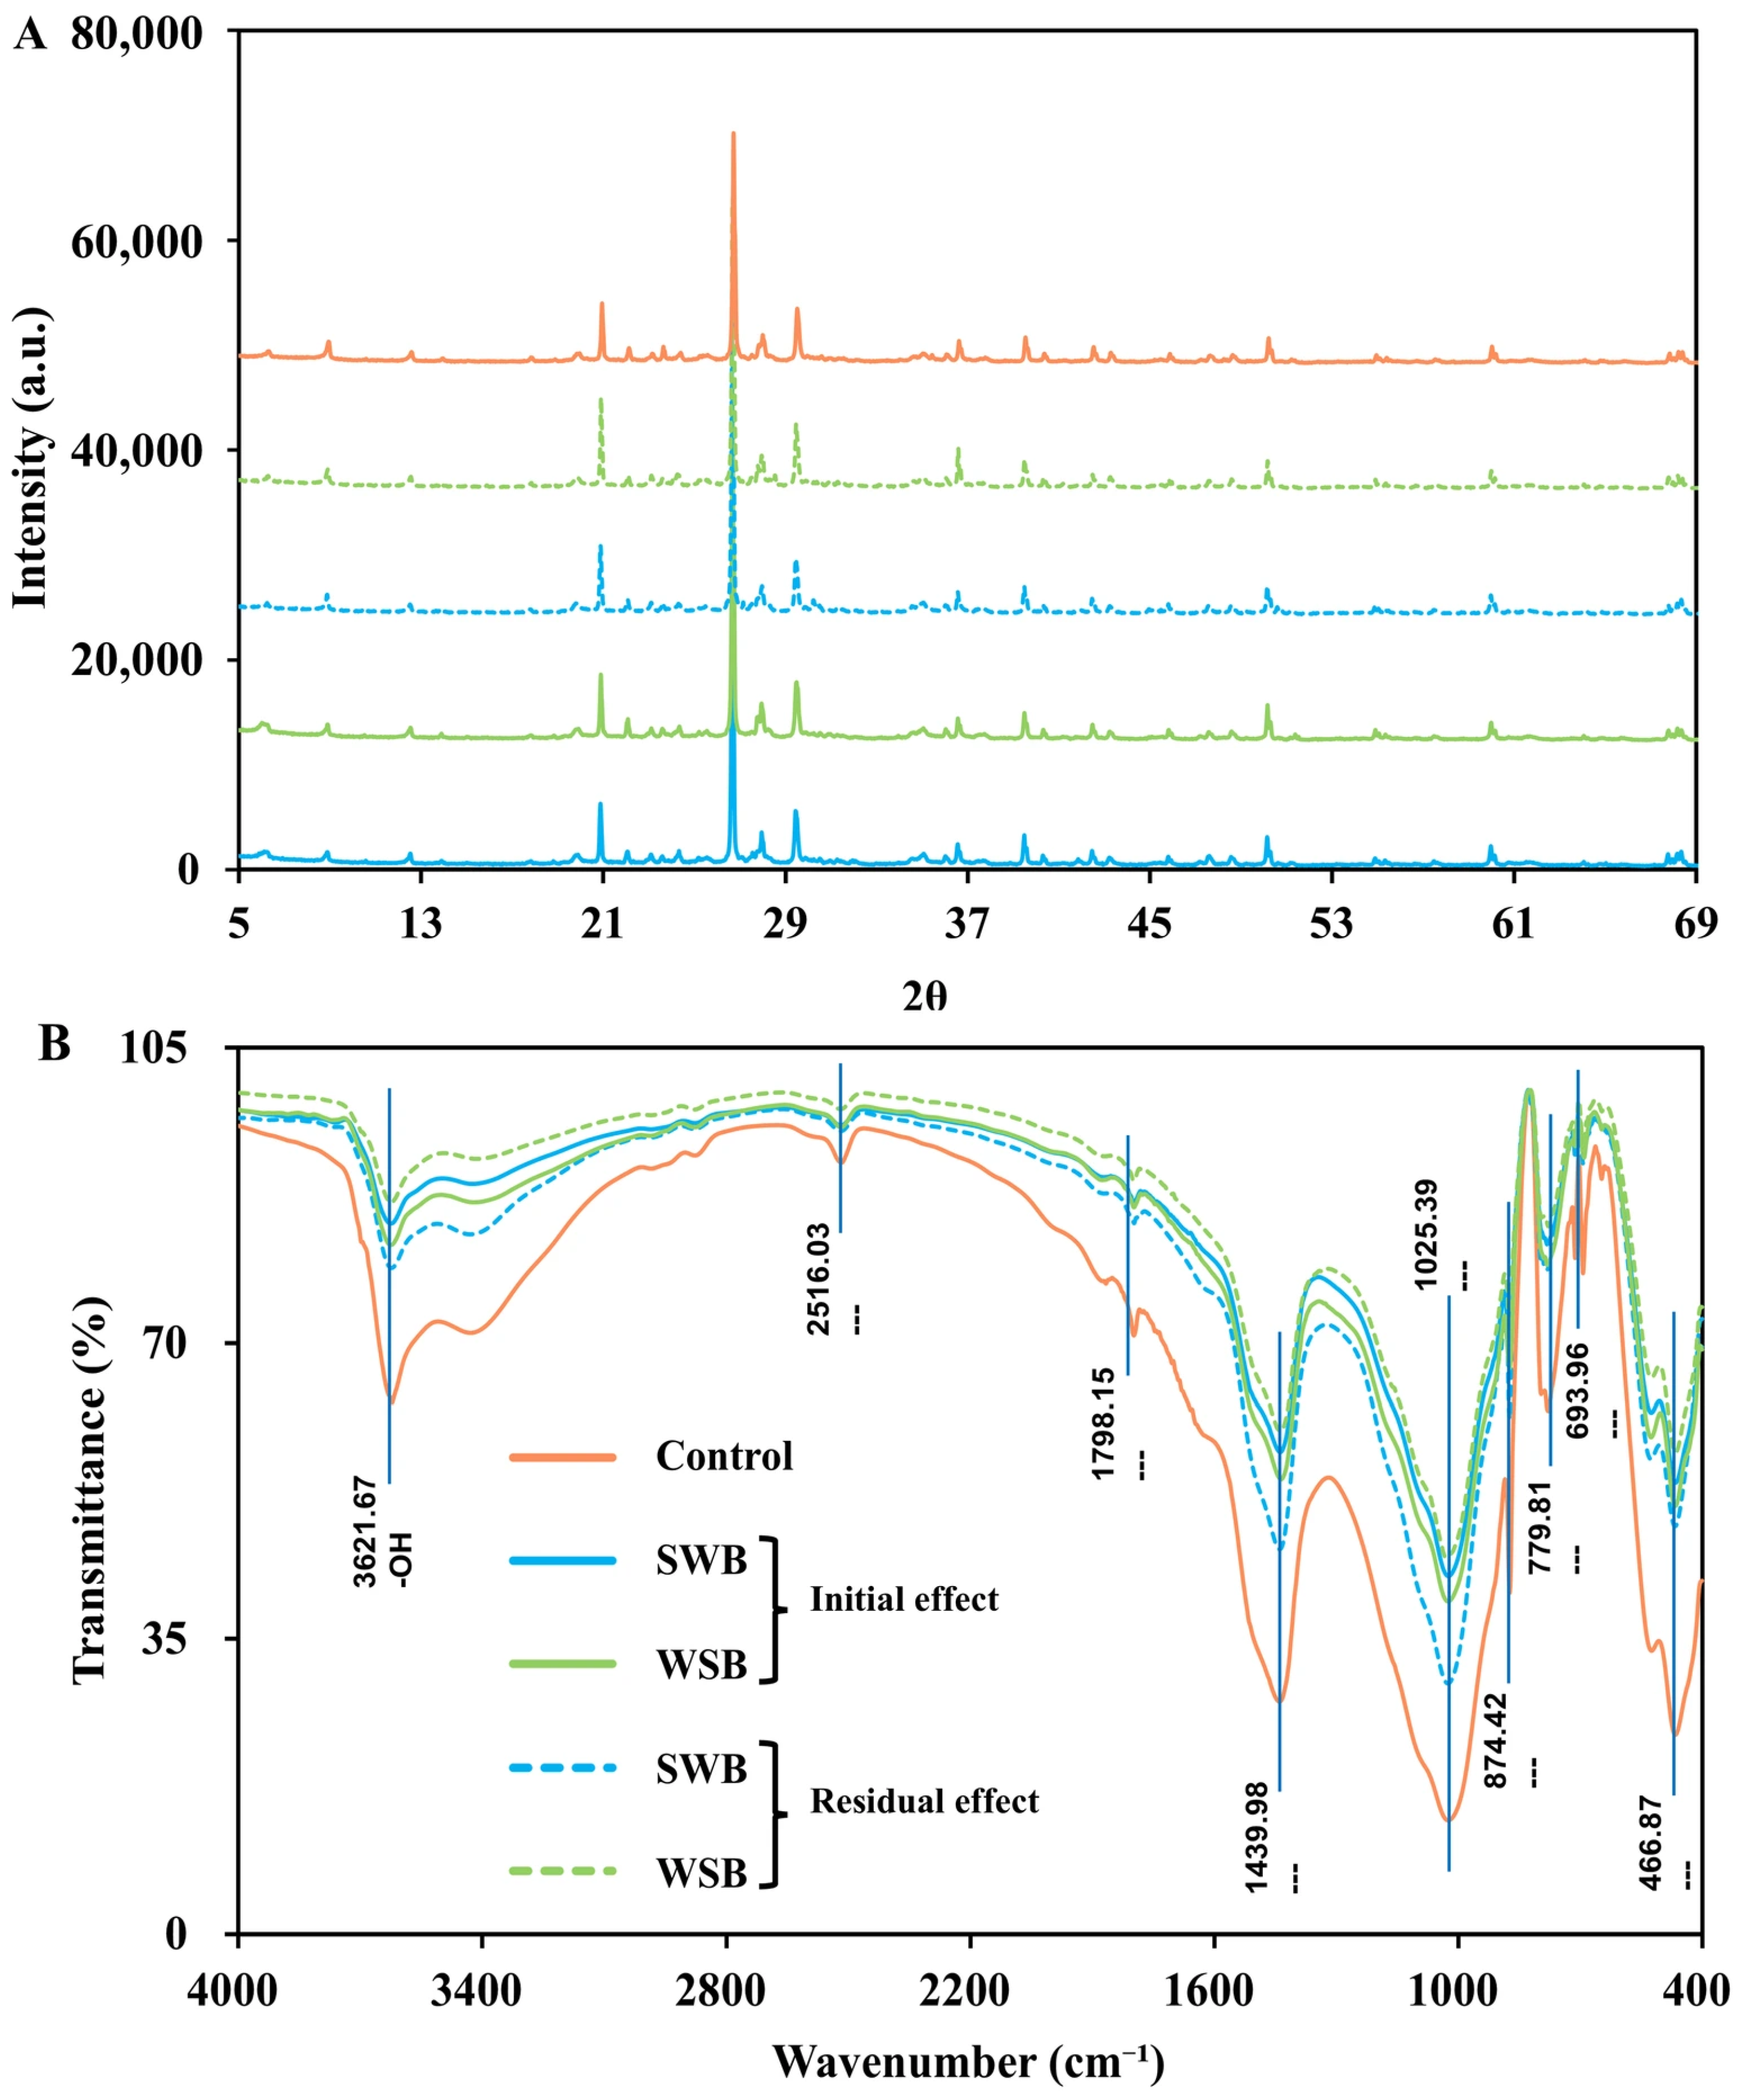
XRD patterns showed that quartz, muscovite, feldspar, calcite, and vermiculite were the dominant mineral fractions across treatments, and no obvious differences in crystalline mineral composition were detected between the initial and residual biochar effects (Figure 4A). XRF analysis further showed similar elemental profiles among the amended soils (Table S1). FTIR spectra indicated that the two biochars had broadly similar functional groups but differed in peak intensity. In the amended soils, however, the overall spectral patterns remained largely unchanged between treatments and across crop cycles. The main peaks at 466.87, 1025.30, 1439.90, and 3621.67 cm−1 corresponded to Si–O–Si deformation, Si–O stretching in clay minerals, CO32− stretching in calcite, and O–H stretching in structural hydroxyl groups, respectively [57,58]. Additional peaks at 2516.03, 1798.10, 874.42, 779.81, and 693.96 cm−1 were assigned to aliphatic C–H, C=O, aromatic C–H, and C–C-related functional groups [59,60,61]. Overall, biochar addition had little effect on the mineralogical and functional-group composition of the soil during either growth season (Figure 4B).

3.2. Soil pH, Zeta Potential, and Water-Dispersible Microaggregate Characteristics

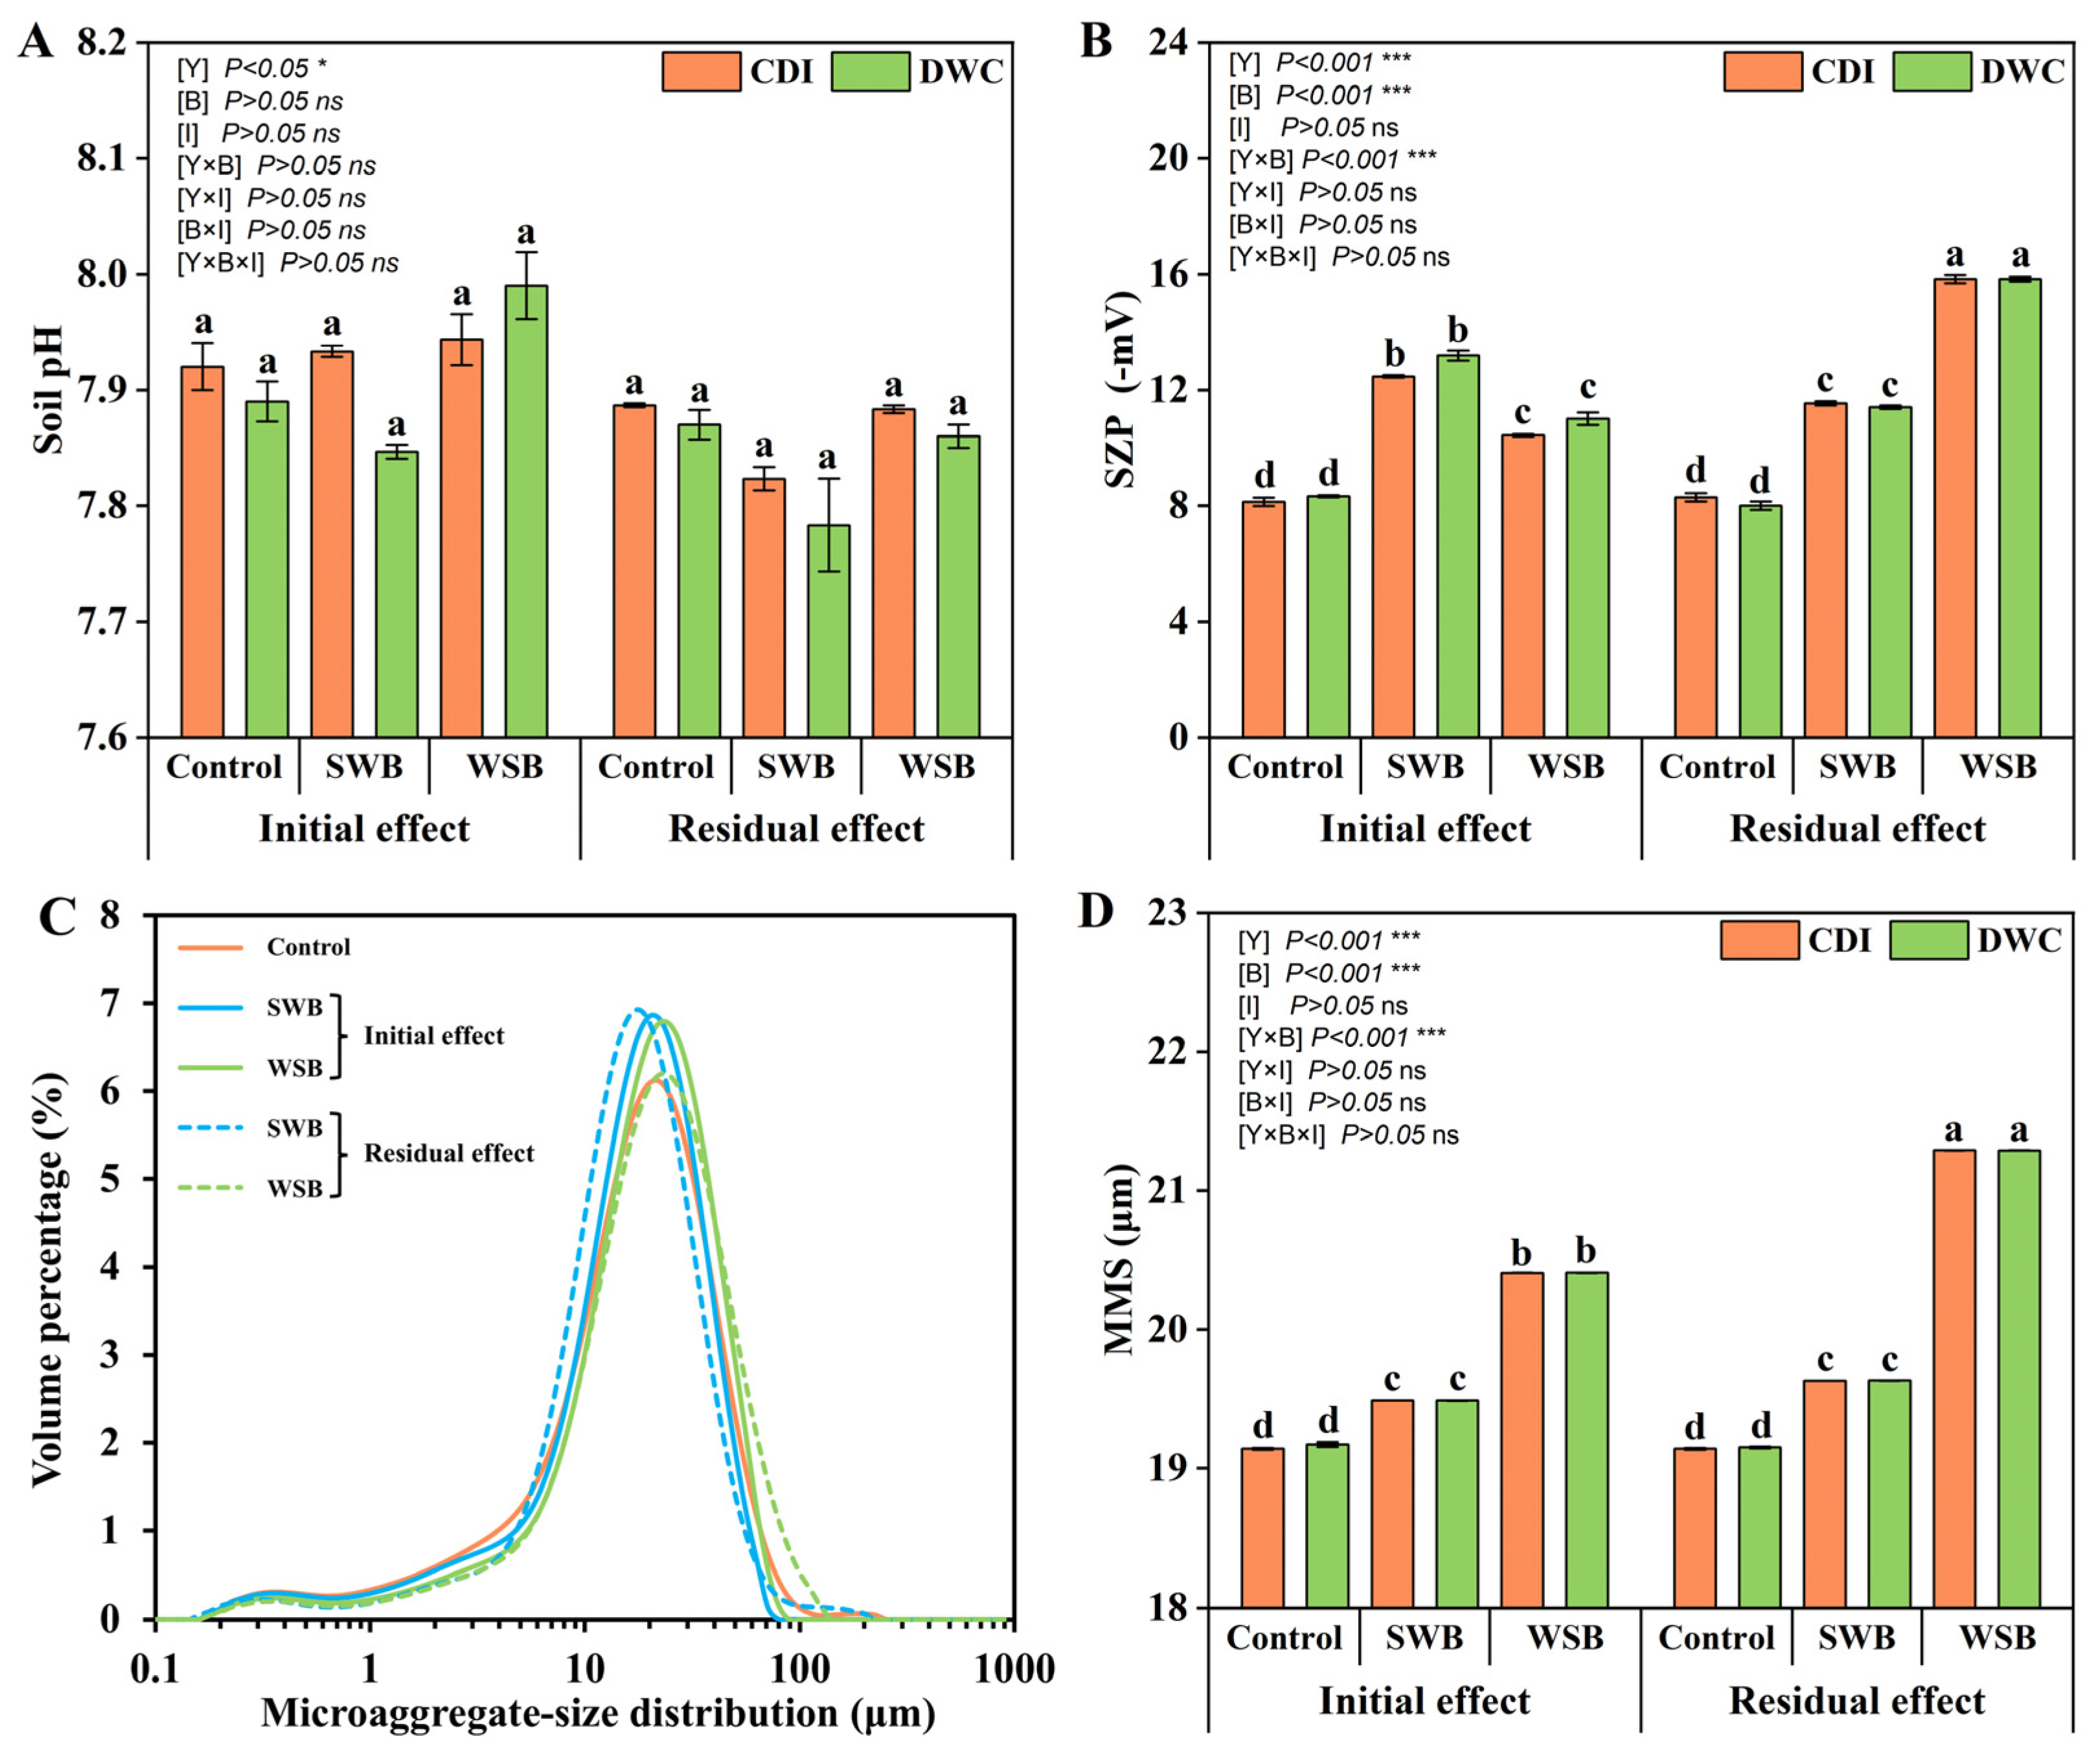
Soil pH was not significantly affected by biochar amendment or irrigation regime (p = 0.105 and 0.777, respectively). Although both biochar treatments, particularly WSB, tended to show higher pH than the control under both CDI and DWC, the differences were not significant. Across crop seasons, soil pH decreased by an average of 1.17 units from year 1 to year 2 (Figure 5A). Changes in SZP were observed mainly in response to biochar amendment. Relative to the initial soil value (−8.2 mV), SWB and WSB reduced SZP by 56.0% and 30.2%, respectively, during the initial effect. Under the residual effect, SZP decreased further by 40.8% in SWB and 94.4% in WSB. Irrigation regime had no significant effect on SZP (p = 0.228) (Figure 5B).
Water-dispersible microaggregate-size distribution also differed among treatments. The mean microaggregate size (MMS) of SWB and WSB were 76.4 and 59.9 μm, respectively, compared with 19.1 μm for the unamended soil (Table 1). Under the residual biochar effect, the proportion of microaggregates < 8 μm decreased from 21.9% in the control soil to 15.7% in the WSB-amended soil and 14.9% in the SWB-amended soil (Figure 5C). WSB increased MMS by 6.5% under the initial effect and by 11.2% under the residual effect, whereas SWB had only minor effects. MMS did not differ significantly between CDI and DWC (p = 0.324) (Figure 5D).

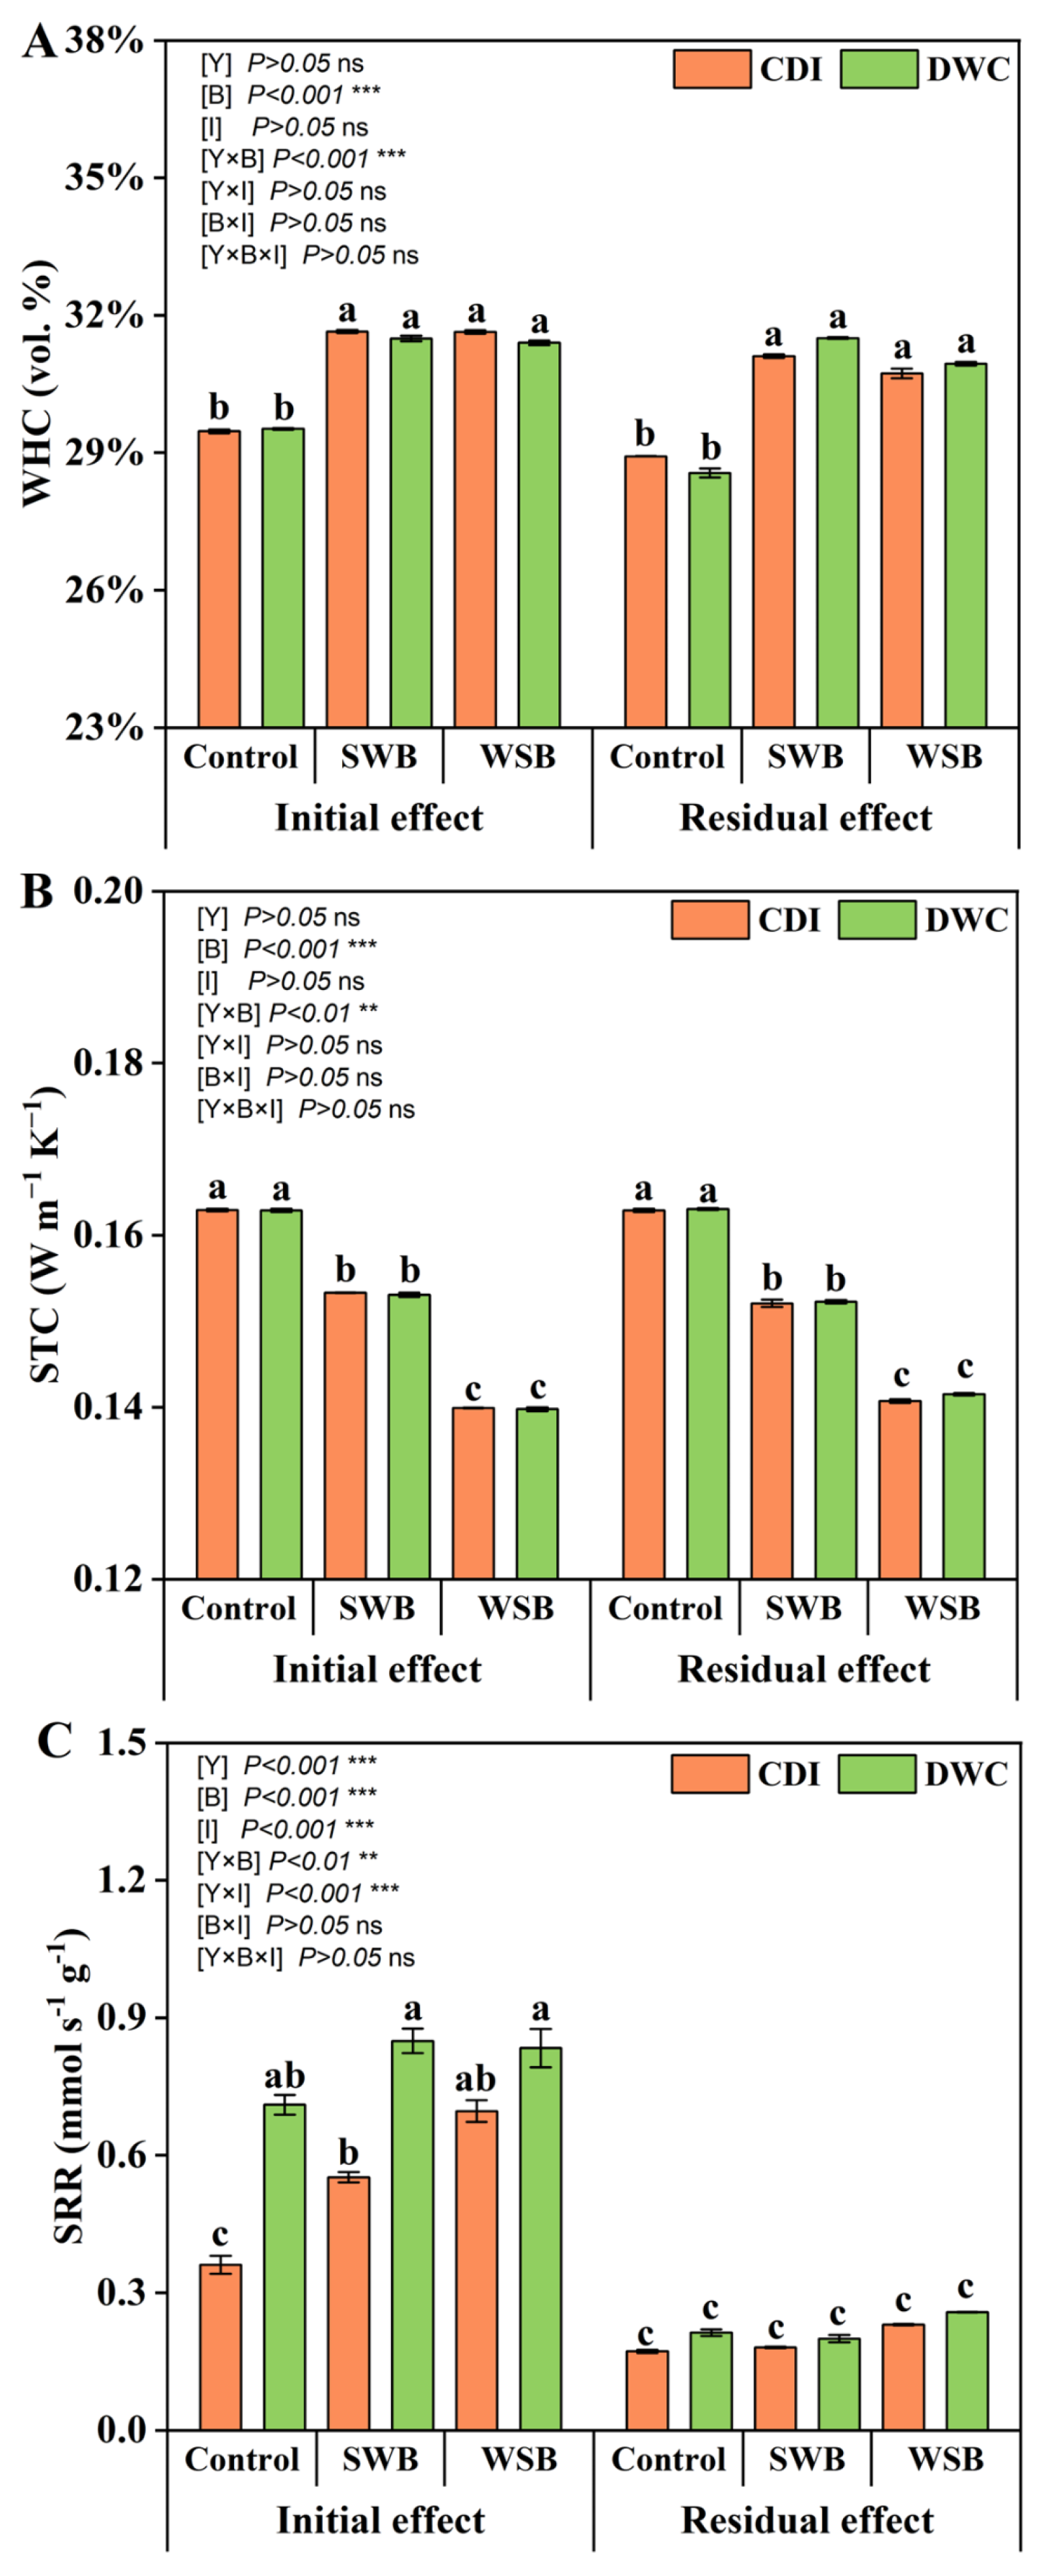
3.3. Soil Water-Holding Capacity, Thermal Conductivity, and Respiration Rate

Biochar significantly increased soil WHC under reduced irrigation. Across the two crop seasons, WHC increased by 7.0–8.9% relative to the control, whereas no significant difference was detected between CDI and DWC (p = 0.783) (Figure 6A). Biochar also reduced STC. Under the initial effect, SWB and WSB reduced STC by 6.0% and 14.2%, respectively, compared with the control. Under the residual effect, the reductions were 6.6–13.4%, following the same overall pattern. Neither the difference between the initial and residual effects nor the difference between CDI and DWC was significant (p = 0.679 and 0.613, respectively) (Figure 6B). Total SRR also increased following biochar amendment. Under the initial effect, SRR increased by 30.8–42.8% over the control, with the largest increase observed in WSB. Under the residual effect, SWB had little effect on SRR, whereas WSB increased SRR by 26.8%. Across biochar treatments, DWC increased total SRR by 14.9–48.8% relative to CDI (Figure 6C).

3.4. Soil Total C and N, C/N Ratio, and Min N

Biochar increased both TC and TN, with the strongest responses observed in WSB-amended soils. Under the initial effect, TC was increased by 77.3–113.8% and TN by 23.8–63.2% relative to the control. Under the residual effect, TC remained 77.3–88.2% higher and TN 42.3–42.9% higher than the control. Relative to CDI, DWC decreased TC slightly by 3.9% but increased TN by 8.9% (Table S2). The soil C/N ratio was also altered by biochar amendment. Under the initial effect, SWB increased C/N ratio by 3.7- to 4.9-fold. Under the residual effect, C/N was 1.2- to 2.7-fold lower than under the initial effect. Compared with CDI, DWC reduced C/N ratio by 10.2–11.1% (Table S2). Min N did not differ significantly among biochar treatments (p = 0.166). However, Min N was 1.2-fold higher under the residual effect than under the initial effect. DWC also increased Min N by 6.2–17.2% relative to CDI (Table S2).

3.5. Microbial Biomass and Carbon Use Efficiency, and Soil Organic Carbon

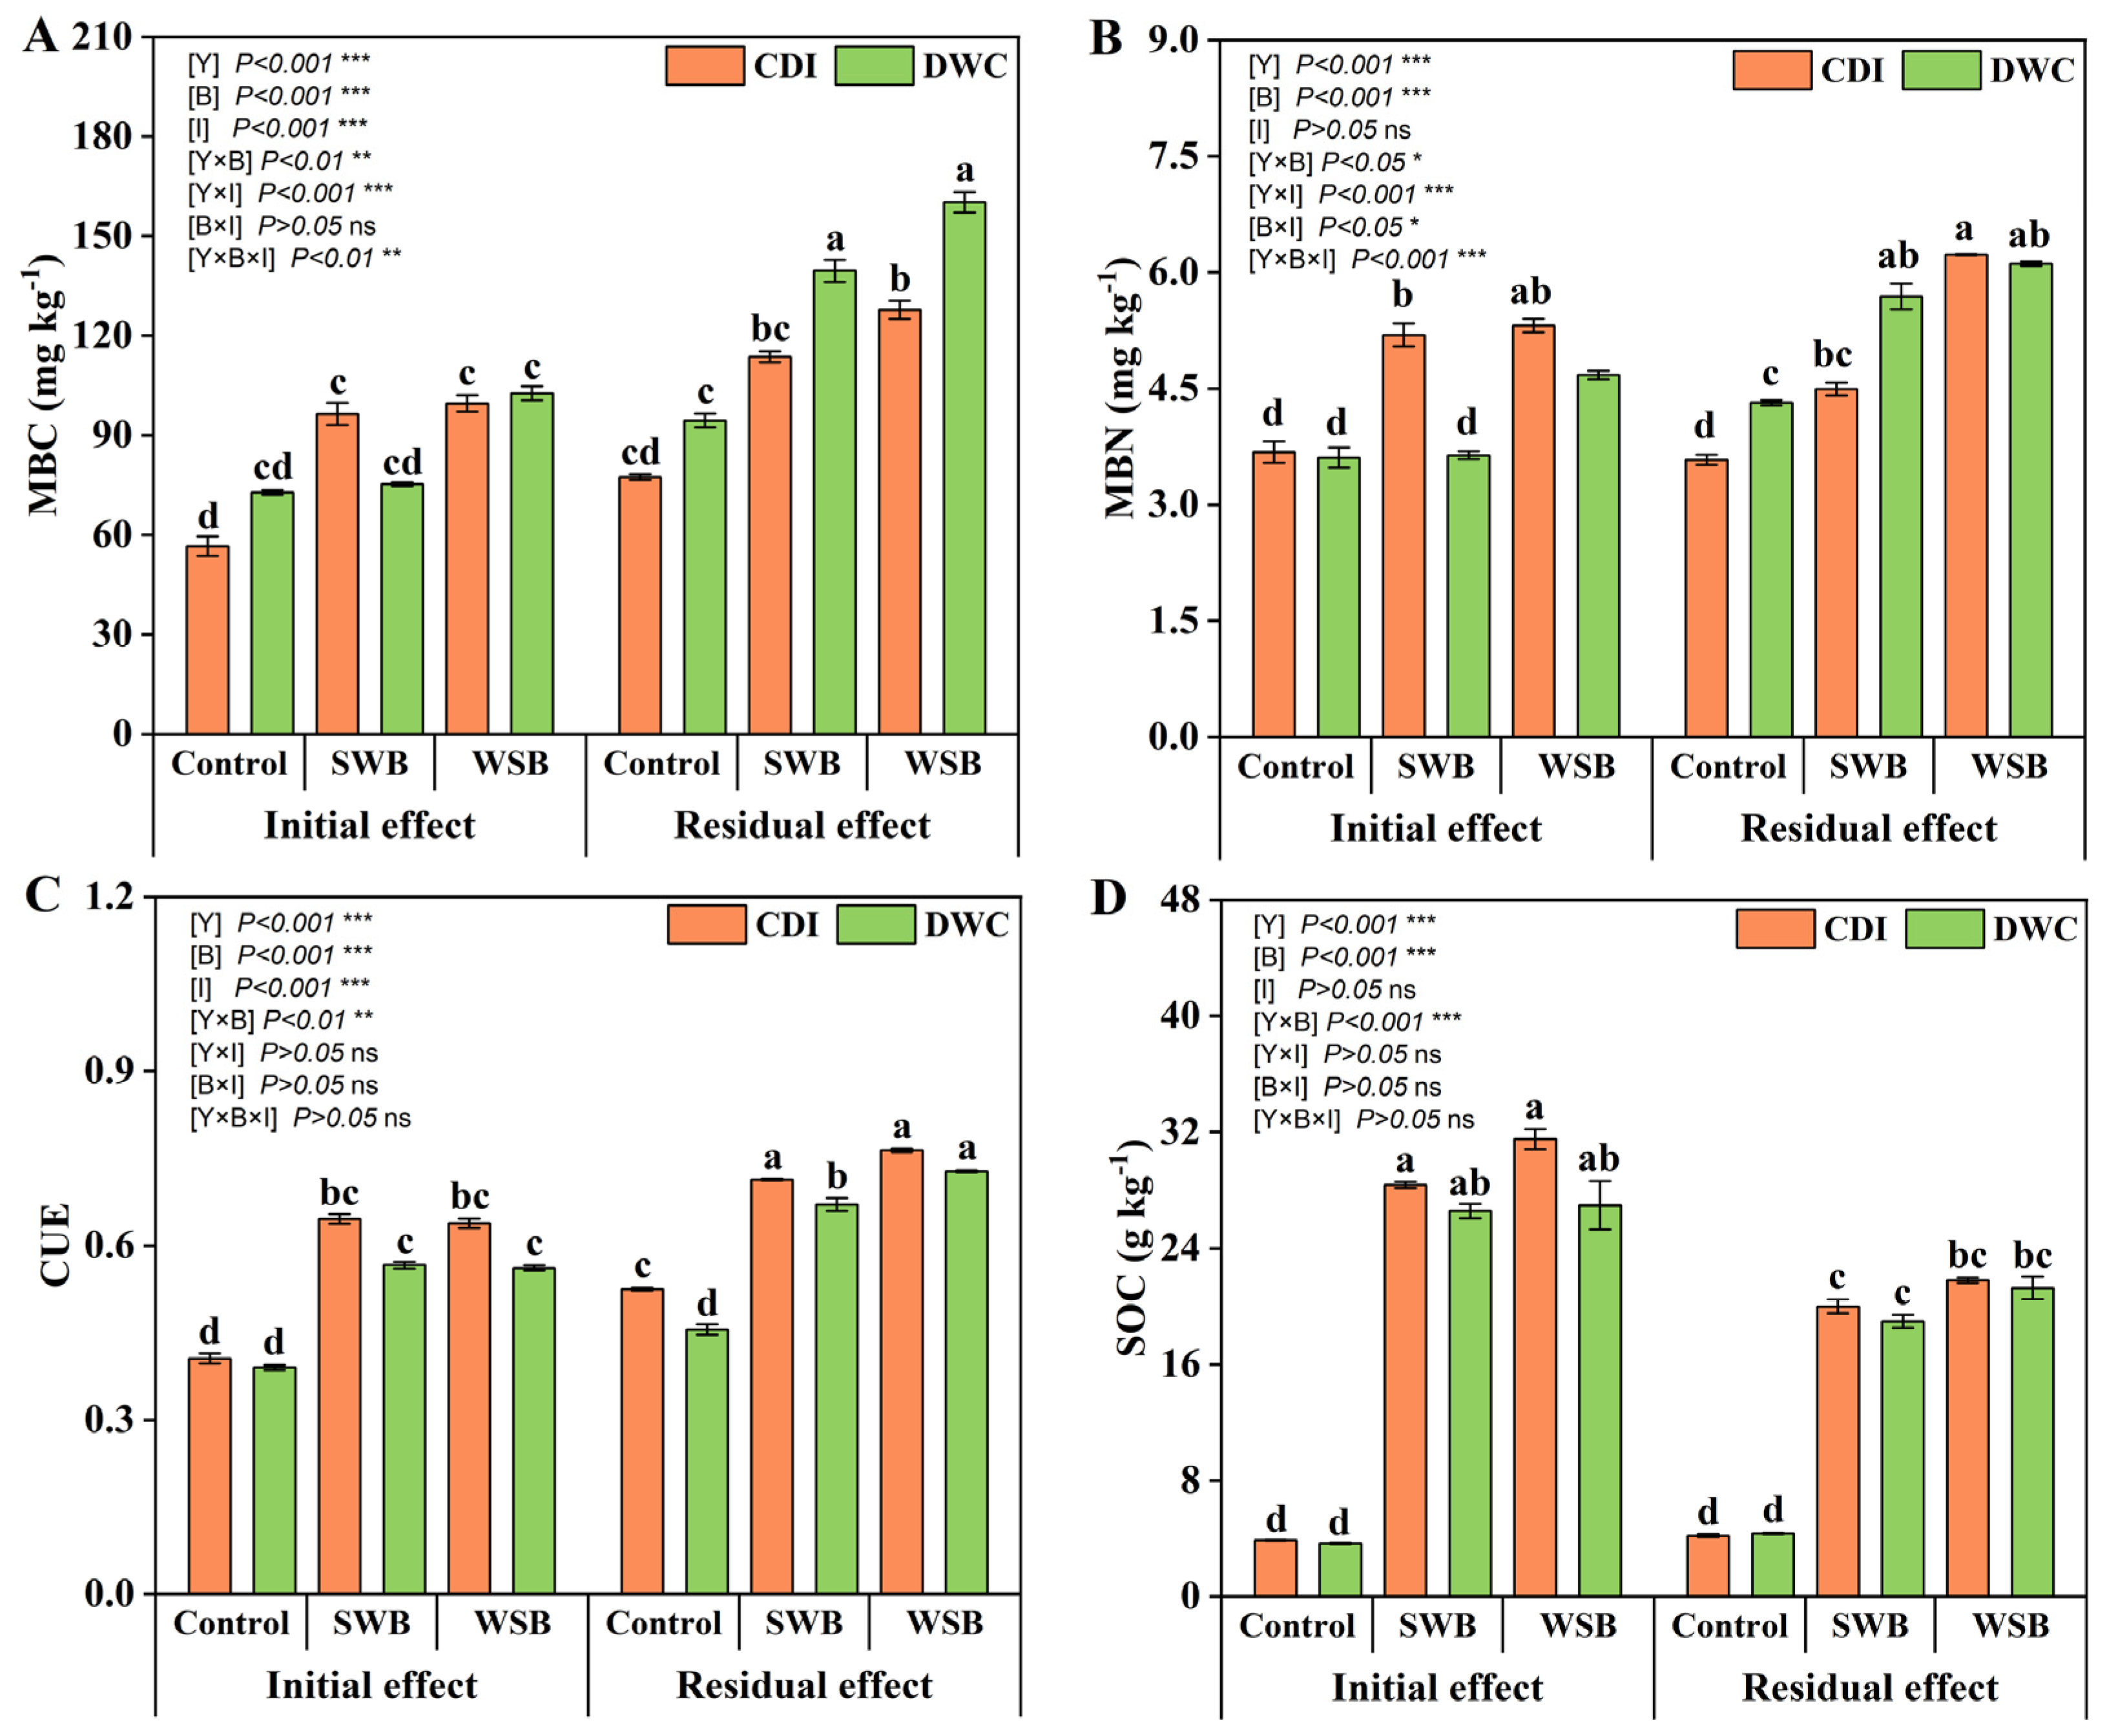
Biochar amendment increased MBC and MBN, with stronger responses generally observed in WSB-amended soils. Relative to the control, MBC was increased by 32.7–67.6% due to biochar addition, and the increase was more pronounced under DWC. MBN showed a similar response with an increase of 21.1–56.2%, although irrigation regime had no significant effect on MBN (p = 0.512) (Figure 7A,B).
Biochar increased microbial CUE, again with the strongest response under WSB. Across the two growth seasons, CUE was 41.1–52.3% higher in biochar-amended soils than in the control soil without biochar. To represent the moisture conditions associated with CDI and the wet and dry compartments of DWC, soil moisture was adjusted to 20%, 20%, and 12% for CDI, the wet-zone of DWC, and the dry-zone of DWC, respectively. Under these moisture conditions, CUE was 7.4–10.2% lower under DWC than under CDI (Figure 7C).
WSB amendment increased SOC by 6.3- to 6.7-fold relative to the control in the first year. SOC remained elevated by 3.5- to 4.0-fold in the second year, although these values were 33.5% lower than those observed in the initial year. Across biochar treatments, DWC reduced SOC by 3.0–10.3% relative to CDI (Figure 7D).

3.6. Importance and Correlation Analysis of Soil Variables for CUE and SOC

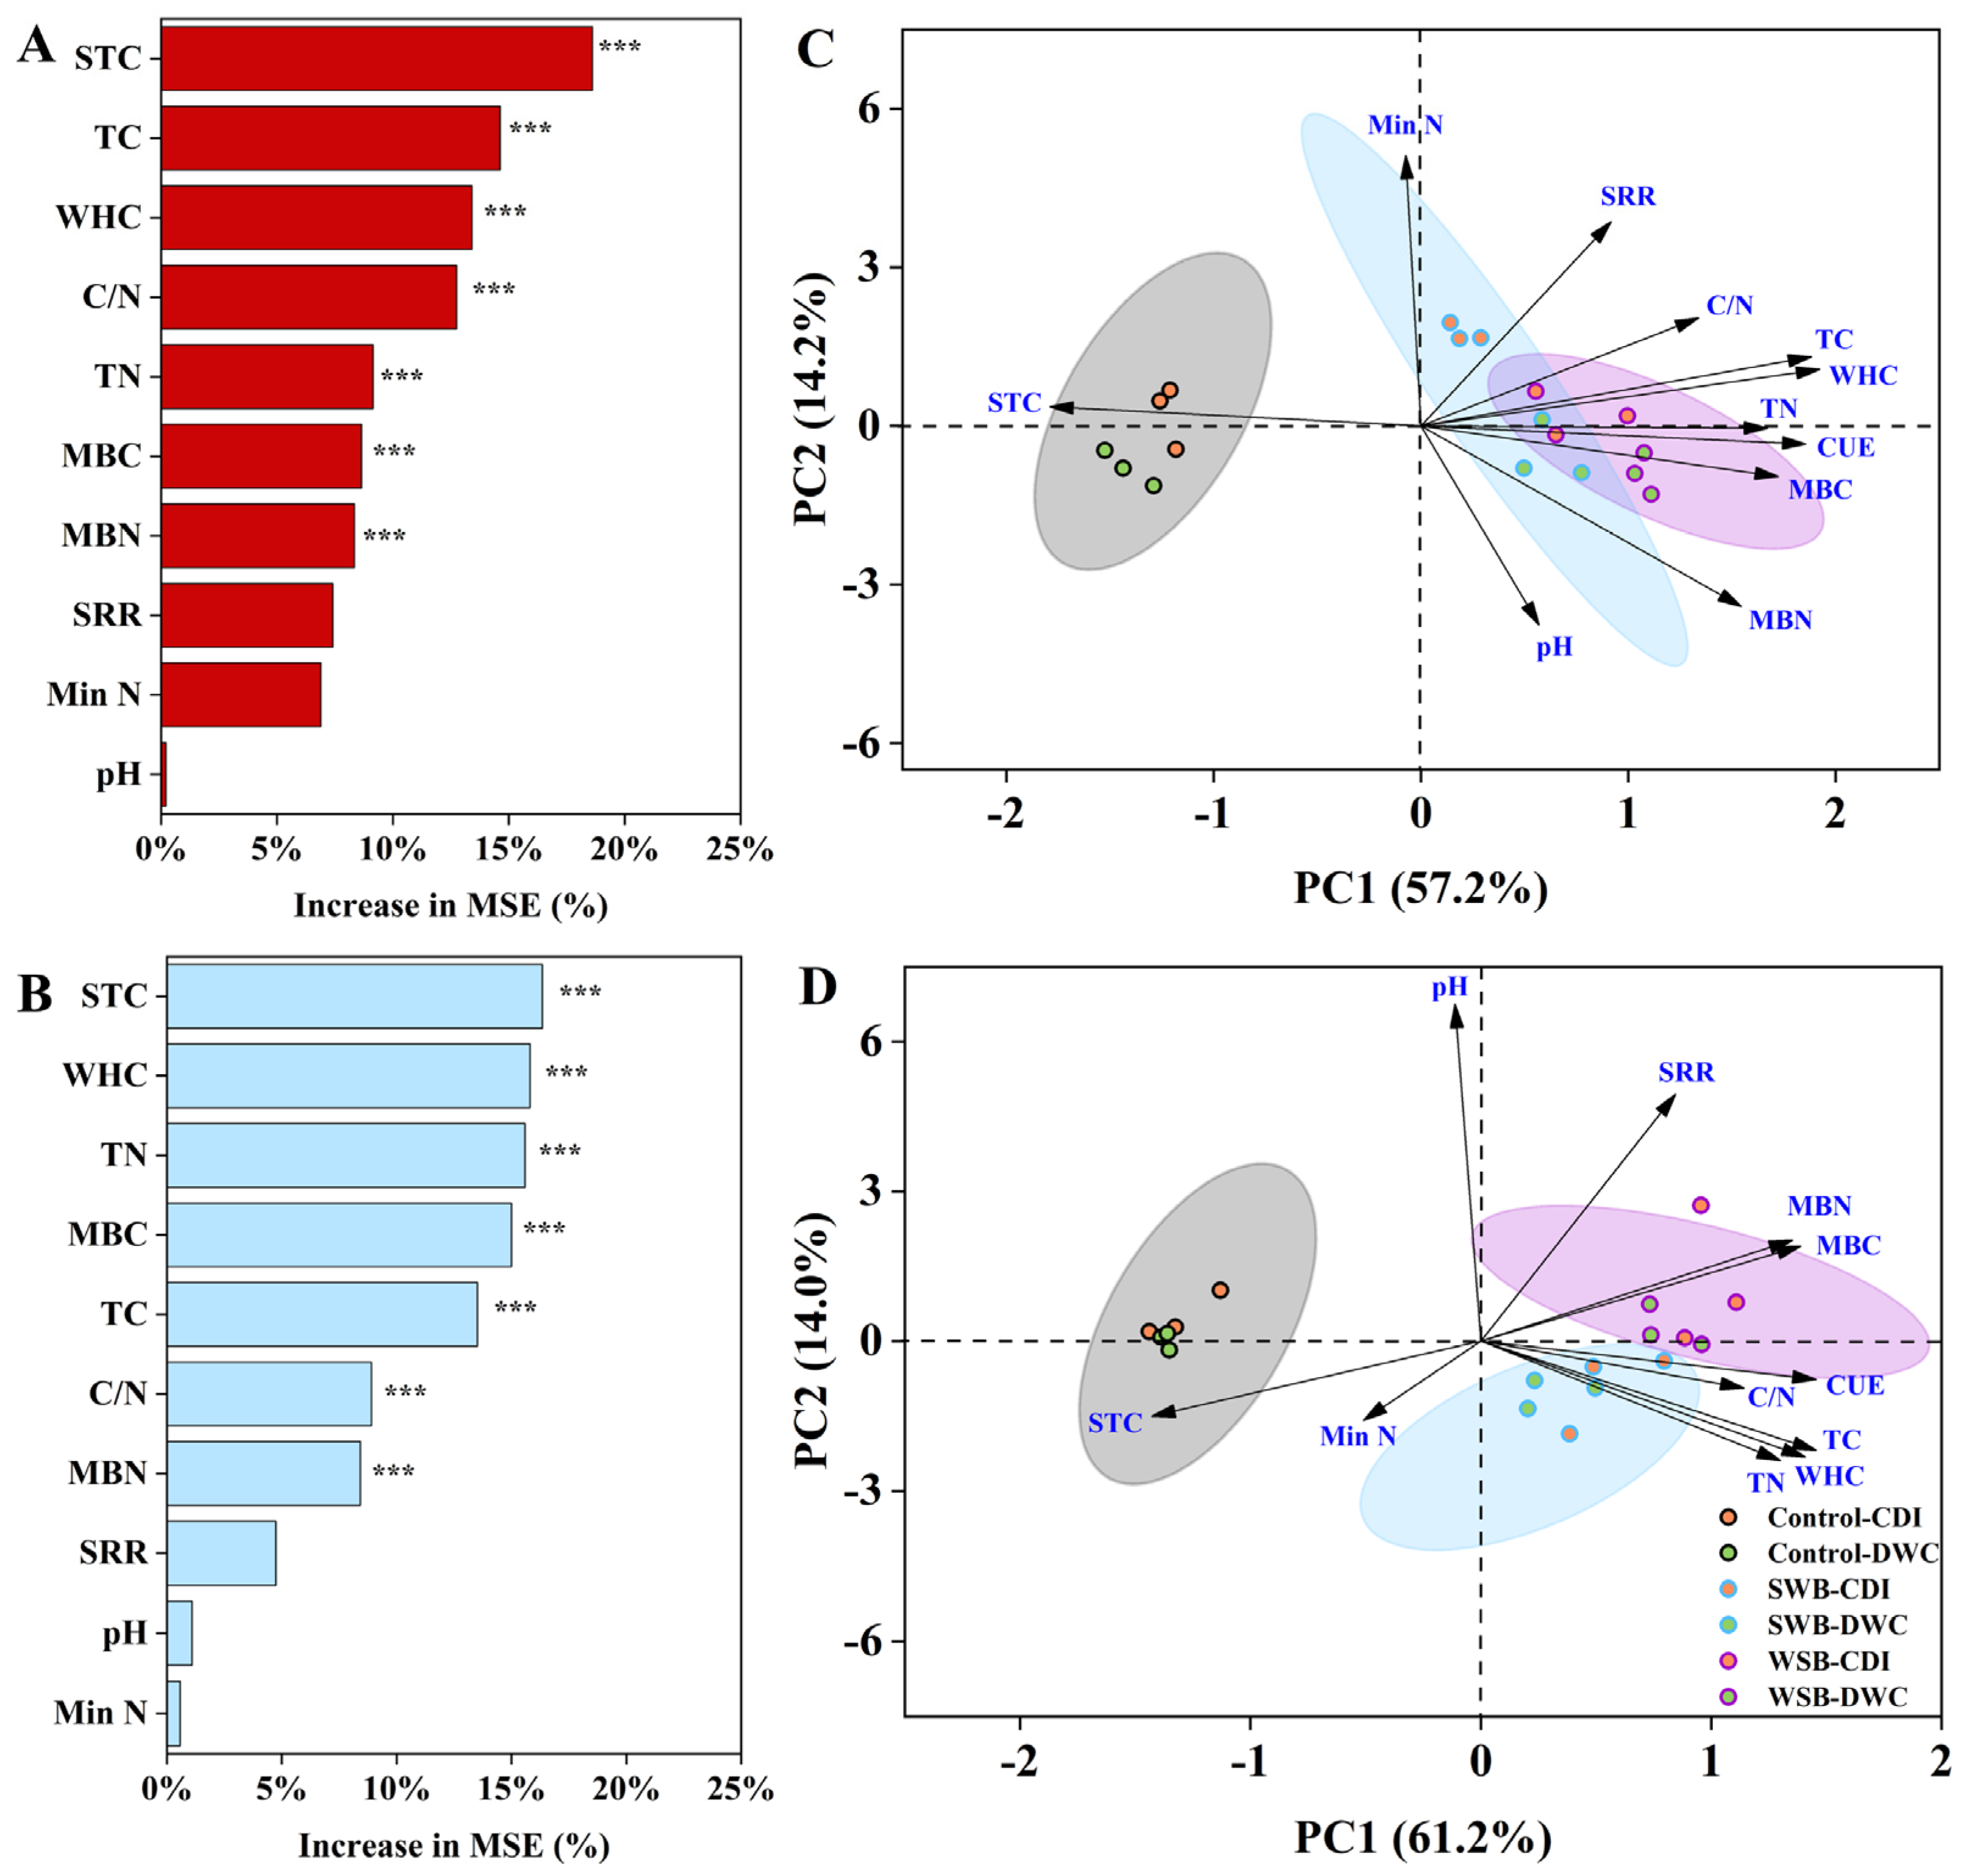
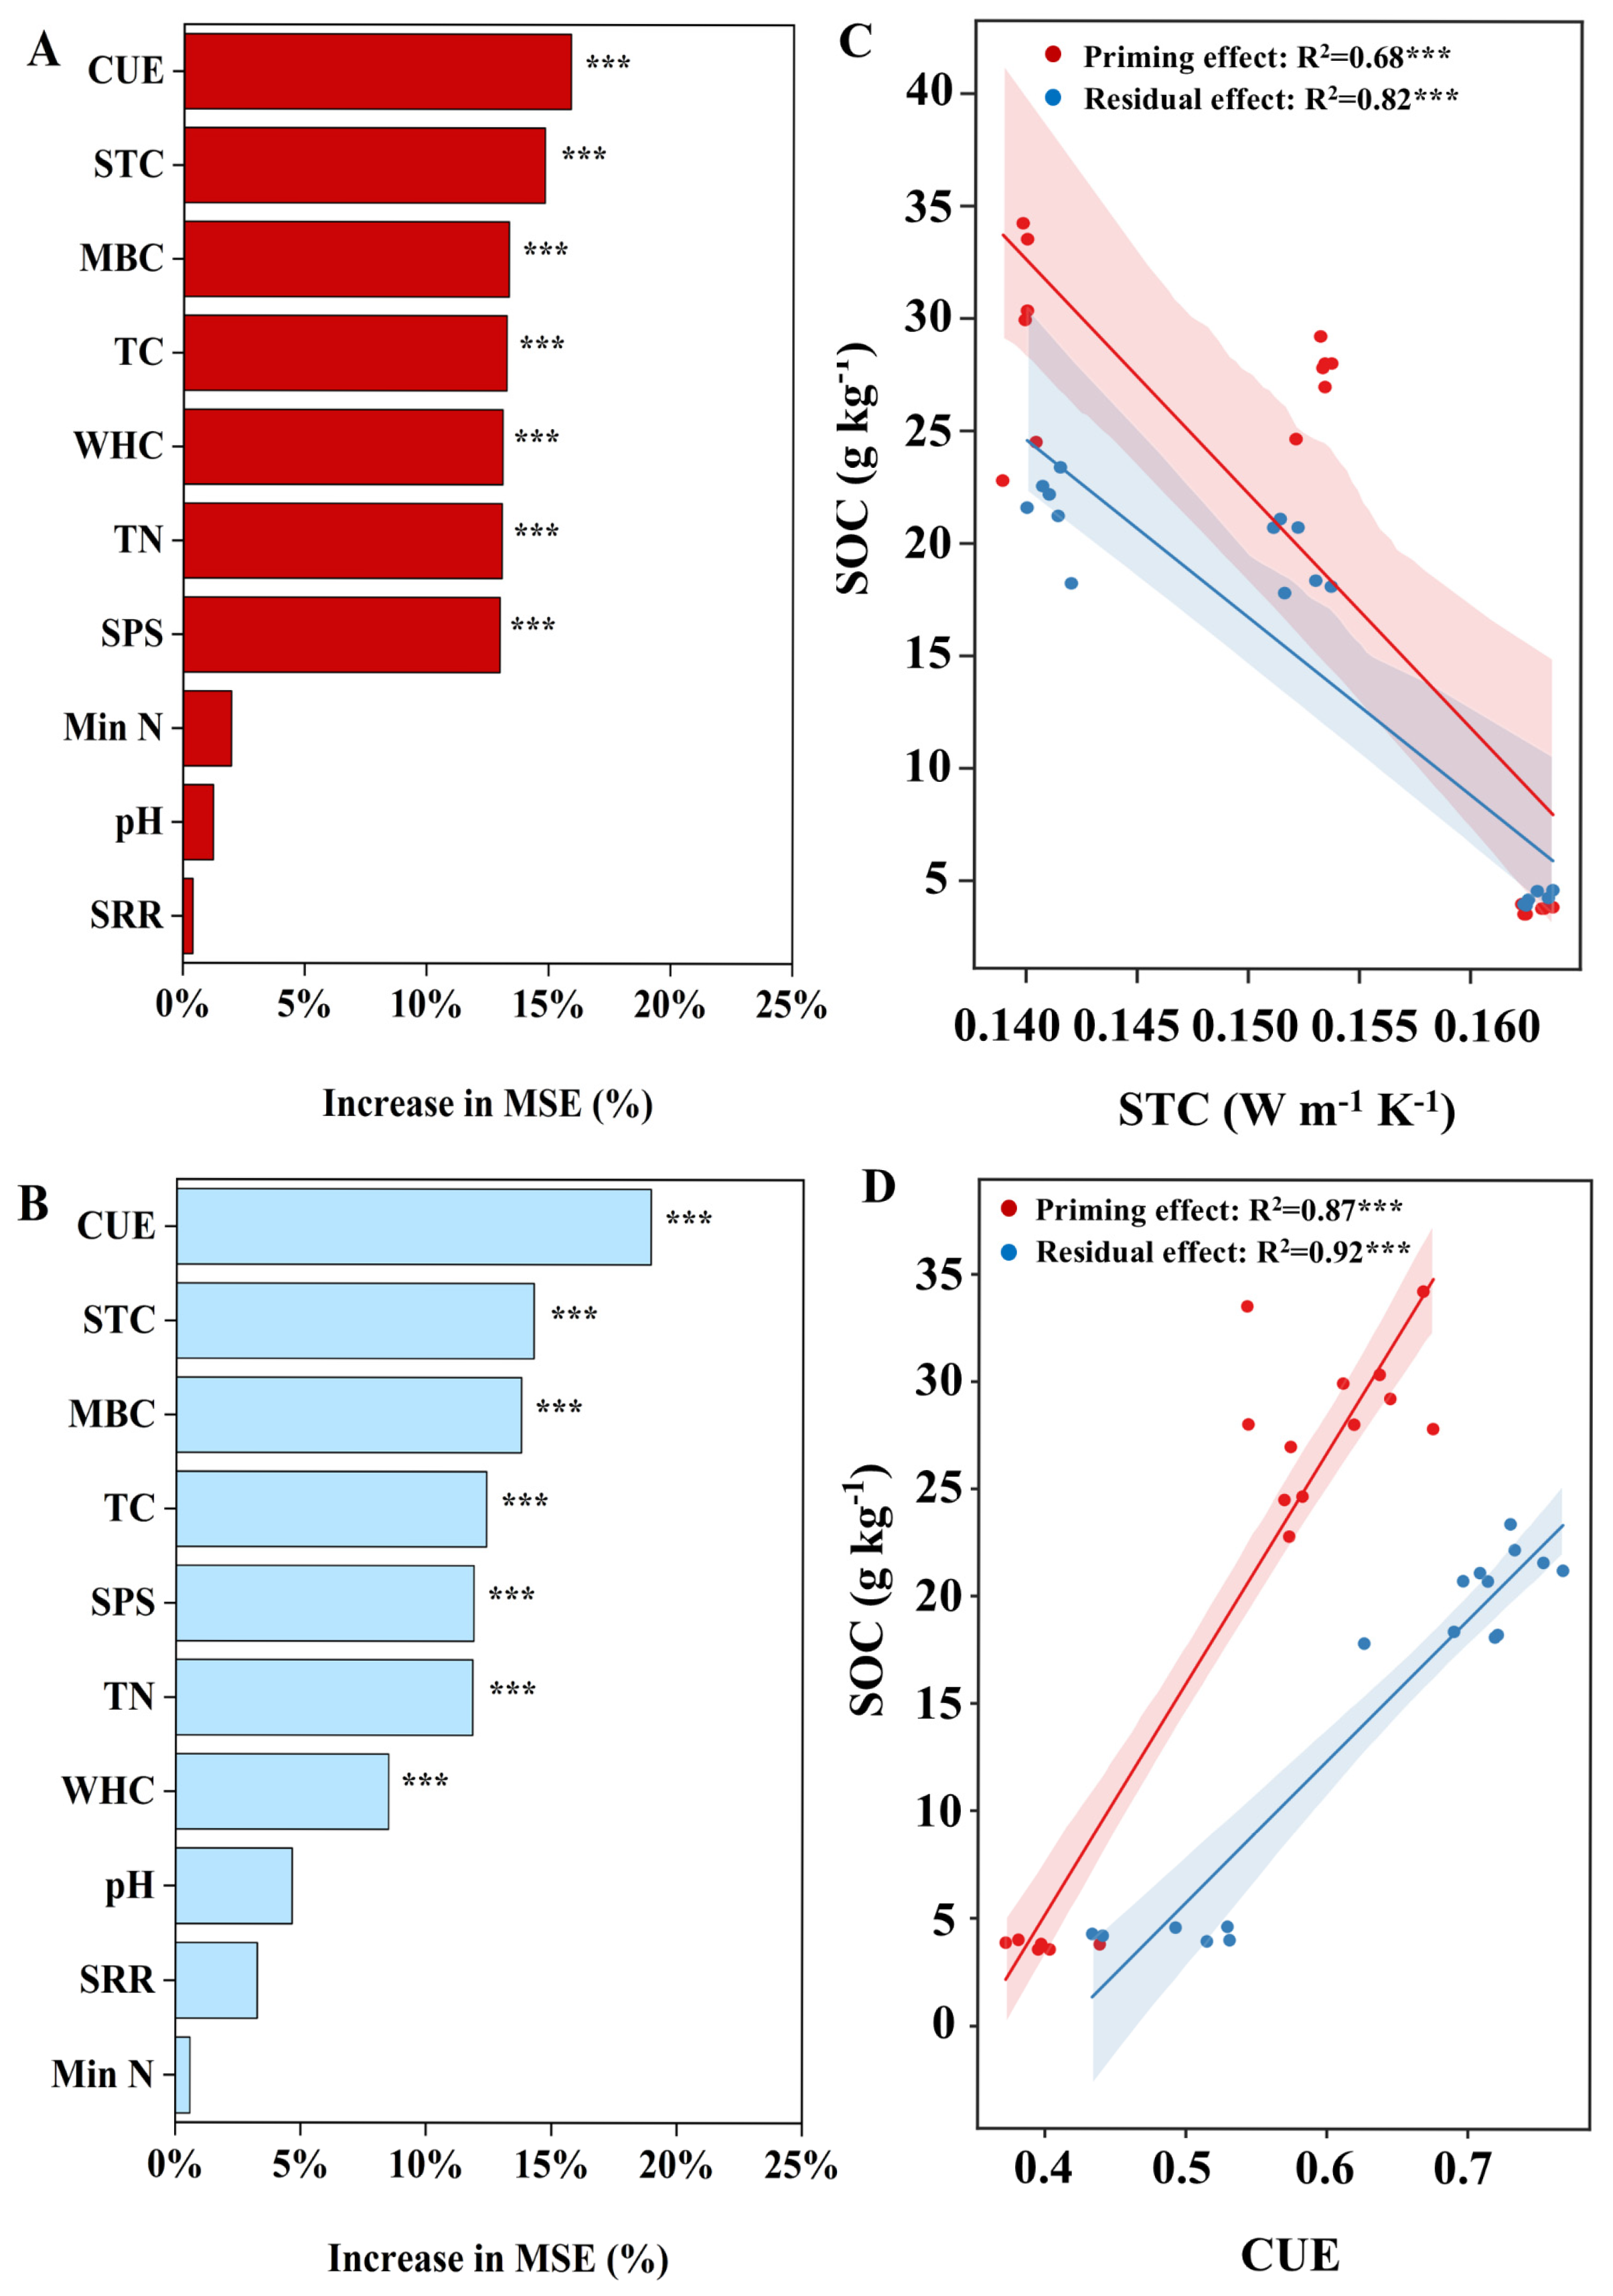
Random forest analysis ranked STC as the variable with the highest importance score for explaining variation in microbial CUE under both the initial and residual biochar effects, regardless of irrigation regime (Figure 8A,B). PCA based on soil physicochemical and microbial variables further separated the treatment groups. PC1 explained 57.2% of the total variance under the initial effect and 61.2% under the residual effect. WSB and SWB treatments were positioned mainly on the positive side of PC1 and were associated with higher CUE, TC, TN, MBC, and WHC, whereas the control clustered on the negative side of PC1 and was associated with higher STC (Figure 8C,D). For SOC, random forest analysis ranked STC and CUE among the most important explanatory variables under both the initial and residual effects (Figure 9A,B). Pearson correlation analysis showed that SOC was positively correlated with CUE and negatively correlated with STC (Figure 9C,D). SOC was also positively correlated with MBC, TC, TN, WHC, and MMS (Figure S1).

4. Discussion

The present study shows that biochar amendment, particularly WSB, reshaped the soil physical environment, altered microbial carbon-use patterns, and increased SOC under both CDI and DWC. These responses were not restricted to a single soil property. Instead, biochar simultaneously increased MMS and WHC, while reducing STC. These physical changes occurred together with higher microbial CUE and greater SOC, suggesting that biochar-mediated modification of the soil physical environment was closely associated with soil carbon responses under fluctuating moisture conditions. This pattern is interpreted as a coordinated soil physical–microbial–carbon response rather than evidence that STC alone directly regulates microbial CUE or SOC.
Biochar amendment significantly reduced STC during both the initial and residual phases, and this effect was generally stronger and more persistent under WSB than SWB (Figure 6B). The decline in STC was accompanied by increases in MMS and WHC, particularly in WSB-amended soils (Figure 5C,D and Figure 6A). These responses are consistent with the porous structure of biochar and its capacity to alter soil particle arrangement, pore continuity, and water distribution within the soil matrix [25,27,62,63]. In addition to changes in pore continuity and water distribution, the 2% (w/w) amendment changed the relative contribution of mineral particles and carbon-rich biochar particles within the solid phase. Because mineral particles generally have higher intrinsic thermal conductivity than organic or carbonaceous particles, the lower STC observed after biochar addition likely reflected the combined influence of altered solid-particle composition, reduced solid–solid contact, increased porosity, and changed water distribution [26,28,64]. Differences in intrinsic thermal conductivity between the two biochar materials may also have contributed to the stronger STC response under WSB than SWB (Table 1). Thus, STC should be viewed as an integrated physical response to biochar amendment, not simply as an isolated soil thermal process. The stronger response under WSB may be related to its higher ash content and more developed pore structure, which can favor aggregate formation, enhance water retention, and more effectively modify the soil physical matrix than SWB [31,32]. Importantly, the persistence of lower STC after two cropping seasons indicates that the physical effects of biochar were not confined to the initial amendment period.
Irrigation regime strongly affected microbial carbon processing. Relative to CDI, DWC increased SRR but reduced microbial CUE across seasons (Figure 6C and Figure 7C). Because SRR was measured in planted pots, it represents total soil CO2 efflux that includes both root-derived autotrophic respiration and heterotrophic microbial respiration; therefore, treatment and season differences in SRR may partly reflect differences in plant/root activity as well as microbial mineralization. Nevertheless, the divergence between higher SRR and lower CUE under DWC indicates that repeated drying and rewetting shifted the soil system toward greater respiratory C loss relative to microbial growth. Such a pattern is consistent with the physiological costs of stress recovery after rewetting and with the Birch effect, in which microbial respiration increases rapidly following the rewetting of dry soil [7,12,15,65]. The parallel decline in SOC under DWC further suggests that repeated moisture fluctuation created a less favorable carbon-use environment in the present system. However, biochar-amended soils, especially those receiving WSB, maintained higher CUE and SOC than the unamended control under DWC, indicating that biochar partly alleviated the negative effects of drying–rewetting on microbial CUE and soil carbon accumulation.
The relationships among soil physical properties, microbial CUE, and SOC provide further insight into these responses. PCA and RFM indicated that several soil physical attributes were associated with variation in microbial carbon processing and SOC responses, with STC showing a particularly prominent contribution among the measured physical variables (Figure 8). In addition, correlation analysis showed that lower STC was associated with higher CUE and higher SOC (Figure 9). These results highlight the importance of the soil physical environment in shaping carbon responses to biochar amendment. STC may be especially informative because it integrates changes in particle contact, pore structure, water distribution, solid-phase composition, and differences in the intrinsic thermal conductivity of mineral versus carbonaceous particles, all of which are relevant to microbial functioning under variable moisture conditions [64]. However, because STC covaried with water-dispersible microaggregate size, aggregation, WHC, and biochar-derived carbon, these statistical relationships do not demonstrate that lower STC directly caused higher CUE or SOC. Instead, lower STC likely served as an indicator of a biochar-modified soil matrix that was more favorable for microbial carbon retention and SOC accumulation.
The SOC response observed in this study likely resulted from several interacting processes. Biochar amendment increased SOC across both seasons, with the strongest increases generally occurring under WSB (Figure 7D). Given the relatively high amendment rate of 2% (w/w), the approximately 6-fold increase in SOC after the first cropping season was most likely dominated by the direct input of exogenous biochar-derived carbon. Therefore, the increase in SOC should not be interpreted as evidence that microbial processing alone drove soil carbon accumulation. Nevertheless, the positive association between microbial CUE and SOC remains relevant for understanding how the amended soil environment may have influenced carbon retention after biochar addition. Higher CUE indicates that a greater proportion of assimilated carbon is allocated to microbial growth rather than lost through respiration, thereby increasing the potential contribution of microbial biomass and residues to more persistent soil organic matter [8,9,10,66]. Recent global-scale evidence also supports the importance of microbial CUE for SOC storage patterns across ecosystems [11]. In the present study, however, microbial CUE should be regarded as a process associated with SOC retention rather than as the primary source of the observed SOC increase. Overall, the SOC response under biochar amendment likely reflected the combined effects of direct biochar carbon input, altered plant-derived carbon inputs, physical and physicochemical protection, and changes in microbial carbon-use patterns [].
Physical and physicochemical protection may also have contributed to the stronger SOC response under WSB. The increases in soil particle size and aggregation after WSB amendment indicate improved structural conditions for the physical protection of organic matter. Aggregation can reduce the accessibility of organic substrates to decomposers and increase the spatial separation between extracellular enzymes and protected carbon pools [67,68]. In addition, the higher ash and mineral contents of WSB may have enhanced the potential for cation-mediated interactions and organo-mineral associations, which can further support carbon persistence in soil [31,69,70]. These mechanisms provide a plausible explanation for why WSB produced more pronounced SOC responses than SWB. Thus, the stronger carbon response under WSB was likely associated with the combined influence of improved soil structure, higher microbial CUE, and greater potential for physicochemical protection.
The residual effects observed in the second cropping season are also notable. Although the magnitude of some responses varied over time, WSB continued to maintain lower STC, higher CUE, and greater SOC than the control, suggesting that feedstock-dependent biochar effects persisted beyond the initial amendment phase [26]. This persistence is important because the agronomic and ecological value of biochar depends not only on its short-term effects but also on whether it can sustain improvements in soil functioning across successive crop cycles []. The present findings indicate that the residual physical effects of WSB remained sufficiently strong to influence microbial carbon-use responses and SOC under both irrigation regimes.
Overall, the results support a broader interpretation of biochar-mediated carbon responses under fluctuating moisture. Biochar did not merely alter a single physical property; it improved multiple aspects of the soil physical environment. These changes were closely associated with microbial CUE and SOC responses, while STC emerged as a particularly informative physical attribute within this integrated response pattern. This framework helps explain why WSB, which produced stronger and more persistent physical modifications than SWB, also showed greater capacity to maintain microbial carbon use efficiency and SOC under DWC.

5. Conclusions and Limitations

Biochar amendment, particularly WSB, improved soil physical conditions, increased microbial CUE, and enhanced SOC under both CDI and DWC across two maize growing seasons. DWC increased soil respiration but reduced CUE and SOC relative to CDI, indicating that repeated drying–rewetting promoted a less efficient microbial carbon-use regime. Biochar partly alleviated these negative effects, with WSB showing stronger and more persistent responses than SWB. The results further indicate that soil physical properties were closely linked to microbial and carbon responses following biochar amendment. Lower STC was associated with higher CUE and SOC, and multivariate analyses showed that STC made a particularly prominent contribution among the measured physical variables. These relationships should be interpreted as coordinated associations within a biochar-modified soil matrix, rather than as direct evidence that STC causally controlled microbial CUE or SOC. These findings suggest that soil thermal properties represent an important component of the broader physical framework through which biochar influences microbial carbon processing and SOC responses under fluctuating moisture.
Several limitations should be considered. The experiment was conducted under greenhouse pot conditions, used a single soil type, applied a relatively high biochar rate of 2% (w/w), and included 18 independent pots followed across two growing seasons. Therefore, the magnitude of the responses should not be directly extrapolated to all field application rates or soil types without further validation. Moreover, biochar-derived carbon, plant-derived carbon, and microbially processed carbon were not partitioned, preventing direct attribution of SOC increases to specific carbon sources. Microbial community composition, microbial necromass formation, and direct soil thermal dynamics were also not measured. In addition, SRR was measured as total soil CO2 efflux in planted pots, and autotrophic root respiration was not separated from heterotrophic microbial respiration. This limits direct attribution of SRR responses to microbial carbon mineralization alone. Future studies should verify these relationships under field conditions and over longer timescales, while integrating carbon-source tracing, microbial trait analysis, and direct characterization of soil thermal behavior to further clarify the processes underlying biochar-mediated carbon responses.

Supplementary Materials

The following supporting information can be downloaded at: https://www.mdpi.com/article/10.3390/agronomy16131262/s1, Figure S1. Relationships between (A) SOC versus MBC, (B) SOC versus TC, (C) SOC versus TN, (D) SOC versus WHC, and (E) SOC versus SPS in the rhizosphere of maize treated with season (Y), biochar (B), irrigation (I). All data points are shown on the plots. Regression lines are red color for the initial effect of first maize growth season (2021), blue color for the residual effect of second maize growth season (2022). *, ** and *** indicate significant levels at p < 0.05, p < 0.01, and p < 0.001, respectively. ns indicates no statistical significance. Table S1. Chemical compositions of Control, original biochar, biochar treatments in 2021 and 2022 analyzed by XRF (wt.%). Table S2. Soil total C content (TC), total N content (TN), soil C/N, and mineral N content (Min N) as affected by season (Y), biochar (B), irrigation (I) and their interactions. Values are the mean ± standard error (n = 3). Different letters indicate significant differences (p < 0.05) among Y, B, and I. *, ** and *** indicate significant levels at p < 0.05, p < 0.01, and p < 0.001, respectively. ns indicates no statistical significance.

Author Contributions

H.W.: software, validation, formal analysis, writing—original draft, data curation, and investigation; G.C.: writing—original draft, formal analysis, and software; X.Z.: investigation and software; N.X.: formal analysis and writing—review and editing; J.M.: software and writing—review and editing; Y.D.: investigation and software; H.Y.: investigation and software; J.H.: software, validation, and formal analysis; Z.W.: methodology and writing—review and editing; H.Z.: software and writing—review and editing; F.L. (Fei Li): validation, supervision, visualization, and writing—review and editing; M.H.: writing—review and editing, validation, funding acquisition, supervision, visualization, investigation, data curation, and resources; F.L. (Fulai Liu): writing—review and editing, validation, methodology, resources, software, supervision, and visualization. All authors have read and agreed to the published version of the manuscript.

Funding

This work was financially supported by Integration and Demonstration of Key Technologies for Cultivated Land Soil Fertility Improvement in the West Liao River Basin (No. TL2025TW005), Second-Tier Team under the 2025 “Yingcai Xingmeng” Talent Program Team Project (No. KYCYYC26001), 2025 Inner Mongolia Autonomous Region Outstanding Postdoctoral Fellowship (No. MBZ20250209), Inner Mongolia Agricultural University Basic Research Project (No. BR22-13-04 and BR22-10-20), and the Excellent Youth Project of the Natural Science Foundation of Ningxia (No. 2023AAC05017).

Data Availability Statement

The original contributions presented in this study are included in the article/Supplementary Materials. Further inquiries can be directed to the corresponding authors.

Acknowledgments

Heng Wan would like to thank the College of Agriculture, Northwest A&F University, for providing seedlings in this experiment.

Conflicts of Interest

The authors declare no conflicts of interest.

References

  1. Abu-Hamdeh, N.H.; Reeder, R.C. Soil thermal conductivity effects of density, moisture, salt concentration, and organic matter. Soil Sci. Soc. Am. J. 2000, 64, 1285–1290. [Google Scholar] [CrossRef] [Scilit]
  2. Ahmed, M.B.; Zhou, J.L.; Ngo, H.H.; Guo, W.; Chen, M. Progress in the preparation and application of modified biochar for improved contaminant removal from water and wastewater. Bioresour. Technol. 2016, 214, 836–851. [Google Scholar] [CrossRef] [Scilit]
  3. Antonangelo, J.A.; Zhang, H.; Sun, X.; Kumar, A. Physicochemical properties and morphology of biochars as affected by feedstock sources and pyrolysis temperatures. Biochar 2019, 1, 325–336. [Google Scholar] [CrossRef] [Scilit]
  4. Bates, D.; Maechler, M.; Bolker, B.; Walker, S.; Christensen, R.H.B.; Singmann, H.; Dai, B.; Grothendieck, G.; Green, P.; Bolker, M.B. Package ‘lme4’. convergence 2015, 12, 2. [Google Scholar]
  5. Birch, H. The effect of soil drying on humus decomposition and nitrogen availability. Plant Soil 1958, 10, 9–31. [Google Scholar] [CrossRef] [Scilit]
  6. UK Biochar Research Centre. Reducing and Removing CO2 While Improving Soils: A Significant and Sustainable Response to Climate Change; UK Biochar Research Centre: Edinburgh, UK, 2009. [Google Scholar]
  7. Breiman, L. Random forests. Mach. Learn. 2001, 45, 5–32. [Google Scholar] [CrossRef] [Scilit]
  8. Bremner, J. Determination of nitrogen in soil by the Kjeldahl method. J. Agric. Sci. 1960, 55, 11–33. [Google Scholar] [CrossRef] [Scilit]
  9. Bremner, J. Inorganic forms of nitrogen. In Methods of Soil Analysis: Part 2 Chemical and Microbiological Properties; American Society of Agronomy: Madison, WI, USA, 1965; Volume 9, pp. 1179–1237. [Google Scholar]
  10. Burrell, L.D.; Zehetner, F.; Rampazzo, N.; Wimmer, B.; Soja, G. Long-term effects of biochar on soil physical properties. Geoderma 2016, 282, 96–102. [Google Scholar] [CrossRef] [Scilit]
  11. Buss, W.; Graham, M.C.; Shepherd, J.G.; Mašek, O. Suitability of marginal biomass-derived biochars for soil amendment. Sci. Total Environ. 2016, 547, 314–322. [Google Scholar] [CrossRef] [Scilit] [PubMed]
  12. Canarini, A.; Schmidt, H.; Fuchslueger, L.; Martin, V.; Herbold, C.W.; Zezula, D.; Gündler, P.; Hasibeder, R.; Jecmenica, M.; Bahn, M. Ecological memory of recurrent drought modifies soil processes via changes in soil microbial community. Nat. Commun. 2021, 12, 5308. [Google Scholar] [CrossRef] [Scilit] [PubMed]
  13. Canarini, A.; Wanek, W.; Watzka, M.; Sandén, T.; Spiegel, H.; Šantrůček, J.; Schnecker, J. Quantifying microbial growth and carbon use efficiency in dry soil environments via 18O water vapor equilibration. Glob. Change Biol. 2020, 26, 5333–5341. [Google Scholar] [CrossRef] [Scilit]
  14. Cao, G.; Sun, J.; Chen, M.; Sun, H.; Zhang, G. Co-transport of ball-milled biochar and Cd2+ in saturated porous media. J. Hazard. Mater. 2021, 416, 125725. [Google Scholar] [PubMed]
  15. Cotrufo, M.F.; Lavallee, J.M. Soil organic matter formation, persistence, and functioning: A synthesis of current understanding to inform its conservation and regeneration. In Advances in Agronomy; Elsevier: Amsterdam, The Netherlands, 2022; Volume 172, pp. 1–66. [Google Scholar]
  16. Cotrufo, M.F.; Wallenstein, M.D.; Boot, C.M.; Denef, K.; Paul, E. The Microbial Efficiency-Matrix Stabilization (MEMS) framework integrates plant litter decomposition with soil organic matter stabilization: Do labile plant inputs form stable soil organic matter? Glob. Change Biol. 2013, 19, 988–995. [Google Scholar]
  17. Domeignoz-Horta, L.A.; Pold, G.; Liu, X.-J.A.; Frey, S.D.; Melillo, J.M.; DeAngelis, K.M. Microbial diversity drives carbon use efficiency in a model soil. Nat. Commun. 2020, 11, 3684. [Google Scholar] [CrossRef] [Scilit] [PubMed]
  18. Domingues, R.R.; Trugilho, P.F.; Silva, C.A.; Melo, I.C.N.A.D.; Melo, L.C.A.; Magriotis, Z.M.; Sánchez-Monedero, M.A. Properties of biochar derived from wood and high-nutrient biomasses with the aim of agronomic and environmental benefits. PLoS ONE 2017, 12, e0176884. [Google Scholar] [CrossRef] [Scilit] [PubMed]
  19. Downie, A.; Crosky, A.; Munroe, P. Physical Properties of Biochar, Biochar for Environmental Management; Routledge: Abingdon, UK, 2012; pp. 45–64. [Google Scholar]
  20. Du, W.; Yang, Y.; Hu, L.; Chang, B.; Cao, G.; Nasir, M.; Lv, J. Combined determination analysis of surface properties evolution towards bentonite by pH treatments. Colloids Surf. 2021, 626, 127067. [Google Scholar] [CrossRef] [Scilit]
  21. Duan, N.; Li, L.; Liang, X.; Fine, A.; Zhuang, J.; Radosevich, M.; Schaeffer, S.M. Variation in bacterial community structure under long-term fertilization, tillage, and cover cropping in continuous cotton production. Front. Microbiol. 2022, 13, 847005. [Google Scholar] [CrossRef] [Scilit] [PubMed]
  22. Duan, N.; Radosevich, M.; Zhuang, J.; DeBruyn, J.M.; Staton, M.; Schaeffer, S.M. Identification of novel viruses and their microbial hosts from soils with long-term nitrogen fertilization and cover cropping management. Msystems 2022, 7, e00571-22. [Google Scholar] [CrossRef] [Scilit] [PubMed]
  23. Dynarski, K.A.; Bossio, D.A.; Scow, K.M. Dynamic stability of soil carbon: Reassessing the “permanence” of soil carbon sequestration. Front. Environ. Sci. 2020, 8, 514701. [Google Scholar] [CrossRef] [Scilit]
  24. Enders, A.; Hanley, K.; Whitman, T.; Joseph, S.; Lehmann, J. Characterization of biochars to evaluate recalcitrance and agronomic performance. Bioresour. Technol. 2012, 114, 644–653. [Google Scholar] [CrossRef] [Scilit] [PubMed]
  25. Eshel, G.; Levy, G.J.; Mingelgrin, U.; Singer, M.J. Critical evaluation of the use of laser diffraction for particle-size distribution analysis. Soil Sci. Soc. Am. J. 2004, 68, 736–743. [Google Scholar] [CrossRef] [Scilit]
  26. Feng, X.; Qin, S.; Zhang, D.; Chen, P.; Hu, J.; Wang, G.; Liu, Y.; Wei, B.; Li, Q.; Yang, Y. Nitrogen input enhances microbial carbon use efficiency by altering plant–microbe–mineral interactions. Glob. Change Biol. 2022, 28, 4845–4860. [Google Scholar]
  27. Geyer, K.M.; Kyker-Snowman, E.; Grandy, A.S.; Frey, S.D. Microbial carbon use efficiency: Accounting for population, community, and ecosystem-scale controls over the fate of metabolized organic matter. Biogeochemistry 2016, 127, 173–188. [Google Scholar] [CrossRef] [Scilit]
  28. Guo, L.; Born, M.L.; Niu, W.; Liu, F. Biochar amendment improves shoot biomass of tomato seedlings and sustains water relations and leaf gas exchange rates under different irrigation and nitrogen regimes. Agric. Water Manag. 2021, 245. [Google Scholar] [CrossRef] [Scilit]
  29. Hardy, B.; Sleutel, S.; Dufey, J.E.; Cornelis, J.-T. The long-term effect of biochar on soil microbial abundance, activity and community structure is overwritten by land management. Front. Environ. Sci. 2019, 7, 110. [Google Scholar] [CrossRef] [Scilit]
  30. Hendershot, W.H.; Lalande, H.; Duquette, M. Soil reaction and exchangeable acidity. In Soil Reaction and Exchangeable Acidity, 2nd ed.; CRC Press: Boca Raton, FL, USA, 1993. [Google Scholar]
  31. Hillel, D. Introduction to Soil Physics; Academic Press: Cambridge, MA, USA, 2013. [Google Scholar]
  32. Hood-Nowotny, R.; Umana, N.H.-N.; Inselbacher, E.; Oswald-Lachouani, P.; Wanek, W. Alternative methods for measuring inorganic, organic, and total dissolved nitrogen in soil. Soil Sci. Soc. Am. J. 2010, 74, 1018–1027. [Google Scholar] [CrossRef] [Scilit]
  33. Hou, J.; Wan, H.; Liang, K.; Cui, B.; Ma, Y.; Chen, Y.; Liu, J.; Wang, Y.; Liu, X.; Zhang, J. Biochar amendment combined with partial root-zone drying irrigation alleviates salinity stress and improves root morphology and water use efficiency in cotton plant. Sci. Total Environ. 2023, 904, 166978. [Google Scholar] [CrossRef] [Scilit] [PubMed]
  34. Hu, W.; Ran, J.; Dong, L.; Du, Q.; Ji, M.; Yao, S.; Sun, Y.; Gong, C.; Hou, Q.; Gong, H. Aridity-driven shift in biodiversity–soil multifunctionality relationships. Nat. Commun. 2021, 12, 5350. [Google Scholar] [PubMed]
  35. Huang, R.; Lan, M.; Liu, J.; Gao, M. Soil aggregate and organic carbon distribution at dry land soil and paddy soil: The role of different straws returning. Environ. Sci. Pollut. Res. 2017, 24, 27942–27952. [Google Scholar] [CrossRef] [Scilit]
  36. Ippolito, J.A.; Cui, L.; Kammann, C.; Wrage-Mönnig, N.; Estavillo, J.M.; Fuertes-Mendizabal, T.; Cayuela, M.L.; Sigua, G.; Novak, J.; Spokas, K. Feedstock choice, pyrolysis temperature and type influence biochar characteristics: A comprehensive meta-data analysis review. Biochar 2020, 2, 421–438. [Google Scholar] [CrossRef] [Scilit]
  37. Kallenbach, C.M.; Frey, S.D.; Grandy, A.S. Direct evidence for microbial-derived soil organic matter formation and its ecophysiological controls. Nat. Commun. 2016, 7, 13630. [Google Scholar] [CrossRef] [Scilit] [PubMed]
  38. Khaledi, S.; Delbari, M.; Galavi, H.; Bagheri, H.; Chari, M.M. Effects of biochar particle size, biochar application rate, and moisture content on thermal properties of an unsaturated sandy loam soil. Soil Tillage Res. 2023, 226, 105579. [Google Scholar]
  39. Lehmann, J.; Joseph, S. Biochar for Environmental Management: An Introduction, Biochar for Environmental Management; Routledge: Abingdon, UK, 2015; pp. 1–13. [Google Scholar]
  40. Lehmann, J.; Kleber, M. The contentious nature of soil organic matter. Nature 2015, 528, 60–68. [Google Scholar] [CrossRef] [Scilit] [PubMed]
  41. Liang, C.; Amelung, W.; Lehmann, J.; Kästner, M. Quantitative assessment of microbial necromass contribution to soil organic matter. Glob. Change Biol. 2019, 25, 3578–3590. [Google Scholar] [CrossRef] [Scilit]
  42. Liu, W.; Zhang, Z.; Wan, S. Predominant role of water in regulating soil and microbial respiration and their responses to climate change in a semiarid grassland. Glob. Change Biol. 2009, 15, 184–195. [Google Scholar] [CrossRef] [Scilit]
  43. Liu, X.; Ma, Y.; Manevski, K.; Andersen, M.N.; Li, Y.; Wei, Z.; Liu, F. Biochar and alternate wetting-drying cycles improving rhizosphere soil nutrients availability and tobacco growth by altering root growth strategy in Ferralsol and Anthrosol. Sci. Total Environ. 2022, 806, 150513. [Google Scholar] [CrossRef] [Scilit] [PubMed]
  44. Liu, X.; Wei, Z.; Ma, Y.; Liu, J.; Liu, F. Effects of biochar amendment and reduced irrigation on growth, physiology, water-use efficiency and nutrients uptake of tobacco (Nicotiana tabacum L.) on two different soil types. Sci. Total Environ. 2021, 770, 144769. [Google Scholar] [CrossRef] [Scilit] [PubMed]
  45. Lu, S.; Ren, T.; Gong, Y.; Horton, R. An improved model for predicting soil thermal conductivity from water content at room temperature. Soil Sci. Soc. Am. J. 2007, 71, 8–14. [Google Scholar] [CrossRef] [Scilit]
  46. Lunardi, C.N.; Gomes, A.J.; Rocha, F.S.; De Tommaso, J.; Patience, G.S. Experimental methods in chemical engineering: Zeta potential. Can. J. Chem. Eng. 2021, 99, 627–639. [Google Scholar]
  47. Madejová, J. Baseline Studies of the Clay Minerals Society Source Clays: Infrared Methods. Clays Clay Miner. 2001, 49, 410–432. [Google Scholar] [CrossRef] [Scilit]
  48. Malik, A.A.; Martiny, J.B.; Brodie, E.L.; Martiny, A.C.; Treseder, K.K.; Allison, S.D. Defining trait-based microbial strategies with consequences for soil carbon cycling under climate change. ISME J. 2020, 14, 1–9. [Google Scholar] [PubMed]
  49. Manzoni, S.; Taylor, P.; Richter, A.; Porporato, A.; Ågren, G.I. Environmental and stoichiometric controls on microbial carbon-use efficiency in soils. New Phytol. 2012, 196, 79–91. [Google Scholar] [PubMed]
  50. Mašek, O.; Buss, W.; Roy-Poirier, A.; Lowe, W.; Peters, C.; Brownsort, P.; Mignard, D.; Pritchard, C.; Sohi, S. Consistency of biochar properties over time and production scales: A characterisation of standard materials. J. Anal. Appl. Pyrolysis 2018, 132, 200–210. [Google Scholar] [CrossRef] [Scilit]
  51. Nelson, D.W.; Sommers, L.E. Total carbon, organic carbon, and organic matter. In Methods of Soil Analysis: Part 3 Chemical Methods; Soil Science Society of America: Madison, WI, USA, 1996; Volume 5, pp. 961–1010. [Google Scholar]
  52. Palansooriya, K.N.; Wong, J.T.F.; Hashimoto, Y.; Huang, L.; Rinklebe, J.; Chang, S.X.; Bolan, N.; Wang, H.; Ok, Y.S. Response of microbial communities to biochar-amended soils: A critical review. Biochar 2019, 1, 3–22. [Google Scholar] [CrossRef] [Scilit]
  53. Pei, J.; Fang, C.; Li, B.; Nie, M.; Li, J. Aridity-Driven Change in Microbial Carbon Use Efficiency and Its Linkage to Soil Carbon Storage. Glob. Change Biol. 2024, 30, e17565. [Google Scholar]
  54. Plaza, C.; García-Palacios, P.; Berhe, A.A.; Barquero, J.; Bastida, F.; Png, G.K.; Rey, A.; Bardgett, R.D.; Delgado-Baquerizo, M. Ecosystem productivity has a stronger influence than soil age on surface soil carbon storage across global biomes. Commun. Earth Environ. 2022, 3, 233. [Google Scholar] [CrossRef] [Scilit]
  55. Rowley, M.C.; Grand, S.; Verrecchia, É.P. Calcium-mediated stabilisation of soil organic carbon. Biogeochemistry 2018, 137, 27–49. [Google Scholar]
  56. Shah, Z.; Shah, T. Residual effect of biochar on soil properties and yield of maize (Zea mays L.) under different cropping systems. Open J. Soil Sci. 2018, 8, 16. [Google Scholar]
  57. Shen, Z.; Zhang, Y.; McMillan, O.; Jin, F.; Al-Tabbaa, A. Characteristics and mechanisms of nickel adsorption on biochars produced from wheat straw pellets and rice husk. Environ. Sci. Pollut. Res. 2017, 24, 12809–12819. [Google Scholar] [CrossRef] [Scilit]
  58. Six, J.; Conant, R.T.; Paul, E.A.; Paustian, K. Stabilization mechanisms of soil organic matter: Implications for C-saturation of soils. Plant Soil 2002, 241, 155–176. [Google Scholar] [CrossRef] [Scilit]
  59. Six, J.; Guggenberger, G.; Paustian, K.; Haumaier, L.; Elliott, E.T.; Zech, W. Sources and composition of soil organic matter fractions between and within soil aggregates. Eur. J. Soil Sci. 2001, 52, 607–618. [Google Scholar] [CrossRef] [Scilit]
  60. Sokol, N.W.; Whalen, E.D.; Jilling, A.; Kallenbach, C.; Pett-Ridge, J.; Georgiou, K. Global distribution, formation and fate of mineral-associated soil organic matter under a changing climate: A trait-based perspective. Funct. Ecol. 2022, 36, 1411–1429. [Google Scholar]
  61. Tao, F.; Huang, Y.; Hungate, B.A.; Manzoni, S.; Frey, S.D.; Schmidt, M.W.; Reichstein, M.; Carvalhais, N.; Ciais, P.; Jiang, L. Microbial carbon use efficiency promotes global soil carbon storage. Nature 2023, 618, 981–985. [Google Scholar] [CrossRef] [Scilit] [PubMed]
  62. Tariq, A.; Sardans, J.; Zeng, F.; Graciano, C.; Hughes, A.C.; Farré-Armengol, G.; Peñuelas, J. Impact of aridity rise and arid lands expansion on carbon-storing capacity, biodiversity loss, and ecosystem services. Glob. Change Biol. 2024, 30, e17292. [Google Scholar]
  63. Usowicz, B.; Lipiec, J.; Łukowski, M.; Marczewski, W.; Usowicz, J. The effect of biochar application on thermal properties and albedo of loess soil under grassland and fallow. Soil Tillage Res. 2016, 164, 45–51. [Google Scholar] [CrossRef] [Scilit]
  64. Usowicz, B.; Lipiec, J.; Usowicz, J.B.; Marczewski, W. Effects of aggregate size on soil thermal conductivity: Comparison of measured and model-predicted data. Int. J. Heat Mass Transf. 2013, 57, 536–541. [Google Scholar] [CrossRef] [Scilit]
  65. Vane, L.M.; Zang, G.M. Effect of aqueous phase properties on clay particle zeta potential and electro-osmotic permeability: Implications for electro-kinetic soil remediation processes. J. Hazard. Mater. 1997, 55, 1–22. [Google Scholar]
  66. Verheijen, F.; Jeffery, S.; Bastos, A.; Van der Velde, M.; Diafas, I. Biochar Application to Soils. A Critical Scientific Review of Effects on Soil Properties, Processes, and Functions; EUR 24099; European Commission: Luxembourg, 2010; pp. 2183–2207. [Google Scholar]
  67. Wan, H.; Chen, Y.; Cui, B.; Liu, X.; Hou, J.; Wei, Z.; Liu, J.; Liu, F. Biochar Amendment Increases C and N Retention in the Soil–Plant Systems: Its Implications in Enhancing Plant Growth and Water-Use Efficiency Under Reduced Irrigation Regimes of Maize (Zea mays L.). J. Soil Sci. Plant Nutr. 2023, 23, 1576–1588. [Google Scholar]
  68. Wan, H.; Hong, M.; Fang, L.; Al-Salman, Y.; van Schaik, L.; Wei, Z.; Li, F.; Geissen, V.; Liu, F. Contrasting residual effects of different biochar types on maize nitrogen uptake, biomass accumulation, water and nitrogen use efficiency under alternate partial root-zone drying irrigation. Biochar 2025, 7, 115. [Google Scholar] [CrossRef] [Scilit]
  69. Wan, H.; Hou, J.; Wei, Z.; Liu, F. Contrasting maize responses to soil phosphorus and potassium availability driven by biochar under reduced irrigation. Plant Soil 2024, 508, 677–700. [Google Scholar] [CrossRef] [Scilit]
  70. Wan, H.; Wei, Z.; Liu, C.; Yang, X.; Wang, Y.; Liu, F. Biochar amendment modulates xylem ionic constituents and ABA signaling: Its implications in enhancing water-use efficiency of maize (Zea mays L.) under reduced irrigation regimes. J. Integr. Agric. 2024, 24, 132–146. [Google Scholar]
Figure 2. The daily temperature data inside the greenhouse during the growing period in 2021 and 2022. DAT stands for days after transplanting.
Agronomy 16 01262 g002
Figure 3. Scanning electron microscopy (SEM) images of the biochars used as soil amendments: (A) SWB and (B) WSB.
Agronomy 16 01262 g003
Figure 4. XRD (A) patterns and FTIR (B) spectra of the original soil and biochar materials, and of soils collected from the control, SWB, and WSB treatments under CDI and DWC in 2021 (initial effect) and 2022 (residual effect). The control refers to the original soil without biochar amendment and without plant growth or irrigation.
Agronomy 16 01262 g004
Figure 5. Soil pH (A), soil zeta potential (SZP, (B)), water-dispersible microaggregate-size distribution (C), and mean microaggregate size (MMS, (D)) as affected by season (Y), biochar (B), irrigation (I), and their interactions in 2021 (initial effect) and 2022 (residual effect). Values are the mean ± standard error (n = 3). Different letters indicate significant differences (p < 0.05) among Y, B, and I. *, and *** indicate significant levels at p < 0.05, and p < 0.001, respectively. ns indicates no statistical significance.
Agronomy 16 01262 g005
Figure 6. (A) Soil water-holding capacity (WHC), (B) soil thermal conductivity (STC), and (C) soil respiration rate (SRR) as affected by season (Y), biochar (B), irrigation (I), and their interactions in 2021 (initial effect) and 2022 (residual effect). Values are the mean ± standard error (n = 3). Different letters indicate significant differences (p < 0.05) among Y, B, and I. ** and *** indicate significant levels at p < 0.01 and p < 0.001, respectively. ns indicates no statistical significance.
Agronomy 16 01262 g006
Figure 7. (A) Microbial biomass carbon (MBC), (B) microbial biomass nitrogen (MBN), (C) microbial carbon use efficiency (CUE), and (D) total soil organic carbon content (SOC) as affected by season (Y), biochar (B), irrigation (I), and their interactions in 2021 (initial effect) and 2022 (residual effect). Values are the mean ± standard error (n = 3). Different letters indicate significant differences (p < 0.05) among Y, B, and I. *, **, and *** indicate significant levels at p < 0.05, p < 0.01, and p < 0.001, respectively. ns indicates no statistical significance.
Agronomy 16 01262 g007
Figure 8. (A,B) are the relative importance of potential predictors to the variations in CUE for 2021 and 2022, respectively. Importance is determined by the percentage of increase in the mean square error (MSE) in the random forest analysis. (C,D) are the plots of principal component analysis of 2021 and 2022, respectively. The parameters are: CUE, STC, TC, WHC, C/N, TN, MBC, MBN, SRR, Min N, and soil pH. The pink ellipse represents WSB treatment, the blue ellipse represents SWB treatment, and the grey ellipse represents the non-biochar control. *** indicates significant levels at p < 0.001.
Agronomy 16 01262 g008
Figure 9. (A,B) are the relative importance of potential predictors to the variations in SOC for 2021 and 2022, respectively. Importance is determined by the percentage of increase in the mean square error (MSE) in the random forest analysis. Relationships between (C) SOC versus STC and (D) SOC versus CUE in the rhizosphere of maize treated with season (Y), biochar (B), and irrigation (I). All data points are shown on the plots. Regression lines are red for the initial effect of 2021, and blue for the residual effect of 2022. *** indicates significant levels at p < 0.001.
Agronomy 16 01262 g009
Table 1. Original soil and biochar properties.
FactorSoilSWBWSB
Clay (<0.002 mm, %)8--
Silt (0.05–0.002 mm, %)85--
Sand (2–0.05 mm, %)7--
Mean microaggregate size (μm)19.176.459.9
pH7.77.99.9
EC (μS cm−1)360901700
CEC (cmol + kg−1)2.03.26.2
Total C (%)1.885.568.3
Total N (%)0.1<0.11.4
Total P (c) (%)0.10.10.1
Total K (c) (%)2.40.31.6
Total Ca (c) (%)7.40.30.8
C:N18<855.249.1
H:Ctot-0.40.4
O:Ctot-0.10.1
(O + N):C <0.10.1
Surface area (m2 g−1)-26.426.4
Total ash (a) (%)-1.321.2
C stability (b) (%)-69.696.5
(a) TGA; (b) Cross A, Sohi SP [38]; (c) Aqua Regia digestion followed by ICP. EC measured in a 1:5 solid-to-water extract.
Disclaimer/Publisher’s Note: The statements, opinions and data contained in all publications are solely those of the individual author(s) and contributor(s) and not of MDPI and/or the editor(s). MDPI and/or the editor(s) disclaim responsibility for any injury to people or property resulting from any ideas, methods, instructions or products referred to in the content.