


Abstract
Sugarcane production in China is severely constrained by frequent seasonal droughts, especially in the major planting region of Guangxi. Identifying drought-resistant varieties is crucial for ensuring yield stability. This study aimed to comprehensively evaluate the drought resistance of 15 sugarcane varieties and screen key identification indicators. A pot experiment was conducted with both well-watered (control) and drought-stress treatments. Fifteen agronomic and physiological traits were measured, and drought resistance was assessed using the comprehensive drought resistance evaluation value (D value), the comprehensive drought resistance coefficient (CDC), and the weighted drought resistance coefficient (WDC). Results showed significant variations in trait responses to drought: green leaf number (NGL) decreased the most (66.06%), while proline (Pro) increased the most (88.09%). PCA reduced 15 traits to 5 principal components, with a cumulative variance contribution rate of 82.26%. Comprehensive evaluation using D values, comprehensive drought resistance coefficients (CDCs), and weighted drought resistance coefficients (WDCs) showed consistent overall drought resistance rankings, with slight differences in individual varieties. Cluster analysis based on D values classified the 15 varieties into three groups: 10 drought-resistant (66.67%, e.g., YZ08-1609, LT5), 3 moderately drought-resistant (e.g., GT08-56), and 2 drought-sensitive (GT10-612, ZT13-012). Grey relational analysis identified single stalk weight (SSW), number of leaves (NL), and number of green leaves (NGL) as key indicators closely associated with drought resistance. This study provides a scientific basis for establishing a drought-resistant sugarcane variety evaluation system and lays the foundation for breeding drought-resistant varieties.
1. Introduction
Sugarcane (Saccharum L. spp. hybrids) is a crucial sugar crop in China. Guangxi, the nation’s largest sugarcane planting region, accounts for over 60% of the total national planting area. However, more than 90% of sugarcane in Guangxi grows on arid, barren, and sloping lands [1]. Additionally, the region experiences uneven rainfall distribution and frequent seasonal droughts [2]. As a result, water stress has become a major environmental factor limiting sugarcane production [3]. For instance, Guangxi experienced a nearly three-month autumn drought in 2019; from June to August 2020, Chongzuo, a main production area, recorded its lowest rainfall for the same period in 60 years, reaching the highest drought level; and in 2021, various regions of Guangxi encountered meteorological droughts of varying intensities and durations. An analysis by Nong et al. [4] on factors affecting sugarcane yield in Chongzuo from 2003 to 2016 indicated that drought is the primary meteorological disaster causing yield reduction. Therefore, systematically evaluating the drought tolerance of sugarcane varieties and screening excellent drought-tolerant varieties are of great significance for breeding drought-tolerant sugarcane varieties and further investigating drought tolerance mechanisms.
Regarding the evaluation of drought tolerance, it is a complex quantitative trait influenced by multiple genes and environmental conditions. Its assessment can be conducted from multiple perspectives, including morphological characteristics, physiological and biochemical responses, and yield and quality traits, with methods varying across different growth stages. Numerous studies have shown that drought stress leads to leaf wilting, a decrease in leaf water content [5,6], and a reduction in green leaf rate [7], resulting in diminished photosynthetic area and capacity [8]. This consequently inhibits sugarcane growth, resulting in reduced internode length, stem diameter, plant height, and single stalk weight, ultimately leading to yield loss [9]. At the physiological and biochemical level, drought stress increases the activities of antioxidant enzymes such as catalase, superoxide dismutase, and peroxidase [10,11,12]. It also elevates levels of osmotic adjustment substances like malondialdehyde, soluble sugars, and proline [13,14,15]. Meanwhile, drought stress decreases the photosynthetic rate, transpiration rate, stomatal conductance, and chlorophyll content while increasing intercellular CO2 concentration [8,16]. Regarding the selection of indicators for drought tolerance evaluation, research suggests that antioxidant enzyme activities [17], osmotic adjustment substances [18], chlorophyll content measured by SPAD [19], and chlorophyll fluorescence parameters [20,21] can serve as key indicators for assessing sugarcane drought tolerance.
Various quantitative analysis methods have been widely applied in drought resistance evaluation. Gao et al. [18] combined principal component analysis, correlation analysis, discriminant analysis, and cluster analysis to classify 16 sugarcane varieties into three categories: highly resistant, moderately resistant, and susceptible. Lü et al. [22] integrated a membership function and principal component analysis to classify 30 tested sugarcane accessions into the same three categories. Tao et al. [23] employed the membership function method, a quantitative approach for evaluating drought resistance, to assess 12 F2-generation varieties with the ‘Yunge 82-114’ lineage and found that ‘Yungeban F203-117’ was the most drought-resistant. Jiang et al. [24] comprehensively evaluated six drought resistance indices of 19 sugarcane varieties using a membership function, principal component analysis, cluster analysis, and discriminant analysis. Given the complex quantitative nature of crop drought resistance and the distinct mechanisms across different crops, accurately evaluating varietal drought resistance requires integrating various indicators related to yield, morphology, physiology, and biochemistry. Furthermore, applying quantitative analysis methods such as the membership function, cluster analysis, stability analysis, and analytic hierarchy process is essential to improve the reliability and scientific rigour of evaluation results [25].
This study conducted a pot-based drought experiment with normal irrigation as the control and subjected 15 sugarcane varieties to drought stress. Fifteen agronomic and physiological traits were measured under both normal and stress conditions. Subsequently, comprehensive methods were employed to systematically evaluate the drought resistance of each variety. These methods included the drought resistance coefficient—a measure of a variety’s performance under drought relative to normal conditions—the membership function, principal component analysis, and grey relational analysis; cluster analysis was also applied to group varieties based on their drought resistance characteristics. This research aims to identify key indicators closely related to sugarcane drought resistance and to select highly drought-resistant varieties. The results will provide a theoretical basis for both the identification of drought-resistant sugarcane varieties and the establishment of a drought resistance evaluation system. Moreover, they will provide a resource base of varieties for breeding new drought-resistant varieties and for researching drought resistance mechanisms.
2. Materials and Methods
2.1. Experimental Materials and Cultivation Management
The experiment was carried out on flat land at the Sugarcane Research Institute, Guangxi Academy of Agricultural Sciences (22.5058° N, 108.1447° E), Nanning, China, from March 2023 to November 2023. The annual sunshine hours are 1551 h, the annual precipitation is 1396 mm, and the average annual temperature is 21.6 °C (http://gx.cma.gov.cn/qxfw/qxgb/202407/t20240726_6451182.html, accessed on 15 December 2025). A total of 15 sugarcane varieties were selected as experimental materials for this study, with their names and breeding institutions detailed in Table 1. The cultivation process for all materials was as follows: On 1 March 2023, the test materials were cut into single-bud segments. After being disinfected by soaking them in carbendazim solution, they were sown in a seedling substrate for nursery cultivation. When the seedlings developed 4–5 leaves, uniformly growing individuals were selected and transplanted into plastic pots filled with an equal amount of soil. Each variety was planted in 10 pots, with one seedling per pot. All plants were cultivated under normal water and fertilizer management conditions until the initiation of the drought treatment.
Table 1.
Sugarcane varieties used in the experiment.
2.2. Drought Treatment Design
On 13 August 2023, the 10 pots of plants for each variety were randomly divided into two groups: the control group (5 pots) continued to receive normal water supply, and the drought treatment group (5 pots) had water withheld. The soil surface of the drought treatment group was covered with plastic film to effectively reduce water evaporation, thereby gradually intensifying drought stress. Throughout the treatment period, soil water content was monitored daily using a time domain reflectometry probe (TDR300, Spectrum Technologies, Inc., Plainfield, IL, USA) to accurately quantify the stress intensity.
2.3. Indicator Measurement and Methods
2.3.1. Physiological and Morphological Indicators During Stress Period
When the soil water content of the drought treatment group decreased to 12.5% (defined as a severe drought level) on 25 August 2023, various indicators during the stress period were measured. The sampling site was standardized to the +1 leaf (i.e., the youngest fully expanded leaf) of the plant, which refers to the first fully expanded leaf above the shoot apex. The measured morphological indices included plant height (determined as the vertical distance from the soil surface to the auricle of the +1 leaf), stem diameter, number of green leaves (defined as leaves with >2/3 green leaf area), and total leaf number. Chlorophyll content (SPAD value) was measured using a SPAD 502 Plus portable chlorophyll meter (Spectrum Technologies, Plainfeld, IL, USA). Leaf area and leaf length were measured using a portable area meter (LI-3000A, LI-COR, Lincoln, NE, USA). Net photosynthetic rate (Pn) was assessed using a portable photosynthesis system (LI6400XT, LI-COR, Lincoln, NE, USA). Additionally, the activities of superoxide dismutase (SOD), peroxidase (POD), and the content of proline (Pro) in the leaves were determined using micro-method kits provided by Suzhou Comin Biotechnology Co., Ltd. (Suzhou, China).
2.3.2. Agronomic Trait Measurement at Harvest
After sampling, all tested plants were immediately rewatered and subjected to conventional cultivation and management practices until the end of the growing season. At the harvest stage on 4 November 2023, key agronomic and quality traits including plant height, stem diameter, single stem weight, and brix were determined for each treatment group to evaluate the effects of drought stress on the late recovery growth and final yield-related traits of the plants. Brix values were measured using a handheld refractometer (ATAGO, Tokyo, Japan), a standard instrument for soluble solid content measurement in sugarcane research.
2.4. Data Processing
The evaluation of drought tolerance in sugarcane varieties was performed using previously described methods [26,27], with the detailed procedure as follows. First, the single drought resistance coefficient (DC) and the comprehensive drought resistance coefficient (CDC) for each trait were calculated according to Formulas (1) and (2), respectively. Here, Ti and CKi represent the measured values of the i-th indicator for the drought treatment group and the control group of the same variety, respectively.
Subsequently, principal component analysis (PCA) was performed on all single DC value. The weight coefficient (ωi) of each principal component was calculated according to Formula (3). Here, Pi is the contribution rate of the i-th principal component.
Next, the membership function value μ(xi) for each variety on different principal components was calculated according to Formula (4). Here, xi represents the score of a certain variety on the i-th principal component, while ximax and ximin denote the maximum and minimum scores of all varieties on that component, respectively.
Based on this, the comprehensive drought resistance evaluation value (D) for each variety was calculated according to Formula (5).
To determine the weight of each single indicator, grey relational analysis (GRA) was conducted. The DC values of each indicator were used as the comparison sequence, and the D value was used as the reference sequence. Correlation coefficient was calculated using the Formula (6), where i = 1, 2, 3,…, n, x0(k) is the reference sequence, xi(k) is the comparison sequence, is the two-level maximum difference, is the two-level maximum difference, ρ is the distinguishing coefficient (taken as 0.5 in this study). The correlation degree (γD) between the DC value and D value was calculated using Formula (7). Then, the weight coefficient (ωi) for each indicator was calculated using Formula (8). Based on this, the Weighted Drought Resistance Coefficient (WDC) was calculated using Formula (9).
Similarly, grey relational analysis was performed again using the D value as the comparison sequence and the WDC value as the reference sequence. The correlation degree (γWDC) between the D value and the WDC value was then calculated according to Formulas (6) and (7).
Finally, based on the D value, Euclidean distance and between-group linkage method were used to perform systematic clustering on the tested varieties (lines) for the classification of drought resistance levels.
2.5. Data Analysis
Experimental data were initially organized using WPS Office. Subsequently, analysis of Variance, correlation analysis, principal component analysis, membership function analysis, and cluster analysis were performed with Origin 2024b. Graphs were created using Origin 2024b and GraphPad Prism 9.0.
3. Results
3.1. Statistical Analysis of Single Trait Indicators
Fifteen agronomic and physiological traits of the sugarcane varieties were measured under both normal and drought stress conditions. The results (Table 2) showed that the coefficients of variation (CV) for agronomic traits between treatments ranged from 8.85% to 33.61%, while the CVs for physiological traits ranged from 13.00% to 55.50%. These findings indicate substantial variation in the traits among the 15 tested sugarcane accessions under drought stress, reflecting significant differences and demonstrating that the plant materials are representative of the population studied. The correlation coefficients between treatments ranged from 0.102 to 0.862, indicating varying sensitivity levels of the different indicators to drought stress and confirming that a single indicator cannot fully capture the complexity of drought tolerance (Supplementary Table S1).
Table 2.
Statistics of DC value of each index.
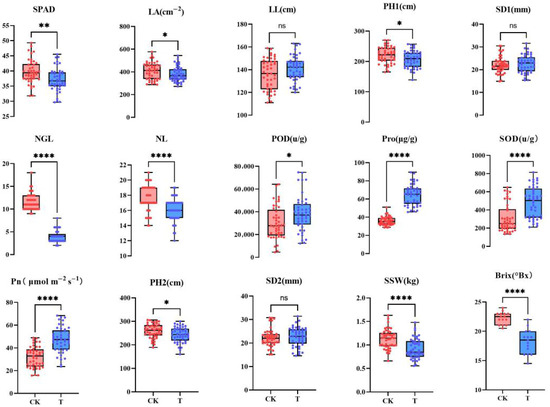
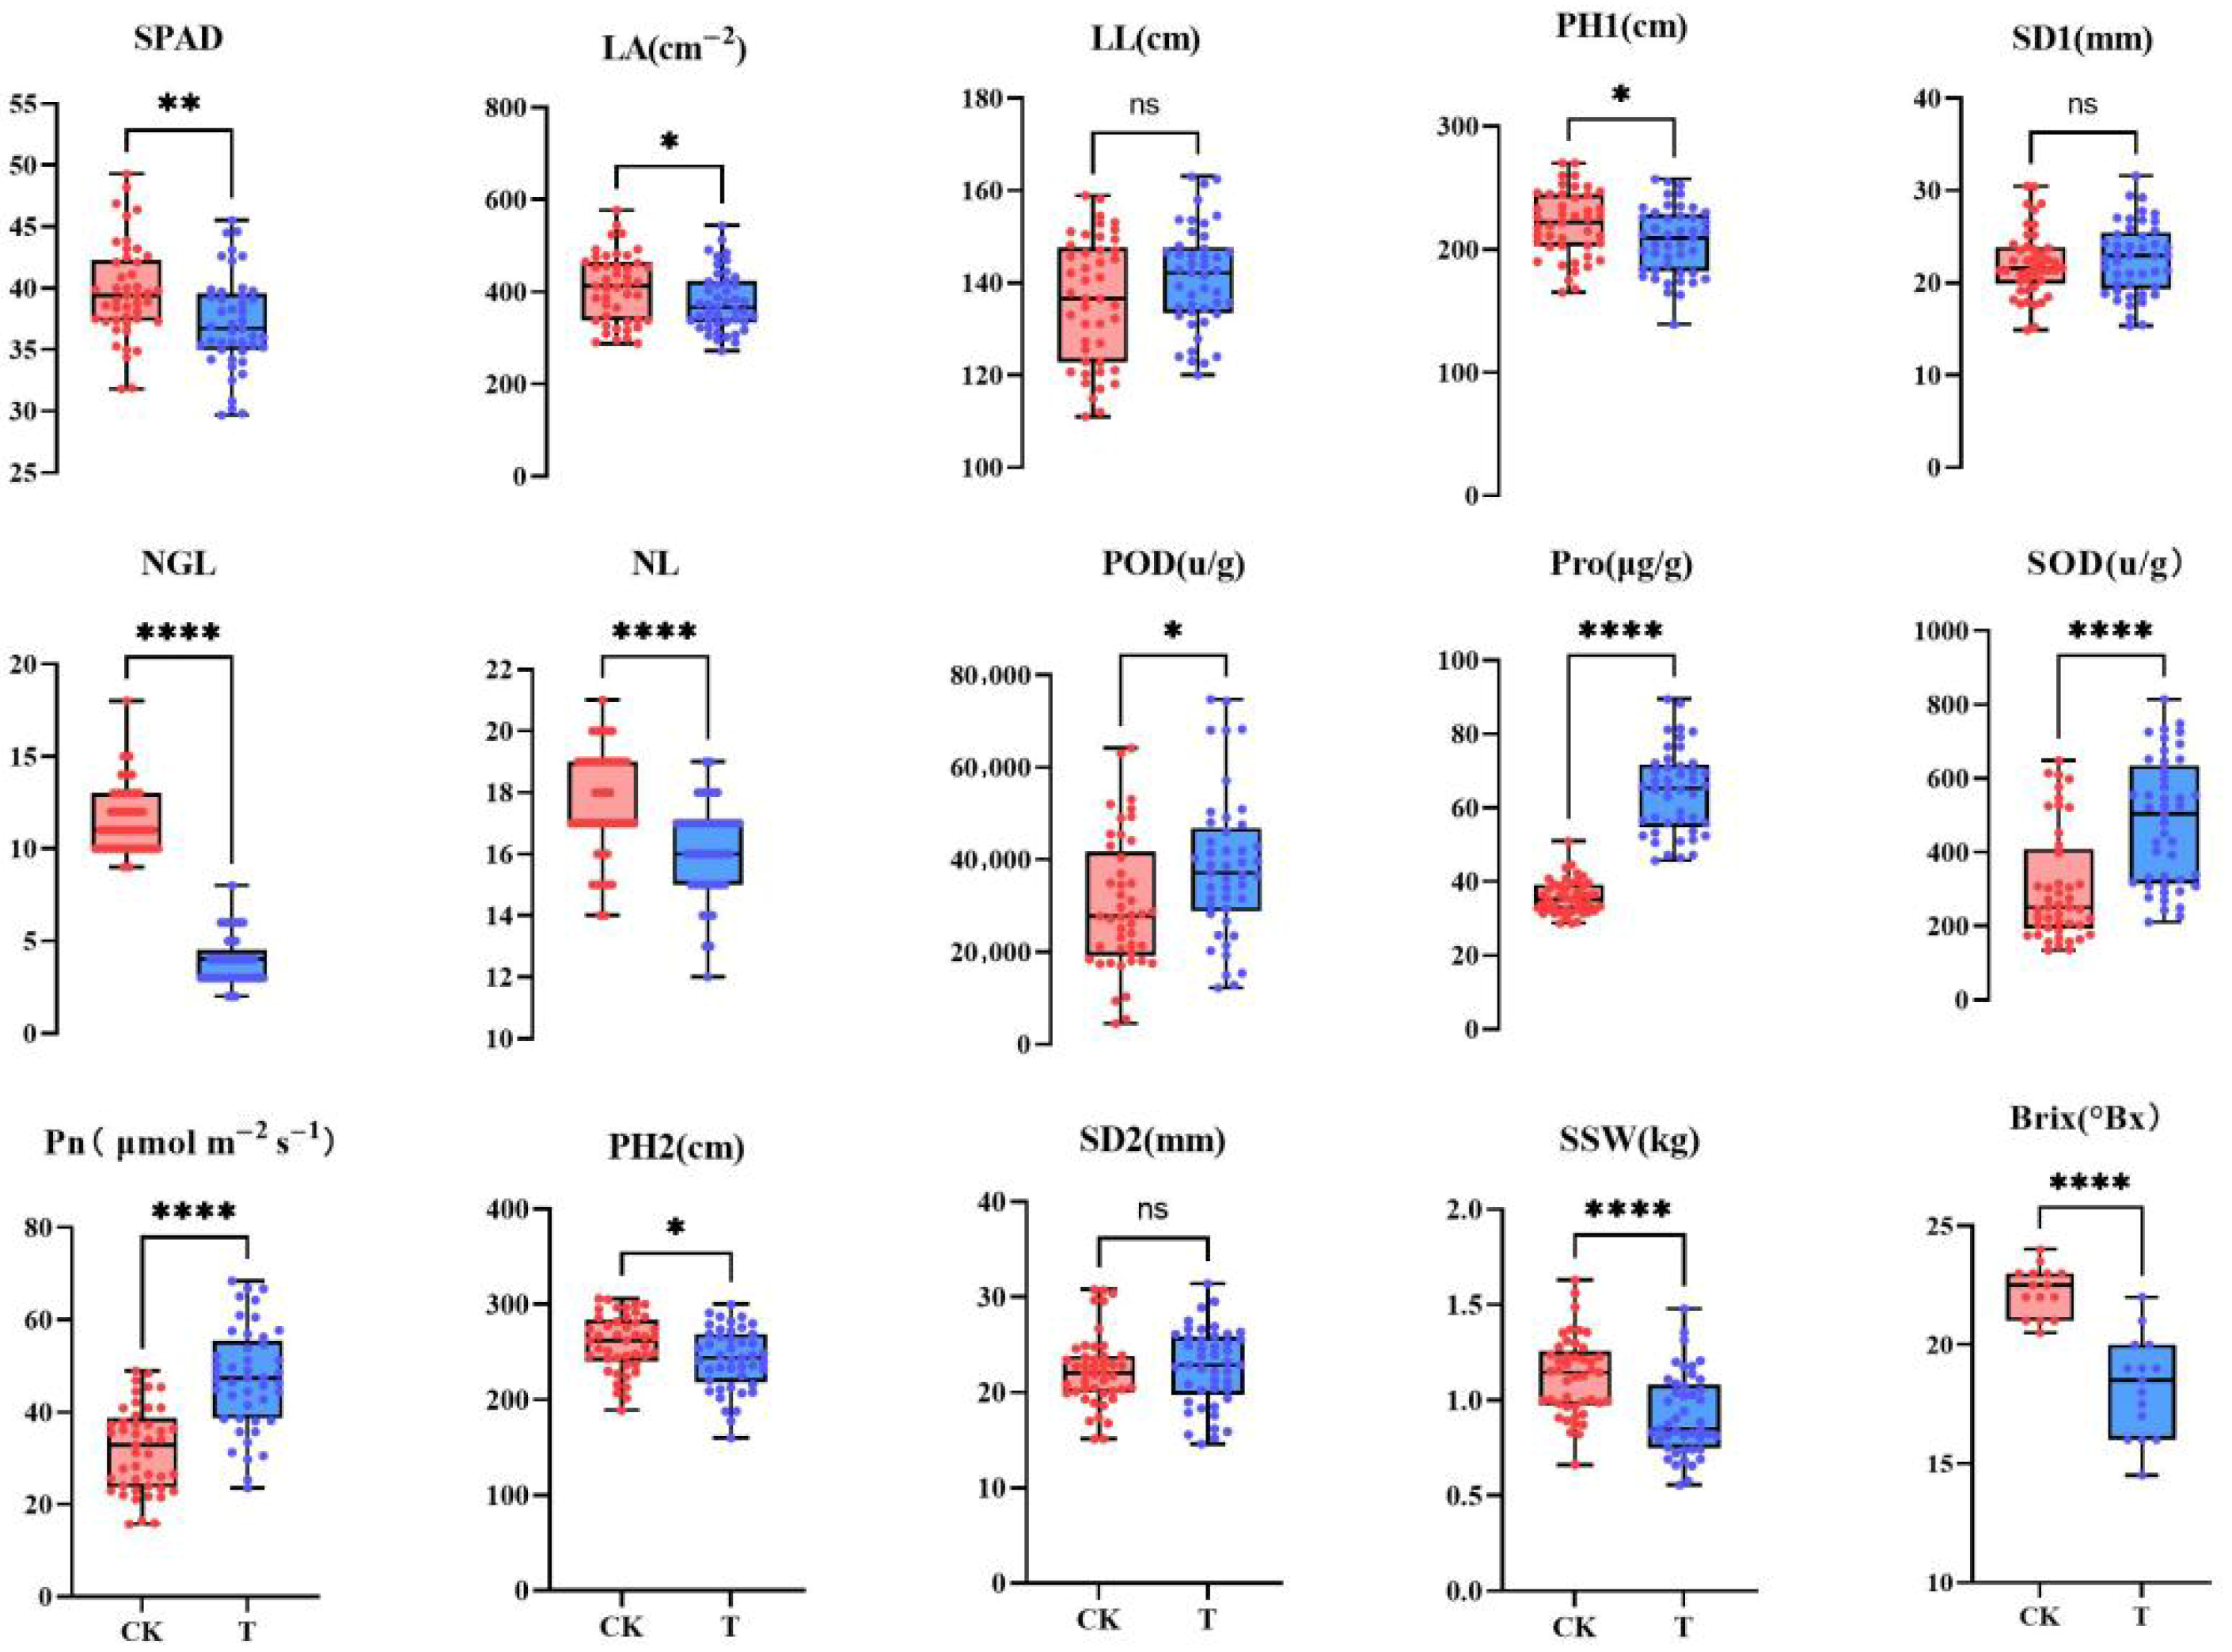
Analysis of variance revealed no significant differences in leaf length (LL), stem diameter 1 (SD1), and stem diameter 2 (SD2) between the different treatments. Leaf area (LA), peroxidase activity (POD), plant height 1 (PH1), and plant height 2 (PH2) showed significant differences (p < 0.05); SPAD values showed highly significant differences (p < 0.01); while number of green leaves (NGL), number of leaves (NL), proline content (Pro), superoxide dismutase activity (SOD), net photosynthetic rate (Pn), single stem weight (SSW), and Brix showed extremely significant differences (p < 0.001). Under drought stress, SPAD, LA, PH1, NGL, NL, PH2, SSW, and Brix decreased significantly. The order of decrease was as follows: NGL (66.06%) showed the greatest reduction, followed by Brix (18.11%), SSW (16.65%), NL (8.25%), LA (7.28%), PH2 (6.44%), PH1 (6.17%), and SPAD (6.02%). In contrast, POD, Pro, SOD, and Pn increased significantly, with the order of increase being proline content (88.09%) followed by SOD (52.67%), Pn (49.72%), and POD (28.63%) (Figure 1). These results further demonstrate that all selected indicators were affected by drought stress during growth and development; however, the extent of change varied among traits, making it difficult for any single indicator to comprehensively reflect the drought tolerance of sugarcane.
Figure 1.
Differences in sugarcane indicators under irrigation and drought treatments. Red represents the control group, and blue represents the drought treatment group. Red dots denote all data points of the corresponding indicators for the control group. Blue dots denote all data points of the corresponding indicators for the drought treatment group. SPAD: relative chlorophyll content; LA: leaf area; LL: leaf length; PH1: plant height at drought stage; SD1: stem diameter at drought stage; NGL: number of green leaves; NL: number of leaves; POD: peroxidase activity; Pro: proline content; SOD: superoxide dismutase activity; Pn: net photosynthetic rate; PH2: plant height at harvest stage; SD2: stem diameter at harvest stage; SSW: single stem weight. ns: no significant difference; *, **, **** indicate significant differences at p < 0.05, p < 0.01, and p < 0.0001 levels, respectively. The same applies below.
3.2. Drought Resistance Coefficients of Trait Indicators
The DC values for each of the 15 traits was calculated using Formula (1), and descriptive statistics were performed on these coefficients (Table 2). The DC values varied to different degrees among the sugarcane varieties after drought treatment. The coefficients of variation for the DC of each indicator ranged from 4.08% to 47.00%; NL exhibited the smallest CV, while SOD showed the largest (Table 2). These results reveal differences among traits, confirm the appropriate structure of the studied population, and further demonstrate that different indicators have varying sensitivities to drought stress.
3.3. Frequency Distribution Analysis of DC Values
The frequency distribution of DC values differed among the tested traits (Table 3). Within the range of 0.2 < DC ≤ 0.5, only NGL and SOD were present, with frequencies of 87.50% and 12.50%, respectively. Within the range of 0.5 < DC ≤ 1.0, all traits except Pro were present. The distribution frequencies, from high to low, were as follows: Brix, PH1, NL, PH2, SPAD, LA, SSW, SD1, SD2, LL, NGL, POD, SOD, and Pn. Brix was present at 100% within this interval. Within 1.0 < DC ≤ 1.5, all traits except NGL and Brix were present. When DC > 1.5, only POD, Pro, SOD, and Pn were present.
Table 3.
Distribution of drought resistance coefficient in different regions.
3.4. Correlation Analysis of DC Values
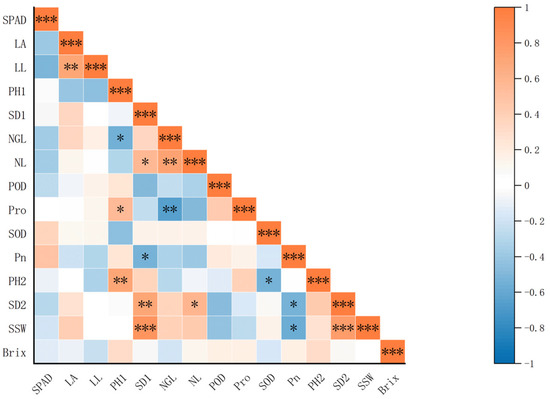
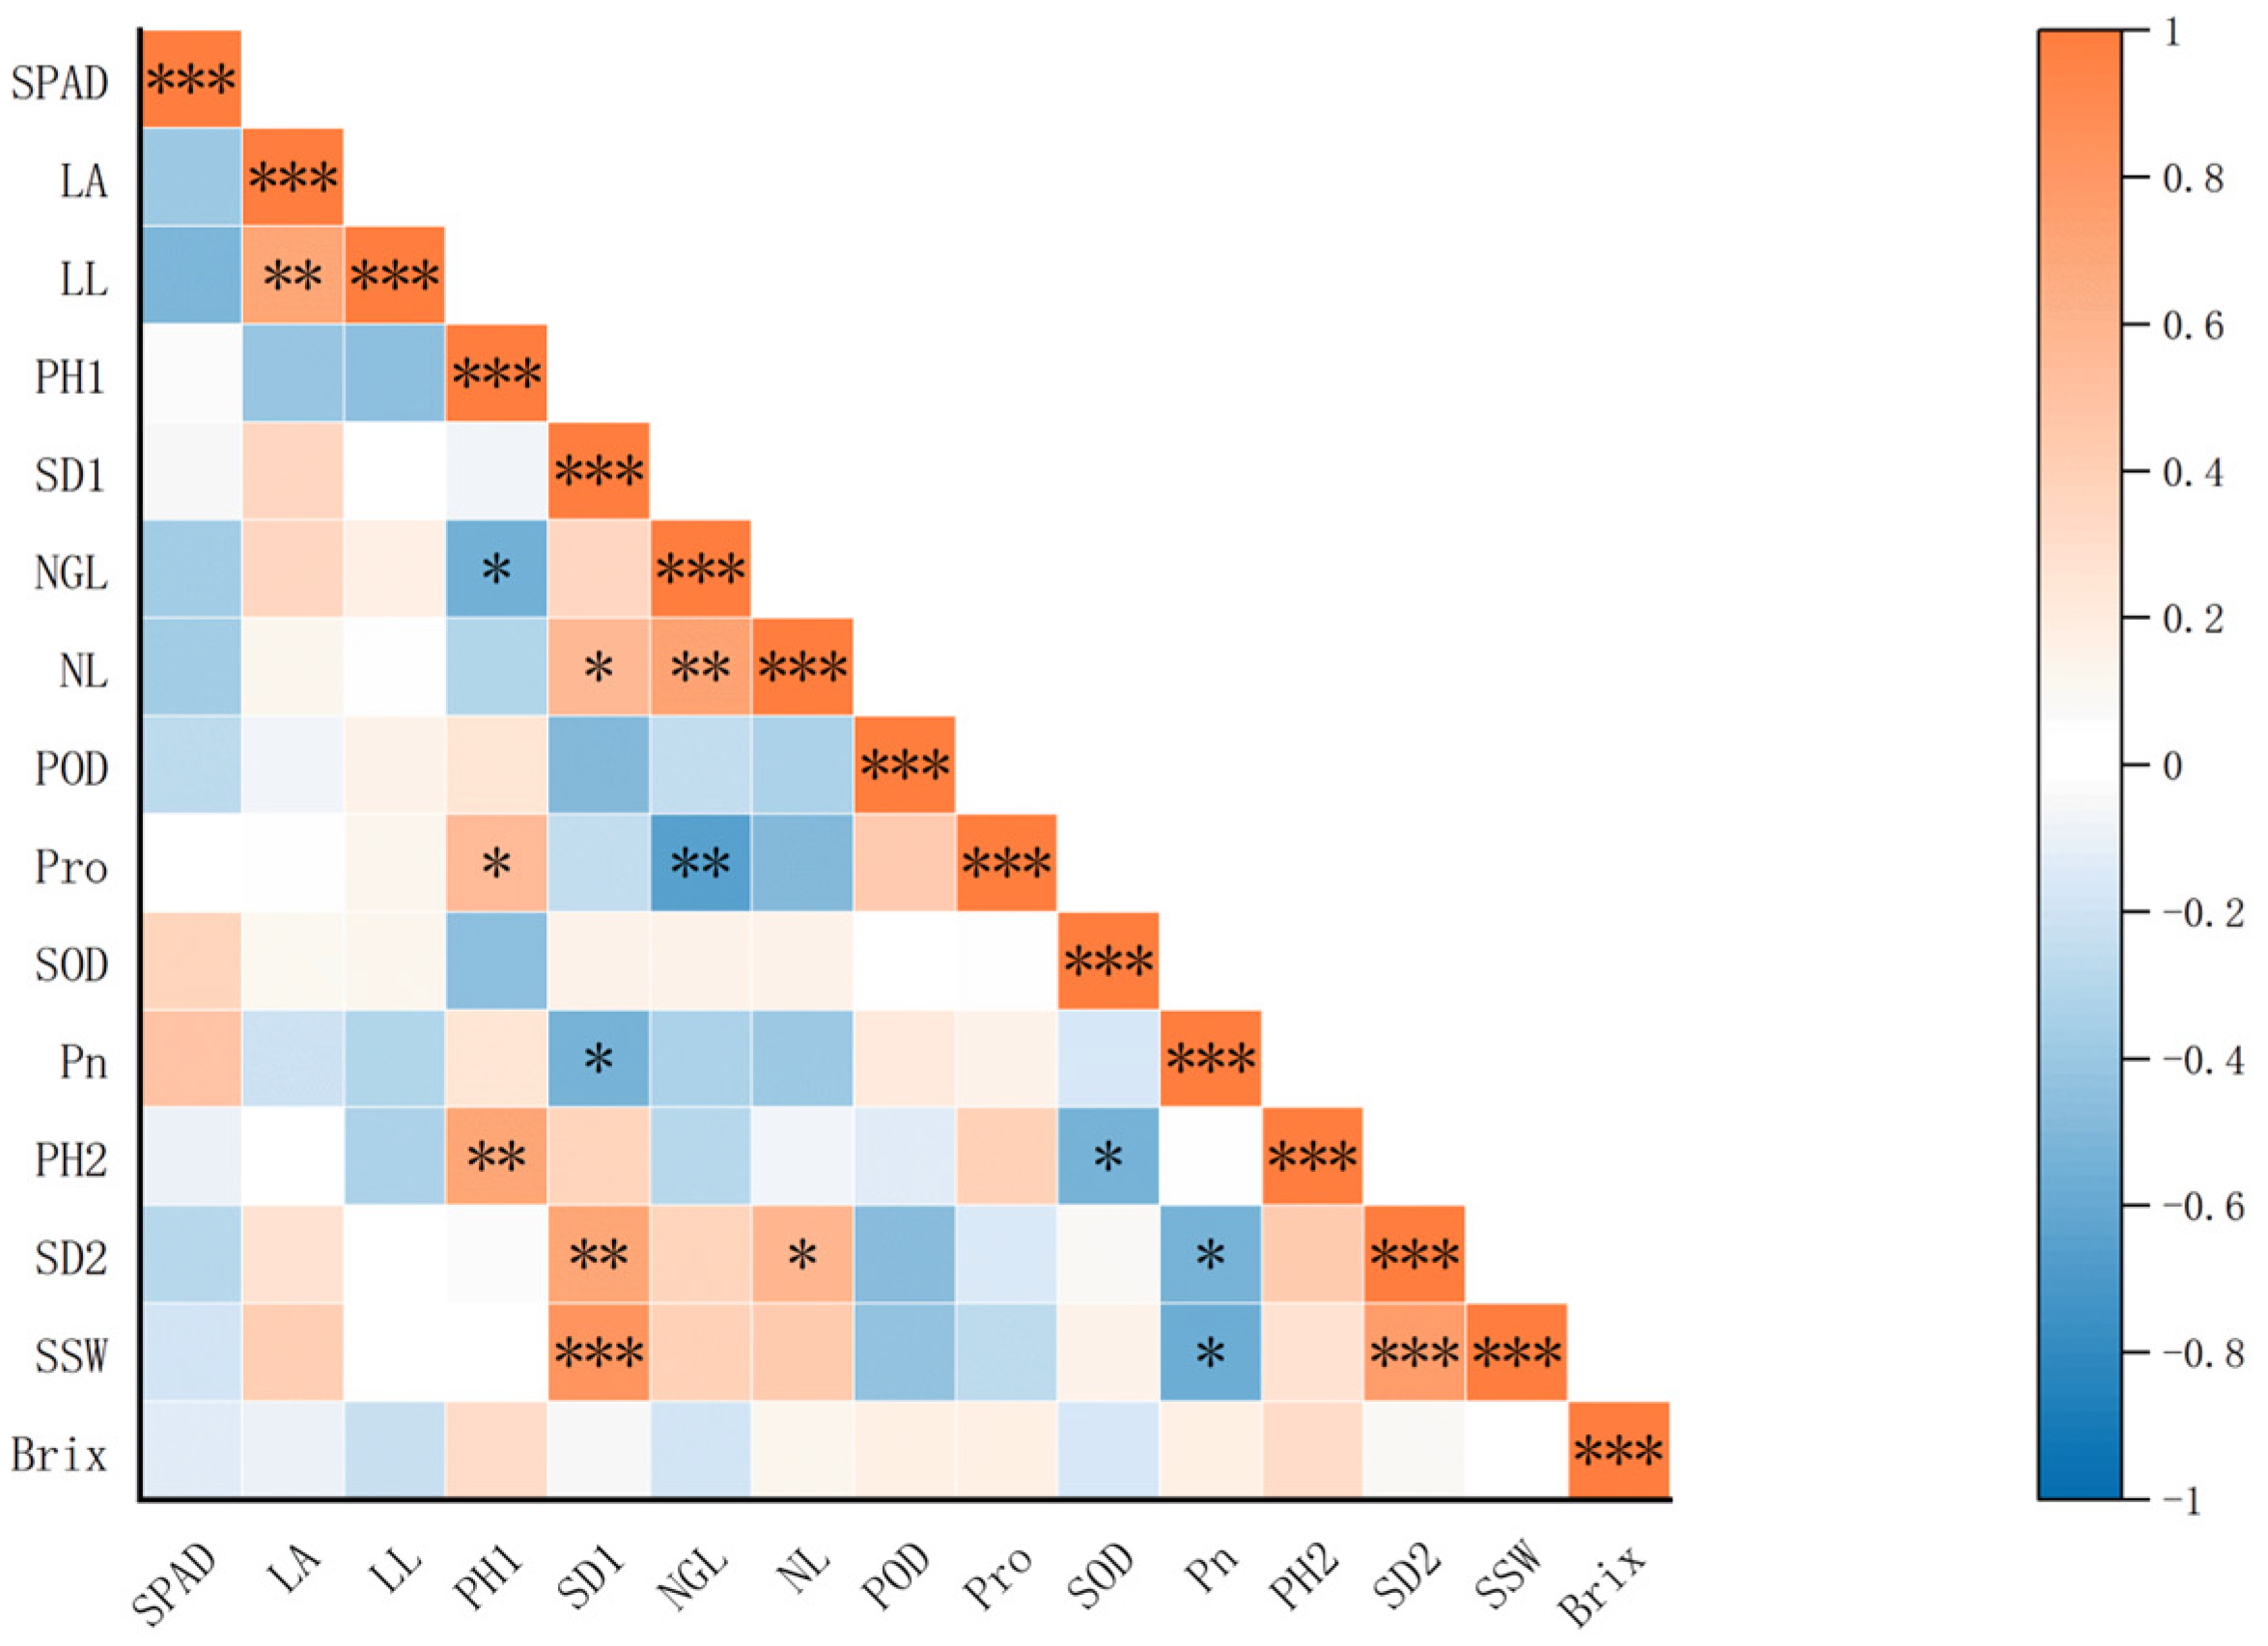
Significant correlations were observed among the individual DC values of the measured indicators (Figure 2). Specifically, the following pairs showed significant correlations (p < 0.05): NGL and PH1; Pro and PH1; NL and SD1; Pn and SD1; SD2 and NL; PH2 and SOD. The pairs LL and LA; PH2 and PH1; SD2 and SD1; NL and NGL; Pro and NGL exhibited highly significant correlations (p < 0.01). Additionally, SSW and SD1, as well as SSW and SD2, showed extremely significant correlations (p < 0.001). Correlations among other traits were not significant (p > 0.05). Given the substantial variation and overlapping information among the measured traits, relying solely on the DC is insufficient for an accurate evaluation of drought resistance. Therefore, a more comprehensive assessment using Principal Component Analysis and membership function analysis is necessary.
Figure 2.
Correlation coefficients between drought resistance coefficient of each index. *, ** and *** indicate significant correlation at the 0.05, 0.01 and 0.001 probability levels, respectively.
3.5. Principal Component Analysis of Sugarcane Indicators
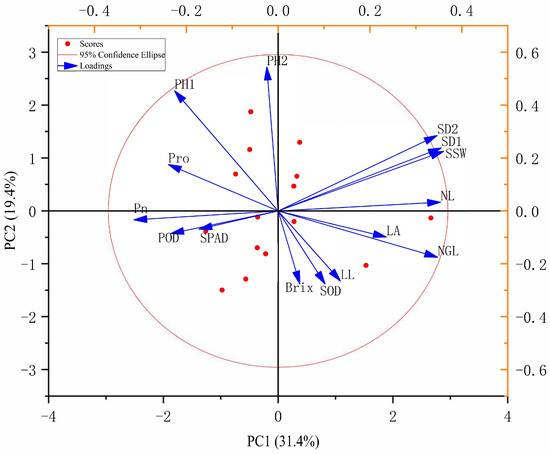
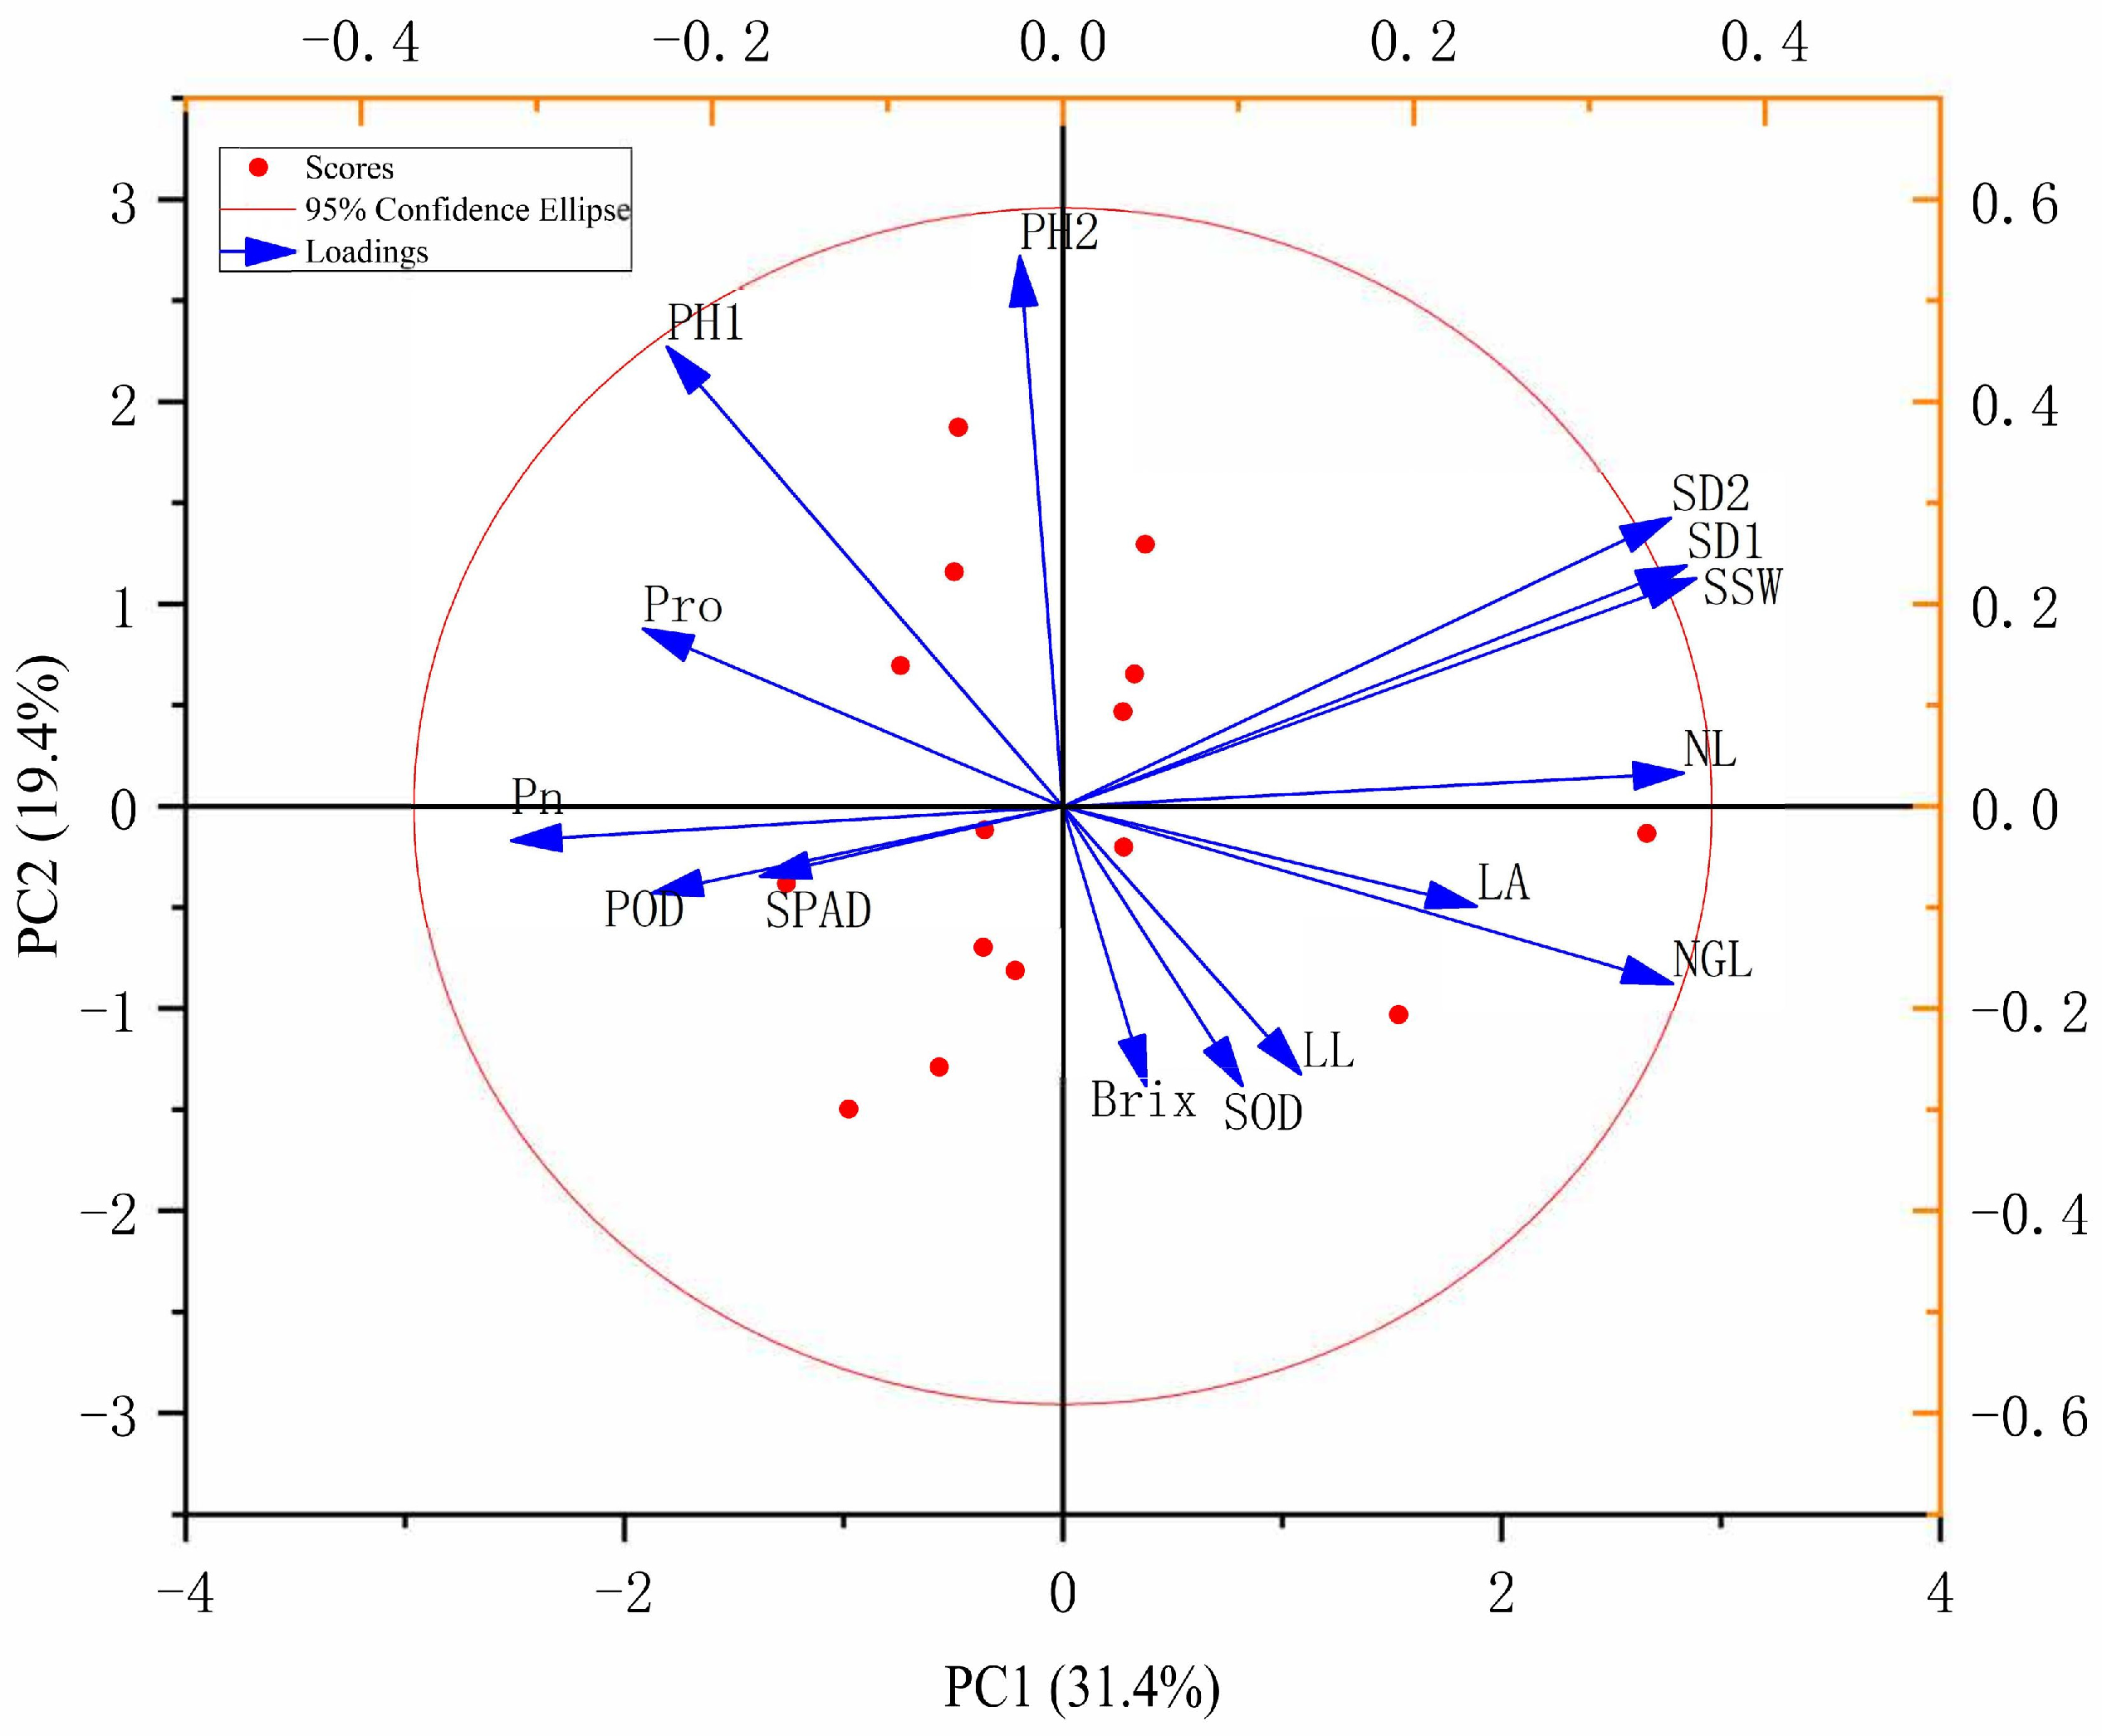
PCA was used to reduce dimensionality and simplify the data while retaining as much original information as possible. In this study, PCA was performed on the DC values of the 15 traits, yielding factor loadings, eigenvalues, and contribution rates for each principal component to further identify and evaluate drought tolerance indicators. Figure 3 presents a biplot showing the distribution of 15 sugarcane accessions (red dots) overlaid with trait loading vectors (blue arrows) that indicate the contribution and direction of each measured variable. The germplasm points show a relatively dispersed distribution across the biplot space, with all accessions clustering within the 95% confidence ellipse, indicating normal multivariate variation patterns. Based on specific criteria for eigenvalues and variance contribution rates, the first five principal components (PC1 through PC5) were selected. Their contribution rates were 31.49%, 19.40%, 14.38%, 9.92%, and 6.07%, with a cumulative contribution rate of 82.26%. The corresponding eigenvalues were 4.72, 2.91, 2.16, 1.49, and 1.06. PC1 had high loadings on SPAD, SD1, NGL, POD, Pn, and LA. PC2 had high loadings on SSW, NGL, Brix, POD, SD2, and LA. PC3 had high loadings on Brix, SD1, SSW, and NL. PC4 had high loadings on NL, POD, and Pn. PC5 had high loadings on NGL, LL, Pro, and LA (Table 4). Through this analysis, the 15 individual indicators were transformed into five independent comprehensive indicators. This achieved a systematic evaluation and dimensionality reduction in drought tolerance traits in sugarcane resources, providing important reference information for sugarcane breeding and drought tolerance research.
Figure 3.
Principal component analysis of DC values.
Table 4.
Principal Component Analysis (PCA) results with contribution ratios for each indicator.
3.6. Comprehensive Evaluation of Drought Resistance in Sugarcane Varieties
The D value, CDC value, and WDC value were calculated using Formulas (5), (2) and (7), respectively. The drought resistance of the tested varieties can be evaluated by the magnitudes of the D value, CDC value, and WDC value, with higher values indicating stronger drought resistance of the corresponding variety. The drought tolerance of the 15 tested sugarcane varieties was comprehensively evaluated using these three methods (Table 5). The D values ranged from 0.12 to 0.56. The order of drought tolerance from strongest to weakest based on the D value was: YZ08-1609 > LT5 > LT8 > ROC22 > GT42 > GNZ08212 > GT76 > GT52 > HZ22 > LT4 > GT08-56 > GT11-2211 > YG59 > GT10-612 > ZT13-012. The CDC values ranged from 0.98 to 1.24. The order based on CDC value was: LT5 > LT8 > GT76 > YZ08-1609 > ROC22 > GNZ08212 > GT42 > GT52 > LT4 > HZ22 > GT11-2211 > GT10-612 > GT08-56 > ZT13-01 > YG59. The WDC values ranged from 0.94 to 1.22. The order based on WDC value was: GT76 > LT8 > LT5 > GT11-2211 > YZ08-1609 > ROC22 > GNZ08212 > GT42 > GT52 > LT4 > HZ22 > GT10-612 > GT08-56 > ZT13-01 > YG59 (Table 5). Although the classification results for individual varieties showed slight differences among the D, WDC, and CDC methods, the overall results were highly consistent.
Table 5.
D-value, CDC-value, and WDC-value of drought resistance evaluation in sugarcane varieties.
3.7. Cluster Analysis and Drought Resistance Evaluation
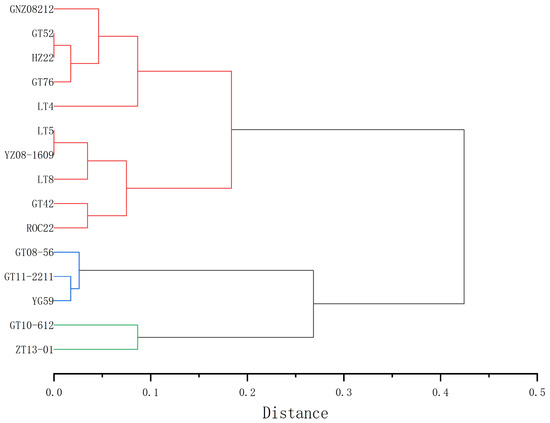
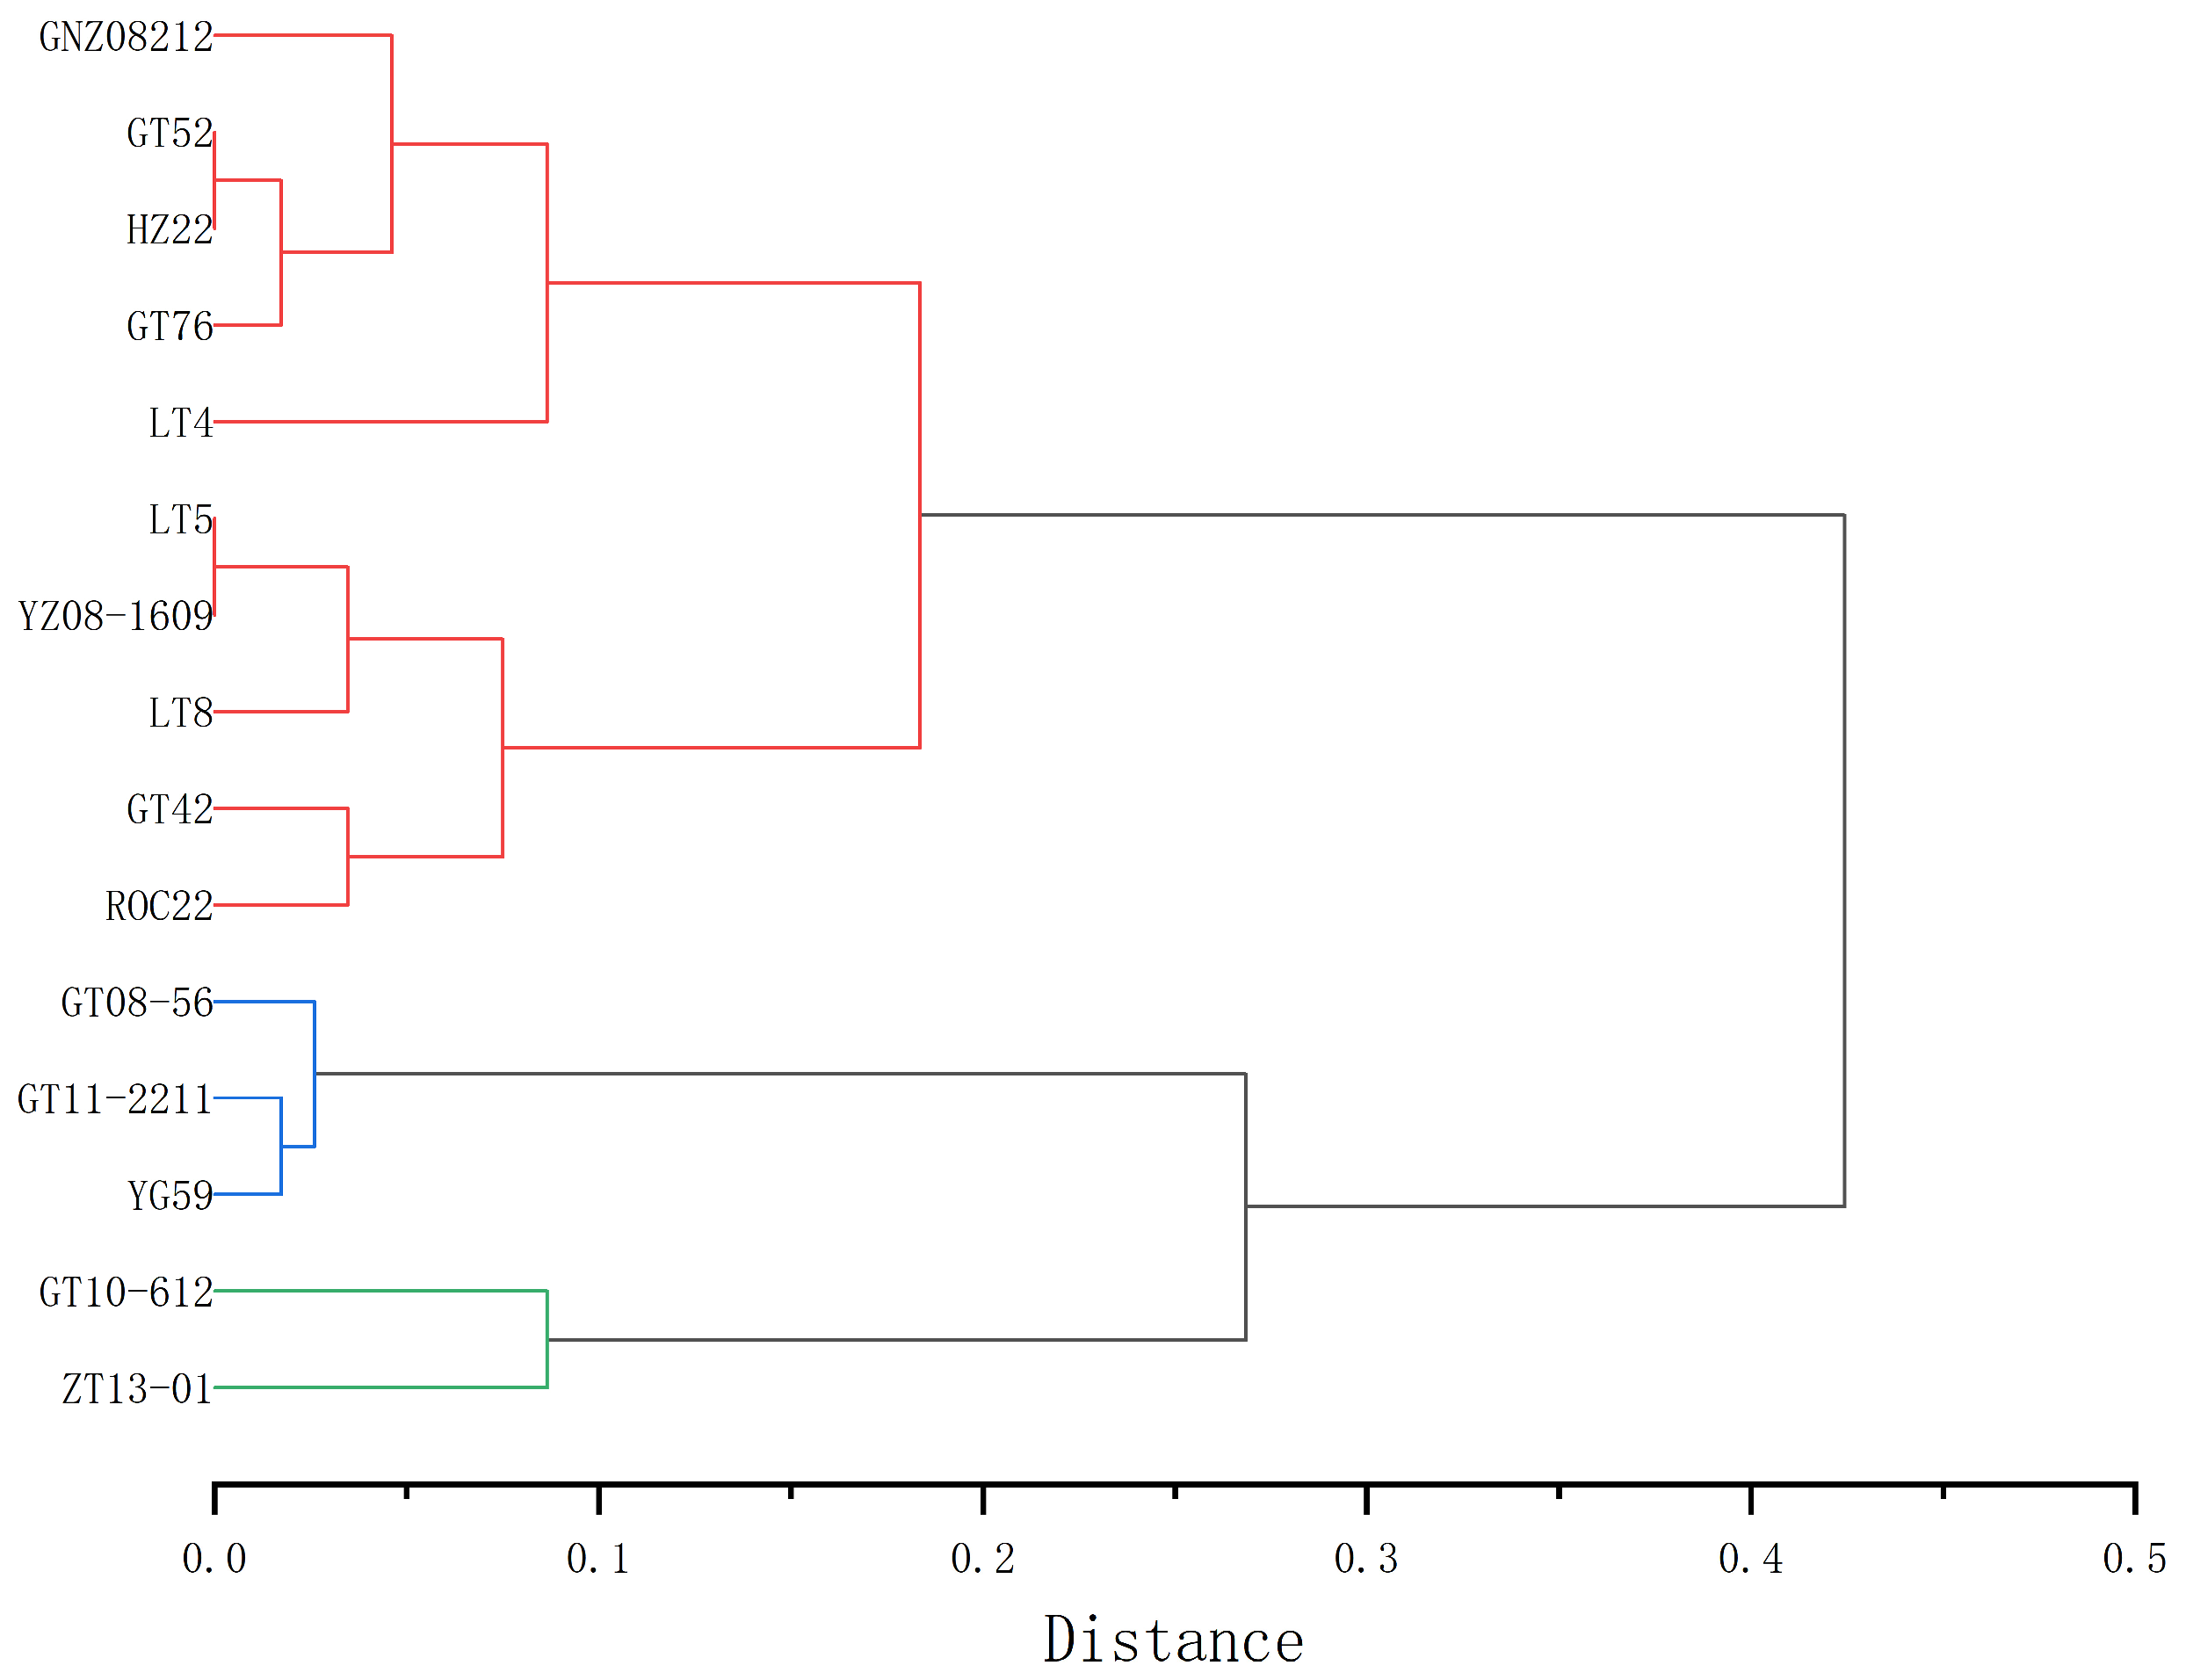
Cluster analysis based on the comprehensive drought resistance D-value revealed that the 15 tested sugarcane varieties could be classified into three distinct drought resistance categories (Figure 4). Among them, ten varieties (accounting for 66.67%) were classified as drought-resistant, including YZ08-1609, LT5, LT8, ROC22, GT42, GNZ08212, GT76, GT52, HZ22, and LT4. Three varieties (GT08-56, GT11-2211, and YG59) were identified as moderately drought-resistant, while the remaining two (GT10-612 and ZT13-012) were categorized as drought-sensitive.
Figure 4.
Clustering dendrogram of drought resistance in sugarcane based on D-values. Three colors represent three distinct drought resistance categories, where red denotes drought-resistant, blue denotes moderately drought-resistant, and green denotes drought-sensitive.
3.8. Evaluation of Sensitive Traits Under Drought Stress in Sugarcane Varieties
Grey relational analysis was conducted between the individual DC value and the D value to obtain the degree of association between each trait’s DC value and the D value. The results showed that the top five indicators ranked by association degree were: SSW, NL, NGL, SD1, and PH2. This indicates a close relationship between the DC values of these indicators and the D value, which is generally consistent with the sensitivity of these indicators to drought stress. Similarly, the association degrees between each indicator’s DC value and the WDC value were analyzed. The top five indicators were: SSW, NL, LL, PH2, and SPAD (Table 6). The closeness of each trait to the WDC value was not entirely consistent with its closeness to the D value, indicating some differences in the results obtained by different analytical methods. Nevertheless, the WDC value can still be used as a supplementary tool for evaluating variety drought resistance.
Table 6.
Correlation degree between DC and D, DC and WDC in sugarcane varieties.
4. Discussion
4.1. Screening of Evaluation Indicators for Sugarcane Drought Resistance
Sugarcane drought resistance is a complex comprehensive trait controlled by multiple genes, and its evaluation indicators vary depending on the crop species and growth stages [28]. Therefore, screening key indicators highly correlated with drought resistance is crucial. Accordingly, extensive research has been conducted on morphological and physiological traits related to sugarcane drought resistance [29,30]. Studies have highlighted the importance of photosynthetic parameters [18]; agronomic traits like plant height and leaf area [30]; green leaf rate [7]; and biochemical markers such as malondialdehyde content [31]. However, a unified standard for drought resistance identification in sugarcane is still lacking. Building upon this foundation, our research systematically evaluates multiple traits. We identified SSW, NL, and NGL, as the most critical indicators, as they showed the strongest association with the comprehensive D-value. SSW is directly correlated with yield formation, reflecting the plant’s capacity to sustain assimilate partitioning and storage under stress conditions. NL and NGL are closely associated with the maintenance of photosynthetic capacity, which constitutes the core of drought resistance in sugarcane—a C4 crop characterized by high photosynthetic efficiency. Specifically, NL represents the canopy’s “photosynthetic potential”, whereas NGL indicates the “effective photosynthetic area” that remains functional under stress. Compared with conventional indicators (e.g., photosynthetic parameters, antioxidant enzyme activities, and osmotic adjustment substances), SSW, NL and NGL offer the advantages of simple, non-destructive measurement without the need for sophisticated biochemical assays or equipment. These features render them highly suitable for high-throughput phenotypic screening in sugarcane breeding programs, where efficient evaluation of large germplasm collections is required. These findings provide a smaller, more predictive set of reliable traits for efficient screening of sugarcane drought resistance in breeding programs.
4.2. Comprehensive Evaluation Methods for Sugarcane Drought Resistance
Crop drought resistance is affected by multiple factors, and its comprehensive evaluation is not only related to the inherent drought-resistant mechanisms of the crop itself, but also closely associated with the evaluation methods and objectives [32]. In recent years, with the deepening of research, the identification of crop drought resistance has developed into a comprehensive evaluation system with multi-angle and multi-method characteristics. Compared with a single indicator or method, the adoption of multivariate statistical methods—such as correlation analysis, membership function analysis, principal component analysis, and grey relational analysis—enables a more scientific and reliable assessment of crop drought resistance [33]. Drawing on the methodologies established by previous studies, this research comprehensively employed multiple approaches including the drought resistance coefficient of individual indicators, correlation analysis, principal component analysis, grey relational analysis, membership function analysis, and cluster analysis. By calculating the D value, CDC value, and WDC value, a systematic evaluation of the drought resistance of sugarcane throughout its entire growth period was conducted. Although the evaluation results derived from the three methods exhibited slight discrepancies, the overall trends were consistent. Among these methods, the D-value method comprehensively considers the sensitivity of each indicator to drought stress, the correlations between indicators, and their respective contribution degrees to drought resistance, thus yielding more reasonable and credible evaluation outcomes. In practical applications, it is recommended that the D value be used as the primary evaluation criterion, while the CDC value and WDC value serve as supplementary references, jointly facilitating the comprehensive evaluation of drought resistance in sugarcane varieties.
4.3. Evaluation of Drought Resistance in Sugarcane at Different Growth Stages
The drought resistance of sugarcane is closely associated with its genotype, morphological characteristics, and physiological and biochemical responses, while being significantly influenced by the timing of drought occurrence [34]. The seedling stage is the most sensitive growth phase of sugarcane. Relevant studies have confirmed that drought stress during this period not only directly reduces the emergence rate of sugarcane but also exerts a persistent inhibitory effect on the subsequent growth and development of plants, ultimately leading to yield loss. Its negative impact is far more significant than that of drought stress occurring at other growth stages [35]. Other studies have also indicated that the seedling stage is an appropriate period for conducting drought resistance identification and screening of sugarcane varieties [36]. During the elongation stage, the inhibitory effect of drought on sugarcane plant height growth is most prominent: drought restricts plant height development by hindering internode elongation, which has become one of the important causes of sugarcane yield reduction. When entering the maturity stage, drought stress may interfere with the synthesis and accumulation of sugar.
The conclusions of this study are mainly drawn based on the stress treatment data of a single growth stage (seedling stage). Although this single-stage evaluation method can reveal the drought resistance response characteristics of sugarcane at a specific period, it has obvious limitations. Therefore, to more comprehensively analyze the drought adaptation mechanism of sugarcane and screen out varieties with greater production and application value, future research should focus on constructing a multi-stage and dynamic drought resistance evaluation system. Specifically, standardized drought stress treatments should be applied at the seedling stage, elongation stage, and maturity stage, respectively. Key agronomic and physiological indicators should be systematically monitored during each stage and the regrowth process after stress relief, so as to clarify the vulnerable periods and resistance advantage periods of sugarcane with different genotypes throughout their life cycles. On this basis, two types of core variety resources should be distinguished: one type is varieties that can stably maintain growth performance under continuous drought stress, and the other type is varieties with extremely strong recovery ability after drought stress relief. Meanwhile, combined with the drought occurrence patterns in specific target production areas (such as regions prone to spring drought at the seedling stage or summer drought at the elongation stage), parental materials or promoted varieties with excellent performance during key periods should be selected in a targeted manner. This multi-stage evaluation perspective can effectively connect the trait identification in the laboratory with the complex scenarios of field production, thereby providing a more solid scientific basis for breeding “adaptive varieties” that are suitable for different stress conditions.
4.4. Application of Strongly Drought-Resistant Sugarcane Varieties in Combination with Production Needs
Drought resistance has long been one of the major research directions in sugarcane stress tolerance studies. Through comprehensive differential and correlation analyses, this study identified a suite of key agronomic traits closely associated with drought resistance in sugarcane. On this basis, the drought-resistant performance of different varieties under specific water stress conditions was compared, providing a valuable theoretical basis for drought-resistant sugarcane breeding and field management. However, an important finding is that there exists a complex trade-off between drought resistance and the traits of high yield and high sugar content. For instance, under the experimental conditions of this study, the variety ‘GT76’, which exhibited strong drought resistance, did not show outstanding yield performance; in contrast, the high-yield variety ‘ROC22’ had relatively weak drought resistance. Similarly, the drought-resistant variety ‘GNZ151505’ presented a low brix value, while the high-sugar variety ‘YG29’ received an unsatisfactory evaluation in terms of drought resistance. These results indicate that the evaluation system established in this study can effectively distinguish the differences in drought resistance among varieties, yet “drought-resistant varieties” cannot be equated with “high-yield varieties” or “high-sugar varieties”. This phenomenon may be attributed to the divergence in resource allocation strategies: for example, drought-resistant varieties allocate more resources to the development of stress-tolerant structures and functions, such as root system proliferation and osmolyte synthesis, thereby reducing resource investment in biomass accumulation or sucrose storage.
Therefore, a multi-objective comprehensive evaluation system must be established in breeding practice and extension application. For breeding programs targeting drought resistance as a primary objective, the elite drought-resistant germplasm screened in this study can serve as valuable parental materials, and their drought-resistant genes can be introgressed into the genetic backgrounds of high-yield or high-sugar varieties. In terms of variety selection for field production, the tendency to unilaterally pursue a single extreme trait should be abandoned. Instead, a comprehensive weighted assessment of drought resistance, yield potential, yield stability, sugar content, and disease resistance must be performed according to the drought occurrence patterns of specific ecological regions (e.g., seasonal drought vs. full-growth-period drought), irrigation conditions, and production objectives (yield-oriented vs. sugar-content-oriented). This approach will facilitate the screening of “adaptive varieties” with the optimal comprehensive performance under specific production scenarios.
5. Conclusions
This study successfully established a comprehensive and reliable evaluation system for assessing drought resistance in sugarcane varieties. By integrating multiple statistical methods and analyzing a wide array of traits, we classified 15 varieties into three distinct drought-resistant categories, identifying YZ08-1609 and LT5 as the most drought-resistant. Furthermore, we pinpointed key agronomic traits, most notably SSW, NL, and NGL, as highly effective indicators for drought resistance screening.
Supplementary Materials
The following supporting information can be downloaded at: https://www.mdpi.com/article/10.3390/agronomy16010034/s1, Table S1: Differences in sugarcane indicators under irrigation and drought treatments.
Author Contributions
Conceptualization, H.S.; methodology, S.L.; software, H.L.; validation, L.T., J.W.; investigation, Y.G.; resources, Y.G.; data curation, X.L.; writing—original draft preparation, H.L.; writing—review and editing, L.T.; visualization, Y.T.; supervision, H.S.; funding acquisition, H.L., K.Z. and X.L. All authors have read and agreed to the published version of the manuscript.
Funding
This research was funded by the Natural Science Foundation of Guangxi (2023GXNSFBA026194), Science and Technology MajorKey Project of Guangxi Province (GuikenongAB24153001, 2022YFD2301102), Basic Research Project of Guangxi Academy of Agricultural Sciences (Guinongke2026YT045, Guinongke2026YP014, 2026YT046), China Agriculture Research System (CARS-17).
Data Availability Statement
The original contributions presented in the study are included in the article, further inquiries can be directed to the corresponding authors.
Acknowledgments
During the preparation of this manuscript, the authors used DeepSeek for the purpose of polishing grammar, structure, and spelling. The authors have reviewed and edited the output and take full responsibility for the content of this publication.
Conflicts of Interest
The authors declare no conflicts of interest.
References
- Li, Y.R.; Yang, L.T. Sugarcane agriculture and sugar industry in China. Sugar Tech 2015, 17, 1–8. [Google Scholar] [CrossRef] [Scilit]
- Wang, L.; Zhao, Z. Seasonal drought drives sugarcane borer outbreaks. J. Econ. Entomol. 2025, 118, 145–151. [Google Scholar] [CrossRef] [Scilit]
- Hoang, T.D.; Watanable, K.; Takaragawa, H.; Kawamitsu, Y. Effects of drought stress at early growth stage on response of sugarcane to different nitrogen application. Sugar Tech 2017, 20, 420–430. [Google Scholar] [CrossRef] [Scilit]
- Nong, G.; Nong, M.Z.; Wang, D. Preliminary refinement analysis of meteorological conditions of Chongzuo sugarcane in Guangxi. Sugarcane Canesugar 2019, 1, 10–15. [Google Scholar]
- Zhao, J.; Bai, Y.D.; Zhao, X.D.; Yang, L.H.; Lu, S.C.; Li, X.M.; Ma, Y.F.; Li, M.H.; Wang, S.H.; Fan, Y.H. Drought resistance evaluation and correlation analysis of agronomic and quality traits of sugarcane under irrigated and rain-fed conditions. J. Hunan Agric. Univ. (Nat. Sci.) 2016, 42, 579–586. [Google Scholar]
- Liu, S.M.; Yang, Q.H.; Li, X.N.; Huang, G.P.; Xiao, G.L. Effects of drought stress on morphological index and physiological characteristics of sugarcane at different growth stages. J. South. Agric. 2016, 47, 1273–1278. [Google Scholar]
- Liu, S.; Fan, X.; Quan, Y.J.; Yang, S.L.; Li, R.D.; Deng, J.; Zhang, Y.B. Effects of drought stress on photosynthetic and physiological characteristics of sugarcane. Southwest China J. Agric. Sci. 2022, 35, 1779–1785. [Google Scholar]
- Zhao, D.; Glaz, B.; Comstock, J.C. Sugarcane leaf photosynthesis and growth characters during development of water-deficit stress. Crop Sci. 2013, 53, 1066–1075. [Google Scholar] [CrossRef] [Scilit]
- Yin, S.H.; Zhou, S.; Huang, X.Y.; Li, W.Y.; Li, W.L.; Chen, B.S. Response and evaluation of drought resistance of middle sugarcane varieties to drought stress. Chin. J. South. Agric. 2020, 51, 339–345. [Google Scholar]
- Kaura, V.; Malhotra, P.K.; Mittal, A.; Sanghera, G.S.; Kaur, N.; Bhardwaj, R.D.; Cheema, R.S.; Kaur, G. Physiological, biochemical, and gene expression responses of sugarcane under cold, drought and salt stresses. J. Plant Growth Regul. 2023, 42, 6367–6376. [Google Scholar] [CrossRef] [Scilit]
- Do, T.T.; Li, J.; Zhang, F.J.; Xing, Y.X.; Yang, L.T.; Li, Y.R.; Nguyen, T.H. Changes of antioxidant enzyme activities and contents of osmotic regulation substances in leaves of different sugarcane varieties under drought stress. Chin. J. Trop. Crops 2018, 39, 858–866. [Google Scholar]
- Da Silva, M.D.; de Oliveira Silva, R.L.; Ferreira Neto, J.R.C.; Benko-Iseppon, A.M.; Kido, E.A. Genotype-dependent regulation of drought-responsive genes in tolerant and sensitive sugarcane cultivars. Gene 2017, 633, 17–27. [Google Scholar]
- Jin, W.; Yang, L.T.; Ying, P.; Yang, J.B.; Luo, C.Y.; Li, Y.R. Eco-physiological responses of different sugarcane varieties to drought and re-watering. J. South. Agric. 2012, 43, 1945–1951. [Google Scholar]
- Li, X.J.; Luo, Z.Q.; Lu, C.Q.; Tang, J.C.; Zhou, Z.; Cao, Q. Evaluation of drought resistance on twenty sugarcane varieties (strains). Chin. J. Trop. Crops 2020, 41, 2482–2491. [Google Scholar]
- Takaragawa, H.; Wakayama, M. Responses of leaf gas exchange and metabolites to drought stress in different organs of sugarcane and its closely related species Erianthus arundinaceus. Planta 2024, 4, 90. [Google Scholar]
- Wu, K.C.; Huang, C.M.; Deng, Z.N.; Cao, H.Q.; Wei, Y.W.; Xu, L.; Li, Y.R.; Yang, L.T. Effects of drought stress and re-watering on physiological-biochemical characteristics in sugarcane at elongation stage. J. South. Agric. 2015, 46, 1166–1172. [Google Scholar]
- Tian, C.Y.; Bian, X.; Yu, H.X.; Lang, R.B.; Dong, L.H.; Tao, L.A.; Zhou, Q.M.; An, R.D.; Sun, Y.F.; Yang, L.H.; et al. Comprehensive evaluation of innovative yunrui sugarcane parents for drought resistance. J. Plant Genet. Resour. 2019, 20, 610–623. [Google Scholar]
- Gao, S.J.; Luo, J.; Chen, R.K.; Zhang, M.Q.; Pan, D.R. Photosynthetic physiology indexes of the drought resistance of sugarcane and its comprehensive evaluation. Acta Agron. Sin. 2002, 28, 94–98. [Google Scholar]
- Zhao, P.F.; Zhao, J.; Liu, J.Y.; Zan, F.G.; Xia, H.M.; Jackson, P.A.; Basnayake, J.; Inman-Bamber, N.G.; Yang, K.; Zhao, L.; et al. Genetic variation of four physiological indexes as impacted by water stress in sugarcane. Sci. Agric. Sin. 2017, 50, 28–37. [Google Scholar]
- Luo, J.; Zhang, M.Q.; Lin, Y.Q.; Zhang, H.; Chen, R.K. Studies on the relationship of chlorophyll fluorescence characters and drought tolerance in seedling of sugarcane under water stress. Sci. Agric. Sin. 2004, 37, 1718–1721. [Google Scholar]
- Lu, X.; Mao, J.; Li, C.; Xu, C.; Cai, Q.; Fan, Y.H. Effect of genotype and soil moisture interaction on sugarcane biomass under moderate water stress. Southwest China J. Agric. Sci. 2018, 31, 1399–1404. [Google Scholar]
- Lü, S.Z.; Shen, Q.Q.; Rao, X.B.; Qian, Z.F.; Zhang, R.Q.; He, L.L.; Li, F.S. Comprehensive evaluation on drought resistance of thirty Saccharum spontaneum L. accessions in seedling stage. Southwest China J. Agric. Sci. 2024, 37, 233–241. [Google Scholar] [CrossRef]
- Tao, L.A.; Yang, L.H.; Jing, Y.F.; Duan, H.F.; Dong, L.H.; An, R.D.; Zhou, Q.M.; Zhu, J.R. Comprehensive evaluation of drought resistance for descendant F2 of Saccharum spotaneum in Yunnan by subjection function. Southwest China J. Agric. Sci. 2011, 24, 1676–1680. [Google Scholar]
- Jiang, H.T.; Jiang, X.L.; Shang, H.Y.; Li, A.G.; Zhang, M.Q. Evaluation on drought-tolerance in new sugarcane clones by multiple statistics analysis. Sugar Crops China 2021, 43, 1–7. [Google Scholar]
- Zhang, M.Q.; Chen, R.K. Molecular Physiological and Genetic Improvement of Crop Drought Tolerance; Science Press: Beijing, China, 2005; pp. 58–63. [Google Scholar]
- Bao, X.; Hou, X.; Duan, W.; Yin, B.; Ren, J.; Wang, Y.; Liu, X.; Gu, L.; Zhen, W. Screening and evaluation of drought resistance traits of winter wheat in the North China Plain. Front. Plant Sci. 2023, 14, 1194759. [Google Scholar] [CrossRef] [Scilit]
- Li, X.; Luo, L.; Shi, X.; Li, S.; Wang, L.; Li, D.; Li, F. Screening drought tolerance in potato germplasm resources in the northwestern region of China. BMC Plant Biol. 2025, 25, 777. [Google Scholar] [CrossRef] [Scilit] [PubMed]
- Li, J.L.; Liu, S.D.; Zhang, S.P.; Chen, J.; Liu, R.H.; Shen, Q.; Li, Y.; Ma, H.J.; Zhao, X.H.; Pang, C.Y. Identification of drought tolerance during whole growth period in cotton germplasm resources and resistance index screening. J. Agric. Sci. Technol. 2021, 23, 52–65. [Google Scholar]
- Jiang, H.T.; Huang, M.Y.; Guo, Q.; Yan, Y.P.; Zhang, M.Q. Effects of varied plant growth regulators on drought resistance of sugarcane under water stress. Southwest China J. Agric. Sci. 2016, 29, 2114–2120. [Google Scholar]
- Lu, H.W.; Yang, Q.H.; Xiao, G.L.; Zhao, Z.H.; Huang, L.H. Identification of drought resistance in dominant sugarcane varieties in Yunnan. Subtrop. Agric. Res. 2012, 8, 8–12. [Google Scholar]
- Li, H.B.; Zhou, H.; Wei, J.J.; Gui, Y.Y.; Zhu, K.; Zhang, R.H.; Yang, R.Z.; Liu, X.H. Drought resistance index screening and drought resistance evaluation of commonly-used sugarcane parents in field. J. South. Agric. 2023, 1, 46–55. [Google Scholar] [CrossRef]
- Wang, X.R.; Li, Y.; Zhang, Y.J.; Li, Y.S.; Wang, J.C.; Xu, Y.P.; Qi, X.S. Drought resistance identification and drought resistance indexes screening of Tibetan hulless barley resources at adult stage. Acta Agron. Sin. 2022, 48, 1279–1287. [Google Scholar] [CrossRef] [Scilit]
- Hemaprabha, G.; Nagarajan, R.; Alarmelu, S. Response of sugarcane genotypes to water deficit stress. Sugar Tech 2004, 6, 165–168. [Google Scholar] [CrossRef] [Scilit]
- Turner, N.C. Adaptations to water deficits: A changing perspec tive. Aust. J. Plant Physiol. 1986, 13, 175–190. [Google Scholar] [CrossRef] [Scilit]
- Fan, X.; Quan, Y.; Yang, S.; Li, R.; Deng, J.; Zhang, Y. Identification and Evaluation of Drought Resistance in Sugarcane Seedling Stage. Chin. Agric. Sci. Bull. 2022, 38, 17–24. [Google Scholar]
- Yang, J.B.; Zhuge, S.J.; Li, H.T.; Yang, L.T.; Li, Y.R. Impact of drought stress on sugarcane growth physiology and evaluation on drought resistance of sugarcane cultivars. J. South. Agric. 2012, 43, 1114–1120. [Google Scholar]

Disclaimer/Publisher’s Note: The statements, opinions and data contained in all publications are solely those of the individual author(s) and contributor(s) and not of MDPI and/or the editor(s). MDPI and/or the editor(s) disclaim responsibility for any injury to people or property resulting from any ideas, methods, instructions or products referred to in the content. |
© 2025 by the authors. Licensee MDPI, Basel, Switzerland. This article is an open access article distributed under the terms and conditions of the Creative Commons Attribution (CC BY) license.