


Abstract
The Ti-6Al-4V alloy is widely used in aerospace and deep-sea applications due to its exceptional strength and corrosion resistance. However, its application is often constrained by high deformation resistance and a narrow hot-working temperature window, primarily attributed to its heat and mass transfer characteristics. To address these limitations, a novel Ti-6Al-1.3V-0.9Fe alloy was designed with an equivalent molybdenum content. In this study, Gleeble thermal simulation tests were conducted to investigate the impact of Fe on the hot deformation behavior under various conditions and to identify the optimal processing window for this alloy. The effects of deformation temperature and strain rate on the flow stress curves and peak stress were systematically analyzed, along with the role of Fe in microstructural evolution during hot deformation. The results demonstrate that the addition of Fe significantly refines the grain size of the Ti-6Al-1.3V-0.9Fe alloy. As expected, the flow stress decreases with increasing deformation temperature and increases at higher strain rates. Under high-temperature and low-strain-rate conditions, the alloy exhibits steady-state flow behavior, indicating improved hot workability. Based on the constitutive modeling, the apparent activation energy (Q) for hot deformation was calculated to be 503.81 kJ/mol. Finally, the optimal hot-working parameters for the Ti-6Al-1.3V-0.9Fe alloy were identified as a temperature range of 760 °C to 860 °C and a strain rate between 0.01 and 0.16 s−1.
1. Introduction
Titanium alloys, known for their high specific strength, excellent corrosion resistance, and good biocompatibility, have been widely utilized in various fields, including aerospace [1], medical devices [2], chemical equipment [3], automotive and marine industries [4], and sports equipment [5]. Among them, the Ti-6Al-4V alloy, as the most extensively applied α + β titanium alloy in engineering, has become one of the preferred materials across industries due to its superior properties. However, its high flow resistance, narrow hot-working range, and high processing costs significantly limit its applications beyond the aerospace sector, particularly in civilian fields [6,7]. Therefore, improving the hot workability of the Ti-6Al-4V alloy and expanding its hot-working range have become key focuses and challenges in current titanium alloy research [8].
Currently, the primary methods for improving the metallurgical structure of titanium alloys include alloying, external field assistance, and the addition of particle nucleating agents [9,10,11]. Among these, alloying is the most widely used and direct approach. Chen et al. [12] employed microalloying modification techniques to design a novel alloy, Ti-6Al-4V-0.55Fe, which enhances the fracture toughness of the alloy by replacing the traditional method of controlling interstitial element content, thereby pioneering a new pathway to reduce costs. Sun et al. [13] discovered that Fe alloying endows Ti-6Al-4V-0.55Fe with more persistent cyclic hardening behavior and a lower cyclic softening rate, resulting in enhanced fatigue life under selected strain amplitudes. Yu et al. [14] found that the addition of 0.5 wt.% Fe to Ti-6Al-4V-0.55Fe alloy most significantly improves tensile ductility and Mode I fracture toughness; further additions of Fe lead to significant fluctuations in yield strength and ultimate strength. Abdelrahman et al. [15] designed two low-cost novel α + β titanium alloys (Ti-2Mo-0.5Fe and Ti-3Mo-0.5Fe), which exhibit higher strength, hardness, and better corrosion resistance and cell compatibility than Ti-6Al-4V ELI alloy, making them important candidates for third-generation metallic biomaterials for long-term implant applications. Zhang et al. [16] developed a new Ti-6Al-2V-1Cr-1Fe (α + β) titanium alloy. Compared to the cast Ti-6Al-4V alloy, the new alloy shows a significant refinement in grain size and α-lath thickness, with a reduction of up to 50–75% and improvements in yield strength and ductility by 19.7% and 51.8%, respectively. In summary, Fe microalloying effectively improves the microstructure of Ti-6Al-4V, enhances alloy performance, and reduces the cost of alloy preparation.
Titanium alloys are characterized by high strength, poor plasticity at room temperature, and low thermal conductivity, which typically necessitates processing under high-temperature conditions. To reduce the deformation resistance encountered during titanium alloy processing and enhance its hot-working performance, thereby enabling the cost-effective production of titanium alloys, it is essential to conduct in-depth research on the hot deformation behavior, microstructural evolution, and flow plastic deformation mechanisms of titanium alloys. Currently, numerous studies have been conducted on the thermomechanical behavior of titanium alloys. Zhang et al. [17] investigated the influence of initial microstructure on the hot deformation behavior of the Ti-6Al-4V alloy and found that specimens with an initial α′ martensitic structure exhibited equiaxed microstructures after hot deformation across all strain rates between 10−3 s−1 and 1 s−1. Particularly, at a strain rate of 1 s−1, a uniform ultrafine-grained structure with an average grain size of 400 nm was obtained at both deformation temperatures. He et al. [18] studied the microstructural evolution of the Ti-6Al-4V alloy and discovered that the simultaneous occurrence of hot deformation and phase transformation can significantly reduce grain size and enhance the driving force for phase transformation, with grain refinement and phase transformation improvement primarily attributed to strain-induced β/α phase transformation.
Recently, the compositional design philosophy and room-temperature tensile properties of a novel Ti-6Al-xV-yFe alloy series were successfully established in our previous work [19]. While that study confirmed the potential of the Ti-6Al-xV-yFe series at ambient temperatures, its hot workability and industrial processing windows remained unexplored. To bridge this gap, the current manuscript focuses exclusively on the hot deformation behavior and microstructural evolution of the specific Ti-6Al-1.3V-0.9Fe alloy. By utilizing Gleeble thermo-mechanical simulation data, a comprehensive processing map based on the Dynamic Materials Model (DMM) is constructed. This work is distinct from the previous study as it strictly addresses the hot fabrication boundaries, establishing constitutive models and clarifying the dynamic recrystallization (DRX) and flow instability regimes required to guide the actual industrial forging or rolling processes of this specific alloy composition.
This study designs a Ti-6Al-1.3V-0.9Fe alloy with the same Kβ coefficient as Ti-6Al-4V based on the Kβ coefficient method and Mo equivalent method [19]. The hot deformation behavior, microstructural evolution, and flow plastic deformation mechanisms of the Ti-6Al-1.3V-0.9Fe alloy are investigated through hot compression simulation cycling experiments. Subsequently, a hot-working map is established based on the Dynamic Material Model (DMM) to analyze the safe processing window of the Ti-6Al-1.3V-0.9Fe alloy, ultimately determining the optimal processing range for the alloy.
2. Materials and Methods
The raw materials used for the preparation of the Ti-6Al-1.3V-0.9Fe alloy in this study were Grade 0 sponge titanium, 45Al-55V alloy, and Fe particles with a purity of 99.99%. The alloy was melted using a vacuum cold crucible suspension melting furnace at a temperature range of 1600 °C to 1700 °C to obtain the initial ingot. The initial ingot was remelted six times to ensure the uniformity of the chemical composition within the final ingot. The actual chemical composition of the final ingot was measured using an ICP (Agilent 5110, Santa Clara, CA, USA) spectrometer, with the results presented in Table 1.
Table 1.
Actual composition of the Ti-6Al-1.3V-0.9Fe alloy.
The phase transformation points of the alloy were determined using differential scanning calorimetry and metallographic analysis. The theoretical phase transformation temperature was calculated, and samples were processed at intervals of 10 °C around this temperature to observe the microstructure. The phase transformation point (Tβ) of the Ti-6Al-1.3V-0.9Fe alloy was ultimately determined to be 1005 °C. Hot compression tests were conducted using a Gleeble 3800 thermal simulator. The cylindrical specimens used for the hot compression tests, with dimensions of Φ8 mm × 12 mm, were prepared by wire electrical discharge machining and precision turning. During the entire hot compression process, an inert gas (argon) was used to protect the specimens. The heating rate in the hot compression tests was 10 °C/s, with a deformation temperature range of 755–955 °C and a temperature interval of 50 °C. The strain rates varied from 0.01 s−1 to 10 s−1. After heating to the specified deformation temperature, the specimens were held for five minutes before undergoing hot compression deformation at different strain rates. The tests were terminated when the strain reached 60%, and the specimens were subsequently quenched in water to preserve the deformed microstructure.
The microstructure of the alloy was observed using an optical microscope (OM, ZEISS A1m, Jena, Germany). The microscopic morphology was observed using a scanning electron microscope (SEM, Zeiss, Oberkochen, Germany) with an electron backscatter diffraction (EBSD, Oxford Instrument, Abingdon, UK) detector. The grain size was measured using Image J (Version 1.54r) software, and the Aztec (Version 6.3) analysis software was used to analyze the EBSD results. The EBSD maps were acquired using a step size of 0.5 μm, covering a total scanned area of 225 × 175 μm2. Metallographic specimen preparation was performed on the experimental samples, and the etching solution used for metallography was Kroll’s reagent with a ratio of HF:HNO3:H2O = 1:2:7.
3. Results and Discussion
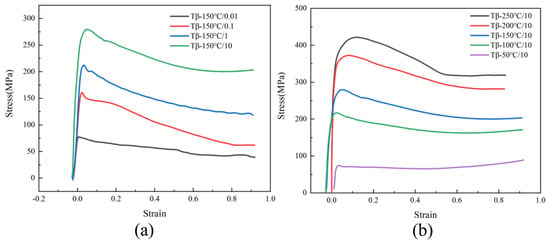
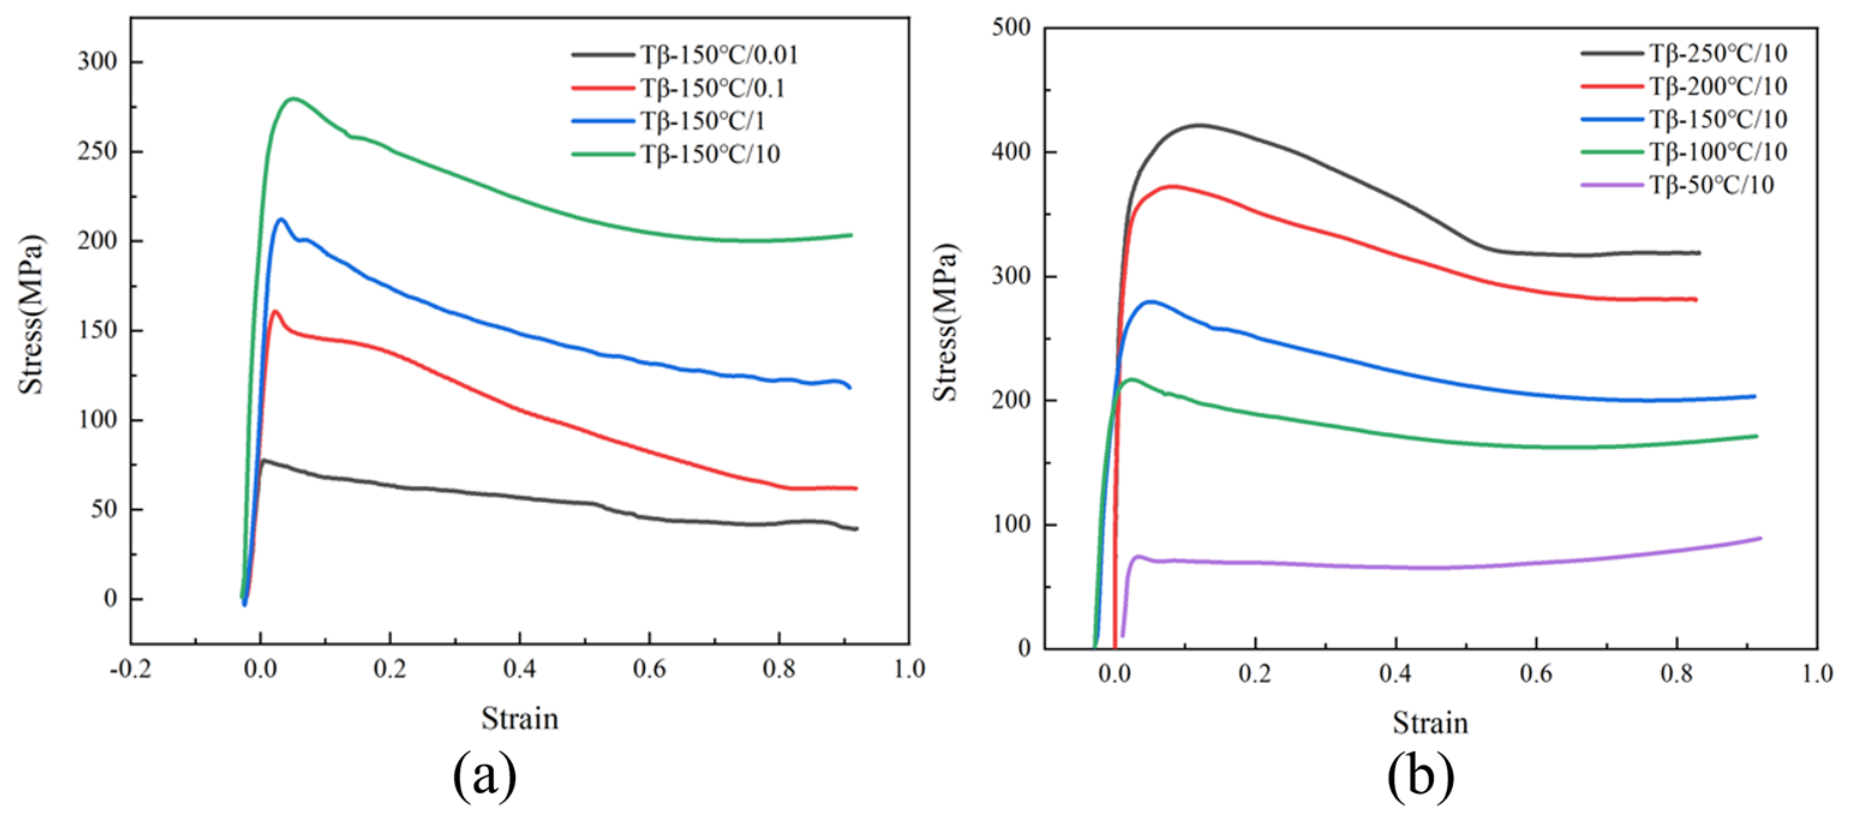
Figure 1 presents the flow stress curves of the Ti-6Al-1.3V-0.9Fe alloy under different deformation temperatures and strain rates. As shown in Figure 1, the flow stress curves of the Ti-6Al-1.3V-0.9Fe alloy exhibit typical single-peak characteristics. In the initial stage of deformation, the alloy undergoes work hardening, during which the dislocation density increases due to plastic deformation, leading to a sharp increase in flow stress at low strains. Subsequently, the increase in flow stress slows down and continues to rise until it reaches a peak, attributed to the softening effect caused by dynamic recovery and dynamic recrystallization. The flow stress curves at strain rates of 1 s−1 and 10 s−1 both show dynamic softening behavior. However, after reaching the peak, the flow stress continuously decreases without a distinct steady-state flow phenomenon. In contrast, the deformation curves at strain rates of 0.01 s−1 and 0.1 s−1 show that the flow stress initially increases and then gradually levels off, resulting in relatively flat curves without significant flow softening. At high strain rates, the deformation time is extremely short, and plastic deformation cannot fully occur, leading to a large accumulation of dislocations in a short period. When the strain rate is low, plastic deformation can proceed and complete stably and uniformly within the alloy. Therefore, compared to high strain rates, the peak and steady-state flow stress values are lower, and the alloy is more likely to achieve a steady-state flow condition.
Figure 1.
(a) Flow stress curves of the Ti-6Al-1.3V-0.9Fe alloy at different strain rates at 855 °C; (b) Flow stress curves of the Ti-6Al-1.3V-0.9Fe alloy at different temperatures with a strain rate of 10 s−1.
As depicted in Figure 1b, the flow stress curves exhibit a steady-state flow condition with increasing temperature. Under low-temperature conditions, the flow stress rapidly reaches a peak with increasing strain and then gradually decreases without entering a steady-state flow regime. In contrast, at high temperatures, the flow stress swiftly transitions to a steady-state flow after reaching the peak. This behavior is attributed to insufficient heat at lower deformation temperatures, which fails to provide the energy required for dynamic recrystallization and dynamic recovery, thus preventing the elimination of the substantial dislocations generated during deformation. Conversely, at higher deformation temperatures, dynamic recovery and dynamic recrystallization are activated, rapidly eliminating the dislocations produced during deformation and facilitating the alloy’s transition to a steady-state flow.
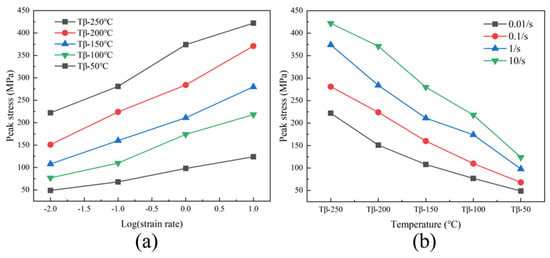
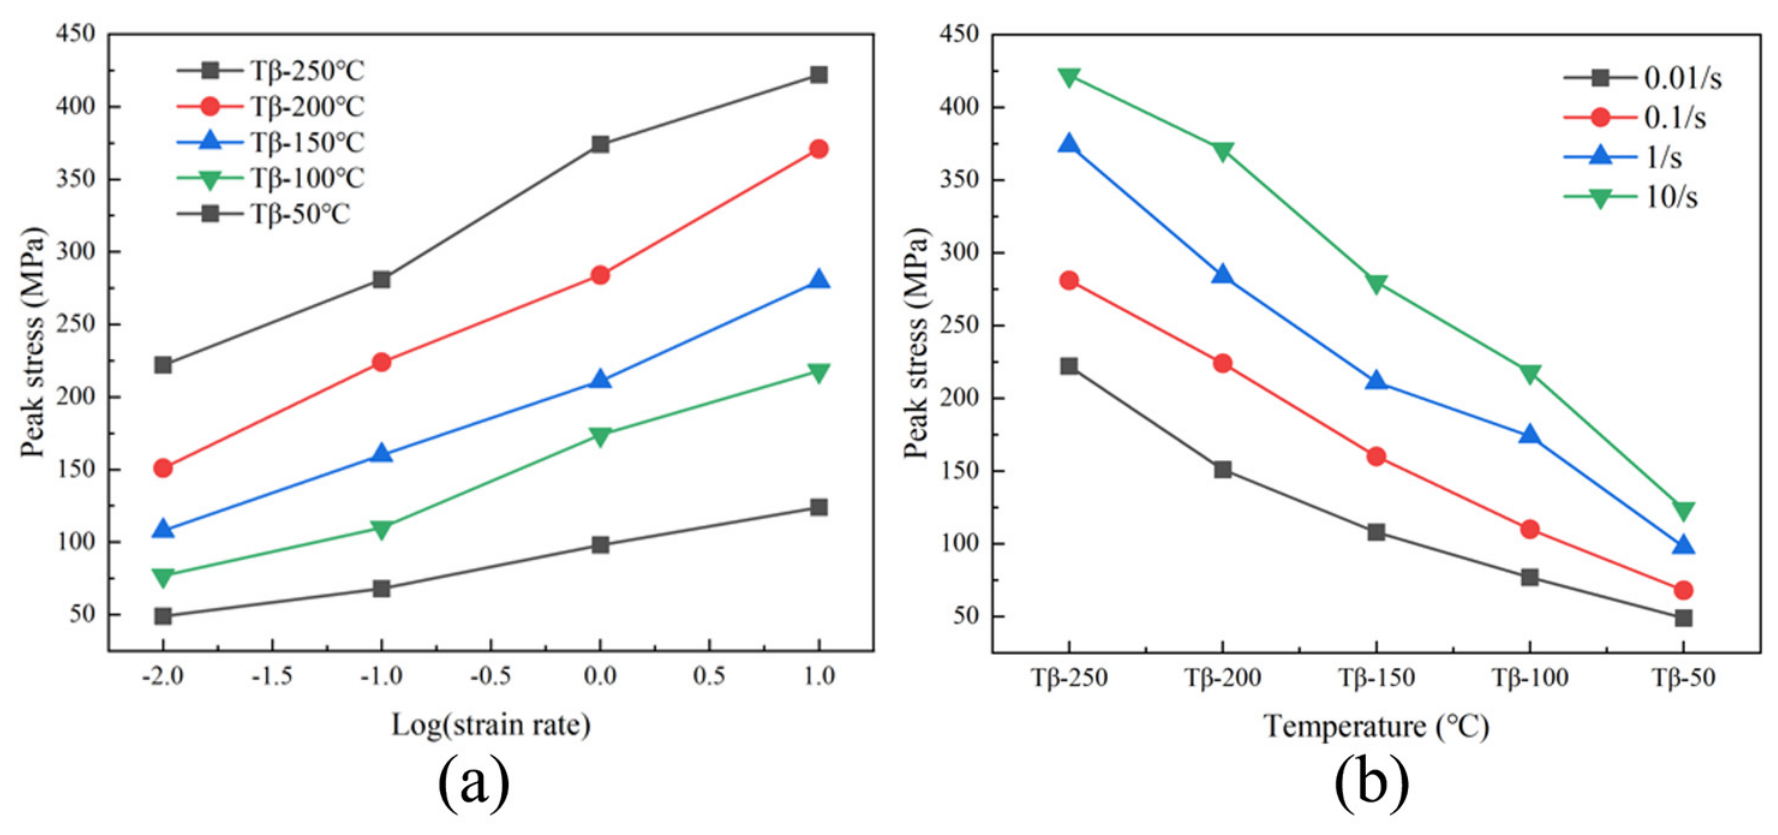
Figure 2 presents the peak stress comparison of the Ti-6Al-1.3V-0.9Fe alloy under different deformation temperatures and strain rates. At a constant strain rate, the peak stress progressively decreases with increasing deformation temperature. This trend is explained by the increased occurrence of dynamic recrystallization and dynamic recovery at higher temperatures, which prevents dislocation accumulation and entanglement, thereby promoting a flow softening state in the alloy. At a constant temperature, higher strain rates result in greater peak stress. This is because a higher strain rate leads to a greater number of dislocations proliferating and entangling within a given time frame, which strengthens the alloy and consequently increases the peak stress.
Figure 2.
(a) Comparison of peak stresses of the Ti-6Al-1.3V-0.9Fe alloy at different deformation temperatures; (b) Comparison of peak stresses of the Ti-6Al-1.3V-0.9Fe alloy at different strain rates.
The Prasad processing map model of the Dynamic Material Model is extensively utilized in the hot deformation studies of metallic materials and has become one of the effective means for optimizing material processing [20]. Throughout the process, the energy input from external sources impacts the alloy in two primary ways: first, plastic deformation, where most of the energy is dissipated as heat, with only a small portion stored within the alloy; and second, microstructural evolution, which requires energy to proceed, such as phase transformations, dynamic recovery, and dynamic recrystallization.
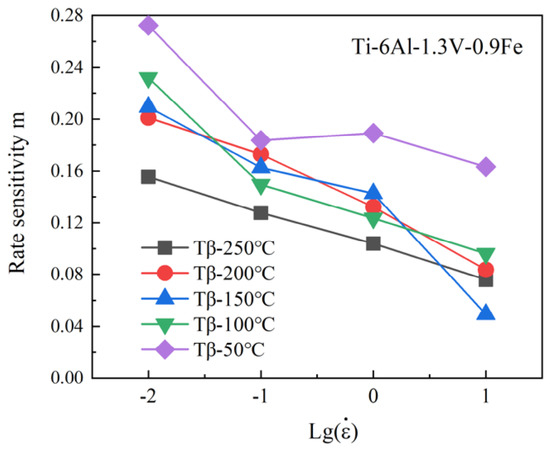
To quantitatively clarify the influence of strain rate on the flow stress of the Ti-6Al-1.3V-0.9Fe alloy, the strain rate sensitivity index (m) was calculated. This index characterizes the softening degree of the alloy during thermal deformation, where a larger m value indicates more significant flow softening behavior.
The calculation of m requires determining the flow stress under different deformation parameters at a fixed strain. Defined as the partial derivative of the logarithm of flow stress (lg σ) with respect to the logarithm of strain rate (lg , m varies nonlinearly with deformation rate and temperature. To enhance data reliability, the cubic spline interpolation method was employed to expand the dataset, and the relationship between lg σ and lg was fitted using a cubic polynomial:
where A, B, C, and D are fitting constants. By taking the partial derivative of both sides of Equation (1), the expression for m is derived as
Physically, a negative m value typically indicates the formation of microdefects in the specimen, such as adiabatic shear bands and microcracks. In general, m values ranging from 0 to 1 signify that the alloy is in a steady-state flow stage. A larger m value corresponds to a more stable processing window, and an m value of 1 represents an ideal linear dissipation state of the alloy.
As depicted in Figure 3, the m value of the Ti-6Al-1.3V-0.9Fe alloy decreases gradually with increasing strain rate at all deformation temperatures. Notably, the m value remains consistently highest when the deformation temperature is Tβ-50 °C, suggesting that this temperature range is optimal for the processing of the alloy. This can be rigorously explained through the synergistic evolution of phase fractions and dynamic softening mechanisms. From a physical metallurgy perspective, deforming the alloy at Tβ-50 °C establishes an optimal volume fraction balance between the remaining primary α phase and the high-temperature β phase. This optimal two-phase configuration generates a high density of α/β interphase boundaries. During hot compression, these phase boundaries serve a dual function. Firstly, they act as highly favorable nucleation sites for continuous dynamic recrystallization (CDRX) and the dynamic globularization of the α lamellae, thereby significantly enhancing the energy dissipation capacity of the material. Secondly, the abundant α/β interfaces accommodate localized strain through phase boundary sliding and cooperative deformation between the softer BCC matrix and the harder HCP phase, which mimics superplastic-like flow behavior and yields a remarkably high m value. Furthermore, the presence of the retained α phase at this specific sub-transus temperature effectively exerts a Zener pinning effect on the β phase, inhibiting the rapid β grain growth that would otherwise degrade workability and induce flow instability if the temperature were closer to or above the β-transus.
Figure 3.
Strain rate sensitivity index of the Ti-6Al-1.3V-0.9Fe alloy under different deformation conditions.
According to the Zener-Hollomon model [21], the flow stress during the hot deformation of metallic materials can be expressed as
where T is the deformation temperature, ε is the strain, is the strain rate, C is the chemical composition, and S is the microstructure. During hot working, the alloy composition remains essentially unchanged, so C can be treated as a constant. Since the microstructure S is also dependent on deformation parameters, Equation (3) can be simplified to:
At high strain rates, the relationship between strain rate and flow stress follows:
where A2 and β are both constants. Based on the correspondence between the formula and steady-state creep, Sellars and Tegart proposed the hyperbolic sine form of the Arrhenius equation [22]. This equation neglects the effect of strain and includes the thermal deformation activation energy Q and the deformation temperature T:
where A, α, and n are constants independent of temperature, is the strain rate (/s), Q is the deformation activation energy (kJ/mol), R is the gas molar constant, which is 8.314 J, σ is the flow stress value (MPa), and T is the absolute temperature at deformation (K).
Based on the Zener-Hollomon model, the Zener-Hollomon parameter (Z) is defined as
Combining Equations (6) and (7), the relationship between the Z parameter and flow stress σ is obtained:
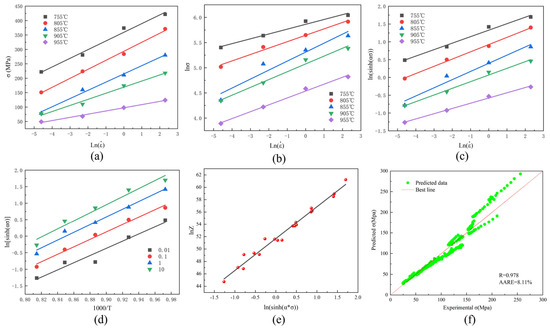
Figure 4a–c present the relationships and fitting curves of , , and for the Ti-6Al-1.3V-0.9Fe alloy. The average values of β, n1, and n were calculated from the slopes of the fitted lines, and the α value was further derived using these parameters. Subsequently, substituting α into the relationship, the average n value was determined via least-squares fitting.
Figure 4.
The relationship between deformation rate and peak stress of the Ti-6Al-1.3V-0.9Fe alloy: (a) , (b) , (c) , (d) The parametric relationship between deformation temperature and peak stress of the Ti-6Al-1.3V-0.9Fe alloy (), (e) The relationship curve of for the Ti-6Al-1.3V-0.9Fe alloy, (f) correlation between the experimental and predicted flow stress of the Ti-6Al-1.3Fe-0.9V alloy.
Figure 4d shows the linear fitting results of () for the alloy. The hot deformation activation energy Q was calculated by substituting the previously obtained β, n1, and n into the fitting equation, and was further derived by substituting Q into the corresponding formula. Finally, substituting all these parameters into Equation (8) enabled the calculation of Z values under different deformation conditions.
Based on the hot deformation data of the Ti-6Al-1.3V-0.9Fe alloy, all relevant constitutive parameters were determined. By fitting the , , and relationships, the linear equations with the highest degree of fit for the Ti-6Al-1.3V-0.9Fe alloy were obtained, as illustrated in Figure 4e. The detailed constitutive equation parameters are shown in Table 2. Figure 4f shows the correlation between the experimental and predicted flow stress of the Ti-6Al-1.3V-0.9Fe alloy, with an R value of 0.978 and an AARE value of 8.11%. This could prove the high predictive accuracy of the established constitutive equation. The apparent activation energy (Q) for the hot deformation of the Ti-6Al-1.3V-0.9Fe alloy was calculated to be 503.81 kJ/mol. Notably, this value is substantially higher than the self-diffusion activation energies of pure α-Ti (169 kJ/mol) and β-Ti (153 kJ/mol) [23]. It is also comparable to or slightly higher than the typical Q values reported for standard Ti-6Al-4V alloys deformed in the α + β two-phase region (typically ranging from 400 to 500 kJ/mol) [24]. The markedly high Q value indicates that the hot deformation behavior of this newly designed alloy is not solely a diffusion-controlled process. Instead, it is governed by complex dynamic softening mechanisms, such as dynamic recrystallization (DRX), which require extra thermal activation to overcome substantial microstructural barriers. Specifically, the addition of Fe plays a dual and complex role in altering the hot workability. On the one hand, as a strong β-stabilizer, Fe lowers the β-transus temperature and promotes the formation of the softer body-centered cubic (BCC) β phase, which generally favors high-temperature deformation. On the other hand, the partitioning of Fe (along with V) into the β phase induces severe lattice distortion and a strong solid-solution strengthening effect. The presence of these alloying elements exerts a significant solute drag effect on mobile dislocations. Furthermore, during deformation in the α + β region, the dense α/β phase interfaces act as highly effective barriers to dislocation glide and climb. Consequently, higher thermal activation energy (503.81 kJ/mol) is required to overcome this robust deformation resistance and initiate macroscopic flow and DRX.
Table 2.
The parameters of the constitutive equation of the Ti-6Al-1.3V-0.9Fe alloy.
The current Ti-6Al-1.3V-0.9Fe alloy exhibits a lower apparent activation energy (Q = 503.81 kJ/mol) compared to the previously studied Ti-6Al-0.4V-1.2Fe alloy (Q = 516.65 kJ/mol) [25]. The calculated activation energies for both alloys are statistically comparable, considering the margin of experimental error. While the slight variation might be related to the modified V/Fe ratio, further high-precision investigations are required to confirm this potential trend.
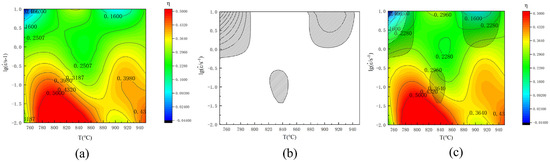
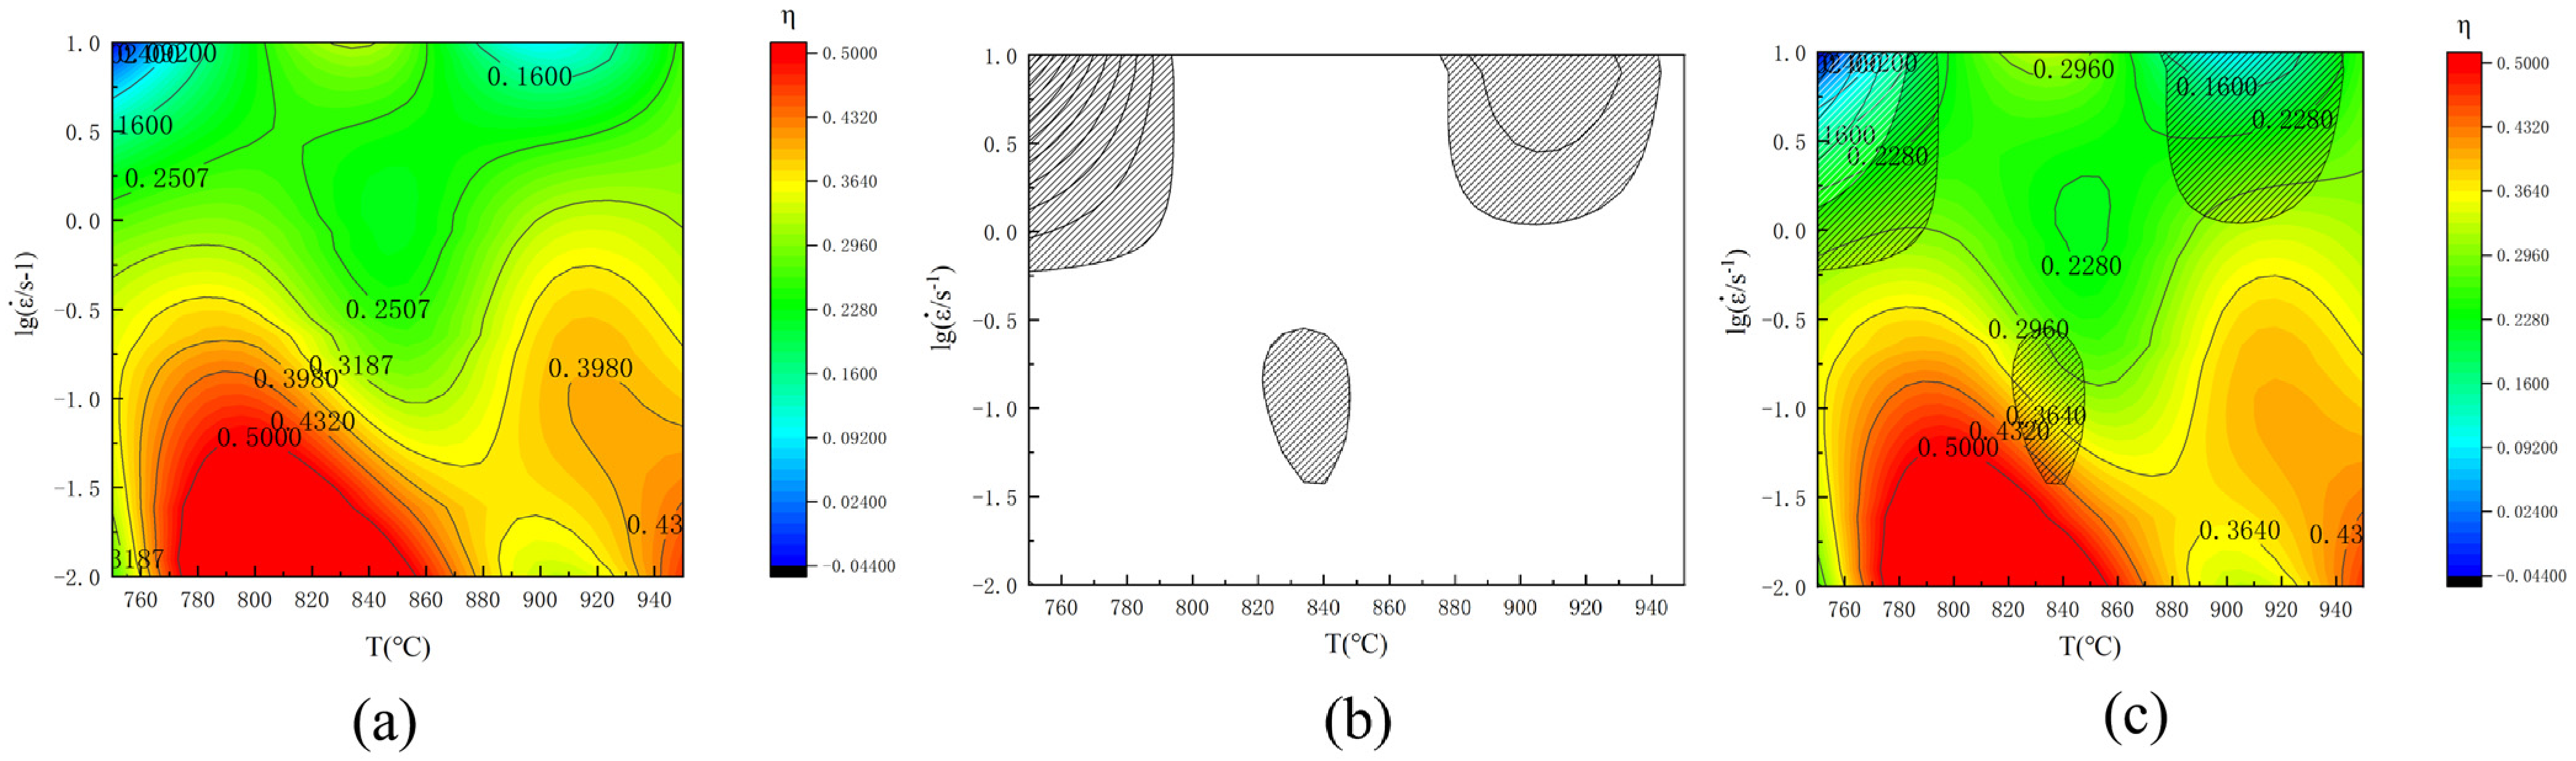
True stress–strain data under various conditions were obtained through hot compression experiments on Ti-6Al-1.3V-0.9Fe alloy. However, these data merely reflect the mechanical properties under specific deformation temperatures and strain rates, making it challenging to comprehensively assess the alloy’s processability across the entire temperature and strain rate spectrum. Therefore, the introduction of a power dissipation map is proposed to achieve a more comprehensive and systematic evaluation of performance. The power dissipation map can illustrate the extent to which energy is utilized for microstructural evolution during deformation. Figure 5a presents the power dissipation map of the Ti-6Al-1.3V-0.9Fe alloy, where the red region indicates high dissipation efficiency, signifying that a larger proportion of the total energy is consumed for microstructural evolution during hot deformation, typically accompanied by dynamic recovery and dynamic recrystallization, resulting in better hot workability. In contrast, the blue region represents low dissipation efficiency, where the alloy cannot undergo sufficient dynamic microstructural evolution during hot deformation, leading to poorer hot workability.
Figure 5.
(a) power dissipation plot; (b) destabilization plot; (c) thermal processing plot for Ti-6Al-1.3V-0.9Fe alloy.
During the deformation of titanium alloys, higher dissipation efficiency values facilitate the occurrence of microstructural evolution mechanisms such as dynamic recovery and dynamic recrystallization but can also lead to various defects. These defects can significantly impact the hot plastic deformation of titanium alloys. Therefore, using dissipation efficiency alone as a criterion for judging the processing regions of titanium alloys is inaccurate, necessitating the introduction of the concept of instability zones. The most commonly used Prasad instability criterion is employed to predict the instability zones of the Ti-6Al-1.3V-0.9Fe alloy. When the rate of entropy production in the system is less than the external deformation rate, the system will exhibit localized flow phenomena, known as flow instability. The resulting instability map is shown in Figure 5b.
The superposition of the power dissipation map and the flow instability map yields the hot-working map of the Ti-6Al-1.3V-0.9Fe alloy, as depicted in Figure 5c. It can be observed that there are three instability zones in the hot-working map. The ξ() values are negative in the region with deformation temperatures of 840 °C to 880 °C and strain rates of approximately 1 s−1 to 10 s−1, indicating that adiabatic shear bands may occur during hot working in these regions. Additionally, all instability zones are in the low-temperature and high-strain-rate regions, where insufficient deformation time under high strain rates makes the alloy more prone to defects. The optimal processing region for the Ti-6Al-1.3V-0.9Fe alloy is ultimately determined to be within the temperature range of 760 °C to 860 °C and the strain rate range of 0.01 s−1 to 0.16 s−1. The OM image of 800 °C, 0.01 s−1, the microstructure was displayed typical dynamic recrystallized features with fine equiaxed grains in Figure S1, demonstrated that the process window of 800 °C and 0.01 s−1 can indeed refine and soften materials.
The variation in the V/Fe ratio fundamentally shifts the optimal industrial processing windows by altering the intrinsic deformation kinetics. The processing map of the current Ti-6Al-1.3V-0.9Fe alloy identifies a highly stable optimum window at 760–860 °C and 0.01–0.16 s−1. Compared to the Ti-6Al-0.4V-1.2Fe alloy [25], which exhibited its optimum processing domain at 820–950 °C and a strain rate of 0.01–0.32 s−1, the current composition shifts the optimal hot workability region to notably lower temperatures and a narrower strain rate range. This shift to lower temperatures is a direct macroscopic consequence of the lowered activation barrier (503.81 kJ/mol) and the enhanced dynamic softening promoted by the optimized V/Fe ratio, which facilitates deformation at lower thermal inputs.
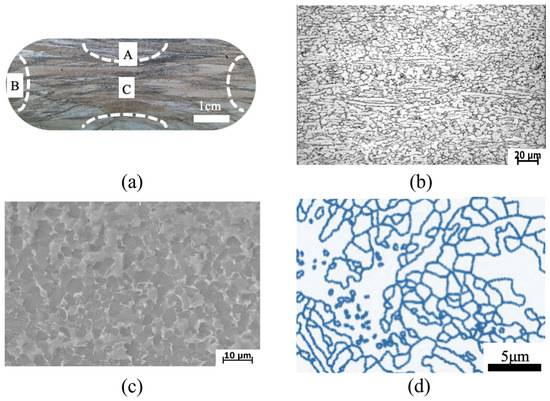
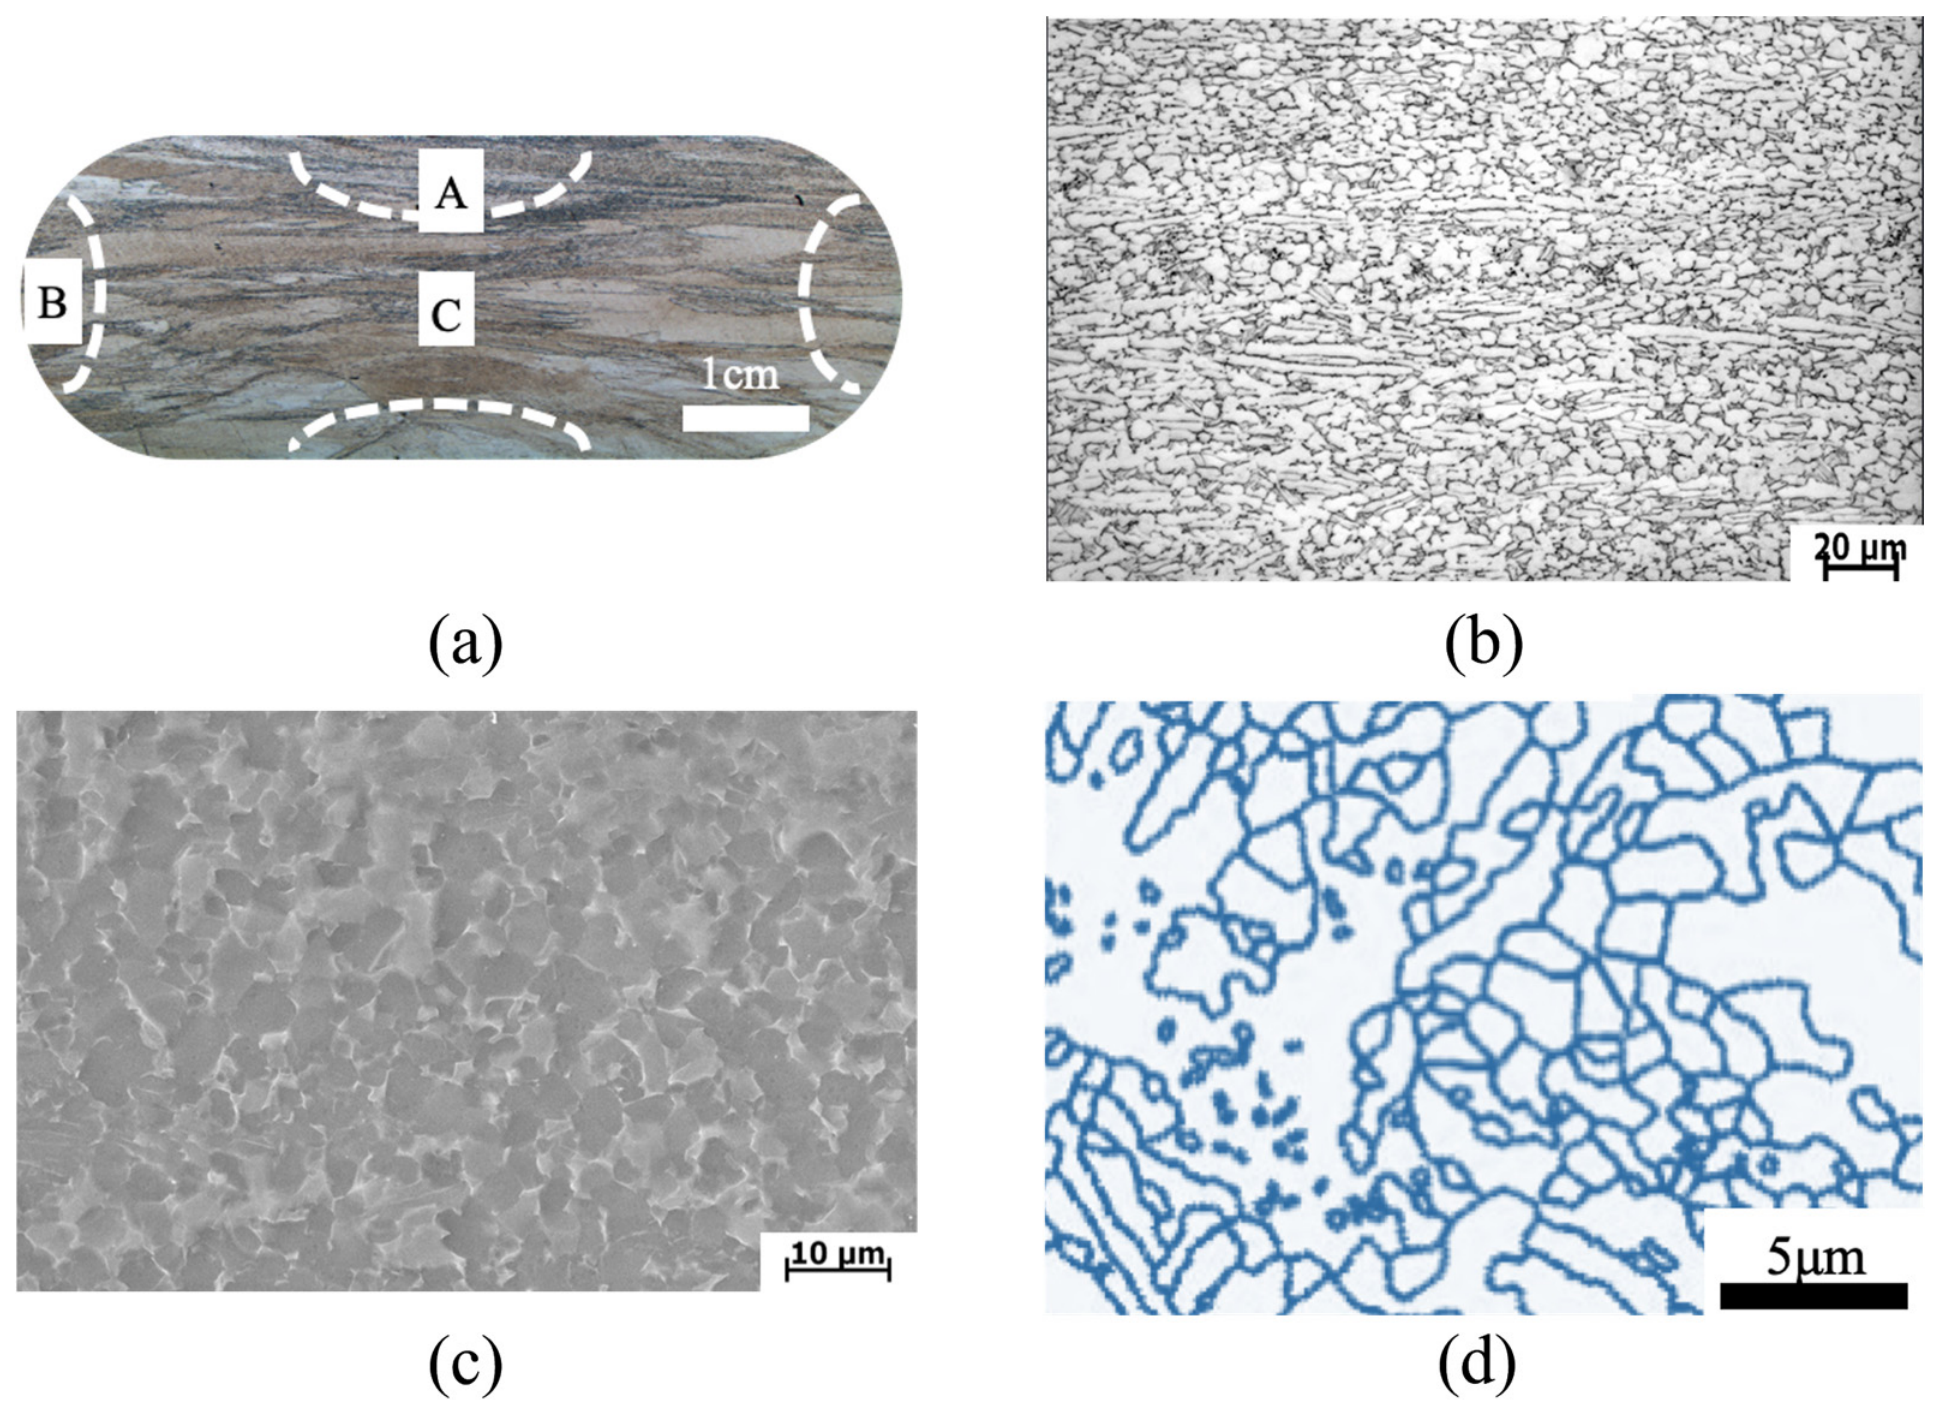
Figure 6 illustrates the macrostructure, deformed microstructure (OM and SEM images), and deformed grain boundary microstructure of the Ti-6Al-1.3V-0.9Fe alloy after deformation at a deformation temperature of 955 °C and a strain rate of 0.01 s−1. Area A, subjected to triaxial compressive stresses during hot compression, exhibits relatively minor microstructural changes, with coarser grains and occasional twisted β grain boundaries. Area B, located at the edge of the hot compression specimen, experiences deformation under uniaxial loading. According to the principle of constant volume, the specimen gradually assumes a barrel shape during hot compression. In Area B, grains are subjected to hoop tension, leading to the gradual disappearance of original β grain boundaries and a reduction in grain size. The central area C of the specimen, experiencing the least load constraint, undergoes the most significant deformation during hot compression. The original β grains are completely fragmented, and the initial α phase is also deformed.
Figure 6.
Ti-6Al-1.3V-0.9Fe alloy after deformation: (a) macroscopic histogram; (b) deformed microstructure OM map; (c) SEM map; (d) grain boundary microstructure.
As shown in Figure 6b, the deformed microstructure of the Ti-6Al-1.3V-0.9Fe alloy lacks distinct grain boundaries and elongated grains, indicating a uniform microstructure without significant dynamic recovery. The alloy contains some equiaxed α phase, with new recrystallized grains forming around or within it. During recrystallization, grains absorb dislocations via sub-grain boundaries, increasing angles and transforming small-angle boundaries into large-angle ones, leading to a uniform microstructure that aligns with continuous dynamic recrystallization (CDRX).
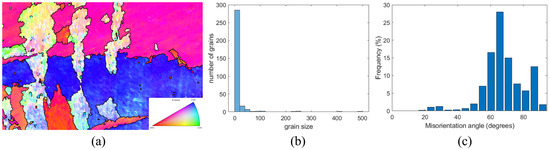
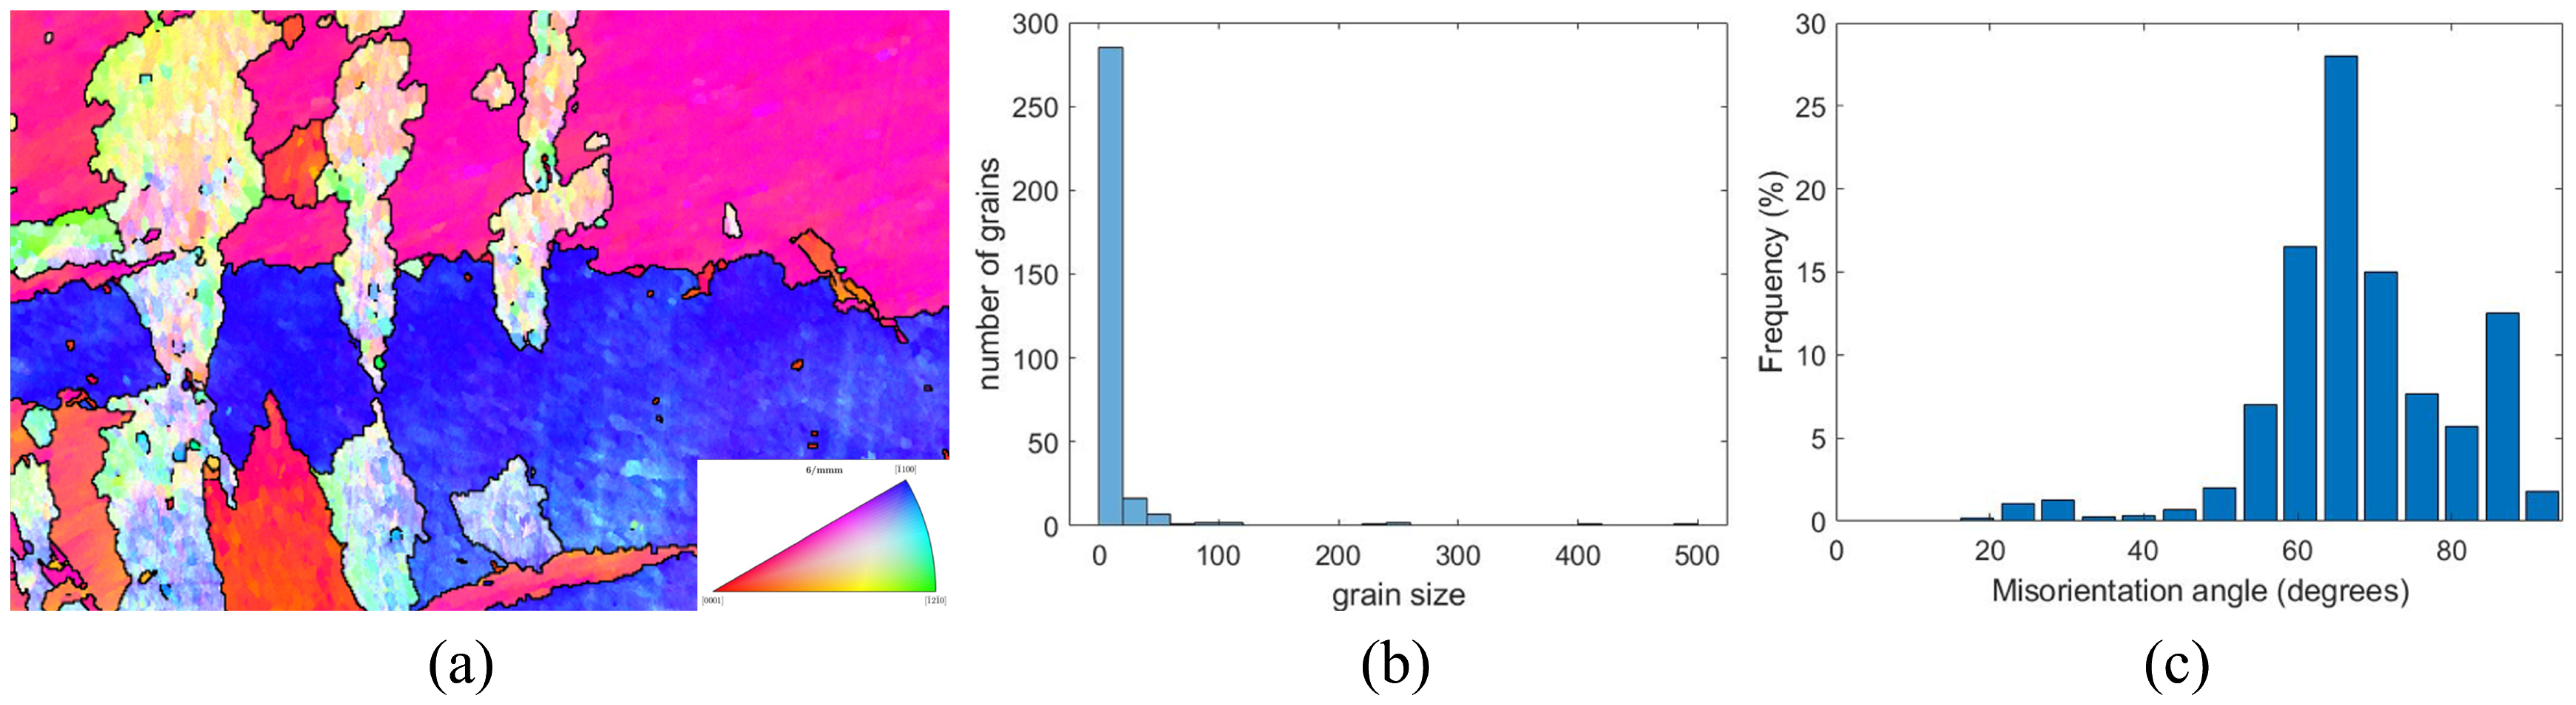
Figure 7a presents the inverse pole figure (IPF) of the Ti-6Al-1.3V-0.9Fe alloy after deformation, showing small grain clusters. Figure 7b illustrates the grain size distribution, where most grains are between 0 and 25 μm, with a few between 25 and 75 μm, and some very large grains. Figure 7c presents the grain boundary angle distribution of the Ti-6Al-1.3V-0.9Fe alloy, where high-angle grain boundaries are predominant, mainly ranging from 60° to 80°, while low-angle grain boundaries are almost nonexistent. This confirms that the primary dynamic softening mechanism in the Ti-6Al-1.3V-0.9Fe alloy is continuous dynamic recrystallization (CDRX). The pronounced dominance of continuous dynamic recrystallization (CDRX) as the primary dynamic softening mechanism is intrinsically linked to the unique initial as-cast microstructure of the Ti-6Al-1.3V-0.9Fe alloy. During the initial solidification and cooling processes, the strong partitioning and high growth restriction effect of the 0.9 wt.% Fe addition dramatically refines the prior α grains and promotes the formation of widely dispersed, spheroidized α particles. Consequently, the starting material inherently possesses an exceptionally high density of initial α/β interphase boundaries and β grain boundaries. During subsequent hot compression, these dense, pre-existing interfaces act as highly efficient physical barriers, severely impeding dislocation glide and accelerating localized dislocation pileups. This rapid accumulation of dislocations significantly promotes the swift formation of low-angle grain boundaries (LAGBs) and sub-grains within the refined β matrix. More importantly, the uniformly distributed spheroidized α particles exert a robust Zener pinning effect on the migrating β boundaries. This localized pinning effectively suppresses the macroscopic grain boundary bulging. Kinetically restricted from triggering conventional DDRX, the highly strained matrix accommodates the deformation energy predominantly through the progressive absorption of mobile dislocations into the pre-existing LAGBs. This continuous accumulation seamlessly drives the gradual rotation of sub-grains, progressively transforming LAGBs into high-angle grain boundaries (HAGBs), thereby firmly establishing CDRX as the governing microstructural evolution pathway.
Figure 7.
Ti-6Al-1.3V-0.9Fe alloy after deformation: (a) IPF diagram; (b) grain size distribution; and (c) grain boundary angle distribution.
4. Conclusions
The hot deformation behavior of the Ti-6Al-1.3V-0.9Fe alloy was studied using a Gleeble 3800 thermal simulator. The following conclusions were drawn:
- (1)
- The stress–strain curves of the Ti-6Al-1.3V-0.9Fe alloy show typical single-peak flow behavior. The flow stress decreases with increasing deformation temperature and increases with strain rate. Higher temperatures and lower strain rates facilitate stable flow and processing.
- (2)
- The optimal processing parameters for the Ti-6Al-1.3V-0.9Fe alloy, based on its hot-working map, are deformation temperature 760 °C to 860 °C and strain rate 0.01 s−1 to 0.16 s−1.
- (3)
- The flow instability domains of the Ti-6Al-1.3V-0.9Fe alloy are precisely identified in the medium-temperature and high-strain-rate regions, specifically at temperatures of 840 °C to 880 °C and strain rates between 1 s−1 and 10 s−1. To ensure structural integrity and optimal hot workability, industrial forging or rolling processes should be strictly restricted from entering this specific instability window.
Supplementary Materials
The following supporting information can be downloaded at: https://www.mdpi.com/article/10.3390/cryst16080534/s1, Figure S1: Ti-6Al-1.3V-0.9Fe alloy after deformation at 800 °C, 0.01 s−1.
Author Contributions
C.G.: Original draft writing, Methodology, Investigation, Data curation, Formal analysis. H.G.: Review & editing, Funding acquisition, Resource. Z.S.: Review & editing, Validation. J.Z.: Validation, Review & editing. G.D.: Supervision, Review & editing. All authors have read and agreed to the published version of the manuscript.
Funding
This work was financially supported by the Project of Laser Processing and Metal Additive Manufacturing Technology and Application (SJK2023-3), “Qinglan Project” Funding for Higher Education Institutions in Jiangsu (SJSH2025-16), the International Cooperation Project of Jiangsu Province (BZ2025016), Nantong Major Scientific and Technological Achievement Transformation Project (XA2025012), the Basic Science (Natural Science) Research Project of Higher Education Institutions in Jiangsu Province (24KJA460007), the Project of Nantong Natural Science (JC2023059).
Data Availability Statement
The raw/processed data required to reproduce these findings could be available upon reasonable request.
Acknowledgments
This study did not receive any additional administrative support, technical support, or donations of the kind that are not already covered in the author’s contributions or funding sections. Furthermore, GenAI 3.0 pro tools were utilized for generating the core text, data, graphics, or for study design and data analysis.
Conflicts of Interest
The authors declare no conflicts of interest.
References
- Tan, A.W.-Y.; Lek, J.Y.; Sun, W.; Bhowmik, A.; Marinescu, I.; Buenconsejo, P.J.; Dong, Z.; Liu, E. Microstructure, mechanical and tribological properties of cold sprayed Ti6Al4V–CoCr composite coatings. Compos. Part B Eng. 2020, 202, 108280. [Google Scholar] [CrossRef] [Scilit]
- Yuan, Z.; He, Y.; Lin, C.; Liu, P.; Cai, K. Antibacterial surface design of biomedical titanium materials for orthopedic applications. J. Mater. Sci. Technol. 2021, 78, 51–67. [Google Scholar] [CrossRef] [Scilit]
- Yu, J.; Li, Z.; Qian, C.; Huang, S.; Xiao, H. Investigation of deformation behavior, microstructure evolution, and hot processing map of a new near-α Ti alloy. J. Mater. Res. Technol. 2023, 23, 2275–2287. [Google Scholar] [CrossRef] [Scilit]
- Yan, S.; Song, G.-L.; Li, Z.; Wang, H.; Zheng, D.; Cao, F.; Horynova, M.; Dargusch, M.S.; Zhou, L. A state-of-the-art review on passivation and biofouling of Ti and its alloys in marine environments. J. Mater. Sci. Technol. 2018, 34, 421–435. [Google Scholar] [CrossRef] [Scilit]
- Wang, Y.; Qian, X.; Huang, F.; Fan, Y.; Wang, T.; Hu, L. Improving the anticorrosion property of outdoor fitness equipment via a novel Ti/Zr/Mo composite conversion coating. Mater. Res. Express 2023, 10, 076403. [Google Scholar] [CrossRef] [Scilit]
- Saini, A.; Pabla, B.; Dhami, S. Developments in cutting tool technology in improving machinability of Ti6Al4V alloy: A review. Proc. Inst. Mech. Eng. Part B J. Eng. Manuf. 2016, 230, 1977–1989. [Google Scholar] [CrossRef] [Scilit]
- Alabort, E.; Putman, D.; Reed, R. Superplasticity in Ti-6Al-4V: Characterisation, modelling and applications. Acta Mater. 2015, 95, 428–442. [Google Scholar] [CrossRef] [Scilit]
- Bodunrin, M.O.; Chown, L.H.; van der Merwe, J.W.; Alaneme, K.K. On the substitution of vanadium with iron in Ti-6Al-4V: Thermo-Calc simulation and processing map considerations for design of low-cost alloys. Mater. Sci. Eng. A 2020, 791, 139622. [Google Scholar] [CrossRef] [Scilit]
- Su, J.; Jiang, F.; Tan, C.; Weng, F.; Ng, F.L.; Goh, M.H.; Xie, H.; Liu, J.; Chew, Y.; Teng, J. Additive manufacturing of fine-grained high-strength titanium alloy via multi- eutectoid elements alloying. Compos. Part B Eng. 2023, 249, 110399. [Google Scholar] [CrossRef] [Scilit]
- Fan, K.; Liu, D.; Zhou, K.; Liu, Y.; Zhang, H.; Zhang, X.; Li, Y.; Li, M.; Li, Y.; Wahab, M.A. Enhanced fretting fatigue strength of TC11 titanium alloy using laser-assisted ultrasonic surface rolling process. Tribol. Int. 2024, 195, 109619. [Google Scholar] [CrossRef] [Scilit]
- Miao, Q.; Ding, W.; Zhu, Y.; Chen, Z.; Fu, Y. Brazing of CBN grains with Ag-Cu-Ti/TiX composite filler—The effect of TiX particles on microstructure and strength of bonding layer. Mater. Des. 2016, 98, 243–253. [Google Scholar] [CrossRef] [Scilit]
- Chen, F.; Gu, Y.; Xu, G.; Cui, Y.; Chang, H.; Zhou, L. Improved fracture toughness by microalloying of Fe in Ti-6Al-4V. Mater. Des. 2020, 185, 108251. [Google Scholar] [CrossRef] [Scilit]
- Sun, Y.; Qian, S.; Chang, H.; Duan, W.; Feng, L.; Li, F.; Zhou, L. Improved low cycle fatigue property of Ti-6Al-4V alloy by trace Fe addition. J. Mater. Res. Technol. 2024, 30, 8396–8408. [Google Scholar] [CrossRef] [Scilit]
- Liao, Y.; Bai, J.; Chen, F.; Xu, G.; Cui, Y. Microstructural strengthening and toughening mechanisms in Fe-containing Ti-6Al-4V: A comparison between homogenization and aging treated states. J. Mater. Sci. Technol. 2022, 99, 114–126. [Google Scholar] [CrossRef] [Scilit]
- Abdelrhman, Y.; Gepreel, M.A.H.; Kobayashi, S.; Okano, S.; Okamoto, T. Biocompatibility of new low-cost (α + β)-type Ti-Mo-Fe alloys for long-term implantation. Mater. Sci. Eng. C 2019, 99, 552–562. [Google Scholar] [CrossRef] [Scilit] [PubMed]
- Zhang, T.; Zhu, J.; Yang, T.; Luan, J.; Kong, H.; Liu, W.; Cao, B.; Wu, S.; Wang, D.; Wang, Y.; et al. A new α + β Ti-alloy with refined microstructures and enhanced mechanical properties in the as-cast state. Scr. Mater. 2022, 207, 114260. [Google Scholar] [CrossRef] [Scilit]
- Zhang, Z.X.; Qu, S.J.; Feng, A.H.; Shen, J.; Chen, D. Hot deformation behavior of Ti-6Al-4V alloy: Effect of initial microstructure. J. Alloys Compd. 2017, 718, 170–181. [Google Scholar] [CrossRef] [Scilit]
- He, L.; Dehghan-Manshadi, A.; Dippenaar, R.J. The evolution of microstructure of Ti-6Al-4V alloy during concurrent hot deformation and phase transformation. Mater. Sci. Eng. A 2012, 549, 163–167. [Google Scholar] [CrossRef] [Scilit]
- Guo, C.; Dai, G.; Guo, Y.; Xia, J.; Sun, Z.; Chang, H.; Zhang, Q.; Zhou, L. Fe modification altered the microstructure and mechanical properties of novel designed Ti-6Al-xV-yFe alloys. J. Alloys Compd. 2026, 1058, 186784. [Google Scholar] [CrossRef] [Scilit]
- Liu, J.; Wang, X.; Liu, J.; Liu, Y.; Li, H.; Wang, C. Hot deformation and dynamic recrystallization behavior of Cu-3Ti-3Ni-0.5Si alloy. J. Alloys Compd. 2019, 782, 224–234. [Google Scholar] [CrossRef] [Scilit]
- Humphreys, F.J.; Hatherly, M. Recrystallization and Related Annealing Phenomena; Elsevier: Amsterdam, The Netherlands, 2012. [Google Scholar]
- Sellars, C.M.; McTegart, W.J. On the mechanism of hot deformation. Acta Metall. 1966, 14, 1136–1138. [Google Scholar] [CrossRef] [Scilit]
- Seshacharyulu, T.; Medeiros, S.C.; Morgan, J.T.; Malas, J.; Frazier, W.; Prasad, Y. Hot deformation mechanisms in ELI grade Ti-6A1-4V. Scr. Mater. 1999, 41, 283–288. [Google Scholar] [CrossRef] [Scilit]
- Balasubrahmanyam, V.V.; Prasad, Y. Deformation behaviour of beta titanium alloy Ti-10V-4.5 Fe-1.5 Al in hot upset forging. Mater. Sci. Eng. A 2002, 336, 150–158. [Google Scholar] [CrossRef] [Scilit]
- Wan, G.; Ren, Z.; Guo, Y.; Sun, Z.; Chang, H. The analysis of hot deformation behaviour of low-cost α+ β Ti-6Al-0.4 V-1.2 Fe alloys. Mater. Sci. Technol. 2023, 39, 1530–1542. [Google Scholar] [CrossRef] [Scilit]

Disclaimer/Publisher’s Note: The statements, opinions and data contained in all publications are solely those of the individual author(s) and contributor(s) and not of MDPI and/or the editor(s). MDPI and/or the editor(s) disclaim responsibility for any injury to people or property resulting from any ideas, methods, instructions or products referred to in the content. |
© 2026 by the authors. Licensee MDPI, Basel, Switzerland. This article is an open access article distributed under the terms and conditions of the Creative Commons Attribution (CC BY) license.