


Abstract
To evaluate whether atmospheric-pressure plasma jet (APPJ) treatment induced early, sintering-related, surface microstructural variations in 3 mol% yttria-stabilized zirconia (3Y-TZP), with a particular focus on how treatment time affected the grain size and SEM-derived surface dark-area fraction, this exploratory study examined time-dependent surface microstructural changes in commercial 3 mol% yttria-stabilized zirconia (3Y-TZP) subjected to air APPJ exposure for 4, 8, 15, 30, or 60 min under fixed device settings. A separate no-dwell furnace reference series was used to contextualize surface microstructural changes during heating; it was not used to assign an equivalent temperature to APPJ exposure. Field-emission scanning electron microscopy was used to determine surface grain dimensions and a threshold-derived surface dark-area fraction. No specimen-surface temperature was recorded during APPJ exposure. Surface grain dimensions remained similar through 15 min and increased at 30 and 60 min, whereas the surface dark-area fraction changed modestly. Under the tested conditions, prolonged APPJ exposure was associated with marked surface grain coarsening and limited change in the SEM-derived dark-area fraction.
1. Introduction
The structural ceramic 3 mol% yttria-stabilized tetragonal zirconia polycrystal (3Y-TZP) is widely used in dentistry because of its high strength, fracture resistance, chemical stability, and favorable biocompatibility. In dental CAD/CAM workflows, zirconia blanks are milled into restorations and subsequently subjected to final sintering to obtain the microstructure and mechanical performance required for clinical service [1,2,3,4]. Accordingly, the development of low-thermal-budget, efficient, and controllable sintering strategies has become an important research direction in terms of 3Y-TZP processing [5,6,7,8].
In recent years, field-assisted sintering has opened up new approaches toward low-thermal-budget ceramic processing [9,10]. An atmospheric-pressure plasma jet (APPJ) is a remote external-field method that can operate in open air, combining reactive species, electric fields, and interfacial physicochemical reactions. An APPJ can be readily integrated into continuous manufacturing workflows. For these reasons, APPJs have attracted increasing attention in the non-contact material processing field. APPJs are used to treat surfaces, for etching and deposition, and to aid in the manufacture of flexible electronics [11,12,13].
Nevertheless, direct use of a plasma jet for sintering of 3Y-TZP remains poorly investigated. The feasibility thereof and the microstructural consequences require further exploration. During ceramic sintering, grain growth and densification are not entirely synchronous. Variations in their timing are governed by multiple mechanisms, including surface, grain-boundary, and bulk diffusion, and pore shrinkage [14,15]. The non-equilibrium environment that develops under plasma treatment may change the composition of reactive species, the energy-transfer pathways, and the interfacial reaction atmosphere, thereby influencing mass transport between particles, grain-boundary development, and pore variation [8,16,17]. Therefore, grain size and surface dark-area fraction must both be considered when assessing whether plasma treatment produces sintering-related changes [18,19].
Of the various processing parameters, treatment time is one of the most important because this determines the cumulative extent of plasma–specimen interaction. A systematic time-series comparison might clarify whether APPJ treatment principally affects grain enlargement, pore reduction, or both during the early stage of zirconia sintering. Therefore, the present study assessed early sintering-related microstructural variation in 3Y-TZP under APPJ treatment using grain size and surface dark-area fraction as the principal readouts, with a particular emphasis on the effects of treatment time.
2. Materials and Methods
2.1. Materials and Specimen Preparation
Commercial 3 mol% yttria-stabilized zirconia (3Y-TZP; ST-Color®, Upcera, Shenzhen, China) was supplied as green-state 3Y-TZP specimen blanks. Disk specimens (approximately 10 mm in diameter and 0.50 ± 0.05 mm in thickness) were milled from the blanks using X-mill 300 (XTCERA, Shenzhen, China). No post-milling polishing was performed before APPJ exposure or SEM observation, because the objective was to examine the as-treated external surface. A total of 75 specimens were randomly assigned to 15 experimental groups (n = 5 per group).
2.2. Experimental Design and Workflow
The design included two separate experimental series: (1) a no-dwell furnace reference series that described the surface microstructural response of the material during heating, and (2) an APPJ exposure-time series that assessed time-dependent changes under fixed plasma-device settings. These series were not designed as matched thermal-equivalence experiments. The untreated group (CONTRAST) served as the common starting-state reference. A routinely sintered group (SINTERED) was included as an endpoint reference for surface morphology and the corresponding SEM-derived measurements.
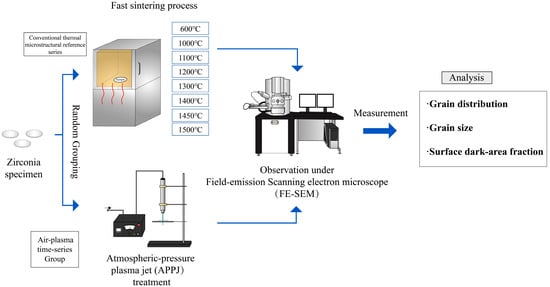
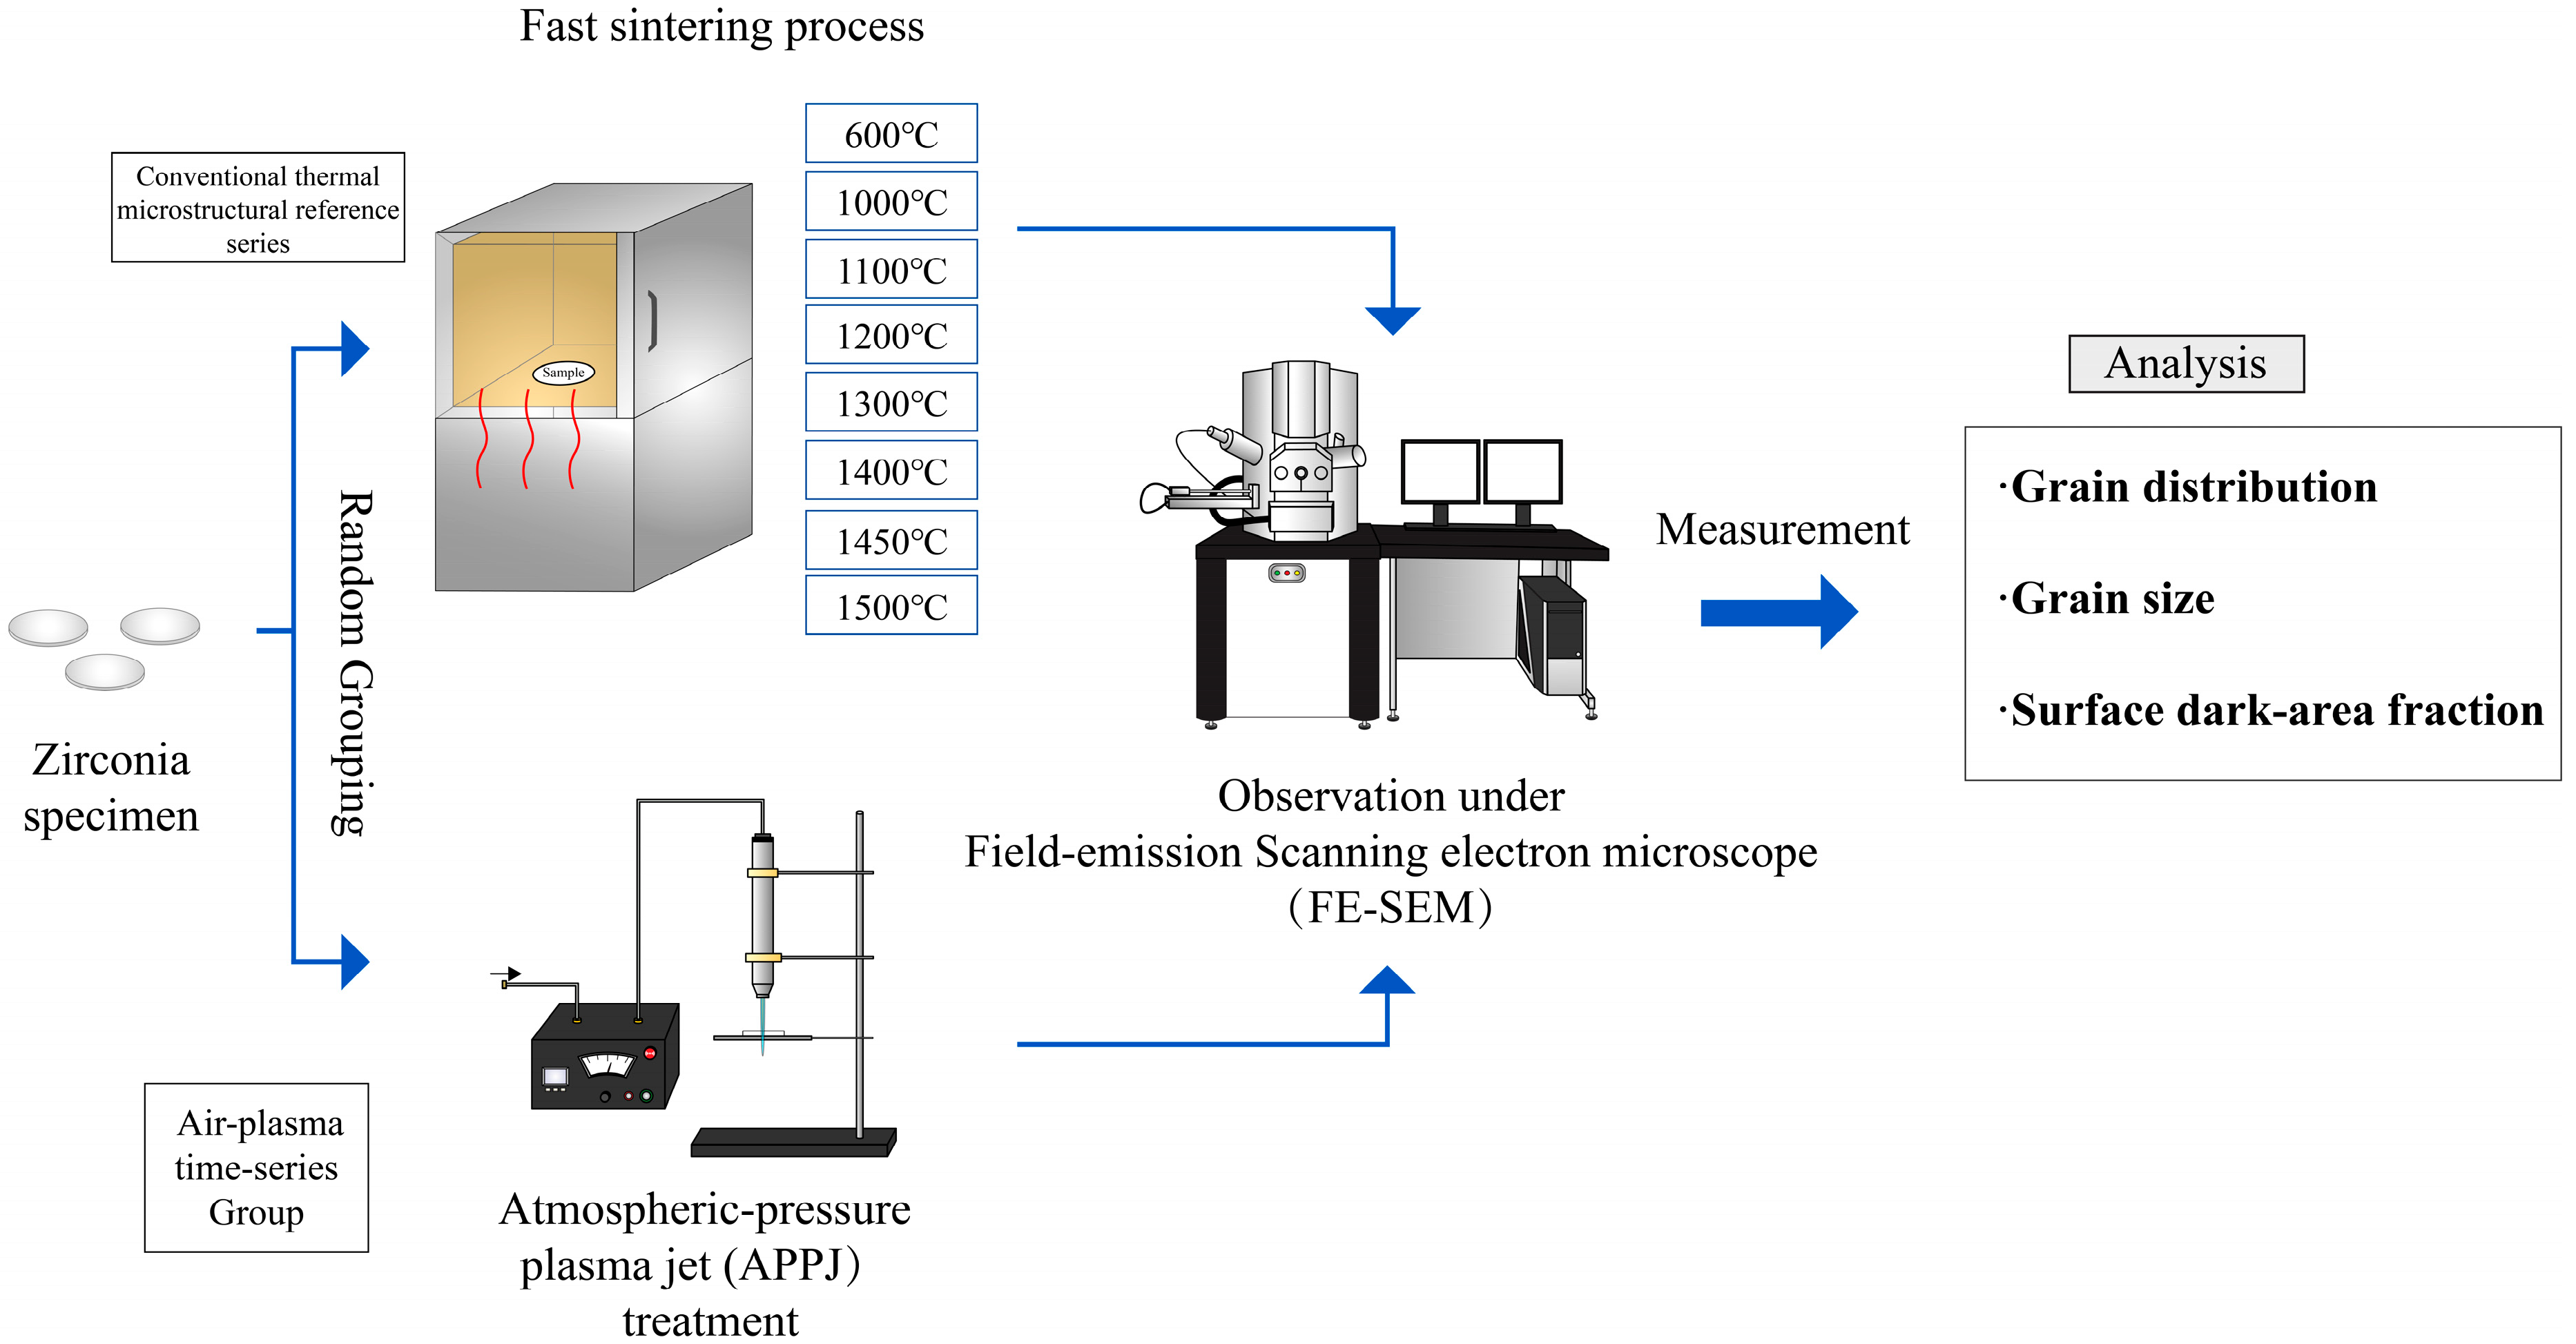
The workflow was specimen preparation, group allocation, furnace or APPJ treatment, FE-SEM observation of the relevant specimen surface, image-based quantification, and statistical or descriptive analysis (Figure 1).
Figure 1.
Experimental flowchart.
2.3. Conventional Thermal Microstructural Reference Series
Initially, one set of specimens was used to establish a conventional thermal microstructural reference series (“T groups”). The specimens were heated to 600, 1000, 1100, 1200, 1300, 1400, 1450, or 1500 °C (6T, 10T, 11T, 12T, 13T, 14T, 14.5T, and 15T). To establish the baseline, all specimens were heated from room temperature to the target temperature at 10 °C/min. No dwell time was scheduled at the target temperature; rather, all specimens were removed from the heat source immediately after they attained the preset temperature and then cooled naturally to room temperature. This series was used to provide a qualitative furnace-heating reference for surface microstructural evolution. It was not used to assign an equivalent temperature, thermal dose, or sintering stage to any APPJ exposure group.
2.4. Atmospheric-Pressure Plasma Jet Treatment
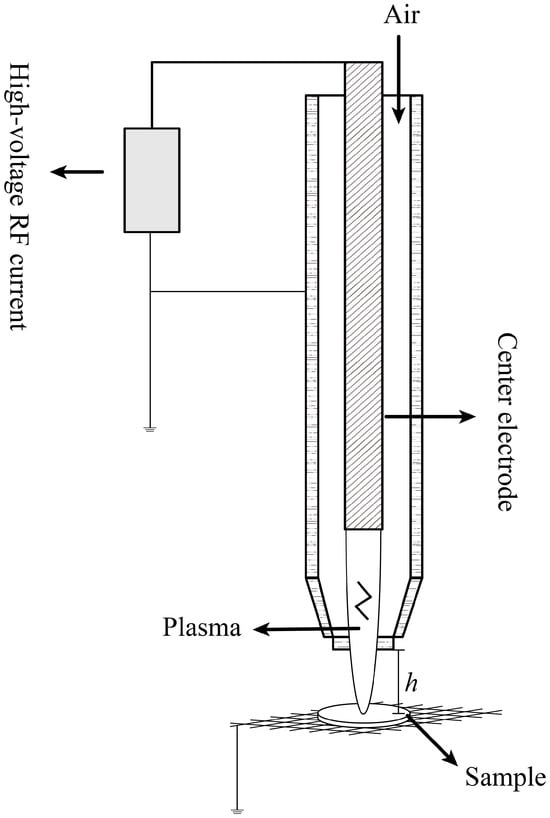
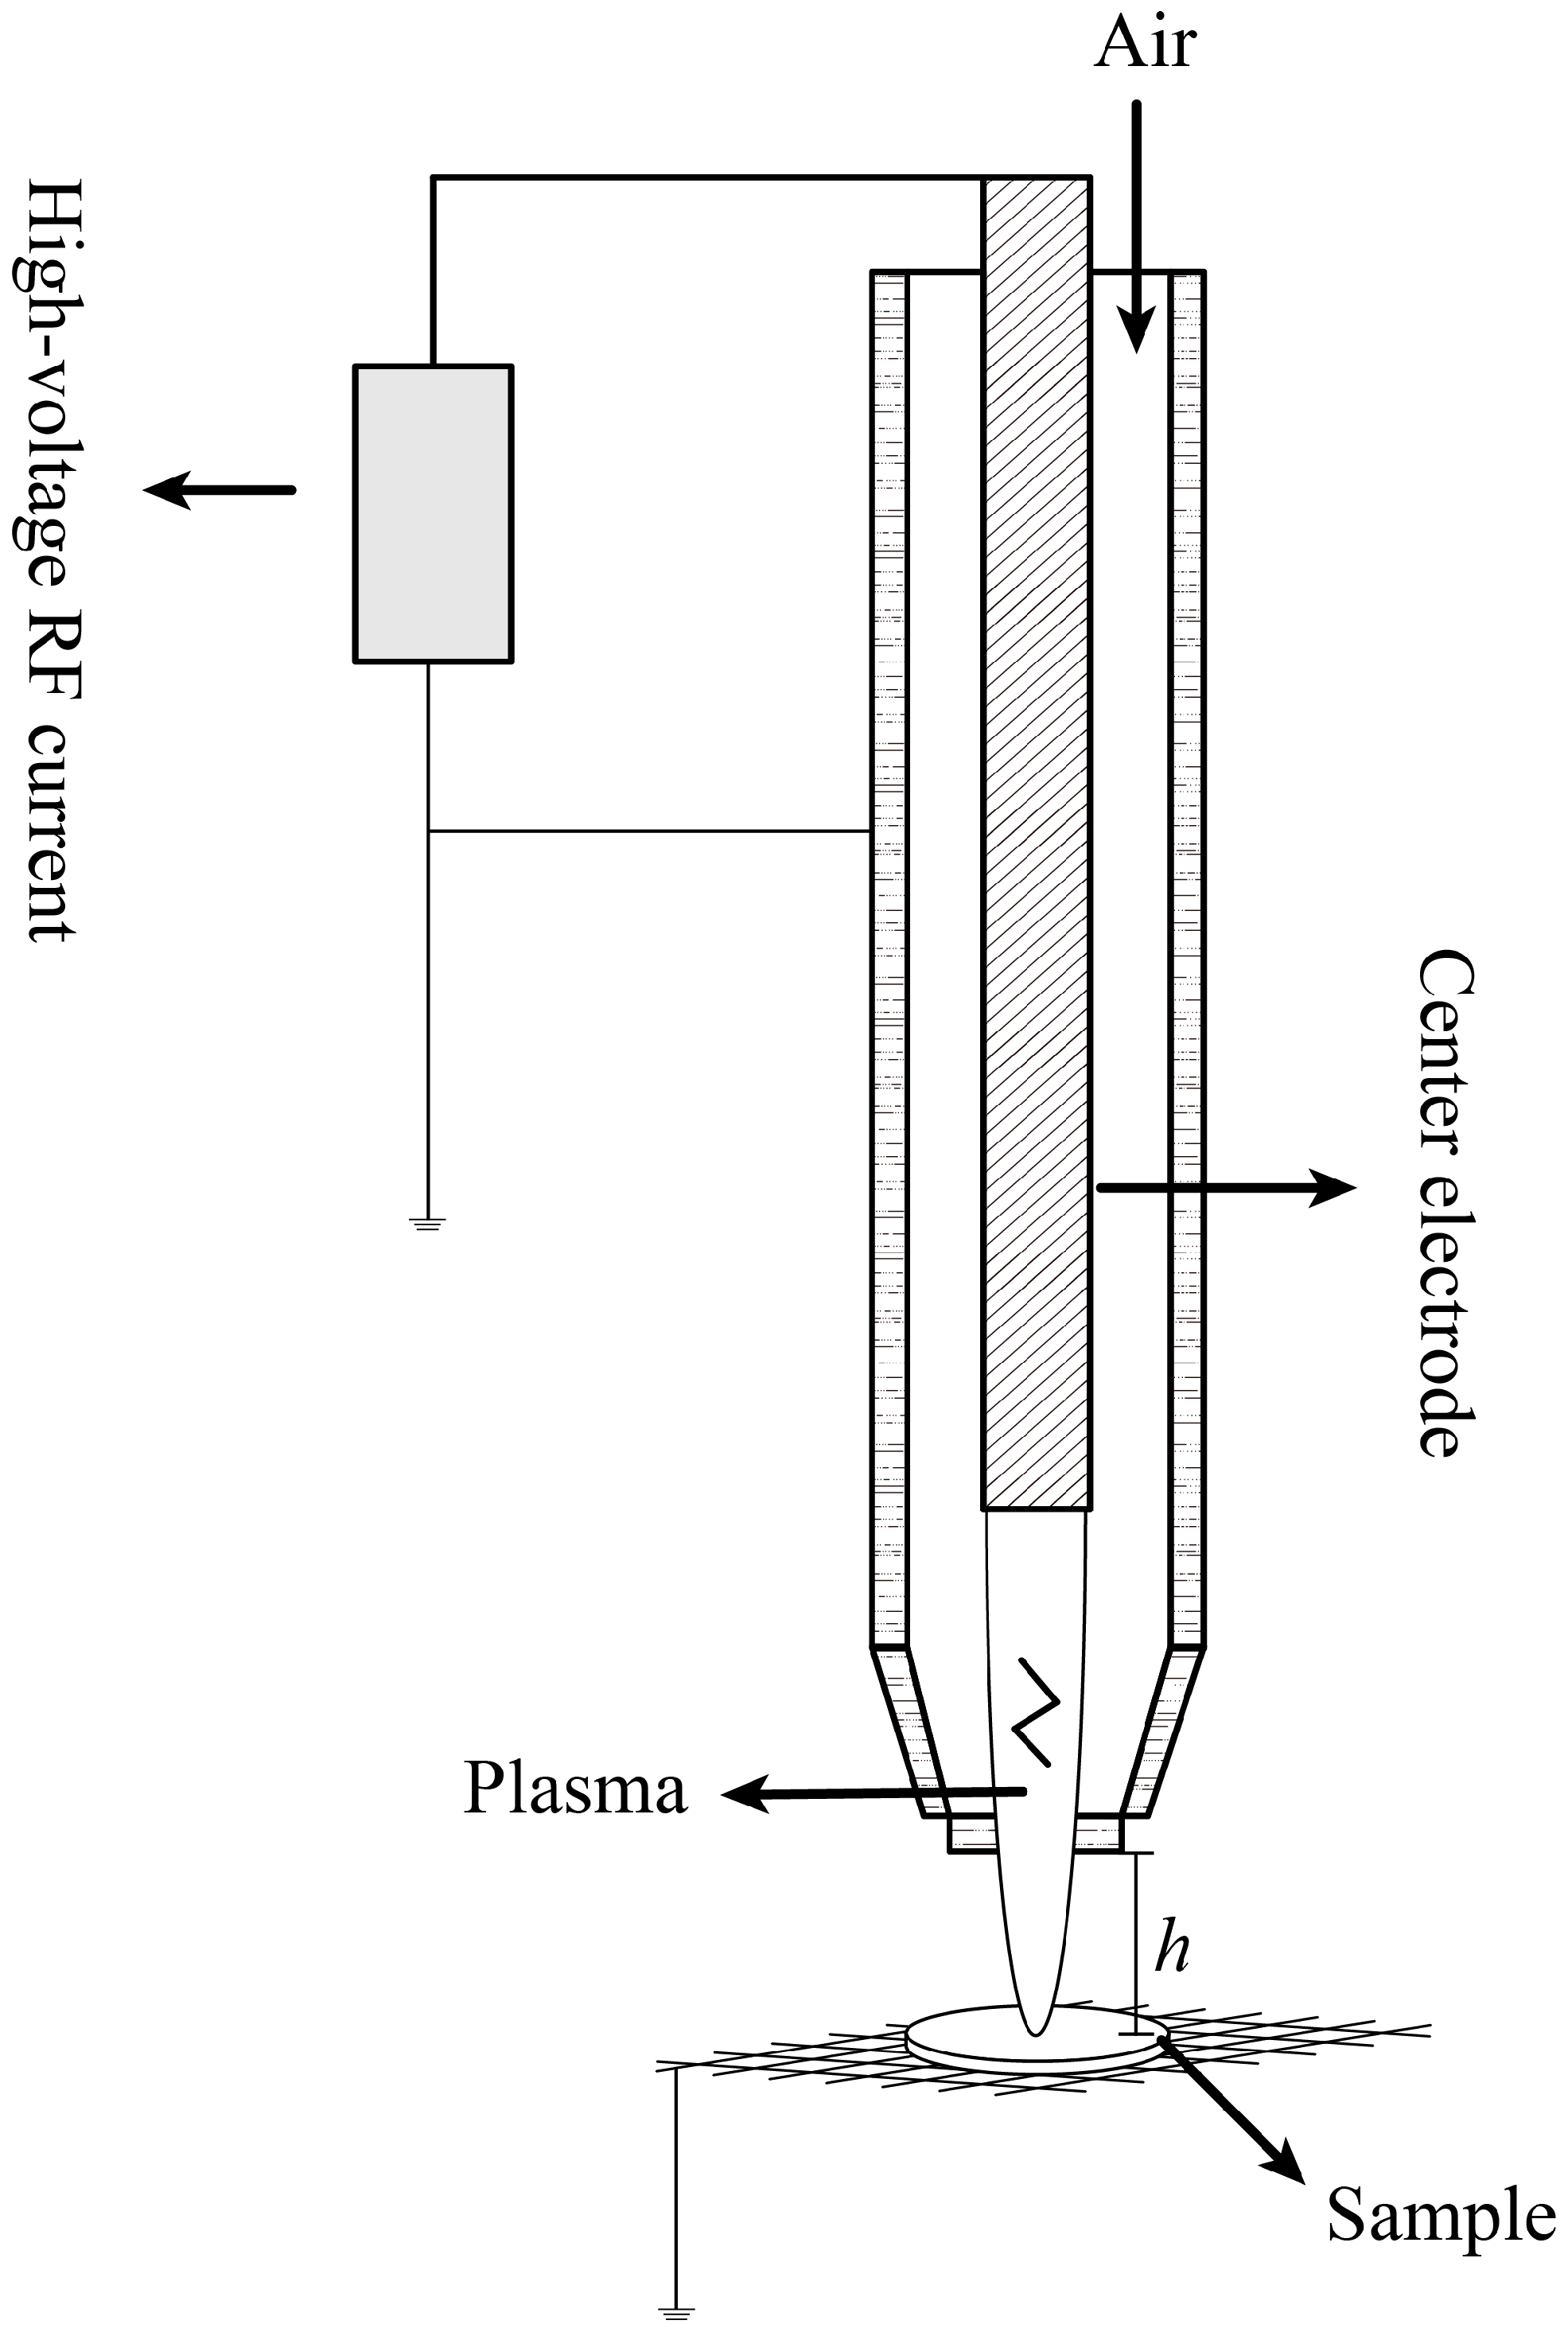
All plasma treatments employed the same APPJ platform (Figure 2), comprising a jet excitation unit, a grounded electrode, and a tungsten mesh support (99% W). The input voltage was 220 V, the rated power was 1000 W, and the operating power was 800 W. Compressed air was used as the working gas; the supply pressure was 0.4 MPa, the operating pressure was >0.2 MPa, and the nozzle-to-surface distance was 1 cm. Each disk was exposed sequentially on both faces (half of the stated total duration per face). The same handling sequence was used for all APPJ groups. No specimen-surface temperature or temperature distribution was recorded during exposure. Consequently, the present study does not separate plasma-specific effects from local heat-input effects and does not establish a thermal equivalence to furnace treatment.
Figure 2.
The APPJ platform in operation (h represents nozzle-to-surface distance).
For the time-series experiment, compressed air served as the working gas throughout, with treatment times of 4, 8, 15, 30, and 60 min. The corresponding air-plasma time-series groups are termed A4, A8, A15, A30, and A60, respectively.
No visually discernible warping was observed after treatment. This qualitative observation does not replace quantitative measurement of linear shrinkage or temperature uniformity. Energy-dispersive X-ray spectroscopy (EDS) spectra acquired from 5 representative post-treatment surface locations were used to screen for tungsten transfer. No W signal was detected at the analyzed locations (Supplementary Figure S1).
2.5. Microstructural Characterization
After thermal or plasma treatment, all specimens were submitted for microstructural examination. Surface morphologies were observed using an FE-SEM (SU8010, Hitachi, Tokyo, Japan). Before observation, all specimens were sputter-coated with gold for 90 s. Images were acquired at an accelerating voltage of 10 kV and at magnifications ranging from 10,000× to 30,000×. As different magnifications were selected by reference to actual surface features, all quantitative measurements of grain size and surface dark-area fraction were calibrated using the scale bars of the individual SEM images.
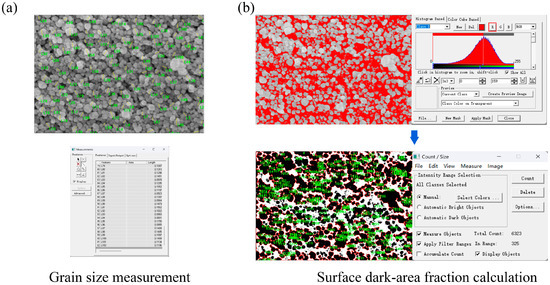
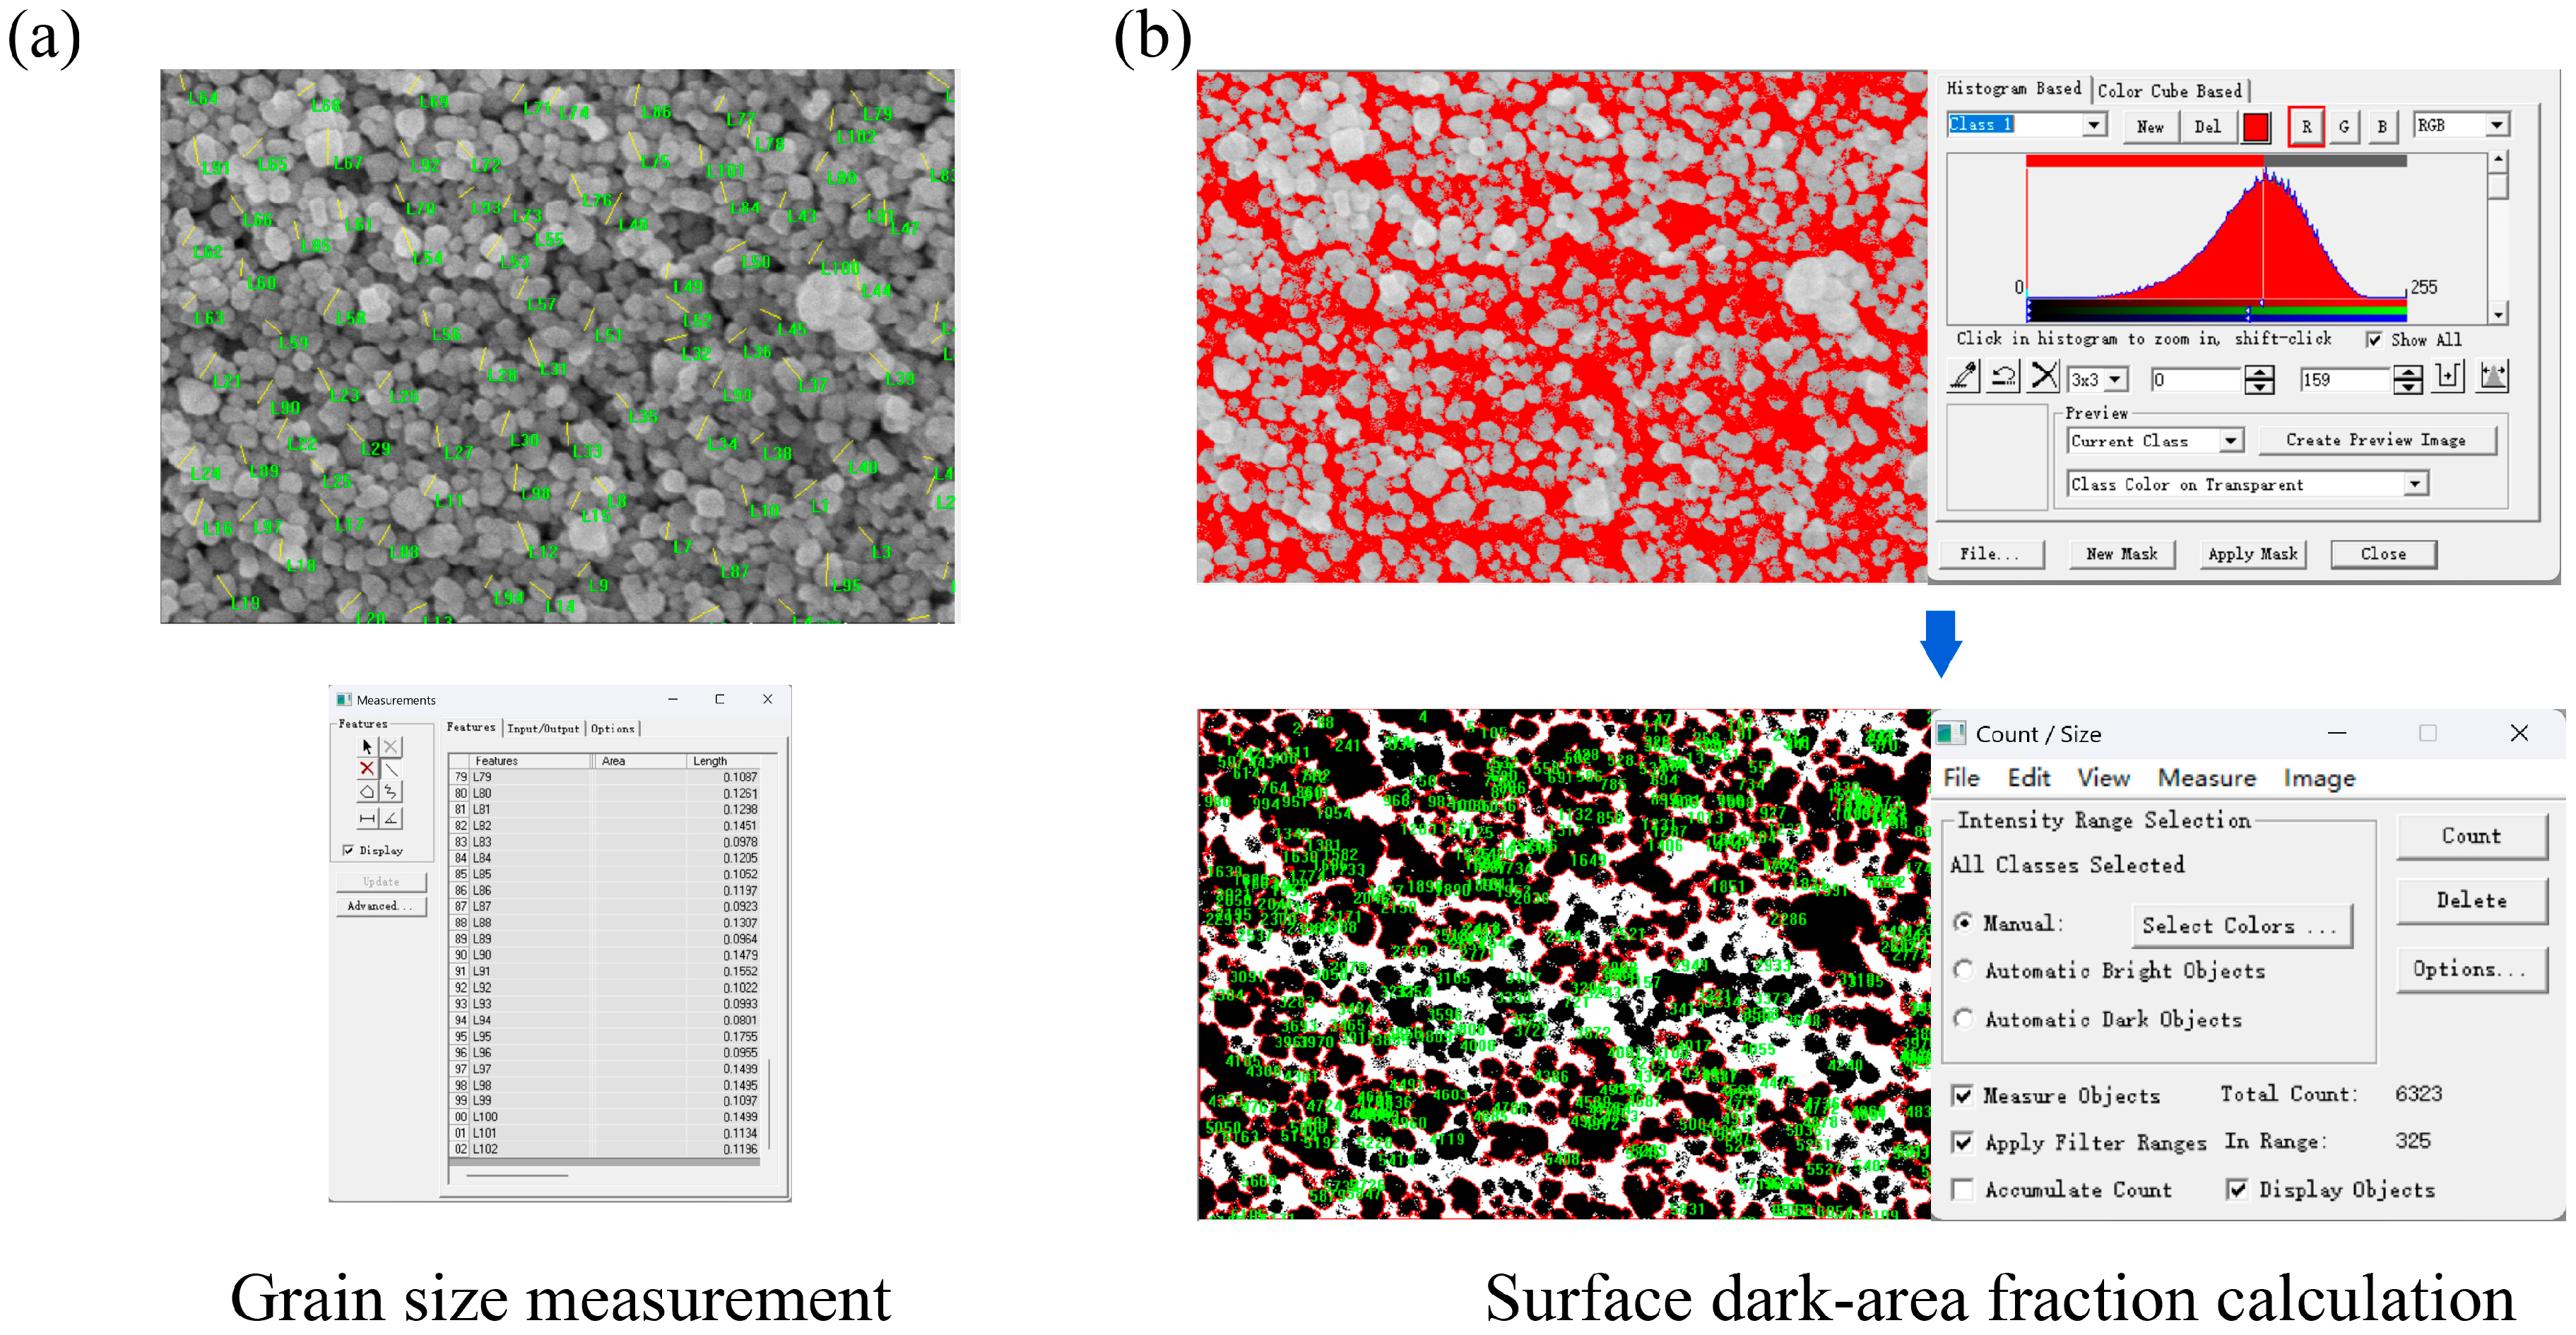
Grain size and surface dark-area fraction appearing in SEM images were quantified using Image-Pro Plus 6.0. Clearly identifiable surface grains were individually measured (Figure 3). One hundred grains were sampled from each SEM image and at least five images were analyzed per group, yielding at least 500 grain measurements for each group. Surface-grain dimensions and SEM-derived surface dark-area fraction were quantified from FE-SEM images using Image-Pro Plus 6.0. The dark-area fraction was introduced as an image-based surface descriptor rather than as a material porosity measurement. In secondary-electron SEM images of unpolished green-state zirconia, low-gray-value regions may arise from open pore-like depressions, interparticle shadowing, local surface relief, edge effects, charging-related contrast, or imaging contrast. Therefore, this parameter was not interpreted as true porosity, bulk density, densification, or pore elimination.
Figure 3.
Use of Image-Pro Plus 6.0 to calculate grain size and surface dark-area fraction. (a) Grain-size measurement. (b) Surface dark-area fraction calculation.
To reduce contrast-related variability, all images used for dark-area analysis were acquired using the same SEM platform, accelerating voltage, coating procedure, detector mode, and comparable imaging conditions. Brightness and contrast were not adjusted individually for quantitative segmentation after image acquisition. For each analyzed SEM field, the scale bar and non-sample regions were excluded before image processing. Images were converted to 8-bit grayscale and analyzed using the same predefined Image-Pro Plus 6.0 workflow. Low-gray-value regions were segmented using a fixed algorithmic thresholding rule rather than manual selection. The threshold range was defined from gray value 0 to the main histogram peak of each image, and the resulting segmented area was expressed as a percentage of the analyzed surface field. The same workflow was applied to all groups to provide a standardized within-study descriptor of surface-visible dark features.
Because the measured value depends on SEM imaging conditions and grayscale contrast, the SEM-derived surface dark-area fraction should be interpreted only as a relative image descriptor within the present dataset. The dark-area fraction represents a two-dimensional SEM image descriptor of surface-visible low-intensity regions and should not be interpreted as true porosity, bulk density, or densification. Accordingly, the present study uses this parameter only as a secondary surface-image metric, whereas surface grain size is treated as the primary quantitative microstructural outcome.
2.6. Statistical Analysis
Grain sizes and surface dark-area fraction values were compared with the aid of Python 3.4. Data normality was first assessed using the Shapiro–Wilk test. As the grain-size values exhibited skewed distributions, intergroup comparisons were performed using nonparametric methods. The Kruskal–Wallis test was used for overall group comparisons, and Dunn’s post hoc test was then applied for pairwise comparisons, with the p-values subjected to correction using the Bonferroni method. A p-value lower than 0.05 was considered statistically significant.
3. Results
3.1. Grain-Size Measurement and Distribution Characteristics
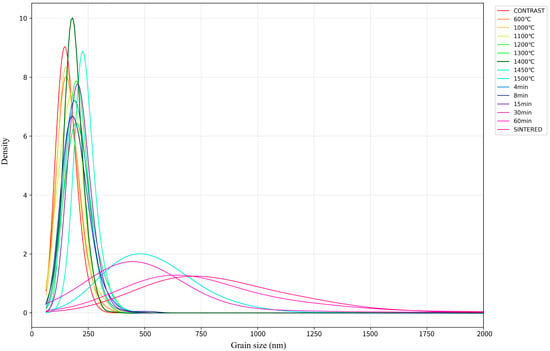
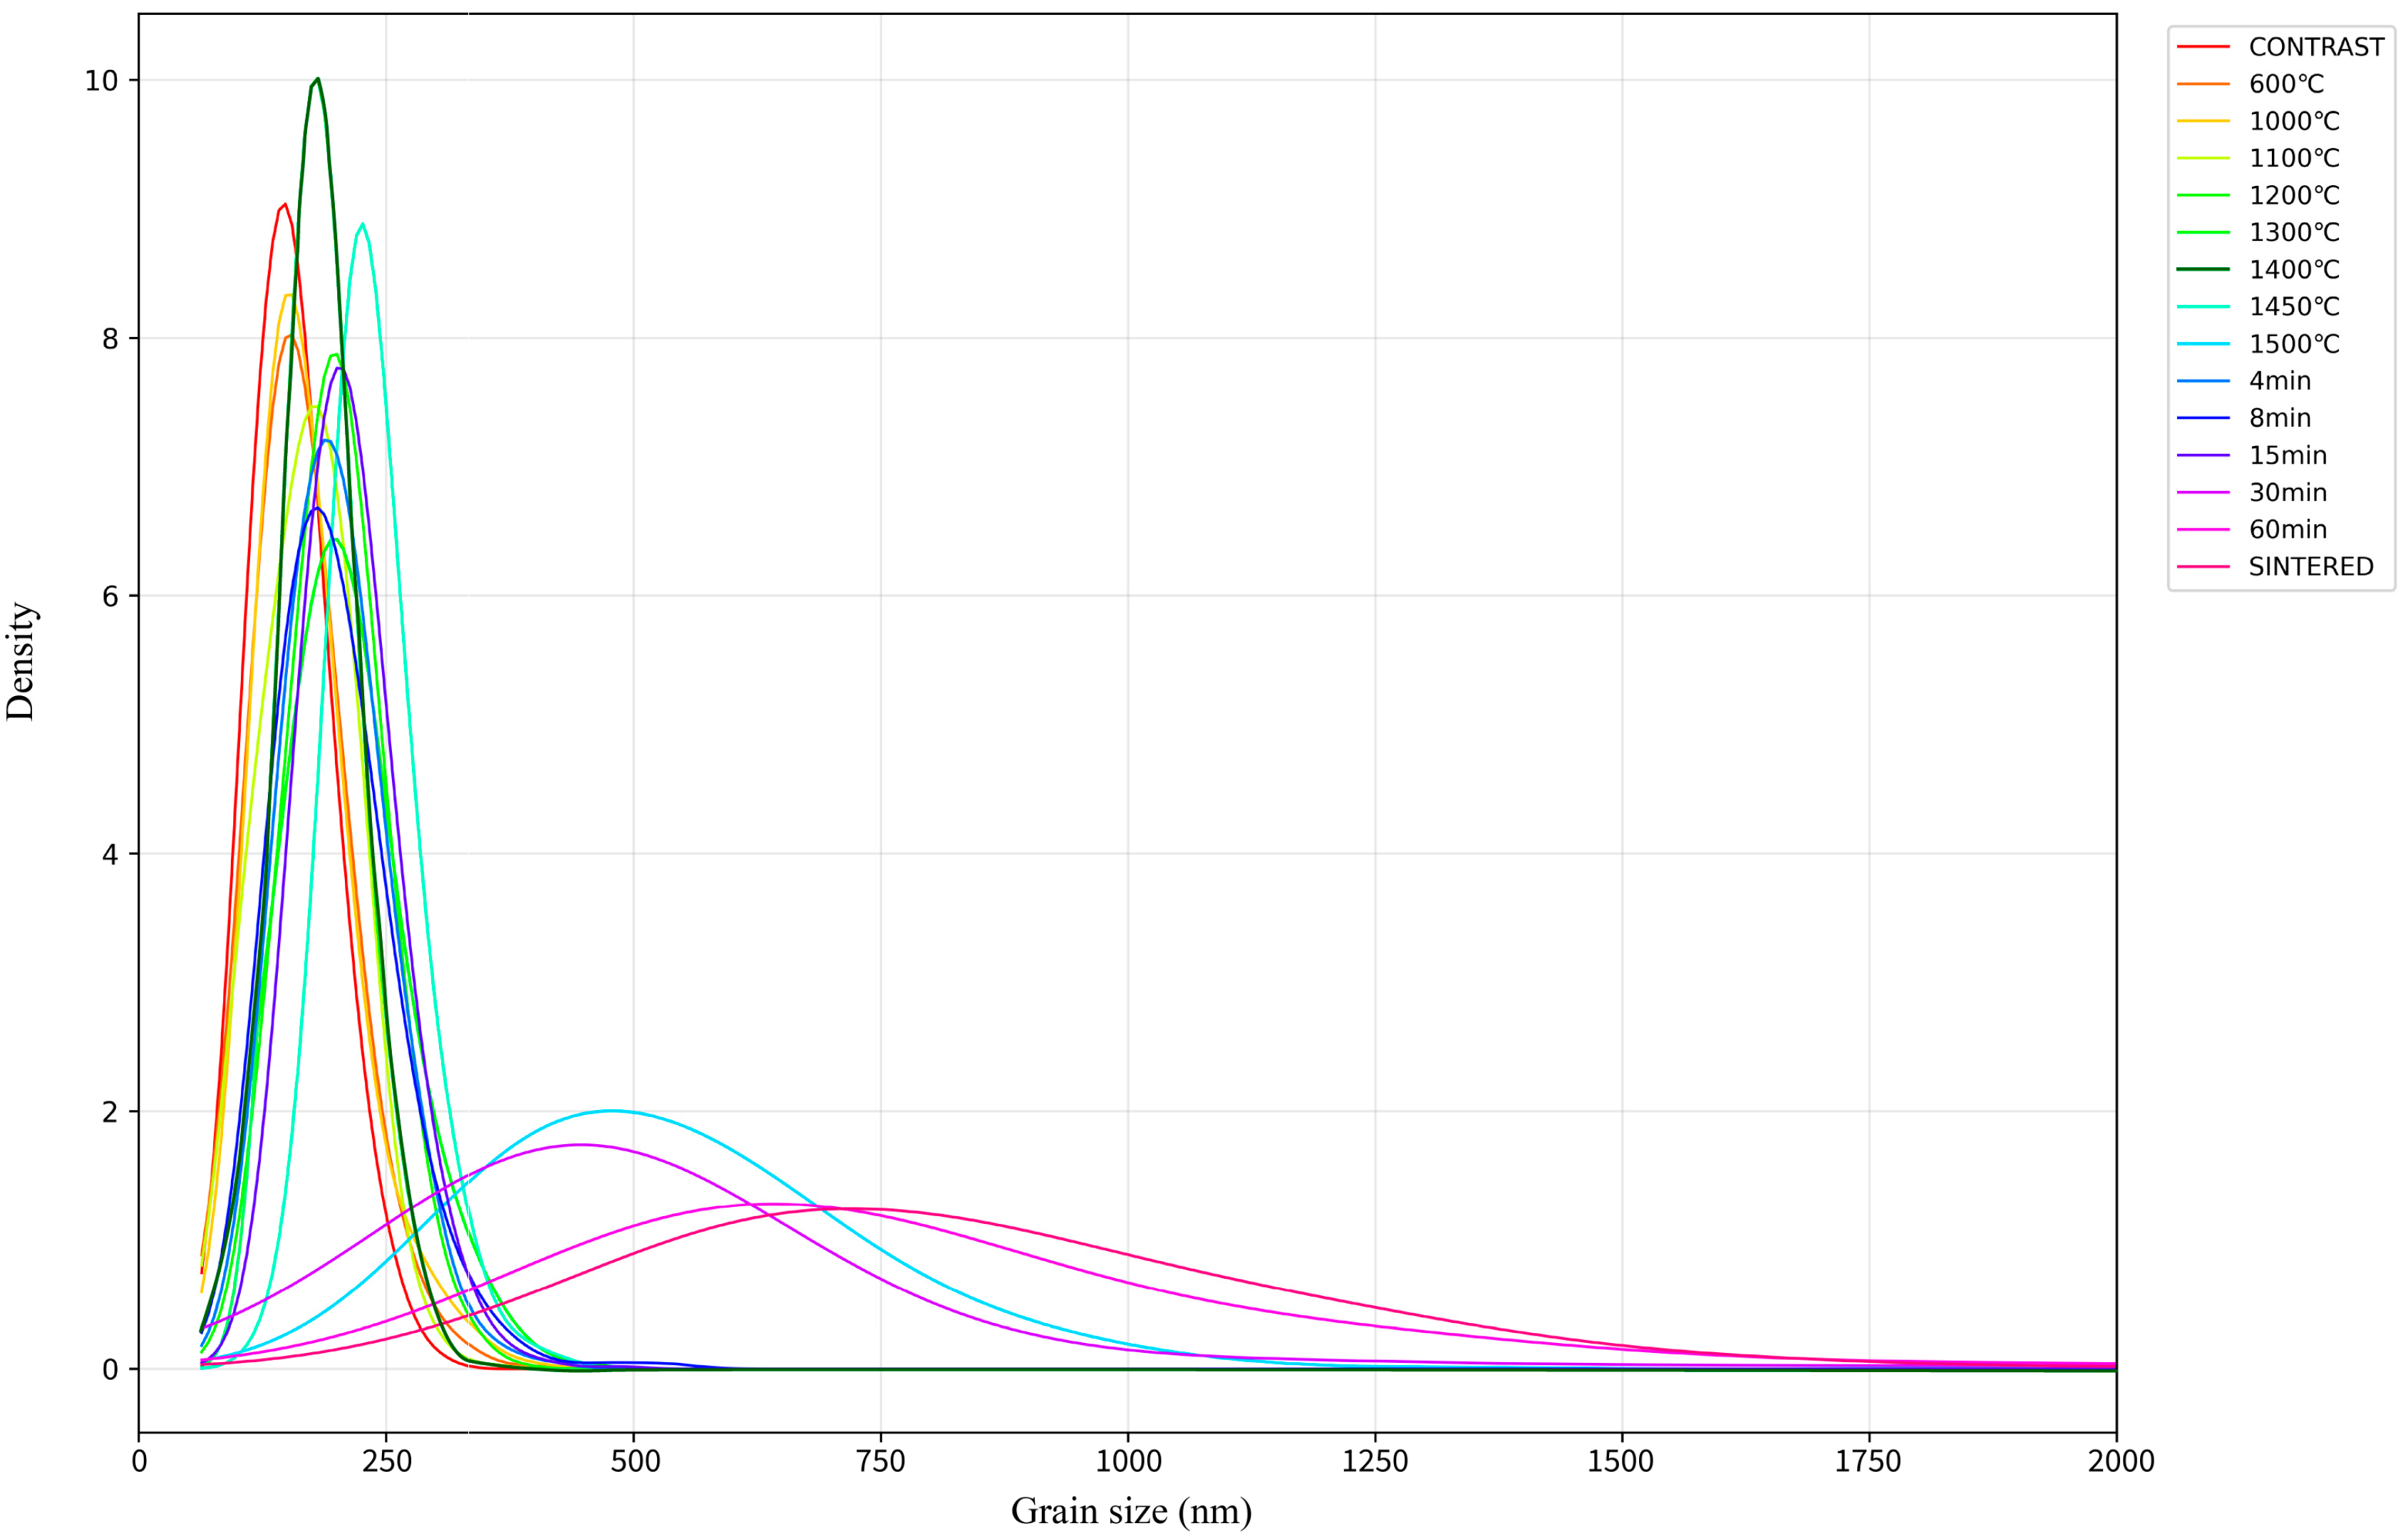
Kernel density plots revealed skewed grain-size distributions across all groups, with broader right-tailed distributions in groups that exhibited more pronounced coarsening (Figure 4). To improve interpretability, the distribution plots are shown separately for the furnace reference series and the APPJ exposure-time series (Supplementary Figure S2). Such findings are consistent with sintering theory [20,21,22].
Figure 4.
The kernel density plots of all groups.
3.2. Surface Microstructure of the Conventional Thermal Microstructural Reference Series
3.2.1. Grain Size
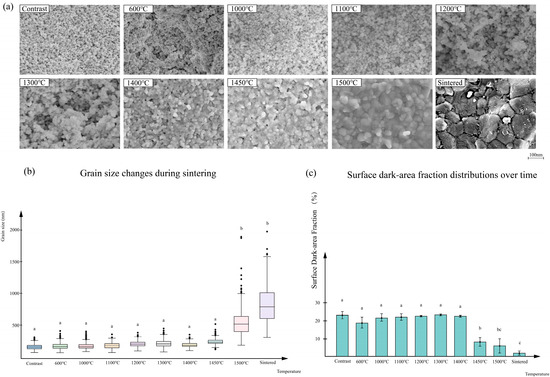
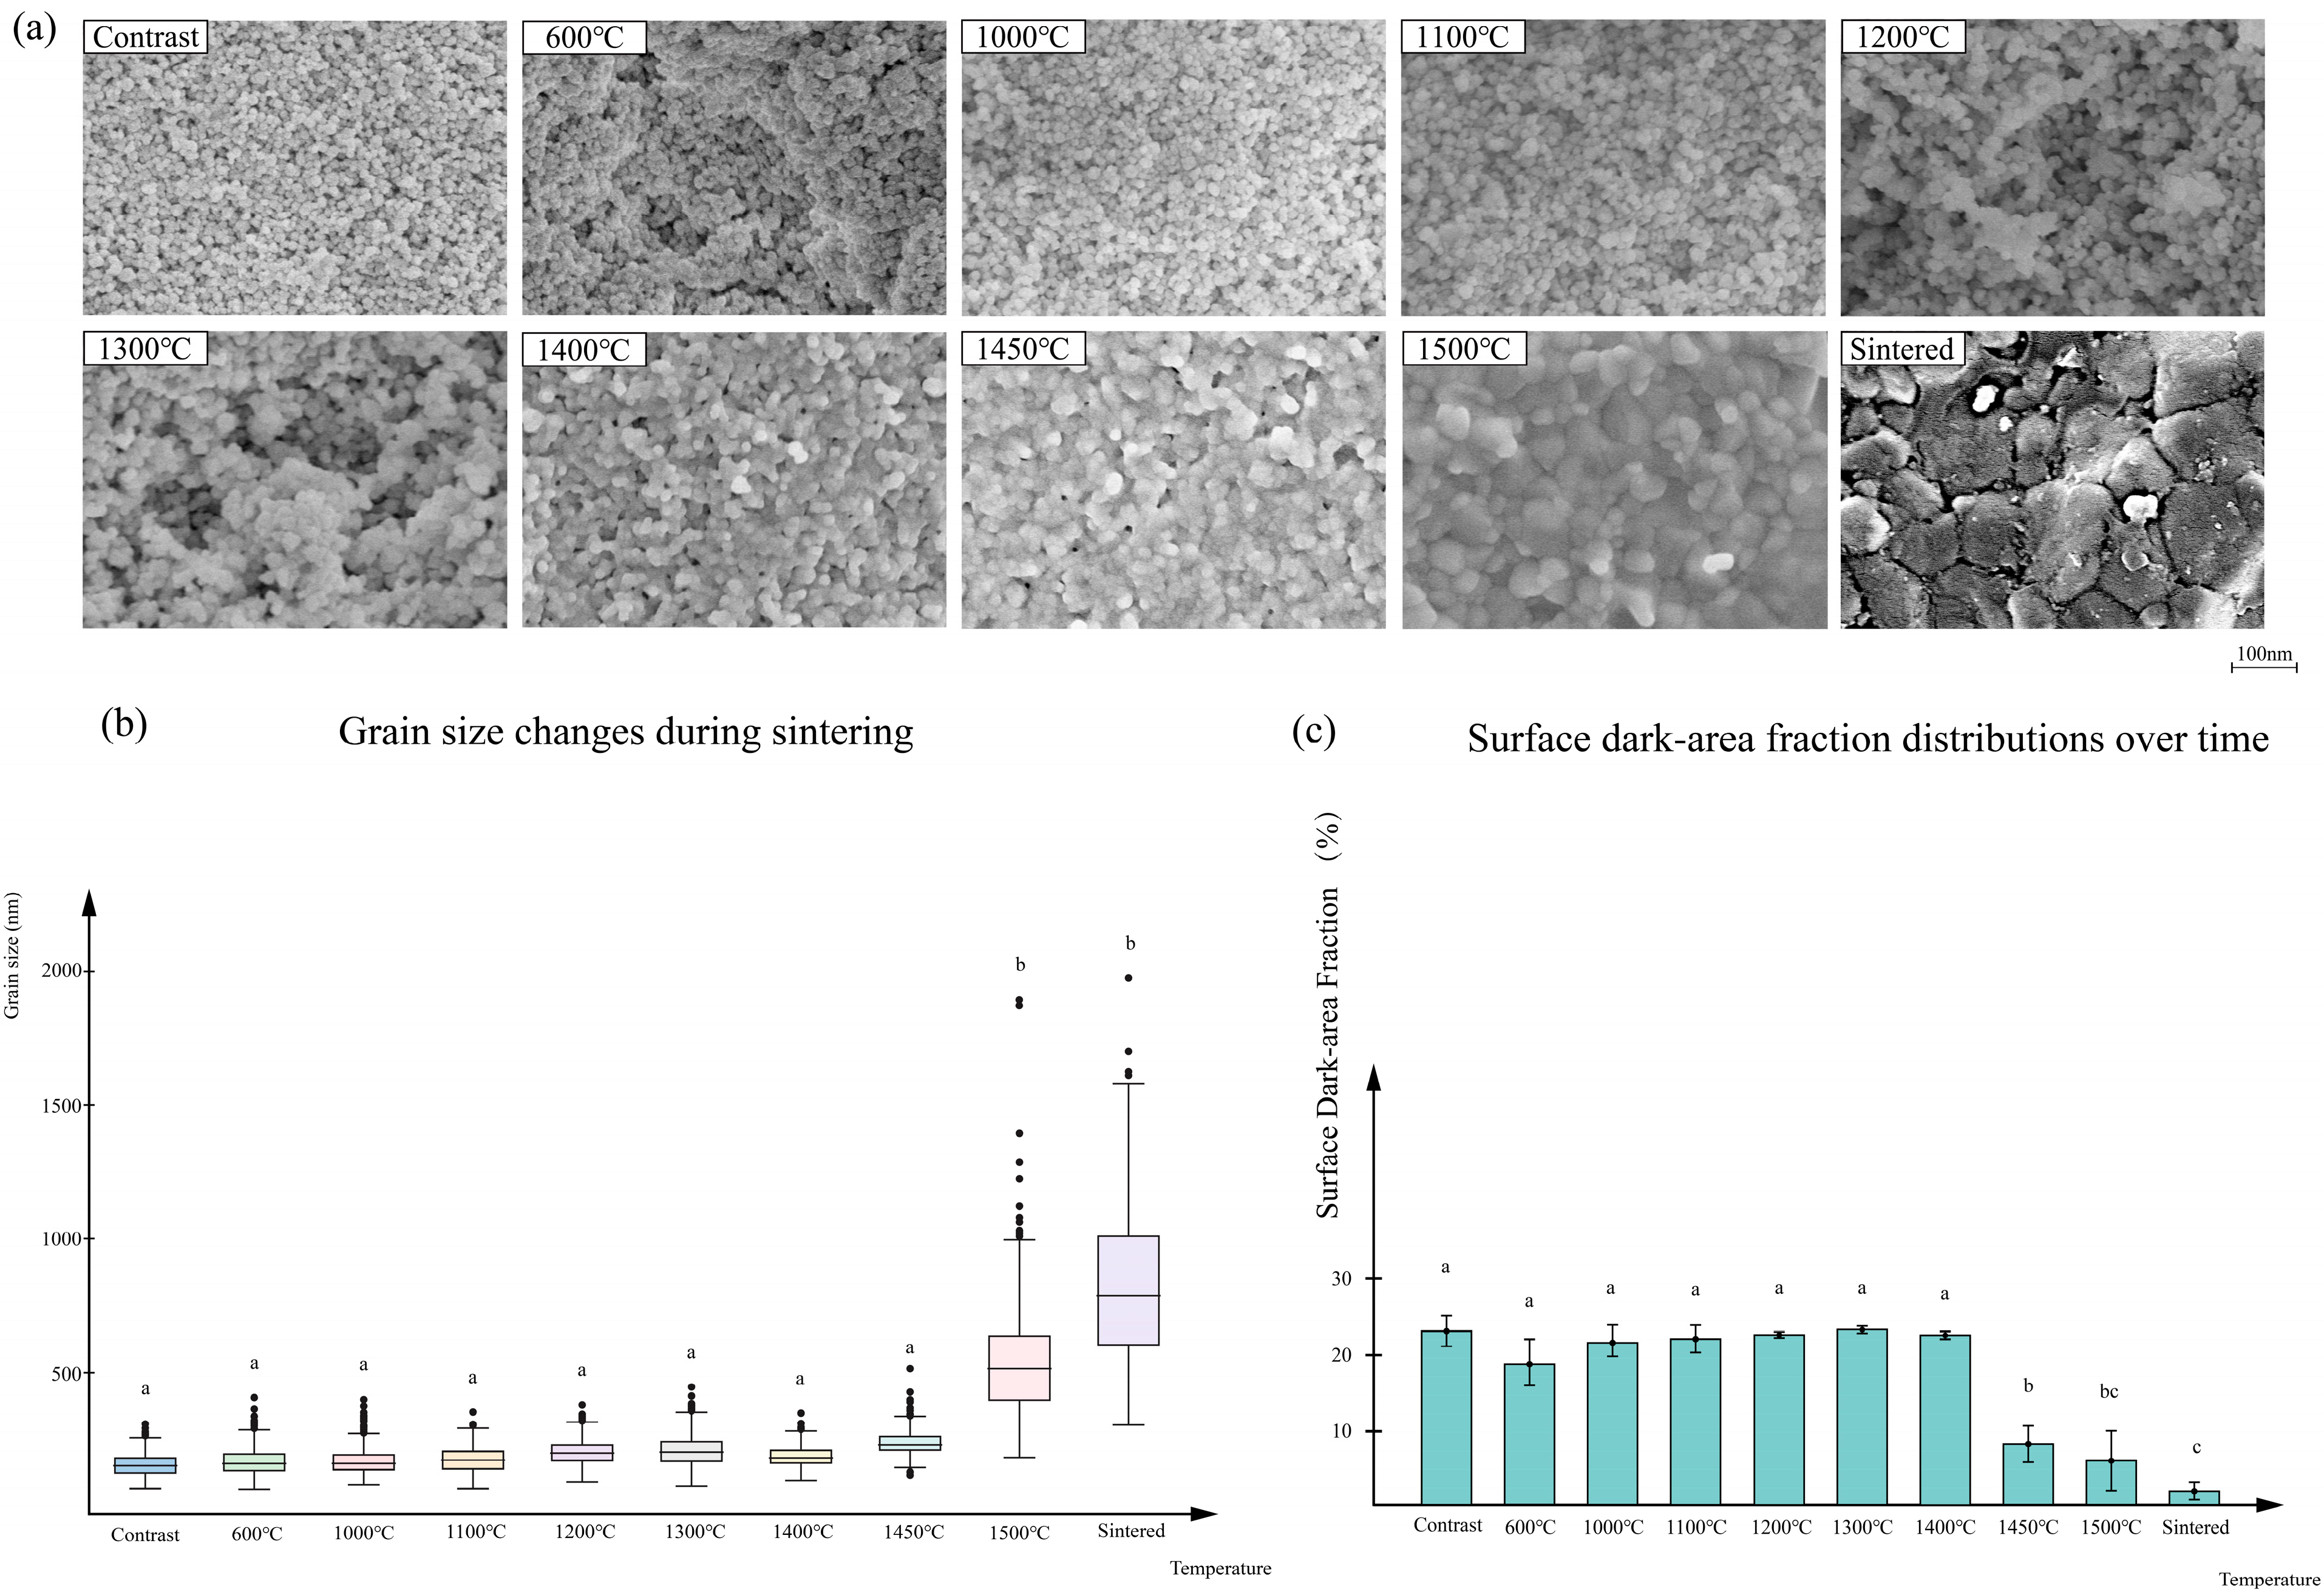
In the conventional thermal microstructural reference series (Table 1 and Figure 5), the median grain size of the untreated control group (CONTRAST) was 151.47 nm (interquartile range [IQR]: 53.87 nm). From 600 to 1450 °C, the grain size changed only modestly, with median values ranging from 159.97 nm (IQR: 62.37 nm) to 229.78 nm (IQR: 50.92 nm). A much larger increase appeared at 1500 °C, where the median grain size attained 514.82 nm (IQR: 241.27 nm). Thus, under heat treatment alone, obvious grain coarsening was concentrated in the high-temperature region rather than progressing linearly across the full temperature range.
Table 1.
The grain size and surface dark-area fraction under different conditions.
Figure 5.
Conventional thermal microstructural reference series for 3Y-TZP. (a) FE-SEM images taken at different temperatures. (b) Box plots of the grain-size distributions at different temperatures. (c) Surface dark-area fraction distributions at different temperatures. Different superscript letters within the same column indicate statistically significant differences (p < 0.05).
The Dunn post hoc comparisons showed no significant differences in grain size among CONTRAST and the furnace reference groups from 6T through 14.5T. In contrast, 15T and SINTERED exhibited significantly larger grain sizes than all groups from CONTRAST through 14.5T, with no significant difference between 15T and SINTERED.
Overall, grain size remained statistically comparable from the untreated condition through 14.5T, despite a modest numerical increase at 14.5T, and increased markedly at 15T and after routine final sintering.
3.2.2. Surface Dark-Area Fraction
In the conventional thermal microstructural reference series, the surface dark-area fraction of CONTRAST was 22.84% ± 2.07%. Between 600 and 1400 °C, the fraction remained within a relatively narrow range of 18.49%~23.03%, indicating that pore elimination was still limited at this stage. When the temperature increased to 1450 °C, the fraction decreased sharply to 8.00% ± 2.05%, and fell further to 5.81% ± 4.02% at 1500 °C. The porosity reduction became evident earlier than the marked grain-size jump at 1500 °C.
The Dunn post hoc comparisons revealed no significant differences among CONTRAST, 10T, 11T, 12T, and 14T. The 13T group showed the highest mean value, but it did not differ significantly from the untreated control or from the 10T, 11T, 12T, and 14T groups. The surface dark-area fraction decreased markedly at 14.5T and 15T. The 14.5T and 15T groups were significantly lower than the untreated-to-intermediate-temperature groups. The SINTERED group showed the lowest value; it was significantly lower than 14.5T, whereas no significant difference was detected between SINTERED and 15T.
Together, the data show that, for the conventional thermal microstructural reference series, grain growth and porosity reduction were not synchronized. Grain size began to deviate from that of the untreated control at intermediate temperatures, but abrupt grain coarsening was observed at only 1500 °C. In contrast, the surface dark-area fraction remained close to that of the control to 1400 °C and then decreased markedly at 1450~1500 °C.
Because this furnace series and the APPJ series differed in temperature history, heat-transfer conditions, and exposure variables, these results are used only to contextualize the direction of surface microstructural evolution; they do not define an equivalent APPJ processing temperature.
3.3. Effect of Air-Plasma Treatment Time on Surface Microstructure Metrics
3.3.1. Grain Size
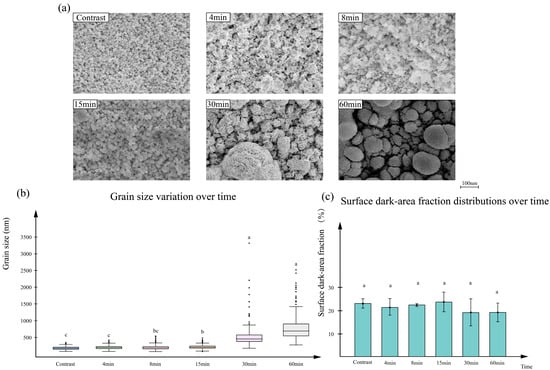
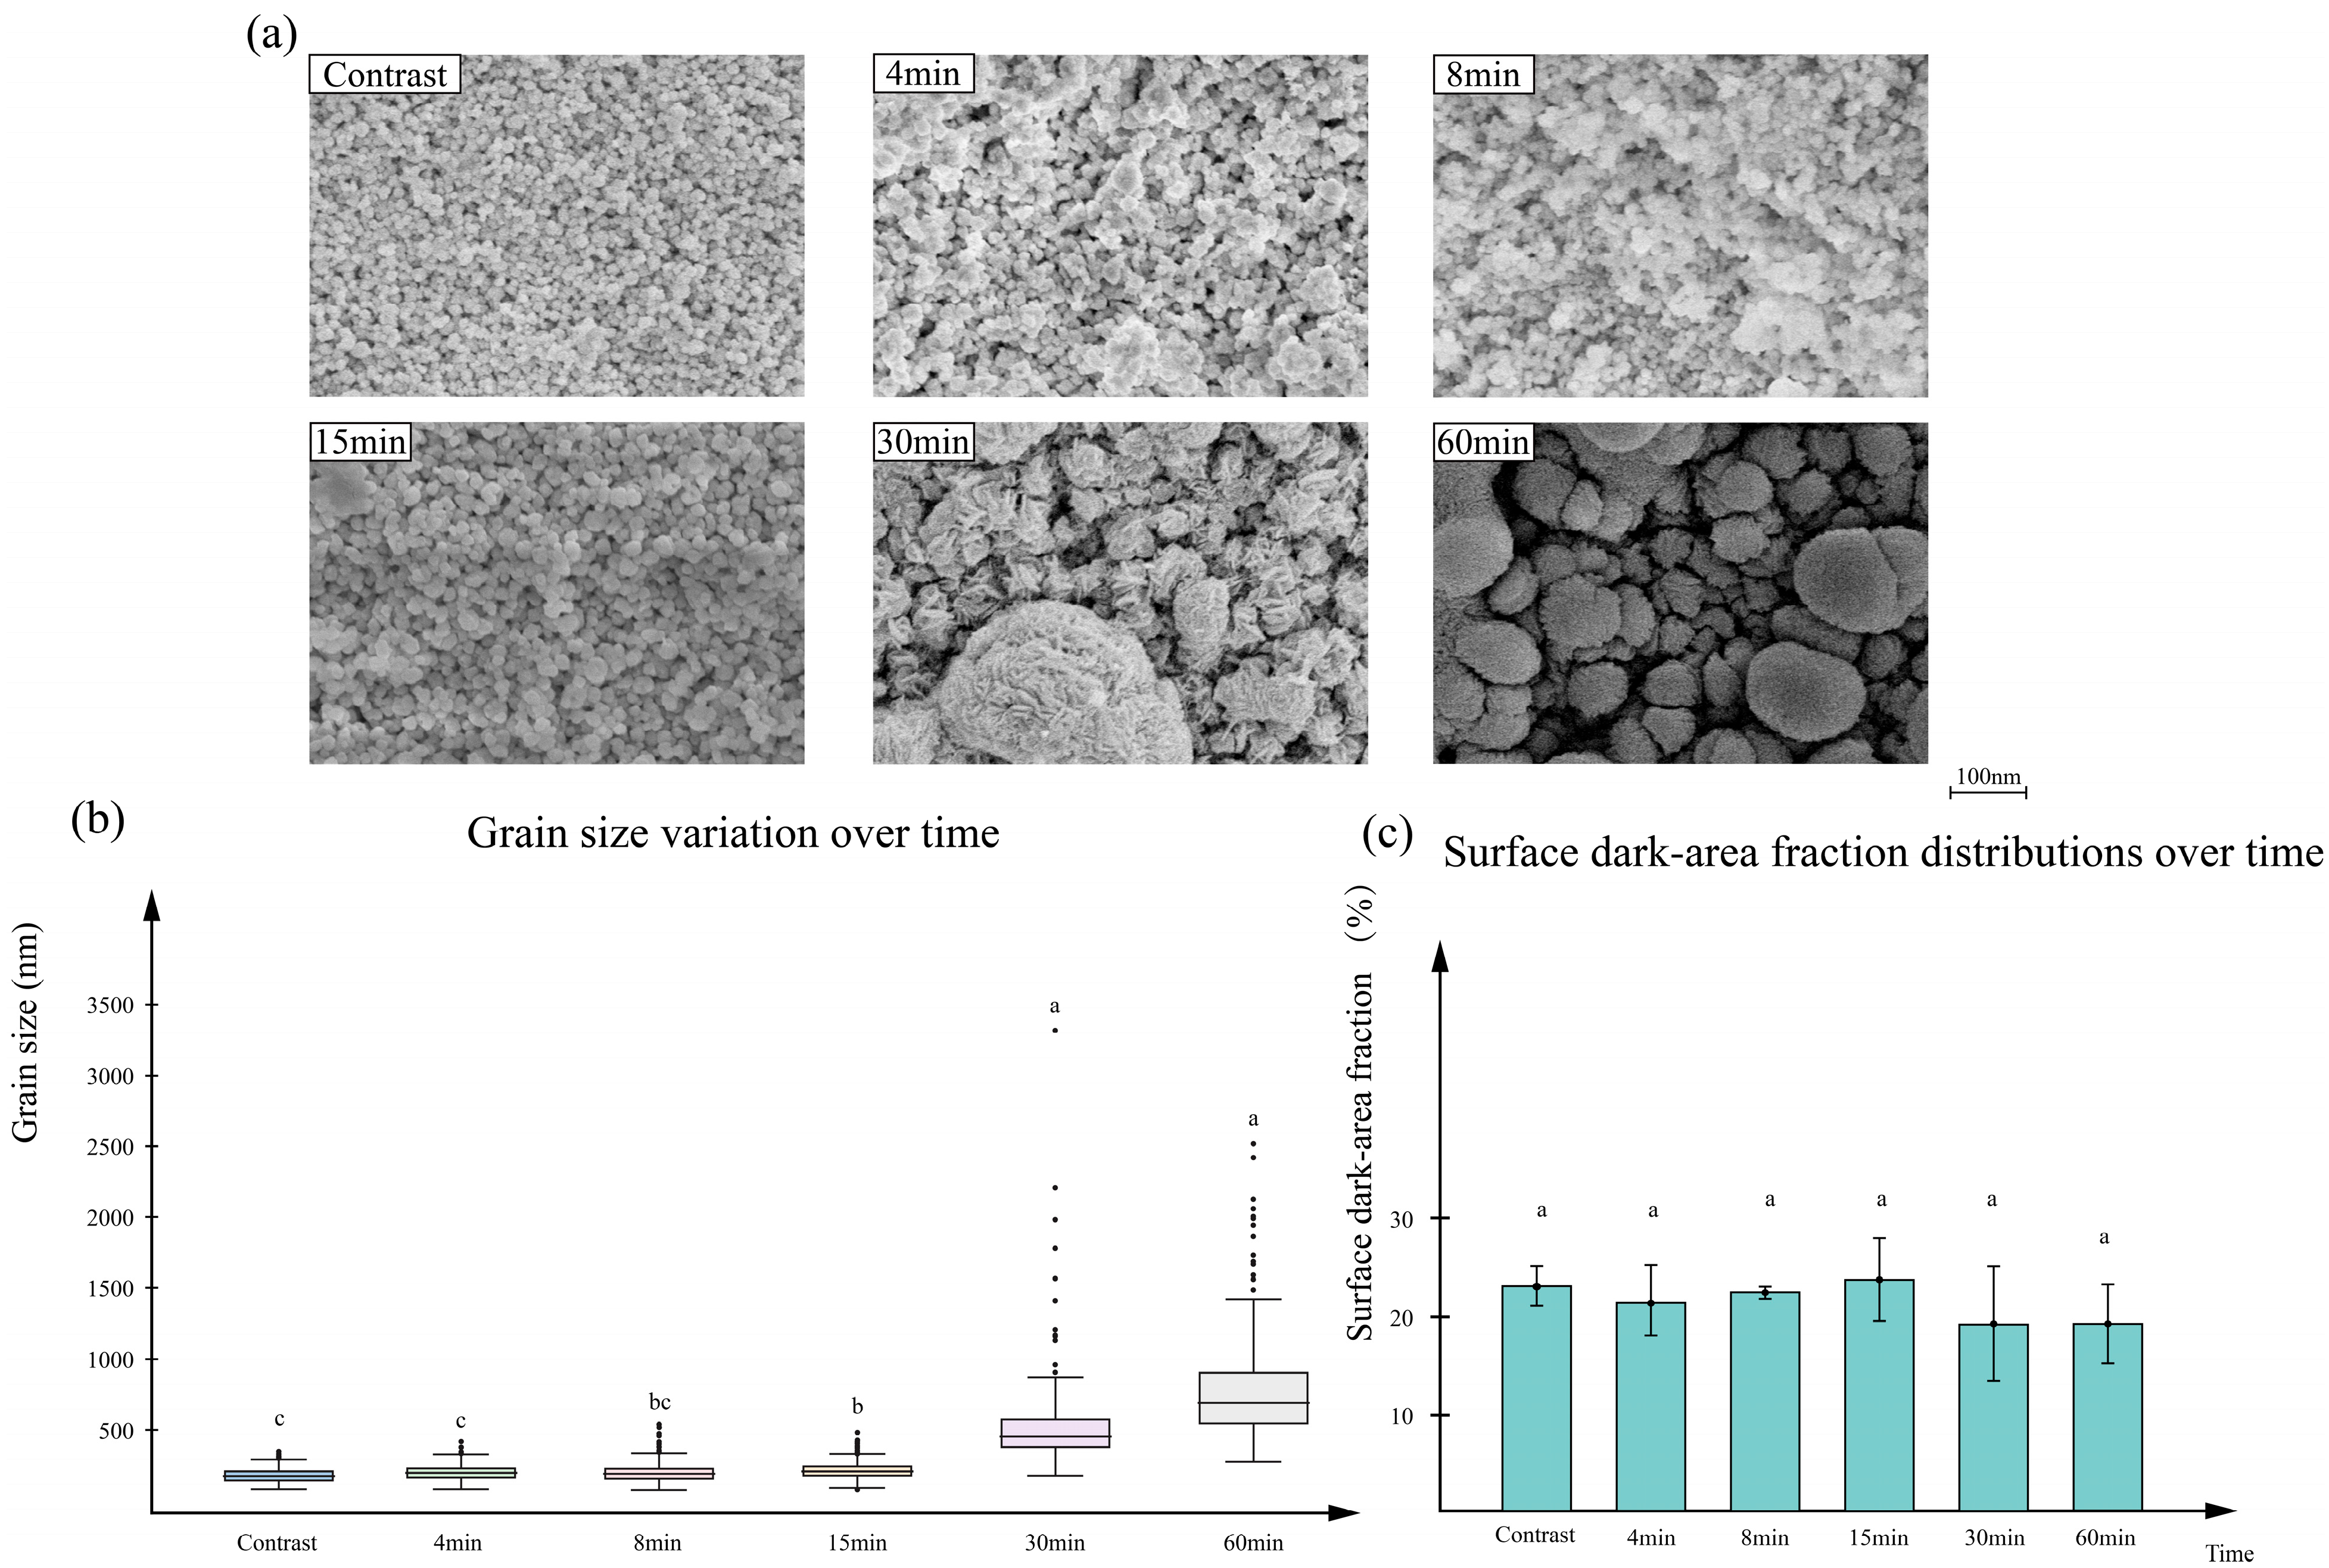
In the air-plasma time-series groups (Table 1 and Figure 6), the median grain size was 156.86 nm (IQR: 23.14 nm) at A4, 196.92 nm (IQR: 73.37 nm) at A8, and 209.28 nm (IQR: 61.31 nm) at A15, thus exhibiting only limited variation within the first 15 min of treatment. When the treatment time was extended, grain size increased sharply to 455.16 nm (IQR: 199.33 nm) at A30 and 695.58 nm (IQR: 363.97 nm) at A60.
Figure 6.
Effect of air-plasma treatment time. (a) SEM images taken at different treatment times. (b) Box plots of the grain-size distributions at these times. (c) Surface dark-area fraction distributions at the various times. Different superscript letters within the same column indicate statistically significant differences (p < 0.05).
For the APPJ exposure-time series, the Dunn post hoc comparisons revealed no significant difference in grain size between CONTRAST and A4. A8 showed a moderate numerical increase, but it was not significantly different from CONTRAST, A4, or A15. A15 was significantly larger than CONTRAST and A4, but not significantly different from A8. When the exposure time was extended to 30 and 60 min, grain size increased markedly. A30 and A60 were significantly larger than CONTRAST, A4, A8, and A15, whereas no significant difference was detected between A30 and A60. These results indicate that the most evident transition in surface-visible grain size occurred between 15 and 30 min of APPJ exposure.
3.3.2. Surface Dark-Area Fraction
The SEM-derived surface dark-area fraction values were 21.15% ± 3.65% at A4, 22.22% ± 0.71% at A8, and 23.52% ± 4.28% at A15, remaining close to the untreated control level during the first 15 min of APPJ exposure. When the treatment time was prolonged to 30 and 60 min, the mean values decreased numerically to 18.94% ± 5.88% and 18.96% ± 4.12%, respectively. However, no statistically significant pairwise differences in the SEM-derived surface dark-area fraction were detected among CONTRAST, A4, A8, A15, A30, and A60. Taken together, the APPJ exposure-time series showed a clearer time-dependent response in surface grain size than in the SEM-derived surface dark-area fraction. Surface grain coarsening became evident after 30 min of APPJ exposure, whereas the surface dark-area fraction showed only a modest numerical decrease without statistically significant differences among the APPJ groups.
4. Discussion
APPJ exposure was associated with surface grain coarsening, whereas the SEM-derived surface dark-area fraction changed to a lesser extent. This indicates that the present APPJ treatment affected the surface microstructure in a selective rather than a fully balanced manner [23]. This pattern is compatible with early sintering-like surface microstructural evolution, but it does not by itself establish a sintering mechanism. Because specimen-surface temperature was not monitored, the observed response represents the combined outcome of APPJ exposure and its associated local heat input. The present design cannot distinguish a plasma-specific contribution from a thermal contribution.
The no-dwell furnace reference series was included to place the observed APPJ-associated surface changes in a qualitative context. It showed that changes in surface grain dimensions and in the surface dark-area fraction were not necessarily synchronized during furnace heating. However, the furnace data cannot be used to assign an APPJ-equivalent temperature or sintering stage because the thermal histories and heat-transfer conditions were not matched. In the untreated control group, the median grain size was 151.47 nm (IQR: 53.87 nm). From 600 to 1450 °C, the median grain size remained within a relatively narrow range of 159.97–229.78 nm, indicating only modest grain enlargement over this temperature interval. A marked increase was observed only at 1500 °C, at which point the median grain size attained 514.82 nm (IQR: 241.27 nm). In contrast, the surface dark-area fraction remained close to the control level up to 1400 °C, varying only between 18.49% ± 3.14% and 23.02% ± 0.59%, and then decreased sharply to 8.00% ± 2.05% at 1450 °C and 5.81% ± 4.02% at 1500 °C. This difference is consistent with a view that grain growth and pore reduction are governed by related but kinetically distinct transport processes in play during sintering [16]. Accordingly, plasma-induced changes should not be interpreted using either grain size or surface dark-area fraction alone.
A similar imbalance was observed in the APPJ time-series experiment. During early treatment, both indicators remained relatively close to the control level. After treatment times longer than 15 min, significant grain growth became evident, with the median grain size increasing to 455.16 nm (IQR: 199.33 nm) at 30 min and 695.58 nm (IQR: 363.97 nm) at 60 min, whereas the surface dark-area fraction decreased to only about 19%. One possible explanation is that APPJ enhances both surface diffusion and grain-boundary mobility. Therefore, grain coarsening may appear early, whereas surface dark-area fraction reduction may lag behind in the identical plasma-processing window. Although increasing plasma-treatment time was associated with the same directional trend for both indicators, namely larger grains and lower surface dark-area fraction, the time response of grain size was clearly stronger than that of surface dark-area fraction, suggesting that cumulative plasma exposure preferentially promoted grain-boundary activity and grain coarsening. This suggests that the current processing window may be sufficient to trigger surface mass transport and grain-boundary evolution, but not to induce a proportionate reduction in surface dark-area fraction under the present measurement conditions [22]. In this sense, the APPJ treatment of the present study is more appropriately viewed as a method that regulates early sintering-related surface microstructural variation, not as a process that ensures complete bulk sintering.
Several limitations define the scope of this work. First, only external-surface FE-SEM images were analyzed; no cross-sectional imaging was performed. Second, the dark-area metric is a two-dimensional SEM-image descriptor rather than a bulk porosity or density measurement. For this reason, the dark-area fraction was not used as a direct porosity or densification metric. Instead, it was retained as a standardized image-based descriptor of surface-visible low-intensity regions within this specific SEM dataset. Third, APPJ specimen-surface temperature, temperature uniformity, and dimensional change were not measured. Fourth, phase composition, densification kinetics, and mechanical properties were not assessed. Therefore, the present findings should be interpreted as evidence of time-dependent surface microstructural evolution under the selected APPJ conditions, not as evidence of bulk sintering, phase stability, dimensional stability, or improved mechanical performance.
Even with these limitations, the present work serves as a useful basis for further study. From the perspective of surface microstructural variation, the study offers preliminary support for the feasibility of APPJ-induced early sintering-like surface microstructural evolution of 3Y-TZP, but not full bulk sintering. Future investigations could vary the working gas composition to determine whether the plasma chemistries influence the balance between grain growth and surface dark-area fraction reduction. In addition, APPJ treatment may be combined with subsequent thermal sintering to test whether plasma preconditioning improves later densification, microstructural homogeneity, or overall sintering efficiency.
5. Conclusions
This study used a conventional thermal microstructural reference series and an air-plasma treatment-time series of 3Y-TZP. The main conclusions are as follows: Under the fixed air-APPJ settings used in this exploratory study, increasing exposure time was associated with time-dependent changes in the external surface microstructure of commercial 3Y-TZP. The lack of cross-sectional SEM analysis is a further limitation. Accordingly, no conclusion is made regarding whether the observed surface-grain coarsening extended into the interior of the green-state specimens. Surface grain dimensions increased most clearly after 30 and 60 min, whereas the SEM-derived surface dark-area fraction changed more modestly. The no-dwell furnace reference series provided qualitative context for surface-microstructure evolution during heating but did not establish a temperature equivalence for APPJ exposure. Because the study did not measure specimen temperature, phase composition, cross-sectional microstructure, bulk density, dimensional change, or mechanical properties, it does not demonstrate bulk plasma-assisted sintering or improved zirconia performance. The results instead identify an APPJ exposure window that warrants targeted follow-up studies of subsequent sintering behavior.
Supplementary Materials
The following supporting information can be downloaded at https://www.mdpi.com/article/10.3390/cryst16080514/s1, Figure S1: EDS analysis of the sample surface. (Upper panel: Typical SEM micrograph, where the yellow box indicates the selected area for EDS analysis. Lower panel: The corresponding EDS spectrum obtained from the selected region. SEM and EDS analysis of the sample surface.); Figure S2: The kernel density plots of each group.
Author Contributions
Conceptualization, C.Y. and X.L.; methodology, C.Y.; software, C.Y.; validation, C.Y., J.L., X.C. and X.L.; formal analysis, C.Y.; resources, X.L.; data curation, C.Y.; writing—original draft preparation, C.Y.; writing—review and editing, J.L., X.C. and X.L.; visualization, C.Y.; supervision, X.L.; project administration, X.L.; funding acquisition, X.L. All authors have read and agreed to the published version of the manuscript.
Funding
This work was supported by the National Natural Science Foundation of China (52472279).
Institutional Review Board Statement
Not applicable.
Informed Consent Statement
Not applicable.
Data Availability Statement
The original contributions presented in this study are included in the article/Supplementary Materials. Further inquiries can be directed to the corresponding author.
Acknowledgments
During the preparation of this manuscript, the authors used ChatGPT 5.3 for the purposes of language refinement only. The authors have reviewed and edited the output and take full responsibility for the content of this publication.
Conflicts of Interest
The authors declare no conflicts of interest.
References
- Mazaheri, M.; Simchi, A.; Golestani-Fard, F. Densification and grain growth of nanocrystalline 3Y-TZP during two-step sintering. J. Eur. Ceram. Soc. 2008, 28, 2933–2939. [Google Scholar] [CrossRef] [Scilit]
- Husain, N.A.-H.; Özcan, M.; Dydyk, N.; Joda, T. Conventional, Speed Sintering and High-Speed Sintering of Zirconia: A Systematic Review of the Current Status of Applications in Dentistry with a Focus on Precision, Mechanical and Optical Parameters. J. Clin. Med. 2022, 11, 4892. [Google Scholar] [CrossRef] [Scilit] [PubMed]
- Alves, M.F.R.P.; de Campos, L.Q.B.; Simba, B.G.; da Silva, C.R.M.; Strecker, K.; dos Santos, C. Microstructural Characteristics of 3Y-TZP Ceramics and Their Effects on the Flexural Strength. Ceramics 2022, 5, 798–813. [Google Scholar] [CrossRef] [Scilit]
- Theunissen, G.; Winnubst, A.; Burggraaf, A. Sintering kinetics and microstructure development of nanoscale Y-TZP ceramics. J. Eur. Ceram. Soc. 1993, 11, 315–324. [Google Scholar] [CrossRef] [Scilit]
- Biesuz, M.; Grasso, S.; Sglavo, V.M. What’s new in ceramics sintering? A short report on the latest trends and future prospects. Curr. Opin. Solid State Mater. Sci. 2020, 24, 100868. [Google Scholar] [CrossRef] [Scilit]
- Mirt, T.; Bhootpur, N.; Malgaj, T.; Özcan, M.; Jevnikar, P.; Kocjan, A. Sintering Strategies for Dental Zirconia Ceramics: Slow Versus Rapid? Curr. Oral Health Rep. 2023, 10, 233–242. [Google Scholar] [CrossRef] [Scilit]
- Borrell, A.; Salvador, M.D.; Rayón, E.; Peñaranda-Foix, F.L. Improvement of microstructural properties of 3Y-TZP materials by conventional and non-conventional sintering techniques. Ceram. Int. 2012, 38, 39–43. [Google Scholar] [CrossRef] [Scilit]
- Yang, C.; Liu, X. Research Progress on the Sintering Techniques of Zirconia in Prosthetic Dentistry. Ceramics 2025, 8, 118. [Google Scholar] [CrossRef] [Scilit]
- Olevsky, E.A.; Dudina, D.V. Field-Assisted Sintering, 1st ed.; Springer: Cham, Switzerland, 2018. [Google Scholar]
- Denis, Y.; Philippot, G.; Roitero, E.; Goglio, G.; Suchomel, M.; Chung, U.-C.; de Beauvoir, T.H.; Reveron, H.; Chevalier, J.; Estournès, C.; et al. Cold Sintering of Zirconia and Yttria-Stabilized Zirconia from Reactive Hydroxides Precursors. J. Eur. Ceram. Soc. 2025, 45, 117650. [Google Scholar] [CrossRef] [Scilit]
- Shang, H.; Ning, W.; Shen, S.; Wang, R.; Dai, D.; Jia, S. Atmospheric pressure plasma jet for surface treatment: A review. Rev. Mod. Plasma Phys. 2024, 9, 1–85. [Google Scholar] [CrossRef] [Scilit]
- Penkov, O.V.; Khadem, M.; Lim, W.-S.; Kim, D.-E. A review of recent applications of atmospheric pressure plasma jets for materials processing. J. Coat. Technol. Res. 2015, 12, 225–235. [Google Scholar] [CrossRef] [Scilit]
- Fanelli, F.; Fracassi, F. Atmospheric pressure non-equilibrium plasma jet technology: General features, specificities and applications in surface processing of materials. Surf. Coat. Technol. 2017, 322, 174–201. [Google Scholar] [CrossRef] [Scilit]
- Karacasulu, L.; de Beauvoir, T.H.; De Bona, E.; Cassetta, M.; Vakifahmetoglu, C.; Sglavo, V.M.; Bortolotti, M.; Manière, C.; Estournès, C.; Biesuz, M. Ultrafast high-temperature sintering of yttria-stabilized zirconia in reactive N2 atmosphere. J. Eur. Ceram. Soc. 2025, 45, 116879. [Google Scholar] [CrossRef] [Scilit]
- Wakai, F.; Okuma, G.; Nishiyama, N. Sintering mechanics of ceramics: A short review. Mater. Today Proc. 2019, 16, 4–13. [Google Scholar] [CrossRef] [Scilit]
- Kang, S.-J.L. Sintering: Densification, Grain Growth & Microstructure; Elsevier Butterworth-Heinemann: Oxford, UK, 2005. [Google Scholar]
- Elissalde, C.; de Beauvoir, T.H.; Chung, U.-C.; Martin, E.; Denis, Y.; de Landtsheer, J.; Suchomel, M.; Goglio, G.; Philippot, G.; Estournès, C. Densification of zirconia-based ceramics by non-conventional sintering processes and chemical pathways. Ceram. Int. 2024, 50, 37385–37394. [Google Scholar] [CrossRef] [Scilit]
- Kang, S.-U.; Kim, C.-H.; Kim, H.-K.; Yoon, Y.-W.; Kim, Y.-K.; Kim, S.-J. Effect of the Plasma Gas Type on the Surface Characteristics of 3Y-TZP Ceramic. Int. J. Mol. Sci. 2022, 23, 3007. [Google Scholar] [CrossRef] [Scilit] [PubMed]
- Kong, P.; Pfender, E. Plasma Gas Composition and Pressure Effects on the Sintering of Stabilized Zirconia. MRS Online Proc. Libr. 1990, 190, 71–76. [Google Scholar] [CrossRef] [Scilit]
- Pande, C.; Cooper, K.; McFadden, G. Grain size distribution in two dimensions in the long time limit. Acta Mater. 2008, 56, 5304–5311. [Google Scholar] [CrossRef] [Scilit]
- Bobrowski, P.; Faryna, M.; Pędzich, Z. Microstructural Characterization of Yttria-Stabilized Zirconia Sintered at Different Temperatures Using 3D EBSD, 2D EBSD and Stereological Calculations. J. Mater. Eng. Perform. 2017, 26, 4681–4688. [Google Scholar] [CrossRef] [Scilit]
- Chaim, R. Activation energy and grain growth in nanocrystalline Y-TZP ceramics. Mater. Sci. Eng. A 2008, 486, 439–446. [Google Scholar] [CrossRef] [Scilit]
- Luo, J.; Adak, S.; Stevens, R. Microstructure evolution and grain growth in the sintering of 3Y–TZP ceramics. J. Mater. Sci. 1998, 33, 5301–5309. [Google Scholar] [CrossRef] [Scilit]

Disclaimer/Publisher’s Note: The statements, opinions and data contained in all publications are solely those of the individual author(s) and contributor(s) and not of MDPI and/or the editor(s). MDPI and/or the editor(s) disclaim responsibility for any injury to people or property resulting from any ideas, methods, instructions or products referred to in the content. |
© 2026 by the authors. Licensee MDPI, Basel, Switzerland. This article is an open access article distributed under the terms and conditions of the Creative Commons Attribution (CC BY) license.