


Abstract
The grain size and texture of high-purity Cu-Al alloy are crucial for its application in sputtering targets. In order to improve the grain size and texture of high-purity Cu-Al alloy, clock rolling followed by a subsequent annealing process was employed in the study. In comparison with unidirectional rolling (UR), the grain structure and texture evolution during clock rolling and annealing were characterized and analyzed. The results show that clock rolling (CR) promotes the uniform distribution of strain, and produces a dominant Cube texture after rolling. Experiments have confirmed that CR is more conducive to the occurrence of recrystallization than UR. After recrystallization, a large amount of the S texture is present in the specimens of UR, while S texture is obviously weakened in the specimens of CR. In addition, Cube texture transforms to S and Copper textures during recrystallization in CR specimens. Overall, clock rolling helps to generate equiaxed grains and weaken the texture.
1. Introduction
High-purity Cu-Al alloy for sputtering targets is a critical conductive interconnection material in the semiconductor industry [1]. With the development of integrated circuit manufacturing technology, the performance requirements for copper targets and copper alloy targets used in interconnection processes are constantly increasing [2,3]. The purity and grain structures of the alloys are particularly important for high-quality sputtering targets. The grain size and orientation of high-purity copper targets directly affect the sputtering rate and the quality of deposited films [4,5,6]. Studies have shown that within a certain range of grain sizes, an increase in grain size usually leads to a decrease in the deposition rate of film [7,8]. Inappropriate grain texture may lead to uneven sputtering rates in local regions of the target, resulting in differential sputtering depths and affecting the quality of deposited films [9,10]. However, the conventional processes have difficulty in well controlling grain size and texture, which greatly limits the development and application of high-quality Cu-Al alloy targets.
Currently, the production of Cu alloy targets mainly uses traditional unidirectional rolling (UR). These targets often have significant single preferred orientation and severe texture gradients in the thickness direction. To address this defect, some new rolling techniques have been developed to improve the microstructure homogeneity of targets, such as cross rolling and asymmetric rolling [11,12]. Deformation textures can be effectively weakened by the extra shear strain introduced in asymmetric and cross rolling processes [13,14]. Solouki et al. [15] compared the asymmetric unidirectional rolling (AUR) and asymmetric cross rolling (ACR) for copper sheets. Both processes produce weak deformation textures (Copper, S, and Brass components, and α and β fibers), and uniform shear textures ({111}<112>, {223}<223>). Continuous unidirectional shear in AUR induces an asymmetric through-thickness strain gradient, yielding stronger Cube recrystallization texture at the surface than the sheet core. By contrast, 90° normal-direction (ND) rotation per pass in ACR homogenizes through-thickness shear strain. Alternating cross rotation activates multiple slip systems to facilitate dynamic recovery, and triggers continuous dynamic recrystallization, delivering more uniform Cube texture. Furthermore, the distinct microstructures under asymmetric and cross rolling inevitably affect the nucleation and growth of recrystallization grains in subsequent annealing [16,17].
Multi-directional cross-rolling has been proven to effectively improve the texture, residual stress, and material anisotropy of FCC and BCC metals [18,19]. Clock rolling (CR), as a type of multi-directional cross-rolling process, can effectively refine grain size and weaken the texture of the sheet [20,21]. Liu et al. [22,23] conducted a series of studies on the texture of tantalum plates under clock rolling. By comparing with unidirectional rolling, clock rolling changes the stability of the {111} and {100} texture components and optimizes the microstructure and recrystallization behavior of the tantalum plates, which especially alleviates the microstructure gradient along the thickness direction. Additionally, asymmetric cross rolling with periodic 90° ND rotation greatly relieves inherent θ/γ fiber texture gradients through the cross-shear zone [15,24]. Although 90° cross-rolling has been proven to improve the microstructure homogeneity of Cu-Al alloys [25], systematic investigations focusing on grain structure and texture evolution of high-purity Cu-Al alloys under clock rolling are still insufficient. In particular, the competitive evolution mechanism of deformation texture and recrystallization texture under multi-directional shear deformation and annealing temperatures remains unclear, which urgently needs to be further clarified.
In this work, clock rolling assisted with subsequent annealing is used to improve the grain structure and texture orientation of high-purity Cu-Al alloys. Based on numerical simulation, the strain and stress distribution of unidirectional rolling and clock rolling of the Cu-Al alloys were compared. The microstructure and texture evolution as well as the recrystallization behavior of high-purity Cu-Al alloys under rolling and annealing processes are systematically studied.
2. Materials and Methods
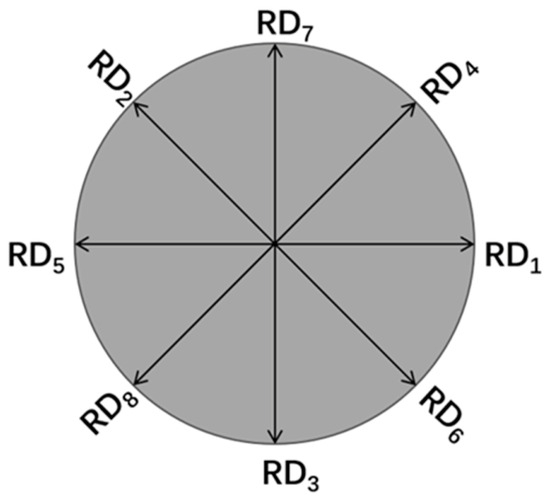
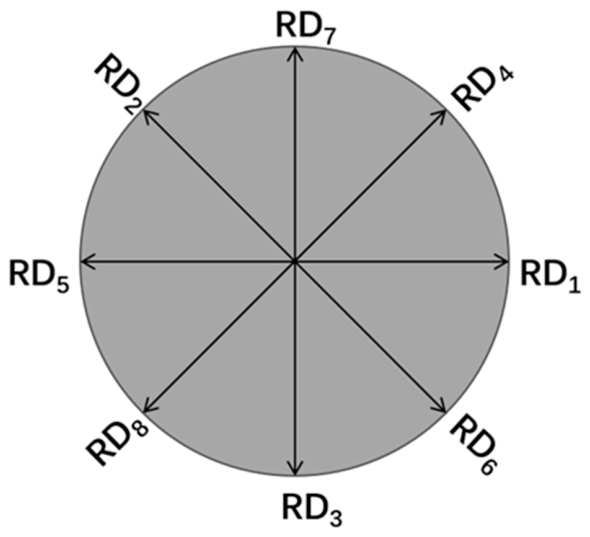
6N ultra-high-purity electrolytic copper plates (purity ≥ 99.9999 wt.%) and 6N high-purity aluminum (purity ≥ 99.9999 wt.%) were used as raw materials. A high-purity Cu-4 wt.% Al master alloy was pre-prepared using the above raw materials, and then quantitatively blended and diluted with ultra-high-purity copper to obtain the designed Cu-0.1Al alloy (0.1 wt.% Al). The matched master alloy and pure copper raw materials were melted in a vacuum induction melting furnace, and the resulting melt was cast into a graphite mold under argon atmosphere to obtain high-purity Cu-Al alloy ingots. Then, the as-cast high-purity Cu-Al alloy plates with an initial thickness of 20 mm were cold rolled down to 1 mm, achieving a total reduction ratio of 95%. The rolling methods include unidirectional rolling and clock rolling. The clock rolling was completed in four cycles each with an 8-pass rolling. Each pass was performed at an interval of 135°. The cumulative reduction in the first cycle was 35%, while each of the following three cycles had a reduction of 20%. This resulted in an equivalent total reduction of 95%. The schematic diagram of the clock rolling process is shown in Figure 1.
Figure 1.
Schematic diagram of cross rolling process.
To investigate the evolution of microstructure and texture of high-purity Cu-Al alloys during annealing, rolled samples with the thickness reductions of 35%, 55%, 75%, and 95% were isothermally annealed at 100 °C, 200 °C, and 300 °C for 1 h, respectively. In addition, the 95% heavily deformed alloy specimens were further annealed at 300 °C for 1.5 h and at 400 °C for 1 h. All annealing experiments were conducted in a tube furnace under high-purity argon atmosphere, and the samples were immediately quenched in water after annealing.
The microstructure and crystallographic texture of the alloy specimens were characterized by using electron backscatter diffraction (EBSD). EBSD analysis was performed on a Symmetry S2 EBSD detector mounted on a Gemini300 scanning electron microscope (ZEISS, Oberkochen, Germany). For EBSD measurements, a unified scanning step size of 0.35 μm was adopted for recrystallization grains, and each specimen was scanned over a consistent area no less than 200 μm × 200 μm. More than 400 valid grains were measured and analyzed for each sample. During texture reconstruction, a Gaussian spread of 5 was used for texture smoothing, and a truncation rank of 22 was adopted for spherical harmonic fitting. Meanwhile, X-ray diffraction (XRD) was also employed to examine the texture of alloys. A Rigaku Smartlab diffraction system equipped with a nine-axis goniometer was selected for the study (Rigaku, Tokyo, Japan). The analysis was carried out with a copper target and an accelerating voltage of 40 kV. Pole figures of {111}, {200}, and {220} crystal plane families were collected under Schulz reflection geometry. The polar angle α is in a scanning range of 20–90°, and the azimuthal angle β uses a rotation step of 5° (full clock scanning from 0° to 360°).
To describe and illustrate the deformation characteristics, the unidirectional rolling (UR) and clock rolling (CR) processes of high-purity Cu-0.1Al alloy plates were simulated by using the Deform-3D V11.0 finite element software. The simulation was established based on the elastic-plastic constitutive theory. The Coulomb friction model was adopted to describe the interfacial friction behavior between the workpiece and rolling roller, and a constant friction coefficient of 0.4 was assigned to describe the severe dry friction condition. The rolling roller was simplified as an analytical rigid body with a diameter of 200 mm and a fixed angular velocity of 2 rad/s. The initial dimension of the rolling workpiece was Φ30 mm × 20 mm. For mesh discretization, tetrahedral elements were selected for the workpiece, and an adaptive meshing strategy was applied during simulation. Local mesh refinement was strictly implemented in the roller-workpiece contact deformation zone to guarantee computational precision, and the minimum mesh element size in the refined region was set to 0.1 mm.
3. Results
3.1. Numerical Simulation
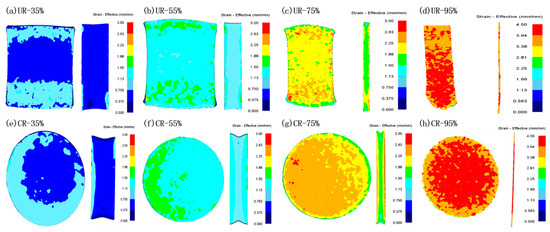
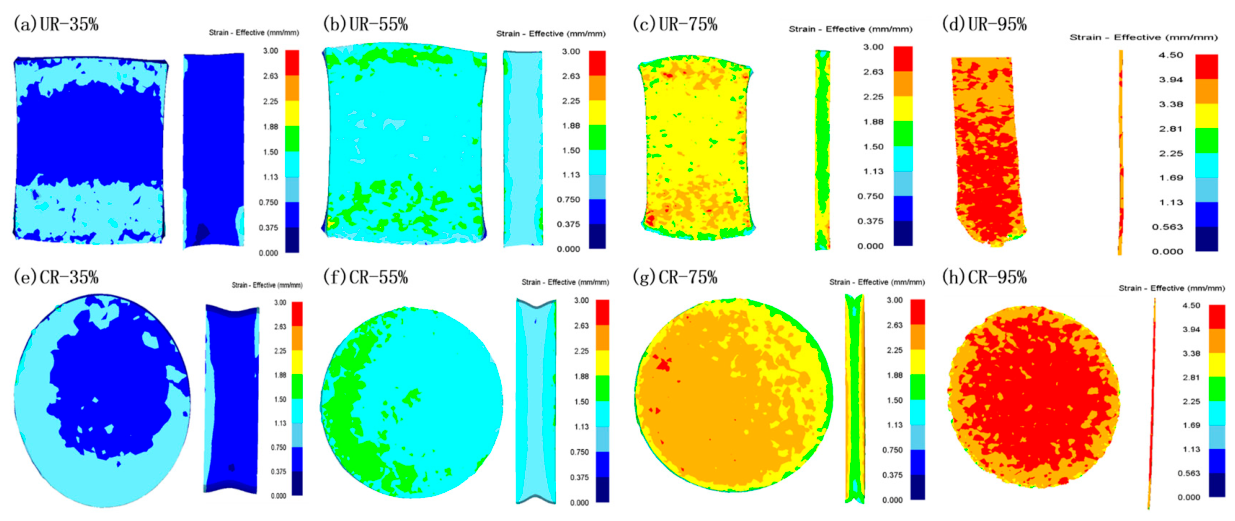
Figure 2 shows the equivalent strain distribution of unidirectional rolling (UR) and clock rolling (CR) under different deformations. The 3D finite element models for present simulations adopt two rigid work rolls with identical radius and equal rotational speed. The side-view plane shown in Figure 2 is the longitudinal section along the rolling direction (RD). The contour scale bar is marked with effective strain (mm/mm), which refers to the dimensionless von Mises equivalent plastic strain. The results indicate that the equivalent strain accumulates near the surface region at the initial stage, and then gradually spreads to the central area as the deformation increases. For both rolling routes, the strain has a symmetrical gradient distribution along the thickness direction. Nevertheless, the strain gradient tends to spread deeper in CR specimens due to multi-directional cyclic loading. When the total thickness reduction reaches 95%, the strain in UR still maintains a typical distribution pattern with much higher strain concentrated at the surface layer. However, multi-directional strain superposition in CR greatly elevates the strain magnitude at the central region, where the equivalent strain value approaches that of the surface layer, yielding a far more uniform through-thickness strain field.
Figure 2.
Equivalent strain distribution of UR and CR (longitudinal section parallel to rolling direction (RD)).
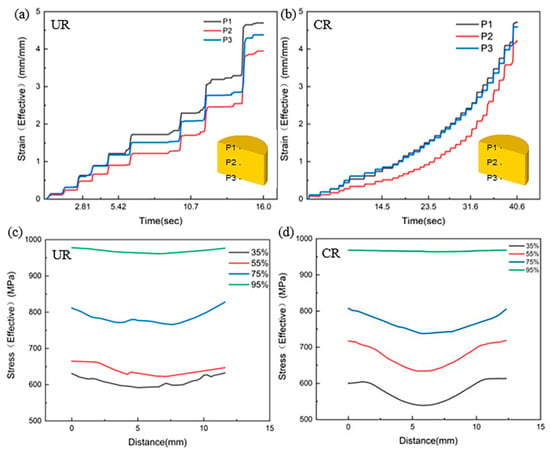
Figure 3 reveals the strain and stress distribution along the thickness direction of specimens rolled under UR and CR methods. Both processes exhibit consistent time-dependent strain evolution trends. However, there is a significant strain difference between the upper and lower surfaces of UR, while the strain distribution difference on the surfaces of CR is more balanced. Distinct differences in distribution symmetry are observed owing to their different loading paths. In the UR process, the specimen is fed into the roll gap along a fixed single direction without rotation. Persistent unidirectional frictional shear gradually amplifies the deformation discrepancy between the sheet surface and core. Furthermore, it also progressively widens the strain gap between tracking points on the top and bottom surfaces. Specifically, slight asymmetric interfacial shear, arising from different geometric contact trajectories at the roll entry and exit zones, accumulates throughout multiple rolling passes and yields consistently higher equivalent strain magnitudes on the top sheet surface.
Figure 3.
Evolution of equivalent strain with time and stress distribution in the thickness direction in (a,c) UR and (b,d) CR.
Compared with UR, CR strategy realizes multi-directional alternating strain loading by rotating the specimen. The alternately changed shear boundary conditions effectively compensate for the unidirectional deformation asymmetry. Both rolling routes produce a through-thickness stress gradient with clear stress discrepancies between the surface and core regions. However, with the increase in thickness reduction to 95%, the stress field of CR specimen becomes more uniform. The stress difference between the surface and the center in CR is decreased to 4 MPa, much smaller than that of 15 MPa in UR. This indicates that clock rolling can effectively weaken the through-thickness mechanical gradient and achieve uniform plastic deformation.
3.2. Microstructure and Texture
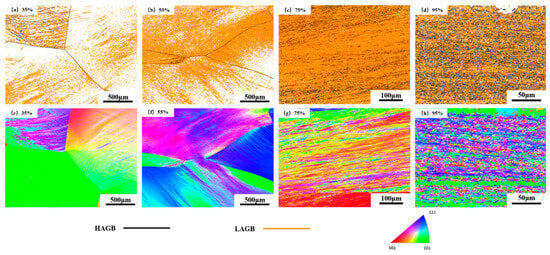
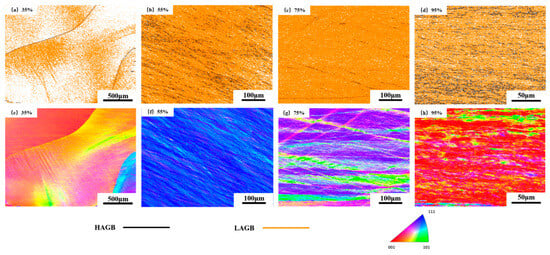
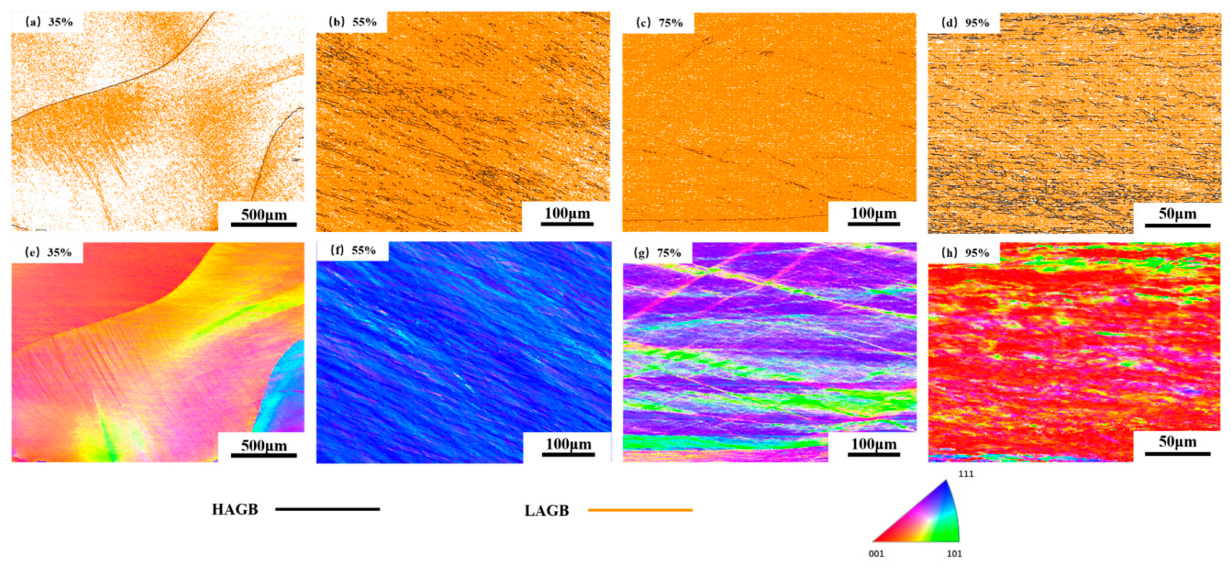
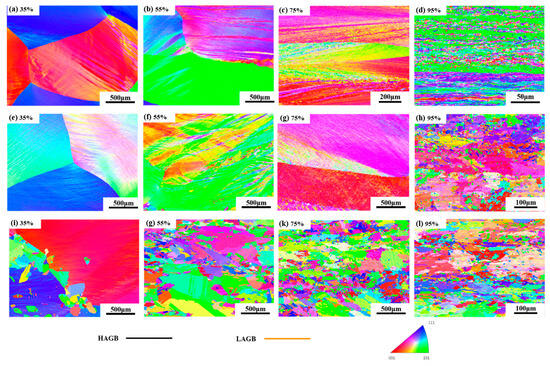
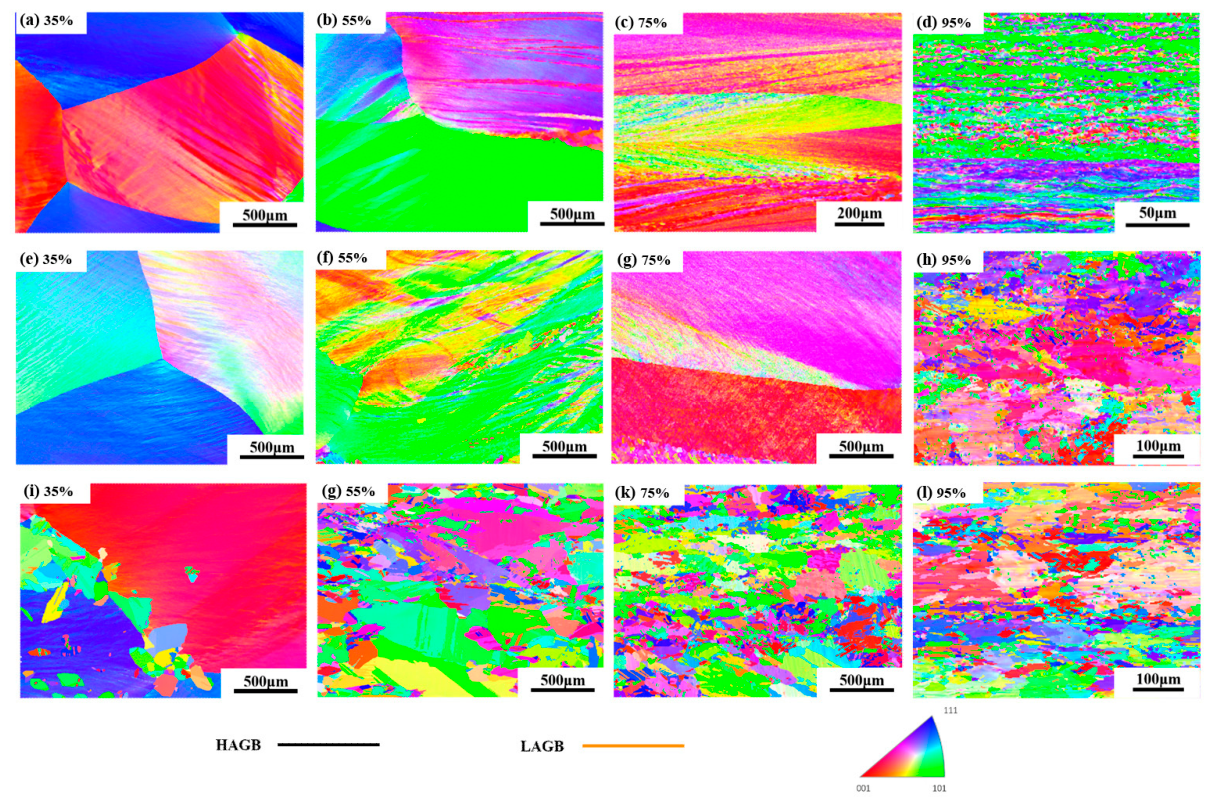
Figure 4 shows the grain boundary maps and orientation maps of UR specimen. It can be seen that with the increase in deformation, the low-angle grain boundaries (LAGBs) in the sample gradually increase. At a low strain, the high-angle grain boundaries (HAGBs) of original grains are still obvious. However, as the thickness reduction increases to 75%, the grains are elongated along the rolling direction, eventually resulting in the formation of numerous low-angle grain boundaries. Severe plastic deformation induces the generation and propagation of localized shear bands inside grains, and intense dislocation accumulation and grain subdivision within shear bands continuously generate a large number of LAGBs. At a large thickness reduction of 95%, the density of low-angle grain boundaries is reduced, and subgrain structures appear clearly.
Figure 4.
Grain boundary maps and orientation maps of UR specimens under different deformation: (a,e) 35%, (b,f) 55%, (c,g) 75%, (d,h) 95%.
Figure 5 shows the grain boundary maps and orientation maps of CR specimens. Under low rolling reductions, LAGBs dominate the microstructure in CR. As deformation proceeds, multi-directional shear during clock rolling activates numerous latent slip systems. When the thickness reduction reaches 55%, the number of LAGBs increases significantly and HAGBs gradually develop. Dislocations with diverse orientations continuously multiply and intersect, forming dense LAGBs inside grains. Sustained shear loading drives the rotation of subgrains bounded by LAGBs, thereby transforming LAGBs into HAGBs. When the thickness reduction is further increased to 75%, multi-directional shear band crossing can be observed obviously. CR imposes alternating multi-directional shear. As a result, local high-strain bands of diverse orientations interpenetrate and intersect, and ultimately evolve into an interlaced network of cross shear bands. At a thickness reduction of 95%, the amount of LAGBs decreases. This is mainly attributed to the occurrence of dynamic recovery.
Figure 5.
Grain boundary maps and orientation maps of CR specimens under different deformation: (a,e) 35%, (b,f) 55%, (c,g) 75%, (d,h) 95%.
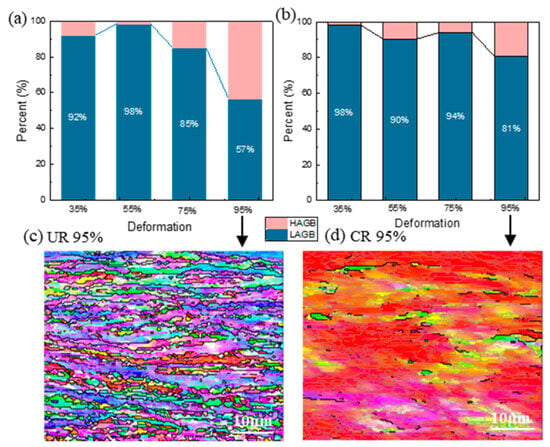
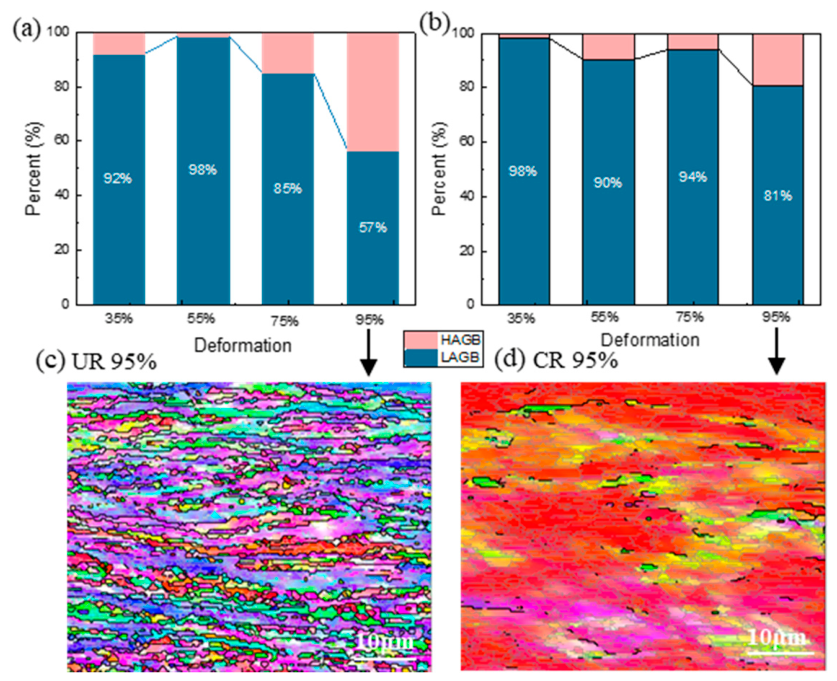
Figure 6a,b clearly illustrates the evolution of LAGBs and HAGBs in UR and CR specimens. As the thickness reduction increases, the fraction of LAGBs drops remarkably once the thickness reduction exceeds 75%, but this decreasing trend is much milder for CR samples. During unidirectional rolling, a limited set of slip systems are activated, thus easily inducing severe local dislocation pile-ups. Once dislocation density attains saturation, the material proceeds to dynamic recovery, during which dislocations annihilate and reorganize to develop subgrains and subboundaries. By contrast, multi-directional shear during clock rolling enables continuous dislocation accumulation in multiple directions, maintaining higher dislocation density and a larger proportion of LAGBs.
Figure 6.
(a) Statistics of the fractions of high-angle grain boundaries (HAGBs) and low-angle grain boundaries (LAGBs) for UR and (b) CR specimens under different thickness reductions; (c) the magnified EBSD maps of UR and (d) CR specimens after 95% thickness reduction.
As displayed in Figure 6c,d, the subgrain structures at 95% thickness reduction are examined. Extremely fine grains appear in UR specimens, while this feature is much less evident in CR. In UR, the localized high-energy zones rapidly accumulate enough stored energy to meet the critical threshold for dynamic recrystallization (DRX), thereby inducing early nucleation of recrystallized grains inside shear bands. By contrast, cross rolling activates multiple slip systems and yields a higher bulk dislocation density. Nevertheless, sustained dynamic recovery homogenizes stored energy and suppresses the development of high-energy localized shear bands. Consequently, much larger strains are needed to initiate DRX.
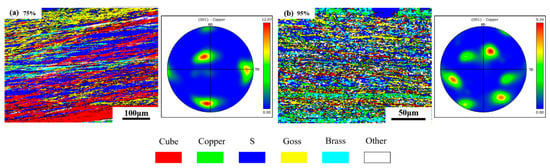
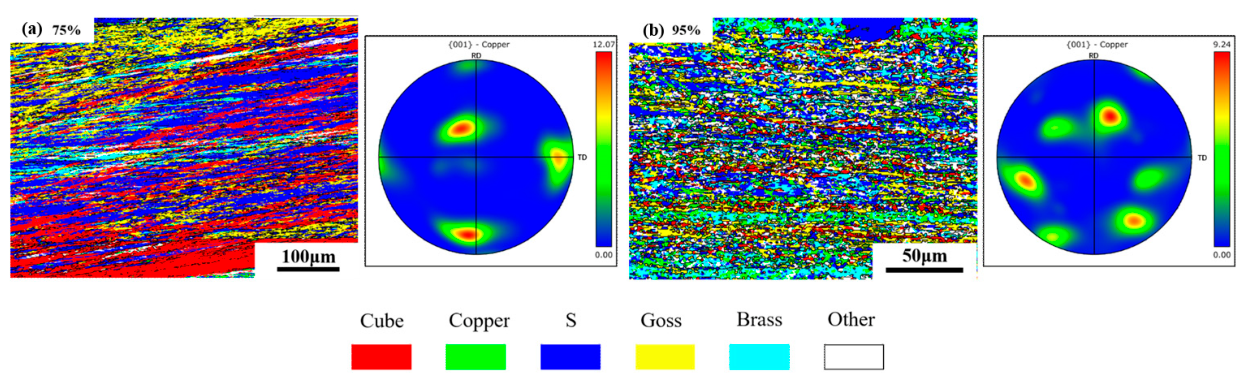
To investigate texture characteristics under dynamic recovery and dynamic recrystallization, only specimens subjected to large deformation were selected for analysis. Figure 7 shows the distribution of texture components and the corresponding {100} pole figure of UR specimens under large deformation. The texture components of S ({123}<634>), Goss ({011}<100>) and Cube {001}<100> coexist when the thickness reduction reaches 75%. Under heavy unidirectional deformation, massive dislocations pile up and lead to saturated dislocation density. The accumulated dislocation storage energy acts as the intrinsic driving force for dislocations annihilation, rearrangement and the formation of subgrain structures. At this stage, the texture intensity reaches its maximum. When the thickness reduction reaches 95%, subgrain structures become more prominent owing to sustained cold dynamic recovery, and partial local dynamic recrystallization is activated. The S texture still remains dominant because the stored energy is insufficient to randomize grain orientations.
Figure 7.
The distribution of texture components and the corresponding {100} pole figures of UR under the deformations of (a) 75%, (b) 95%.
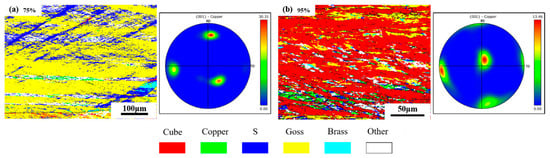
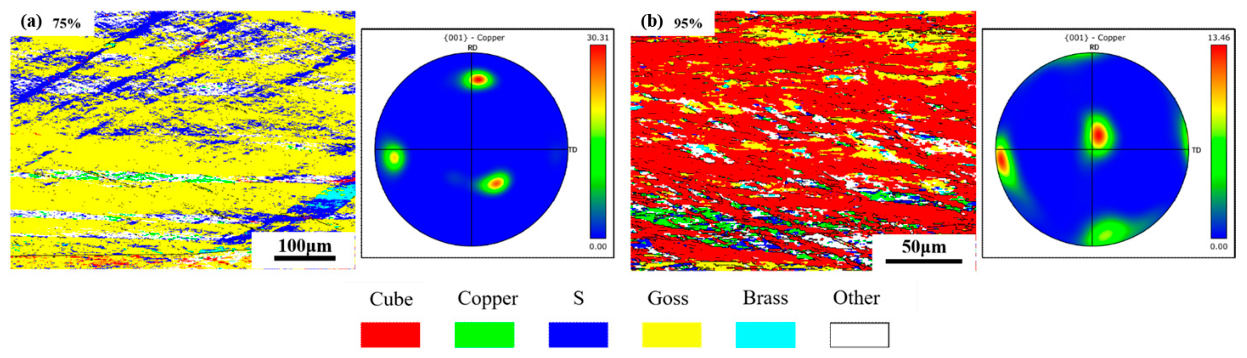
Figure 8 shows the distribution of texture components and the corresponding {100} pole figure of CR specimens under large deformation. Under the thickness reduction of 75%, alternating deformation bands carrying Goss and S orientations are observed along different directions, and the texture intensity reaches a high value of approximately 30.31. As the thickness reduction reaches 95%, the Cube orientation becomes dominant. The emergence of dominant Cube texture stems from the geometric coordination requirements under cyclic multi-directional strain paths. The intensity of Cube texture decreases significantly, driven by cold dynamic recovery. Such recovery forms abundant subgrains and homogenizes local grain orientations, thus lowering the overall texture intensity.
Figure 8.
The distribution of texture components and the corresponding {100} pole figures of CR under the deformations of (a) 75%, (b) 95%.
3.3. Recrystallization Microstructure and Texture After Annealing
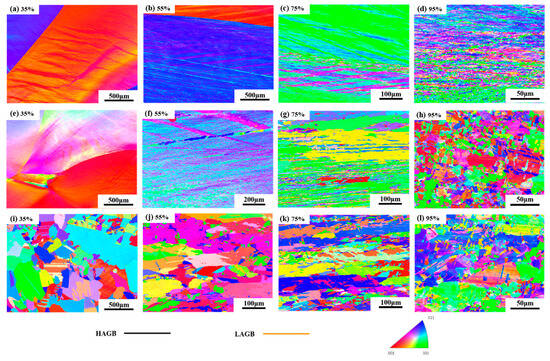
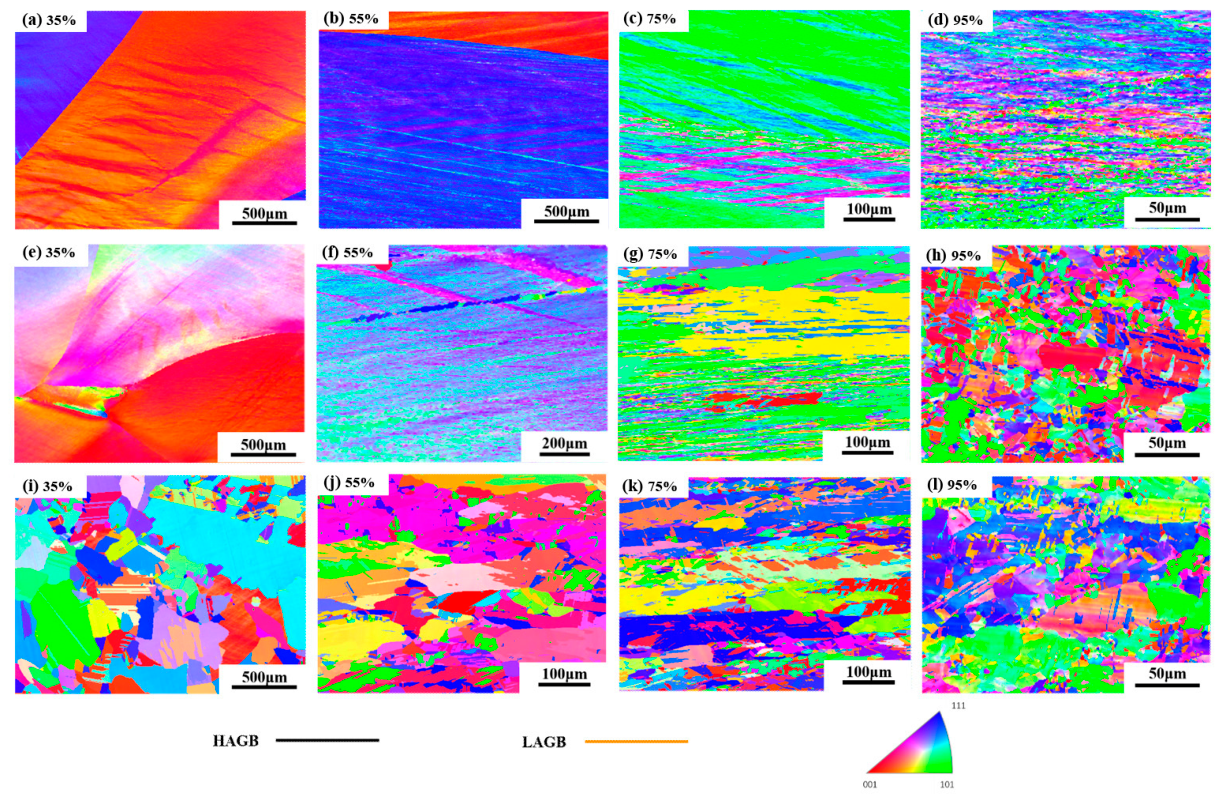
Figure 9 shows the inverse pole figure (IPF) maps of UR samples under different deformation and annealing temperatures. It can be seen that at an annealing temperature of 100 °C, the grain morphology under deformations from 35% to 75% keeps similar to that before annealing. The grains are elongated along the rolling direction. The samples under 95% deformation show a clearly lamellar structure with some small subgrains. After being annealed at 200 °C, the coarse grains indicate that recrystallization does not occur under 35%, 55% and 75% deformations. However, at 95% deformation, recrystallization is clearly observed. The grains exhibit preferred orientation and the average grain size is approximately 12.5 μm.
Figure 9.
IPF maps of UR under different deformation at annealing temperatures of (a–d) 100 °C, (e–h) 200 °C, and (i–l) 300 °C.
After annealed at 300 °C, a small number of recrystallized grains can be found along the grain boundaries in the sample of 35% deformation, which shows a discontinuous dynamic recrystallization mechanism. The recrystallization is almost completed under 55%, 75% and 95% deformations, and the corresponding average grain size is about 42.4 μm, 36.2 μm and 11.8 μm, respectively.
Figure 10 shows the IPF maps of CR samples under deformation and different annealing temperatures. It can be seen that the recrystallization of CR is similar to that of UR at 100 °C annealing. The shear bands inside the grain can be seen obviously under 35%, 55% and 75% deformations. A large number of fibrous structures along the rolling direction are gradually formed. When the deformation increases to 95%, fine deformation substructures are observed, which implies that significant dynamic recovery or dynamic recrystallization occurs.
Figure 10.
IPF maps of CR specimen under different deformation and at annealing temperatures of (a–d) 100 °C, (e–h) 200 °C, and (i–l) 300 °C.
Different from UR specimens, partial recrystallization is initiated in CR specimens annealed at 200 °C under the deformation of 75%, but the grains still exhibit an elongated morphology in the rolling direction. When the deformation reaches 95%, a large number of grains have recrystallized, showing relatively random orientations. After annealed at 300 °C, large-scale recrystallization has been observed even under 35% deformation, but the grain size distribution is not uniform with an average grain size of 68 μm. As the deformation increases, the grains are almost completely recrystallized.
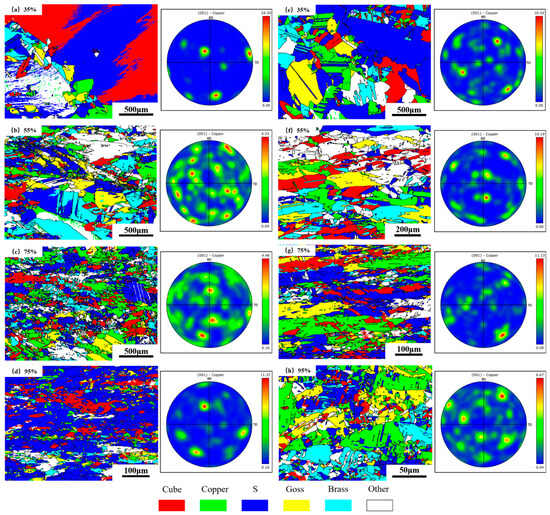
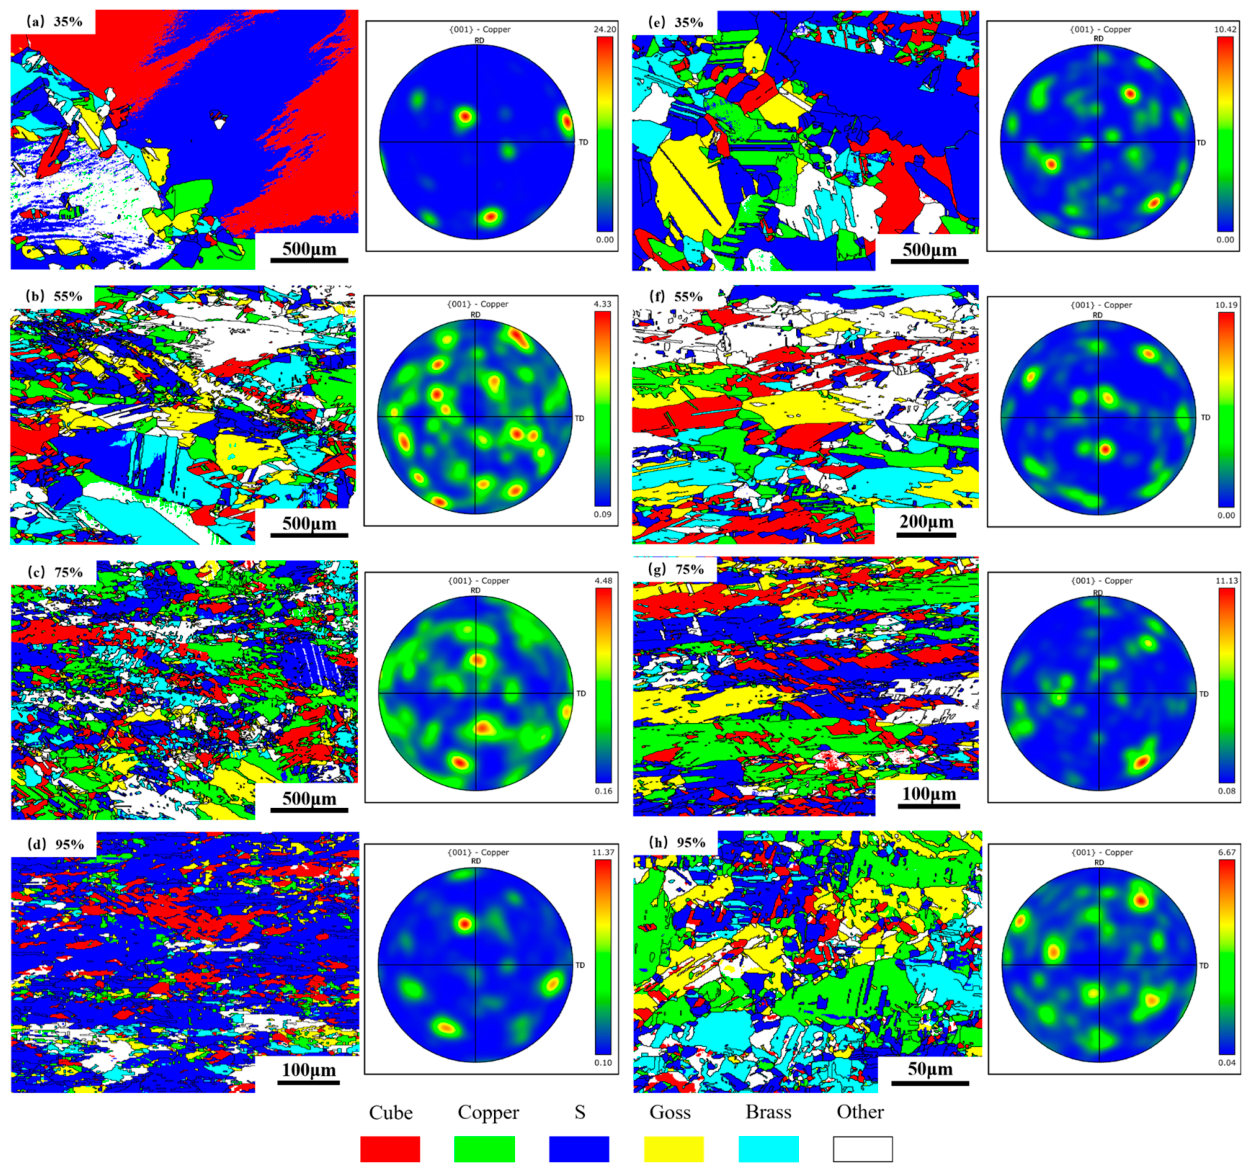
Figure 11 shows the texture distribution and the corresponding {100} pole figure of both UR and CR samples under different deformation after annealing at 300 °C. Under the deformation of 35%, the grains in UR sample contain a large amount of Cube texture and S texture. Meanwhile, CR sample also has lots of S texture. As the deformation increases, the proportion of S texture is reduced due to recrystallization, but still remains relatively high in UR. By comparison, the grain orientation after recrystallization is relatively random in CR. When the deformation is 95%, the fraction of S texture in UR is extremely high. It is implied that the S orientation is easily formed during recrystallization in UR. Although the grain orientation is random in CR, the fraction of Copper texture and S texture is slightly high.
Figure 11.
The texture distribution and the corresponding {100} pole figure of (a–d) UR, (e–h) CR under different deformation after annealing at 300 °C.
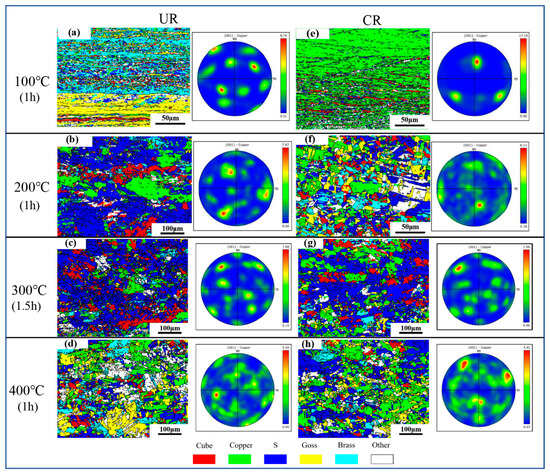
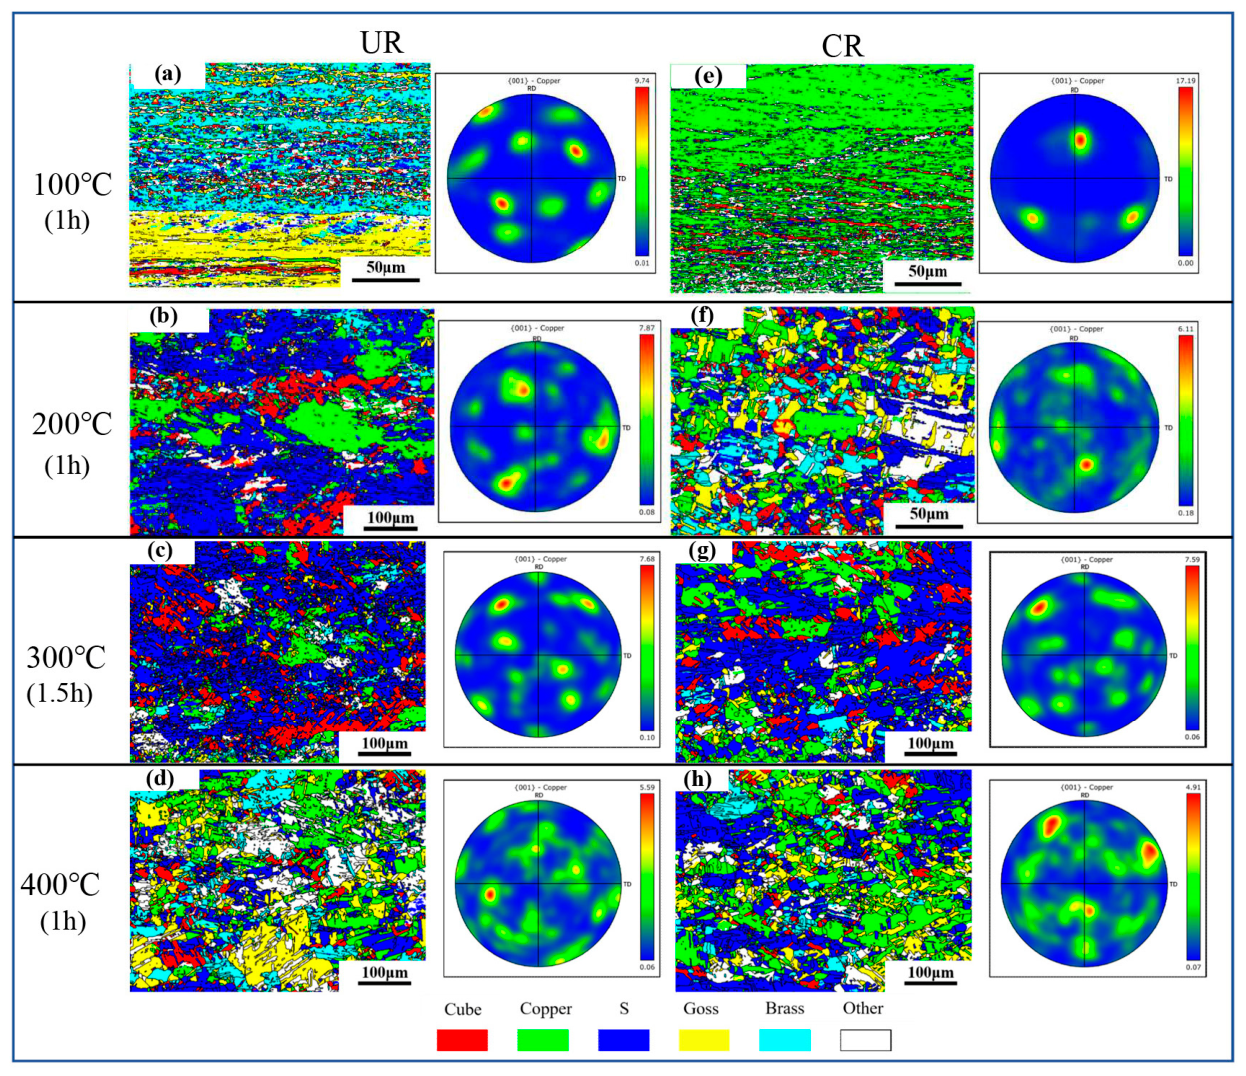
Figure 12 shows the texture distribution and the corresponding {100} pole figure of UR and CR at different annealing temperatures under 95% deformation. After annealed at 100 °C, Goss and Brass textures are dominant in UR, while Copper texture is dominant in CR. When annealed at 200 °C, a large number of grains show a similar orientation in UR, and S texture accounts for the majority of the grain orientations, accompanied by a small amount of Cube texture and Copper texture. In the CR sample, the orientation of recrystallized grains is more random.
Figure 12.
The texture distribution and the corresponding {100} pole figure of (a–d) UR, (e–h) CR for unidirectional and clock rolling with 95% reduction under different annealing processes.
In order to verify the texture after full recrystallization, the 95% deformed samples were annealed at 300 °C for 1.5 h and 400 °C for 1 h, respectively. After extending the annealing time at 300 °C, S texture in the UR sample still remains the majority. In addition, the S texture in the CR sample also increases significantly. When the annealing temperature increases to 400 °C, the S texture in UR samples decreases obviously. The texture in UR becomes more uniform, which is composed of Copper, Goss and Brass textures. In CR sample, S, Copper and Goss components are the main texture.
4. Discussion
4.1. Texture Evolution During Clock Rolling
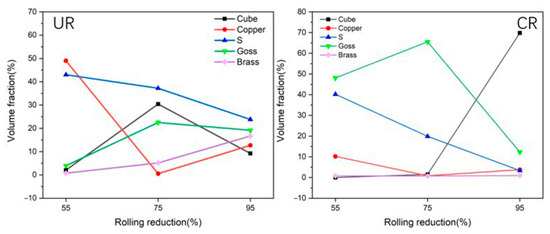
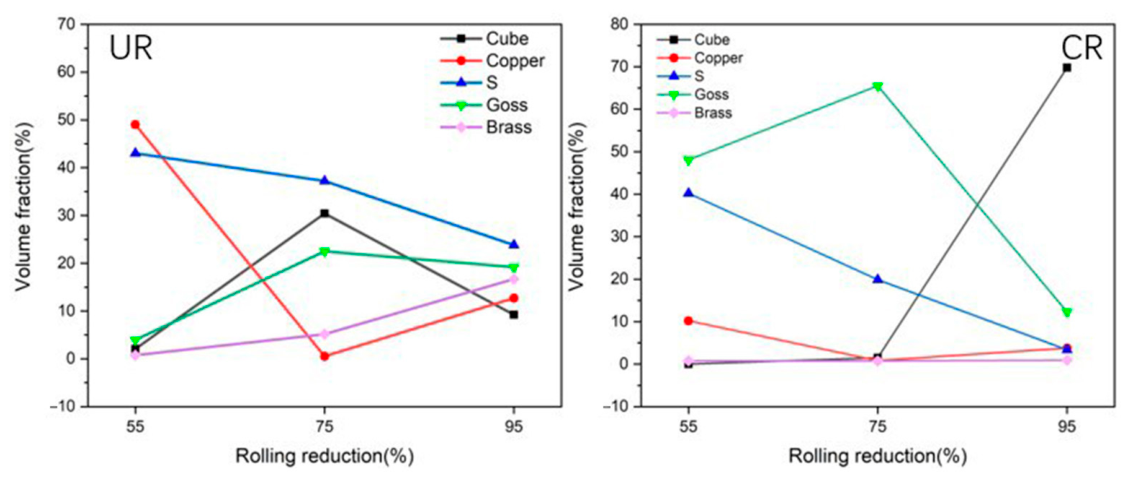
The texture evolution in UR and CR is described in Figure 13. Except for the Cube texture, the evolution of the other textures is similar between the two rolling methods. When the thickness reduction is less than 75%, S texture accounts for a high proportion in UR, while the proportion of Goss texture is relatively high in CR. As the deformation increases to 95%, the fraction of S texture remains higher than the other texture components in UR. Meanwhile, the Cube texture is more prominent in CR process.
Figure 13.
Statistics of the fraction of texture components under UR and CR.
As typical deformation textures, S and Copper textures are more conducive to the coordinated movement of slip systems in the rolling direction. Thus, grains prefer to these orientations to accommodate the plastic flow during deformation. However, Cube and Goss textures are difficult to keep stable during rolling. The initial orientation of Cube-oriented grains have slip systems mismatched with the rolling direction, which hinders the slip of dislocations, so that they gradually turn to S or Copper orientation which is easier to coordinate deformation. Under severe deformation, due to the saturation of dislocation density as well as the activation of dynamic recovery, some Cube- and Goss-oriented grains were restored, and the unstable texture of Goss undergoes a transition [26]. In addition, with the increase in deformation, the overall intensity of rolling texture is continuously enhanced [27].
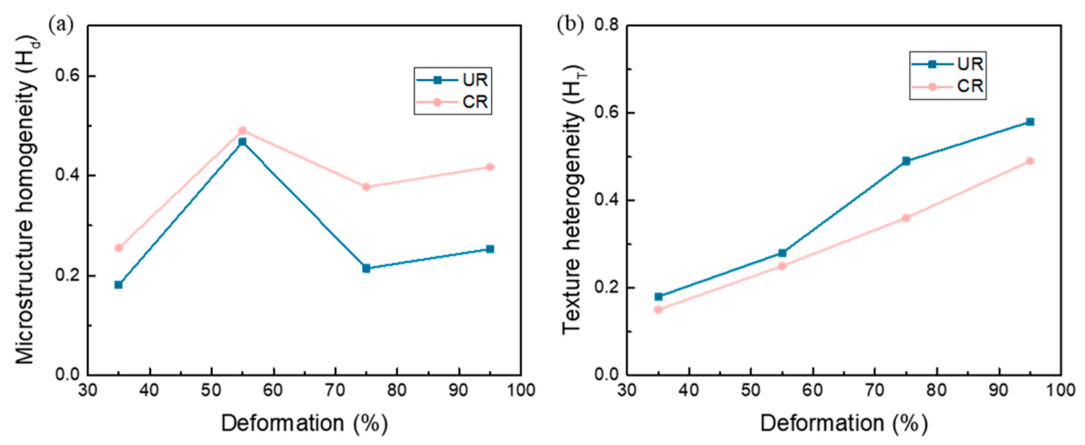
The microstructural homogeneity index and texture heterogeneity index proposed by Sidor [28] was used to quantitatively evaluate the microstructure and texture of the UR and CR specimens. The two homogenization indices are defined by the formulas below:
where is the average grain size, and the representative grain size is determined through volume weighting of individual grain sizes. is the overall texture index obtained by integrating the squared values of orientation distribution function, and is the average texture index of texture subdomains.
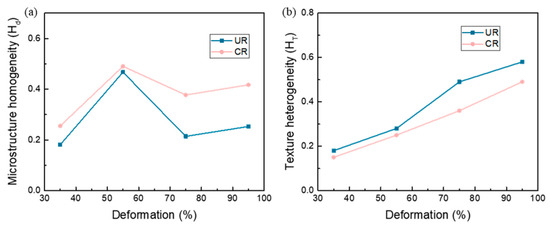
Figure 14 illustrates the evolution of the indices and at different deformation levels. The microstructural homogeneity index moderately rises at the early stage of deformation. As deformation proceeds, dislocation density increases, which fragments the initial coarse grains and triggers the ordered arrangement of dislocations to generate numerous fine grains. This process narrows the spread of grain sizes and yields a more uniform grain size distribution. Dynamic recovery, dynamic recrystallization and continuous shear effect exhibit competitive influences on grain homogeneity, which accounts for the fluctuation of homogenization indices under rolling reductions exceeding 75%. The texture heterogeneity index shows a nearly monotonic upward trend with increasing strain. In comparison, all values of CR samples are lower than those of UR, which directly demonstrates superior overall texture homogeneity for CR sheets. The multi-directional strain paths during clock rolling homogenize grain orientations effectively.
Figure 14.
(a) Evaluation of microstructural homogeneity index and (b) texture heterogeneity index for UR and CR specimens.
During the unidirectional deformation of UR, dislocations are strongly piled up at grain boundaries, and the internal storage energy is high, which induces the random nucleation of dynamic recrystallization. In contrast, the multi-directional shear strain introduced by CR promotes the cross-slip and reorganization of dislocations, and effectively releases the strain energy through dynamic recovery process, thus inhibiting the occurrence of recrystallization and making the Cube texture remain dominant.
The spatial distribution of shear stress field directly affects the selective development of the texture components. In the process of clock rolling, the periodic switching of rolling paths forms an alternating shear stress field in the material, which is more conducive to the stabilization of {001}<100> orientation (Cube texture). The uniaxial stress field of unidirectional rolling promotes the evolution of typical rolling textures such as Brass, which is consistent with the texture evolution of traditional rolling metals [29].
4.2. Recrystallization Texture of Clock Rolling
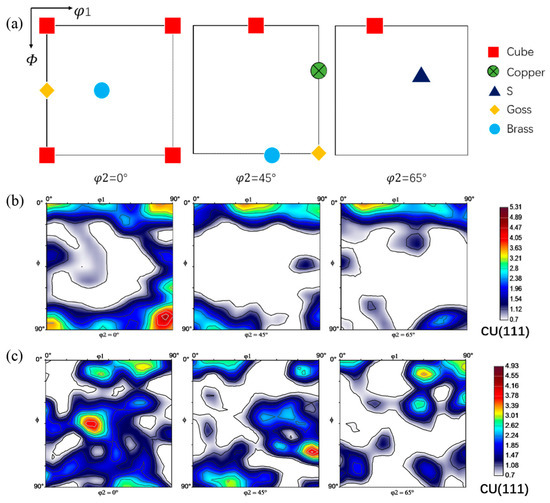
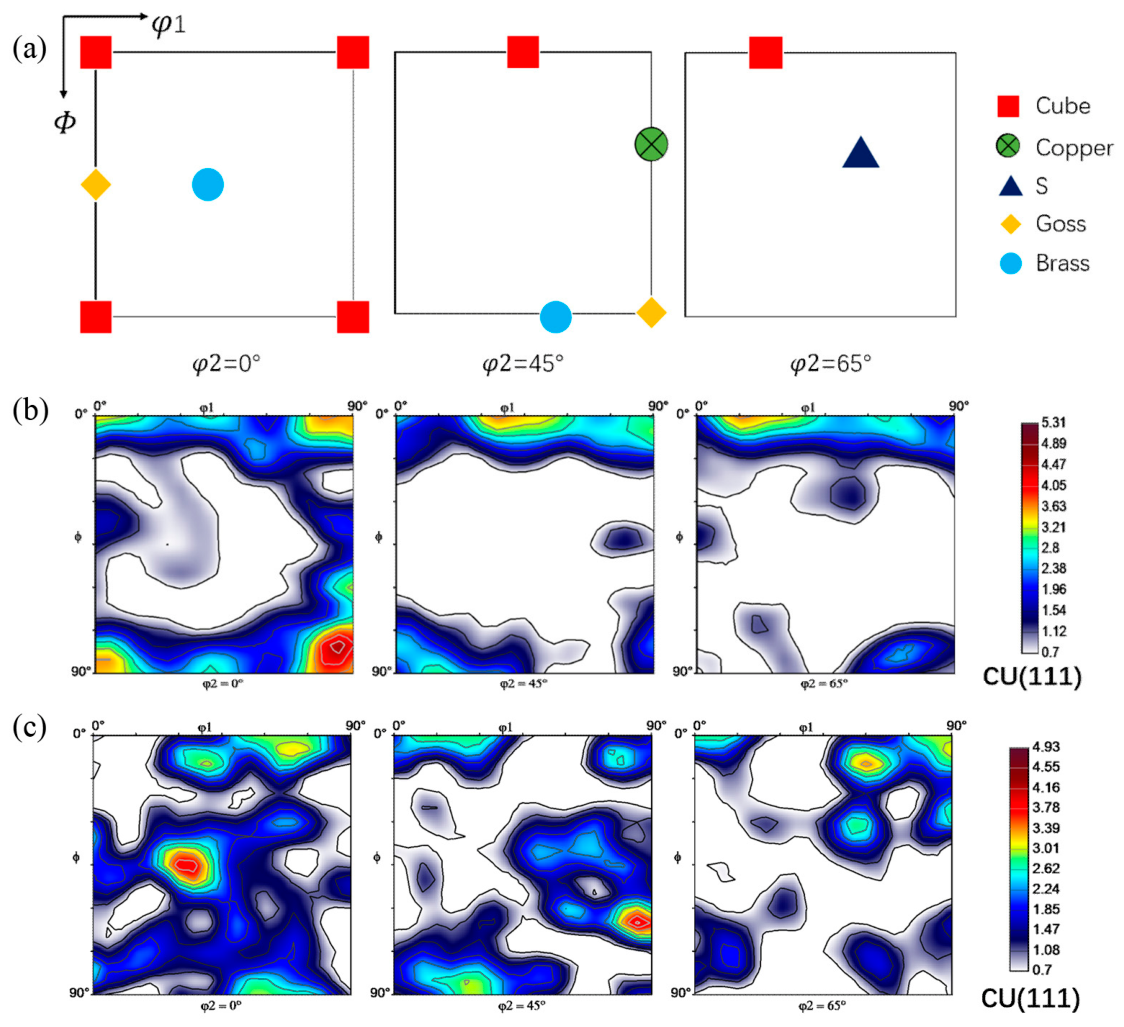
Figure 15 shows the orientation distribution function (ODF) maps of the samples under clock rolling of 95% deformation and annealing at 400 °C measured by XRD. In this study, XRD texture measurement mainly serves to qualitatively analyze the variation in typical texture components under rolling and annealing. It should be noted that the limited φ1 interval of 0–90° cannot fully reflect the complete texture distribution of CR specimens, for the in-plane symmetry of the clock rolled specimen is broken by the alternating strain paths. The typical textures of FCC material are illustrated in Figure 15a. Obviously, there is strong Cube texture and a small amount of Goss texture after 95% deformation of clock rolling as shown in Figure 15b, but the texture intensity of Cube texture is low, only 5.31, indicating that dynamic recrystallization is likely to occur in the sample. This is consistent with the EBSD results.
Figure 15.
(a) Schematic of texture distribution and ODF maps of (b) 95% clock rolling and (c) 400 °C annealing measured by XRD.
Figure 15c shows the ODF maps of CR sample after annealing at 400 °C. In the section of φ2 = 45° in Eulerian space, the strong Cube component in as-rolled state has been completely eliminated, and the texture shows a preferred Brass orientation (the maximum orientation density is 4.93), accompanied by a small amount of weakened S texture. The extremely low texture intensity reflects a quasi-random orientation distribution.
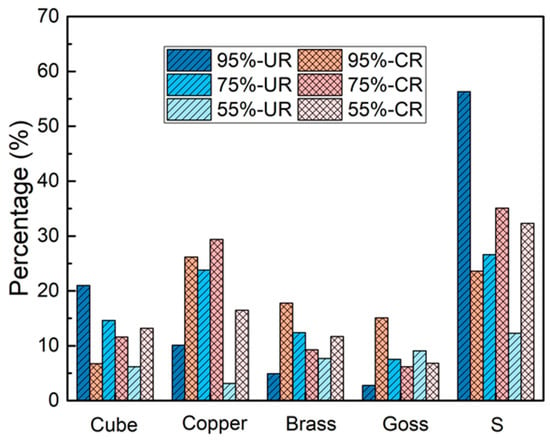
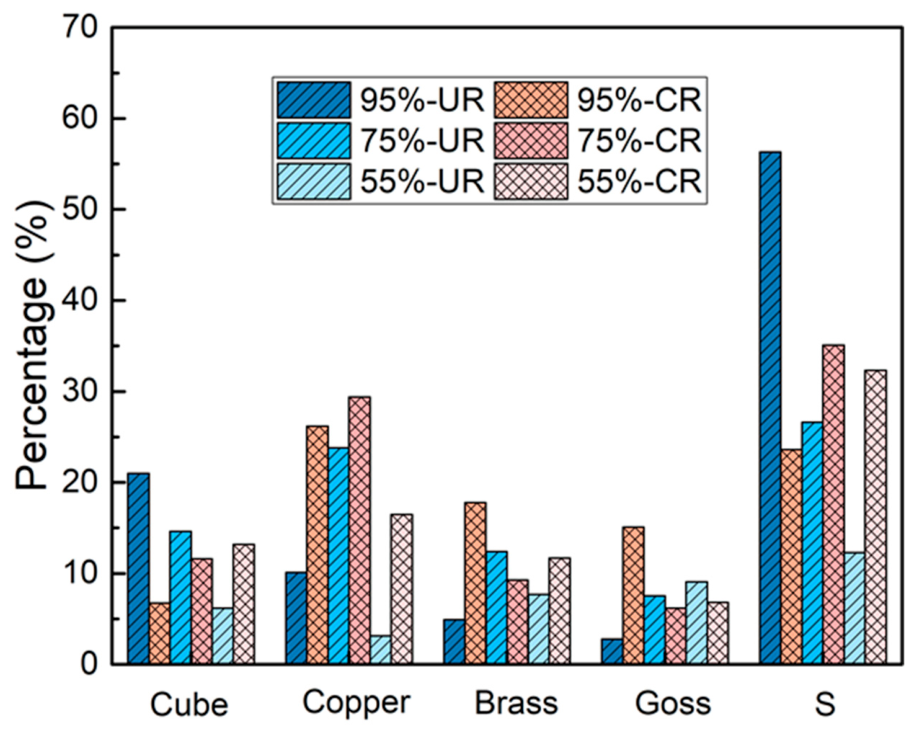
The statistics of texture fraction in all the recrystallization samples annealed at 300 °C are shown in Figure 16. Under UR, S texture gradually increases with the increase in deformation, and a high proportion of S texture forms at 95% deformation. Compared with UR, the proportion of each texture component in CR is more uniform under large deformation. The difference in the fraction of recrystallization texture between UR and CR decreases at low deformation. It indicates that clock rolling has an advantage in the homogenization of recrystallized grains under large deformations, which is conducive to weakening texture [11,30].
Figure 16.
Statistics of the main texture components after annealing at 300 °C under different deformation.
4.3. Recrystallization Behavior of Clock Rolling
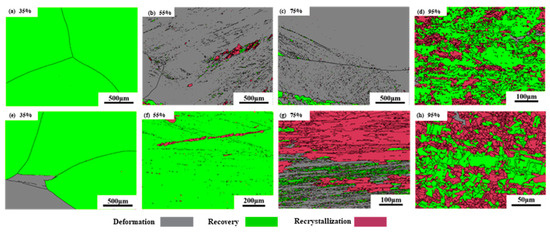
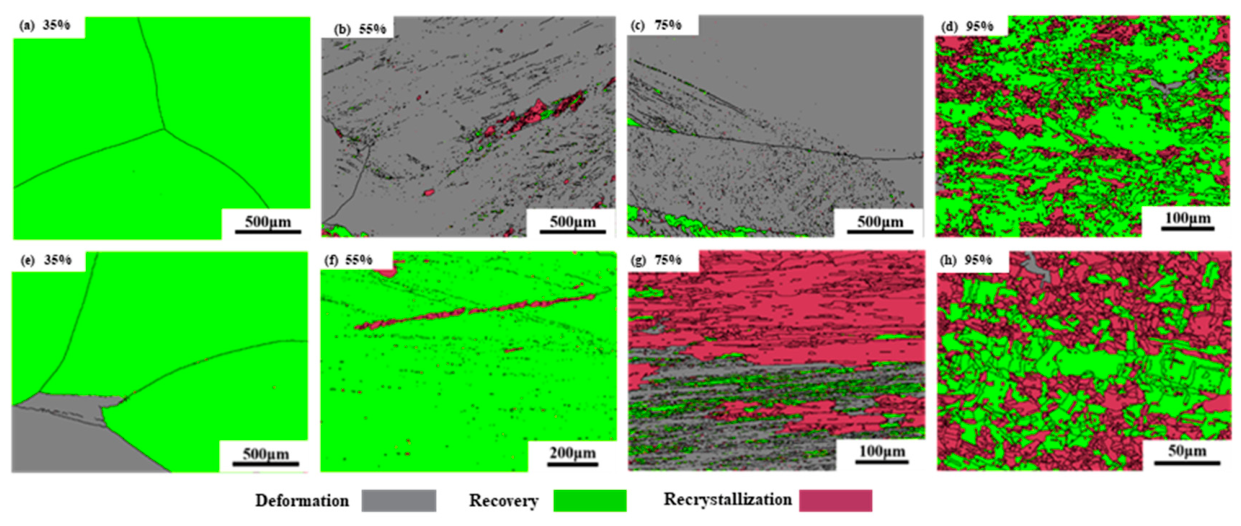
The Grain Orientation Spread (GOS) map is an important tool to analyze the recrystallization of materials. Generally, low GOS values (0–2°) correspond to recrystallized grains, high GOS values (>7°) characterize deformed grains, and intermediate values (2–7°) reflect recovery grains. Figure 17 shows the GOS maps of UR and CR under different deformation after annealing at 200 °C. It can be seen that under 35% deformation, the grains in both rolling methods still maintain an as-cast structure, so it is marked as a recovery state. The samples of UR under 55% and 75% deformations are in a deformed state, although a small amount of recrystallization has occurred. However, a large area of recrystallization is present under 75% deformation of CR. Compared with UR, the recovery and recrystallization in CR occur more quickly, which is due to the fact that the multi-directional deformation in CR promotes the cross slip and uniform distribution of dislocations. Under large deformation of 95%, more recrystallized grains are formed in CR.
Figure 17.
GOS maps of (a–d) UR and (e–h) CR samples annealed at 200 °C under different deformation.
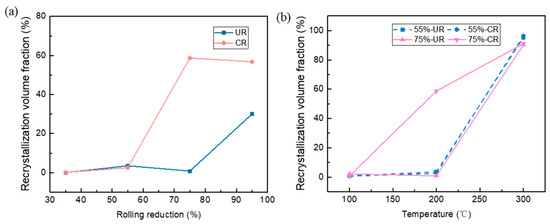
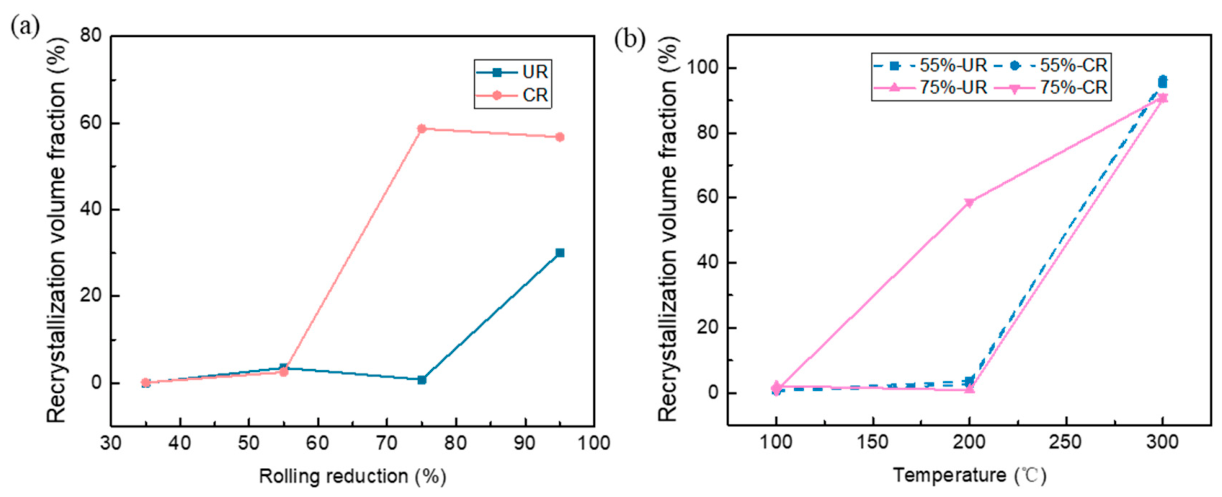
It can be concluded that CR is more conducive to recrystallization occurrence compared with UR. Figure 18 shows the statistical recrystallization fraction at different deformation and temperature, which displays intuitively the recrystallization fraction evolving with the deformation after annealing at 200 °C. Obviously, under the same conditions, CR has an earlier or higher recrystallization fraction than UR, which shows its promotion of recrystallization. The final volume fraction of the recrystallization in both methods is close to each other when the annealing temperature reaches the complete recrystallization.
Figure 18.
Recrystallization fraction at different deformation and temperature in UR and CR. (a) Recrystallization evolution with rolling reduction at 200 °C, and (b) recrystallization fraction evolution with temperature under 55% and 75% deformation.
After full recrystallization, there is a small difference in the size of recrystallized grains between UR and CR, which is consistent with the study of Long et al. [25] on the microstructure evolution of high-purity Cu-Al alloy during rolling. After annealing of CR, fine and equiaxed recrystallized grains benefit from the multi-directional deformation [31]. In addition, the recrystallization mechanism may also be influenced by clock rolling. The recrystallization mechanism under 35% unidirectional rolling deformation has shown a discontinuous dynamic recrystallization. However, it is reported that cross rolling tends to change the recrystallization mechanism to continuous dynamic recrystallization [15]. This may affect the size and distribution of recrystallized grains at low deformation of CR.
5. Conclusions
By comparison with unidirectional rolling, the microstructure and texture evolution of ultra-high-purity Cu-0.1Al alloy under clock rolling at different deformation and different annealing temperatures were studied. The deformation characteristics, texture components of clock rolling under deformation and recrystallization were analyzed in detail. The main conclusions are summarized as follows.
(1) Clock rolling could reduce the strain gradient and stress gradient in the thickness direction. The overall strain uniformity of clock rolling is better than that of unidirectional rolling.
(2) At large deformation, Cube texture is dominant in clock rolling while S texture is preferred in unidirectional rolling. Both unidirectional rolling and clock rolling have obvious recovery substructure, but partial dynamic recrystallization occurs obviously during unidirectional rolling.
(3) The recrystallization texture of clock rolling is relatively uniform with weakened intensity, while that of unidirectional rolling under large deformation is mainly S texture, which could be relieved under high-temperature annealing of 400 °C.
(4) Compared with unidirectional rolling, clock rolling is more likely to promote recrystallization under equivalent annealing treatments, and yields a relatively uniform grain size distribution, which benefits from the multi-directional shear strain.
Although clock rolling exhibits outstanding advantages in homogenizing strain, grain and recrystallization texture for ultra-high-purity Cu-Al alloy sheets, its industrial transformation still faces prominent bottlenecks. Restricted by special loading mode, the technique is challenging to large-scale continuous industrial production, yet it exhibits promising application prospects for small-batch production of materials with limited dimensions.
Author Contributions
Conceptualization, M.L. and S.L. (Song Liu); methodology, M.L.; software, S.L. (Shizheng Li); validation, S.L. (Shizheng Li), and B.C.; formal analysis, S.L. (Shizheng Li); investigation, S.L. (Shizheng Li); resources, S.L. (Song Liu); data curation, S.L. (Shizheng Li) and B.C.; writing—original draft preparation, M.L.; writing—review and editing, M.L.; visualization, M.L. and S.L. (Shizheng Li); supervision, S.L. (Song Liu); project administration, S.L. (Song Liu); funding acquisition, M.L. All authors have read and agreed to the published version of the manuscript.
Funding
This research was funded by the National Natural Science Foundation of China (grant number U24A2029), the project of Zhongyuan Critical Metals Laboratory (grant number GJJSGFYQ202409), and the Natural Science Foundation of Henan Province (grant number 252300420007).
Institutional Review Board Statement
Not applicable.
Informed Consent Statement
Not applicable.
Data Availability Statement
The original contributions presented in the study are included in the article. Further inquiries can be directed to the corresponding authors.
Conflicts of Interest
The authors declare no conflict of interest.
References
- He, J.; Lyu, B.; Jia, Q.; Ding, Z.; Liu, S.; Luo, J.; Wang, X. Development of High-purity Metal Sputtering Targets for Integrated Circuits. Chin. J. Eng. Sci. 2023, 25, 79. [Google Scholar] [CrossRef] [Scilit]
- Byrne, C.; Brady, A.; Walsh, L.; McCoy, A.P.; Bogan, J.; McGlynn, E.; Rajani, K.V.; Hughes, G. Chemical and electrical characterisation of the segregation of Al from a CuAl alloy (90%:10% wt) with thermal anneal. Thin Solid Films 2016, 599, 59–63. [Google Scholar] [CrossRef] [Scilit]
- Li, B.; Sullivan, T.D.; Lee, T.C.; Badami, D. Reliability challenges for copper interconnects. Microelectron. Reliab. 2004, 44, 365–380. [Google Scholar] [CrossRef] [Scilit]
- Yang, W.; Zhao, G.; Wang, Y.; Wang, S.; Zhan, S.; Wang, D.; Bao, M.; Tang, B.; Yao, L.; Wang, X. Influence of grain size of Cu target on its magnetron sputtering erosion and parameters. J. Mater. Sci. Mater. Electron. 2021, 32, 26181–26188. [Google Scholar] [CrossRef] [Scilit]
- Wang, S.-K.; Yang, W.-H.; Wang, Y.-P.; Zhao, G.-H.; Zhan, S.-S.; Wang, D.; Tang, B.; Bao, M.-D. Effect of target grain size on target sputter etching morphology and performance. Vacuum 2022, 201, 111083. [Google Scholar] [CrossRef] [Scilit]
- Zhao, X.; Yuan, J.; Zhou, X.; Lu, H.; Hu, B.; Zhu, J. Effects of grain size, dislocation density, and texture type on the etching behavior of Cu target in magnetron sputtering process. Surf. Topogr.-Metrol. 2025, 13, 025018. [Google Scholar] [CrossRef] [Scilit]
- Ning, Z.; Wang, Y.; Li, S.; Tang, K.; Wen, M. The sputtering performance of Ag sputtering targets with different microstructure. Vacuum 2023, 210, 111888. [Google Scholar] [CrossRef] [Scilit]
- Michaluk, C.A. Correlating discrete orientation and grain size to the sputter deposition properties of tantalum. J. Electron. Mater. 2002, 31, 2–9. [Google Scholar] [CrossRef] [Scilit]
- Yu, K.; Xue, X.; Xu, L.; Li, G.; Zhang, X.; Wang, Y. Effect of grain size and orientation on magnetron sputtering yield of tantalum. Int. J. Refract. Met. H. 2025, 126, 106948. [Google Scholar] [CrossRef] [Scilit]
- Song, R.-X.; Wang, D.; Yang, Y.; He, J.; Li, S.; Yan, H.-L.; Zuo, L. A Review of Grain Refinement and Texture Engineering in Aluminum Alloy Magnetron Sputtering Targets. Materials 2025, 18, 3235. [Google Scholar] [CrossRef] [Scilit] [PubMed]
- Shin, Y.-C.; Park, Y.-C.; Hong, J.-P.; Cheong, J.Y.; Kim, K.-Y.; Shin, B.; Jeong, D.-Y.; Lee, T.; Kwak, T.; Jung, T.-K.; et al. Cross-rolling induced texture randomization and structural evolution for improved plastic isotropy in Al-Mg alloys with high Mg content. J. Alloys Compd. 2024, 1008, 176530. [Google Scholar] [CrossRef] [Scilit]
- Vincze, G.; Simões, F.J.P.; Butuc, M.C. Asymmetrical Rolling of Aluminum Alloys and Steels: A Review. Metals 2020, 10, 1126. [Google Scholar] [CrossRef] [Scilit]
- Uniwersał, A.; Wroński, M.; Wróbel, M.; Wierzbanowski, K.; Baczmański, A. Texture effects due to asymmetric rolling of polycrystalline copper. Acta Mater. 2017, 139, 30–38. [Google Scholar] [CrossRef] [Scilit]
- Byrska-Wójcik, D.; Ostachowska, M.; Gibek, J.; Wierzbanowski, K.; Wróbel, M.; Błoniarz, R.; Baczmański, A.; Kopyściański, M.; Kalemba-Rec, I. Effects of asymmetric rolling with tilted material entry on texture and mechanical properties of aluminium. J. Mater. Process. Technol. 2025, 338, 118796. [Google Scholar] [CrossRef] [Scilit]
- Solouki, H.; Jamaati, R.; Jamshidi Aval, H. Comparison of a copper processed by asymmetric unidirectional rolling (AUR) and cross rolling (ACR): Strain distribution, microstructure, texture, and mechanical properties. Mater. Chem. Phys. 2024, 311, 128558. [Google Scholar] [CrossRef] [Scilit]
- Ren, X.; Zhang, X.; Huang, Y.; Liu, Y.; Zhao, L.; Zhou, W. Evolution of shear texture during the asymmetric rolling and its annealing behavior in a twin-roll casting AA6016 sheet: An ex-situ electron backscatter diffraction study. J. Mater. Res. Technol. 2020, 9, 6420–6433. [Google Scholar] [CrossRef] [Scilit]
- Guo, B.; Gao, H.; Kong, C.; Wang, Z.; Cui, H.; Yu, H. Transverse texture weakening and anisotropy improvement of Ti-6Al-4V alloy sheet via asymmetric rolling and static recrystallization annealing. J. Alloys Compd. 2025, 1010, 177507. [Google Scholar] [CrossRef] [Scilit]
- Wronski, S.; Wrobel, M.; Baczmanski, A.; Wierzbanowski, K. Effects of cross-rolling on residual stress, texture and plastic anisotropy in f.c.c. and b.c.c. metals. Mater. Charact. 2013, 77, 116–126. [Google Scholar] [CrossRef] [Scilit]
- Zhang, J.Y.; Li, F.; Sun, L.; Niu, W.T.; Cao, M.Z. Texture traits and mechanical anisotropy of AZ31 magnesium alloy sheet by hard plate cross rolling. J. Magnes. Alloys 2025, 14, 101647. [Google Scholar] [CrossRef] [Scilit]
- Fan, H.; Liu, S.; Li, L.; Deng, C.; Liu, Q. Largely alleviating the orientation dependence by sequentially changing strain paths. Mater. Des. 2016, 97, 464–472. [Google Scholar] [CrossRef] [Scilit]
- Liu, Y.; Zhu, Q.; Yang, X.; Chen, J.; Qu, Y. Deformation mechanism of metastable oriented grains in high-purity tantalum under different strain paths. J. Mater. Res. Technol. 2024, 30, 5465–5473. [Google Scholar] [CrossRef] [Scilit]
- Deng, C.; Liu, S.F.; Ji, J.L.; Hao, X.B.; Zhang, Z.Q.; Liu, Q. Texture evolution of high purity tantalum under different rolling paths. J. Mater. Process. Technol. 2014, 214, 462–469. [Google Scholar] [CrossRef] [Scilit]
- Zhu, J.; Liu, S.; Yuan, X.; Liu, Q. Comparing the Through-Thickness Gradient of the Deformed and Recrystallized Microstructure in Tantalum with Unidirectional and Clock Rolling. Materials 2019, 12, 169. [Google Scholar] [CrossRef] [Scilit] [PubMed]
- Lin, N.; Liu, S.; Liu, Y.; Fan, H.; Zhu, J.; Deng, C.; Liu, Q. Effects of asymmetrical rolling on through-thickness microstructure and texture of body-centered cubic (BCC) tantalum. Int. J. Refract. Met. Hard Mater. 2019, 78, 51–60. [Google Scholar] [CrossRef] [Scilit]
- Long, D.; Liu, S.; Zhu, J.; Zhang, J.; Yuan, X. Texture and Microstructure Evolution of Ultra-High Purity Cu-0.1Al Alloy under Different Rolling Methods. Crystals 2021, 11, 1113. [Google Scholar] [CrossRef] [Scilit]
- Cabibbo, M.; Evangelista, E.; Scalabroni, C. EBSD FEG-SEM, TEM and XRD techniques applied to grain study of a commercially pure 1200 aluminum subjected to equal-channel angular-pressing. Micron 2005, 36, 401–414. [Google Scholar] [CrossRef] [Scilit] [PubMed]
- Qin, J.; Li, X.; Wang, D.; Zhou, C.; Hu, T.; Wang, J.; Yang, Y.; Hu, Y. Microstructure and Texture Evolution in Cold-Rolled and Annealed Oxygen-Free Copper Sheets. Materials 2024, 17, 2202. [Google Scholar] [CrossRef] [Scilit] [PubMed]
- Sidor, J.J. Quantitative Indicators of Microstructure and Texture Heterogeneity in Polycrystalline System. Materials 2024, 17, 6057. [Google Scholar] [CrossRef] [Scilit] [PubMed]
- Meng, T.; Gao, L.; Chen, J.; Wang, R.; Cai, Z. Microstructures and thermal conductivity anisotropy of hot-rolled Cu/Kovar composites sheet. J. Mater. Res. Technol. 2025, 35, 1741–1751. [Google Scholar] [CrossRef] [Scilit]
- Zhu, G.; Liu, Z.; Min, F.; Mei, D.; Wang, L.; Zhu, S.; Guan, S. The isotropic enhanced performance of magnesium thin sheet produced by cross-rolling. J. Alloys Compd. 2025, 1018, 179309. [Google Scholar] [CrossRef] [Scilit]
- He, S.; Yin, L.; Jiang, F.; Teng, J.; He, C.; Lu, H.; Kan, H.; Zeng, Z.; Xu, S. On the deformation mechanisms of Fe-18Mn-1.3Al-0.6C austenitic steel under unidirectional and cross rolling. Mater. Sci. Eng. A 2025, 941, 148611. [Google Scholar] [CrossRef] [Scilit]
Disclaimer/Publisher’s Note: The statements, opinions and data contained in all publications are solely those of the individual author(s) and contributor(s) and not of MDPI and/or the editor(s). MDPI and/or the editor(s) disclaim responsibility for any injury to people or property resulting from any ideas, methods, instructions or products referred to in the content. |
© 2026 by the authors. Licensee MDPI, Basel, Switzerland. This article is an open access article distributed under the terms and conditions of the Creative Commons Attribution (CC BY) license.