


Abstract
To investigate the effects of trace phosphorus (P) addition on the solidification behavior, microstructure, and local mechanical response of β-Sn alloys, Sn–P alloys containing 0.02, 0.05, and 0.08 wt.% P were prepared. Phase constitution, solidification characteristics, and nanomechanical properties were characterized by X-ray diffraction, thermogravimetry–differential scanning calorimetry, and nanoindentation, respectively. Electron backscatter diffraction was additionally conducted on representative pure Sn and Sn–P0.08 samples to qualitatively compare the endpoint microstructures. All alloys were primarily composed of β-Sn, while localized P-rich secondary regions in Sn–P0.08 were indexed as Sn4P3. Trace P promoted heterogeneous nucleation and markedly modified solidification, increasing the solidification peak temperature by approximately 20–22 °C and reducing the undercooling from 39.83 °C to 17.50–20.33 °C. Relative to pure Sn, Sn–P0.08 exhibited more grain regions and grain boundaries, together with pronounced dendritic and locally refined features, indicating modified β-Sn nucleation and growth. Young’s modulus and hardness of Sn–P0.08 reached 29.86 GPa and 0.232 GPa, respectively. Inverse nanoindentation analysis revealed increased representative stress, strain-hardening exponent, and strength coefficient. Fracture-energy analysis showed superior crack-growth energy dissipation for Sn–P0.02, whereas Sn–P0.08 exhibited greater resistance to plastic deformation.
1. Introduction
Metallic tin is widely used in electronic packaging, protective surface coatings, low-melting-point joining materials, and metal–metal interfacial bonding because of its low melting point, good wettability, high electrical conductivity, and good processability [1,2,3,4,5]. At room temperature, tin mainly exists as β-Sn with a tetragonal crystal structure. β-Sn is the primary constituent phase in Sn-based electronic solders and Sn alloys, and its grain size, crystallographic orientation, and grain-boundary structure strongly affect the mechanical response, thermomechanical deformation behavior, and service reliability of these materials. Shen and Wu [6] reported that the grain orientation of β-Sn in Sn-rich solder joints affects electromigration, thermomigration, and thermomechanical fatigue reliability through anisotropic diffusion, mechanical properties, and thermal expansion behavior. Bieler et al. [7] found that Sn grain size and orientation markedly influence the thermomechanical response and reliability of solder joints. Kariya et al. [8] showed, using β-Sn single crystals and micro-joint structures, that the static mechanical properties and fatigue behavior of β-Sn exhibit significant crystallographic orientation dependence. From the perspective of solidification, Gourlay et al. [9] further reported that the formation of β-Sn grain structure and orientation is closely related to nucleation, undercooling, and competitive grain growth during the solidification of Sn-based solders. Therefore, the microstructure and crystallographic orientation of β-Sn not only determine the initial mechanical properties of Sn-based materials but also influence their deformation and failure behavior during service.
Microalloying is an effective strategy for tailoring the grain structure and mechanical properties of β-Sn. Ma et al. [10] investigated the effect of Co microalloying on the solidification behavior of Sn–3Ag–0.5Cu solder and found that Co addition promoted β-Sn nucleation and significantly refined Sn-based solder grains, indicating that trace elements can influence β-Sn grain growth by modifying nucleation conditions. Cheng et al. [11] studied the effects of minor Ni and Co additions on the microstructure and mechanical properties of Sn–Ag–Cu solders and reported that these alloying elements changed the morphology of intermetallic compounds, grain size, and mechanical response of the solders. Lee et al. [12] investigated the effect of Sb addition on the microstructure and shear strength of Sn–Ag solder joints and found that Sb participated in second-phase formation, thereby suppressing Ag3Sn coarsening and improving the mechanical properties of the solder joints. In addition to grain size and second-phase morphology, the characteristic length scale of dendritic structures is another important microstructural parameter governing the mechanical properties of Sn-based alloys. Silva et al. [13] established a correlation between the dendritic scale, Ag3Sn spacing, and hardness of Sn–2Ag–0.7Cu solder. Zhang et al. [14] further demonstrated that variations in dendritic morphology and second-phase distribution induced by directional solidification significantly affected the mechanical response of Sn–6.5Zn–Cu solder alloys. These findings indicate that microalloying and solidification-process control can improve the microstructure and mechanical properties of Sn-based materials by modifying β-Sn nucleation and grain growth, refining the dendritic scale, and regulating the morphology and distribution of second phases or intermetallic compounds.
As a relatively active trace element, phosphorus (P) has also been reported to affect Sn-based alloys. Xian and Gong [15] studied the oxidation behavior of molten Sn with P addition and found that trace P significantly reduced the surface oxidation of molten Sn by forming a composite protective film consisting of SnO2, (Sn, P)O, and a transition layer. Subsequently, they investigated the surface oxidation behavior of Sn–0.07 wt.% P in air and reported that the P content in the oxide film increased at relatively high P levels, accompanied by possible Sn–P-related chemical states [16]. Körmendy et al. [17] studied Sn–P alloy formation and dross behavior on Sn-based melt surfaces, suggesting that P addition can reduce surface oxidation and dross formation. Nogita et al. [18] reported that a significant volume fraction of primary Sn dendrites formed in Sn-0.7Cu-0.05Ni-xP solder alloys when the P content exceeded approximately 0.01 mass%. These findings indicate that, in Sn-based systems, P not only improves melt-surface stability and modifies the composition of the surface oxide film but may also influence the formation of P-containing phases, the solidification pathway, and dendritic morphology.
However, studies on the effect of P addition on the grain-growth behavior and mechanical properties of the β-Sn matrix remain limited. In particular, whether low P addition can modify the undercooling, grain size, crystallographic orientation, and mechanical response of β-Sn still requires systematic investigation.
In this study, Sn–P alloys with different P contents of 0.02 wt.%, 0.05 wt.%, and 0.08 wt.% were prepared by a secondary alloying method, with pure Sn used as the reference sample, to investigate the effect of trace P addition on the grain-growth behavior and mechanical properties of Sn-based alloys.
2. Materials and Methods
2.1. Preparation of Sn–P Alloys
Sn–P alloys with different P contents were prepared by a secondary alloying method. Pure Sn with a purity of 99.99% and a Sn–P master alloy containing 94.2 wt.% Sn and 5.8 wt.% P were used as raw materials. During melting, a KCl–LiCl composite molten salt was used as a covering agent. The mass ratio of KCl to anhydrous LiCl was 1:1.3, and the actual additions were 8.0 g and 10.4 g, respectively. The KCl and anhydrous LiCl were first thoroughly mixed, placed in a crucible, and preheated at 440 °C for 30 min to fully melt the composite salt and form a protective covering layer. Subsequently, high-purity Sn and the corresponding amount of Sn–P master alloy were added and melted at 440 °C. After complete melting, the melt was stirred with a clean stainless-steel rod to promote the uniform distribution of P in the Sn-based melt. The melt was then held at 440 °C for 90 min and stirred every 30 min to further improve compositional homogeneity. After melting, the alloy was removed from the furnace and air-cooled to room temperature to obtain Sn–P alloy ingots.
The cooled alloy samples were ultrasonically cleaned with deionized water to remove residual solid salt from the surface. The cleaned alloys were then remelted on a heating stage and cast into bulk samples with dimensions of approximately 15 mm × 15 mm using a graphite mold. Finally, the required specimens were cut along the centerline of the bulk samples by wire cutting, followed by grinding and polishing of the test surfaces. By diluting the Sn–P master alloy with high-purity Sn, Sn–P alloys with P contents of 0.02 wt.%, 0.05 wt.%, and 0.08 wt.% were obtained and denoted as Sn–P0.02, Sn–P0.05, and Sn–P0.08, respectively. Pure Sn was used as the reference sample.
2.2. Testing and Characterization Methods
X-ray diffraction (XRD; Ultima IV, Rigaku, Tokyo, Japan) was used to analyze the phase constitution of pure Sn and Sn–P alloys, in order to determine whether trace P addition caused changes in the phase composition or crystal structure of the Sn matrix. Simultaneous thermogravimetry–differential scanning calorimetry (TG–DSC; STA 449 F3, NETZSCH, Selb, Germany) was used to investigate the thermal stability and melting–solidification behavior of pure Sn and Sn–P alloys during a heating–cooling cycle up to 400 °C. DSC measurements were conducted under an air atmosphere at a heating rate of 10 °C min−1, followed by cooling at a rate of 10 °C min−1. The DSC heat-flow curves were used to analyze the melting endothermic peaks during heating and the solidification exothermic peaks during cooling, thereby evaluating the effect of trace P addition on the crystallization behavior of β-Sn [19].
Electron backscatter diffraction (EBSD; GeminiSEM 300, ZEISS, Oberkochen, Germany; Symmetry S, Oxford Instruments, Bucks, UK) was used to characterize the microstructure of pure Sn and Sn–P0.08. Before EBSD analysis, the samples were sequentially ground using 240, 400, 600, 800, 1000, 1500, 2000, 3000, and 5000 grit SiC papers, followed by polishing with 3 and 1 μm diamond suspensions. Final Ar-ion polishing was performed for 1 h at an accelerating voltage of 5 kV and an ion-beam incidence angle of 60° to minimize surface deformation introduced during mechanical preparation. During the EBSD examination, several candidate regions on each sample surface were initially surveyed, after which one representative large area was selected from each composition for complete EBSD mapping. The preliminary field of view for pure Sn was dominated by coarse β-Sn orientation domains, making local orientation variations and grain-boundary features difficult to distinguish. Therefore, a relatively small step size of 3 μm was used to examine possible local orientation variations and boundary features within the coarse β-Sn grains in greater detail. For Sn–P0.08, more apparent dendritic or banded microstructural features were already observed during the preliminary examination. Therefore, a step size of 7 μm was used to examine the overall morphology and orientation distribution over a large area of approximately 3.14 × 2.35 mm2. Pole figures of the main β-Sn crystal planes were used to analyze changes in crystallographic orientation distribution. Inverse pole figure (IPF) maps were used to observe grain morphology and orientation differences [20]. Kernel average misorientation and grain boundary (KAM and GB) maps were used to analyze local misorientation and grain-boundary distribution. Combined with grain-size statistics, these results were used to evaluate the effect of trace P addition on β-Sn grain refinement. In addition, the P elemental distribution in the Sn–P0.08 alloy was analyzed to further discuss the relationship between P addition, microstructure evolution, and mechanical properties.
Nanoindentation tests were performed at room temperature using a NanoTest Vantage nanoindenter (Micro Materials, Wrexham, UK). A constant strain-rate method was adopted, with a loading strain rate of 0.05 s−1 and a maximum indentation depth of 2000 nm. Poisson’s ratio was set to 0.34. After reaching the maximum indentation depth, a holding time of 5 s was applied to reduce the influence of material creep on unloading-curve analysis. The spacing between adjacent indents was maintained at 25 μm to avoid interactions between the plastic deformation zones of neighboring indents. Based on the numerical fitting of the Berkovich indenter geometry, the equivalent half-angle of the Berkovich indenter was determined to be 65.27° [21,22,23].
3. Results and Discussion
3.1. XRD Phase Analysis
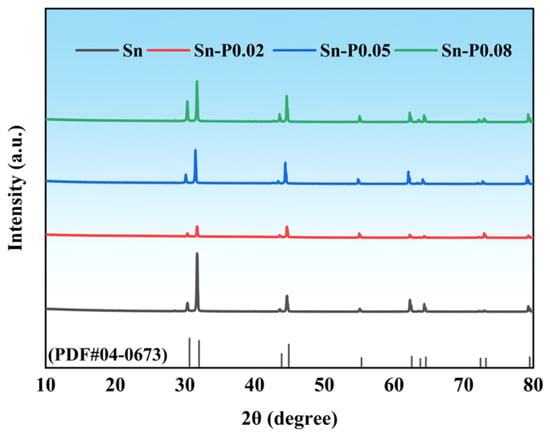
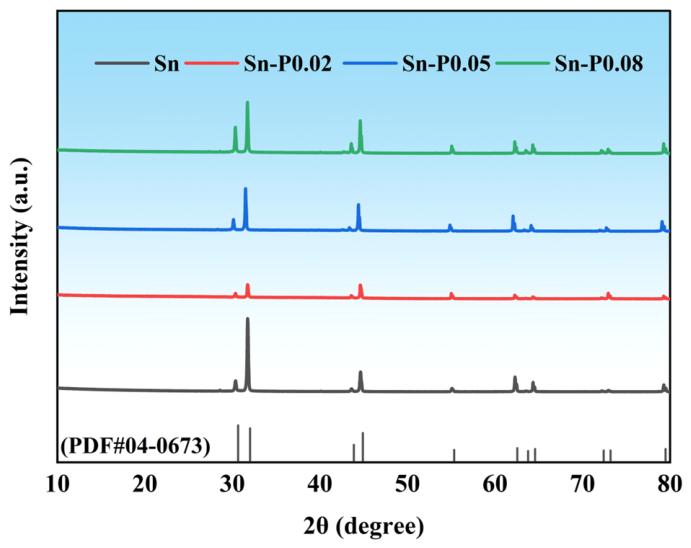
As shown in Figure 1, all detectable diffraction peaks of pure Sn and the Sn–P alloys can be indexed to the β-Sn phase (ICDD PDF No. 04-0673). The diffraction peaks located at approximately 2θ = 30.6°, 32.0°, 43.8°, 44.8°, 55.3°, 62.4°, 63.7°, 64.5°, 72.3°, 73.1°, and 79.4° are assigned to the (200), (101), (220), (211), (301), (112), (400), (321), (420), (411), and (312) crystallographic planes, respectively. β-Sn crystallizes in a body-centered tetragonal structure with the space group I41/amd (No. 141) and representative lattice parameters of a = b ≈ 5.84 Å and c ≈ 3.19 Å. No discernible systematic peak shifts or additional diffraction peaks were observed after P addition, indicating that the β-Sn matrix structure was retained and that no secondary crystalline phase was detected within the detection limit of XRD.
Figure 1.
XRD patterns of pure Sn and Sn–P alloys with different P contents.
3.2. Undercooling Analysis
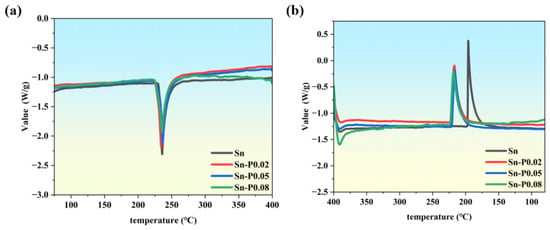
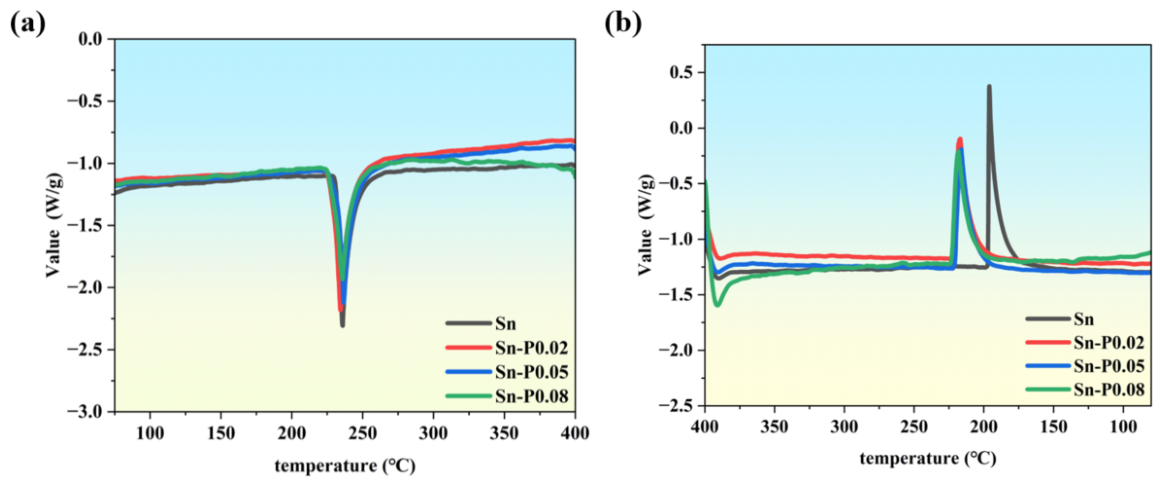
Figure 2 shows the DSC curves of pure Sn and Sn–P alloys with different P contents, where Figure 2a corresponds to the heating process and Figure 2b corresponds to the cooling process. As shown in Figure 2a, all samples exhibit obvious endothermic peaks in the range of 234.33–236.50 °C, corresponding to the melting process of β-Sn. The melting peak temperatures of pure Sn, Sn–P0.02, Sn–P0.05, and Sn–P0.08 are 235.83 °C, 234.33 °C, 236.50 °C, and 235.67 °C, respectively. The small difference in melting peak temperature indicates that trace P addition does not significantly change the main melting behavior of the Sn matrix.
Figure 2.
DSC heat-flow curves of Sn and Sn–P alloys during heating and cooling cycles up to 400 °C: (a) heating process; (b) cooling process.
From the shape of the endothermic peaks during heating, the peak intensity of the P-added samples is generally lower than that of pure Sn, and the peaks are slightly broadened. This suggests that P addition changes the local microstructural state of the alloys, causing the thermal response during melting to change from a relatively concentrated endothermic behavior in pure Sn to a more dispersed endothermic process. Among them, the Sn–P0.08 sample shows a more obvious increase in peak width, indicating that the internal microstructural heterogeneity becomes more pronounced at higher P content. This may be related to the formation of dendritic microstructures and Sn–P-related second-phase features.
Compared with the heating process, the change in solidification behavior during cooling is more significant. The solidification exothermic peak of pure Sn appears at 196.00 °C, whereas those of Sn–P0.02, Sn–P0.05, and Sn–P0.08 appear at 216.83 °C, 216.17 °C, and 218.17 °C, respectively, which are approximately 20–22 °C higher than that of pure Sn. Based on the difference between the melting peak temperature and the solidification peak temperature, the undercooling of pure Sn is calculated to be 39.83 °C, while those of Sn–P0.02, Sn–P0.05, and Sn–P0.08 decrease to 17.50 °C, 20.33 °C, and 17.50 °C, respectively. This indicates that trace P addition substantially reduces the undercooling of Sn-based alloys, allowing solidification to occur at a higher temperature.
According to the binary Sn–P phase diagram, the equilibrium liquidus temperature in the Sn-rich region increases with increasing P content. Therefore, the upward shift in the DSC solidification peak may reflect the combined effects of the equilibrium liquidus shift and reduced kinetic undercooling. However, the nominal P contents investigated in this study were only 0.02–0.08 wt.%, corresponding to a relatively small compositional variation at the Sn-rich end of the phase diagram. Moreover, the melting peak temperatures varied only from 234.33 to 236.50 °C, giving a total variation of 2.17 °C, which was substantially smaller than the approximately 20–22 °C increase in the solidification peak temperature. These results suggest that the equilibrium liquidus shift may contribute to the increase in solidification temperature but cannot fully account for the observed change. A reduction in kinetic undercooling and possible changes in nucleation behavior may therefore also play important roles [24].
Further comparison of the exothermic peak shapes shows that pure Sn has a relatively sharp solidification peak, indicating rapid crystallization after pronounced undercooling during cooling. In contrast, the Sn–P alloys exhibit lower peak intensity and broader peak shapes, suggesting that the solidification heat release changes from a concentrated and rapid process to a more dispersed and gradual process. Trace P may provide potential heterogeneous nucleation sites for β-Sn solidification through the formation of fine Sn–P-related second-phase features, thereby promoting nucleation, reducing undercooling, and suppressing the growth of coarse grains. This change in solidification behavior provides a basis for the subsequent refinement of β-Sn grains and the evolution of dendritic microstructures.
3.3. EBSD Analysis
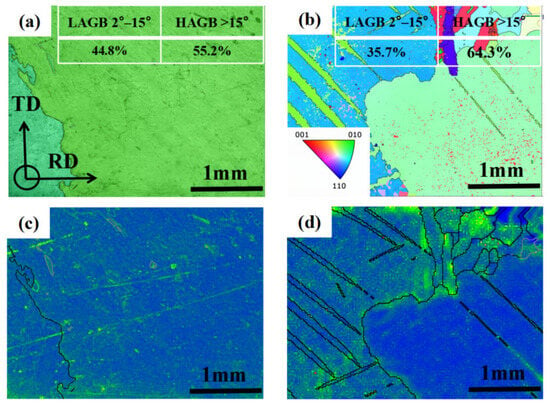
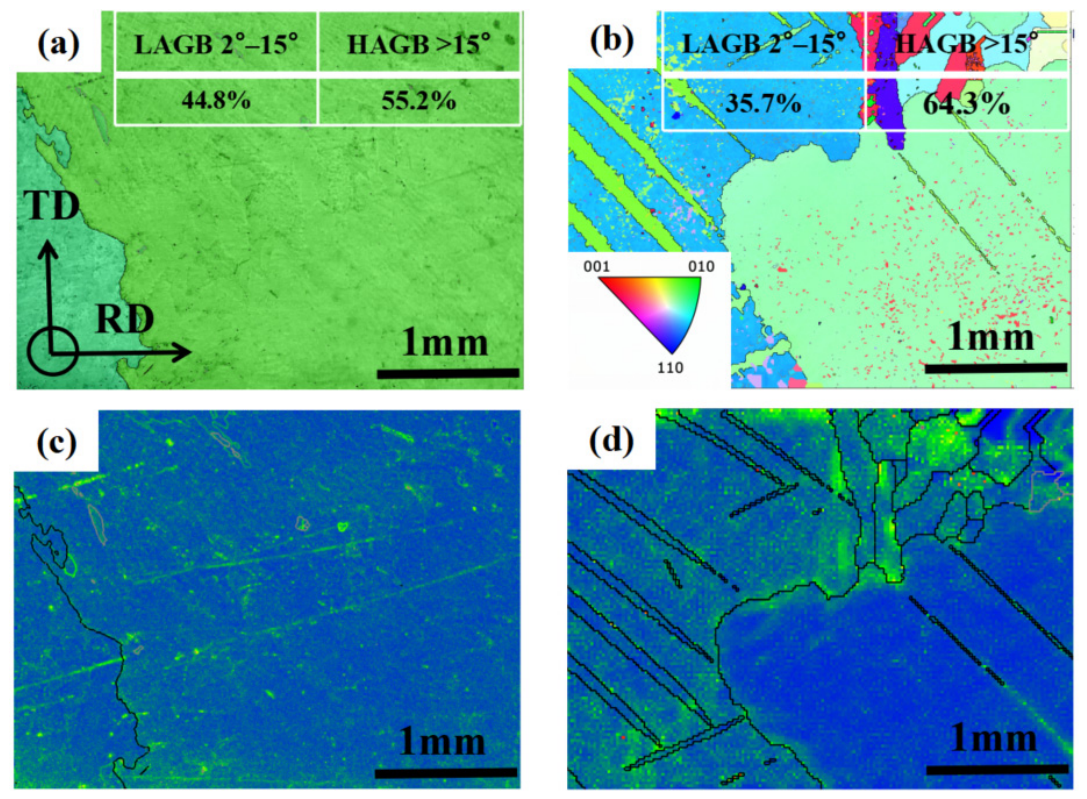
To qualitatively examine the representative microstructural differences between the two endpoint compositions, EBSD analysis was performed on pure Sn and Sn–P0.08. The EBSD maps were used to compare the local crystallographic orientation, KAM distribution characteristics, grain-boundary configuration, and reconstructed orientation-domain morphology within the selected regions, as shown in Figure 3. Figure 3a,b show the IPF orientation maps and grain-boundary misorientation statistics of pure Sn and the Sn–P0.08 alloy. The pure Sn sample exhibits coarse β-Sn grains with a relatively small number of grain boundaries, indicating that grain growth during solidification is dominated by large β-Sn grains with a certain degree of preferential orientation. In contrast, the Sn–P0.08 alloy shows a markedly increased number of grain regions and grain boundaries, together with dendritic microstructural features. This indicates that trace P addition changes the solidification growth behavior of β-Sn and promotes microstructural refinement and dendritic growth [18].
Figure 3.
EBSD orientation maps and KAM distributions: (a) IPF orientation map of pure Sn; (b) IPF orientation map of the Sn–P0.08 alloy; (c) KAM + GB map of pure Sn; (d) KAM + GB map of the Sn–P0.08 alloy.
The grain-boundary misorientation statistics further show that the fraction of low-angle grain boundaries (LAGBs) decreases from 44.8% in pure Sn to 35.7% in the Sn–P0.08 alloy, whereas the fraction of high-angle grain boundaries (HAGBs) increases from 55.2% to 64.3%. This result suggests that P addition promotes a shift in the grain-boundary misorientation distribution toward high-angle boundaries and reduces the fraction of low-angle substructures. Combined with the increased grain number and grain-boundary density observed in the IPF maps, these results demonstrate that trace P addition effectively refines β-Sn grains. The increase in grain-boundary density and HAGB fraction may enhance the barrier effect of grain boundaries on dislocation motion, thereby providing a microstructural basis for the improved local mechanical response of the Sn–P alloy.
The KAM maps shown in Figure 3c,d reveal that both samples are dominated by blue and blue-green regions with low KAM values, indicating that the overall local misorientation within the grains is relatively low. In pure Sn, local bright-green regions are mainly distributed in a band-like manner, suggesting the presence of orientation gradients and local strain concentration within coarse grains. In the Sn–P0.08 alloy, the grain-boundary network becomes more distinct, and relatively high KAM regions are mainly distributed near grain boundaries and band-like microstructural features. This indicates that, after P addition, the increased grain-boundary density causes local misorientation to become more concentrated at grain boundaries and microstructural transition regions.
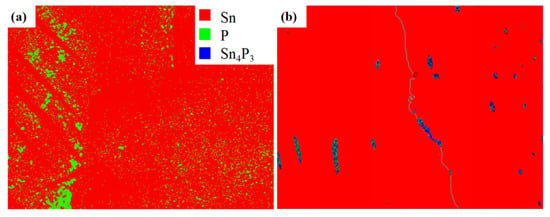
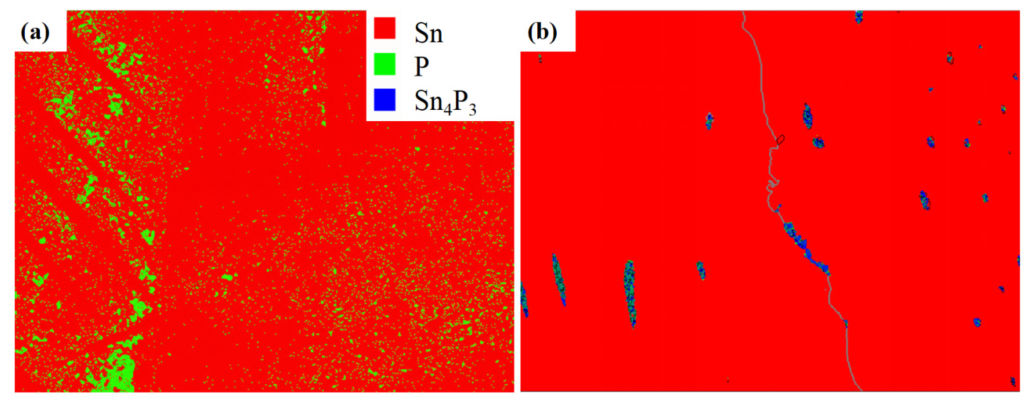
To improve the reliability of identifying trace P-containing phases, a large-area EBSD phase scan was first performed on the Sn–P0.08 alloy at a relatively low magnification to locate regions with concentrated P-associated signals. A representative local region was subsequently selected for further high-resolution phase indexing at 5000×, as shown in Figure 4. Figure 4a presents the low-magnification phase map obtained at 50×. The analyzed area is predominantly composed of the β-Sn matrix, shown in red. The green-indexed regions exhibit a distinctly heterogeneous distribution and appear mainly as localized bands, clusters, and dispersed points, suggesting that the P-associated regions preferentially occur in interdendritic or locally segregated areas. It should be noted that the nominal P content of the alloy is only 0.08 wt.%. Therefore, some isolated green pixels in the low-magnification map may also be affected by spatial resolution, pattern quality, and automatic indexing errors. Accordingly, this result was primarily used to locate potential P-rich regions rather than to quantitatively determine the content or area fraction of elemental P.
Figure 4.
EBSD phase-indexing maps of the Sn–P0.08 alloy at different magnifications: (a) low-magnification overview at 50×; (b) representative high-magnification region at 5000×.
Figure 4b shows the local phase-indexing result obtained at 5000×. The selected region remains predominantly composed of β-Sn, whereas a small number of blue-indexed regions appear as isolated particles, short elongated features, or locally distributed features along linear boundaries and are indexed as Sn4P3. Compared with the extensively dispersed P-associated indexing points in the low-magnification map, the Sn4P3-indexed regions in the high-magnification map exhibit more continuous morphologies and clearer localized aggregation, indicating that these regions are more likely to correspond to an actual secondary phase. Because the equilibrium solubility of P in β-Sn is extremely limited, P rejected from the growing β-Sn phase during solidification may gradually accumulate at grain boundaries or within interdendritic regions, thereby providing favorable local compositional conditions for the enrichment and formation of Sn–P phosphides. Therefore, considering both the thermodynamic tendency of the Sn–P system and the high-magnification EBSD phase-indexing results, these localized secondary-phase features can be identified as an Sn4P3-type phase [24].
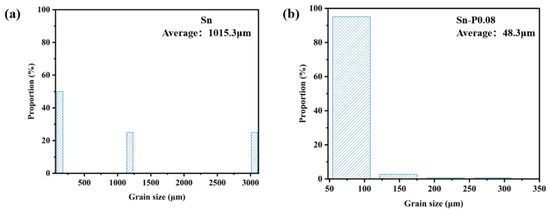
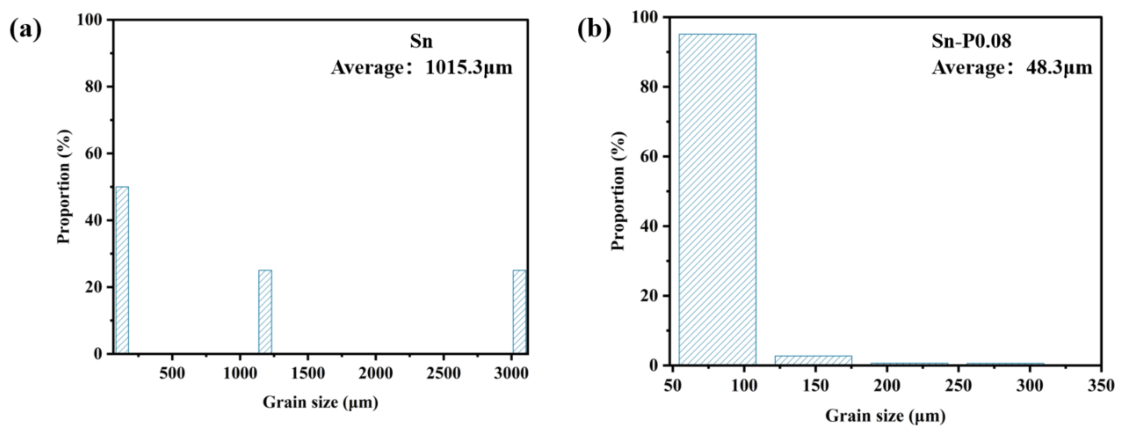
Figure 5 presents the grain-size distributions of pure Sn and the Sn–P0.08 alloy within the selected EBSD regions. For pure Sn, only three valid grains were identified and included in the statistical analysis, giving an average grain size of 1015.3 μm. This result indicates that the scanned region was dominated by a limited number of coarse β-Sn grains, which may be associated with a low density of effective nuclei and the subsequent rapid growth of selected grains during solidification. In contrast, 568 grains were identified in the Sn–P0.08 alloy, with an average grain size of 48.3 μm. Most of these grains were distributed within the range of 50–100 μm, indicating a substantial increase in the number of fine orientation domains and grain boundaries within the selected region after the addition of 0.08 wt.% P.
Figure 5.
EBSD grain-size distributions of pure Sn and the Sn–P0.08 alloy: (a) pure Sn; (b) Sn–P0.08.
Nevertheless, the reduction in the reconstructed grain size does not imply that the entire coarse β-Sn matrix was completely transformed into uniformly fine equiaxed grains. Because the equilibrium solubility of P in β-Sn is extremely limited, P rejected from the growing β-Sn phase during solidification may accumulate in the remaining liquid or interdendritic regions, thereby promoting the formation of fine Sn4P3-type particles. These particles may provide favorable sites for heterogeneous nucleation and restrict the continued growth of β-Sn, thus facilitating dendrite formation, branching, and local microstructural refinement. Consequently, the Sn–P0.08 alloy may retain an overall coarse β-Sn crystallographic framework while containing a greater number of fine dendritic features and locally refined orientation domains. The decrease in the statistically determined grain size may therefore reflect the combined effects of β-Sn grain refinement, dendritic branching, and local orientation subdivision. According to the Hall–Petch relationship, a reduction in grain or orientation-domain size increases the density of grain boundaries, thereby impeding dislocation motion and constraining the expansion of the indentation-induced plastic zone, which contributes to the enhanced hardness and resistance to plastic deformation of the alloy [25,26,27].
3.4. Nanoindentation Mechanical Analysis
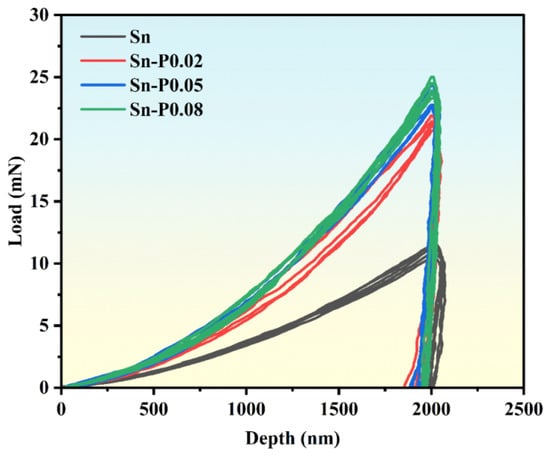
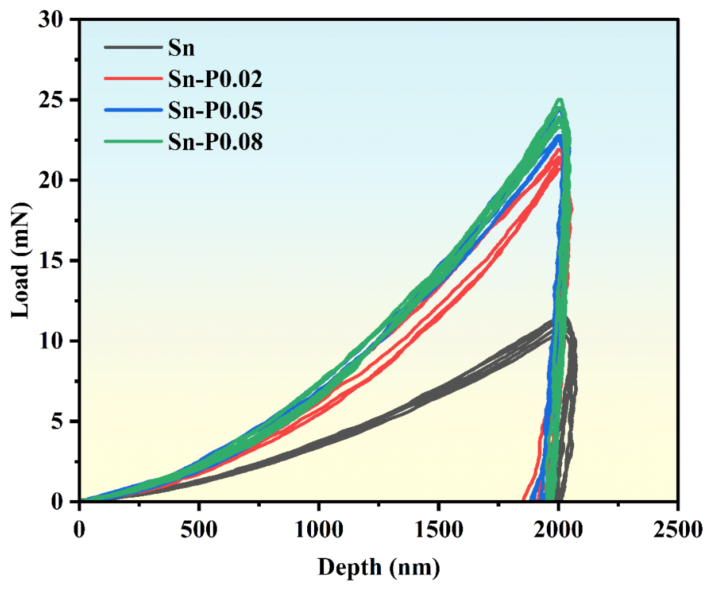
Figure 6 presents the representative nanoindentation load–displacement curves of pure Sn and the Sn–P alloys, whereas Table 1 summarizes the corresponding load–depth parameters, including , , , and . Five independent indentations were performed for each composition, and the quantitative results are expressed as mean ± standard deviation. The target maximum indentation depth was set to approximately 2000 nm. Owing to additional penetration during the 5 s holding stage, the recorded values ranged from 2034.31 to 2063.83 nm. Pure Sn exhibited an average of 11.082 ± 0.414 mN, indicating relatively low resistance to local indentation deformation. After trace P addition, the load–displacement curves shifted markedly upward, and the average values of Sn–P0.02, Sn–P0.05, and Sn–P0.08 increased to 21.275 ± 0.457, 23.213 ± 0.787, and 23.837 ± 0.450 mN, respectively. These values were approximately 92.0%, 109.5%, and 115.1% higher than that of pure Sn, corresponding to approximately 1.92, 2.09, and 2.15 times the pure-Sn value, respectively. Therefore, a higher load was required for the Sn–P alloys to reach a comparable indentation depth, indicating that trace P addition enhanced their local resistance to indentation deformation. Among the investigated compositions, Sn–P0.08 exhibited the highest and thus the strongest local indentation resistance. These results describe the local nanoindentation response and should not be directly interpreted as bulk mechanical strength [21,22,23].
Figure 6.
Nanoindentation load–displacement curves.
Table 1.
Nanoindentation load–depth parameters of pure Sn and Sn–P alloys.
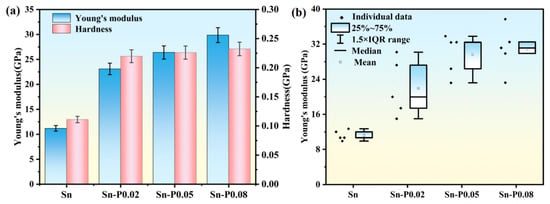
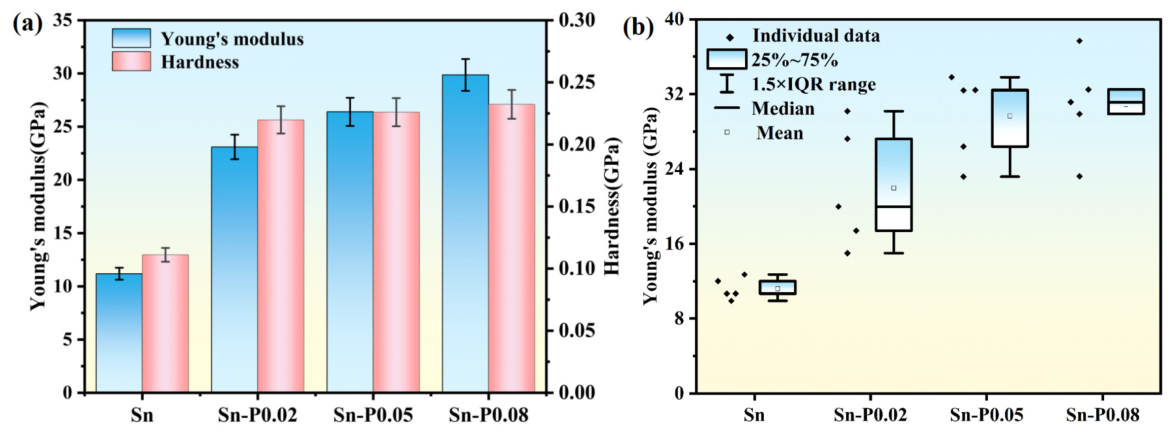
Figure 7 presents the nanoindentation mechanical properties of pure Sn and the Sn–P alloys with different P contents. As shown in Figure 7a, pure Sn exhibits an average indentation Young’s modulus of 11.19 GPa and an average hardness of 0.111 GPa. It should be noted that the elastic modulus measured for Sn-based materials may vary considerably depending on the testing method, strain rate, microstructural state, and time-dependent deformation behavior [28]. Moreover, β-Sn exhibits pronounced crystallographic anisotropy, and differences in grain orientation can lead to substantial variations in the local elastic response measured by nanoindentation [29].
Figure 7.
Nanoindentation mechanical properties of pure Sn and Sn–P alloys with different P contents: (a) Young’s modulus and hardness; (b) box plot of Young’s modulus.
After trace P addition, the measured indentation Young’s modulus increases markedly. The average values of Sn–P0.02, Sn–P0.05, and Sn–P0.08 are 23.10, 26.40, and 29.86 GPa, respectively, corresponding to increases of approximately 106.4%, 135.9%, and 166.8% relative to pure Sn. These values are approximately 2.06, 2.36, and 2.67 times that of pure Sn, respectively. The results indicate that the P-containing samples exhibit a higher local elastic response along the nanoindentation loading direction. However, owing to the strong crystallographic anisotropy of β-Sn, the measured variation should not be attributed solely to an intrinsic composition-induced increase in Young’s modulus; differences in local crystallographic orientation and microstructural state may also contribute.
A similar increase is observed in indentation hardness. Pure Sn exhibits an average hardness of 0.111 GPa, whereas the values of Sn–P0.02, Sn–P0.05, and Sn–P0.08 increase to 0.220, 0.226, and 0.232 GPa, respectively. These values are approximately 1.98, 2.04, and 2.09 times that of pure Sn, corresponding to increases of approximately 98.2%, 103.6%, and 109.0%, respectively. Because indentation hardness reflects the resistance of a material to localized plastic deformation beneath the indenter, these results indicate that trace P addition enhances the local indentation resistance of the Sn–P alloys.
In terms of the compositional trend, the most pronounced changes in both indentation modulus and hardness occur between pure Sn and Sn–P0.02. With further increases in P content, the indentation modulus increases more gradually from 23.10 GPa for Sn–P0.02 to 26.40 GPa for Sn–P0.05 and 29.86 GPa for Sn–P0.08. The increase from Sn–P0.05 to Sn–P0.08 is approximately 13.1%, whereas the hardness values of the three P-containing alloys differ only slightly. This nonlinear variation indicates that the local mechanical response does not increase in direct proportion to the nominal P content. It may instead be associated with the combined evolution of crystallographic orientation, grain-boundary configuration, dendrite-like morphology, local microstructural subdivision, and possible P-rich regions. However, because equivalent microstructural datasets were not obtained for all compositions, this correlation remains qualitative and does not establish a direct causal relationship.
Combined with the EBSD and elemental distribution results, the improvement in mechanical properties can be mainly attributed to the refinement of β-Sn grains, the increase in grain-boundary density, and the formation of fine Sn–P-related second-phase features, possibly associated with Sn4P3. Grain refinement increases the number of grain boundaries, thereby enhancing the barrier effect of grain boundaries on dislocation motion. Meanwhile, fine Sn–P-related second-phase features distributed in the β-Sn matrix, near grain boundaries, or in interdendritic regions may hinder dislocation slip and the expansion of the indentation-induced plastic zone during nanoindentation, resulting in a second-phase dispersion-strengthening effect [30].
The box plot in Figure 7b shows that Young’s modulus distribution of pure Sn is relatively concentrated and located in a lower range, whereas the modulus distribution of the Sn–P alloys shifts upward overall, indicating that Young’s modulus at different indentation points is generally improved after trace P addition. Combined with the EBSD results, pure Sn contains coarse grains, and the indentation points are more likely to be located within the same coarse grain or similar microstructural region; therefore, the modulus distribution is relatively concentrated. In contrast, the Sn–P alloys exhibit refined grains and increased grain-boundary density. In addition, local microstructural differences related to P addition may cause different indentation points to be more strongly affected by grains, grain boundaries, and local structural heterogeneity, resulting in a relatively broader modulus distribution.
3.5. Constitutive Inversion Based on Nanoindentation
To further determine the equivalent elastoplastic constitutive behavior of the materials during indentation, the single Berkovich indentation inverse analysis method proposed by Ogasawara et al. was adopted. This method was combined with the strain-rate correction approach used by Long et al. for solder and sintered-metal systems to calculate the constitutive parameters of pure Sn and Sn–P alloys [31,32,33,34,35,36,37].
In the plastic deformation stage, the stress–strain relationship of β-Sn can be described by a power-law hardening model as follows:
where σ is stress, ε is strain, R is the strength coefficient, and n is the strain-hardening exponent. The value of n reflects the work-hardening ability of the material during plastic deformation.
To describe the equivalent plastic response under the complex triaxial constraint beneath the indenter, the representative stress σR and representative strain εR are introduced. Their relationship with the power-law hardening model is:
For a Berkovich indenter, the representative strain εR can be determined from the indenter geometry, while the representative stress σR can be obtained from the dimensionless indentation-work relationship during the loading stage.
The indentation work Wt during loading represents the deformation work absorbed or dissipated by the material as the indenter moves from initial contact to the maximum indentation depth δmax and is expressed as:
where P(δ) is the load corresponding to the indentation depth δ. For the same maximum indentation depth, a larger Wt indicates that more energy is required for the material to reach the same indentation depth, and thus the material has stronger resistance to indentation deformation. The initial slope of the unloading stage can be used to characterize the contact stiffness S, which is defined as:
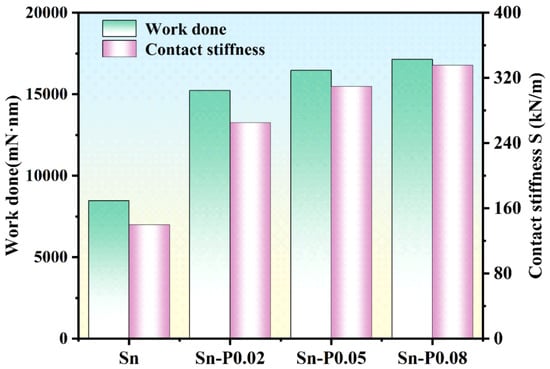
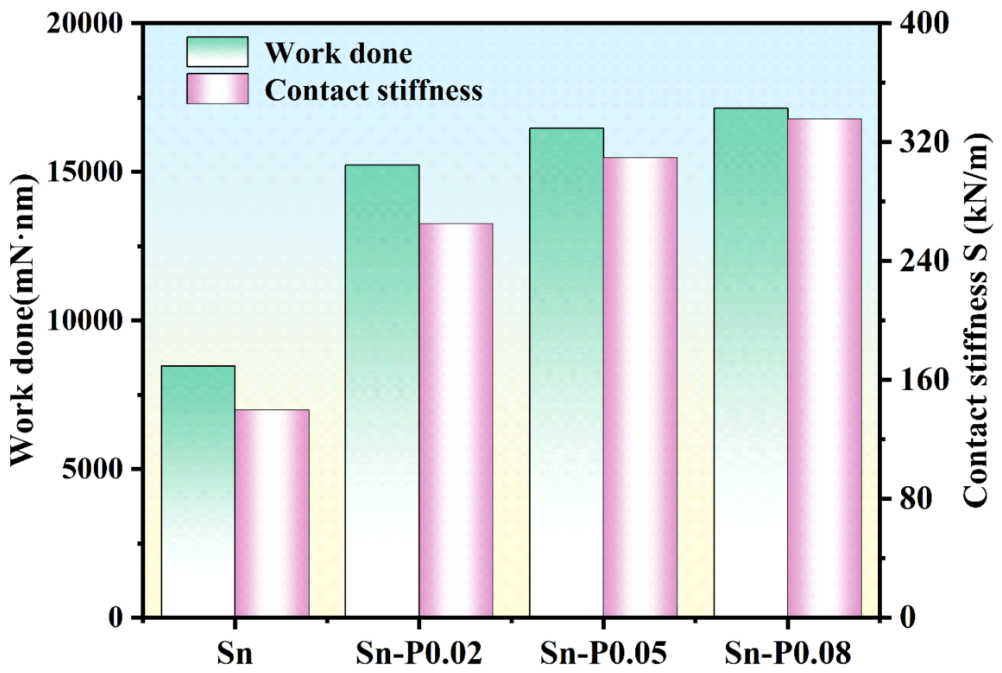
Figure 8 shows the loading work and contact stiffness of pure Sn and Sn–P alloys with different P contents. After trace P addition, both parameters are significantly higher than those of pure Sn, indicating that the Sn–P alloys consume more deformation work during indentation and exhibit higher contact stiffness at the initial unloading stage. This indicates that trace P addition improves the equivalent load-bearing capacity and elastic recovery ability of β-Sn.
Figure 8.
Variation in indentation work and contact stiffness of pure Sn and Sn–P alloys.
After Wt and S are obtained, the representative stress σR and strain-hardening exponent n are further solved using dimensionless relationships. Based on the self-similar characteristics of the Berkovich indenter, the dimensionless indentation work during loading satisfies the following relationship with representative stress:
where ψR is the strain-rate correction factor for the representative stress, and ξ is a dimensionless variable. Equation (5) establishes the relationship between the experimental indentation work and the representative stress, and can therefore be used to determine σR for different samples.
The representative strain εR is determined by the geometrical relationship of the Berkovich indenter and can be expressed as follows:
where α is the equivalent half-angle of the Berkovich indenter, taken as 65.27° in this study. The dimensionless variable ξ can be calculated from the plane-strain modulus Ē, representative stress, and strain-rate correction factor ψR:
where the plane-strain modulus is calculated from Young’s modulus E and Poisson’s ratio νs of the sample:
Because the material under the indenter is subjected to a complex triaxial constrained stress state during nanoindentation, use of the plane-strain modulus can more reasonably describe the elastic response of the indentation region.
It should be noted that the material investigated in this study is β-Sn. For the selection of strain-rate correction factors, the parameters calibrated by Long et al. based on nanoindentation and uniaxial tensile experiments of SAC305 solder were preferentially adopted, namely ψR = 0.52 and ψn = 0.10 [33]. Here, ψR is used to correct the representative stress σR, and ψn is used to correct the strain-hardening exponent n. These strain-rate correction factors were not directly measured in this study, but were referenced from the calibration results of the Sn-based lead-free solder SAC305 to approximately correct the strain-rate difference between nanoindentation and uniaxial loading conditions.
After determining the representative stress σR, the strain-hardening exponent n is further solved from the dimensionless contact-stiffness relationship during unloading. The normalized contact stiffness and the dimensionless variable ξ satisfy the following relationship:
where S is the initial unloading contact stiffness, and (A), (B), (C), and (D) are polynomial coefficients related to the parameter ϑ. The parameter ϑ is defined as the ratio of the strain-hardening exponent n to the hardening-index strain-rate correction factor ψn:
By substituting the experimentally obtained S, δmax, Ē, and ξ obtained in the previous step into Equations (9) and (10), the strain-hardening exponent n of the sample can be determined from the intersection of the functions on the left- and right-hand sides.
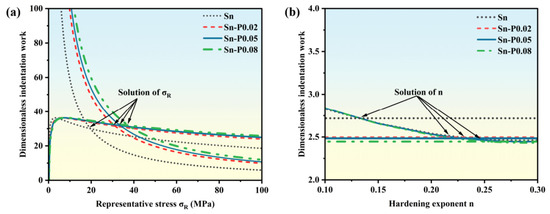
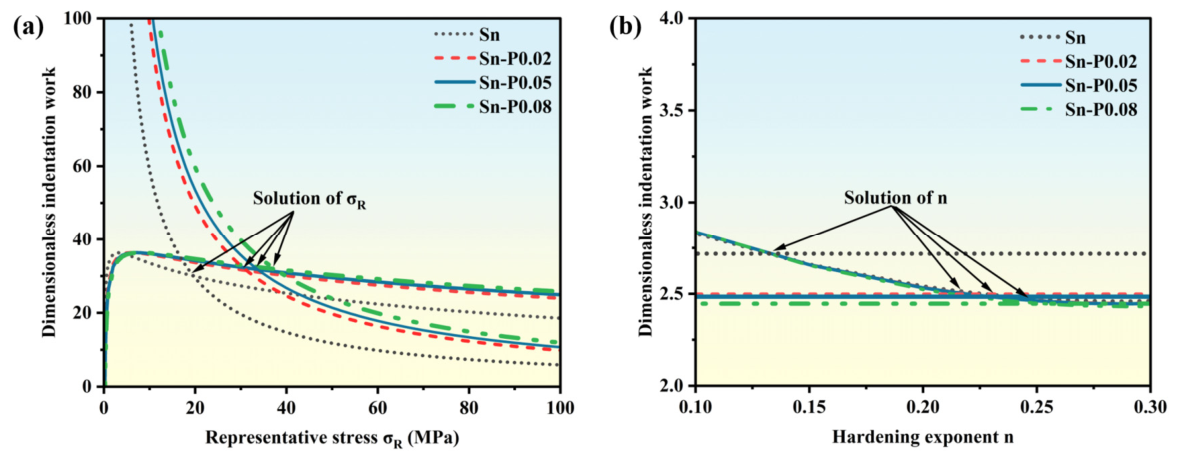
Figure 9 shows the dimensionless fitting results for pure Sn and Sn–P alloys with different P contents. Figure 9a shows the relationship curve between the dimensionless indentation work during loading and representative stress σR, with the intersections corresponding to the representative stresses of the samples. Figure 9b shows the relationship curve between the dimensionless unloading contact stiffness and strain-hardening exponent n, with the intersections corresponding to the strain-hardening exponents. Figure 9a indicates that the representative stress differs among samples with different P contents, demonstrating that trace P addition changes the equivalent load-bearing capacity of β-Sn during indentation. Figure 9b shows that the n values also vary among samples, indicating that trace P addition affects the work-hardening behavior during plastic deformation.
Figure 9.
Dimensionless solution curves for the constitutive parameters of pure Sn and Sn–P alloys with different P contents: (a) representative stress σR; (b) strain-hardening exponent n.
Trace P addition can significantly change the representative stress, strain-hardening exponent, and strength coefficient of β-Sn, thereby affecting its elastoplastic constitutive response. Based on Equations (5)–(10), dimensionless inversion was performed using nanoindentation loading work Wt and unloading contact stiffness, and the constitutive parameters of pure Sn and Sn–P alloys with different P contents were obtained, as shown in Table 2.
Table 2.
Constitutive parameters of pure Sn and Sn–P alloys obtained by nanoindentation inversion.
Table 2 lists the constitutive parameters of Sn and Sn–P alloys obtained by nanoindentation inversion. Compared with pure Sn, trace P addition substantially increases the representative stress σR, strain-hardening exponent n, and strength coefficient R. Specifically, σR increases from 19.64 MPa to 31.27–37.44 MPa, n increases from 0.131 to 0.221–0.253, and R increases from 34.14 MPa to 79.47–108.91 MPa. This indicates that P addition enhances the work-hardening capacity and resistance to plastic deformation of β-Sn. In addition, n = 0.131–0.253 lies within a reasonable range, indicating that the inverted strain-hardening exponents are acceptable [35].
where σe is elastic stress and εe is elastic strain. By combining the straight line of the elastic stage with the power-law curve of the plastic stage, the intersection can be taken as the yield point for the transition from elastic deformation to plastic deformation, and the piecewise stress–strain constitutive equations of different samples can be obtained.
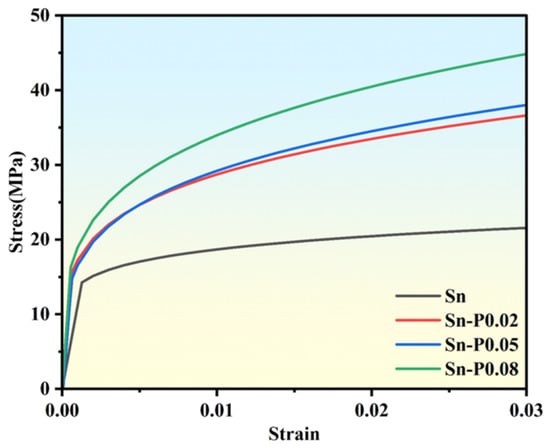
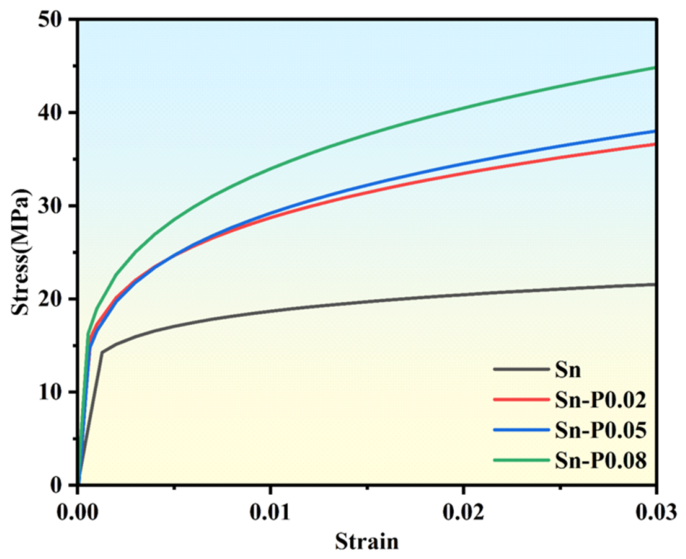
Figure 10 shows the elastoplastic constitutive curves of pure Sn and Sn–P alloys with different P contents. Compared with the tensile stress–strain curve of pure Sn reported by Zhang et al., the stress level and variation trend of the pure Sn inversion curve in this study are basically consistent, both showing slow hardening after yielding. This indicates that the stress–strain curve obtained from nanoindentation inversion in this study has a certain rationality [38].
Figure 10.
Stress–strain constitutive curves of pure Sn and Sn–P alloys obtained by nanoindentation inversion.
Based on the above results, the local mechanical properties of the Sn-based materials are clearly improved after trace P addition. As shown in Figure 7, the elastic modulus and hardness of pure Sn are 11.19 GPa and 0.111 GPa, respectively. After P addition, the elastic moduli of Sn–P0.02, Sn–P0.05, and Sn–P0.08 increase to 23.10 GPa, 26.40 GPa, and 29.86 GPa, respectively, and the hardness values increase to 0.220 GPa, 0.226 GPa, and 0.232 GPa, respectively. This indicates that P addition significantly enhances the ability of the material to resist elastic deformation and local plastic indentation, with Sn–P0.08 exhibiting the highest modulus and hardness and the strongest resistance to indentation deformation.
Further combined with Figure 8, the indentation work and contact stiffness also increase significantly after P addition. The indentation work and contact stiffness of pure Sn are 8473.02 mN·nm and 139.76 kN/m, respectively, whereas those of Sn–P0.08 increase to 17,135.90 mN·nm and 335.70 kN/m, respectively. The increase in indentation work indicates that the material can absorb more external work during indentation, while the increase in contact stiffness indicates that the material has stronger local support under the indenter. This result corresponds to the β-Sn grain refinement, increased grain-boundary number, and dendritic growth revealed by EBSD, indicating that the crystallographic microstructure evolution induced by trace P addition can effectively improve the local deformation resistance of Sn–P alloys.
Consistent with the above nanoindentation results, the stress–strain curves obtained by inversion in Figure 10 are generally higher for Sn–P alloys than for pure Sn and shift upward gradually with increasing P content. According to the constitutive parameters in Table 2, the representative stress σR increases from 19.64 MPa for pure Sn to 37.44 MPa for Sn–P0.08, the strength coefficient R increases from 34.14 MPa to 108.91 MPa, and the strain-hardening exponent n increases from 0.131 to 0.253. This indicates that, after trace P addition, β-Sn requires a higher flow stress to continue plastic deformation under the same strain, and the load-bearing capacity and work-hardening ability in the plastic stage are both enhanced.
From the strengthening mechanism perspective, the improvement in the mechanical properties of Sn–P alloys by trace P addition is not due to a single factor, but rather to the synergistic regulation of the solidification microstructure and crystallographic structure. After trace P addition, the solidification undercooling of β-Sn decreases, promoting nucleation and suppressing the growth of coarse grains. β-Sn grains are refined, grain-boundary density increases, and dendrites appear. Grain boundaries hinder dislocation slip, shorten dislocation motion paths, and limit dislocation accumulation and extension, thereby increasing the resistance to plastic flow. At the same time, dispersed Sn4P3 obstacles pin dislocations and further enhance work-hardening behavior during indentation [39]. Therefore, Sn–P alloys exhibit higher hardness, representative stress σR, strength coefficient R, and strain-hardening exponent n.
3.6. Nanoindentation Energy Analysis and Equivalent Fracture Toughness
To further evaluate the ability of pure Sn and Sn–P alloys with different P contents to resist crack initiation and propagation, the equivalent fracture toughness Kc of the materials was calculated using a nanoindentation energy analysis method. When the cracks induced by nanoindentation are small or the crack length is difficult to measure accurately, the equivalent fracture toughness of the material can be indirectly calculated using energy parameters from the load–displacement curve [40]. During indentation, both the indenter and the sample undergo elastic deformation. Therefore, the reduced elastic modulus Er was first calculated from the elastic parameters of the sample and the diamond Berkovich indenter [41], as shown in Equation (16).
where E and νs are Young’s modulus and Poisson’s ratio of the sample, respectively, and Ei and νi are Young’s modulus and Poisson’s ratio of the indenter, respectively. In this study, Young’s modulus and Poisson’s ratio of the diamond Berkovich indenter were taken as Ei = 1141 GPa and νi = 0.07, respectively [42].
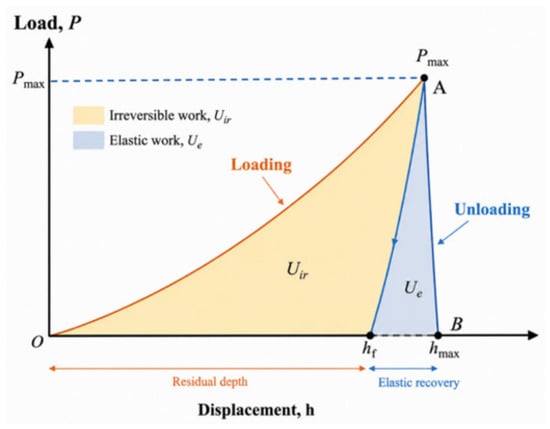
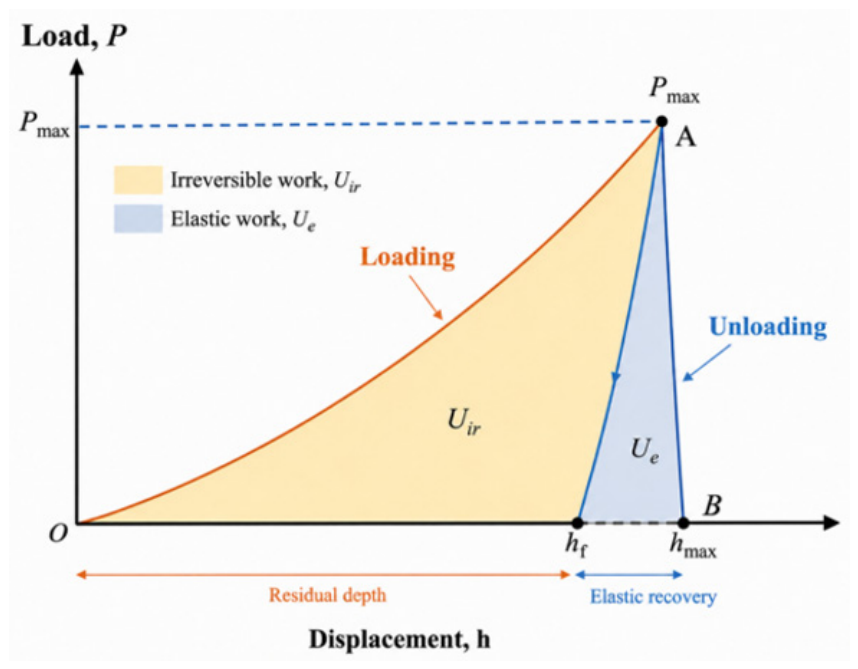
Subsequently, the energy changes during indentation were calculated from the nanoindentation load–displacement curves. The area under the loading curve is defined as the total input energy Ut, and the area under the unloading curve is defined as the elastic recovery energy Ue. The difference between the two is the irreversible energy Uir, as shown in Equation (17).
The irreversible energy Uir includes the energy dissipated by plastic deformation and the energy consumed by crack propagation. To obtain the crack-propagation energy, the pure plastic deformation energy Upp must be deducted; therefore, the crack-propagation energy Ucrack can be expressed as Equation (18).
where Upp is the pure plastic deformation energy, which can be calculated from the total input energy Ut, the residual indentation depth after unloading hf, and the maximum indentation depth δmax, as shown in Equation (19).
After obtaining the crack-propagation energy Ucrack, the critical energy release rate Gc can be further calculated, as shown in Equation (20).
according to Equation (21).
Finally, the equivalent fracture toughness Kc is calculated from the critical energy release rate Gc and the reduced elastic modulus Er, as shown in Equation (22).
Figure 11 shows the energy partition of elastic work and irreversible work in the nanoindentation load–displacement curve. The area enclosed by the loading curve represents the total energy input from the outside, and the area under the unloading curve corresponds to the elastic recovery energy. The difference between the two is the irreversible energy, which further includes plastic-deformation dissipated energy and crack-propagation energy.
Figure 11.
Schematic diagram of elastic work and irreversible work in the nanoindentation load–displacement curve.
Table 3 lists the nanoindentation energy parameters and equivalent fracture toughness of pure Sn and Sn–P alloys with different P contents. As shown in the table, after P addition, both the total indentation work Ut and irreversible work Uir of the samples increase significantly. The Ut and Uir values of pure Sn are 9824.78 mN·nm and 9513.32 mN·nm, respectively, whereas those of Sn–P0.08 increase to 18,189.28 mN·nm and 17,430.27 mN·nm, respectively. This indicates that P addition enhances the local elastoplastic load-bearing capacity and plastic energy-dissipation ability of the material during indentation.
Table 3.
Nanoindentation energy parameters and equivalent fracture toughness of pure Sn and Sn–P alloys with different P contents.
The hf/hmax values of all samples are within the range of 0.93–0.96, indicating that a relatively large residual indentation depth remains after unloading and that indentation deformation is still dominated by irreversible plastic deformation. Among them, Sn–P0.02 has the lowest hf/hmax value, 0.93, indicating that its elastic recovery ability is relatively better.
From the variations in Upp, Ucrack, Gc, and Kc, Upp increases overall after P addition, indicating that Sn–P alloys can sustain and dissipate more plastic deformation energy. However, Ucrack, Gc, and Kc do not increase monotonically with P content, but reach their maximum values in Sn–P0.02. The Ucrack, Gc, and Kc values of Sn–P0.02 are 883.70 mN·nm, 8.51 N·m/m2, and 0.458 MPa·m0.5, respectively, all significantly higher than those of pure Sn. This indicates that appropriate P addition can markedly improve the crack-propagation energy-dissipation ability and equivalent fracture toughness of β-Sn. It should be noted that the Kc values of Sn–P0.05 and Sn–P0.08 are 0.383 and 0.298 MPa·m0.5. The Gc and Kc values obtained for Sn and Sn–P alloys in this study are comparable in order of magnitude to those reported by Huang et al. [43] for sintered Cu using a nanoindentation energy-based method, suggesting that the present results are reasonable.
When the P content increases to 0.05 wt.% and 0.08 wt.%, although Ut, Uir, and Upp continue to increase, indicating that the resistance to plastic indentation deformation is further enhanced, Gc and Kc decrease compared with Sn–P0.02. This indicates that the strengthening effect is enhanced at higher P contents, but the improvement in crack-propagation energy dissipation is limited. Overall, Sn–P0.02 exhibits better equivalent fracture toughness, whereas Sn–P0.08 mainly shows higher hardness.
4. Conclusions
In this study, Sn–P alloys with different P contents were prepared by a secondary alloying method, with pure Sn used as the reference sample. The effects of trace P addition on the phase constitution, solidification crystallization behavior, crystallographic microstructural characteristics, and local mechanical properties of β-Sn alloys were investigated by XRD, DSC, EBSD, nanoindentation testing, and constitutive inversion. The following conclusions were obtained:
- (1)
- XRD results show that pure Sn and Sn–P alloys with different P contents are all mainly composed of β-Sn, with no obvious new phase diffraction peaks observed. This indicates that, within the trace P addition range used in this study, P addition does not significantly change the main phase constitution or crystal structure of the Sn matrix. DSC results show that trace P addition has little effect on the melting behavior of Sn-based alloys but substantially changes their solidification crystallization behavior. Compared with pure Sn, the solidification exothermic peaks of the Sn–P alloys shift to a higher temperature by approximately 20–22 °C, and the undercooling decreases from 39.83 °C to 17.50–20.33 °C. This indicates that P addition promotes the nucleation process of β-Sn and enables the alloy to solidify and crystallize at a lower undercooling.
- (2)
- EBSD and elemental-mapping results indicate that, after P addition, the alloy remains predominantly composed of a coarse β-Sn matrix rather than being completely transformed into a uniformly fine equiaxed-grain structure. However, locally distributed fine Sn4P3 second-phase particles are formed in the Sn–P0.08 alloy, leading to increased dendritic branching, local orientation subdivision, and grain-boundary density. Consequently, the average reconstructed grain size decreases from 1015.3 μm in pure Sn to 48.3 μm in the Sn–P0.08 alloy. These fine second-phase particles may provide favorable sites for heterogeneous nucleation while restricting the continued growth of β-Sn.
- (3)
- Nanoindentation results show that trace P addition significantly improves the local mechanical properties of Sn-based alloys. Young’s modulus and hardness of pure Sn are 11.19 GPa and 0.111 GPa, respectively. Young’s modulus and hardness of Sn–P0.08 are approximately 2.67 and 2.09 times those of pure Sn, respectively, indicating that P addition significantly enhances the resistance of the material to plastic indentation flow. After trace P addition, the representative stress, strain-hardening exponent, and strength coefficient of Sn–P alloys all increase markedly. P content has a clear effect on the mechanical response; among the samples, Sn–P0.08 exhibits the highest modulus, hardness, and flow stress and therefore the most significant strengthening effect.
- (4)
- When the P content is 0.02 wt.%, the critical energy release rate and critical stress intensity factor reach 8.51 N·m/m2 and 0.458 MPa·m0.5, respectively. This indicates that appropriate P addition can enhance crack-propagation energy dissipation while improving resistance to elastoplastic deformation, showing a favorable strength–toughness synergy. When the P content further increases to 0.05 wt.% and 0.08 wt.%, the critical energy release rate and critical stress intensity factor decrease.
- (5)
- The improvement in the mechanical properties of the metal after trace P addition is mainly associated with β-Sn grain refinement, increased grain-boundary density, dendritic microstructure formation, and dislocation pinning by the dispersed Sn4P3 obstacles. Dendrites, grain boundaries, and dispersed Sn4P3 can restrict dislocation slip and plastic-zone expansion, thereby increasing indentation hardness, flow stress, and work-hardening ability. Sn–P0.02 exhibits better crack-propagation energy-dissipation ability and a favorable strength–toughness synergy, whereas Sn–P0.08 mainly shows stronger resistance to plastic deformation.
Author Contributions
Conceptualization, Y.W., Z.Z. and H.Z.; methodology, Y.W.; software, Y.W. and H.Z.; validation, Y.W. and J.H.; formal analysis, Y.W. and W.L.; investigation, Y.W., Z.Z., H.Z., J.H. and W.L.; resources, H.Q., J.H., W.L. and C.L. (Caihang Liang); data curation, Y.W., L.W., C.L. (Chengxu Lin) and M.H.; writing—original draft preparation, Y.W., Z.Z. and H.Z.; writing—review and editing, Y.W., Z.Z., H.Q. and C.L. (Caihang Liang); visualization, Y.W., L.W., C.L. (Chengxu Lin) and M.H.; supervision, H.Q.; project administration, H.Q.; funding acquisition, H.Q. All authors have read and agreed to the published version of the manuscript.
Funding
This work was supported by the Major Program Project of Guangxi Province (No. GuiKeAD25069012), the Major Program Project of Guangxi Province (No. GuiKeAA24206068), the Guangxi Key Laboratory of Advanced Packaging and System Integration (No. GuikeLT2600640003), the Innovation Project of Guangxi Graduate Education (No. YCBZ2025163), and the Innovation Project of GUET Graduate Education (No. 2025YCXS008 and 2026YCXS008).
Data Availability Statement
The original contributions presented in the study are included in the article; further inquiries can be directed to the corresponding author.
Conflicts of Interest
Lili Wang, Chengxu Lin, and Mingzhen Hu were employed by Liuzhou Huaxi Nonferrous Design & Research Institute Co., Ltd. and Guangxi Key Metal Research Institute Co., Ltd. The remaining authors declare that the research was conducted in the absence of any commercial or financial relationships that could be construed as a potential conflict of interest.
References
- Abtew, M.; Selvaduray, G. Lead-Free Solders in Microelectronics. Mater. Sci. Eng. R Rep. 2000, 27, 95–141. [Google Scholar] [CrossRef] [Scilit]
- Cheng, S.; Huang, C.-M.; Pecht, M. A Review of Lead-Free Solders for Electronics Applications. Microelectron. Reliab. 2017, 75, 77–95. [Google Scholar] [CrossRef] [Scilit]
- Kotadia, H.R.; Howes, P.D.; Mannan, S.H. A Review: On the Development of Low Melting Temperature Pb-Free Solders. Microelectron. Reliab. 2014, 54, 1253–1273. [Google Scholar] [CrossRef] [Scilit]
- Zhao, M.; Zhang, L.; Liu, Z.-Q.; Xiong, M.-Y.; Sun, L. Structure and Properties of Sn-Cu Lead-Free Solders in Electronics Packaging. Sci. Technol. Adv. Mater. 2019, 20, 421–444. [Google Scholar] [CrossRef] [Scilit] [PubMed]
- Jiang, N.; Zhang, L.; Liu, Z.-Q.; Sun, L.; Long, W.-M.; He, P.; Xiong, M.-Y.; Zhao, M. Reliability Issues of Lead-Free Solder Joints in Electronic Devices. Sci. Technol. Adv. Mater. 2019, 20, 876–901. [Google Scholar] [CrossRef] [Scilit] [PubMed]
- Shen, Y.-A.; Wu, J.A. Effect of Sn Grain Orientation on Reliability Issues of Sn-Rich Solder Joints. Materials 2022, 15, 5086. [Google Scholar] [CrossRef] [Scilit] [PubMed]
- Bieler, T.R.; Jiang, H.; Lehman, L.P.; Kirkpatrick, T.; Cotts, E.J.; Nandagopal, B. Influence of Sn Grain Size and Orientation on the Thermomechanical Response and Reliability of Pb-Free Solder Joints. IEEE Trans. Compon. Packag. Technol. 2008, 31, 371–381. [Google Scholar] [CrossRef] [Scilit]
- Kariya, Y.; Tajima, S.; Yamada, S. Influence of Crystallographic Orientation on Fatigue Reliability of β-Sn and β-Sn Micro-Joint. Mater. Trans. 2012, 53, 2067–2071. [Google Scholar] [CrossRef] [Scilit]
- Gourlay, C.M.; Belyakov, S.A.; Ma, Z.L.; Xian, J.W. Nucleation and Growth of Tin in Pb-Free Solder Joints. JOM 2015, 67, 2383–2393. [Google Scholar] [CrossRef] [Scilit]
- Ma, Z.L.; Belyakov, S.A.; Gourlay, C.M. Effects of Cobalt on the Nucleation and Grain Refinement of Sn-3Ag-0.5Cu Solders. J. Alloys Compd. 2016, 682, 326–337. [Google Scholar] [CrossRef] [Scilit]
- Cheng, F.; Nishikawa, H.; Takemoto, T. Microstructural and Mechanical Properties of Sn–Ag–Cu Lead-Free Solders with Minor Addition of Ni and/or Co. J. Mater. Sci. 2008, 43, 3643–3648. [Google Scholar] [CrossRef] [Scilit]
- Lee, H.T.; Yang, C.L.; Chen, M.H.; Li, C.S. Effect of Sb Addition on Microstructure and Shear Strength of Sn-Ag Solder Joints. Key Eng. Mater. 2004, 261–263, 501–506. [Google Scholar] [CrossRef] [Scilit]
- Silva, B.L.; Mendes, P.H.; Garcia, A.; Spinelli, J.E. Effect of Aging on Dendritic Array, Ag3Sn Spacing, and Hardness of a Sn-2Ag-0.7Cu Solder Alloy. J. Electron. Mater. 2022, 51, 4641–4648. [Google Scholar] [CrossRef] [Scilit]
- Zhang, Y.; Zhang, J.; Zhao, Z.; Li, Z.; Cen, Y. Effect of Directional Solidification on the Microstructure and Mechanical Properties of Sn-6.5Zn-Cu Lead-Free Solder Alloys. J. Alloys Compd. 2026, 1050, 185798. [Google Scholar] [CrossRef] [Scilit]
- Xian, A.-P.; Gong, G.-L. Oxidation Behavior of Molten Tin Doped with Phosphorus. J. Electron. Mater. 2007, 36, 1669–1678. [Google Scholar] [CrossRef] [Scilit]
- Xian, A.-P.; Gong, G.-L. Surface Oxidation of Molten Sn–0.07 wt.% P in Air at 280 °C. J. Mater. Res. 2008, 23, 1532–1536. [Google Scholar] [CrossRef] [Scilit]
- Körmendy, J.; Vavro, J., Jr.; Vavro, J. Tin–Phosphorus Alloy: The Impact of Temperature on Alloy Formation and the Influence of the Dross Amount on the Solder Bath Surface. Appl. Sci. 2024, 14, 8257. [Google Scholar] [CrossRef] [Scilit]
- Nogita, K.; Gourlay, C.M.; Read, J.; Nishimura, T.; Suenaga, S.; Dahle, A.K. Effects of Phosphorus on Microstructure and Fluidity of Sn-0.7Cu-0.05Ni Lead-Free Solder. Mater. Trans. 2008, 49, 443–448. [Google Scholar] [CrossRef] [Scilit]
- Lin, K.-L.; Liu, T.-P. High-Temperature Oxidation of a Sn–Zn–Al Solder. Oxid. Met. 1998, 50, 255–267. [Google Scholar] [CrossRef] [Scilit]
- Hielscher, R.; Schaeben, H. A Novel Pole Figure Inversion Method: Specification of the MTEX Algorithm. J. Appl. Crystallogr. 2008, 41, 1024–1037. [Google Scholar] [CrossRef] [Scilit]
- Oliver, W.C.; Pharr, G.M. An Improved Technique for Determining Hardness and Elastic Modulus Using Load and Displacement Sensing Indentation Experiments. J. Mater. Res. 1992, 7, 1564–1583. [Google Scholar] [CrossRef] [Scilit]
- Oliver, W.C.; Pharr, G.M. Measurement of Hardness and Elastic Modulus by Instrumented Indentation: Advances in Understanding and Refinements to Methodology. J. Mater. Res. 2004, 19, 3–20. [Google Scholar] [CrossRef]
- Hay, J.; Agee, P.; Herbert, E. Continuous Stiffness Measurement during Instrumented Indentation Testing. Exp. Tech. 2010, 34, 86–94. [Google Scholar] [CrossRef] [Scilit]
- Zavrazhnov, A.Y.; Semenova, G.V.; Proskurina, E.Y.; Sushkova, T.P. Phase Diagram of the Sn–P System. J. Therm. Anal. Calorim. 2018, 134, 475–481. [Google Scholar] [CrossRef] [Scilit]
- Hall, E.O. The Deformation and Ageing of Mild Steel: III Discussion of Results. Proc. Phys. Soc. Lond. Sect. B 1951, 64, 747–753. [Google Scholar] [CrossRef] [Scilit]
- Li, Y.; Bushby, A.J.; Dunstan, D.J. The Hall–Petch Effect as a Manifestation of the General Size Effect. Proc. R. Soc. A Math. Phys. Eng. Sci. 2016, 472, 20150890. [Google Scholar] [CrossRef] [Scilit] [PubMed]
- Go, H.; Noh, T.; Jung, S.-B.; Sohn, Y. Microstructural Optimization of Sn-58Bi Low-Temperature Solder Fabricated by Intense Pulsed Light (IPL) Irradiation. Crystals 2024, 14, 465. [Google Scholar] [CrossRef] [Scilit]
- Basaran, C.; Jiang, J. Measuring Intrinsic Elastic Modulus of Pb/Sn Solder Alloys. Mech. Mater. 2002, 34, 349–362. [Google Scholar] [CrossRef] [Scilit]
- Singh, S.S.; Sarkar, R.; Xie, H.-X.; Mayer, C.; Rajagopalan, J.; Chawla, N. Tensile Behavior of Single-Crystal Tin Whiskers. J. Electron. Mater. 2014, 43, 978–982. [Google Scholar] [CrossRef] [Scilit]
- El-Taher, A.M.; Abd Elmoniem, H.M.; Mosaad, S. Microstructural, Thermal and Mechanical Properties of Co Added Sn–0.7Cu Lead-Free Solder Alloy. J. Mater. Sci. Mater. Electron. 2023, 34, 590. [Google Scholar] [CrossRef] [Scilit]
- Ogasawara, N.; Chiba, N.; Chen, X. Measuring the Plastic Properties of Bulk Materials by Single Indentation Test. Scr. Mater. 2006, 54, 65–70. [Google Scholar] [CrossRef] [Scilit]
- Ogasawara, N.; Chiba, N.; Chen, X. Representative Strain of Indentation Analysis. J. Mater. Res. 2005, 20, 2225–2234. [Google Scholar] [CrossRef] [Scilit]
- Long, X.; Zhang, X.; Tang, W.; Wang, S.; Feng, Y.; Chang, C. Calibration of a Constitutive Model from Tension and Nanoindentation for Lead-Free Solder. Micromachines 2018, 9, 608. [Google Scholar] [CrossRef] [Scilit] [PubMed]
- Long, X.; Hu, B.; Feng, Y.; Chang, C.; Li, M. Correlation of Microstructure and Constitutive Behaviour of Sintered Silver Particles via Nanoindentation. Int. J. Mech. Sci. 2019, 161–162, 105020. [Google Scholar] [CrossRef] [Scilit]
- Dao, M.; Chollacoop, N.; Van Vliet, K.J.; Venkatesh, T.A.; Suresh, S. Computational Modeling of the Forward and Reverse Problems in Instrumented Sharp Indentation. Acta Mater. 2001, 49, 3899–3918. [Google Scholar] [CrossRef] [Scilit]
- Long, X.; Jia, Q.; Shen, Z.; Liu, M.; Guan, C. Strain Rate Shift for Constitutive Behaviour of Sintered Silver Nanoparticles under Nanoindentation. Mech. Mater. 2021, 158, 103881. [Google Scholar] [CrossRef] [Scilit]
- Cheng, Y.-T.; Cheng, C.-M. Scaling, Dimensional Analysis, and Indentation Measurements. Mater. Sci. Eng. R Rep. 2004, 44, 91–149. [Google Scholar] [CrossRef] [Scilit]
- Zhang, X.; Lu, H.; Luo, X.; Jia, Y.; Yu, Y.; Feng, Y.; Zaki, Z.I.; Khalifa, M.E.; Amin, M.A.; Peng, J.; et al. Rate-Dependent Mechanical Behavior of Dual-Phase Structure of Sn Interconnect Materials. J. Mater. Sci. Mater. Electron. 2025, 36, 630. [Google Scholar] [CrossRef] [Scilit]
- Matsukawa, Y. Crystallography of Precipitates in Metals and Alloys: (2) Impact of Crystallography on Precipitation Hardening. In Crystallography; Akitsu, T., Ed.; IntechOpen: London, UK, 2019. [Google Scholar] [CrossRef] [Scilit]
- Jha, K.K.; Suksawang, N.; Lahiri, D.; Agarwal, A. Energy-Based Analysis of Nanoindentation Curves for Cementitious Materials. ACI Mater. J. 2012, 109, 81–90. [Google Scholar] [CrossRef] [Scilit]
- Liu, K.; Ostadhassan, M.; Bubach, B. Applications of Nano-Indentation Methods to Estimate Nanoscale Mechanical Properties of Shale Reservoir Rocks. J. Nat. Gas. Sci. Eng. 2016, 35, 1310–1319. [Google Scholar] [CrossRef] [Scilit]
- Bonithon, R.; Kao, A.P.; Fernández, M.P.; Dunlop, J.N.; Blunn, G.W.; Witte, F.; Tozzi, G. Multi-Scale Mechanical and Morphological Characterisation of Sintered Porous Magnesium-Based Scaffolds for Bone Regeneration in Critical-Sized Defects. Acta Biomater. 2021, 127, 338–352. [Google Scholar] [CrossRef] [Scilit] [PubMed]
- Huang, J.; Wang, B.; He, S.; Cai, M.; Qin, H.; Yan, H. A Comparative Study of the Mechanical Properties of Sintered Submicron and Micron Cu. Solder. Surf. Mt. Technol. 2026, 1–11. [Google Scholar] [CrossRef] [Scilit]

Disclaimer/Publisher’s Note: The statements, opinions and data contained in all publications are solely those of the individual author(s) and contributor(s) and not of MDPI and/or the editor(s). MDPI and/or the editor(s) disclaim responsibility for any injury to people or property resulting from any ideas, methods, instructions or products referred to in the content. |
© 2026 by the authors. Licensee MDPI, Basel, Switzerland. This article is an open access article distributed under the terms and conditions of the Creative Commons Attribution (CC BY) license.