


Abstract
Spatial inhomogeneities are essential for biological membrane function. They could trigger structural transformations in membranes as well as changes in their global behaviours, and influence intercell communications. This study investigates how curvature-enforcing inclusions and in-plane orientational order generate such patterns. We focus on membranes exhibiting spherical topology, consisting of primary (lipids) and secondary (inclusions) constituents. Using Monte Carlo simulations, we show that, for a high enough concentration of inclusions, a budding instability appears below a critical temperature. The complexity of patterns is further increased if membranes exhibit in-plane order. According to the Gauss–Bonnet and Poincare–Hopf theorems in membranes of non-toroidal topology, topological defects are inevitably formed which introduce centres exhibiting strongly local elastic distortions. Regions exhibiting a large enough local curvature could trigger additional pairs of defects. Furthermore, condensed in-plane order could generate a Flory–Huggins-type contribution, promoting the assembly of membrane inclusions. Finally, memory effects are expected to play an important role.
1. Introduction
Biological membranes [1,2] are walls separating the interior and exterior of biological cells. They play diverse roles, including in cell-to-cell communication, waste control, transportation of nutrients, encapsulating particles or viruses, and cell budding and division, to mention a few. These complex adaptive systems occur via the continuous adaptation and optimisation of natural selection mechanisms with respect to the given conditions. They typically consist of lipids, proteins, carbohydrates, cholesterol, and other components. Lipids in the form of a bilayer are their basic constituents. Their membrane thickness is several nm thick, which is relatively thin with respect to the lateral supra-micrometre dimensions. Consequently, it is justifiable to invoke elastic continuum approaches [3,4,5] or simple, effectively two-dimensional lattice-type approaches [6] to model several essential membrane properties.
In general, biological cell membranes exhibit some kind of in-plane orientational order [7,8,9] that can be modelled by p-atic mesoscopic fields [9,10,11,12]. These fields exhibit symmetry invariance under 2π/p local in-plane rotations. In biological systems, one often observes nematic (p = 2) [13,14,15], tetratic (p = 4) [16], and hexatic (p = 6) order [17,18,19,20]. These might play an important role in collective cell motion, cellular extrusion, cell budding or fission, tissue morphogenesis, and the separation and/or aggregation of multi-component membrane constituents [13,21,22,23,24].
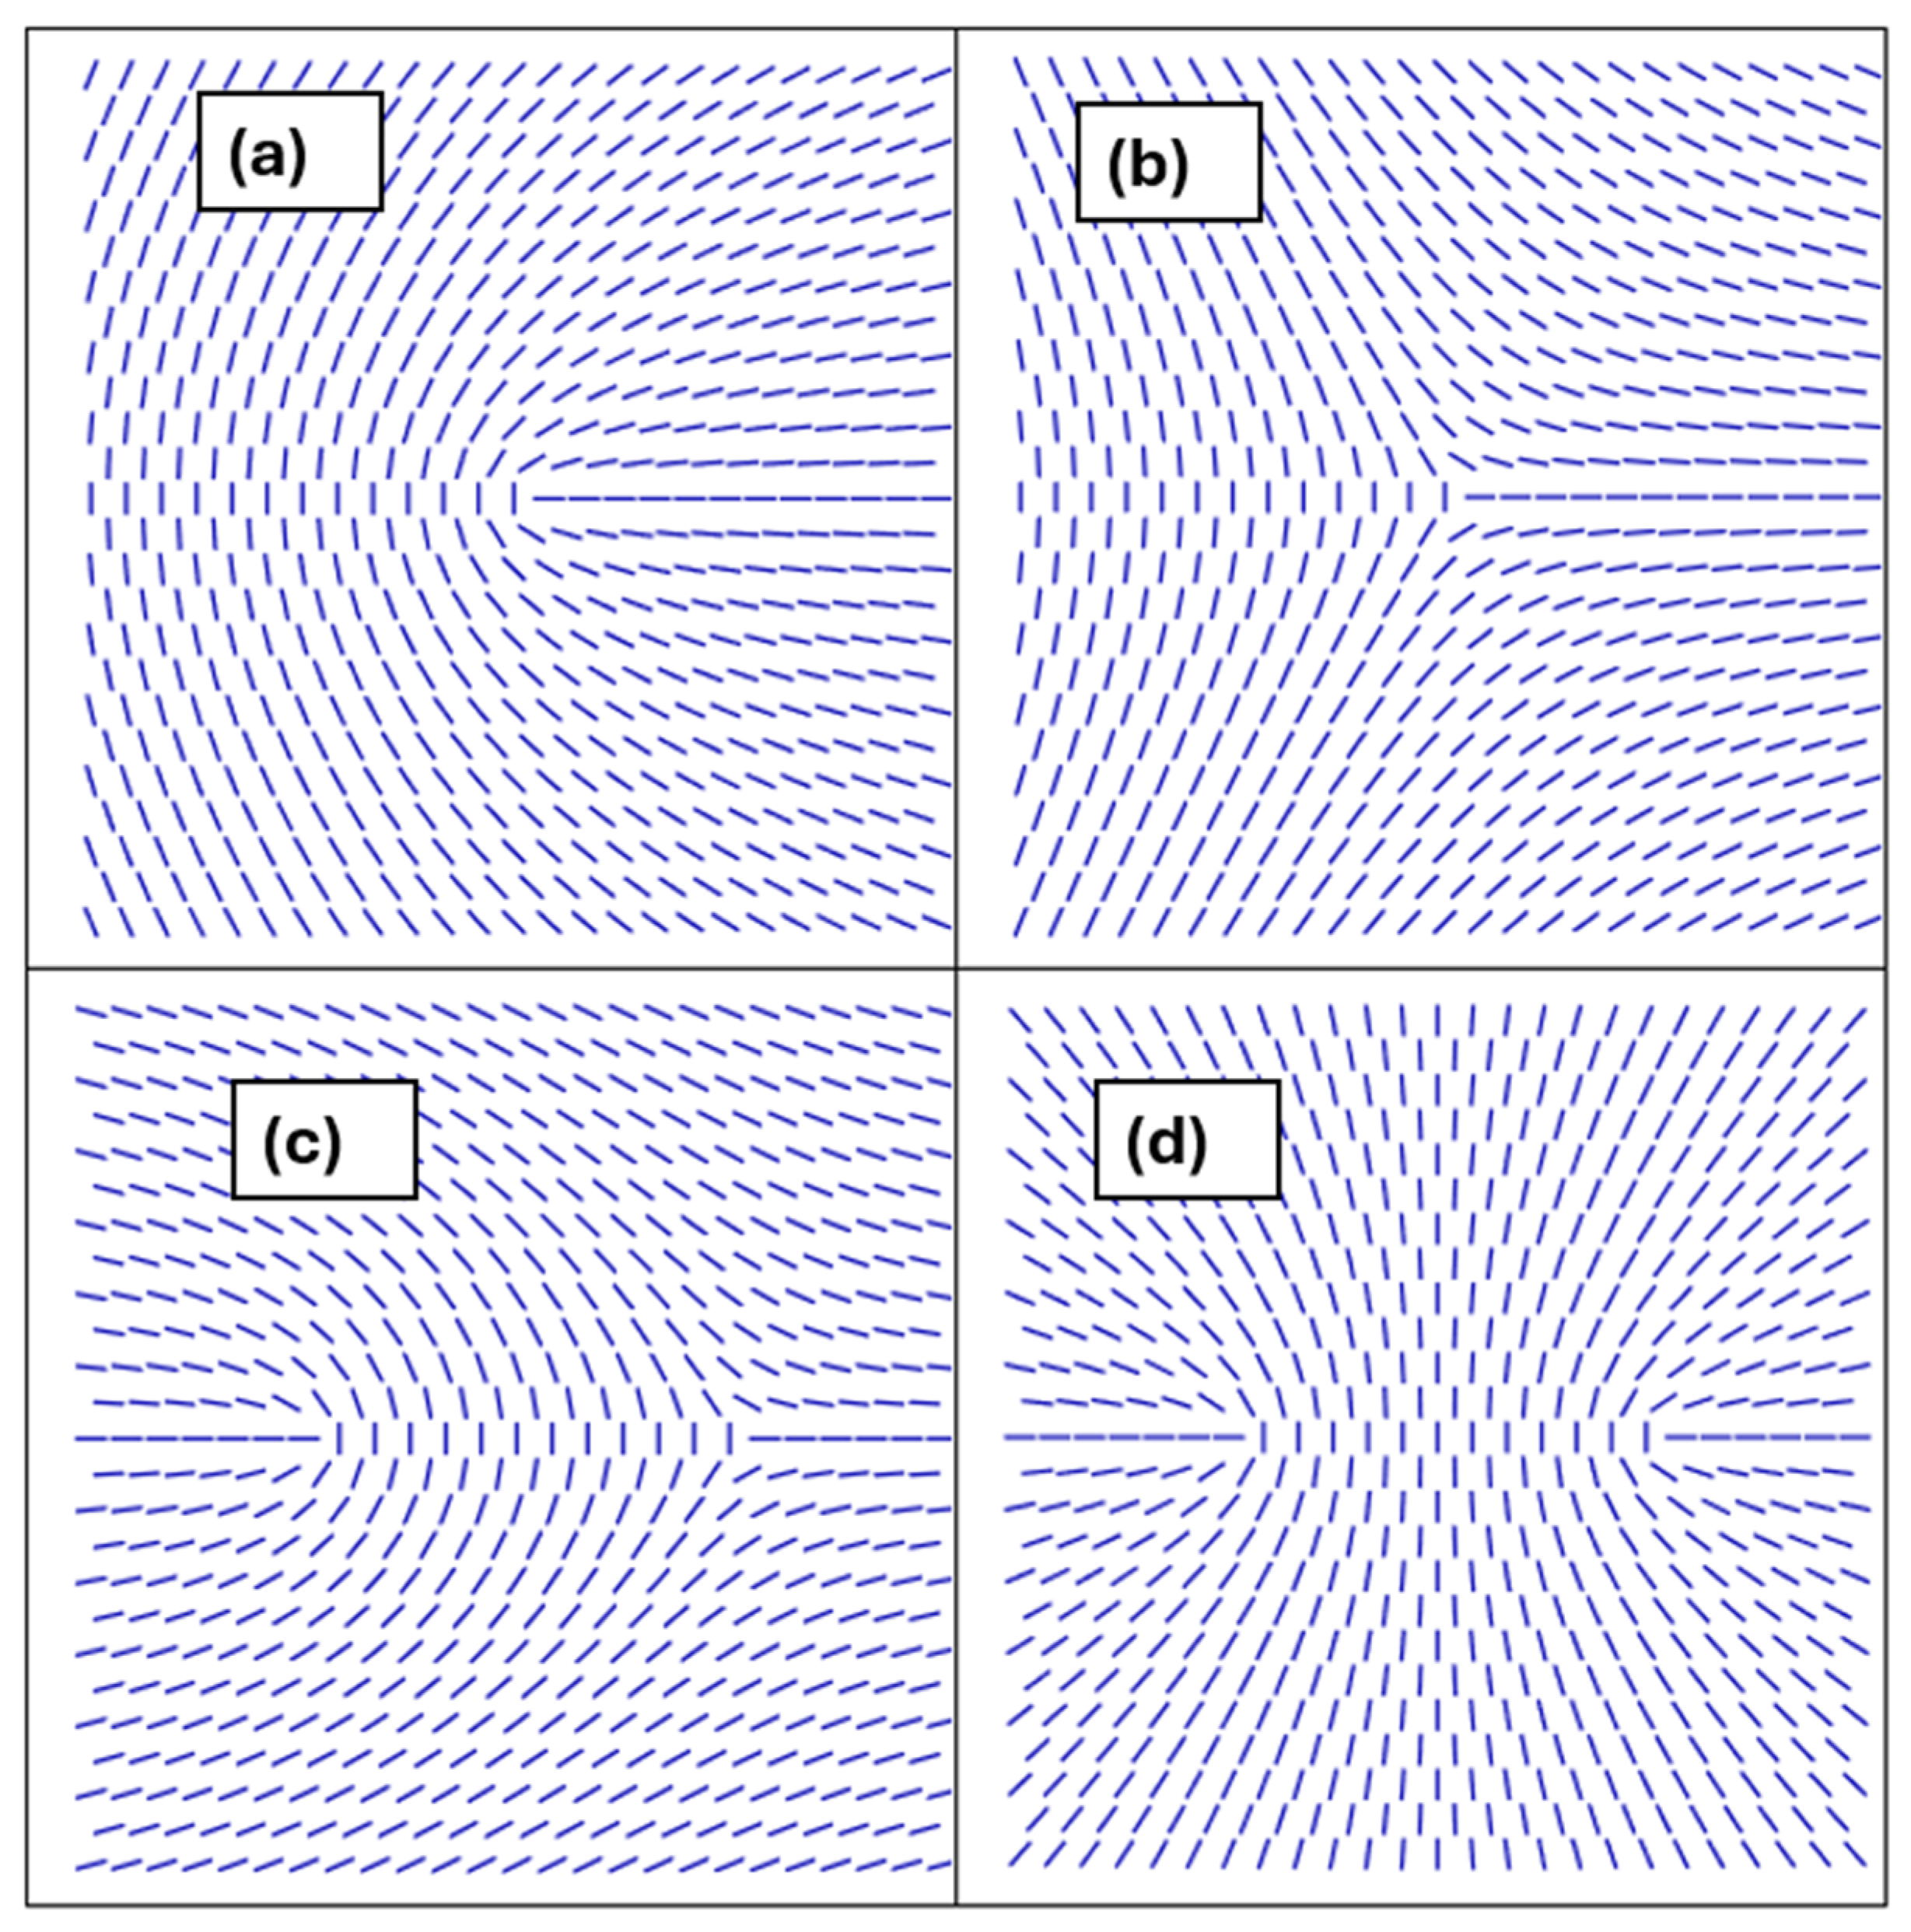
In general, in-plane order inevitably introduces spatial inhomogeneities in curved membranes owing to topology. For example, the Gauss–Bonnet (GB) and Poincare–Hopf (PH) theorems [25,26,27] claim that closed membranes unavoidably possess topological defects (TDs) [28] in the respective ordering fields in systems exhibiting non-toroidal topologies. Therefore, they are surely present in spherical topologies that are the most realised in biological cells. TDs refer to topologically protected localised field distortions. In 2D systems, their key properties are determined by the winding number k (2D topological charge) [29], which is a conserved quantity. It is defined as the number of total rotations of the field on encircling the defect centre counterclockwise on any closed path. At the defect’s centre, the field order is not uniquely defined, and consequently the order is melted. Topological charges exhibit discrete values, and their minimal value (elementary charges) depends on the following field symmetry [30]: . TDs bearing positive and negative values of k are referred to as defects and antidefects [31], respectively. Some representative TDs in 2D nematic order are depicted in Figure 1. A pair {k,−k} on flat substrates tends to annihilate into a defectless state. Namely, its total topological charge is equal to zero and is topologically equivalent to a locally homogeneous state. Note that TDs are energetically expensive (i.e., they have essentially melted defect cores and the surrounding field is spatially distorted) and consequently a system tends to minimise their number. Furthermore, for common conditions, their local energy penalty is proportional to [30]. Consequently, TDs bearing are favoured. Therefore, a locally enforced single “strongly” charged TD possessing tends to decay into elementary charges.
Figure 1.
Representative TDs in nematic liquid crystals characterised by 2D topological charges k. In (a,b), we show single TDs bearing elementary charges: (a) k = 1/2 (defect), (b) k = −1/2 (antidefect). (c) A pair (1/2,−1/2) bearing the total topological charge . Such a pattern is topologically equivalent to a defectless state. (d) A pair (1/2,1/2) bearing the total topological charge . Such a pattern is topologically equivalent to a single defect bearing k = 1.
In membranes, the number and distribution of TDs are strongly affected by the membrane’s curvature field. The latter effects have been systematically analysed using 2D XY-type approaches [10,11,32,33,34]. In addition, TDs could act as attracting sites to nanoobjects [35,36,37] immersed within biological membranes. Namely, these objects could in general affect the membrane ordering field [38,39,40,41,42] and consequently interact with their immediate neighbourhood. If they do not significantly distort the order, they are usually attracted to the cores of the TDs (the regions surrounding the defect where the magnitude of order is strongly affected) [35,36,37]. In cases where a nanoobject (or its assembly) strongly deforms the local orientational field [31,43], it can act as an effective topological defect and, owing to the defect conservation law, generate additional TDs in the system. These TD-enabled inhomogeneities in the membrane, which could also be triggered dynamically [44] (e.g., by shape changes or high enough concentrations of membrane constituents), might play an important role in several vital biological cell mechanisms.
In this contribution, we focus on membranes consisting of lipids (primary membrane constituents) and some other membrane components (secondary membrane components, e.g., proteins). We henceforth refer to the latter as inclusions. Of interest to us are common universal mechanisms that impact the spatial distribution of inclusions. Firstly, using Monte Carlo (MC) simulations, we illustrate the impact of inclusions possessing inherent curvature on membrane shapes. We show that budding-like protrusions could be generated, introducing strong spatial inhomogeneities in membrane configurations. Furthermore, the richness of such patterns could be enormously increased if some kind of in-plane membrane order is present. We present some common universal complexity-generating mechanisms using simple mesoscopic modelling. We focus on universal phenomena related to TDs, which we illustrate using the case of TDs in nematic liquid crystals (NLCs) [29]. TDs in NLCs are relatively simply created, manipulated and observed. Consequently, they represent an ideal laboratory system for testing validity and experimentally illustrating universal topology-driven physics of TDs [24].
The plan of the paper is as follows. In Section 2, we present our MC simulation method and mesoscopic modelling that we use in our analyses. Results are presented in Section 3, and in Section 4, we summarise our findings. In Appendix A, we illustrate the derivation of the membrane mesoscopic curvature free energy contribution. In Appendix B, we list the key parameters used in the studies.
2. Methods
In the following, we first present the Monte Carlo simulations which we used to study the impact of inclusions on the membrane budding instability. We then present the mesoscopic modelling which we used to analyse the impacts of the ordering fields on membrane inhomogeneities.
2.1. Monte-Carlo Method
A membrane is modelled using a 2D triangulated network of vertices which were occupied either by lipids (primary membrane constituents) or inclusions (e.g., proteins). We assume that inclusions are curved and consequently impact the global membrane curvature. Their number is given by and , respectively. The concentration of inclusions is defined in simulations as . Bonds between nearby vertices (thethers) are of variable length , forming a mesh representing the membrane.
2.1.1. Interaction Energy
The energy of a microstate of a closed membrane of total area is given by
consisting of membrane bending penalty and direct interactions among nearby inclusions.
For the bending energy density, we used the classical Helfrich expression [3] (see Appendix A):
where stand for the principal curvatures of a local membrane patch of area , is the inherent local membrane curvature, and is the curvature elastic modulus. In our simulations, we assumed a spatially varying intrinsic curvature field , which was equal to zero at sites hosting lipids (i.e., primary membrane components) and not where inclusions are present [6,45].
Furthermore, is introduced to model the inclusions’ assembling tendency. We assumed a short range attractive interaction given by
Here, the sum runs over all inclusion pairs whose mutual in-plane distance is given by is the range of interaction, stands for the attractive interaction strength, and is the step function, which equals one for pairs separated for less than and otherwise equals zero.
2.1.2. Vertex and Bond Dynamics
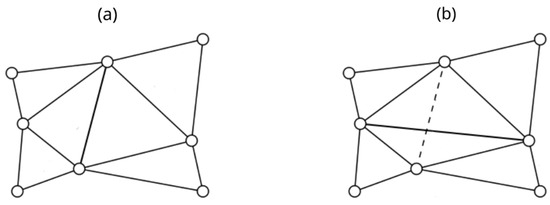
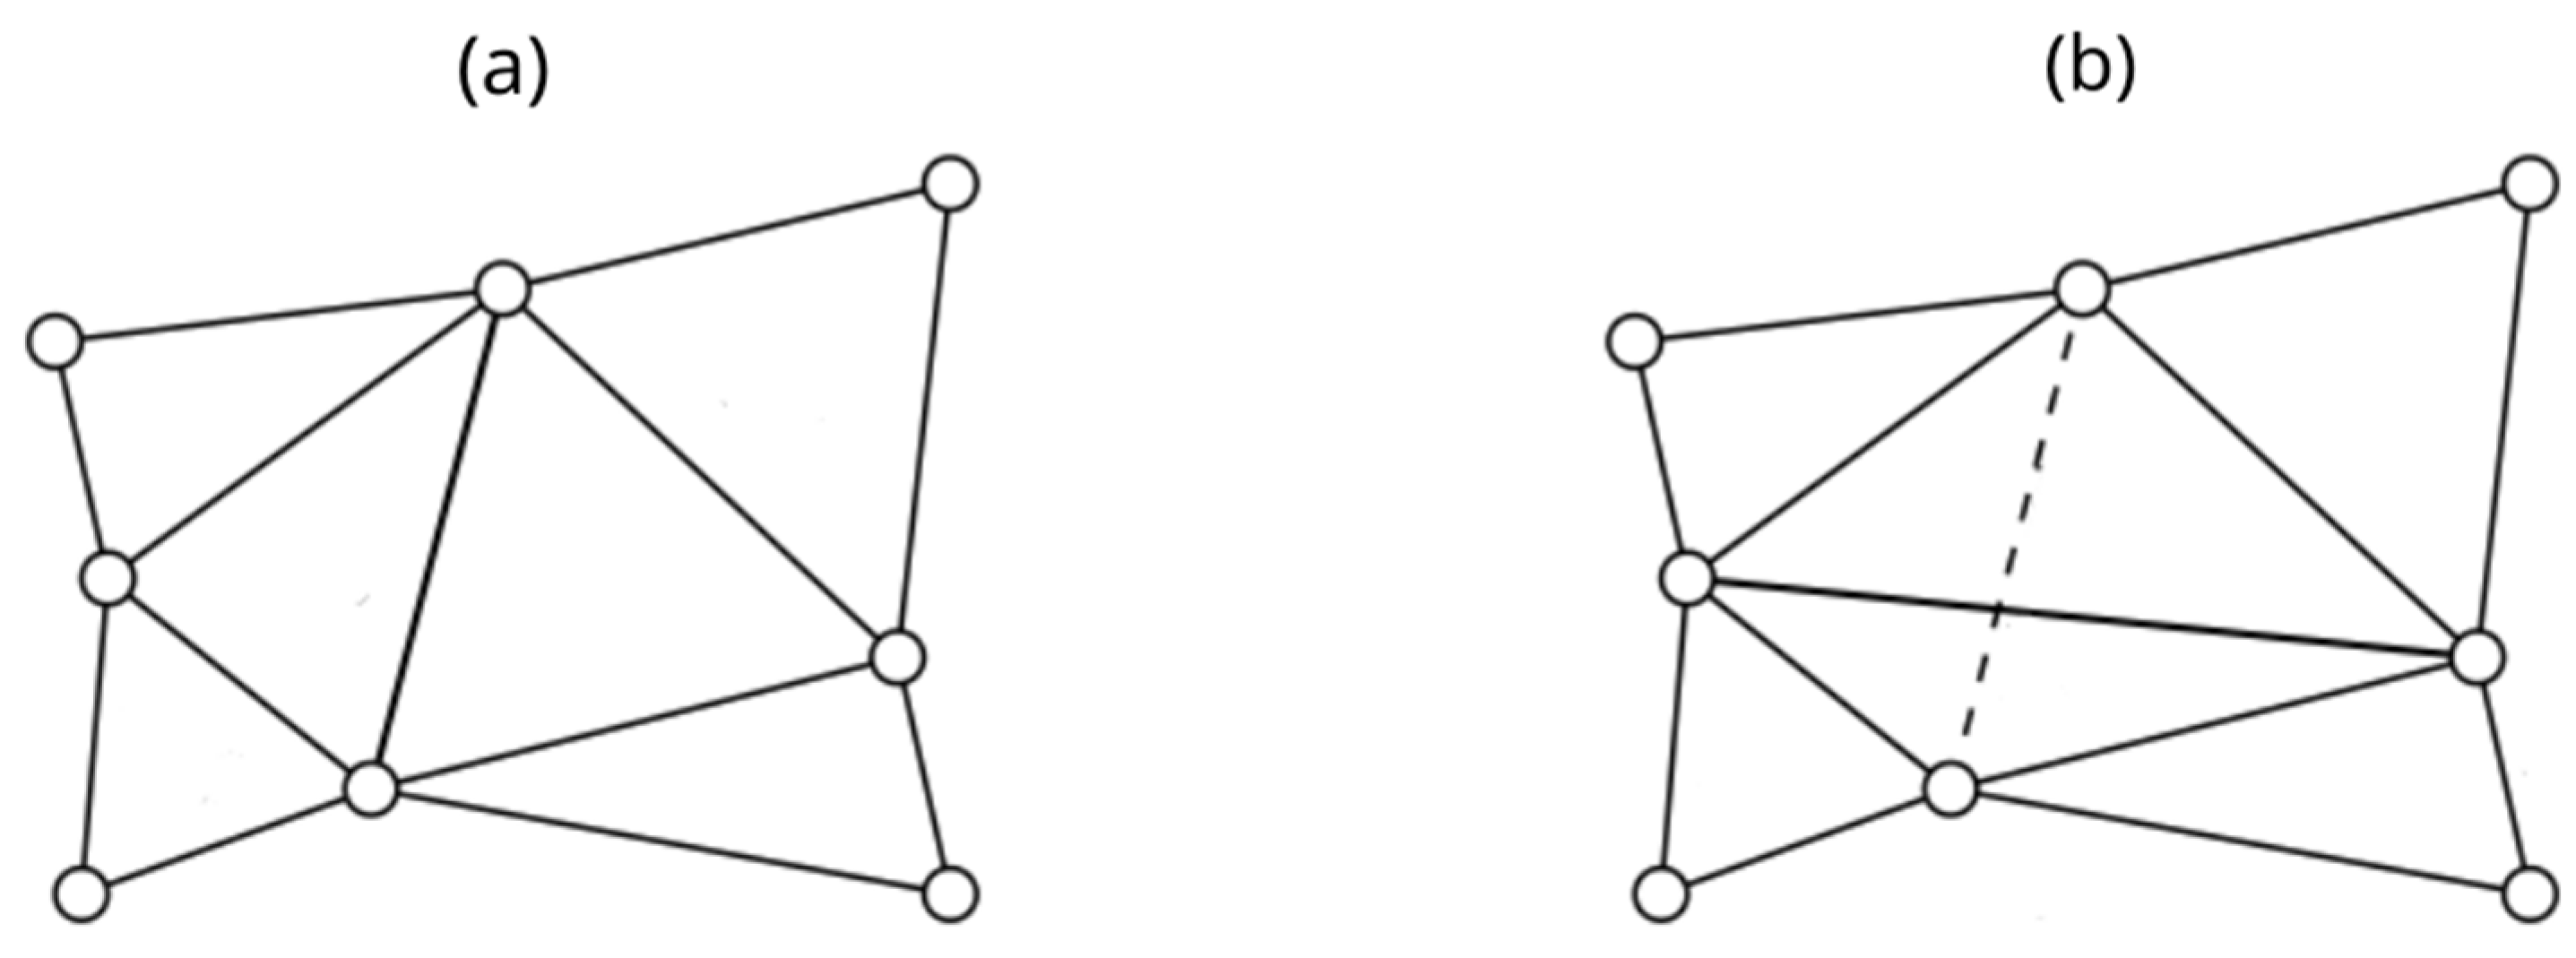
We allowed thermally excited 3D random vertex moves and bond flips among nearby vertices, which allowed the system to use rich thermal equilibrium configuration for given conditions. Note that in this process we do not distinguish between edges’ primary (lipids) and secondary (inclusions) membrane constituents. Each rewiring or bond flip involves four vertices, forming two adjacent triangles, as illustrated in Figure 2. In the initial configuration (a), the two central triangles share a vertical bond. During the flip, this shared bond is removed and a new bond is established between the two previously unconnected vertices, resulting in a horizontal bond connecting them instead (b), where the former bond is shown as a dashed line to indicate its removal. Consequentially, the two original triangles are replaced by two newly created triangles with a different orientation, altering the neighbouring relationships between the four involved vertices and also affecting the triangle neighbours, i.e., the surrounding four triangles that border the flipped region. The probability of accepting a vertex move or bond flip depends on the related energy change of the system. When and > 0, the change is accepted with = 1 and , respectively, where is the Boltzmann constant.
Figure 2.
Schematic picture of a random MC bond rewiring event: (a) before and (b) after rewiring, where the dashed line represents the removed bond.
2.1.3. Membrane Quantitative Measures
We present quantitative impacts using the average mean curvature of membranes , the membranes’ asphericity measure , and the probability distribution of inclusion clusters . Here, is calculated as the spatial and ensemble average of a membrane’s local mean curvature
where and represent principal curvatures of the membrane’s surface patch. The overbar marks the spatial average and <…> the ensemble average.
The parameter quantifies departures from the spherical shape. We obtain it from the gyration tensor [46], which we calculate as
The summation is carried over all discrete points determining the membrane surface that are located by position vectors . The origin of the Cartesian coordinates is set to the centre of mass of the system. The asphericity is defined as [47]
where are eigenvectors of . Key reference values of are as follows:
- (i)
- spherical objects ();
- (ii)
- one-dimensional objects ();
- (iii)
- , 2D axisymmetric discs ( .
Furthermore, we measure the ensemble averaged probability distribution of cluster-like assemblies where we count the number of inclusions in a connected cluster of inclusions.
2.1.4. Simulation Parameters
In simulations, we set N = 3127, comparable to the thermal energy, where K mimics “room” temperature, the ensemble averages were taken over 10 different MC runs, and the intrinsic curvature of inclusions is set to
2.2. Mesoscopic Model
An in-plane order in membranes exhibiting spherical topology inevitably generates TDs, which introduce additional inhomogeneities in the membrane patterns. Furthermore, TDs in general strongly interact with membrane inclusions. We illustrate the universal impact of TDs in the case of nematic () order realised in thermotropic liquid crystals [29]. Namely, in NLCs, universal physics of TDs could be relatively easily experimentally tested and observed [24].
We use a minimal 2D mesoscopic model in which we describe the membrane nematic order and membrane local curvature with the nematic tensor order parameter and the curvature tensor respectively. These are expressed as [21]
The quantity is the orientational order parameter, is the nematic director field [7], indicating the direction of a local in-plane ordering where states are physically equivalent (the so-called head-to tail invariance corresponding to p = 2), , stands for the local membrane normal, and unit vectors {} determine a local principal curvature frame characterised by principal curvatures {}. The resulting local Gaussian curvature reads
2.2.1. Free Energy
We express the total free energy density per membrane area as [44] , where is given by Equation (2) and we set . The condensation term
enforces condensation of the nematic orientational order below the critical temperature . The latter determines the second-order phase transition in a bulk flat system. The quantities are positive phenomenological constants which define the equilibrium degree of bulk order below .
We express the elastic contribution as
This term enforces a spatially homogeneous orientational order in the single elastic approximation, where stand for representative positive elastic constants and marks the surface gradient operator [21].
2.2.2. Membrane Shapes
In our mesoscopic simulations, we considered closed axisymmetric two-dimensional membranes exhibiting spherical topology. A membrane analysed is assumed to be a surface of the revolution with rotational symmetry about the z-axis within the Cartesian system defined by the unit vectors (, ). These shapes are constructed by the rotation of the profile curve about the axis by an angle of . Position vectors determining axisymmetric surface are given by [44]
Coordinates and determine the membrane profile, where represents the arc length of the profile curve. On the surface of the revolution, parallels and meridians are lines of principal curvature.
2.2.3. Scaling
We scale the tensor order parameter with respect to the bulk equilibrium order parameter. The curvature tensor and spatial coordinates are scaled in units of
This length equals the radius of a spherically shaped membrane whose surface area is the same as the surface area of a membrane which we analyse. An additional important length included in the system is the nematic order parameter correlation length. We express it in the nematic phase as
Using the scaled quantities , , , we obtain the following expression for the dimensionless free energy density
For a given membrane shape, we calculate the order parameter profile by minimising the free energy of the system.
3. Results
In this section, we analyse different common mechanisms giving rise to spatial inhomogeneities in biological membranes. In Section 3.1, we analyse the impact of inherent inclusions’ curvature on membrane shapes using the MC approach presented in Section 2.1. In these simulations, we do not consider any in-plane order. In Section 3.2, we use the mesoscopic approach introduced in Section 2.2 and present various mechanisms that are activated in the presence of an in-plane membrane order.
3.1. Curvature-Enabled Inhomogeneities
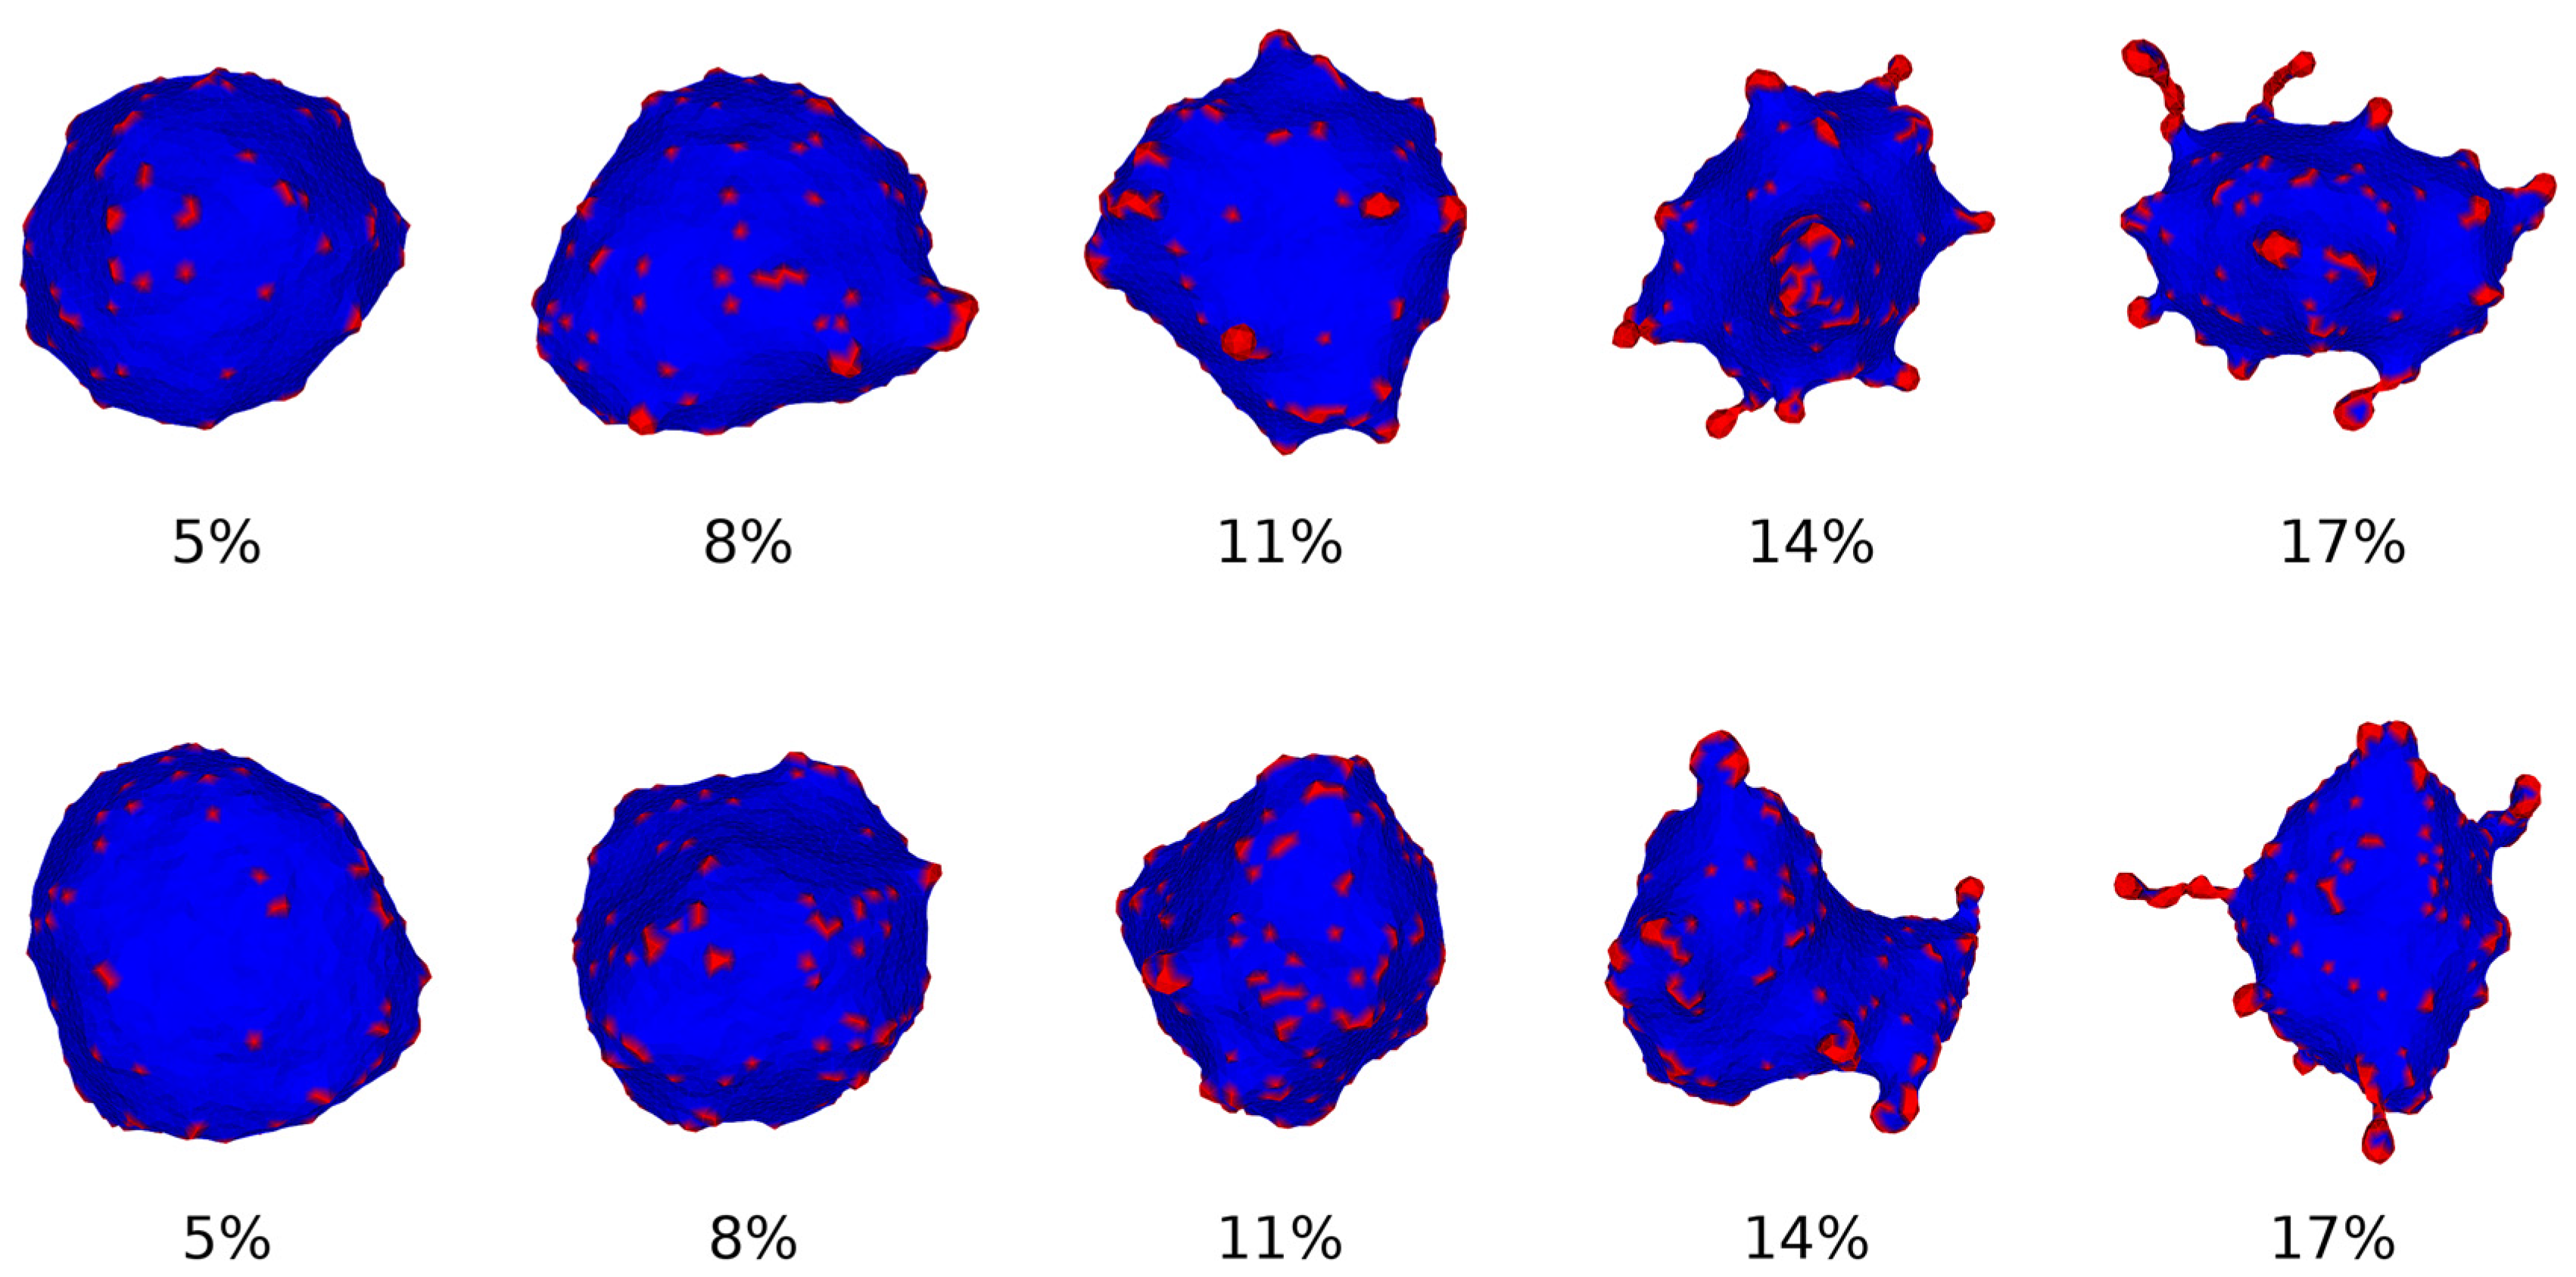
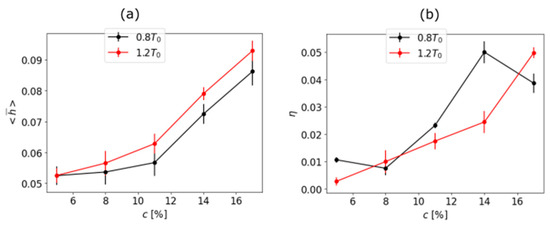
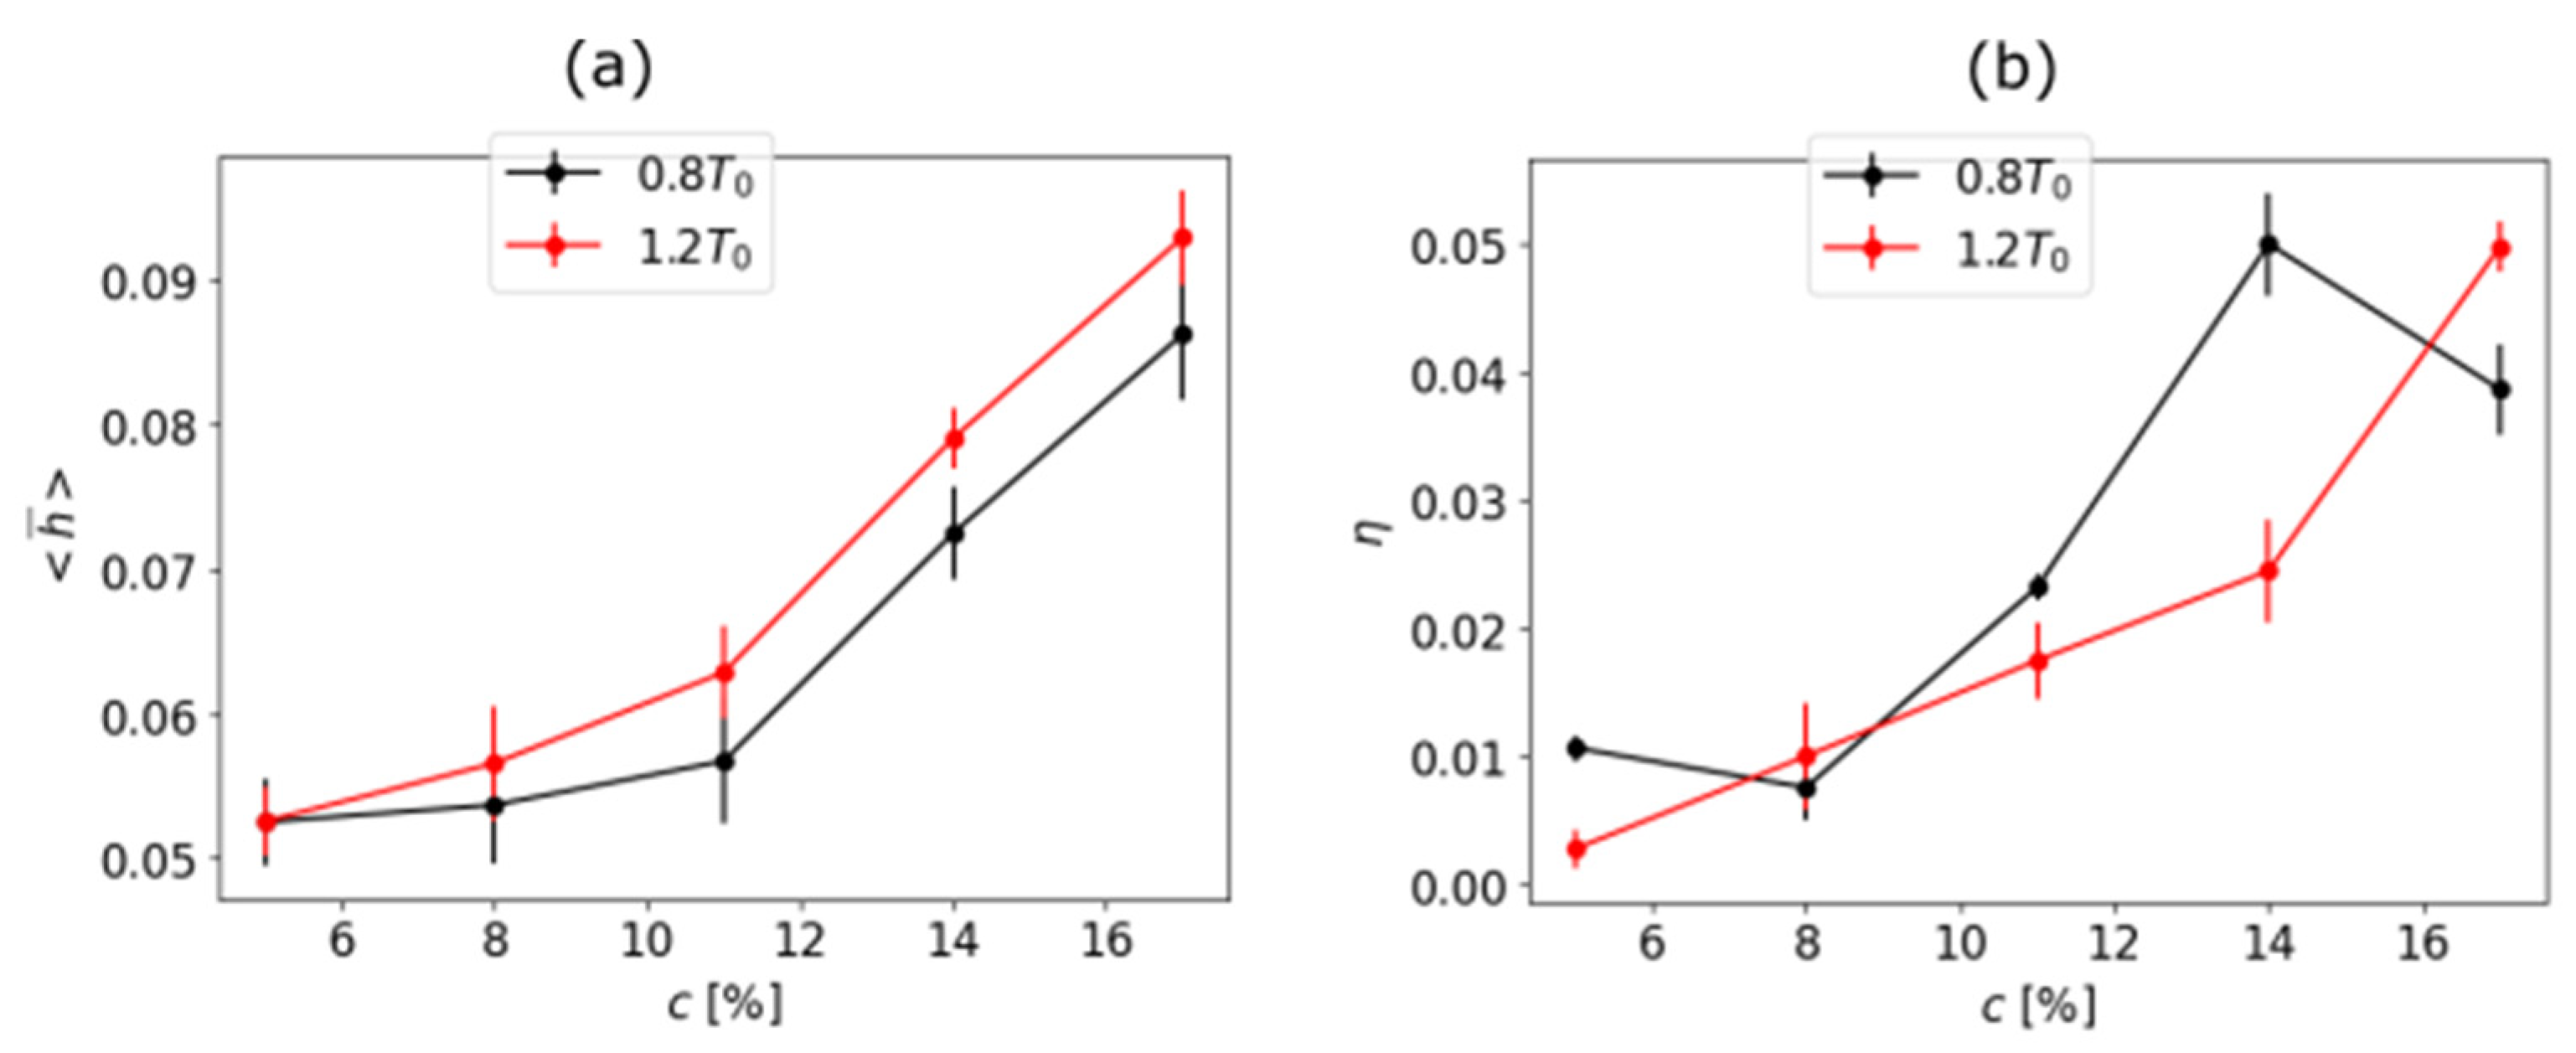
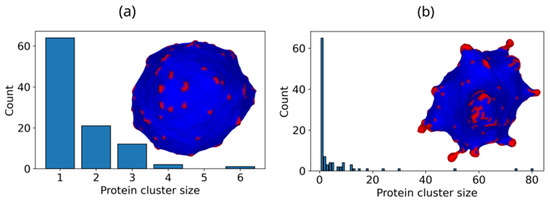
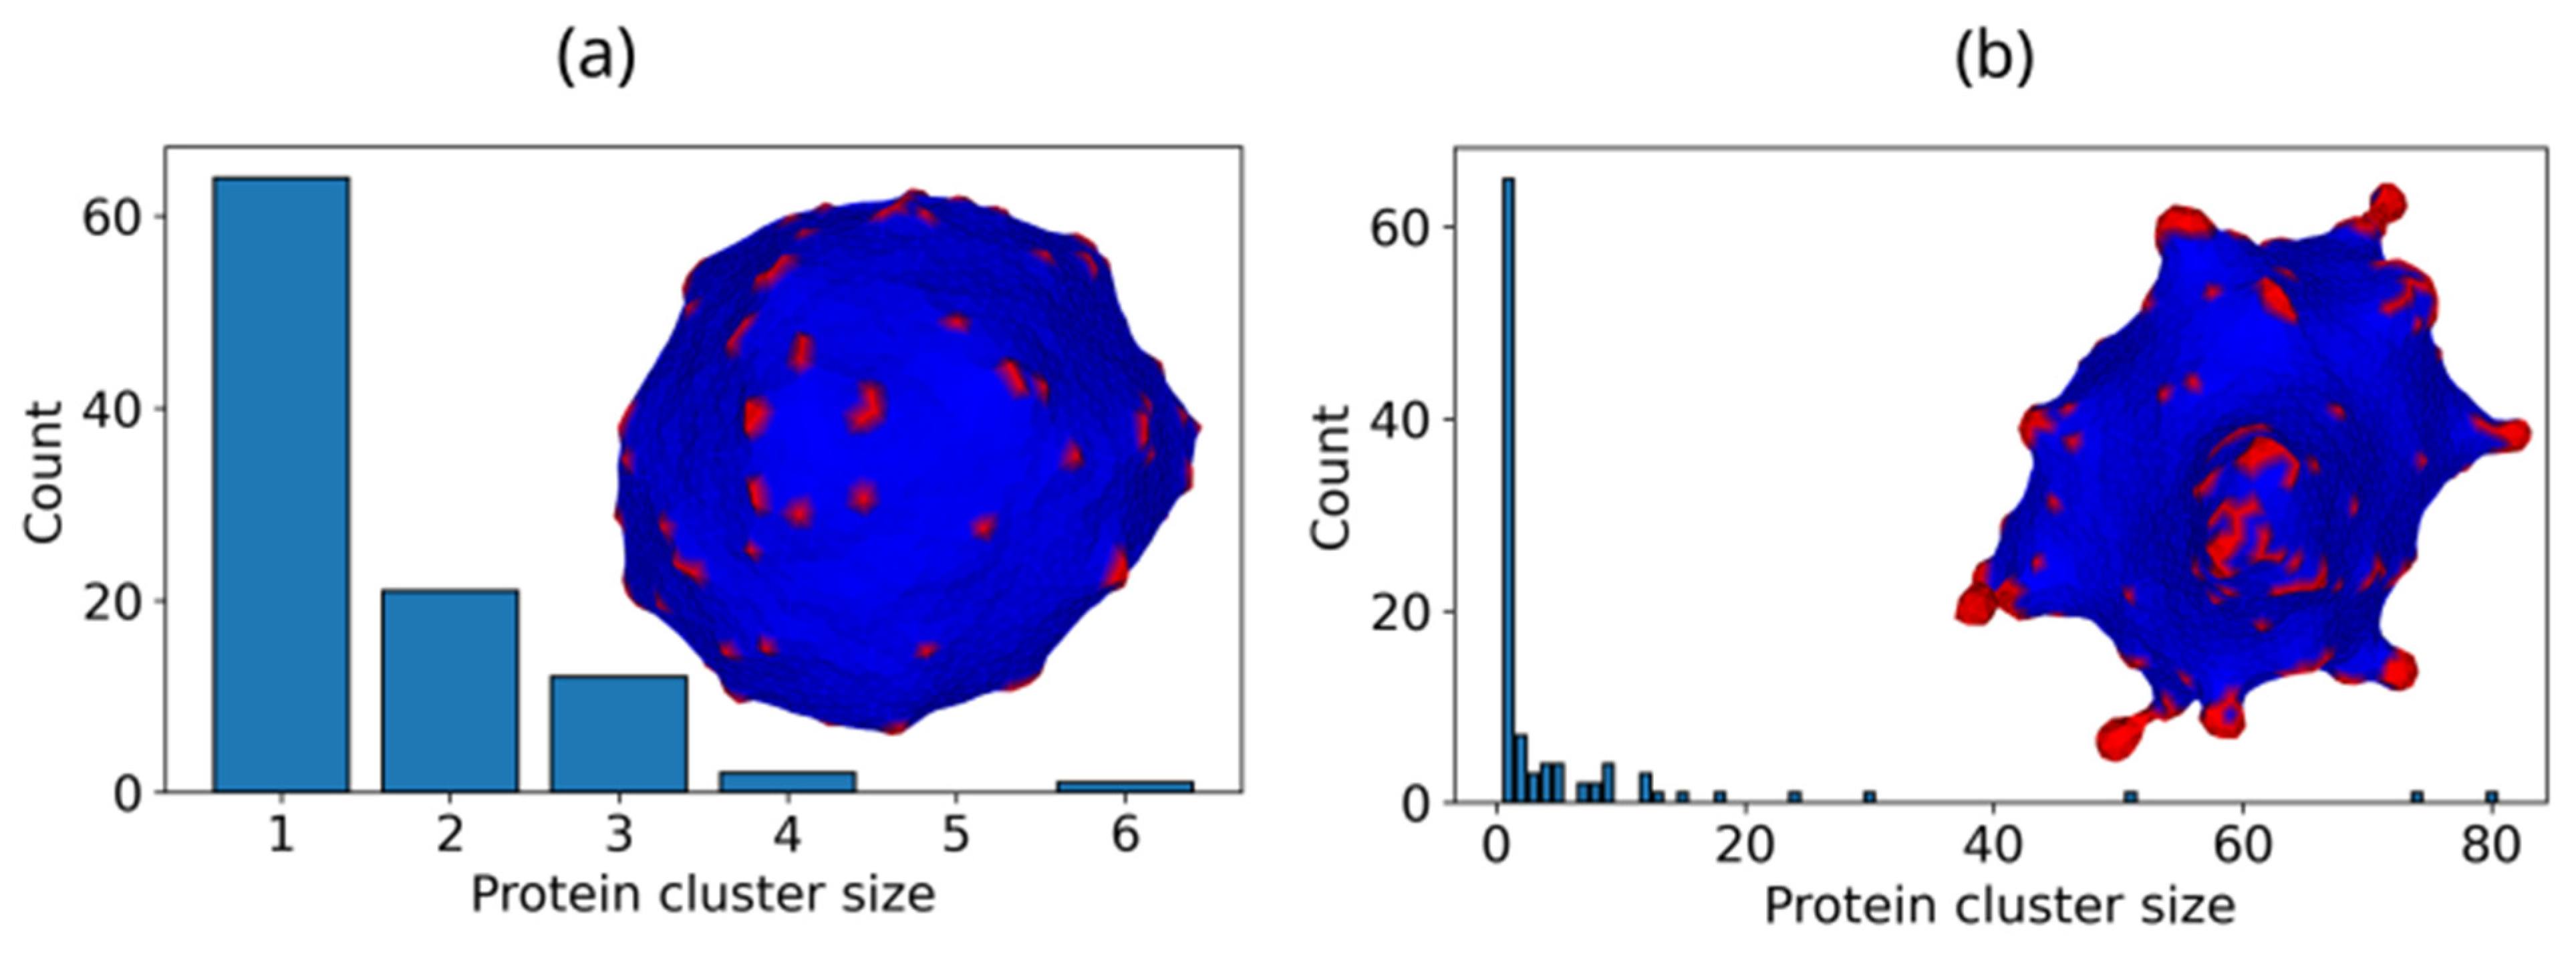
We focused on the impact of increasing the concentration c of inclusions and monitored the macroscopic changes. Membrane configurations were obtained using MC simulations. Some representative membrane patterns are shown in Figure 3. One can see that for relatively low concentrations, the shapes are essentially spherical. In these structures, inclusions have roughly spatially homogeneous grouping. On increasing c, inclusions begin to form assemblies, and the membrane shapes progressively depart from the spherical geometry (e.g., structures shown for in Figure 3). Furthermore, assemblies of inclusions begin to form necklace-like filaments (see structures at c = 0.17 in Figure 3). Related variations in quantitative measures are plotted in Figure 4 and Figure 5. In Figure 4a, we plot the average curvature of membranes on increasing c. One can see progressively increasing values of where steeper responses are observed above Accompanying changes in asphericity are plotted in Figure 4b. The general trend of changes suggests a gradual increasing of asphericity. A better indicator of qualitative changes on varying c is the distribution probability of the inclusions’ cluster sizes, as illustrated in Figure 5. In membrane configurations where necklace-like filaments are absent, the distributions exhibit peaks until relatively low cluster sizes (below 10, see Figure 5a). On the other hand, when branching is pronounced, the distributions extend for far broader intervals (e.g., contributions extend until 80 in Figure 5b). Our simulations are in rough agreement with the linear instability analysis [6,48]. The latter suggests that branching instability appears when the condition
is fulfilled. Here, stands for the critical temperature below which budding is expected. The latter arises only if the direct interactions between nearby inclusions favour their assembling.
Figure 3.
Characteristic membrane shapes on increasing c. Upper panel:, bottom panel: Blue and red colours mark membranes (lipids) and inclusions (e.g., proteins), respectively. The membrane is modelled as a 2D triangulated network of vertices; inclusions carry a nonzero intrinsic curvature , while lipids have no curvature. At low inclusion concentrations (), the membrane remains nearly spherical, with inclusions distributed roughly homogeneously. Above a critical concentration, budding appears: inclusions aggregate into assemblies that progressively deform the membrane, eventually forming necklace-like filamentous protrusions visible at c = 0.17.
Figure 4.
Variation in characteristic membrane parameters on increasing inclusion concentration c: (a) time average curvature of the membrane and (b) time average vesicle asymmetry at temperatures and ; that is, below and above budding temperature, respectively. The mean curvature is found from the spatial and ensemble averages of the local principal curvatures, while the aphericity is derived from the eigenvalues of the gyration tensor ( for a perfect sphere, for a rod-like shape). Both metrics show a progressive departure from spherical geometry, with a steeper response appearing at higher concentrations.
Figure 5.
Distributions of clustering inclusions . Qualitatively different states are plotted with inclusions (depicted in red) on a neutral membrane shown in blue. (a) c = 5%, (b) c = 14%, The histograms count the fractions of inclusions belonging to connected clusters of size (groups of inclusions mutually separated by less than the interaction range ρ0). In (a), at low concentration and above the critical temperature, clusters are small (sizes below 10), indicating dispersed inclusions and a near-spherical membrane shape. In (b), at higher concentrations, the distribution extends to cluster sizes up to 80, reflecting the formation of large inclusion assemblies and the necklace-like membrane protrusions. This qualitative change is consistent with the budding instability condition (Equation (16)).
3.2. Presence of p-atic Order
A much more complex pattern of inhomogeneities is observed if some kind of membrane in-plane order is present and described by a relevant p-atic order parameter field. In many cases, such an order condensates either via discontinuous or continuous phase transition on lowering temperature. Specifically, the evolutionary proximity of phase transitions is advantageous because systems in this regime are more responsive to different stimuli.
To illustrate this, we use a minimal mesoscopic model. In the presence of inclusions of concentration c, the relevant average total free energy density of the system in the diluted regime (c ≪ 1) reads as follows [49,50,51,52]:
Here, determines the spatially averaged membrane free energy density contribution, the second term is the so-called Flory–Huggins term, and the third is the entropy mixing contribution. In common systems, the Flory–Huggins parameter is positive and triggers phase separation if it exceeds the critical value . Let us suppose that , so that phase separation does not appear in the absence of orientational order. Suppose that the temperature is decreased just below the critical temperature , where the quadratic contribution in the condensation free energy prevails, i.e.,
Here, stands for the spatially averaged value of the relevant amplitude order parameter field and marks the temperature where the quadratic contribution in the condensation free energy contribution becomes negative (in the minimal model presented in Section 2.2. it holds at ). In general, is lower with c (because in diluted systems the average interaction between the primary membrane constituents is decreased). In the diluted regime, minimal models suggest that [52], where and are independent of c. Consequently, the condensation term exhibits a Flory–Huggins-type structure, yielding the effective Flory–Huggins interaction [53].
If , the condensation of the orientational order could trigger phase separation.
Furthermore, a condensated in-plane order in general unavoidably introduces topological defects (TDs) into membranes which could serve as attractors for the membrane-embedded inclusions. The total topological charge of a closed membrane exhibiting in-plane order is determined by Gauss–Bonnet and Poincare–Hopf theorems [26,27]:
Here, stands for the Euler characteristics of a closed surface, is the Gaussian curvature of a local surface patch of area dA, and the genus g counts the number of holes within the surface. Therefore, for objects exhibiting spherical topology (g = 0), Consequently, surfaces exhibiting p-ative ordering fields in normal conditions tend to exhibit [30] two, four and twelve TDs for cases p = 1 (polar order, ), (nematic order, ) or p = 6 (hexatic order, ).
However, in general, membranes could host even larger number of TDs in thermal (quasi) equilibrium if they possess strongly curved shapes and/or inclusions. Firstly, regions exhibiting negative could be generators of additional TDs, where their number and positions can be predicted well by the Effective Topological Charge Cancellation (ETCC) mechanism [21]. According to this, each surface patch of area , characterised by the corresponding spatially average Gaussian curvature , tends to be “effectively topologically neutral”. The latter condition is fulfilled when [21]
where the effectively topological charge is defined as
Here, refers to the total winding number within and stands for the hypothetical curvature-induced charge, defined as
Note that, in Equation (22), is strictly zero if (i.e., the surface patch covers the whole membrane), and in this case, Equation (21) displays the GB-PH theorems. Equation (23) suggests that surface patches exhibiting () act as a “smeared” curvature-induced [34] negative (positive) charge, which tends to be compensated by a “real” topological charge.
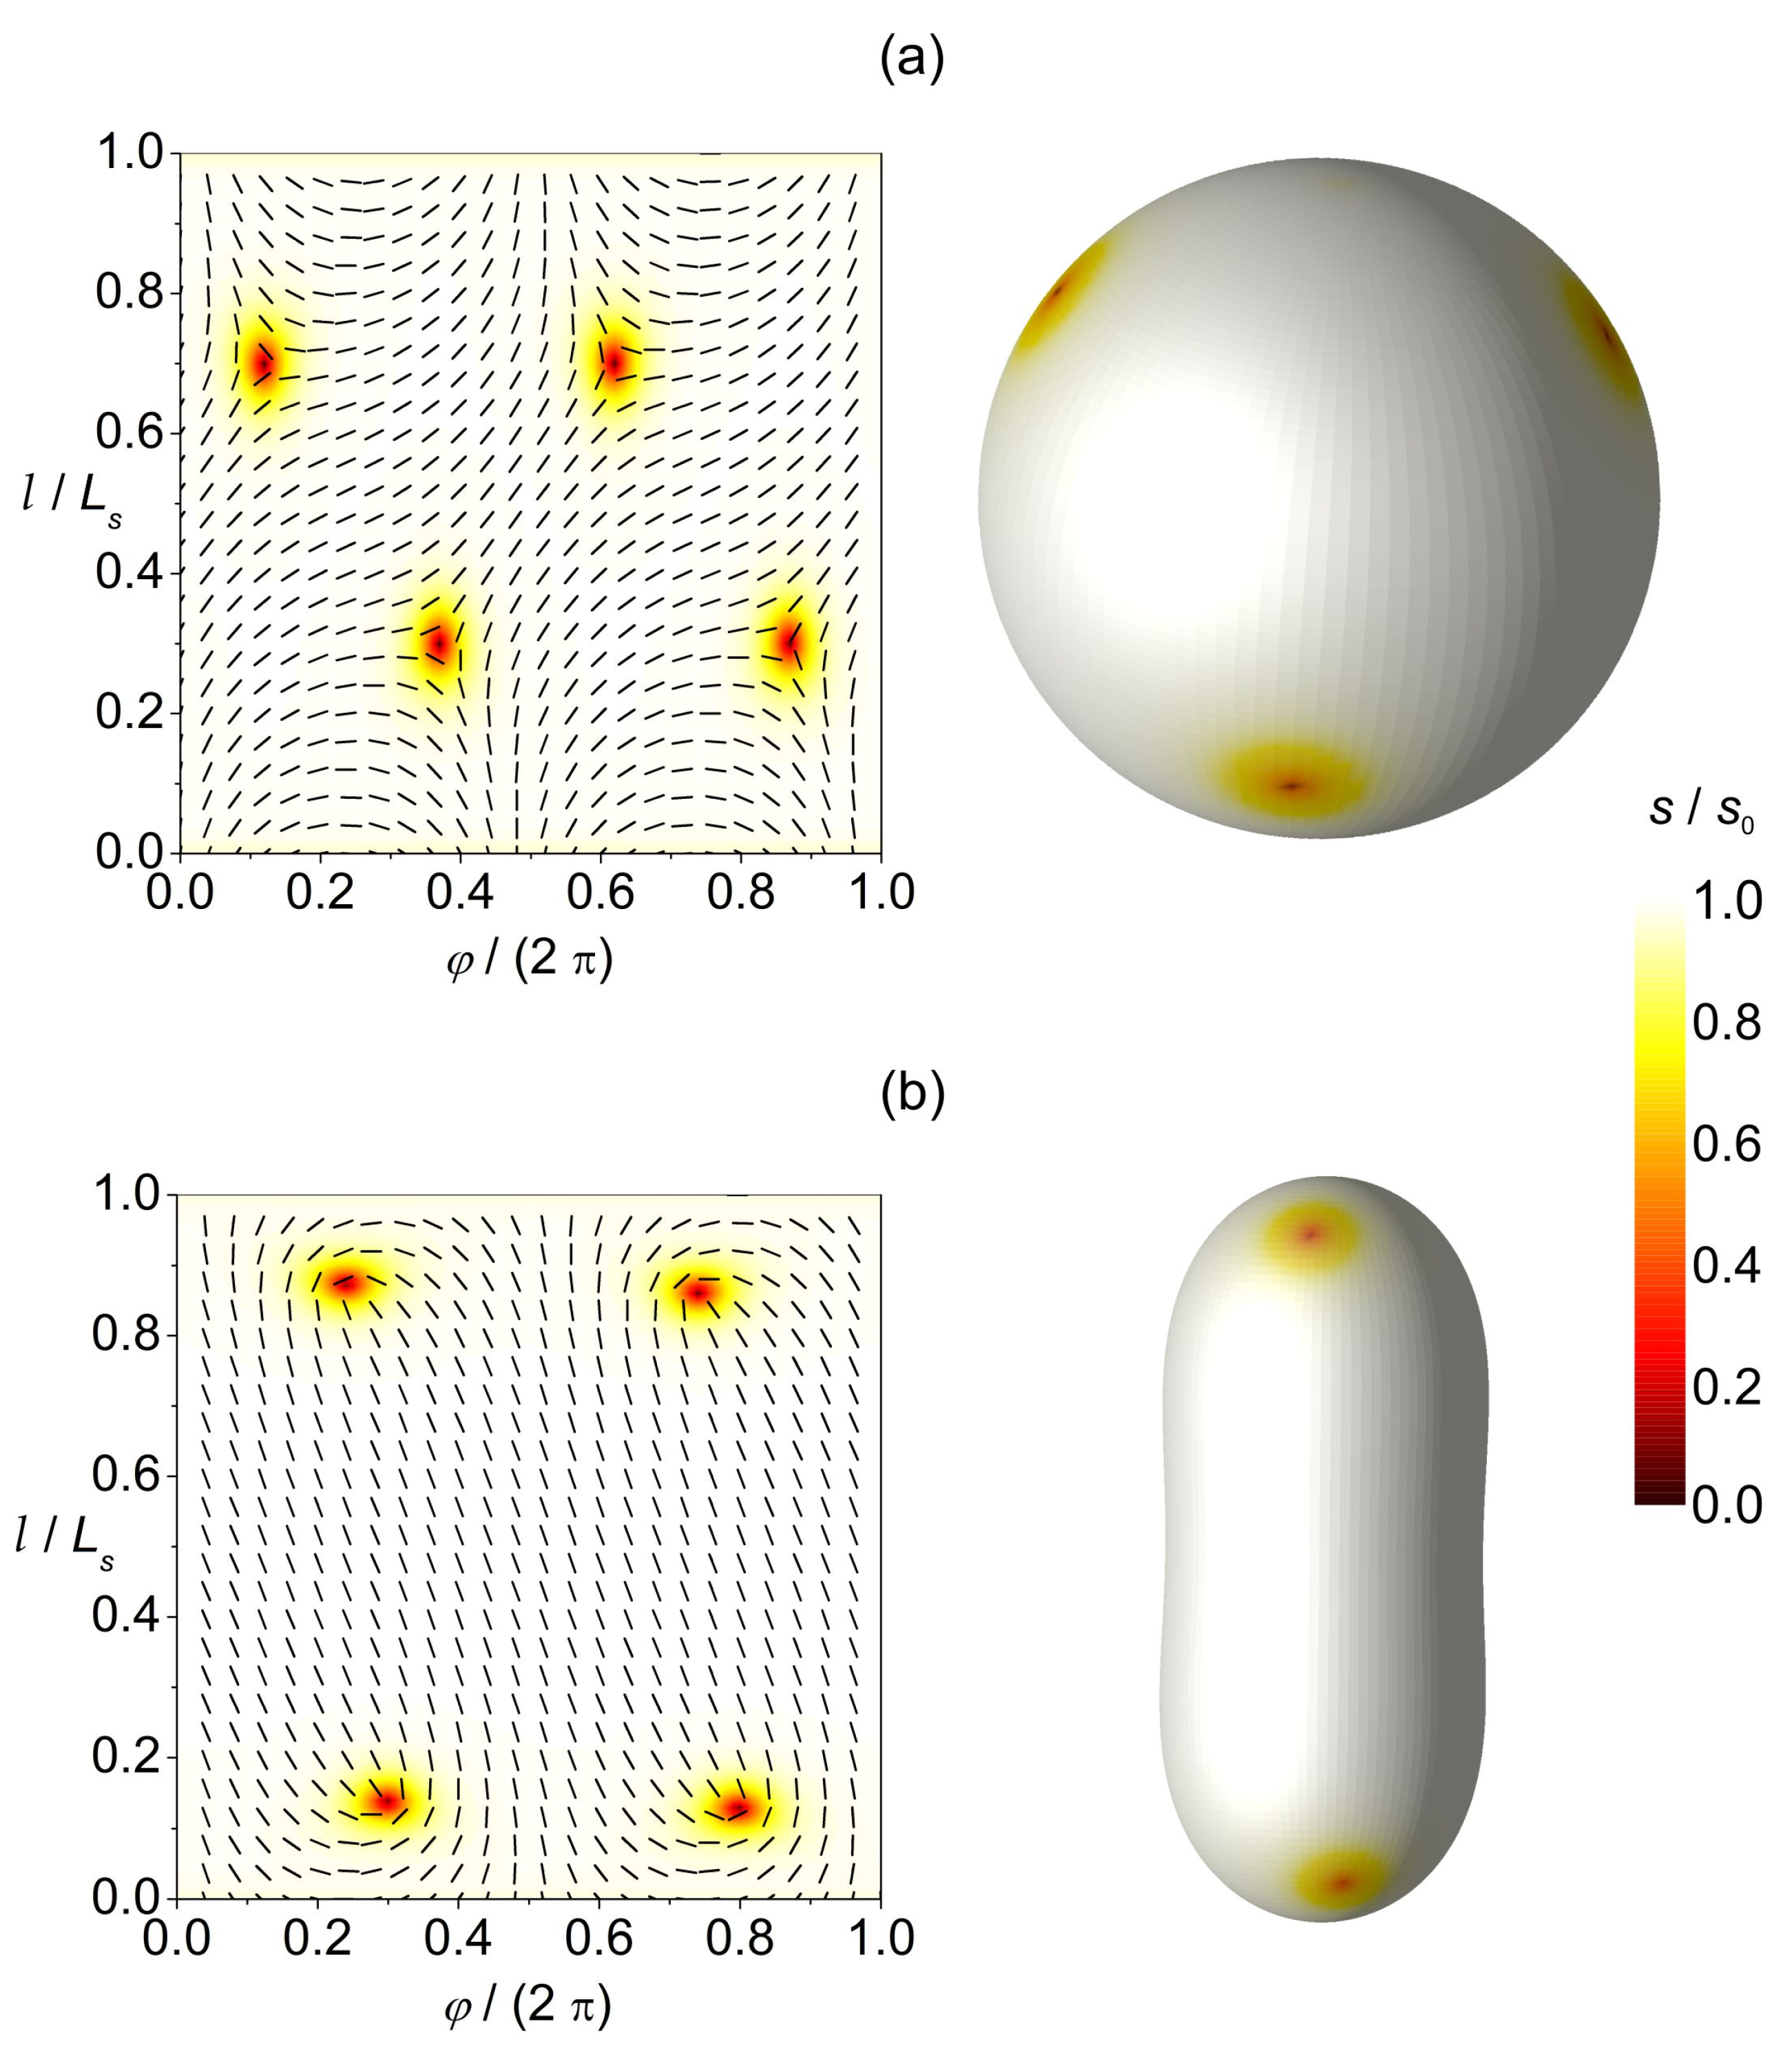
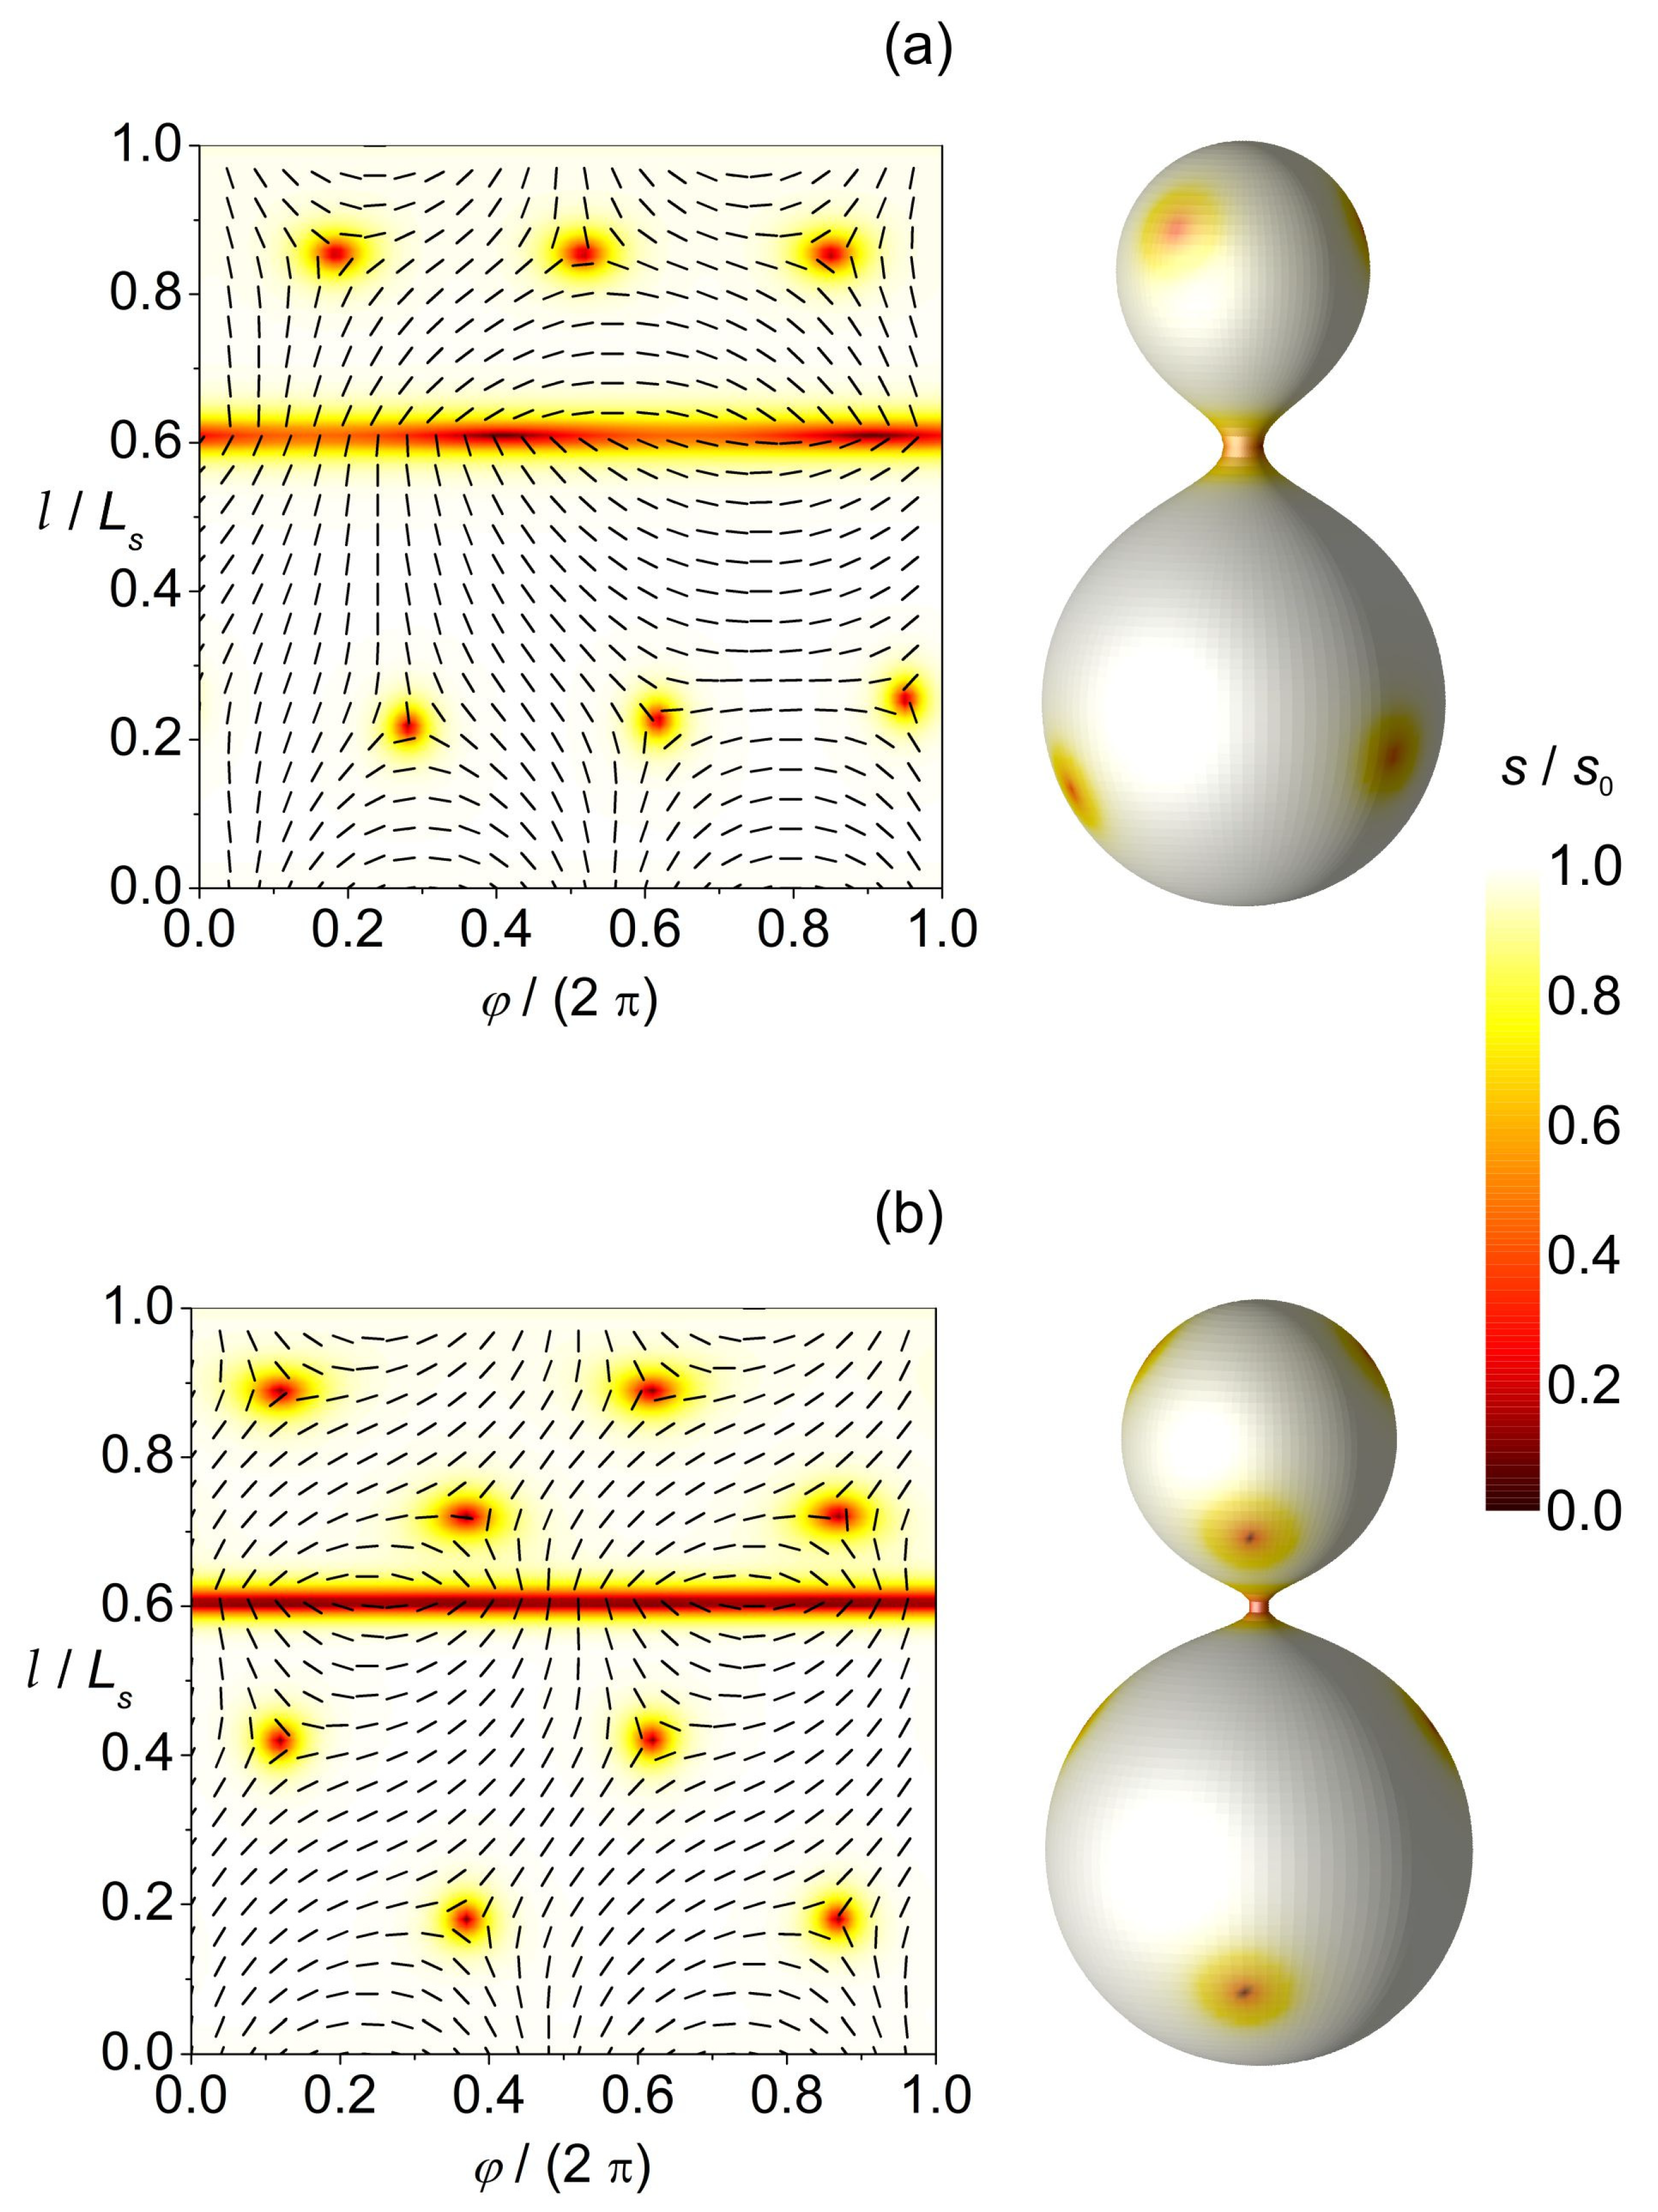
In Figure 6 and Figure 7, we illustrate the ETCC-predicting power for the nematic order. In this case, and .
Figure 6.
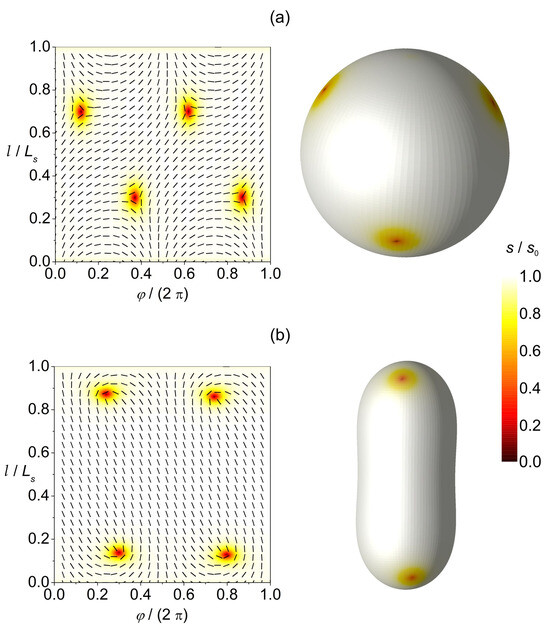
TDs within membranes exhibiting nematic order. In the left panels, we depict the director field and superimposed amplitude of order within the {} plane ( determines the length of the profile shape curve). The left panel illustrates membrane shapes with the corresponding order parameter amplitude profiles. (a) Spherical and (b) prolate shapes hosting four k = 1/2 TDs. The degree of order is marked by different colours where the scale bar is at the right size.
Figure 7.
Additional TDs could be formed if membrane structures possess regions exhibiting a large enough curvature. In thumblike membrane shapes, antidefects are assembled within the necks of the structures, characterised by negative Gaussian curvature. Structures hosting (a) six k = 1/2 and two k = −1/2 TDs; (b) eight k = 1/2 and four k = −1/2 TDs. The degree of order is marked by different colours where the scale bar is at the right size.
In Figure 6a, we plot the configuration in a perfectly spherical membrane. In this case, the smeared curvature charge is negative and spatially homogeneous. The latter is compensated by four k = 1/2 elementary charges which mutually repeal. Consequently, the resulting configuration maximises their mutual separation. In the left side of the picture, we plot the amplitude and phase field within the in-plane surface characterised by relevant scaled variables running in perpendicular directions.
In Figure 6b, the central region exhibits and at the poles of the structure Consequently, TDs are attracted towards the poles.
In Figure 7, we introduce regions exhibiting negative Gaussian curvature whose surface curvature charge tends to be compensated by real TDs. The overall membrane structure is in this case not topologically neutral if only four elementary topological charges (fulfilling the GB-PH theorems) would be present. To achieve neutrality, additional pairs {defect,antidefect} need to be formed [34]. In Figure 7a, we show the case where two {1/2,−1/2} pairs are formed. For a strongly curved neck connecting the two nearly spherical membrane paths, the curvature spatial variations are large enough to form four additional {1/2,−1/2} pairs; see Figure 7b. In this case, both spherical parts exhibiting and the neck area with are topologically neutral. Note that cases shown in Figure 7 illustrate possible origins of TD-driven membrane fission processes; specifically, several TDs are localised at the neck region. Note that the relevant order parameter amplitude is relatively low within the defect cores, suggesting strong fluctuations in the relevant orientational order. This could in turn weaken intermolecular interactions, leading to the rupture of the neck. If the neck is ruptured in the structure shown in Figure 7b, two spherical membranes would be formed, each hosting four k = 1/2 elementary TDs.
4. Conclusions
We illustrate numerically different mechanisms generating spatial inhomogeneities which could enable the assembling of various inclusions within membranes. These could provide nucleation centres to trigger qualitative changes in membrane configurations and related functionalities. We restricted the analysis to membranes exhibiting spherical topologies, which are most often encountered in biological cells.
By means of relatively simple MC simulations, we studied the impact of inclusions possessing intrinsic curvature on membrane shapes. We show that, below a critical temperature, inclusions could form large enough assemblies that can form necklace-like protrusions. Such a qualitative change in behaviour could be observed even in the absence of in-plane membrane order if inclusions possess a finite assembling tendency coupling strength. In the presence of ordering, several additional mechanisms appear that could nucleate membrane shape changes and could open pathways to diverse membrane functional changes. Firstly, order–disorder phase transitions, in which some kind of order is condensated in a symmetry broken phase, are common in biological systems. The proximity of phase transitions enables stronger responses [30] to various perturbations, which could be exploited in biological evolution [44,54]. In the symmetry breaking phase, an additional [53] Flory–Huggins-type contribution in the free energy density appears in common cases. This contribution could trigger phase separations and consequently the formation of regions with higher concentrations of impurities, yielding larger probability of their assembling. This additional contribution is significant if the relevant condensation free energy gain to form order is large enough. Note that this phenomenon is commonly encountered in mixtures of thermotropic liquid crystals [53] (prototypical soft matter representatives) and colloids on nanoparticles on entering the nematic phase while lowering the temperature. In such cases, the kinetic path through which the final state is reached is also important. By varying it quantitatively and even qualitatively, different configurations could be reached. TDs are an additional source of inhomogeneities which could trigger membrane changes. Due to topological reasons, they are present at least in membranes exhibiting spherical topologies, which are the most common. Their minimal number can be determined using the GB-PH theorem and depends on the symmetry of the ordering field. For the topology of a sphere exhibiting a p-atic order, 4, 8 and 12 TDs are expected for , respectively, if equilibrium profiles are established. Furthermore, we illustrated that a high enough local curvature could generate additional TDs by forming {defect–antidefect} pairs.
Our illustrations above were based on free energy minimization. However, membrane order is expected to be highly susceptible to various perturbations, which might give rise to metastable configurations. This could be due to an effective 2D membrane order (i.e., in 3D systems, constituents are coupled strongly because they have more first-order neighbours). Furthermore, if the order is established via a continuous symmetry-breaking phase transition, then such a system will exhibit easily excitable Goldstone modes [30]. Due to these, according to the Imry-Ma theorem, even infinitesimally weak random-type disorder can destroy the long-range order anticipated in the absence of disorder. The resulting configuration is expected to consist of domain-type patterns of characteristic length [55], where measures the disorder strength and d stands for the space dimensionality. Note that other studies [56,57,58,59] have revealed that the applicability of this argument to real systems is questionable; however, it nevertheless identifies the strong susceptibility of such systems to static disorder. The latter is definitely present in real membranes, owing to the diversity of membrane constituents. Note that domains and TDs are mutually related. Indeed, the typical domain growth observed in fast enough order–disorder quenches [60,61,62,63,64] is realised via the annihilation of defects and antidefects. If strong enough disorder is present, some annihilations could be prevented, stabilising structures with larger numbers of TDs with respect to simple GB-PH topological prediction. In addition, high enough local curvatures could generate additional pairs {defect,antidefect} to enable local topological neutrality. High curvatures are often formed in membranes since biological membranes can in general be exposed to strongly varying conditions [44,65] (e.g., erythrocytes travelling through fractal-like blood circulatory system, division and budding of cells, etc.).
Studies in membranes might also be of interest for other branches of physics. For example, it might be that physical fields represent the fundamental natural entity in which “particles” emerge as topologically stable field excitations [66,67,68,69,70]. In these phenomena, curvature [25,26,27] plays the central role. Biological membranes represent a relatively easily experimentally accessible system in which basic features related to curvature can be controlled and systematically analysed in detail to understand basic generic mechanisms.
Author Contributions
Conceptualization, S.K. and S.P.; methodology, S.P., S.K. and A.I.; writing, S.P.; research, S.P. and L.M., visualisation, S.P. and L.M.; supervision, S.K., A.I. and V.K.-I. All authors have read and agreed to the published version of the manuscript.
Funding
This research was funded by Slovenian Research Agency grants P1-0099, P2-0232, J3-60063 and P3-0388, the European Union’s Horizon 2020 Research and Innovation Programme under the Marie Skłodowska–Curie Staff Exchange project “FarmEVs” (grant agreement no. 101131175) and EU COST Action “European Curvature and Biology Network (EuroCurvoBioNet)”, No. COST-CA22153. The views and opinions expressed in this publication are solely those of the authors and do not necessarily reflect those of the European Union. Neither the European Union nor the granting authority can be held responsible.
Data Availability Statement
The original contributions presented in the study are included in the article; further inquiries can be directed to the corresponding authors.
Conflicts of Interest
The authors declare no conflicts of interest.
Appendix A. Curvature Beyond the Mean and Gauss Curvatures
Cell shapes depend on the intrinsic shape and elastic constants of membrane constituents and their interactions, including interactions with the membrane skeleton and cytoskeleton [71]. It has been shown that a non-homogeneous lateral distribution and lateral phase separation of membrane constituents in a multi-component membrane may be a driving force of cell shape transformation [72,73,74,75,76]. The shapes of membrane constituents (lipids and inclusions and the nanodomains they form) are generally anisotropic (Figure A1). Therefore, the membrane energy and its global and local shape also depend on the orientational ordering of anisotropic constituents and deviatoric bending, especially in the highly curved membrane regions [8,74,77,78,79,80,81,82,83,84,85,86].
Figure A1.
Example of two anisotropic intrinsic shapes of flexible membrane nanodomains. (a) An arc-shaped (banana-like) nanodomain with and (). (b) A saddle-like nanodomain with ().
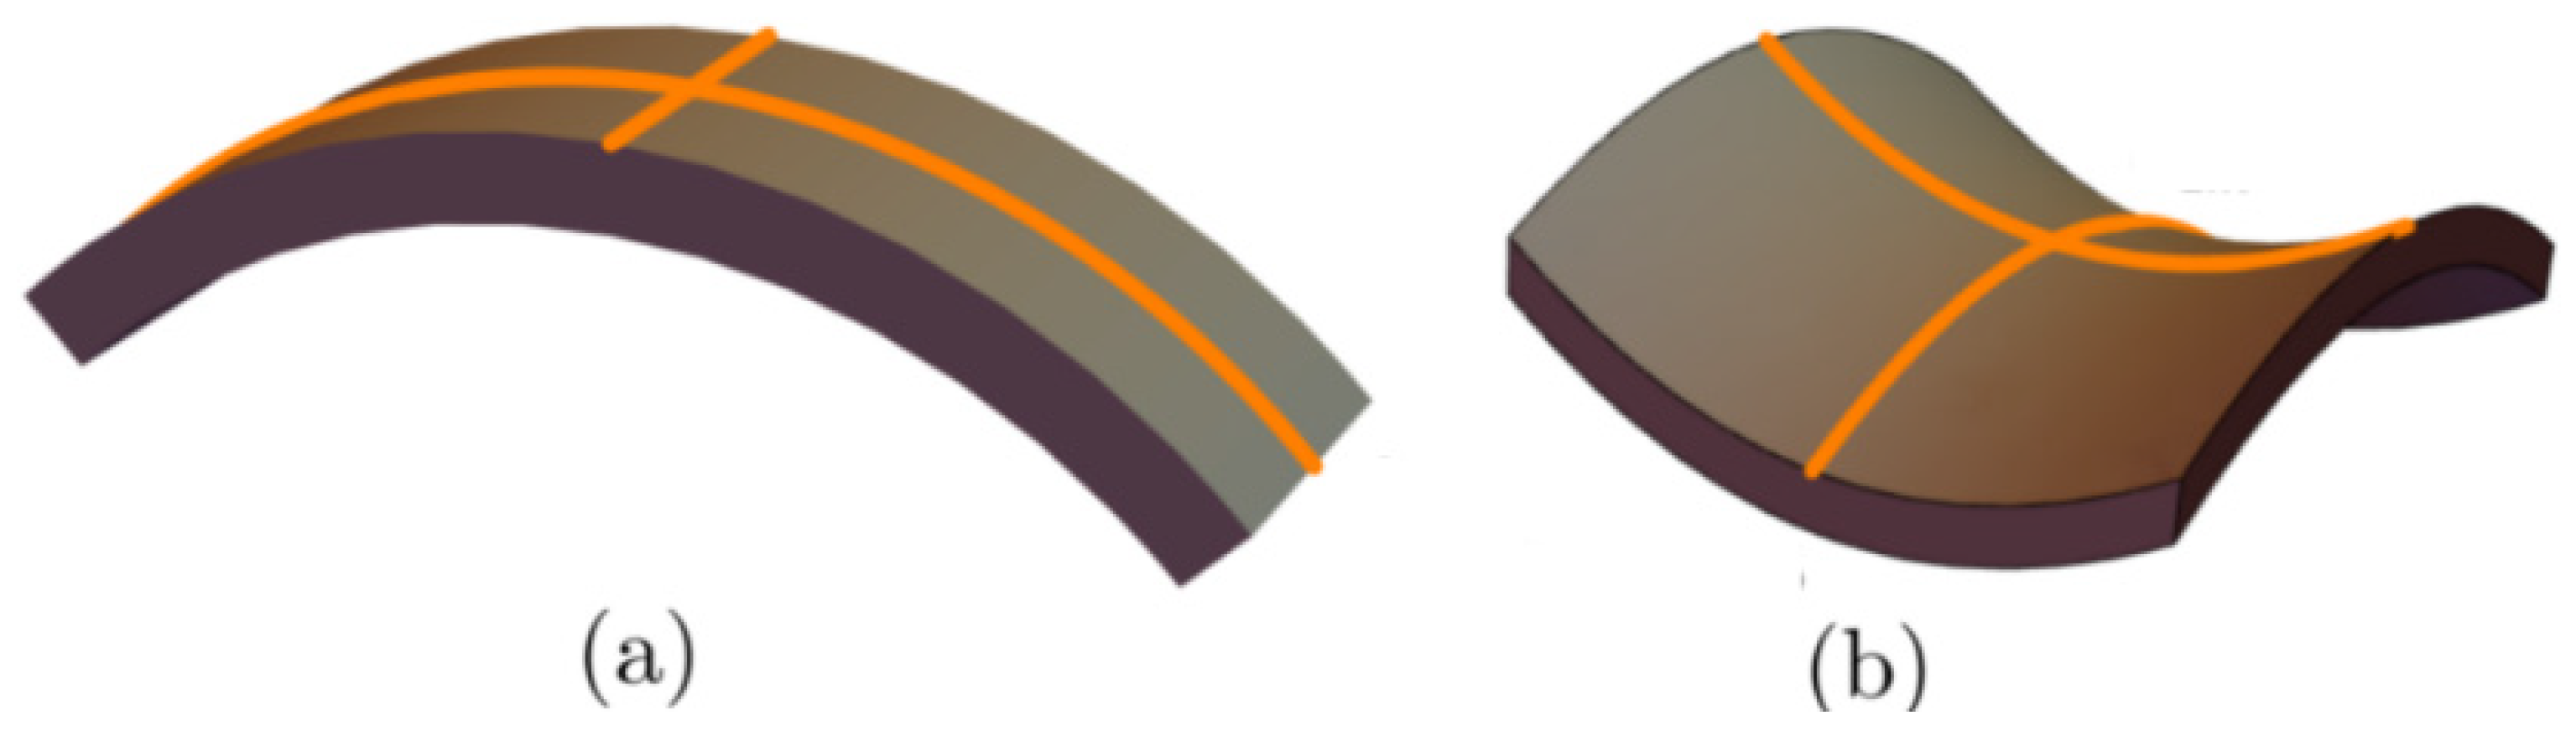
For an anisotropic membrane, the impact of curvature is within the theory of deviatoric elasticity described by the mean curvature and the curvature deviator [8,74,77,78,79], where is the Gaussian curvature, and are the two principal curvatures, and and are the two intrinsic principal curvatures describing the intrinsic shape of the membrane nanodomain (see Figure A1). We define the intrinsic mean curvature and the intrinsic curvature deviator as . Curvatures and are the 1st- order invariants, while the Gaussian curvature is the 2nd-order invariant of the curvature tensor.
The theoretical framework of deviatoric elasticity is grounded in the derivation of the membrane-bending energy of the anisotropic membrane nanodomain [87,88,89]. The model assumes that the elastic energy of a single membrane nanodomain is the lowest when the principal curvatures at that location with the principal curvatures and align with the intrinsic curvatures of nanodomains and . The local membrane curvature can be quantified by comparing the orientations of the local membrane curvature tensor and the intrinsic curvature tensor of the membrane nanodomain at this location. In their local frames, they are expressed as
These two tensors, describing the local directions of the membrane and the nanodomain principal curvatures, respectively, can generally be rotated relative to each other by an angle in the tangent plane at the given point on the membrane. The corresponding mismatch tensor is given by , where is the rotation matrix that quantifies the angular disparity [87,88]:
The membrane nanodomain reorients in the tangent plane by radians to match the membrane curvature and minimise energy, reflecting the energetic cost of deformation. The approximate elastic energy is expressed as a series expansion in the independent invariants of the mismatch tensor . Using the trace and determinant of as invariants yields the following expression [87,88]:
where the integration is carried across the closed membrane surface and {} are material dependent elastic constants. In the case of the vesicle membrane composed only of one type of membrane nanodomain, we find the following [8,74,79,88]:
Note that the energy associated with the deviatoric term [8,74,79,80,82] refers to the extrinsic curvature term [90,91].
In the case of an isotropic membrane, where , the expression Equation (A4) transforms into the well-known expression for Canham–Helfrich–Evans bending energy density [3,92,93] described by
Here, refers to the spontaneous curvature and and are Helfrich bending and splay moduli, respectively [88].
Appendix B
Appendix B summarises the principal symbols used throughout the paper, together with a brief description and the equation in which each parameter is first defined or most explicitly introduced.
| Symbol | Description | Equation |
| Concentration of inclusions | ||
| Bending (curvature elastic) modulus | Equation (2) | |
| Attractive interaction strength between nearby inclusions | Equation (3) | |
| Elastic (orientational) interaction strength | Equation (11) | |
| Principal curvatures of a local membrane patch | Equation (4) | |
| Intrinsic (spontaneous) curvature of inclusion | Equation (4) | |
| Mean curvature and its ensemble average | Equation (4) | |
| Gaussian curvature | Equation (9) | |
| Asphericity parameter | Equation (6) | |
| Nematic tensor order parameter | Equation (7) | |
| Uniaxial nematic (scalar) order parameter | ||
| Curvature tensor | Equation (8) | |
| Nematic order parameter correlation length | Equation (14) | |
| Critical budding temperature | Equation (16) | |
| Flory–Huggins interaction parameter | Equation (17) | |
| Winding number | ||
| Minimal winding number | ||
| Total winding number | ||
| Effective topological charge | Equation (22) | |
| Curvature-induced charge | Equation (23) |
References
- Gao, H.; Shi, W.; Freund, L.B. Mechanics of Receptor-Mediated Endocytosis. Proc. Natl. Acad. Sci. USA 2005, 102, 9469–9474. [Google Scholar] [CrossRef] [Scilit] [PubMed]
- Alberts, B.; Johnson, A.; Lewis, J.; Raff, M.; Roberts, K.; Walter, P. Molecular Biology of the Cell, 5th ed.; W.W. Norton & Company: New York, NY, USA, 2007. [Google Scholar]
- Helfrich, W. Elastic Properties of Lipid Bilayers: Theory and Possible Experiments. Z. Naturforschung C 1973, 28, 693–703. [Google Scholar] [CrossRef] [Scilit]
- Helfrich, W. Blocked Lipid Exchange in Bilayers and Its Possible Influence on the Shape of Vesicles. Z. Naturforschung C 1974, 29, 510–515. [Google Scholar] [CrossRef] [Scilit] [PubMed]
- Deuling, H.J.; Helfrich, W. Red Blood Cell Shapes as Explained on the Basis of Curvature Elasticity. Biophys. J. 1976, 16, 861–868. [Google Scholar] [CrossRef] [Scilit]
- Fošnarič, M.; Penič, S.; Iglič, A.; Kralj-Iglič, V.; Drab, M.; Gov, N.S. Theoretical Study of Vesicle Shapes Driven by Coupling Curved Proteins and Active Cytoskeletal Forces. Soft Matter 2019, 15, 5319–5330. [Google Scholar] [CrossRef] [Scilit]
- Lubensky, T.C.; Prost, J. Orientational Order and Vesicle Shape. J. Phys. II 1992, 2, 371–382. [Google Scholar] [CrossRef] [Scilit]
- Kralj-Iglič, V.; Heinrich, V.; Svetina, S.; Žekš, B. Free Energy of Closed Membrane with Anisotropic Inclusions. Eur. Phys. J. B 1999, 10, 5–8. [Google Scholar] [CrossRef] [Scilit]
- Happel, L.; Oberschelp, G.; Grudtsyna, V.; Jain, H.P.; Sknepnek, R.; Doostmohammadi, A.; Voigt, A. Quantifying the Shape of Cells-from Minkowski Tensors to p-Atic Order. eLife 2025, 14, RP105680. [Google Scholar] [CrossRef] [Scilit]
- Bowick, M.; Nelson, D.R.; Travesset, A. Curvature-Induced Defect Unbinding in Toroidal Geometries. Phys. Rev. E 2004, 69, 041102. [Google Scholar] [CrossRef] [Scilit]
- Bowick, M.J.; Giomi, L. Two-Dimensional Matter: Order, Curvature and Defects. Adv. Phys. 2009, 58, 449–563. [Google Scholar] [CrossRef] [Scilit]
- Gaeta, G.; Virga, E.G. Octupolar Order in Three Dimensions. Eur. Phys. J. E 2016, 39, 113. [Google Scholar] [CrossRef] [Scilit] [PubMed]
- Saw, T.B.; Doostmohammadi, A.; Nier, V.; Kocgozlu, L.; Thampi, S.; Toyama, Y.; Marcq, P.; Lim, C.T.; Yeomans, J.M.; Ladoux, B. Topological Defects in Epithelia Govern Cell Death and Extrusion. Nature 2017, 544, 212–216. [Google Scholar] [CrossRef] [Scilit] [PubMed]
- Duclos, G.; Erlenkämper, C.; Joanny, J.-F.; Silberzan, P. Topological Defects in Confined Populations of Spindle-Shaped Cells. Nat. Phys. 2017, 13, 58–62. [Google Scholar] [CrossRef] [Scilit]
- Kawaguchi, K.; Kageyama, R.; Sano, M. Topological Defects Control Collective Dynamics in Neural Progenitor Cell Cultures. Nature 2017, 545, 327–331. [Google Scholar] [CrossRef] [Scilit]
- Cislo, D.J.; Yang, F.; Qin, H.; Pavlopoulos, A.; Bowick, M.J.; Streichan, S.J. Active Cell Divisions Generate Fourfold Orientationally Ordered Phase in Living Tissue. Nat. Phys. 2023, 19, 1201–1210. [Google Scholar] [CrossRef] [Scilit] [PubMed]
- Li, Y.-W.; Ciamarra, M.P. Role of Cell Deformability in the Two-Dimensional Melting of Biological Tissues. Phys. Rev. Mater. 2018, 2, 045602. [Google Scholar] [CrossRef] [Scilit]
- Durand, M.; Heu, J. Thermally Driven Order-Disorder Transition in Two-Dimensional Soft Cellular Systems. Phys. Rev. Lett. 2019, 123, 188001. [Google Scholar] [CrossRef] [Scilit]
- Eckert, J.; Ladoux, B.; Mège, R.-M.; Giomi, L.; Schmidt, T. Hexanematic Crossover in Epithelial Monolayers Depends on Cell Adhesion and Cell Density. Nat. Commun. 2023, 14, 5762. [Google Scholar] [CrossRef] [Scilit]
- Armengol-Collado, J.-M.; Carenza, L.N.; Giomi, L. Hydrodynamics and Multiscale Order in Confluent Epithelia. eLife 2024, 13, e86400. [Google Scholar] [CrossRef] [Scilit]
- Mesarec, L.; Góźdź, W.; Iglič, A.; Kralj, S. Effective Topological Charge Cancelation Mechanism. Sci. Rep. 2016, 6, 27117. [Google Scholar] [CrossRef] [Scilit]
- Alert, R.; Trepat, X. Living Cells on the Move. Phys. Today 2021, 74, 30–36. [Google Scholar] [CrossRef] [Scilit]
- Guillamat, P.; Blanch-Mercader, C.; Pernollet, G.; Kruse, K.; Roux, A. Integer Topological Defects Organize Stresses Driving Tissue Morphogenesis. Nat. Mater. 2022, 21, 588–597. [Google Scholar] [CrossRef] [Scilit]
- Tubiana, L.; Alexander, G.P.; Barbensi, A.; Buck, D.; Cartwright, J.H.E.; Chwastyk, M.; Cieplak, M.; Coluzza, I.; Čopar, S.; Craik, D.J.; et al. Topology in Soft and Biological Matter. Phys. Rep. 2024, 1075, 1–137. [Google Scholar] [CrossRef] [Scilit]
- Poincaré, H. Sur les courbes définies par les équations différentielles (IV). J. Mathématiques Pures Appliquées 1886, 2, 151–218. [Google Scholar]
- Carmo, M.P.d. Differential Geometry of Curves and Surfaces; Prentice Hall: Englewood Cliffs, NJ, USA, 1976. [Google Scholar]
- Kamien, R.D. The Geometry of Soft Materials: A Primer. Rev. Mod. Phys. 2002, 74, 953–971. [Google Scholar] [CrossRef] [Scilit]
- Mermin, N.D. The Topological Theory of Defects in Ordered Media. Rev. Mod. Phys. 1979, 51, 591–648. [Google Scholar] [CrossRef] [Scilit]
- Kurik, M.V.; Lavrentovich, O.D. Defects in Liquid Crystals: Homotopy Theory and Experimental Studies. Sov. Phys. Uspekhi 1988, 31, 196–224. [Google Scholar] [CrossRef] [Scilit]
- Kleman, M.; Lavrentovich, O.D. (Eds.) Soft Matter Physics: An Introduction; Springer: New York, NY, USA, 2003. [Google Scholar]
- Lavrentovich, O.D. Topological Defects in Dispersed Words and Worlds around Liquid Crystals, or Liquid Crystal Drops. Liq. Cryst. 1998, 24, 117–126. [Google Scholar] [CrossRef] [Scilit]
- Vitelli, V.; Nelson, D.R. Nematic Textures in Spherical Shells. Phys. Rev. E 2006, 74, 021711. [Google Scholar] [CrossRef] [Scilit]
- Vitelli, V.; Turner, A.M. Anomalous Coupling Between Topological Defects and Curvature. Phys. Rev. Lett. 2004, 93, 215301. [Google Scholar] [CrossRef] [Scilit]
- Turner, A.M.; Vitelli, V.; Nelson, D.R. Vortices on Curved Surfaces. Rev. Mod. Phys. 2010, 82, 1301–1348. [Google Scholar] [CrossRef] [Scilit]
- Karatairi, E.; Rožič, B.; Kutnjak, Z.; Tzitzios, V.; Nounesis, G.; Cordoyiannis, G.; Thoen, J.; Glorieux, C.; Kralj, S. Nanoparticle-Induced Widening of the Temperature Range of Liquid-Crystalline Blue Phases. Phys. Rev. E 2010, 81, 041703. [Google Scholar] [CrossRef] [Scilit]
- Choi, H.; Higuchi, H.; Ogawa, Y.; Kikuchi, H. Polymer-Stabilized Supercooled Blue Phase. Appl. Phys. Lett. 2012, 101, 131904. [Google Scholar] [CrossRef] [Scilit]
- Wang, L.; He, W.; Xiao, X.; Meng, F.; Zhang, Y.; Yang, P.; Wang, L.; Xiao, J.; Yang, H.; Lu, Y. Hysteresis-Free Blue Phase Liquid-Crystal-Stabilized by ZnS Nanoparticles. Small 2012, 8, 2189–2193. [Google Scholar] [CrossRef] [Scilit]
- Poulin, P.; Stark, H.; Lubensky, T.C.; Weitz, D.A. Novel Colloidal Interactions in Anisotropic Fluids. Science 1997, 275, 1770–1773. [Google Scholar] [CrossRef] [Scilit] [PubMed]
- Lubensky, T.C.; Pettey, D.; Currier, N.; Stark, H. Topological Defects and Interactions in Nematic Emulsions. Phys. Rev. E 1998, 57, 610–625. [Google Scholar] [CrossRef] [Scilit]
- Stark, H. Physics of Colloidal Dispersions in Nematic Liquid Crystals. Phys. Rep. 2001, 351, 387–474. [Google Scholar] [CrossRef] [Scilit]
- Pires, D.; Fleury, J.-B.; Galerne, Y. Colloid Particles in the Interaction Field of a Disclination Line in a Nematic Phase. Phys. Rev. Lett. 2007, 98, 247801. [Google Scholar] [CrossRef] [Scilit]
- Wang, X.; Miller, D.S.; Bukusoglu, E.; De Pablo, J.J.; Abbott, N.L. Topological Defects in Liquid Crystals as Templates for Molecular Self-Assembly. Nat. Mater. 2016, 15, 106–112. [Google Scholar] [CrossRef] [Scilit]
- Lin, I.-H.; Miller, D.S.; Bertics, P.J.; Murphy, C.J.; De Pablo, J.J.; Abbott, N.L. Endotoxin-Induced Structural Transformations in Liquid Crystalline Droplets. Science 2011, 332, 1297–1300. [Google Scholar] [CrossRef] [Scilit] [PubMed]
- Mesarec, L.; Góźdź, W.; Iglič, A.; Kralj-Iglič, V.; Virga, E.G.; Kralj, S. Normal Red Blood Cells’ Shape Stabilized by Membrane’s in-Plane Ordering. Sci. Rep. 2019, 9, 19742. [Google Scholar] [CrossRef] [Scilit]
- Fošnarič, M.; Iglič, A.; Kroll, D.M.; May, S. Monte Carlo Simulations of a Polymer Confined within a Fluid Vesicle. Soft Matter 2013, 9, 3976. [Google Scholar] [CrossRef] [Scilit]
- Smith, O.K. Eigenvalues of a Symmetric 3 × 3 Matrix. Commun. ACM 1961, 4, 168. [Google Scholar] [CrossRef] [Scilit]
- Rudnick, J.; Gaspari, G. The Shapes of Random Walks. Science 1987, 237, 384–389. [Google Scholar] [CrossRef] [Scilit]
- Gladnikoff, M.; Shimoni, E.; Gov, N.S.; Rousso, I. Retroviral Assembly and Budding Occur through an Actin-Driven Mechanism. Biophys. J. 2009, 97, 2419–2428. [Google Scholar] [CrossRef] [Scilit]
- Onsager, L. The effects of shape on the interaction of colloidal particles. Ann. N. Y. Acad. Sci. 1949, 51, 627–659. [Google Scholar] [CrossRef] [Scilit]
- Flory, P.J. Phase Equilibria in Solutions of Rod-like Particles. Proc. R. Soc. Lond. Ser. Math. Phys. Sci. 1956, 234, 73–89. [Google Scholar] [CrossRef] [Scilit]
- Doi, M. Molecular Dynamics and Rheological Properties of Concentrated Solutions of Rodlike Polymers in Isotropic and Liquid Crystalline Phases. J. Polym. Sci. Polym. Phys. Ed. 1981, 19, 229–243. [Google Scholar] [CrossRef] [Scilit]
- Humphries, R.L.; James, P.G.; Luckhurst, G.R. Molecular Field Treatment of Nematic Liquid Crystals. J. Chem. Soc. Faraday Trans. 2 Mol. Chem. Phys. 1972, 68, 1031. [Google Scholar] [CrossRef] [Scilit]
- Anderson, V.J.; Terentjev, E.M.; Meeker, S.P.; Crain, J.; Poon, W.C.K. Cellular Solid Behaviour of Liquid Crystal Colloids 1. Phase Separation and Morphology. Eur. Phys. J. E 2001, 4, 11–20. [Google Scholar] [CrossRef] [Scilit]
- Heimburg, T.; Jackson, A.D. On Soliton Propagation in Biomembranes and Nerves. Proc. Natl. Acad. Sci. USA 2005, 102, 9790–9795. [Google Scholar] [CrossRef] [Scilit]
- Imry, Y.; Ma, S. Random-Field Instability of the Ordered State of Continuous Symmetry. Phys. Rev. Lett. 1975, 35, 1399–1401. [Google Scholar] [CrossRef] [Scilit]
- Giamarchi, T.; Le Doussal, P. Elastic Theory of Flux Lattices in the Presence of Weak Disorder. Phys. Rev. B 1995, 52, 1242–1270. [Google Scholar] [CrossRef] [Scilit] [PubMed]
- Denholm, D.R.; Sluckin, T.J. Monte Carlo Studies of Two-Dimensional Random-Anisotropy Magnets. Phys. Rev. B 1993, 48, 901–912. [Google Scholar] [CrossRef] [Scilit] [PubMed]
- Chakrabarti, J. Simulation Evidence of Critical Behavior of Isotropic-Nematic Phase Transition in a Porous Medium. Phys. Rev. Lett. 1998, 81, 385–388. [Google Scholar] [CrossRef] [Scilit]
- Feldman, D.E. Quasi-long range order in glass states of impure liquid crystals, magnets, and superconductors. Int. J. Mod. Phys. B 2001, 15, 2945–2976. [Google Scholar] [CrossRef] [Scilit]
- Zurek, W.H. Cosmological Experiments in Superfluid Helium? Nature 1985, 317, 505–508. [Google Scholar] [CrossRef] [Scilit]
- Billeter, J.L.; Smondyrev, A.M.; Loriot, G.B.; Pelcovits, R.A. Phase-Ordering Dynamics of the Gay-Berne Nematic Liquid Crystal. Phys. Rev. E 1999, 60, 6831–6840. [Google Scholar] [CrossRef] [Scilit]
- Dierking, I. Universal Growth Laws in Liquid Crystals Far from Equilibrium. Appl. Phys. Mater. Sci. Process. 2001, 72, 307–310. [Google Scholar] [CrossRef] [Scilit]
- Bray, A.J. Theory of Phase-Ordering Kinetics. Adv. Phys. 2002, 51, 481–587. [Google Scholar] [CrossRef] [Scilit]
- Bradač, Z.; Kralj, S.; Žumer, S. Early Stage Domain Coarsening of the Isotropic-Nematic Phase Transition. J. Chem. Phys. 2011, 135, 024506. [Google Scholar] [CrossRef] [Scilit]
- Tutwiler, V.; Mukhitov, A.R.; Peshkova, A.D.; Le Minh, G.; Khismatullin, R.R.; Vicksman, J.; Nagaswami, C.; Litvinov, R.I.; Weisel, J.W. Shape Changes of Erythrocytes during Blood Clot Contraction and the Structure of Polyhedrocytes. Sci. Rep. 2018, 8, 17907. [Google Scholar] [CrossRef] [Scilit]
- Duda, J. Framework for Liquid Crystal Based Particle Models. arXiv 2021, arXiv:2108.07896. [Google Scholar]
- Faber, M. A Geometric Model in 3+1D Space-Time for Electrodynamic Phenomena. Universe 2022, 8, 73. [Google Scholar] [CrossRef] [Scilit]
- Eto, M.; Hamada, Y.; Nitta, M. Tying Knots in Particle Physics. Phys. Rev. Lett. 2025, 135, 091603. [Google Scholar] [CrossRef] [Scilit]
- Wilczek, F. Majorana Returns. Nat. Phys. 2009, 5, 614–618. [Google Scholar] [CrossRef] [Scilit]
- Head, L.C.; Negro, G.; Carenza, L.N.; Johnson, N.; Keogh, R.R.; Gonnella, G.; Morozov, A.; Orlandini, E.; Shendruk, T.N.; Tiribocchi, A.; et al. Majorana Quasiparticles and Topological Phases in 3D Active Nematics. Proc. Natl. Acad. Sci. USA 2024, 121, e2405304121. [Google Scholar] [CrossRef] [Scilit] [PubMed]
- Sadhu, R.K.; Barger, S.R.; Penič, S.; Iglič, A.; Krendel, M.; Gauthier, N.C.; Gov, N.S. A Theoretical Model of Efficient Phagocytosis Driven by Curved Membrane Proteins and Active Cytoskeleton Forces. Soft Matter 2023, 19, 31–43. [Google Scholar] [CrossRef] [Scilit] [PubMed]
- Markin, V.S. Lateral Organization of Membranes and Cell Shapes. Biophys. J. 1981, 36, 1–19. [Google Scholar] [CrossRef] [Scilit]
- Leibler, S. Curvature Instability in Membranes. J. Phys. 1986, 47, 507–516. [Google Scholar] [CrossRef] [Scilit]
- Kralj-Iglič, V.; Svetina, S.; Žekž, B. Shapes of Bilayer Vesicles with Membrane Embedded Molecules. Eur. Biophys. J. 1996, 24, 311–321. [Google Scholar] [CrossRef] [Scilit]
- Gov, N.S. Guided by Curvature: Shaping Cells by Coupling Curved Membrane Proteins and Cytoskeletal Forces. Philos. Trans. R. Soc. B Biol. Sci. 2018, 373, 20170115. [Google Scholar] [CrossRef] [Scilit] [PubMed]
- Hägerstrand, H.; Mrówczyńska, L.; Salzer, U.; Prohaska, R.; Michelsen, K.A.; Kralj-Iglič, V.; Iglič, A. Curvature-Dependent Lateral Distribution of Raft Markers in the Human Erythrocyte Membrane. Mol. Membr. Biol. 2006, 23, 277–288. [Google Scholar] [CrossRef] [Scilit]
- Fischer, T.M. Bending Stiffness of Lipid Bilayers. I. Bilayer Couple or Single-Layer Bending? Biophys. J. 1992, 63, 1328–1335. [Google Scholar] [CrossRef] [Scilit] [PubMed]
- Fischer, T.M. Bending Stiffness of Lipid Bilayers. V. Comparison of Two Formulations. J. Phys. II 1993, 3, 1795–1805. [Google Scholar] [CrossRef] [Scilit]
- Fournier, J.B. Nontopological Saddle-Splay and Curvature Instabilities from Anisotropic Membrane Inclusions. Phys. Rev. Lett. 1996, 76, 4436–4439. [Google Scholar] [CrossRef] [Scilit]
- Fournier, J.-B.; Galatola, P. Bilayer Membranes with 2D-Nematic Order of the Surfactant Polar Heads. Braz. J. Phys. 1998, 28, 329–338. [Google Scholar] [CrossRef] [Scilit]
- Kralj-Iglič, V.; Iglič, A.; Hägerstrand, H.; Peterlin, P. Stable Tubular Microexovesicles of the Erythrocyte Membrane Induced by Dimeric Amphiphiles. Phys. Rev. E 2000, 61, 4230–4234. [Google Scholar] [CrossRef] [Scilit]
- Kralj-Iglič, V.; Babnik, B.; Gauger, D.R.; May, S.; Iglič, A. Quadrupolar Ordering of Phospholipid Molecules in Narrow Necks of Phospholipid Vesicles. J. Stat. Phys. 2006, 125, 727–752. [Google Scholar] [CrossRef] [Scilit]
- Rappolt, M.; Hodzic, A.; Sartori, B.; Ollivon, M.; Laggner, P. Conformational and Hydrational Properties during the Lβ- to Lα- and Lα- to HII-Phase Transition in Phosphatidylethanolamine. Chem. Phys. Lipids 2008, 154, 46–55. [Google Scholar] [CrossRef] [Scilit]
- Watson, M.C.; Penev, E.S.; Welch, P.M.; Brown, F.L.H. Thermal Fluctuations in Shape, Thickness, and Molecular Orientation in Lipid Bilayers. J. Chem. Phys. 2011, 135, 244701. [Google Scholar] [CrossRef] [Scilit]
- Walani, N.; Torres, J.; Agrawal, A. Endocytic Proteins Drive Vesicle Growth via Instability in High Membrane Tension Environment. Proc. Natl. Acad. Sci. USA 2015, 112, E1423–E1432. [Google Scholar] [CrossRef] [Scilit] [PubMed]
- Ravid, Y.; Penič, S.; Mesarec, L.; Gov, N.S.; Kralj-Iglič, V.; Iglič, A.; Drab, M. Coupling Anisotropic Curvature and Nematic Order: Mechanisms of Membrane Shape Remodeling. Soft Matter 2025, 21, 8407–8428. [Google Scholar] [CrossRef] [Scilit]
- Kralj-Iglič, V.; Remškar, M.; Vidmar, G.; Fošnarič, M.; Iglič, A. Deviatoric Elasticity as a Possible Physical Mechanism Explaining Collapse of Inorganic Micro and Nanotubes. Phys. Lett. A 2002, 296, 151–155. [Google Scholar] [CrossRef] [Scilit]
- Iglič, A.; Babnik, B.; Gimsa, U.; Kralj-Iglič, V. On the Role of Membrane Anisotropy in the Beading Transition of Undulated Tubular Membrane Structures. J. Phys. Math. Gen. 2005, 38, 8527–8536. [Google Scholar] [CrossRef] [Scilit]
- Iglič, A.; Slivnik, T.; Kralj-Iglič, V. Elastic Properties of Biological Membranes Influenced by Attached Proteins. J. Biomech. 2007, 40, 2492–2500. [Google Scholar] [CrossRef] [Scilit]
- Selinger, R.L.B.; Konya, A.; Travesset, A.; Selinger, J.V. Monte Carlo Studies of the XY Model on Two-Dimensional Curved Surfaces. J. Phys. Chem. B 2011, 115, 13989–13993. [Google Scholar] [CrossRef] [Scilit]
- Napoli, G.; Vergori, L. Extrinsic Curvature Effects on Nematic Shells. Phys. Rev. Lett. 2012, 108, 207803. [Google Scholar] [CrossRef] [Scilit]
- Evans, E.A. Bending Resistance and Chemically Induced Moments in Membrane Bilayers. Biophys. J. 1974, 14, 923–931. [Google Scholar] [CrossRef] [Scilit] [PubMed]
- Canham, P.B. The Minimum Energy of Bending as a Possible Explanation of the Biconcave Shape of the Human Red Blood Cell. J. Theor. Biol. 1970, 26, 61–81. [Google Scholar] [CrossRef] [Scilit] [PubMed]
Disclaimer/Publisher’s Note: The statements, opinions and data contained in all publications are solely those of the individual author(s) and contributor(s) and not of MDPI and/or the editor(s). MDPI and/or the editor(s) disclaim responsibility for any injury to people or property resulting from any ideas, methods, instructions or products referred to in the content. |
© 2026 by the authors. Licensee MDPI, Basel, Switzerland. This article is an open access article distributed under the terms and conditions of the Creative Commons Attribution (CC BY) license.