


Abstract
Yellow and pink calcite samples from the Huanggangliang and Xilingol mining areas in Inner Mongolia were investigated to elucidate the relationships among chemical composition, unit-cell parameters, coloration, and luminescence. Electron probe micro-analysis, laser ablation inductively coupled plasma mass spectrometry, X-ray diffraction, infrared spectroscopy, Raman spectroscopy, UV-Vis absorption spectroscopy, and photoluminescence measurements show that samples of yellow and pink calcite differ significantly in impurity incorporation and optical behavior. Yellow calcite is relatively enriched in Mg and rare earth elements, especially Y and Ce, whereas pink calcite contains markedly higher Mn and Fe contents. The pink calcite has smaller lattice parameters and unit-cell volume, consistent with greater substitution of Ca2+ by smaller-radius cations. Spectra reveal that the pink coloration is mainly related to Mn-associated absorption bands at 402 and 527 nm, whereas the yellow color is attributed to weak impurity- and defect-related absorption. Under ultraviolet excitation, yellow calcite exhibits a broad blue–white emission centered at ~470 nm, whereas pink calcite shows an intense orange–red emission near 625 nm characteristic of Mn2+. Variable-temperature photoluminescence further demonstrates that the pink calcite has higher thermal stability, with a thermal-quenching activation energy of 0.218 eV, compared with 0.074 eV for the yellow calcite. These results demonstrate that trace element incorporation plays a key role in regulating the coloration and luminescence of calcite and provide useful insight into the optical behavior of carbonate minerals.
1. Introduction
Calcite, the most abundant carbonate in the Earth’s crust, plays a crucial role in the global carbon cycle and serves as a carbon carrier from the Earth’s surface to the deep interior [1]. The structure of calcite (CaCO3) consists of triangular [CO3]2− groups bonded with Ca2+, which can be easily substituted by divalent cations such as Mg2+, Fe2+, Mn2+, Pb2+, Ba2+, and Sr2+. Trivalent rare earth element ions, with ionic radii either smaller or slightly larger than that of Ca2+, do substitute Ca2+ to a limited extent, accompanied by the replacement of Ca2+ by Na+ to maintain electrical charge balance [2]. Under ultraviolet excitation, calcite can emit strong fluorescence and phosphorescence. Owing to its luminescence property, calcite is suitable as a luminescent matrix material [3,4]. This luminescence phenomenon makes calcite of great significance in mineralogical research and also provides promising application directions in high-technology fields such as environmental protection materials, electronic components, and sensors.
In the field of research on luminescent materials, calcite is attracting increasing attention due to its crystal structure and optical properties. Most previous work has emphasized either synthetic CaCO3 phosphors or a certain color variety of natural calcite. Sun et al. successfully synthesized Gd3+ and Eu3+ co-doped CaCO3 nanoparticles via a carbonization route and systematically characterized their photoluminescence (PL) emission spectra across the ultraviolet–visible spectral region [5]. Xu et al. reported the PL properties of Sn2+ and Mn2+ co-doped CaCO3 phosphors [6]. Dai et al. achieved controlled synthesis of needle-shaped calcite crystals in an ethylene glycol–water mixed solvent system through carbonization [7]. Collectively, these studies underscore calcite’s considerable potential as a luminescent host matrix. To date, the primary activators of luminescence identified in calcite include Mn2+, Pb2+, and Ce3+. Under 208 nm excitation, the PL spectrum of natural calcite exhibits three characteristic emission bands: the band centered at ~620 nm is predominantly attributed to the 4T1 (G)→6A1 (S) d–d transition of Mn2+ [8]; the band near 355 nm arises mainly from the 4f→5d electronic transition of Ce3+ [9]; and the band at ~325 nm originates primarily from the s2 (1S0)→sp (3P1) transition of Pb2+ [10]. In addition, the coloration of gem minerals is increasingly recognized as a critical geochemical tracer, offering insights into fluid compositions, redox conditions, and tectonic settings during mineral formation. Zhang et al. established a correlation between the color of natural topaz and the genesis of its deposits [11]. Previous studies have shown that the coloration and luminescence of natural calcite are controlled by multiple types of centers, and these mechanisms are not always uniform even within a single color variety [9]. Spectroscopic studies of Terlingua-type pink calcite suggested that some unusual luminescence may be associated with radiation-induced centers rather than a simple impurity-activated mechanism [12]. By comparison, natural yellow calcite has received much less systematic attention, especially regarding the relationships among trace-element chemistry, visible absorption, and photoluminescence. In addition, investigations of differently colored calcite from the same ore district remain comparatively scarce; the relationship between the color of calcite and its crystal structure, spectroscopic characteristics, and luminescent properties has not yet been fully revealed. These previous studies indicate that the coloration and luminescence of natural calcite may arise from different mechanisms in different geological settings, including impurity-activated emission (e.g., Mn2+, Ce3+, Pb2+) and, in some special pink varieties, radiation-induced centers. This contrast provides an important framework for interpreting the yellow and pink calcite investigated in the present study.
In this paper, a total of fifteen naturally occurring calcite samples were selected to systematically investigate the unit-cell parameters, chemical composition, spectroscopic characteristics and fluorescent properties. This study advances the theoretical understanding of coloration mechanisms of calcite and establishes a systematic experimental foundation for characterizing its mineralogical properties, thereby supporting its potential application in photothermal conversion environments.
2. Materials and Methods
2.1. Materials
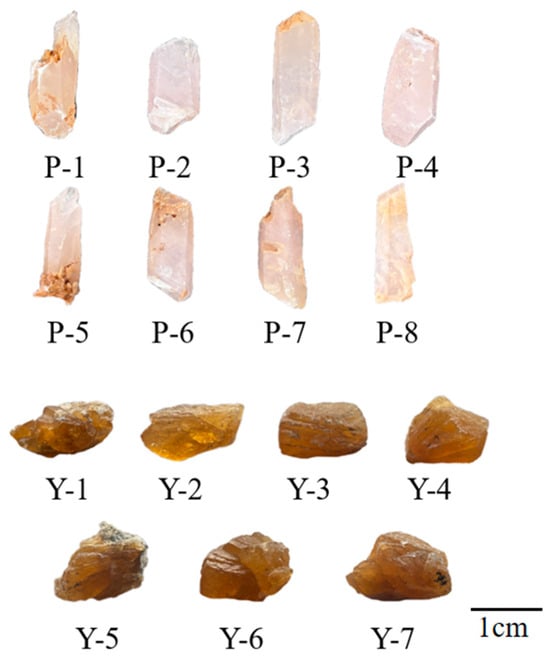
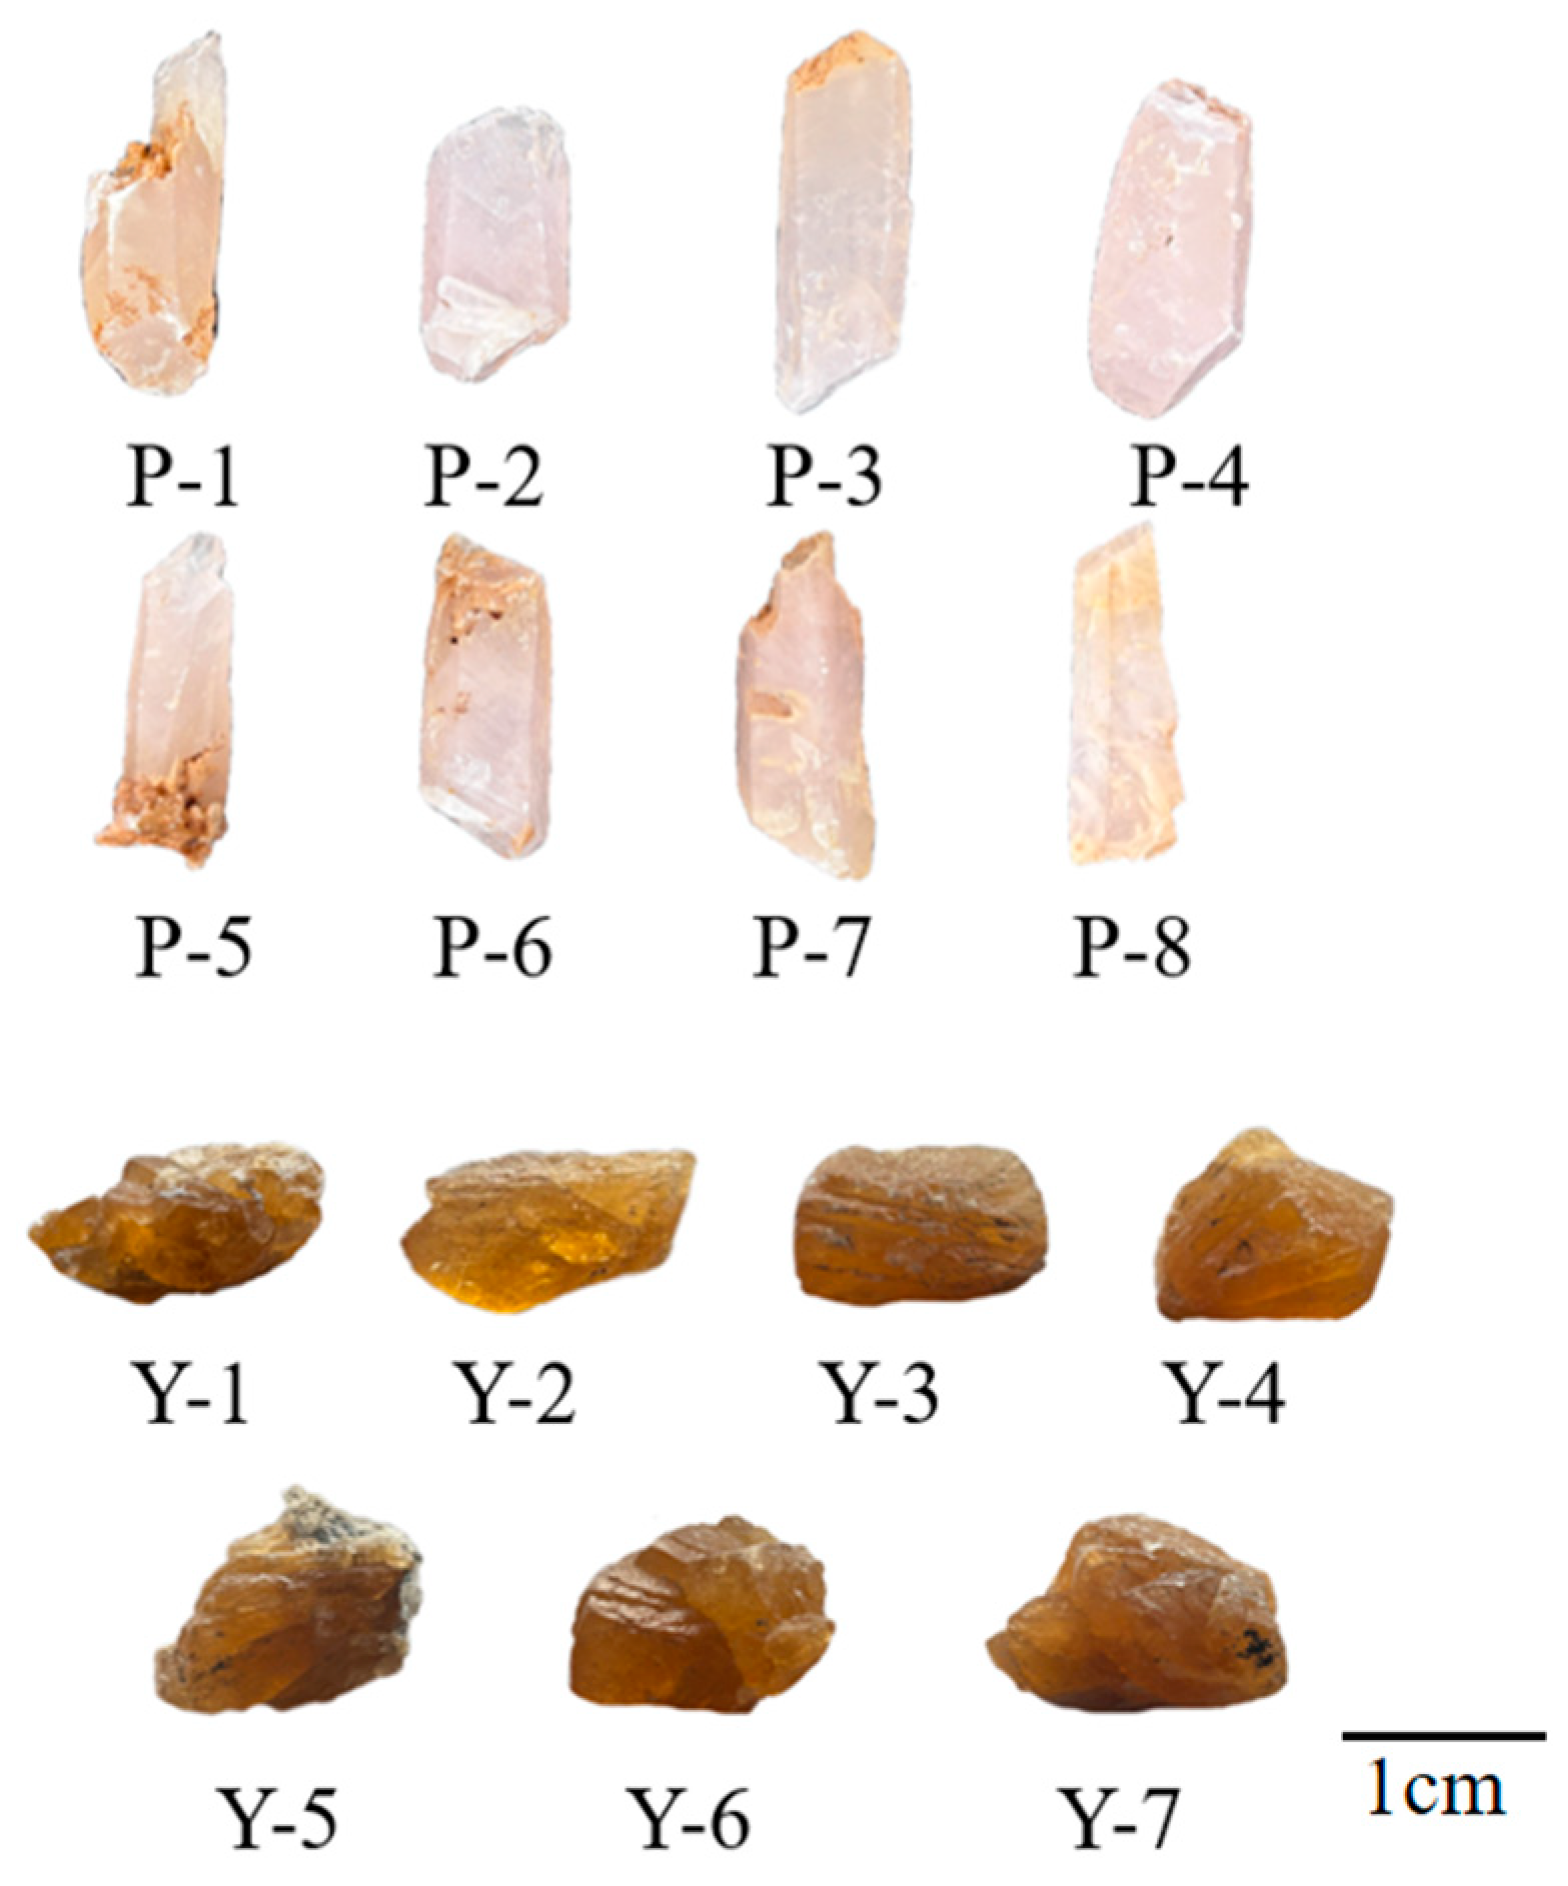
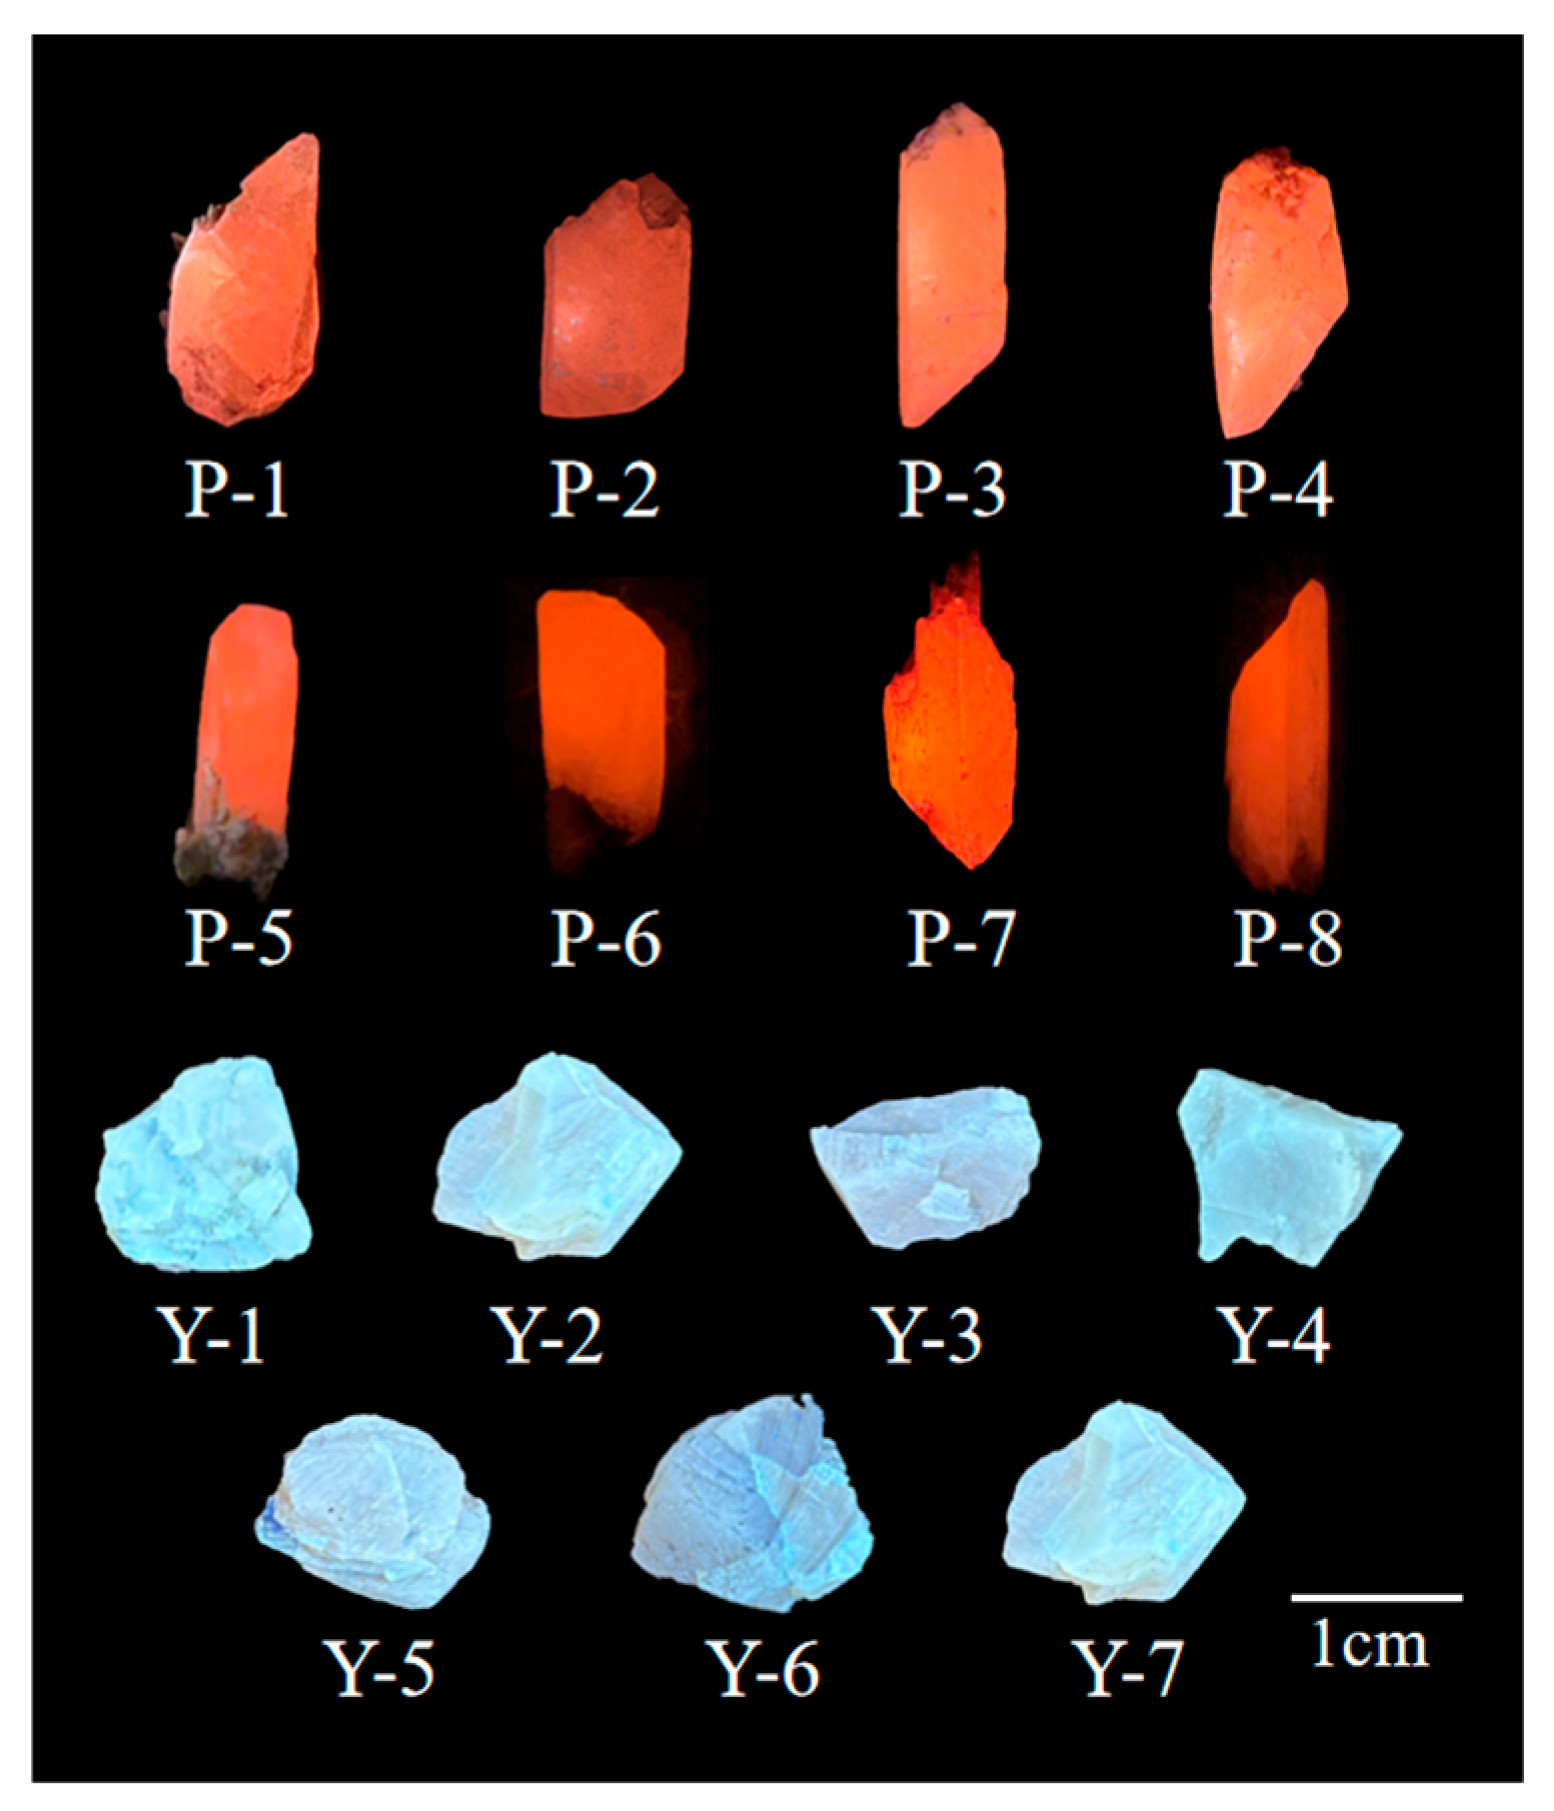
As presented in Figure 1, fifteen natural calcite samples were analyzed in this study and numbered according to their colors. The samples include eight pink elongate fragments (P-1 to P-8) and seven yellow samples of irregular shape (Y-1 to Y-7). The studied yellow calcite samples were collected by miners from the Huanggangliang mining area, Inner Mongolia, China, whereas the studied pink calcite samples were collected by miners from the Xilingol mining area, Inner Mongolia, China.
Figure 1.
Appearance of calcite samples.
2.2. Methods
The samples were characterized by laser ablation inductively coupled plasma mass spectrometry (LA-ICP-MS), electron probe micro-analysis (EPMA) and X-ray powder diffraction. Trace element contents were monitored by LA-ICP-MS using US-based Applied Spectra Inc.’s J-10 femtosecond laser (Elemental Scientific Lasers, Bozeman, MT, USA) and a Thermo X-Series quadrupole mass spectrometry system (Agilent Technologies, Santa Clara, CA, USA). Measurements were conducted at the National Geological Experimental Testing Center. The laser ablation spot diameter was 50 μm, the frequency was 6 Hz, and the energy was 4 J/cm2. The analysis time for each sample point was 65 s, the blank collection time was 20 s, and the continuous collection time was 45 s. The element content was calculated using international standard samples, with NIST 610, NIST 612, BHVO-2G, BCR-2G and BIR-1G as external standards, and with Si as the internal standard. Major element analysis was performed by EPMA using a EPMA-1720 instrument (Shimadzu, Kyoto, Japan) at the Geoscience Test Center, China University of Geosciences (Beijing, China). Analytical conditions included an accelerating voltage of 15 kV, a beam current of 10 nA, and a focused electron beam diameter of 5 µm. Prior to EPMA analysis, representative fragments were prepared to obtain flat, polished surfaces suitable for quantitative measurement. Under these analytical conditions, the practical lower limit for minor-element quantification was on the order of 500 ppm, depending on the element. The X-ray powder diffraction analysis was conducted using a Bruker D8Advance-type X-ray diffractometer (Bruker Corporation, Karlsruhe, Germany) at the School of Materials, China University of Geosciences, Beijing, China. The instrument utilized CuKα radiation with a scanning speed of 10°/min, a scanning range of 5 to 80° and a sampling step width of 0.02° (2θ).
Spectroscopic characterization included infrared spectroscopy, Raman spectroscopy, UV-Vis absorption spectroscopy, photoluminescence excitation spectroscopy and photoluminescence emission spectroscopy. All spectroscopic analyses were carried out at the Gem Testing Laboratory of the School of Gemology, China University of Geosciences, Beijing, China. Infrared spectra were collected with a TENSOR 27 Fourier transform infrared spectrometer produced in Bruker, Ettlingen, Germany. Measurements were performed in reflectance mode over the range 400–1800 cm−1, with a spectral resolution of 2 cm−1 and 50–100 scans. The operating voltage was 220 V, and the scanning frequency was 10 kHz. Aluminum sheets were used for background calibration. Raman spectra were obtained using an HR Evolution micro-Raman spectrometer (HORIBA, Kyoto, Japan). The instrument was operated at 220 V and 10 A, with a spectral resolution of 1 cm−1. A 532 nm laser served as the excitation source, and spectra were recorded from 100 to 1400 cm−1. Silicon wafers were employed for background correction. UV–Vis absorption spectra were measured on a UV-3600 spectrophotometer (Shimadzu, Kyoto, Japan). Data acquisition was conducted in diffuse reflectance mode with a wavelength interval of 1.0 nm across the 300–800 nm range. The photoluminescence excitation spectrum and photoluminescence emission spectrum were recorded using a Hitachi F-4700 fluorescence spectrometer (Hitachi, Tokyo, Japan). The measurements were performed at a scanning speed of 240 nm/min under a detector voltage of 500 V.
3. Results and Discussion
3.1. Composition and Unit-Cell Parameters
3.1.1. Electron Probe Micro-Analysis
Two analytical points were selected from the polished flat surface of each sample for electron microprobe analysis, and the average value was taken as the representative datapoint for that sample.
As shown in Table 1, the samples are compositionally dominated by Ca, whereas Fe, Si, Mn, Mg, and F occur at minor to trace levels overall. The yellow samples are characterized by Ca contents corresponding to 55.60–57.24 wt.% CaO equivalent and very low Mn contents corresponding to only 0.01–0.07 wt.% MnO equivalent, with slightly elevated Mg relative to the pink series. In contrast, the pink samples display markedly higher Mn contents corresponding to 3.68–5.15 wt.% MnO equivalent, accompanied by lower Ca contents corresponding to 52.20–53.98 wt.% CaO equivalent, indicating that Mn is the principal substituting cation in the pink calcite and that its incorporation is coupled with a decrease in Ca at the lattice site. Overall, the results indicate that the pink calcite shows distinctly stronger Mn enrichment, whereas the yellow calcite is comparatively richer in Mg and slightly richer in F, reflecting subtle but meaningful differences in substitution chemistry between the two color varieties.
Table 1.
Electron probe micro-analysis data of calcite samples (wt.%).
The analytical totals are lower than 100 wt.% mainly because the carbon component in calcite is not included in the reported EPMA totals. Empirical formulas calculated from the EPMA data on the basis of one A-site cation per formula unit are listed in Supplementary Table S2. These formulas further confirm that the yellow calcite is characterized by only minor Mg-dominant substitution, whereas the pink calcite shows distinctly stronger Mn-for-Ca substitution.
Because electron microprobe analysis is primarily suited to determining major element concentrations, its analytical precision for trace elements is limited to about 0.05 wt.%. When the concentration falls below this threshold, the results become unreliable. Therefore, subsequent analyses employed laser ablation inductively coupled plasma mass spectrometry to further characterize the trace element composition of the calcite samples.
3.1.2. Laser Ablation Inductively Coupled Plasma Mass Spectrometry
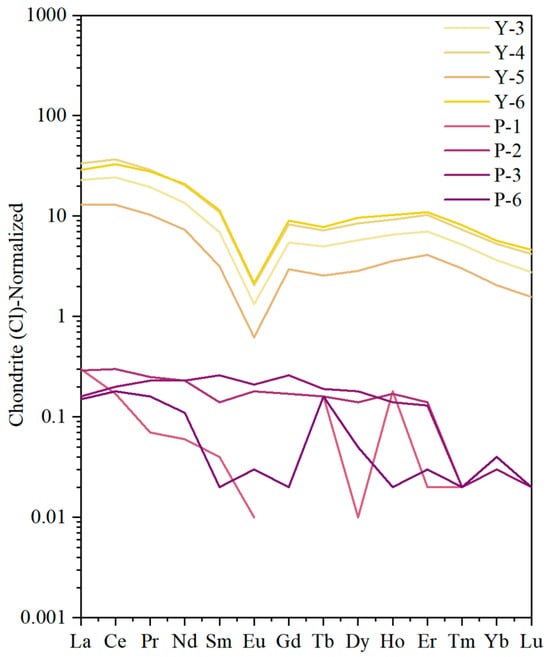
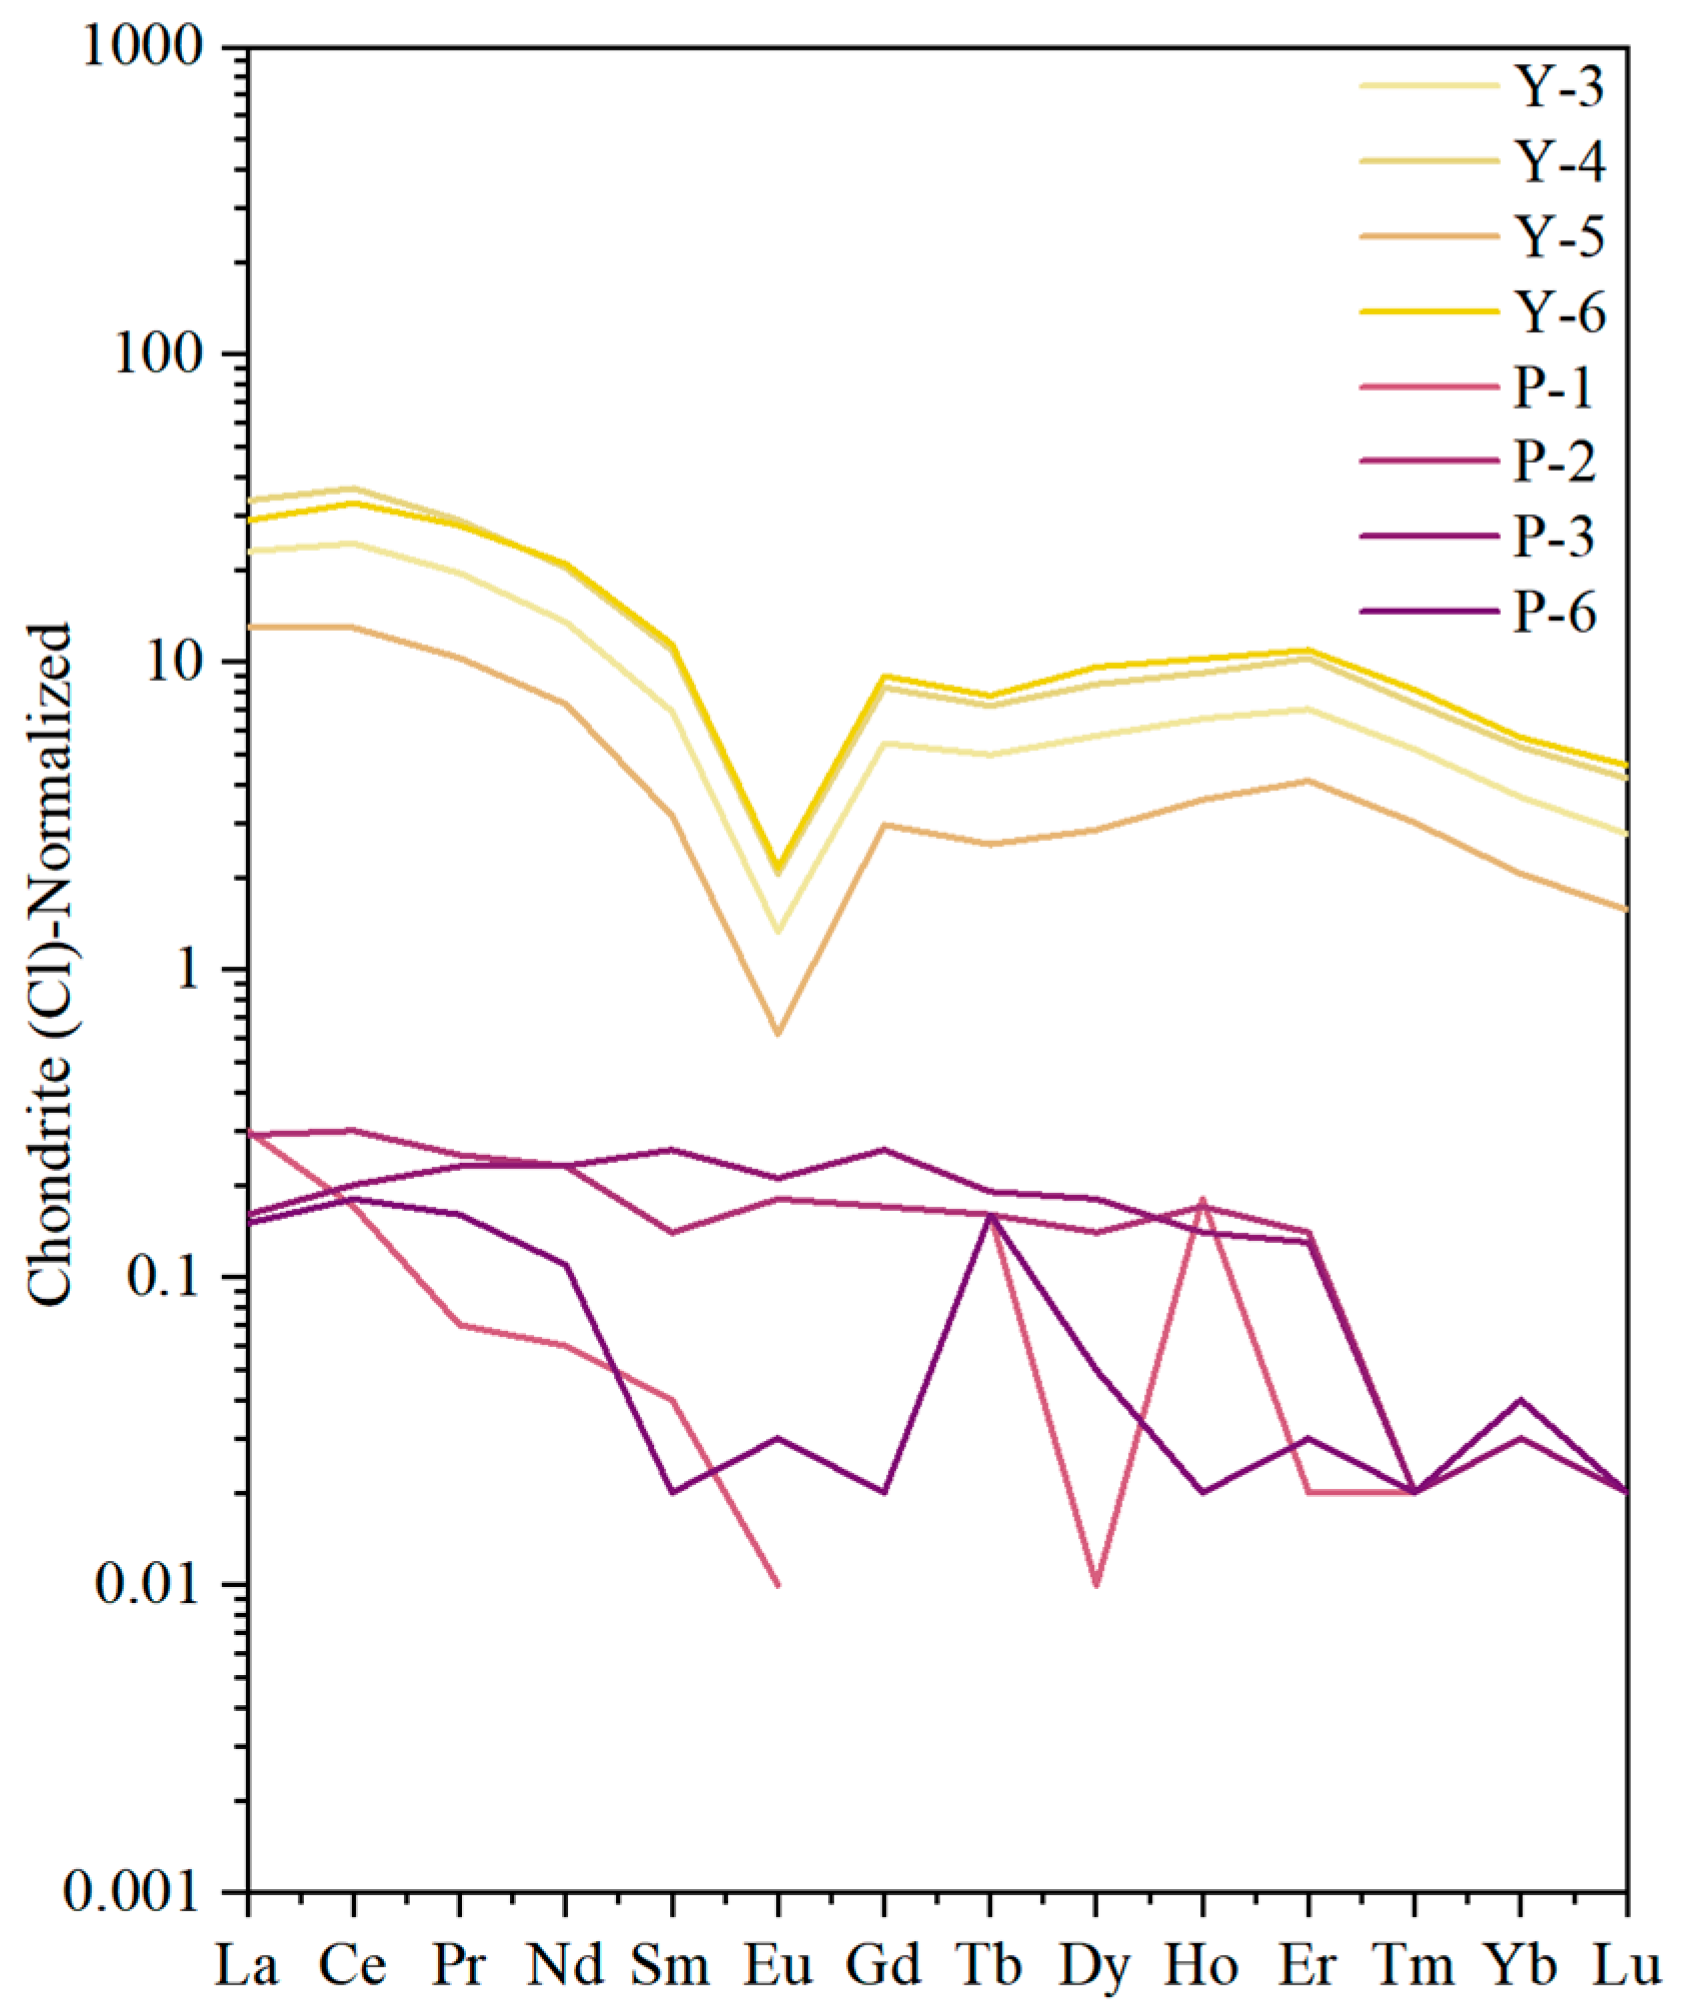
Two points were randomly selected from each sample for laser ablation inductively coupled plasma mass spectrometry (LA-ICP-MS), and the average value was taken as the datapoint of that sample. As shown in Table S2, The LA-ICP-MS data reveal clear trace-element differences between the yellow and pink calcite. The yellow calcite is relatively enriched in Mg, Si and Mn, whereas the pink calcite is characterized by enrichment in Si, Fe and especially Mn, with Mn contents in the pink samples consistently reaching the 104 ppm level, markedly higher than those of the yellow series. In addition, Sr is comparatively abundant in both groups, whereas P and Y occur only at minor levels. These compositional characteristics indicate the presence of several trace elements in the calcite samples. Among them, appropriate divalent and trivalent cations may enter the calcite lattice through substitution for Ca2+, thereby preserving information on fluid composition during precipitation [13]. The chondrite-normalized rare earth element (REE) patterns in Figure 2 further show that both color series are enriched in light rare earth elements (LREEs) and depleted in heavy rare earth elements (HREEs), which reflects the preferential incorporation of LREEs into calcite relative to HREEs. However, the total amount of rare earth elements in the yellow calcite is significantly higher than that in Zpink calcite, and the two color varieties differ in their anomaly characteristics. The yellow calcite exhibits a distinct negative Eu anomaly, whereas the pink calcite shows no obvious Eu anomaly. Eu anomalies are commonly linked to changes in fluid redox state, temperature, and fluid–rock interaction [14].
Figure 2.
Chondrite-normalized REE patterns of calcite samples.
3.1.3. X-Ray Diffraction Analysis
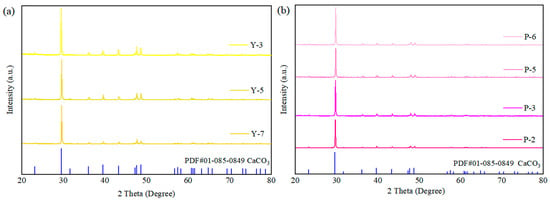
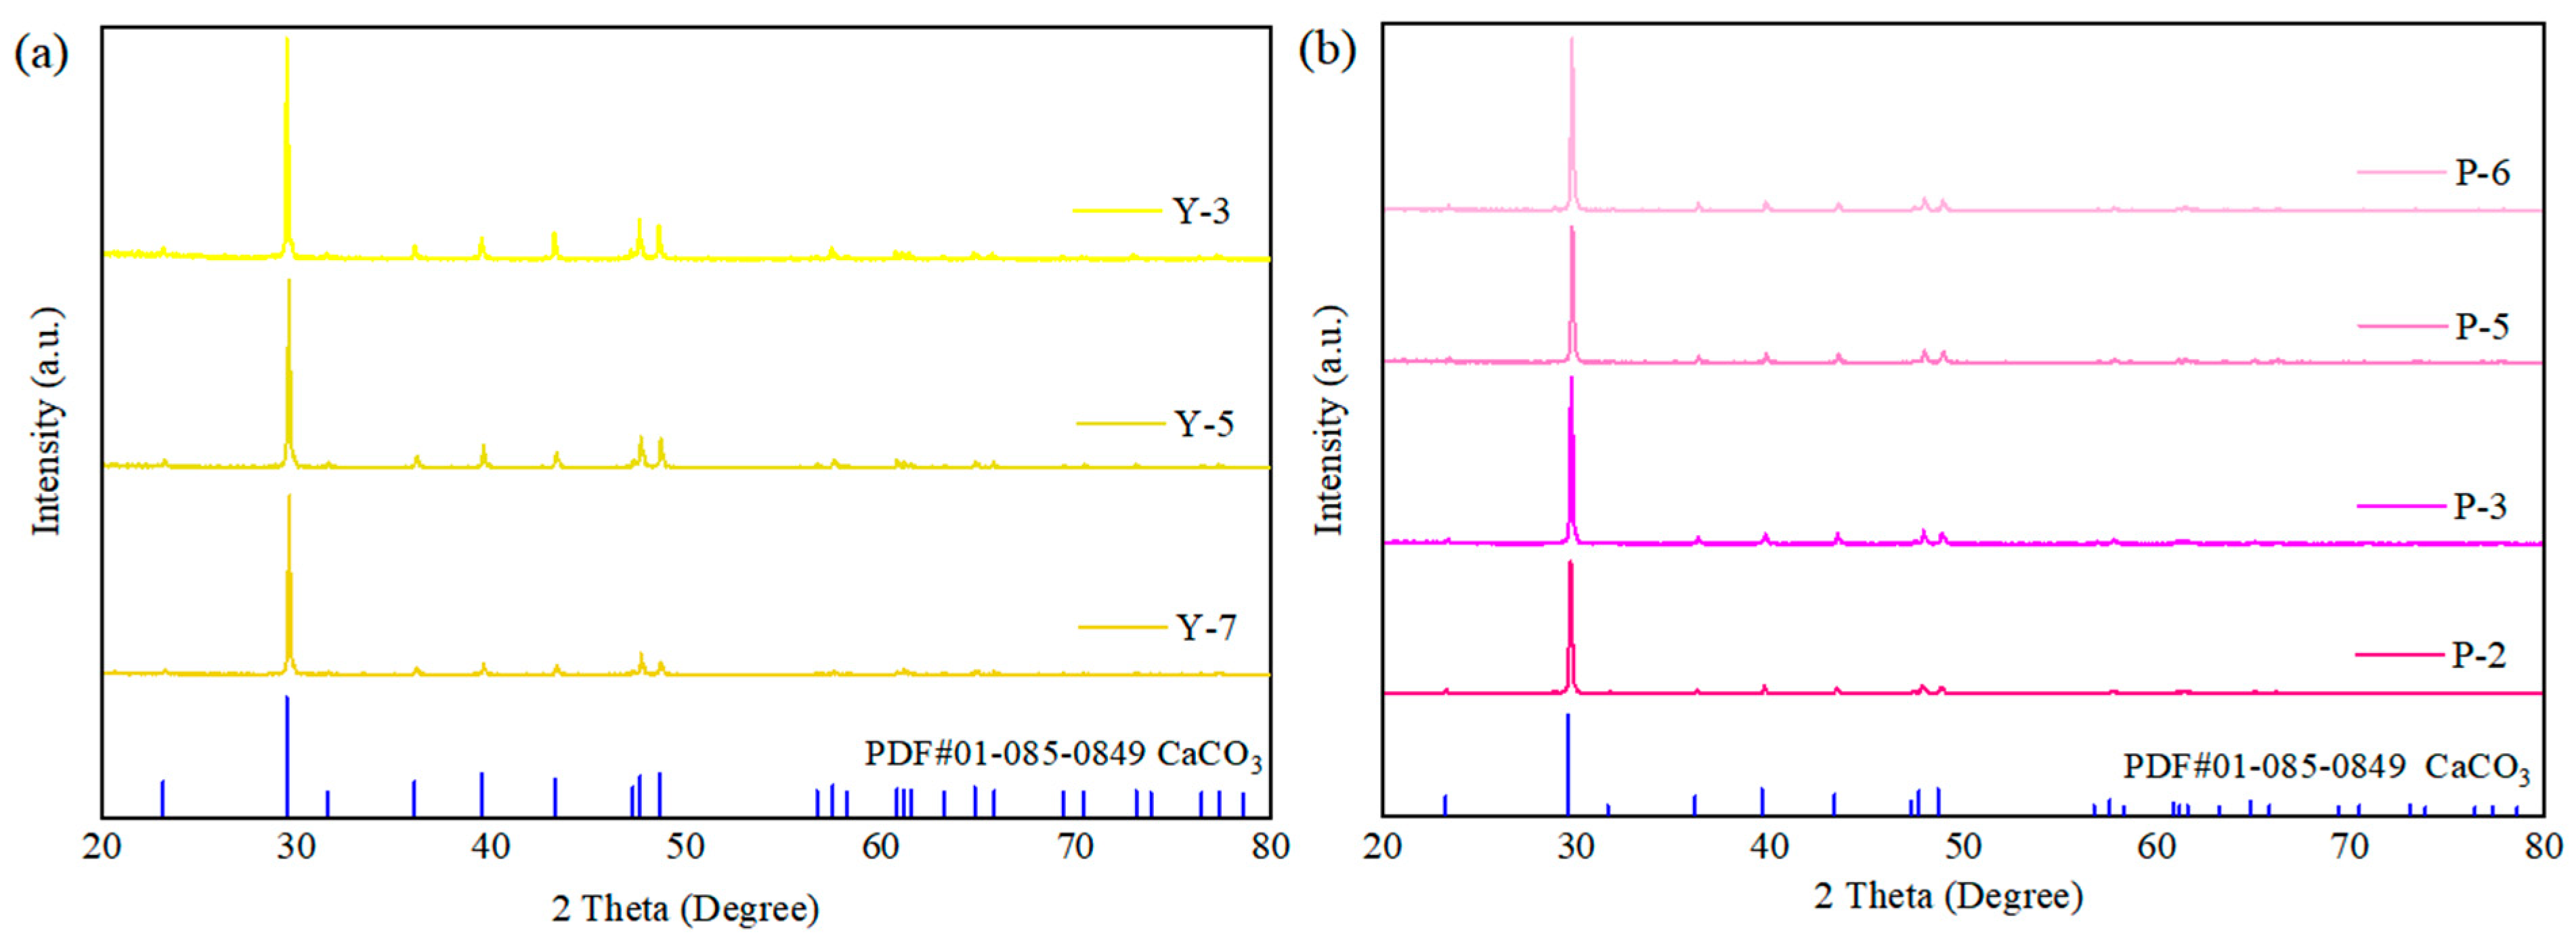
As shown in Figure 3, the X-ray diffraction patterns of the yellow and pink calcite specimens are highly consistent with the standard card PDF#01-085-0849 (CaCO3), indicating that no substantial structural differences are present among samples with different colors. In addition, the diffraction peaks are sharp and intense, reflecting the good crystallinity of the calcite samples. Within the 2θ range of 20–65°, seven diffraction peaks can be identified. The most intense peak at 29.3° and two other relatively strong peaks at 47.5° and 48.5° can be indexed to the (104), (116), and (018) crystal planes, respectively. Four additional prominent peaks located at 22.7°, 35.9°, 39.3°, and 43.1° correspond to the (012), (110), (113), and (202) crystal planes, respectively [15]. The XRD patterns were further refined using GSASII software (v. r5782, Argonne National Laboratory, Argonne, IL, USA), and the unit-cell parameters of the yellow and pink calcite samples were obtained, as listed in Table 2.
Figure 3.
(a) X-ray diffraction patterns of yellow calcite samples Y-3, Y-5, and Y-7; (b) X-ray diffraction patterns of pink calcite samples P-6, P-5, P-3, and P-2.
Table 2.
Unit cell parameters of calcite samples and their correlations with trace-element contents.
As can be seen from Figure 3, the three strongest diffraction peaks of pink calcite are all shifted toward higher angles relative to the standard card PDF#01-085-0849. As shown in Table 2, the lattice parameters a, b, and c, as well as the unit-cell volume, of the yellow calcite are all larger than the corresponding standard values, whereas those of the pink calcite are smaller. These results suggest that cations with ionic radii smaller than that of Ca2+, such as Mg2+, Zn2+, Fe2+, and Mn2+, may substitute for Ca2+ in the lattice of pink calcite, while larger cations, including Ba2+, Sr2+, and Pb2+, are more likely to enter the crystal structure of yellow calcite through isomorphous substitution. Combined with the LA-ICP-MS results, both color varieties of calcite were confirmed to contain Mn, Fe, Mg, Zn, Ba, and Sr. Table 2 also summarizes the relationship between trace-element contents and lattice parameters in the two color series. Compared with pink calcite, the total concentration of the smaller-radius substituting ions (Mg2+, Zn2+, Fe2+, and Mn2+) is much lower in yellow calcite. The average Sr content of the yellow samples is slightly higher than that in the pink series, whereas the Ba contents are comparable in both groups. Therefore, the observed differences in peak shifts, lattice constants, and unit-cell volumes between the two color series are closely related to variations in the contents of trace elements capable of replacing Ca2+ by isomorphous substitution.
3.2. Spectroscopic Characterization
3.2.1. Fourier Transform Infrared Spectroscopy
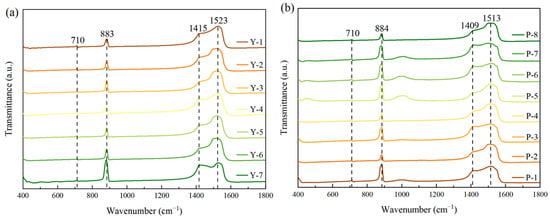
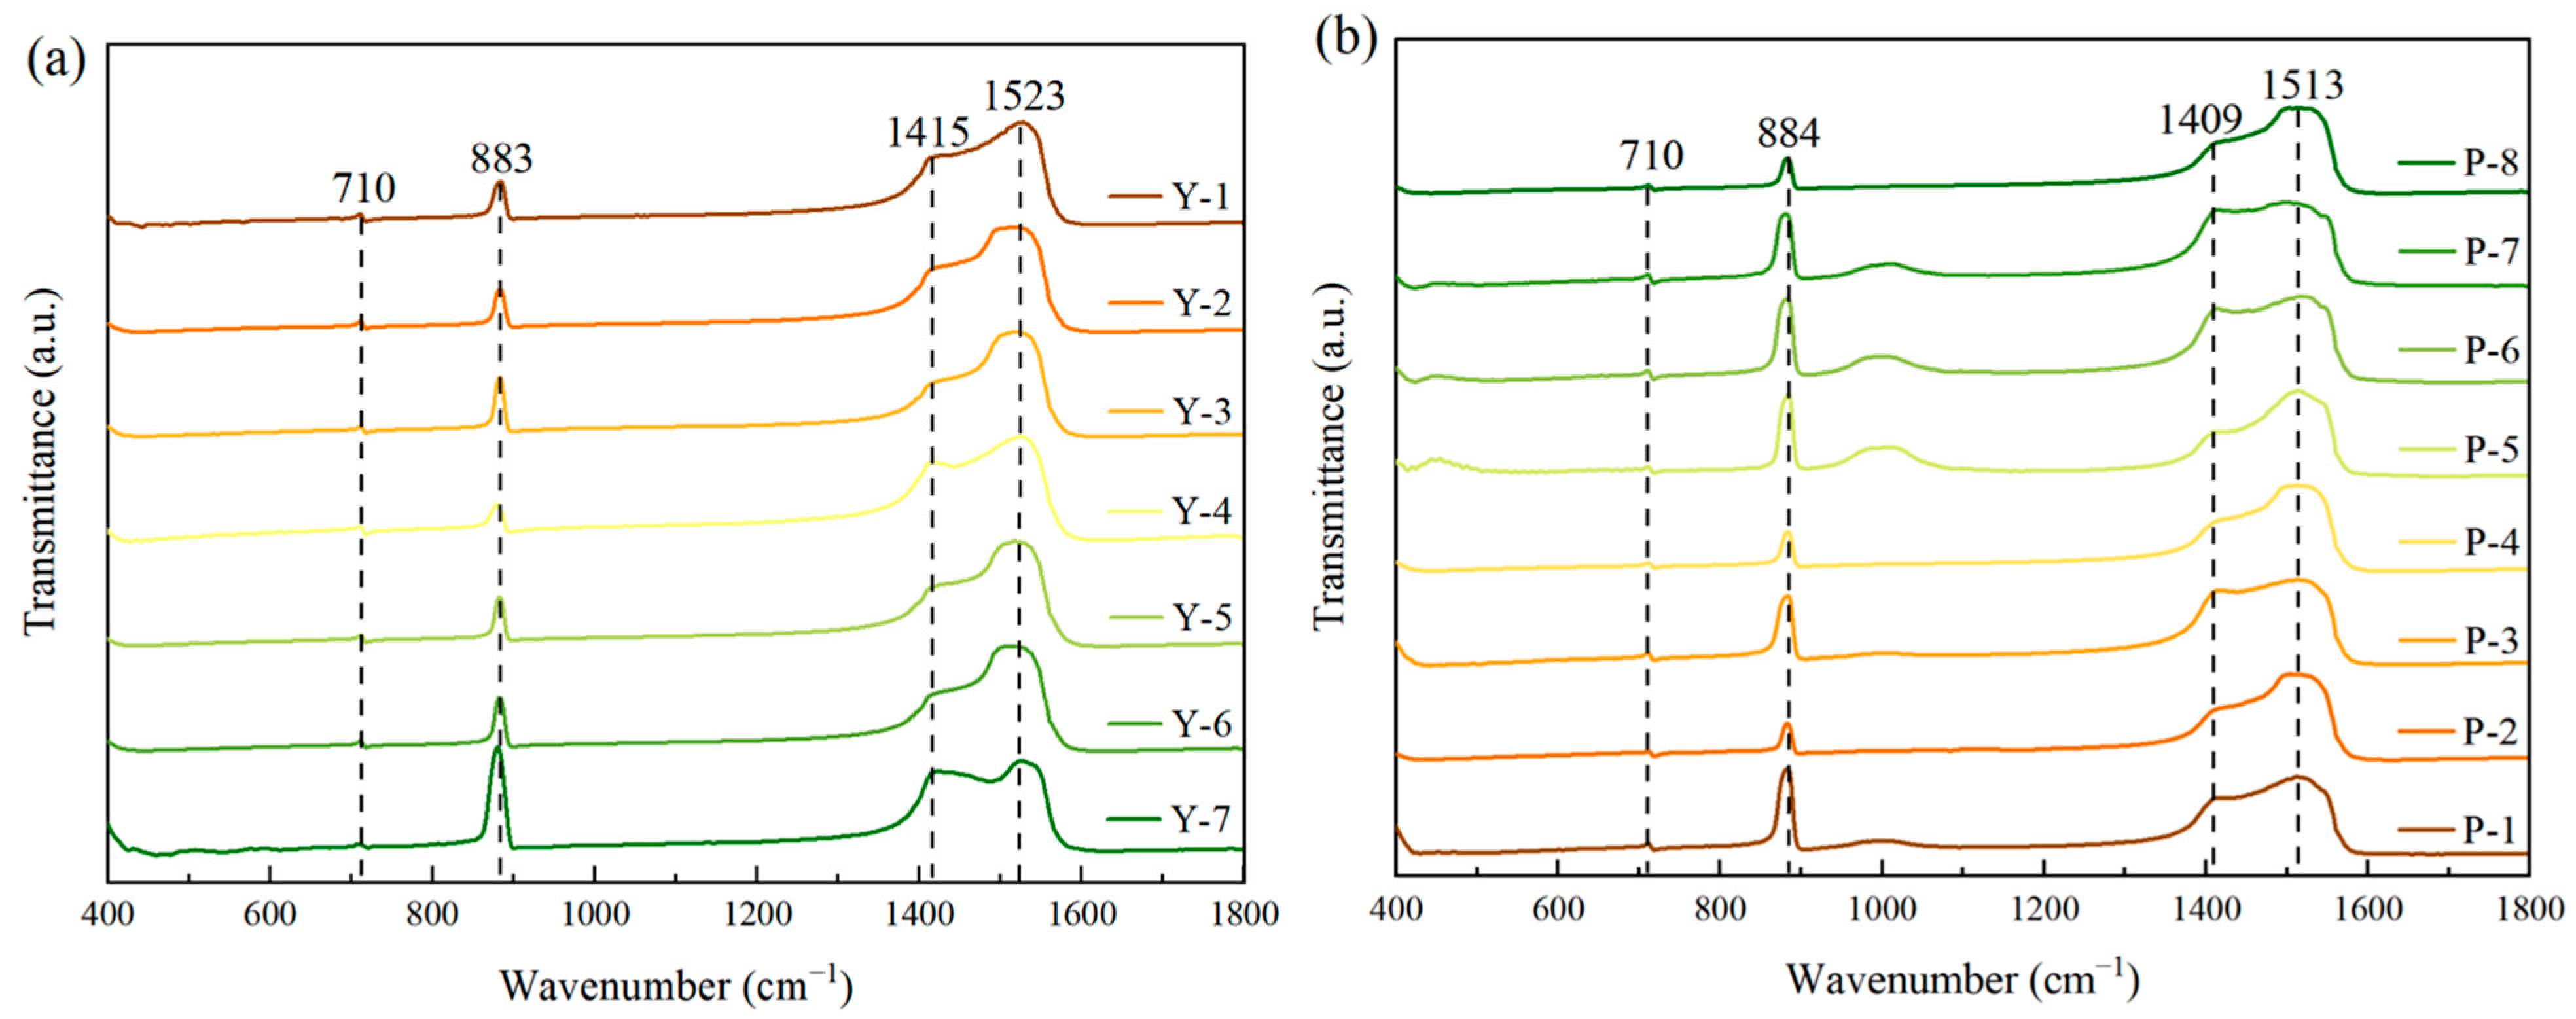
The infrared spectra were obtained in reflectance mode, and the corresponding spectral curves were generated in Origin based on the raw measurement data. Peak assignments for the infrared bands were made with reference to the work of Farmer et al. [16]. As illustrated in Figure 4 and Table 3, calcite exhibits four representative infrared absorption bands associated with different vibrational behaviors. These features are chiefly linked to the [CO3]2− groups in the crystal structure. Specifically, the peak at 710 cm−1 is assigned to the in-plane bending vibration of [CO3]2−, whereas the absorption around 883 cm−1 corresponds to its out-of-plane bending mode. In addition, the band located at approximately 1412 cm−1 is related to the symmetric stretching vibration of [CO3]2−, whereas the band near 1518 cm−1 is attributed to the asymmetric stretching mode [17]. The measured specimens exhibit infrared characteristics typical of calcite and are consistent with the reference spectrum reported in the RRUFF database under entry #R050130. In addition, the symmetric stretching vibration and asymmetric stretching vibration bands of the yellow samples occur at higher wavenumbers than those of the pink samples, which is a consequence of the decreased interatomic distances following the substitution of Ca2+ with the smaller Mg2+ ion. The results are in line with the previous LA-ICP-MS test results; that is, the yellow calcite samples contain more Mg than the pink calcite samples. The results suggest that, although both color varieties are calcite, their local structural environments differ slightly.
Figure 4.
(a) Infrared reflection spectra of yellow calcite samples (400 cm−1–1800 cm−1); (b) infrared reflection spectra of pink calcite samples (400 cm−1–1800 cm−1).
Table 3.
Assignment of infrared spectra of calcite samples.
3.2.2. Raman Spectroscopy
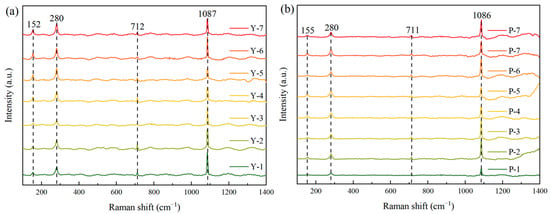
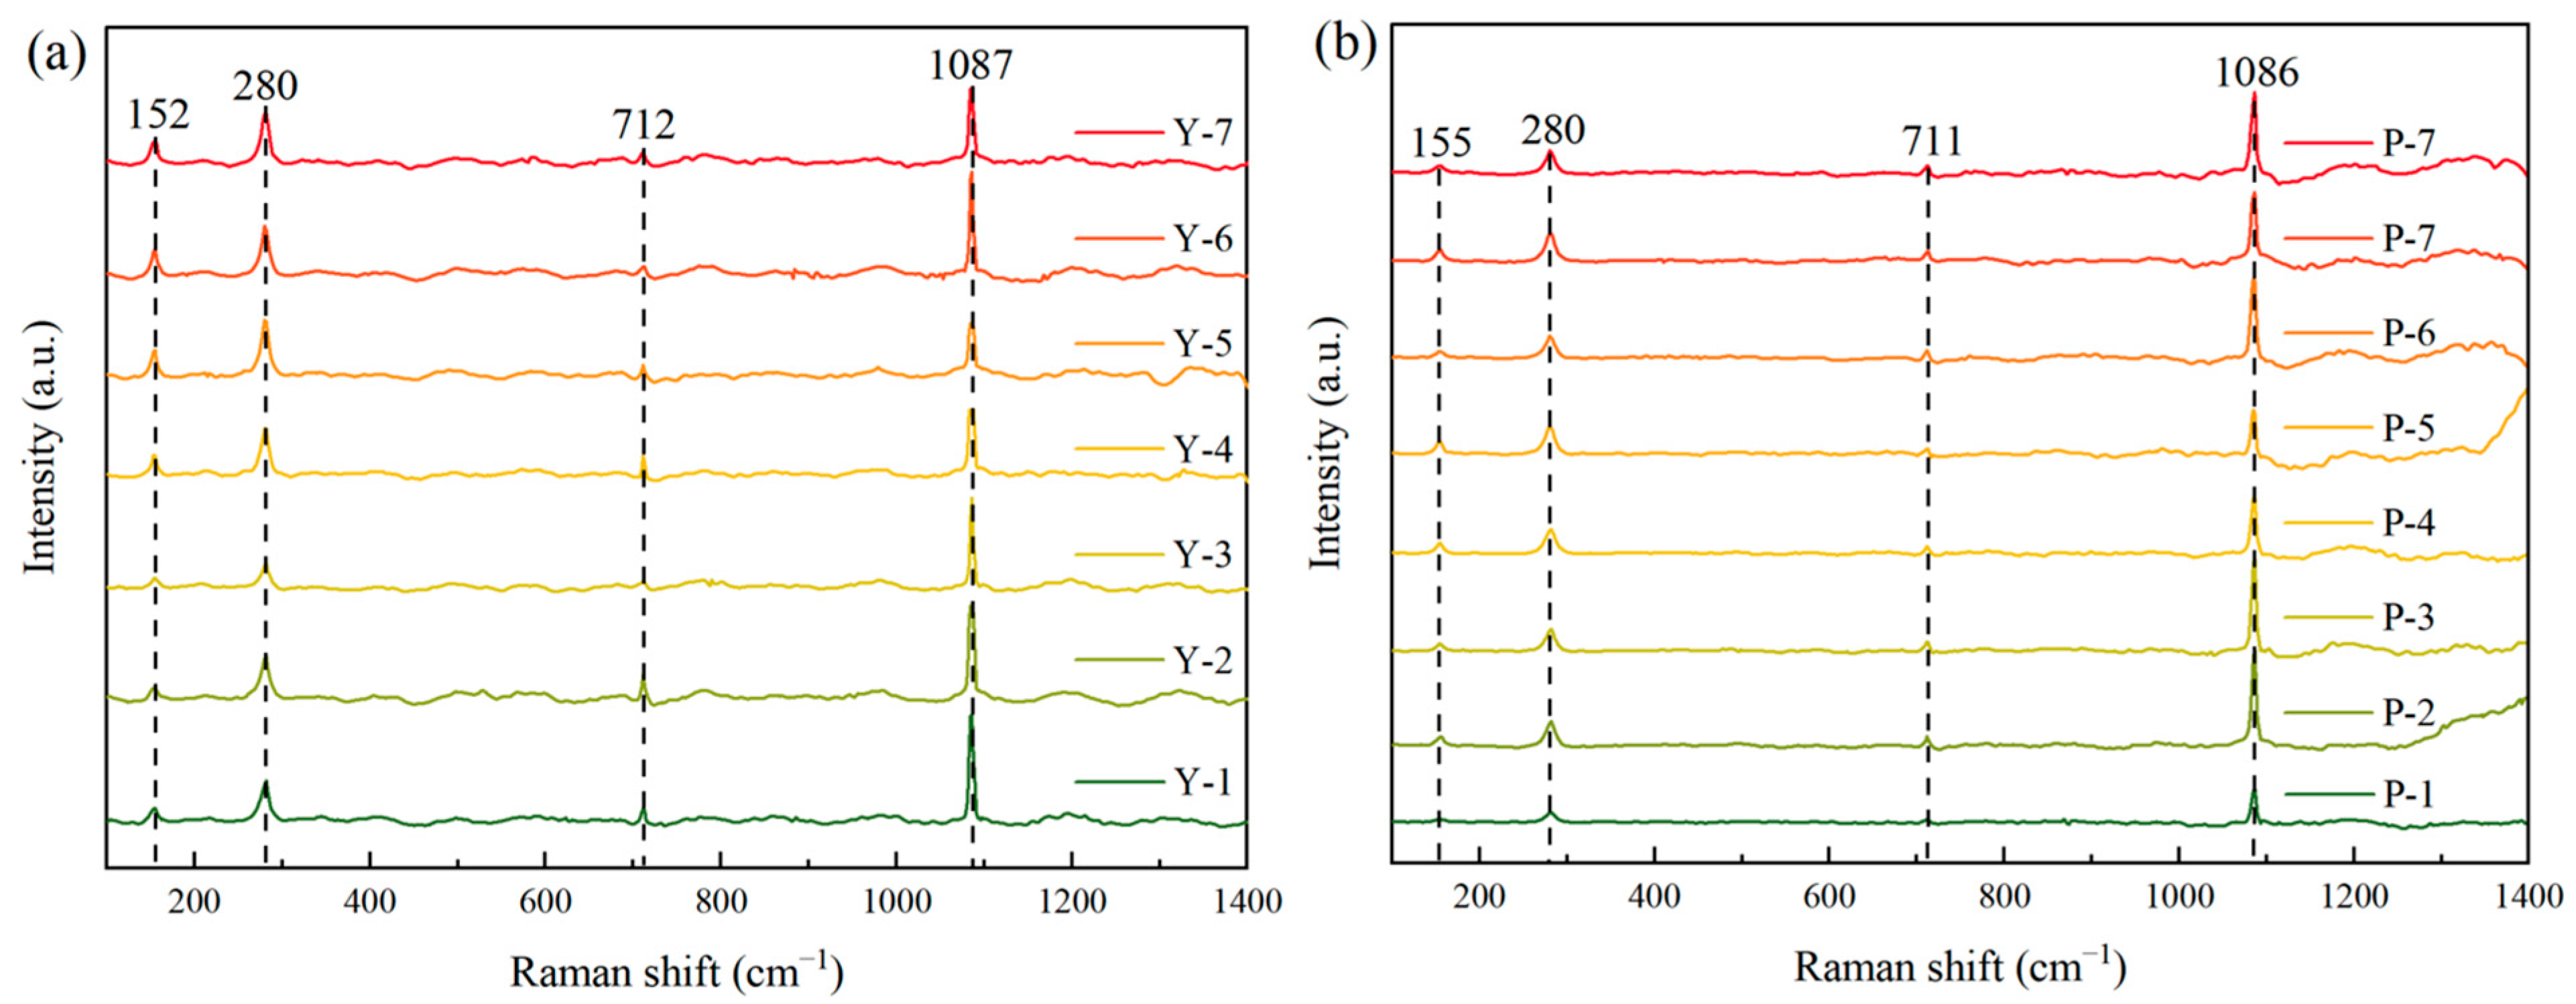
In order to further elucidate the structural differences between the two color varieties of calcite, Raman spectra were collected for all samples, and the corresponding curves were generated from the raw data using Origin software (Origin 2021, OriginLab Corporation, Northampton, MA, USA) (Figure 5). The spectra of both the yellow and pink samples exhibit the characteristic first-order Raman features of calcite, confirming that the two groups share the same structure. Table 4 lists peak positions and assignments for Raman spectra. The peaks observed at approximately 153 cm−1 and 280 cm−1 can be assigned to external lattice modes, corresponding respectively to translational and librational motions involving the Ca2+ cations and [CO3]2− groups. The peak near 712 cm−1 is attributed to the in-plane bending mode of the carbonate group. The intense sharp peak at approximately 1087 cm−1 corresponds to the symmetric stretching vibration of the C-O bond in [CO3]2−. These assignments are in good agreement with the well-established Raman characteristics of calcite reported in previous studies [18].
Figure 5.
(a) Raman spectra of yellow calcite samples (100 cm−1–1400 cm−1); (b) Raman spectra of pink calcite samples (100 cm−1–1400 cm−1).
Table 4.
Assignment of Raman spectra of calcite samples.
Notably, although the overall spectral profiles of the two color varieties are highly similar, the yellow calcite samples show slightly but systematically higher Raman shifts for the in-plane bending mode of the carbonate group and the symmetric stretching vibration of the C-O bond. Such a shift toward higher wavenumbers is typically associated with local lattice contraction and strengthened interatomic interactions, and in calcite this is commonly related to partial substitution of Ca2+ by the smaller Mg2+ ion. This interpretation demonstrates that increasing Mg incorporation in the yellow calcite produces progressive positive shifts in the partial Raman bands because of shortened interatomic distances and enhanced bond strength [19].
3.2.3. UV-Vis Spectra
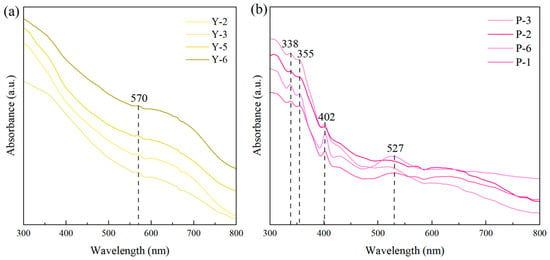
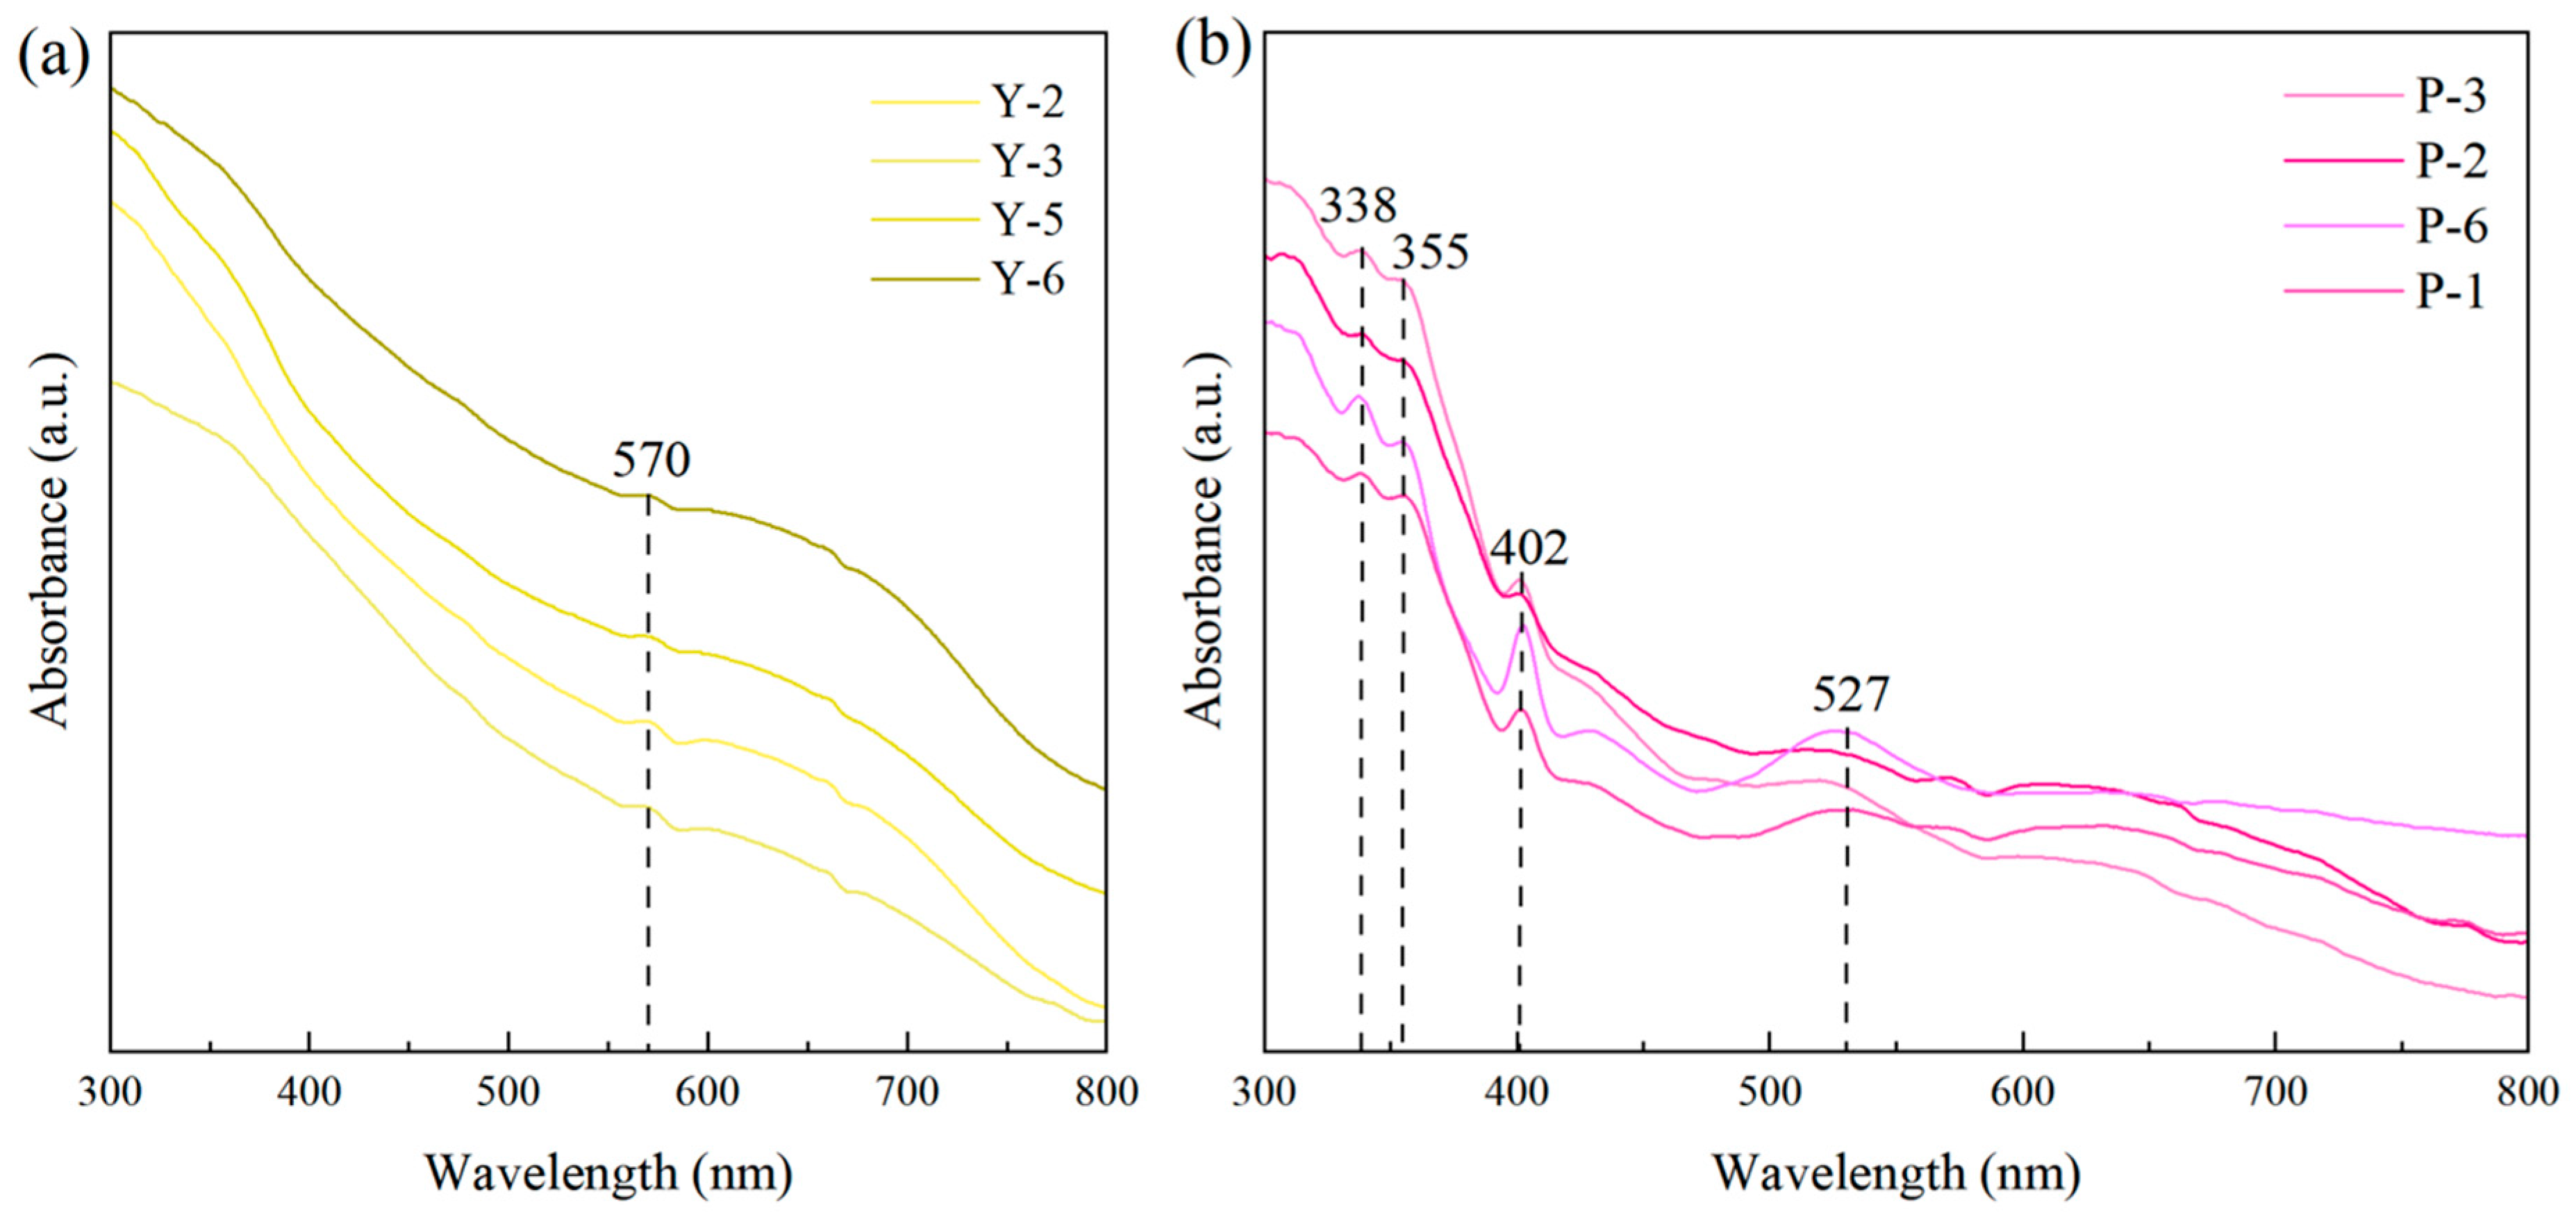
The UV–Vis curves were generated in Origin from the original spectral data. Using a reflectance-based measurement mode, the light absorption behavior of the specimens was examined across the 300–800 nm wavelength range, with absorption features expressed as spectral peaks.
As shown in Figure 6, the yellow calcite samples display only a weak and broad absorption shoulder centered near 570 nm, without sharp absorption bands in the visible region, indicating that their yellow hue is not controlled by a single intense crystal-field transition but more likely by a weak impurity or defect related absorption superimposed on the host-lattice background. Given that the geochemical data show enrichment of Y, Ce, and total REEs in the yellow series, this subdued visible absorption is more reasonably interpreted as the combined effect of minor impurity centers rather than a dominant Fe chromophore. In contrast, the pink calcite samples exhibit distinct absorption features at 338, 355, 402, and 527 nm, among which the bands at 402 and 527 nm are the principal color-causing absorptions in the visible range. Considering the markedly elevated Mn contents of the pink samples and the well-established role of Mn as the major activator and chromophore in calcite-group carbonates, the 402 nm band can be assigned to a Mn-related crystal-field transition, commonly attributed to the spin-allowed 6A1 (S) → 4T1 (4G) transition of Mn2+, whereas the 527 nm band is consistent with absorption by Mn3+, corresponding to the 5Eg → 5T2g transition characteristic of octahedrally coordinated high-spin d4 Mn3+ centers [20]. By comparison, the absorptions at 338 and 355 nm lie mainly in the near-ultraviolet region and therefore contribute less directly to the perceived body color. These bands are regarded as subsidiary Mn-related and defect-assisted absorptions, rather than the dominant chromophoric features. Unlike the unusual pink calcite varieties for which radiation-induced centers have been invoked [12], the present pink calcite is more consistent with a Mn-dominated coloration mechanism, as indicated by the visible absorption bands at 402 and 527 nm together with the strong Mn-related orange–red emission.
Figure 6.
(a) UV-Vis spectra of yellow calcite samples; (b) UV-Vis spectra of pink calcite samples.
3.2.4. Fluorescence Spectra
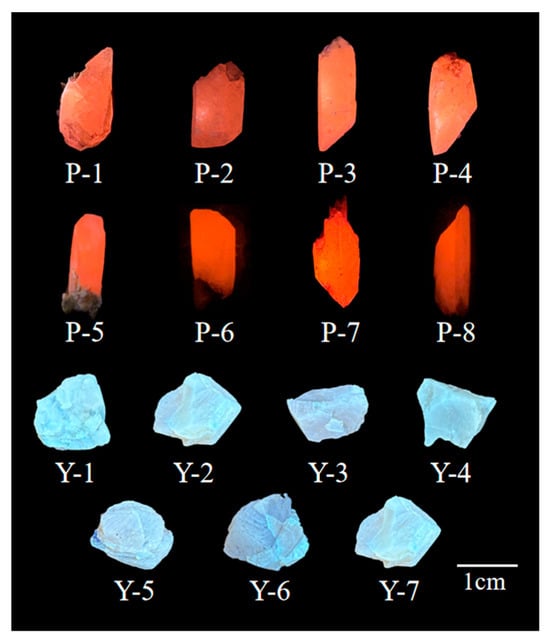
Under long-wave UV excitation, the yellow and pink calcite samples display markedly different luminescence responses (Figure 7), indicating that their emission is controlled by distinct luminescence centers rather than by the calcite host lattice alone.
Figure 7.
Fluorescence photographs of calcite samples under 365 nm ultraviolet excitation.
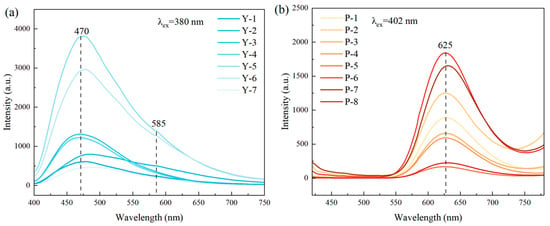
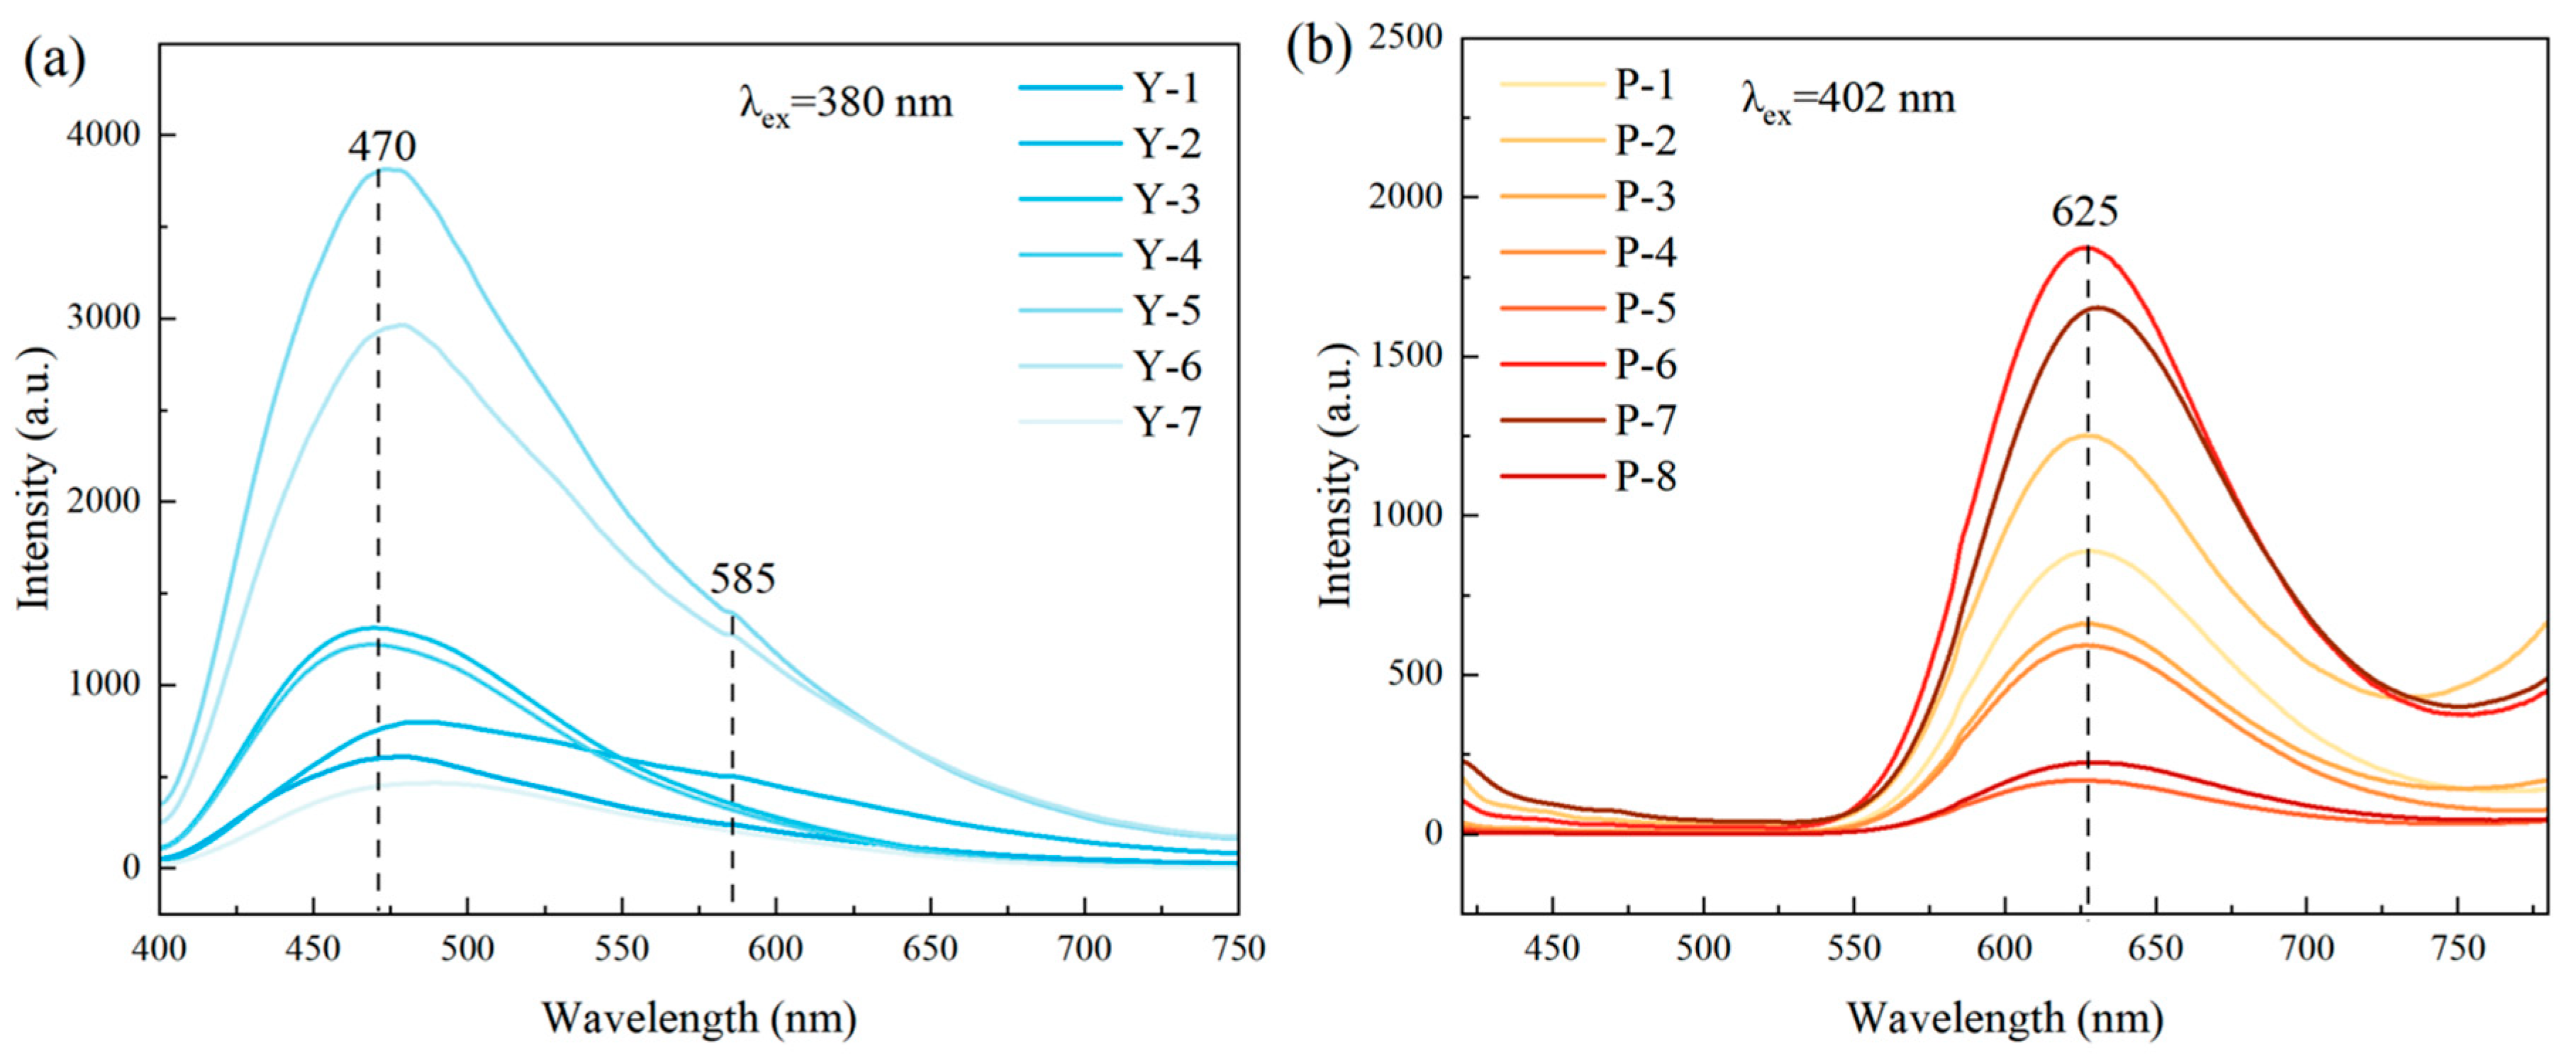
The yellow series exhibits blue–white fluorescence, together with a short-lived green phosphorescent afterglow after removal of the excitation source, whereas the pink series shows stable orange–red fluorescence with much weaker afterglow behavior. As illustrated in Figure 8, the yellow samples exhibit a broad and asymmetric photoluminescence emission band centered at approximately 470 nm under optimal excitation at 380 nm, with a faint shoulder observed near 585 nm. The pink samples display a simpler emission profile, characterized predominantly by a single, remarkable band centered at approximately 625 nm under optimal excitation at 402 nm.
Figure 8.
Fluorescence spectra of calcite samples. (a) Emission spectra of yellow calcite samples. (b) Emission spectra of pink calcite samples.
The broad blue–green emission envelope of the yellow calcite samples suggests that the luminescence is not generated by a single sharply defined activator, but more likely arises from overlapping contributions of defect related and rare earth related centers. In carbonate hosts, broad-band blue emission is consistent with 4f65d1 → 4f7 transitions of Eu2+, while Ce3+ is also known to act as an efficient sensitizer or luminescence center in calcite related systems [21]. Therefore, the emission band centered at 470 nm can be reasonably assigned to contributions from both Eu2+ and Ce3+ ions. However, the current steady-state photoluminescence spectra alone are insufficient to quantitatively deconvolute their individual spectral contributions. The weak feature near 585 nm is compatible with the 5D4 → 7F4 transition of Tb3+, implying that trace rare-earth ions may participate in the yellow calcite emission as subordinate activators [21]. The broad blue–white emission centered near 470 nm is partly comparable to previously reported broad blue bands in yellow calcite, but the geochemical enrichment in REEs and the weak shoulder near 585 nm suggest that the present samples may involve a more complex combination of defect-related and REE-related luminescence centers.
The ~625 nm band of the pink calcite samples falls squarely within the characteristic orange–red emission range of Mn2+ in carbonate lattices and is therefore assigned to the spin-forbidden 4T1 (4G) → 6A1 (6S) transition of octahedrally coordinated Mn2+, an interpretation that is further supported by the distinctly higher Mn content of the pink series revealed by EPMA and by the long-wave UV orange–red fluorescence observed macroscopically [22,23]. Notably, the overall fluorescence intensity of the yellow calcite samples is higher than that of the pink calcite samples under their respective optimal excitation conditions, implying that the yellow-series centers possess either higher excitation efficiency or lower non-radiative loss under near-UV excitation.
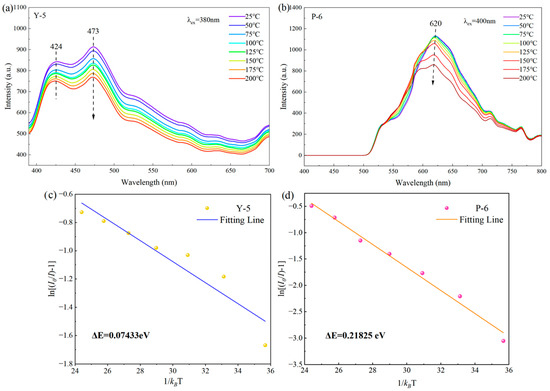
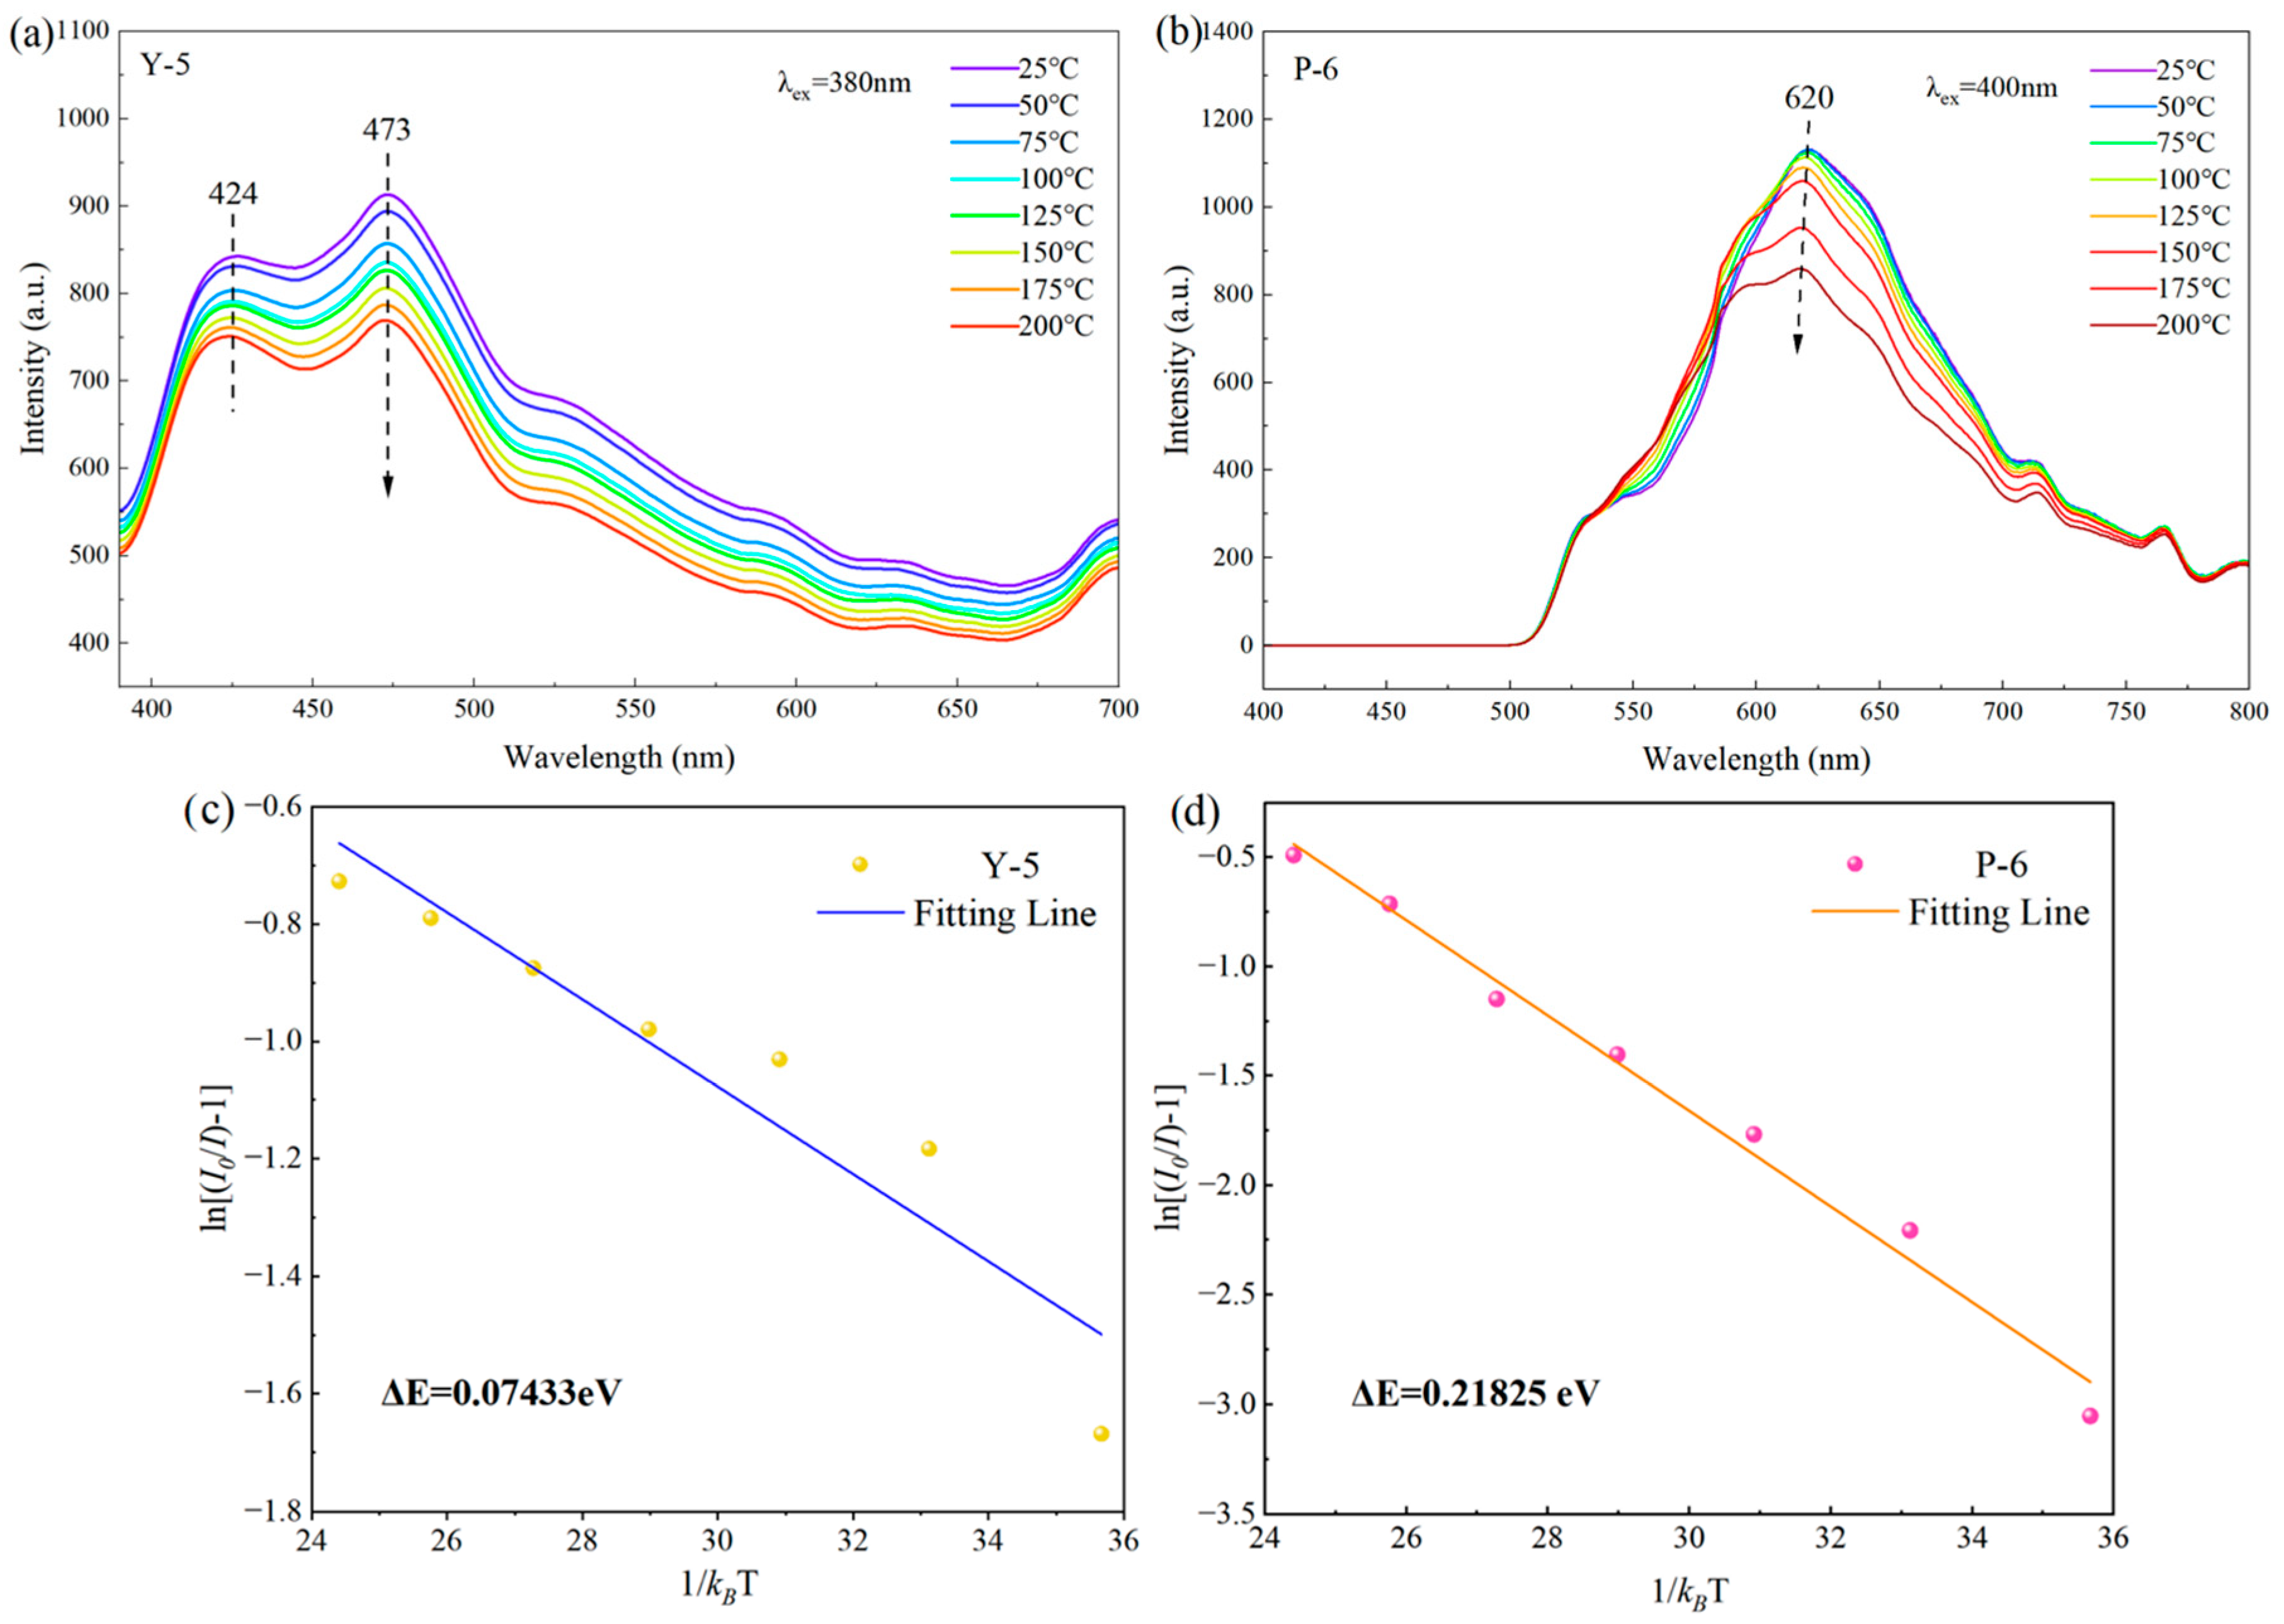
As shown in Figure 9a,b, variable-temperature photoluminescence further highlights the different thermal behaviors of the two color series. During continuous heating, the emission band of the yellow calcite shifts slightly to a longer wavelength and an additional feature appears near 424 nm, which may reflect thermally enhanced resolution of crystal field split Eu2+ 5d states or Ce3+-related sublevels. With increasing temperature, the emission intensity of both samples decreases progressively, indicating that thermally activated non-radiative relaxation increasingly competes with radiative recombination, which is the essential origin of luminescence thermal quenching [21,24]. To quantify this process, the temperature dependence of the integrated emission intensity was fitted using an Arrhenius-type model. The corresponding activation energy reflects the energy barrier that must be overcome for non-radiative decay to occur. Therefore, a larger activation energy indicates better thermal stability of the luminescence center.
where is the initial emission intensity, is the integrated emission intensity at temperature , is a constant related to the probability of non-radiative relaxation, is the activation energy for thermal quenching, and is the Boltzmann constant. By rearranging the above equation, a linear form can be obtained:
Figure 9.
Variable-temperature photoluminescence spectra and thermal quenching analysis of representative calcite samples. (a) Temperature-dependent emission spectra of yellow calcite sample Y-5. (b) Temperature-dependent emission spectra of pink calcite sample P-6. (c) Linear fitting plot for thermal quenching of Y-5. (d) Linear fitting plot for thermal quenching of P-6.
Accordingly, Figure 9c,d plots ln[(/) − 1] against 1/(T). In this representation, the activation energy can be obtained from the slope of the linear fit, so the thermal quenching behavior can be evaluated quantitatively rather than judged only from the visual decrease in emission intensity. According to the fitting results, the activation energy of representative yellow calcite sample Y-5 is 0.074 eV, whereas that of representative pink calcite sample P-6 is 0.218 eV. This result indicates that the luminescence center in the pink calcite has a markedly higher thermal quenching barrier and thus better thermal stability than that in the yellow calcite. Overall, the results of Figure 9c,d demonstrate that the orange–red emission of the pink calcite is more resistant to thermally activated non-radiative decay than the blue–white emission of the yellow calcite.
4. Conclusions
The yellow and pink calcite samples from the Huanggangliang and Xilingol mining areas, respectively, were both structurally identified as calcite; however, they exhibit distinct differences in trace-element concentrations, lattice parameters, coloration, and luminescence. Yellow calcite is relatively enriched in Mg and rare earth elements, especially Y and Ce, whereas pink calcite is characterized by significantly higher Mn and Fe contents. The smaller lattice parameters and unit cell volume of the pink calcite indicate stronger substitution of Ca2+ by smaller radius cations. Spectroscopic results indicate only minor variations in the local structural environment between the two calcite varieties. The pink color is mainly controlled by Mn-related absorption in the visible region, whereas the yellow color is more likely associated with weak impurity- and defect-related absorption. Photoluminescence measurements reveal broad blue–white emission for yellow calcite and characteristic orange–red Mn2+ emission for pink calcite. In addition, the pink calcite shows markedly better resistance to thermal quenching than the yellow calcite. Overall, this study establishes the intrinsic link between trace-element incorporation and the optical properties of calcite, and provides a mineralogical basis for understanding coloration and luminescence in carbonate minerals.
Supplementary Materials
The following supporting information can be downloaded at https://www.mdpi.com/article/10.3390/cryst16050297/s1. Table S1: Empirical formulas of calcite samples calculated from EPMA data on the basis of one A-site cation per formula unit; Table S2: LA-ICP-MS data of calcite samples (ppm).
Author Contributions
Q.Y., analysis and writing—original manuscript; W.L., investigation and writing—original manuscript; Q.G., review and editing. All authors have read and agreed to the published version of the manuscript.
Funding
This study was supported by the National Science and Technology Infrastructure—The National Infrastructure of Mineral, Rock and Fossil Resources for Science and Technology (http//www.nimrf.net.cn, accessed on 25 December 2021), as well as the Program of the Data Integration and Standardization in the Geological Science and Technology from MOST, China, grant number 2013FY110900-3.
Data Availability Statement
The original contributions presented in this study are included in the article/Supplementary Materials. Further inquiries can be directed to the corresponding author.
Acknowledgments
We would like to thank the laboratory of the School of Gemology, China University of Geosciences, Beijing, for their assistance with the experiments. We also sincerely thank the anonymous reviewers for their constructive comments and valuable suggestions, which greatly helped us improve the scientific quality and clarity of this manuscript. In addition, we are grateful to the Academic Editor and the editorial staff for their careful handling of the manuscript and for their efforts in ensuring the quality control of the peer-review and publication process.
Conflicts of Interest
Author Qiuli Yan was employed by the company Beijing Zhongdi Xinke Jewelry Appraisal Co., Ltd. The remaining authors declare that the research was conducted in the absence of any commercial or financial relationships that could be construed as a potential conflict of interest.
References
- Hazen, R.M.; Downs, R.T.; Kah, L.; Sverjensky, D. Carbon mineral evolution. Rev. Mineral. Geochem. 2013, 75, 79–107. [Google Scholar] [CrossRef] [Scilit]
- Tesoriero, A.J.; Pankow, J.F. Solid solution partitioning of Sr2+, Ba2+, and Cd2+ to calcite. Geochim. Cosmochim. Acta 1996, 60, 1053–1063. [Google Scholar] [CrossRef] [Scilit]
- Cheng, Q.; Dong, Y.; Kang, M.; Zhang, P. Preparation and tunable luminescence of CaCO3: Eu3+, Tb3+ phosphors. J. Lumin. 2014, 156, 91–96. [Google Scholar] [CrossRef] [Scilit]
- Kang, M.; Liu, J.; Sun, R.; Yin, G.-F.; Wang, X.-M.; Yan, W.-Q. Synthesis of the CaCO3: Eu3+ red phosphor by microwave method. Spectrosc. Spectr. Anal. 2010, 30, 225–229. [Google Scholar] [CrossRef]
- Sun, Y.; Zou, H.; Zhang, B.; Zhou, X.; Song, Y.; Zheng, K.; Shi, Z.; Sheng, Y. Luminescent properties and energy transfer of Gd3+/Eu3+ co-doped cubic CaCO3. J. Lumin. 2016, 178, 307–313. [Google Scholar] [CrossRef] [Scilit]
- Xu, Q.; Tong, X.; Han, J.; Zhang, X. A study on the tunable emission induced by energy transfer in rare-earth-free calcite-and vaterite-type CaCO3 co-doped with Sn2+ and Mn2+ phosphors. J. Alloys Compd. 2019, 807, 151699. [Google Scholar] [CrossRef] [Scilit]
- Dai, Y.; Zou, H.; Zhu, H.; Zhou, X.; Song, Y.; Zheng, K.; Shi, Z.; Sheng, Y. Facile surfactant-and template-free synthesis and luminescence properties of needle-like calcite CaCO3: Eu3+ phosphors. Cryst. Eng. Comm. 2018, 20, 496–504. [Google Scholar] [CrossRef] [Scilit]
- Sidike, A.; Wang, X.-M.; Sawuti, A.; Zhu, H.-J.; Kusachi, I.; Yamashita, N. Energy transfer among Pb, Ce and Mn in fluorescent calcite from Kuerle, Xinjiang, China. Phys. Chem. Miner. 2006, 33, 559–566. [Google Scholar] [CrossRef] [Scilit]
- Blasse, G.; Aguilar, M. Luminescence of natural calcite (CaCO3). J. Lumin. 1984, 29, 239–241. [Google Scholar] [CrossRef] [Scilit]
- Kraienhemke, R.; Semig, P.; Fischer, F. TSZM-Growth and Optical Properties of Lead Activated Calcite Crystals. Phys. Status Solidi (A) 1990, 119, 327–336. [Google Scholar] [CrossRef] [Scilit]
- Zhang, X.; Wang, N.; Gong, Y. A comprehensive study on the gemological and mineralogical characteristics and coloration mechanisms of four color varieties of natural topaz. RSC Adv. 2025, 15, 17675–17684. [Google Scholar] [CrossRef] [Scilit] [PubMed]
- Gaft, M.; Nagli, L.; Panczer, G.; Waychunas, G.; Porat, N. The nature of unusual luminescence in natural calcite CaCO3. Am. Mineral. 2008, 93, 158–167. [Google Scholar]
- Wang, Z.; Chen, J.; Cai, H.; Yuan, W.; Yuan, S. Coprecipitation of metal ions into calcite: An estimation of partition coefficients based on field investigation. Acta Geochim. 2021, 40, 67–77. [Google Scholar]
- Bau, M.; Moeller, P. Rare earth element fractionation in metamorphogenic hydrothermal calcite, magnesite and siderite. Mineral. Petrol. 1992, 45, 231–246. [Google Scholar]
- Zhao, Z.-Y.; Lin, Y.-T.; Zhao, Y.; Xu, B. Mineralogical characteristics study of calcite from the Fujian Province, China. Crystals 2022, 13, 51. [Google Scholar] [CrossRef] [Scilit]
- Farmer, V.C. The Infrared Spectra of Minerals. Mineral. Soc. Monogr. 1974, 4, 331–363. [Google Scholar] [CrossRef] [Scilit]
- Gunasekaran, S.; Anbalagan, G. Spectroscopic characterization of natural calcite minerals. Spectrochim. Acta Part A Mol. Biomol. Spectrosc. 2007, 68, 656–664. [Google Scholar]
- Gunasekaran, S.; Anbalagan, G.; Pandi, S. Raman and infrared spectra of carbonates of calcite structure. J. Raman Spectrosc. 2006, 37, 892–899. [Google Scholar] [CrossRef] [Scilit]
- Borromeo, L.; Zimmermann, U.; Andò, S.; Coletti, G.; Bersani, D.; Basso, D.; Gentile, P.; Schulz, B.; Garzanti, E. Raman spectroscopy as a tool for magnesium estimation in Mg-calcite. J. Raman Spectrosc. 2017, 48, 983–992. [Google Scholar]
- Czaja, M.; Lisiecki, R.; Chrobak, A.; Sitko, R.; Mazurak, Z. The absorption-and luminescence spectra of Mn3+ in beryl and vesuvianite. Phys. Chem. Miner. 2018, 45, 475–488. [Google Scholar]
- Gaft, M.; Reisfeld, R.; Panczer, G. Modern Luminescence Spectroscopy of Minerals and Materials; Springer: Berlin/Heidelberg, Germany, 2005. [Google Scholar]
- Walker, G.; Abumere, O.; Kamaluddin, B. Luminescence spectroscopy of Mn2+ rock-forming carbonates. Mineral. Mag. 1989, 53, 201–211. [Google Scholar] [CrossRef] [Scilit]
- Mason, R.; Clouter, M.; Goulding, R. The luminescence decay-time of Mn2+ activated calcite. Phys. Chem. Miner. 2005, 32, 451–459. [Google Scholar] [CrossRef] [Scilit]
- Reshchikov, M.A. Mechanisms of thermal quenching of defect-related luminescence in semiconductors. Phys. Status Solidi (A) 2021, 218, 2000101. [Google Scholar] [CrossRef] [Scilit]

Disclaimer/Publisher’s Note: The statements, opinions and data contained in all publications are solely those of the individual author(s) and contributor(s) and not of MDPI and/or the editor(s). MDPI and/or the editor(s) disclaim responsibility for any injury to people or property resulting from any ideas, methods, instructions or products referred to in the content. |
© 2026 by the authors. Licensee MDPI, Basel, Switzerland. This article is an open access article distributed under the terms and conditions of the Creative Commons Attribution (CC BY) license.