


Abstract
Aimed at improving the mechanical performance of welded joints in stainless steel composite materials, this research investigates the evolutionary characteristics of microstructure at the interface between the transition layer weld and base layer weld through electron backscatter diffraction (EBSD) and X-ray diffraction (XRD) analytical techniques. In addition, molecular dynamics simulation methods are employed to conduct an in-depth study on the atomic diffusion behavior during the welding process. The results show that carbon and chromium atoms undergo asymmetric diffusion at the interface, forming a decarburized and a carburized zone. The diffusion coefficient of carbon atoms was the largest, with the diffusion mechanism being interstitial diffusion. Followed by chromium atoms, the diffusion coefficient of Fe was the smallest. On the base layer weld side, two structural zones with different grain sizes were formed; the zone close to the interface was a coarse ferrite microstructure with the lower geometrically necessary dislocation density, the zone far from the interface was a finer-grained ferrite and pearlite microstructure. As the welding heat input of the transition layer weld increases, the average density of geometrically necessary dislocations, the decarburized layer thickness, the average grain size, and the diffusion coefficients of Cr and C atoms at the interface all exhibit a concomitant upward trend. Concurrently, a carbon–chromium compound precipitates at the interface.
1. Introduction
Stainless steel composite materials, characterized by their remarkable strength, outstanding corrosion prevention capabilities, and cost-effectiveness, find extensive application in the manufacturing of large-scale equipment, especially within the petroleum and chemical industries [1,2]. These industries involve harsh service conditions such as high temperature, high pressure, and corrosive media (e.g., H2S, and naphthenic acid), where the structural integrity of equipment directly determines operational safety and economic benefits. Welding technology serves as an indispensable manufacturing process within this domain, playing a pivotal role in structural component fabrication [3]. From the perspectives of chemical and physical metallurgy, the welding procedure for stainless steel composite materials presents significantly greater complexity compared to the welding of single materials [4], primarily due to the inherent heterogeneity of their structure and the conflicting thermophysical properties between the substrate and the cladding material.
The welding joint exhibits a complex structure, comprising three distinct weld layers: the base layer weld, the transition layer weld, and the cladding layer weld [5,6,7]. The transition layer, serving as a metallurgical bridge between the base and cladding layers, plays a critical role in mitigating elemental dilution and improving joint compatibility—its composition design and welding quality directly affect the overall performance of the joint [8]. The welded joint further includes heat-affected zones (HAZs) that correspond to each of the three weld layers [9,10], where significant microstructural transformations occur due to the thermal cycle during welding. For instance, the HAZ of the carbon steel base layer may experience grain coarsening or martensitic transformation, while the stainless steel cladding layer’s HAZ might suffer from sensitization due to chromium carbide precipitation [11,12]. The chemical composition, microstructure, and mechanical properties of each layer and its corresponding heat-affected zone vary significantly [13,14,15]; for example, the base layer emphasizes tensile strength and toughness, the cladding layer prioritizes corrosion resistance, and the transition layer requires a balance of both to ensure interfacial bonding [16,17].
During the welding procedure, a series of interface regions are generated between the transition layer and the layers adjacent to it, and the thermodynamic and kinetic behaviors at these interfaces are highly sensitive to welding parameters. Subjected to chemical potential gradients, temperature variations, and stress fields, the interdiffusion of elements including Fe, Cr, and C across the interface regions detrimentally impacts the mechanical properties of welded joints [18,19,20]. Particularly, the interface boundary between the transition layer weld and base layer weld has been identified as a critical factor influencing the overall performance characteristics of the welded assembly [21]. This interface is not only the area where residual stress accumulates [22,23], but also the main path for element diffusion. During the welding process, carbon atoms in the carbon steel layer tend to diffuse into the stainless steel layer, forming decarburized layers in the carbon steel layer, and chromium carbide (M23C6) precipitates at grain boundaries in the stainless steel, which reduces the corrosion resistance and toughness of the joint [24,25]. Researchers have comprehensively studied the microstructural characteristics and mechanical performance of welded connections [26,27,28]. However, there is a significant research gap in understanding the fundamental thermodynamic and kinetic principles governing elemental diffusion behaviors in the transitional region of weld interfaces during welding. Existing studies mainly focus on qualitative descriptions of diffusion phenomena, lacking quantitative analysis of key parameters such as diffusion activation energy and diffusion coefficient under the coupled effects of temperature, stress, and chemical composition [29]. This restricts the precise control of welding quality and the reliability improvement of stainless steel composite equipment.
To enhance welding quality and refine manufacturing procedures, it is therefore necessary to carry out comprehensive research on the atomic diffusion behaviors that occur at the weld interface within the transition zone, ensuring the long-term service safety of equipment. In this study, a combined approach of experiments and numerical simulations is employed to examine the interfacial characteristics and atomic diffusion behavior at the transition layer weld/base layer weld interface. Based on the diffusion dynamics theory, a numerical model for the interface was established. This study systematically investigates the interface diffusion behaviors of iron, chromium, and carbon atoms through computational simulation-based analyses. It specifically focuses on quantifying their diffusion activation energy values and calculating the corresponding diffusion coefficients. The formation process of the microstructure at this interface was clarified from the perspectives of thermodynamics and dynamics, laying a theoretical foundation for the high-quality welding of stainless steel composite materials.
2. Materials and Methods
The experimental program employed S32304/Q390C (Qinhuangdao Shougang Plate Co., Ltd., Qinhuangdao, China) material as the fundamental test material. This multi-layered construction features a 16 mm thick Q390C carbon steel base layer bonded with 2 mm thick S32304 austenitic stainless steel cladding. The precise chemical compositions of both constituent materials are detailed in Table 1.
Table 1.
Presents the chemical compositions (in weight percentage, wt%) of base materials and filler metals.
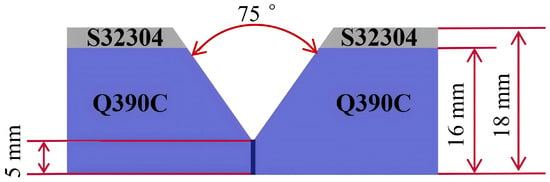
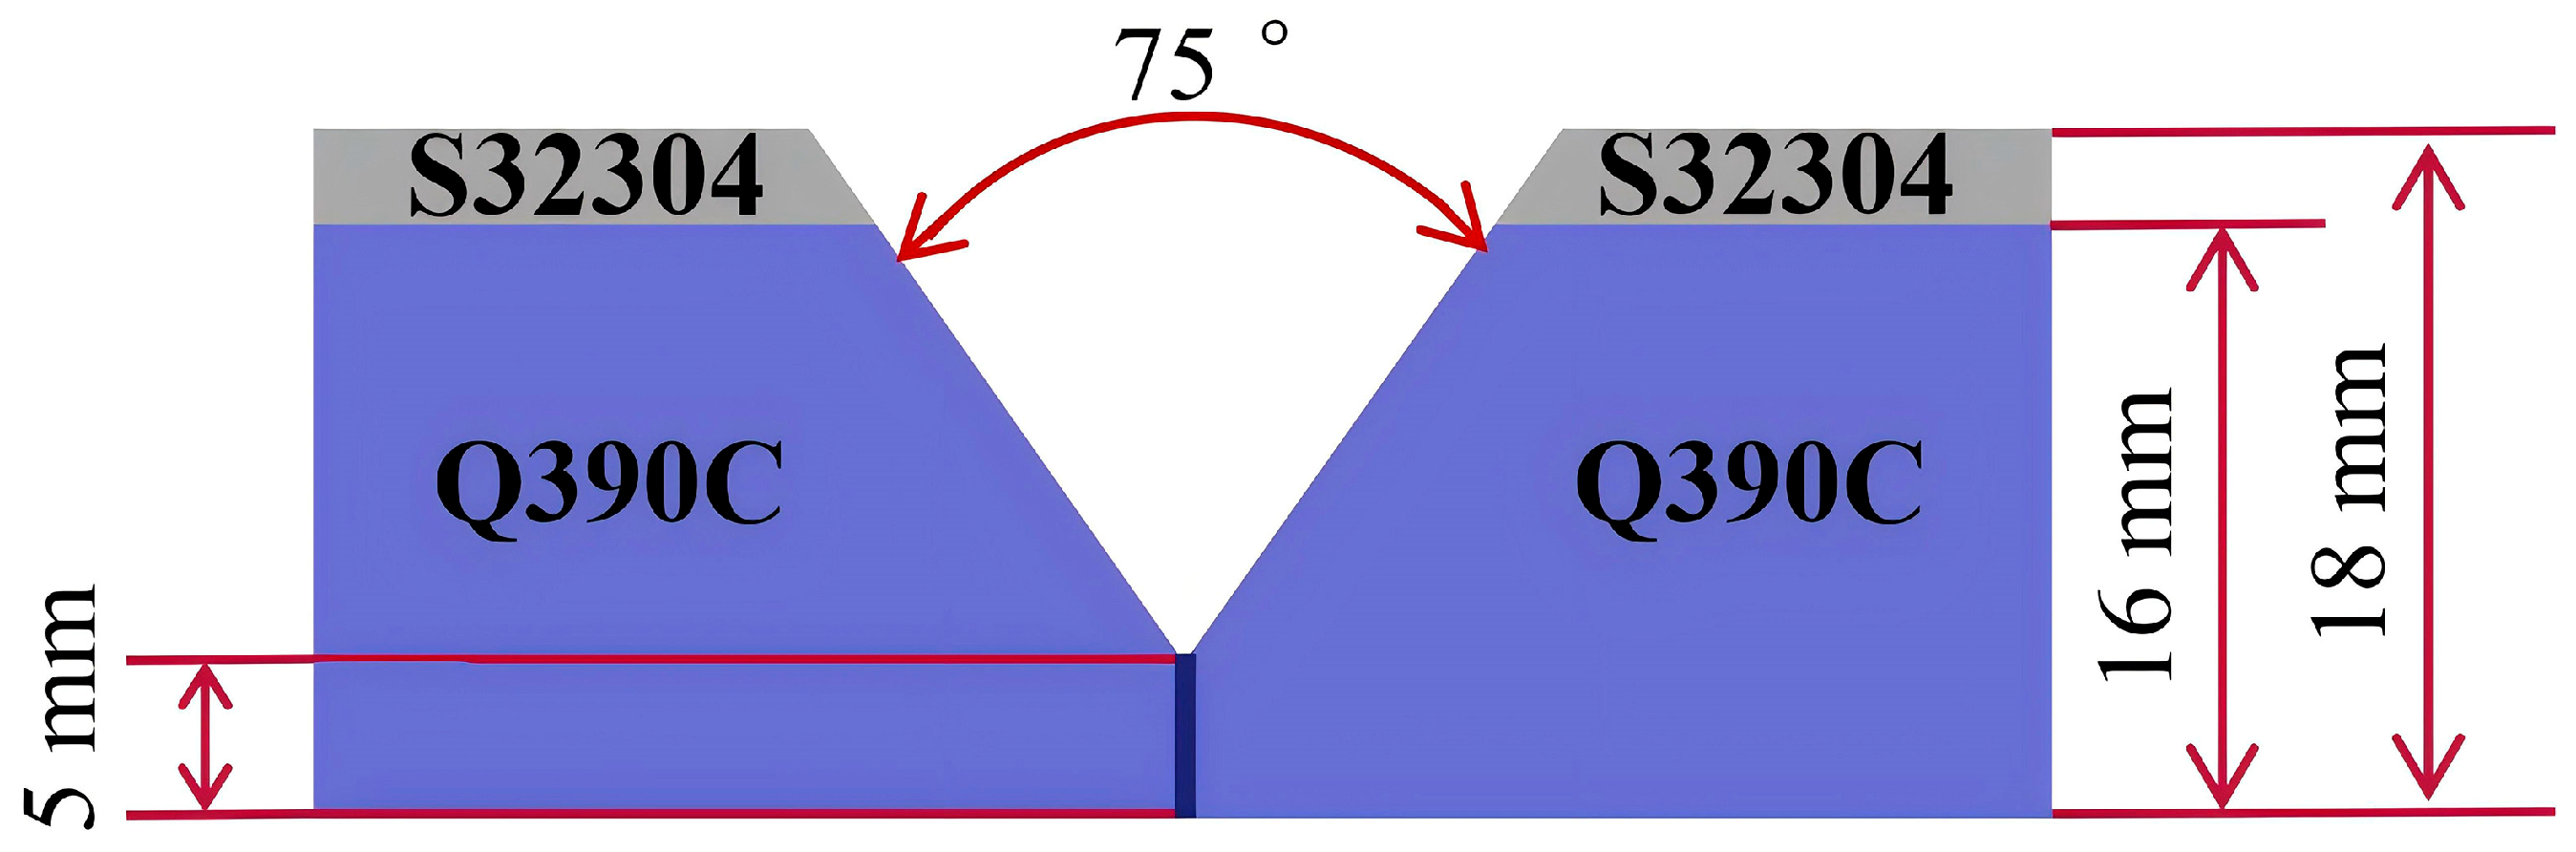
Welding operations utilized a Y-shaped groove configuration characterized by a 75° included angle and 5 mm root face dimension. The geometric specifications of this groove design are visually represented in Figure 1. The selection of welding materials followed established metallurgical compatibility criteria, emphasizing both chemical composition alignment and mechanical property matching across joint regions. For the base layer deposition, solid H08MnA (Tianjin BRIDGE Welding MATERIALS Group Co., Ltd., Tianjin, China) welding wire (3.2 mm diameter) was combined with SJ101 granular flux to achieve proper fusion with the substrate material. The cladding layer application employed ER2209 (Tianjin BRIDGE Welding MATERIALS Group Co., Ltd., Tianjin, China) austenitic–ferritic duplex stainless steel wire with 1.2 mm diameter, while ER309LMo (Tianjin BRIDGE Welding MATERIALS Group Co., Ltd., Tianjin, China) low-carbon austenitic stainless steel wire served as the transition layer filler material to mitigate carbon migration issues. The comprehensive elemental compositions of all welding consumables are documented in Table 1, with corresponding mechanical performance data for both the welding materials and base plates provided in Table 2.
Figure 1.
The schematic diagram of the welding groove.
Table 2.
The mechanical characteristics of welding materials.
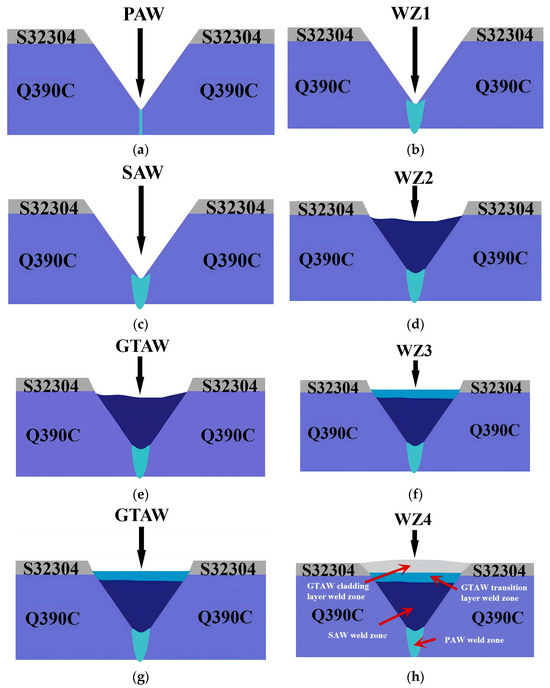
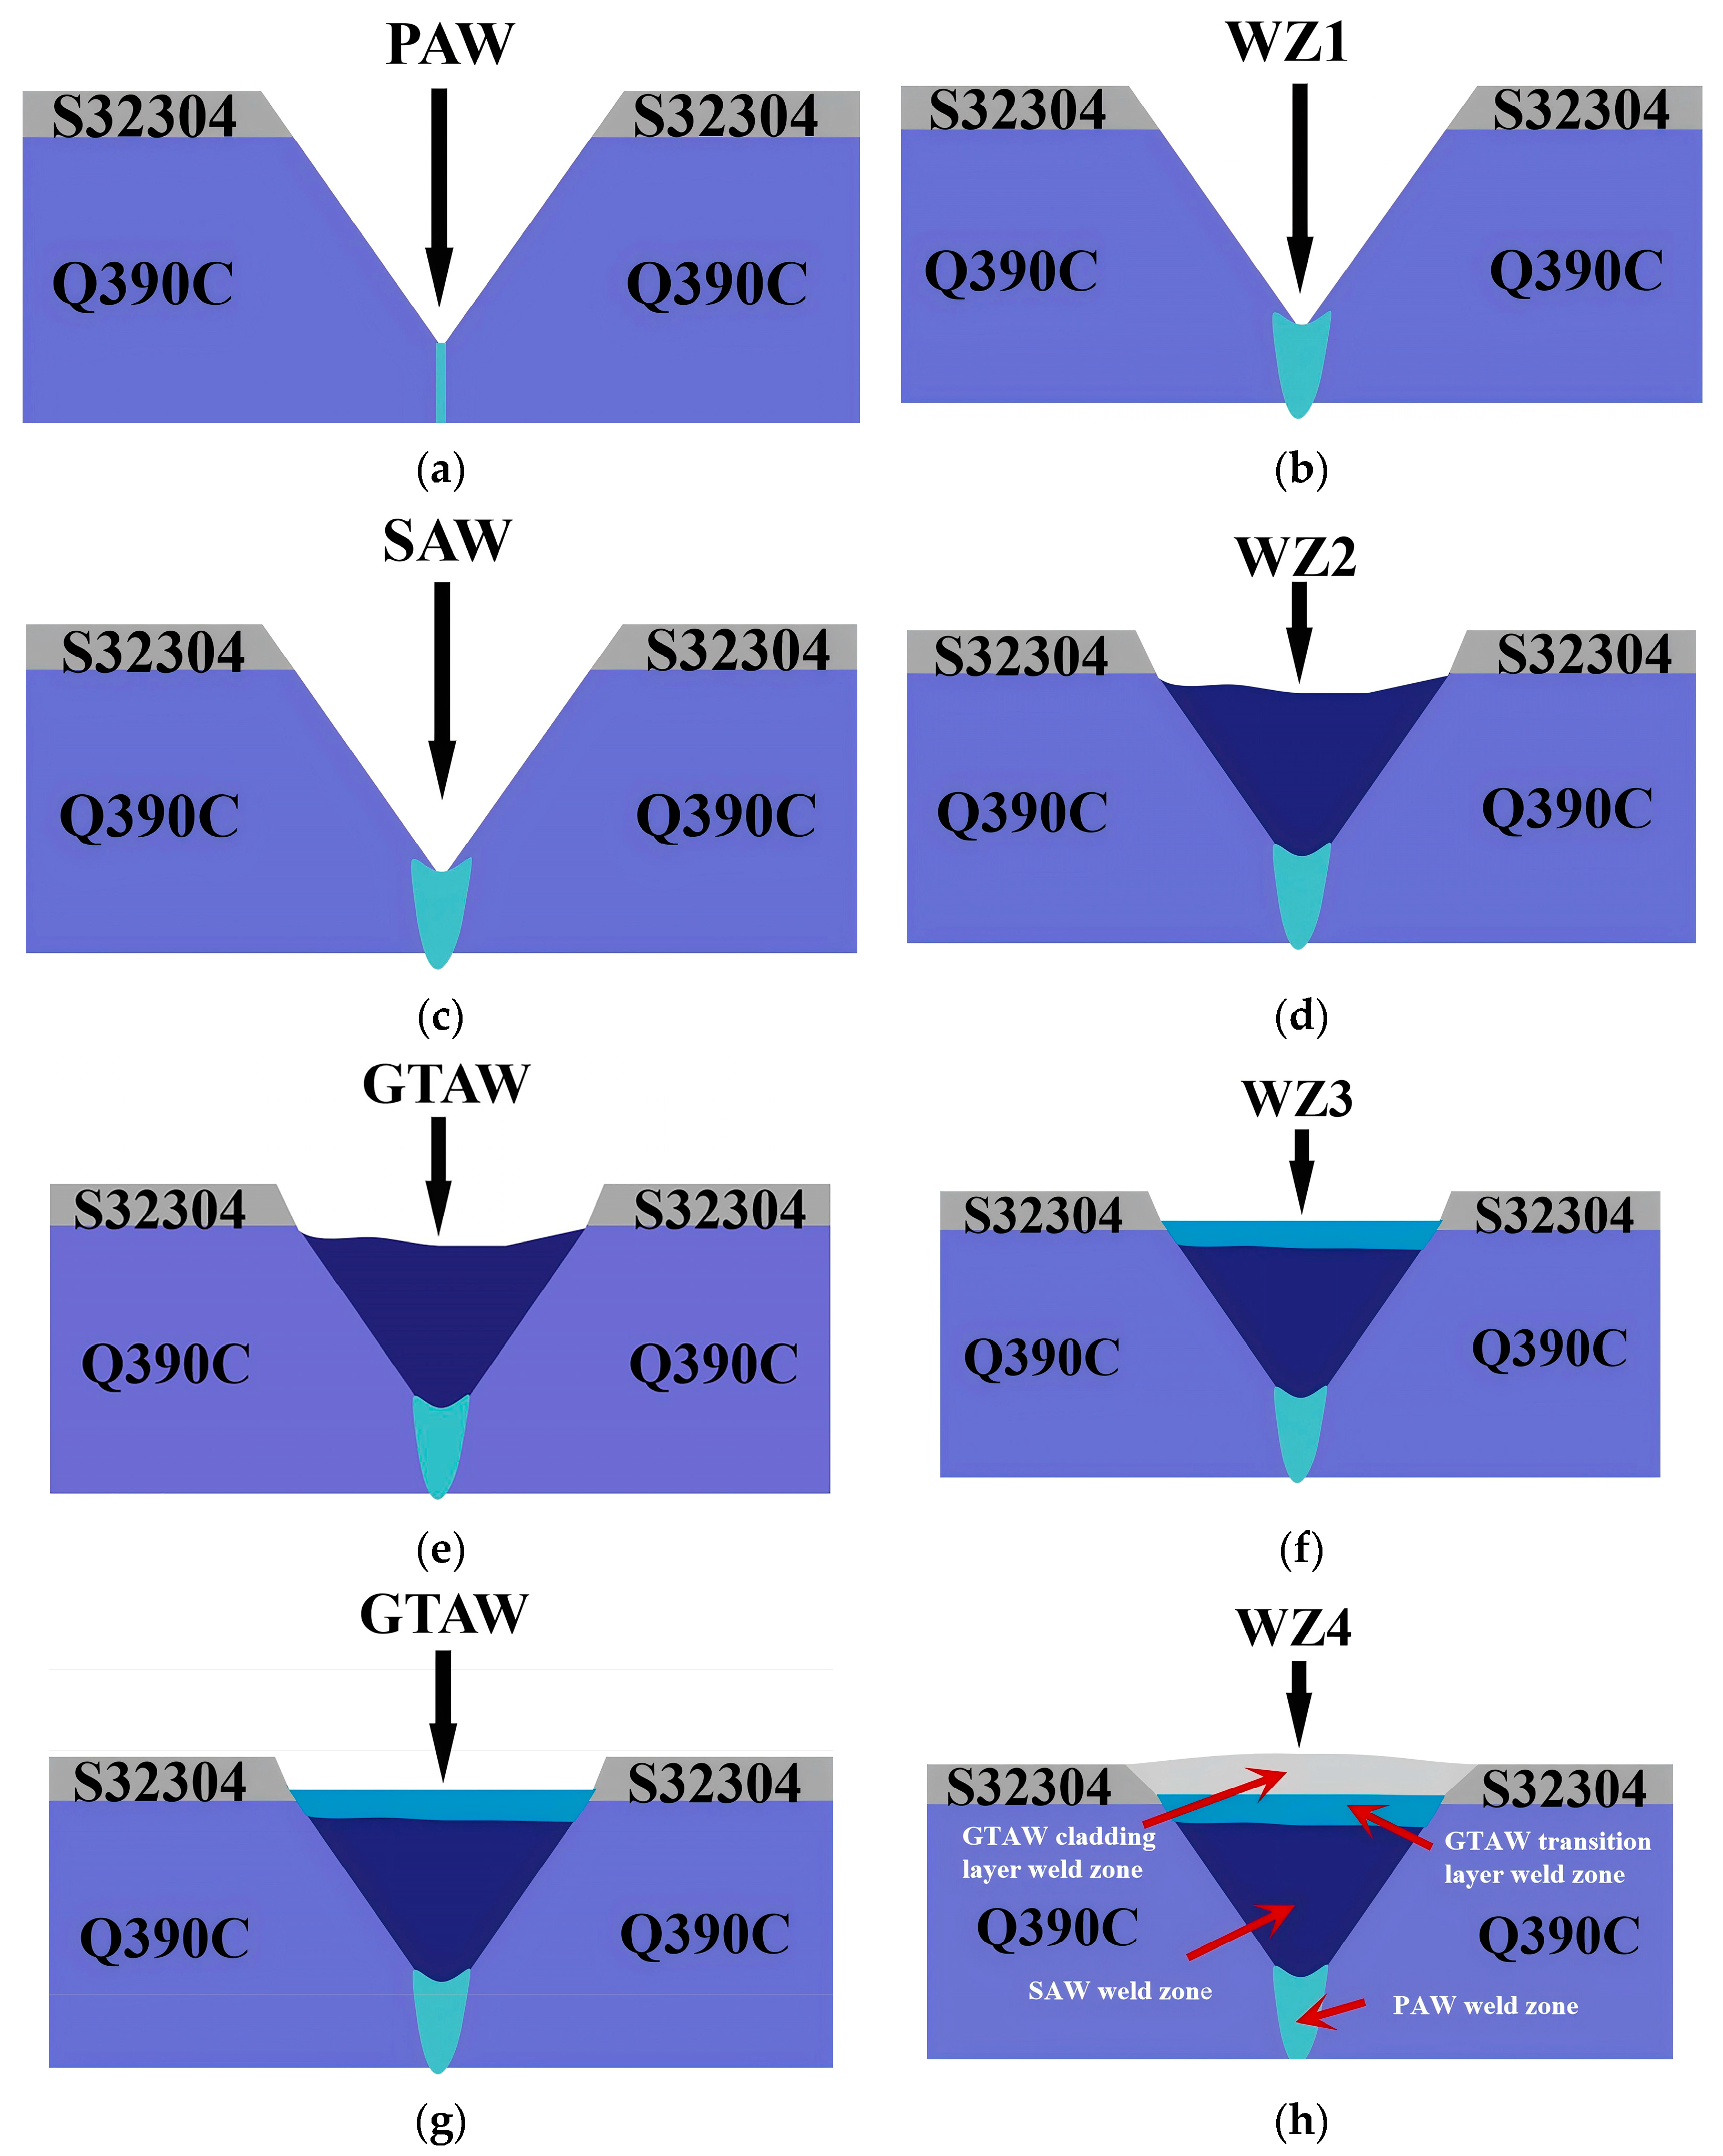
In this welding experiment, plasma arc welding and submerged arc welding were used for the base weld first. Then, gas tungsten arc welding was used for the transition layer. Finally, gas tungsten arc welding was used again for the cladding layer. The single-pass multi-layer welding process was adopted, the interlayer temperature of the weld seam was controlled below 100 °C, and the schematic diagram of the welding procedure is shown in Figure 2. The whole welding used a single-pass multi-layer deposition method. According to the welding procedure specifications, the interlayer temperature was strictly controlled below 100 °C during the entire welding process. Figure 2 shows a detailed step-by-step illustration of the welding process. Table 3 shows the parameters of the welding process.
Figure 2.
The schematic diagram of the welding procedure of S32304/Q390C bimetallic sheet. (a) PAW process; (b) After PAW; (c) SAW process; (d) After SAW; (e) GTAW process for the transition layer weld; (f) After GTAW of the transition layer weld; (g) GTAW Process for the cladding layer weld; (h) After GTAW of the cladding layer weld.
Table 3.
The welding parameters.
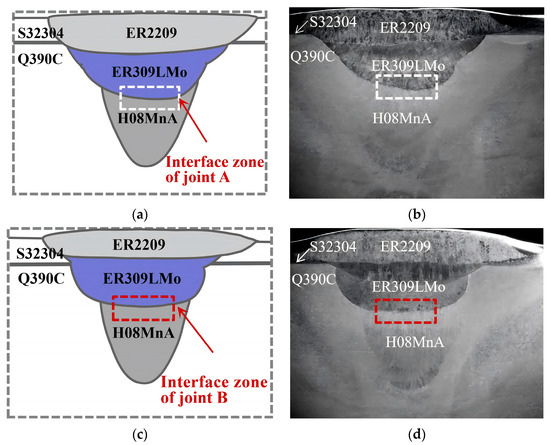
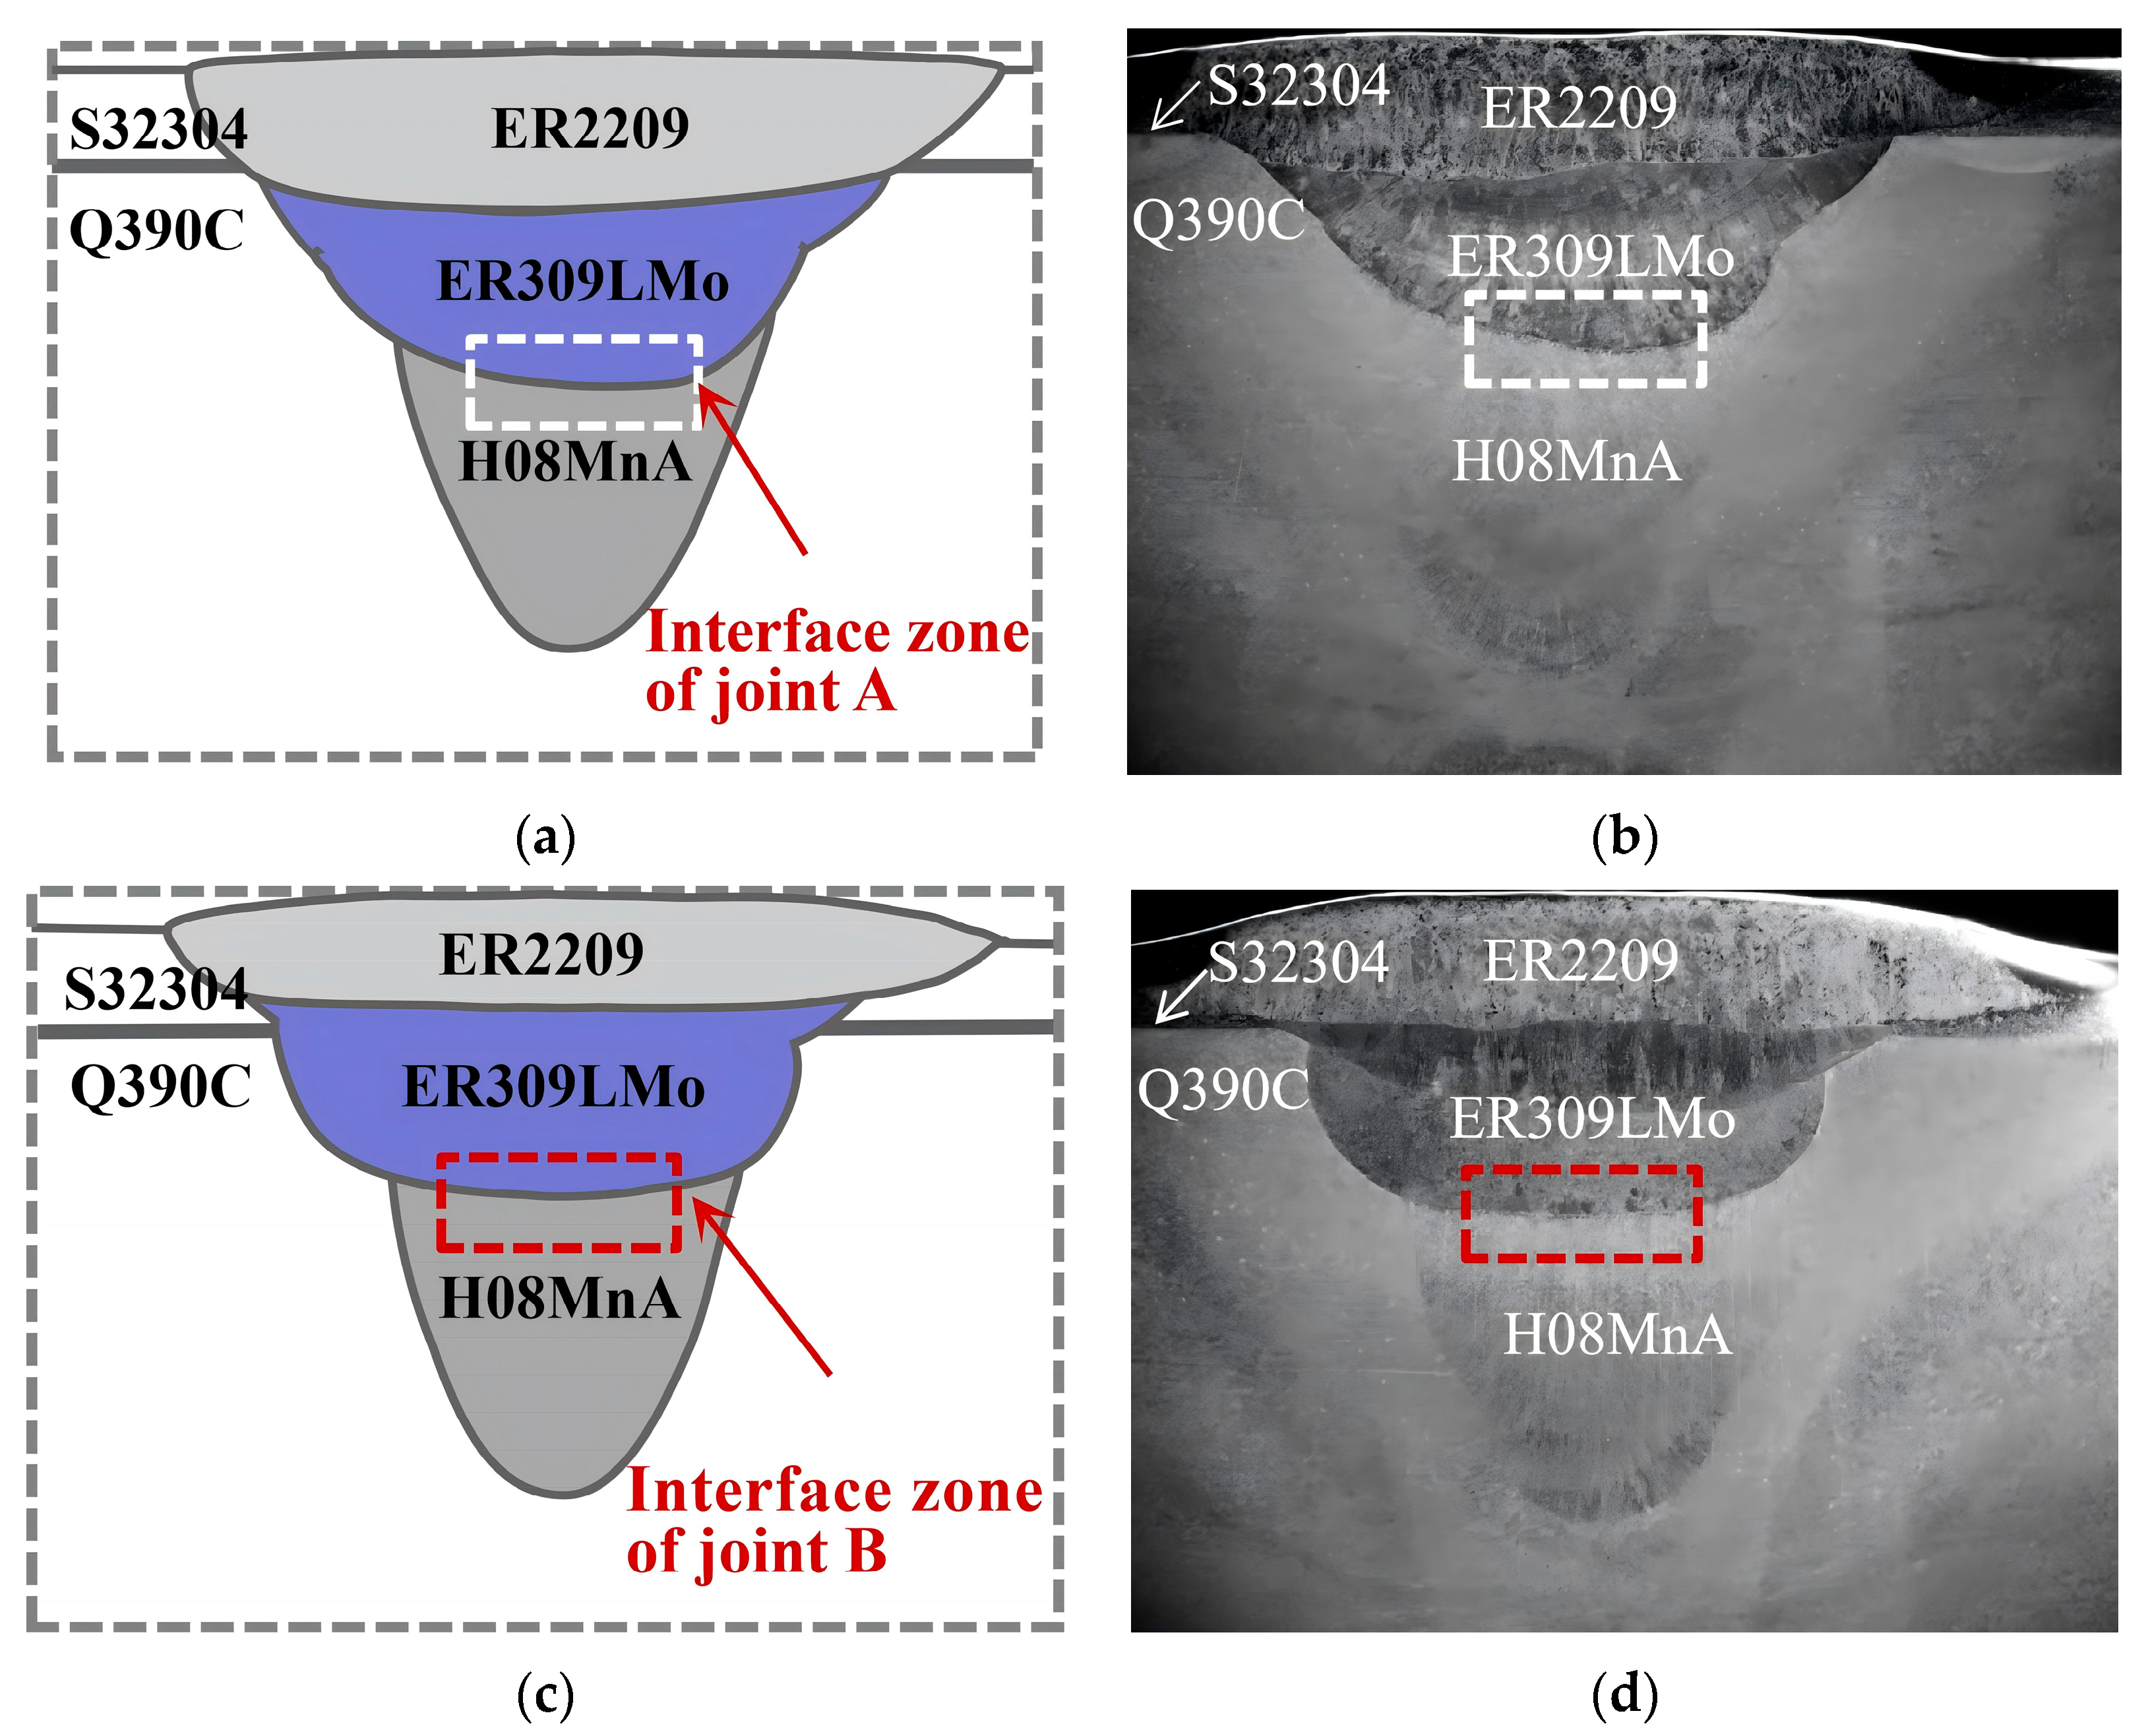
Following welding, the joints were subjected to X-ray nondestructive testing, which revealed no detectable defects. Figure 3 shows the macroscopic morphological characteristics of the cross sections of the welded joints. Upon detailed observation, in joint A, the interface boundary between the transition layer weld and the cladding layer weld is below the composite material interface. In contrast, in joint B, this weld interface is above the composite material interface. Figure 3a shows a schematic illustration of joint A’s section, and Figure 3b shows an actual macroscopic photograph of the same section. The interface within the white dashed box represents the transition layer weld/base layer weld interface. Figure 3c presents a schematic illustration of joint B’s section, while Figure 3d shows an actual macroscopic photograph of it. The interface within the red dashed box indicates the transition layer weld/base layer weld interface.
Figure 3.
Shows the macroscopic morphology of joint sections. Sub-figure (a,b) represent joint A, while (c,d) represent joint B.
Post-welding specimen preparation included sequential grinding, mechanical polishing, and chemical etching to ensure a surface suitable for microstructural analysis. To characterize the interfacial region systematically, electron backscatter diffraction (EBSD, Oxford Instruments, Abingdon, UK) and X-ray diffraction (XRD, Rigaku, Tokyo, Japan) were used to examine microstructural evolution and phase distribution across the welded interface. The interface’s geometrically necessary dislocation density was determined through quantitative analysis of electron backscatter diffraction (EBSD) characterization data. The study also used molecular dynamics simulations to investigate atomic diffusion mechanisms by computing mean squared displacement values, diffusion coefficients, and activation energy barriers for Fe, C, and Cr atoms at the interface. These multi-scale analytical methods together provided insights into atomic diffusion at the weld interface.
3. Results
3.1. Microstructure
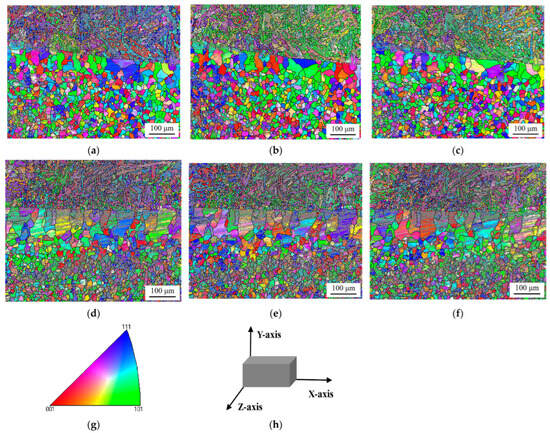
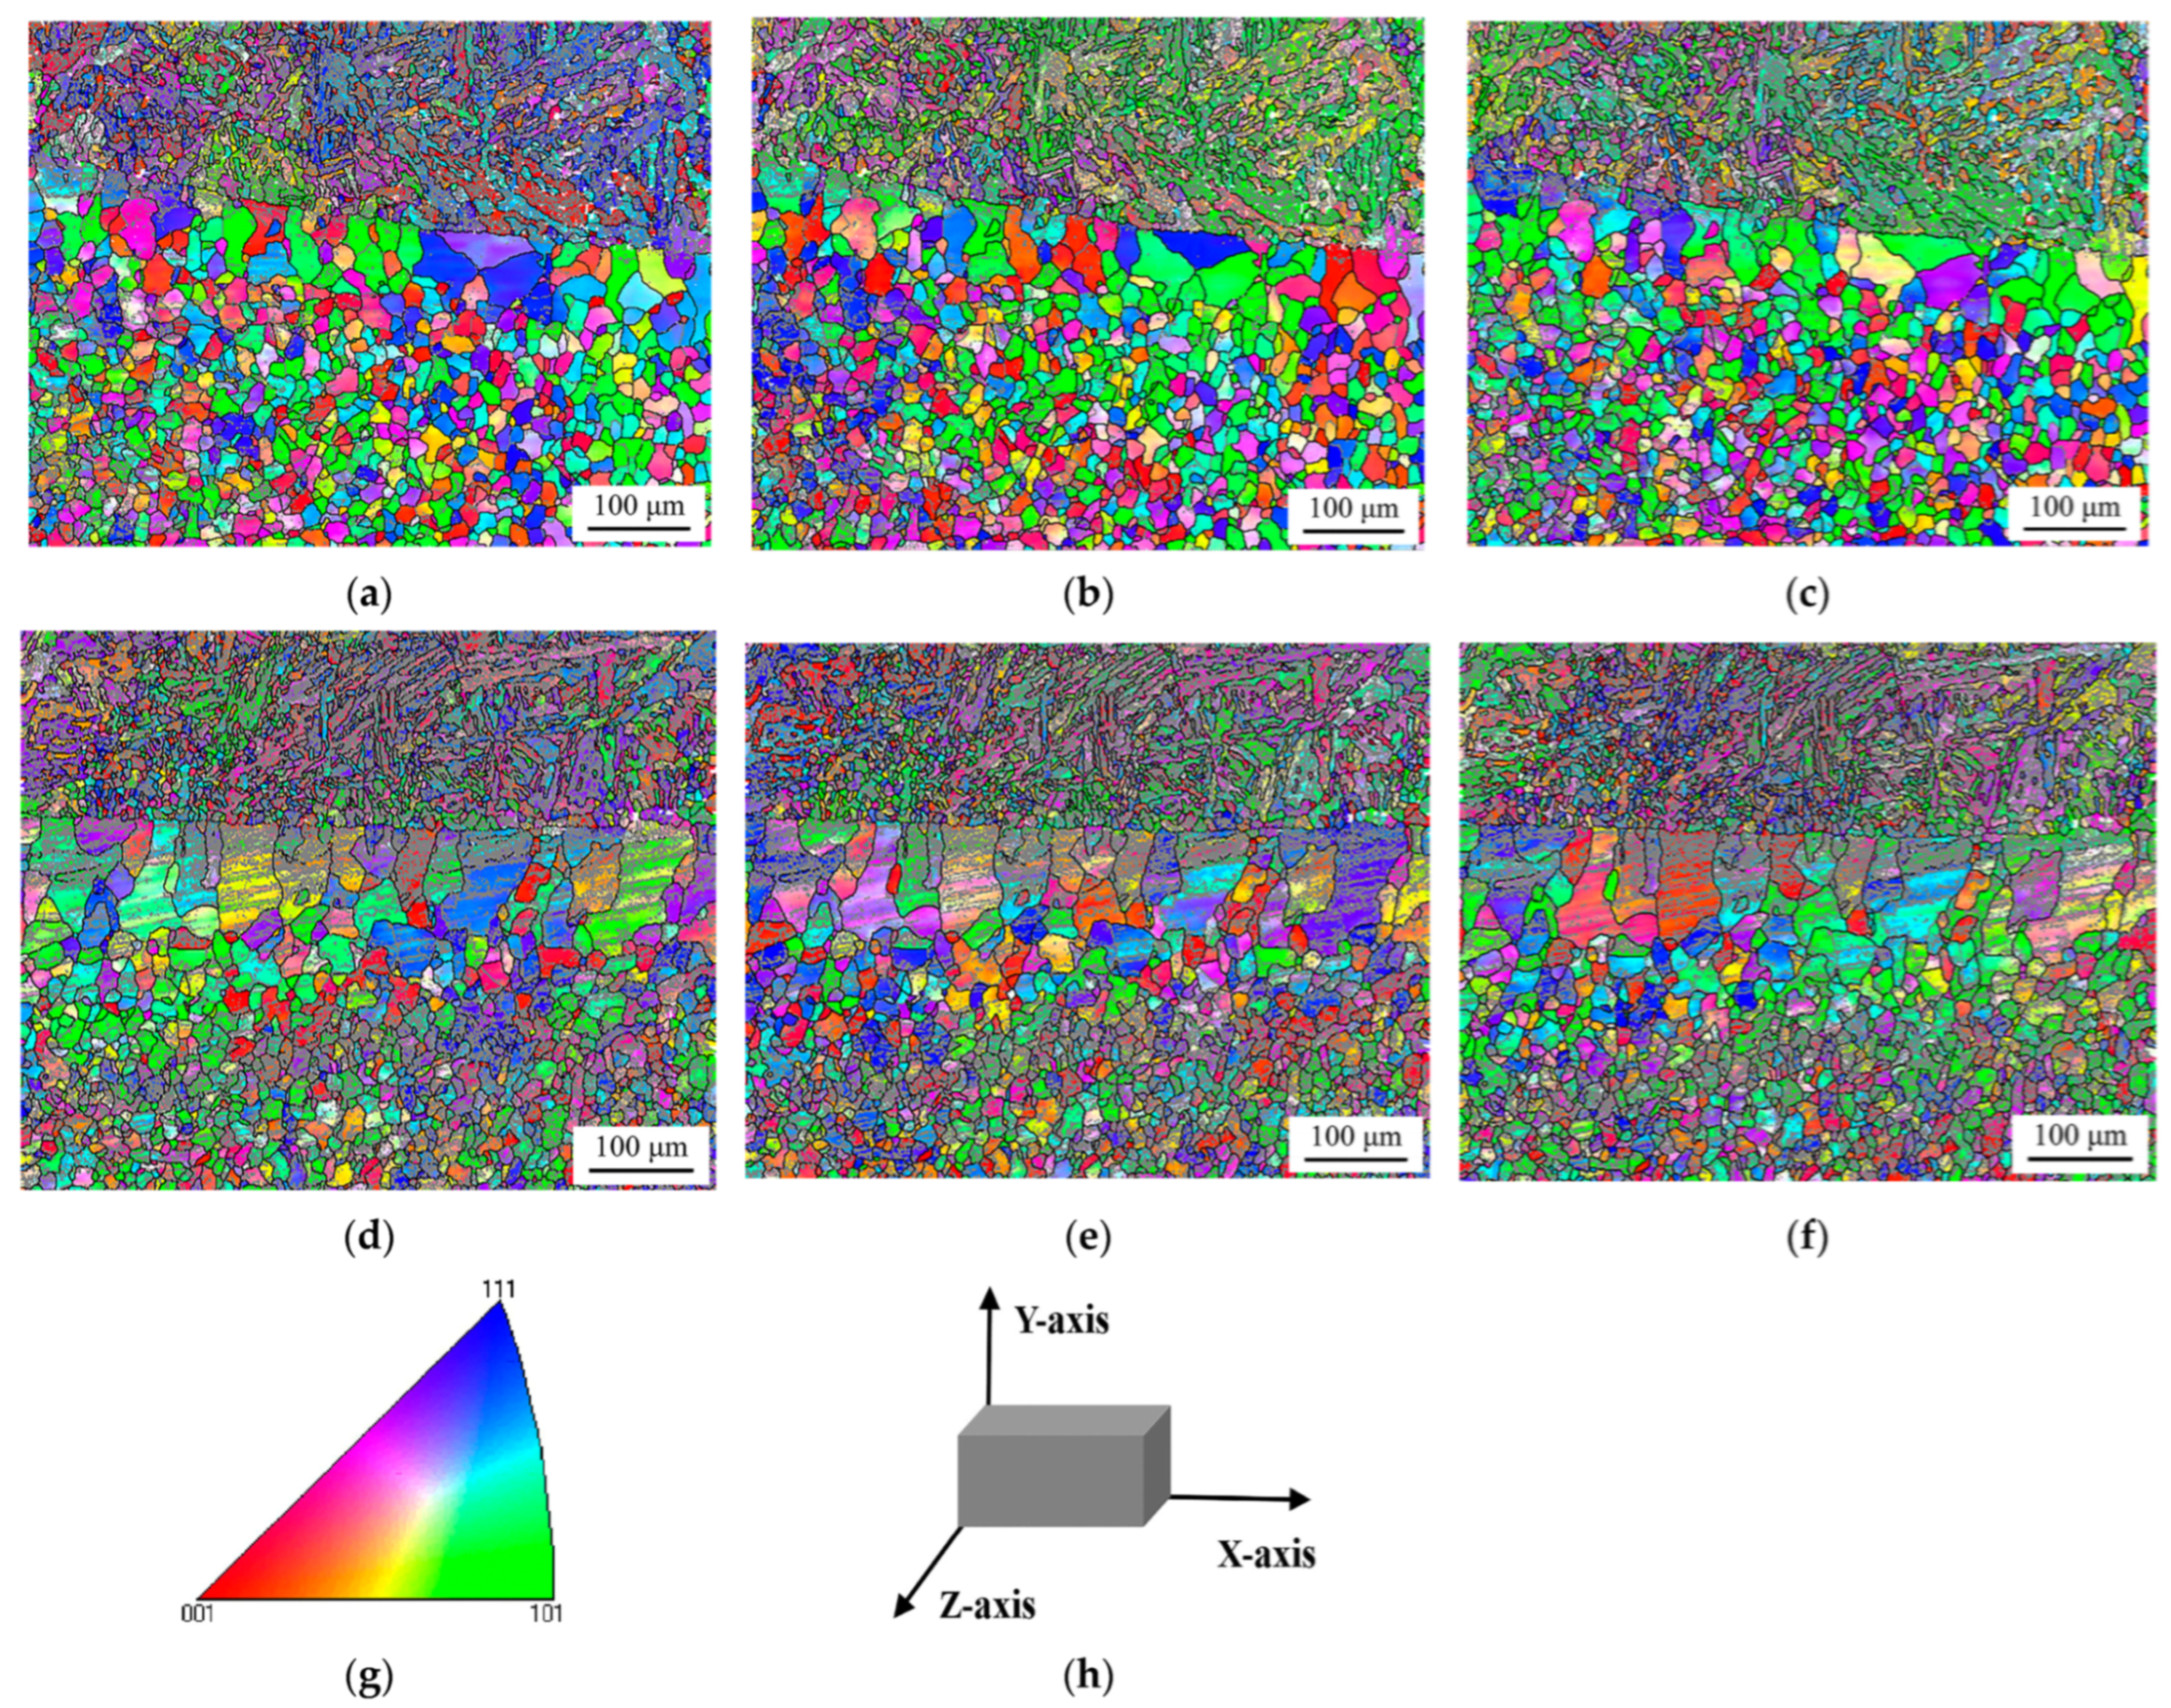
Through EBSD analysis, Figure 4 presents the crystal structure characteristics at the interface between the transition layer weld and the base layer weld. Specifically, Figure 4a–c show the grain orientation distribution maps of the interface region in joint A along the X-, Y-, and Z-axes, respectively, while Figure 4d–f display the corresponding grain orientation characteristics of the interface in joint B under the same coordinate axes. In these characterizations, different colors represent distinct crystallographic orientations, providing a direct and intuitive visualization of the grain orientation distribution in the interfacial region. The X-axis is parallel to the welding direction, the Y-axis is perpendicular to the welding direction (i.e., the thickness direction of the plate), and the Z-axis is the normal direction of the test surface, as illustrated in Figure 4h.
Figure 4.
The grain orientation micrograph of the interface. (a) Joint A interface (X-axis); (b) Joint A interface (Y-axis); (c) Joint A interface (Z-axis); (d) Joint B interface (X-axis); (e) Joint B interface (Y-axis); (f) Joint B interface (Z-axis); (g) Inverse pole figure (IPF) color map for crystallographic orientation, with vertices corresponding to 001 (red), 101 (green), and 111 (blue) orientations; (h) Schematic diagram of the sample coordinate system (X/Y/Z-axes).
According to the EBSD results, the base layer weld zone of the interface exhibits an equiaxed grain structure, and with two structural zones of different grain sizes. The structure of the zone close to the interface was a coarse ferrite structure, while the structure of the zone far from the interface was finer grains of ferrite. The width of the coarse-grained ferrite zone adjacent to the interface measured approximately 100 μm when the transition layer welding was performed with heat inputs of 1.68 kJ/mm and 1.96 kJ/mm. In contrast, this microstructural feature expanded to around 150 μm under higher heat input conditions of 1.92 kJ/mm and 2.24 kJ/mm. Electron backscatter diffraction (EBSD) analysis revealed distinct grain size distributions in the interface regions of the welded joints: joint A exhibited predominant grain sizes ranging from 2.5 to 7.5 μm with an average of 3.98 μm, while joint B showed a broader grain size distribution (2.5–12.5 μm) and a slightly larger average grain size of 4.65 μm. The analysis indicates that as the welding heat input of the transition layer increases, both the width of the decarburization zone formed at the interface and the grain size exhibit a corresponding increasing trend. This phenomenon can be attributed to the greater heat accumulation at the weld joint with the elevation of heat input, which promotes the diffusion of carbon elements at the interface and provides sufficient thermal conditions for grain growth, thereby resulting in the expansion of the decarburization zone and the coarsening of the grains.
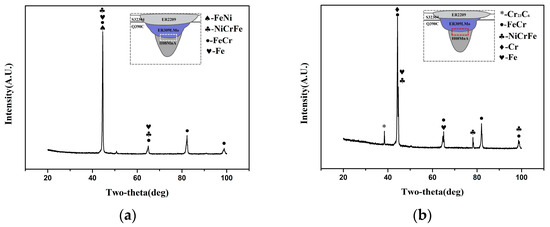
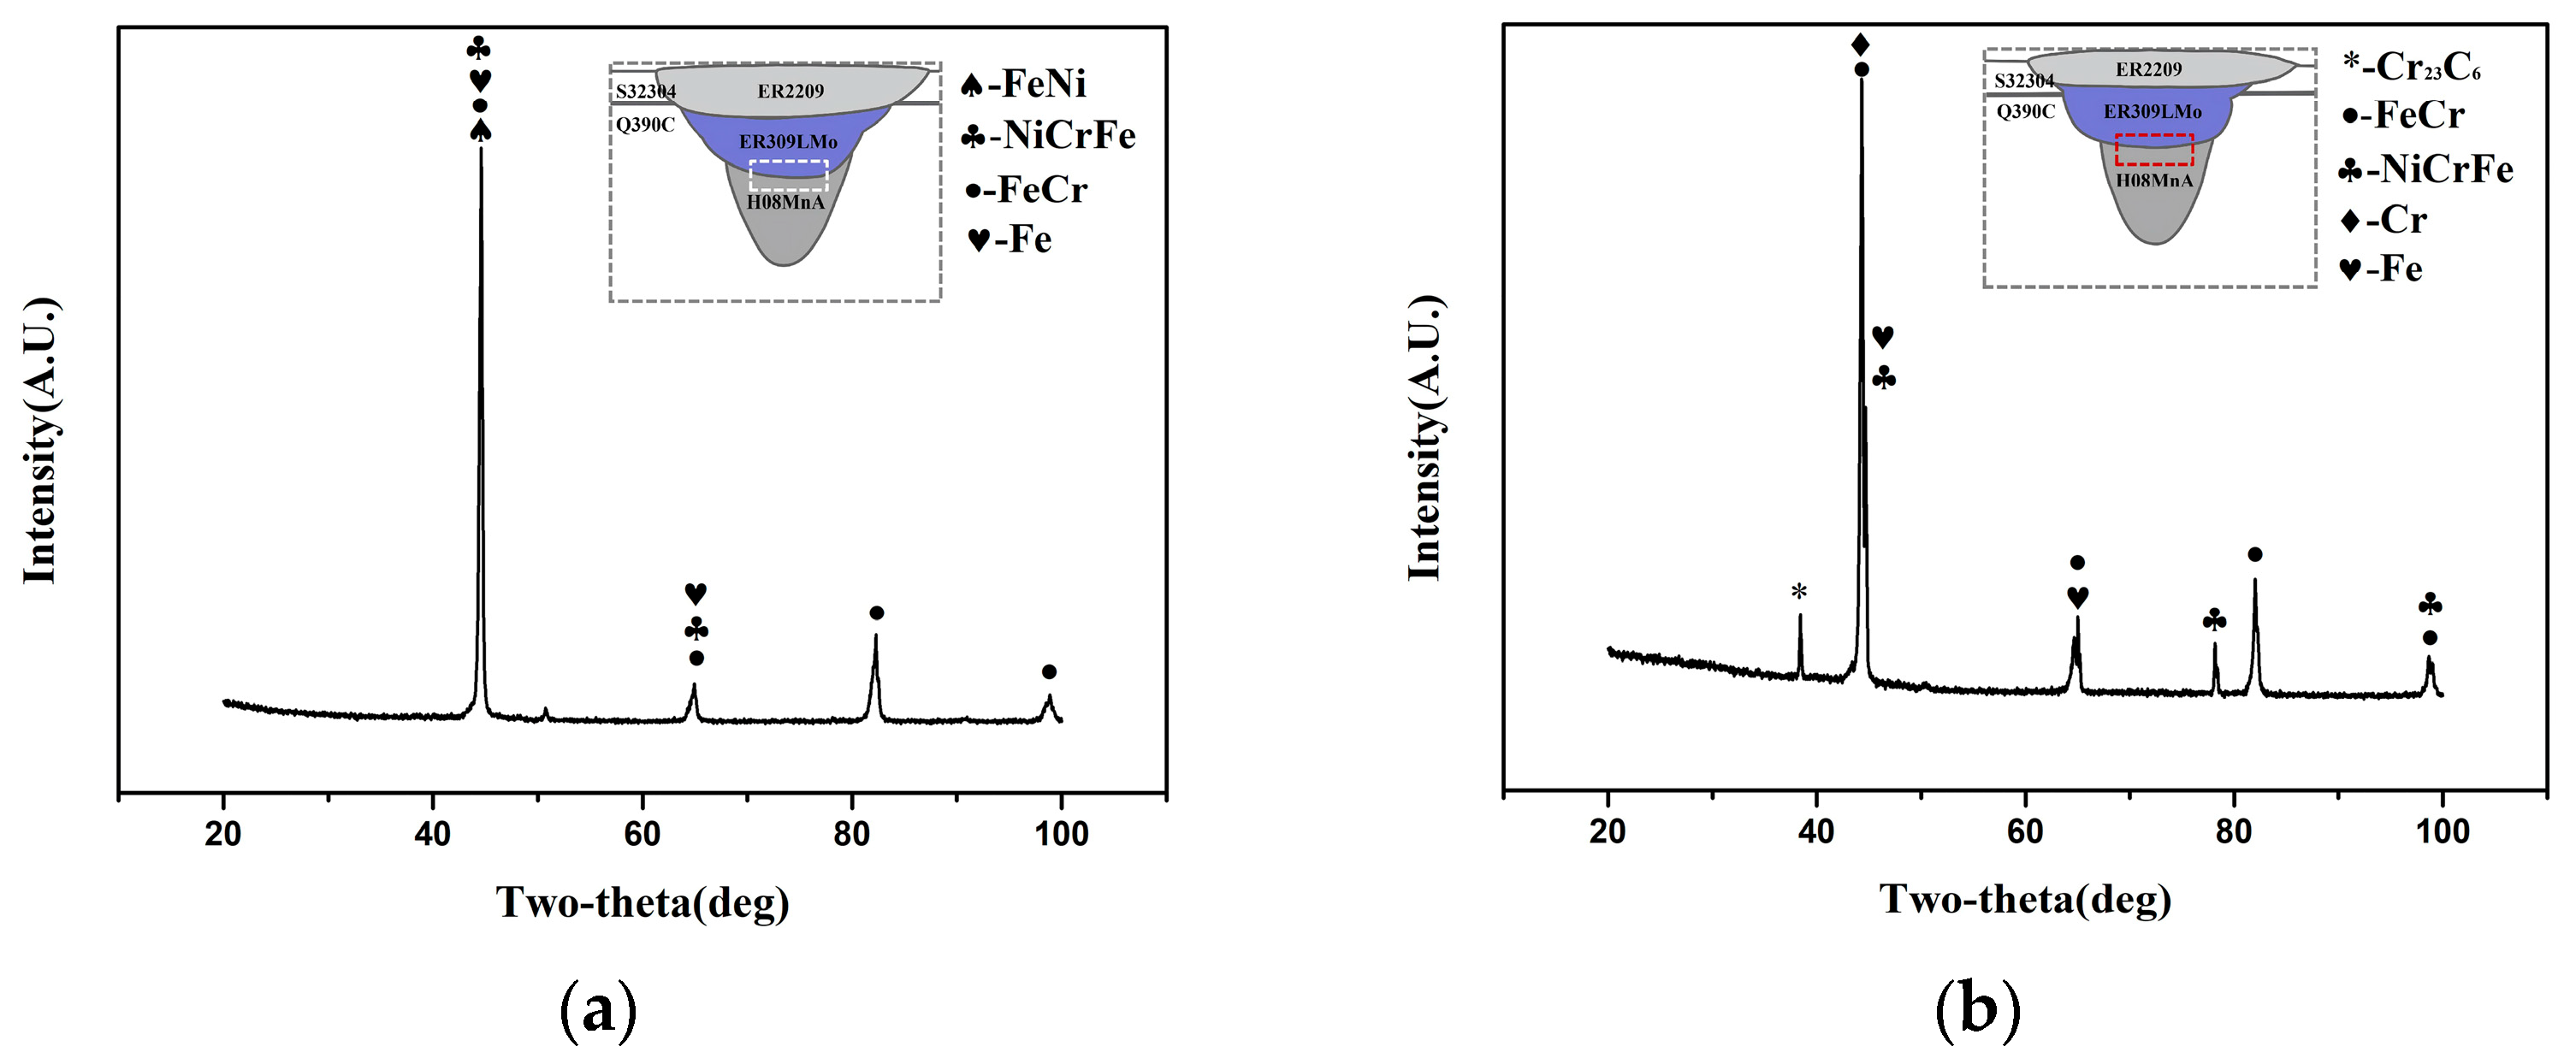
The XRD testing results of the interfaces were presented in Figure 5. According to the XRD results, as the heat input of the transition layer weld increases, the number of C and Cr atoms that undergo diffusion increases at the interface between the transition layer weld and the base layer weld. C and Cr atoms accumulate at the interface and form carbon–chromium compounds. Experimental characterization results demonstrate that the interface of joint A is composed of Fe, FeNi, FeCr, and NiCrFe phases, whereas the interface of joint B comprises Fe, Cr, FeCr, NiCrFe, and Cr23C6. XRD analysis further reveals that both interfaces are predominantly iron-based solid solutions, with Cr23C6 specifically detected at the interface of joint B. With respect to the effect of welding parameters, XRD results indicate that increasing the heat input of the transition layer weld promotes enhanced diffusion of C and Cr atoms at the interface between the transition layer weld and the base layer weld. Consequently, the accumulated C and Cr atoms at this interface react to form carbon–chromium compounds.
Figure 5.
The XRD testing results of the interface: (a) joint A; (b) joint B.
3.2. Geometrically Necessary Dislocation Density
Atomic diffusion at the solid–solid interface is collectively regulated by structural and chemical driving forces. On the one hand, GNDs accumulated at the weld interface induce localized lattice distortion and stress fields, which provide excess energy to reduce the activation barrier for atomic migration across the interface. On the other hand, the chemical potential gradient arising from compositional inhomogeneities serves as a dominant thermodynamic driving force, directing the directional diffusion of atoms (e.g., Cr and C). In this work, to clarify the influence of lattice distortion and stress field generation at the interface between the transition layer weld and the base layer weld on atomic diffusion, we analyzed the GND density at the interface.
Utilizing electron backscatter diffraction (EBSD) measurements, we employed the kernel average misorientation (KAM) technique to compute the orientations of local grains, subsequently estimating the geometrically necessary dislocation (GND) density through the equation ρGND = 2θ/lb. In this mathematical expression, ρGND represents the GND density at a specific location, θ is the misorientation at local points, where l denotes the unit length at that position (with the EBSD step size set to 1.0 μm in our investigation), and b corresponds to the material’s Burgers vector (0.253 nm for the transition layer weld and 0.248 nm for the base layer weld) [30].
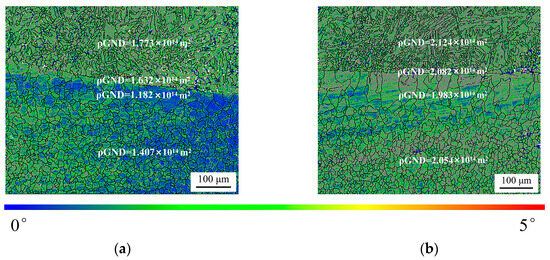
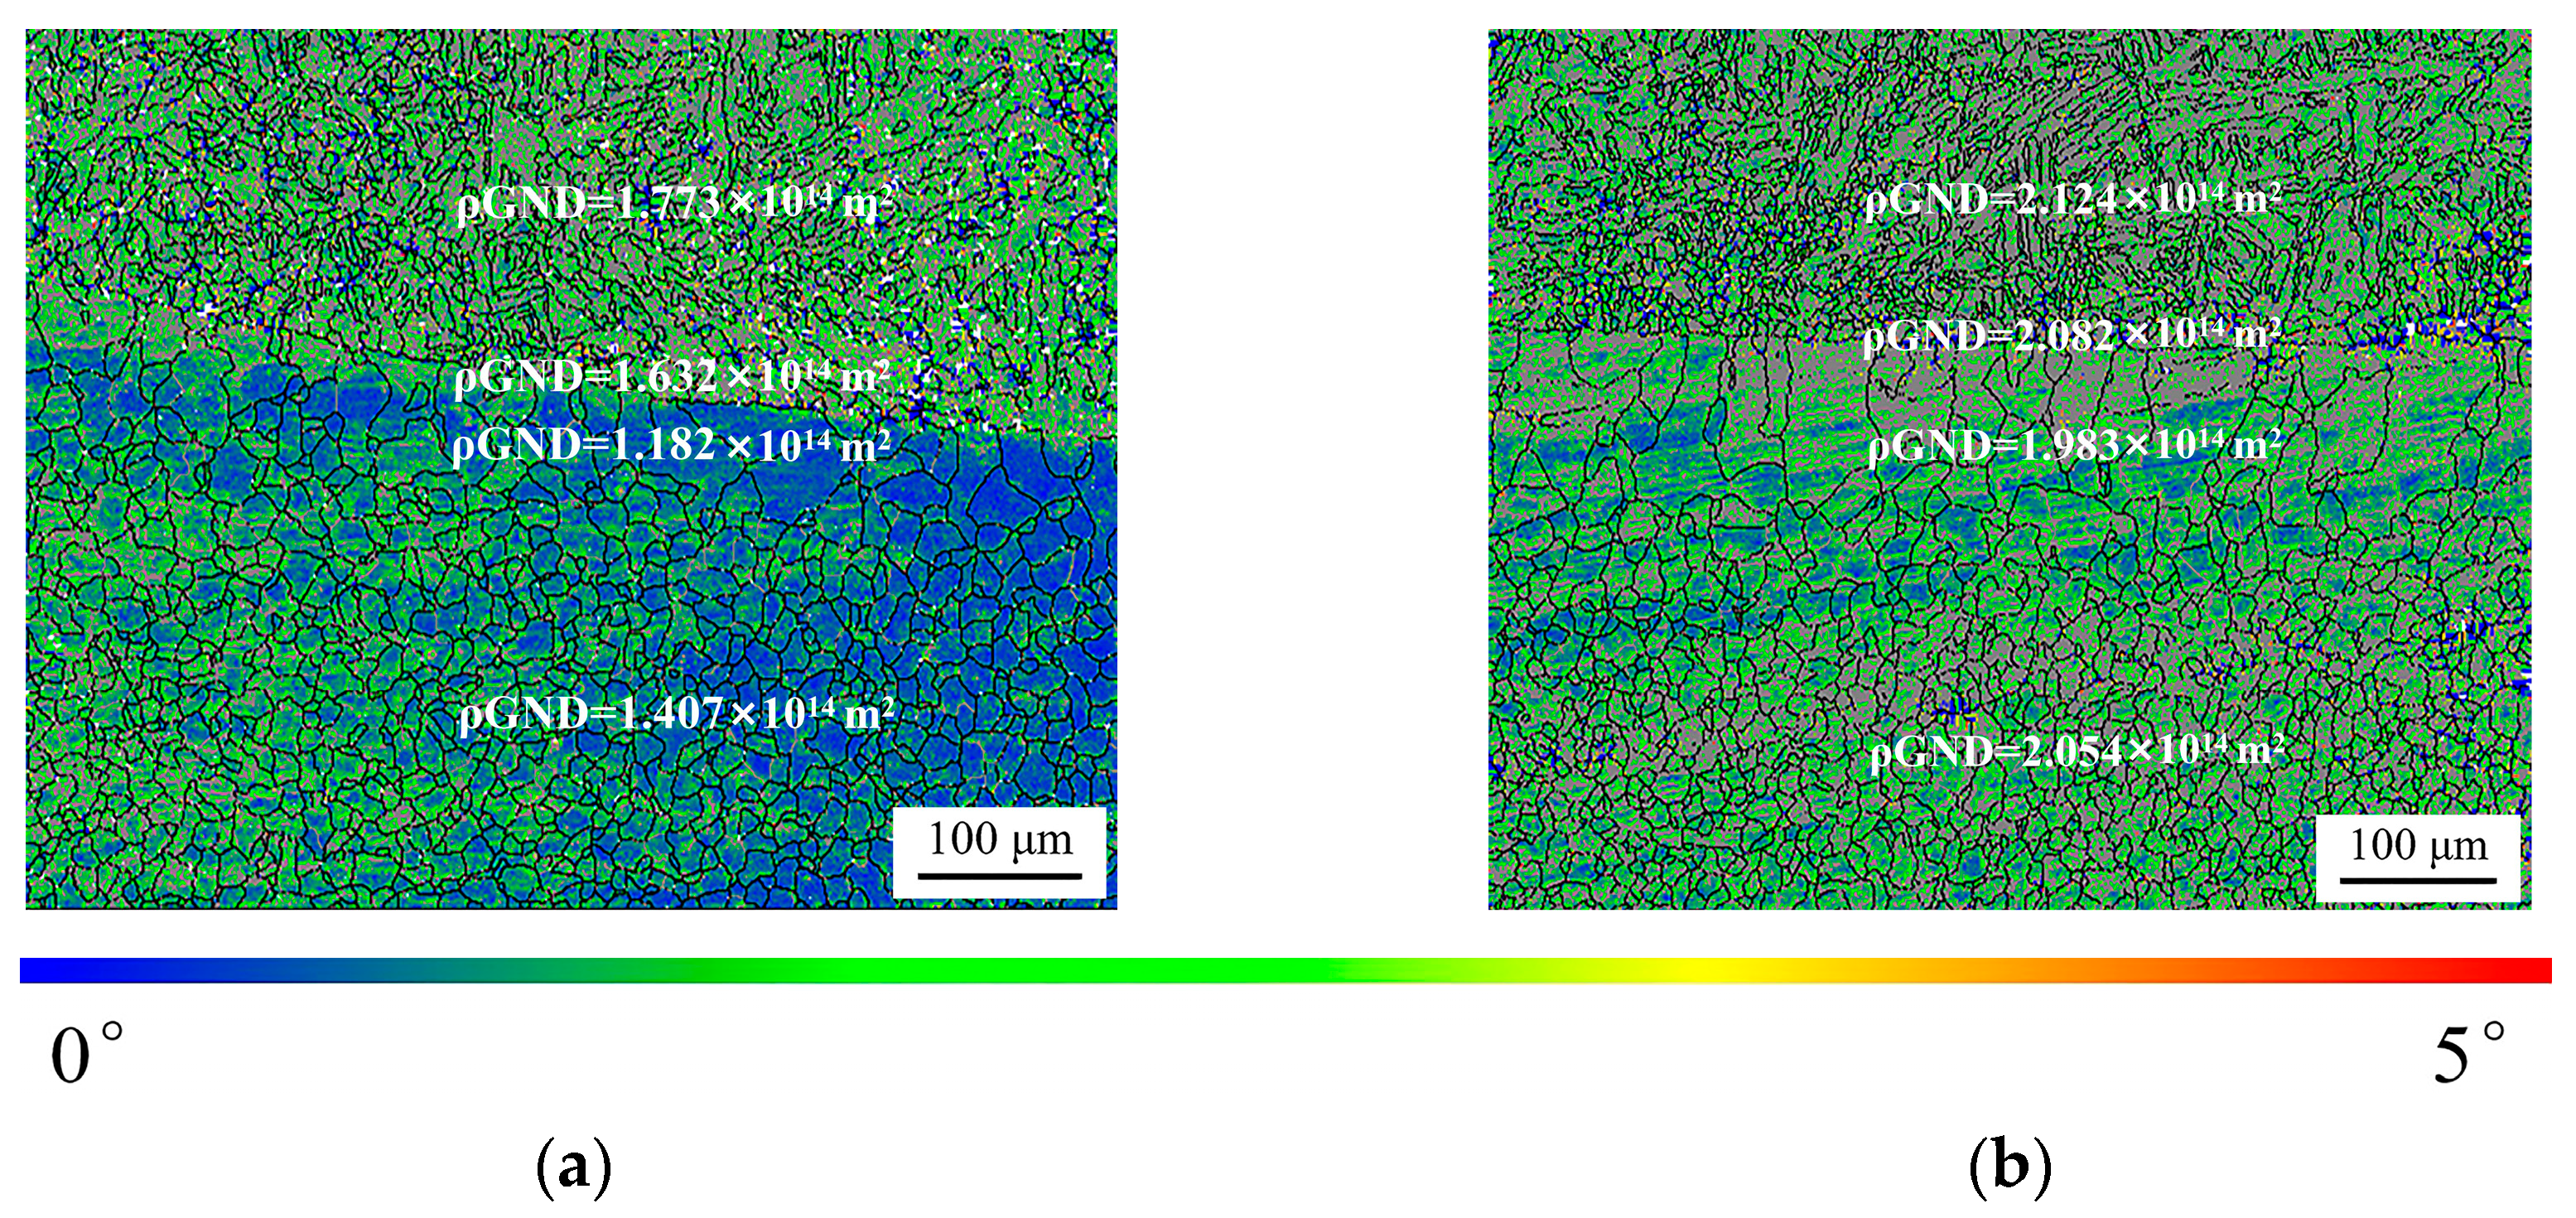
Figure 6 shows the distribution of geometrically necessary dislocation (GND) density at the interface. Figure 6a shows the distribution of average geometrically necessary dislocation (GND) densities across different microstructural regions in joint A. The transition layer weld zone has an average GND density of 1.773 × 10¹⁴ m2, while the interface region’s density is slightly lower at 1.632 × 10¹⁴ m2. The coarse ferrite zone in the base layer weld has the lowest average GND density, 1.182 × 10¹⁴ m2. The microstructural analysis in the figure visually shows a gradual decrease in GND density from the transition layer to the base metal coarse ferrite zone. As shown in Figure 6b, the average GND density in the transition layer weld zone of joint B was 2.124 × 10¹⁴ m2, the average GND density at the interface was 2.082 × 10¹⁴ m2, the average GND density in the coarse ferrite zone of the base weld zone was 1.983 × 10¹⁴ m2, and the average GND density in the finer grains of the ferrite zone was 2.054 × 10¹⁴ m2. Experimental observations reveal that with the increase in welding heat input applied to the transition layer weld, the average geometrically necessary dislocation (GND) density within the transition layer weld, interface region, and base layer weld all exhibits a consistent upward trend. The average GND density at the interface increases from 1.4985 × 10¹⁴ m2 to 1.8101 × 10¹⁴ m2.
Figure 6.
The GND density of the interface: (a) corresponding to the results of joint A; (b) representing the data of joint B.
3.3. Molecular Dynamics Simulation
3.3.1. Modeling Establishment
Within the framework of molecular dynamics simulations, the motion of atoms is predicated on adherence to the fundamental principles of classical mechanics. Consider an isolated system composed of a plurality of atoms: the motion of these atoms is governed by Newton’s equations of motion. Specifically, the force exerted on any atom i can be formulated as the gradient of its potential energy, which is expressed as follows:
Based on Newton’s laws of motion, the acceleration of atom i can be expressed as:
In the context of this mathematical formulation, Fi represents the force exerted on the atom i within the system. U corresponds to the potential energy function evaluated at the atomic position, while xi, yi and zi denote the three-dimensional cartesian coordinates specifying the atom’s location. Additionally, ai quantifies the acceleration experienced by atom i, and mi refers to its respective mass.
During the simulation process, the potential energy of the system is computed based on the spatial coordinates of each individual atom within the system. Subsequently, the forces and accelerations exerted on each atom are ascertained. This cycle is iterated to acquire the positions, velocities, and accelerations of the atoms’ motions within the system at diverse time points.
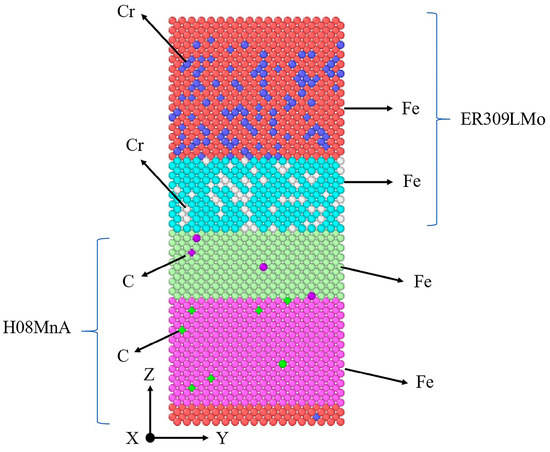
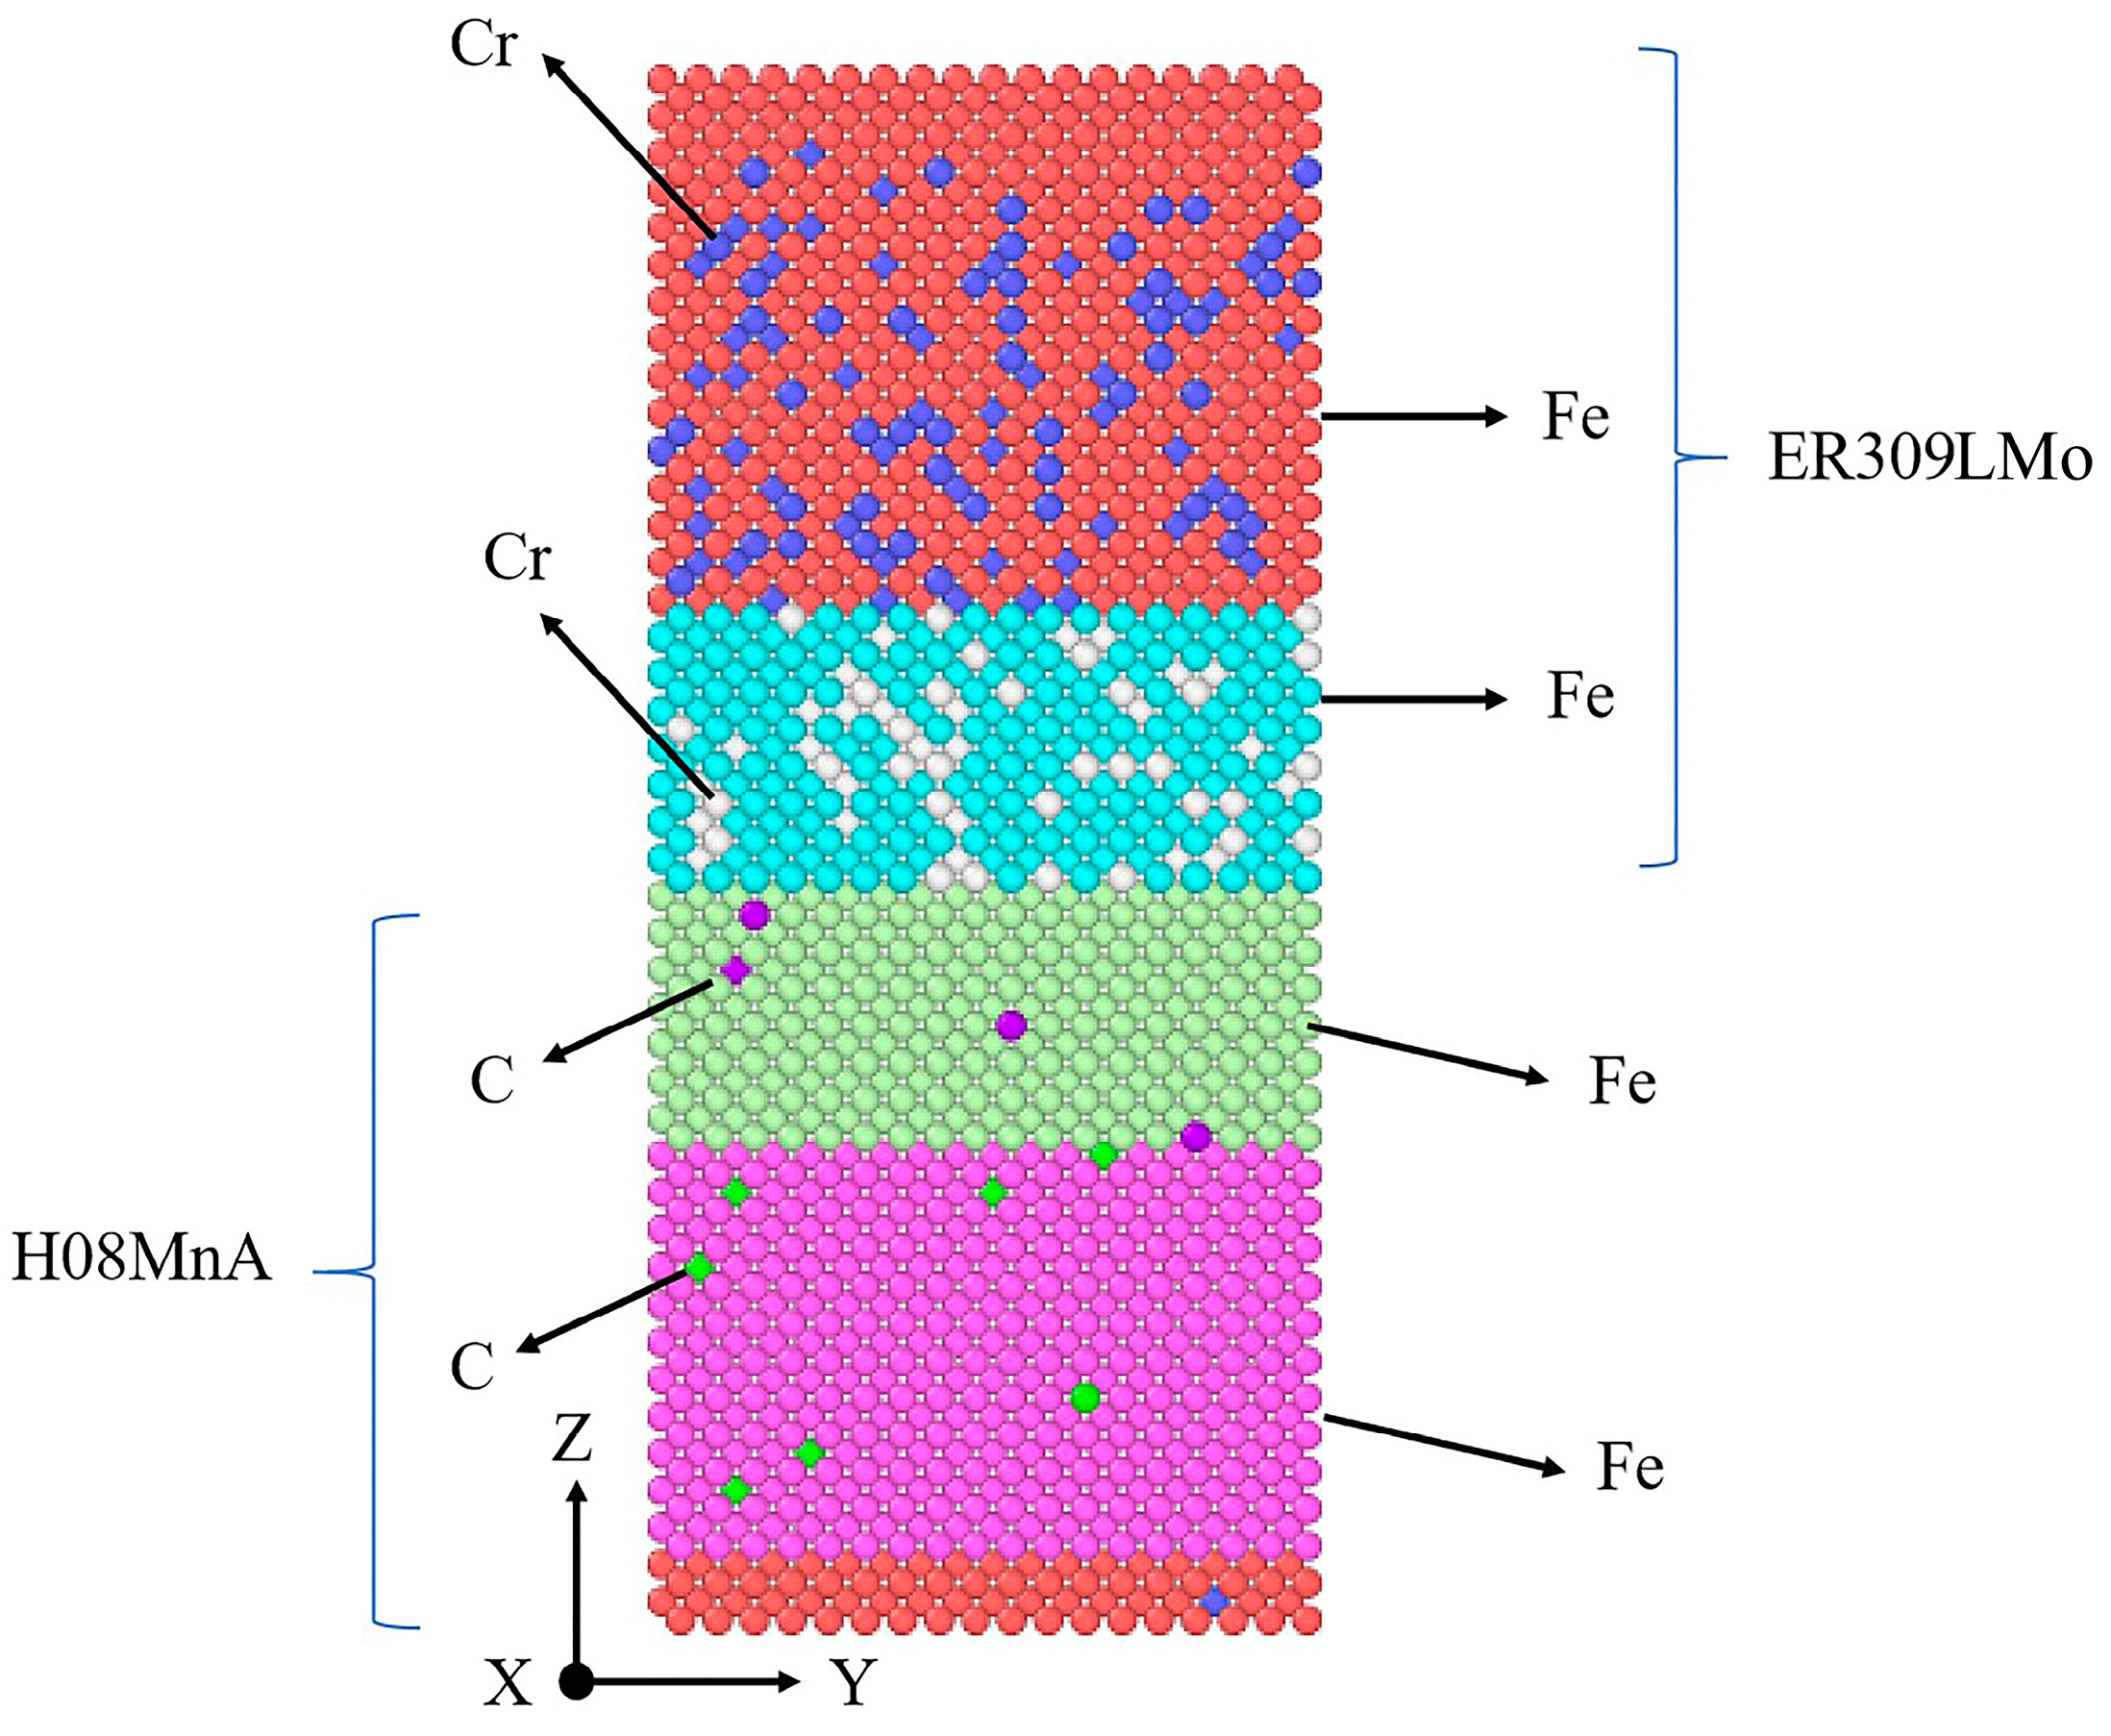
To investigate the atomic diffusion behavior at the interface between the transition layer weld and the base layer weld under elevated temperature conditions, the present study constructed a computational model using the large-scale atomic/molecular massively parallel simulator (LAMMPS) package, with the detailed modeling setup schematically depicted in Figure 7. The model is composed of four components. The transition layer weld model, symbolized by an Fe-Cr model, is made up of the top two parts. The base layer weld model, denoted by an Fe-C model, encompasses the bottom two parts. In this model, the top and bottom are each equipped with four-atom fixed layers. Regarding the boundary conditions in the Z-direction, one side is set as fixed, while the other side has shrinking boundary conditions. The dimensions of the model measure 5.13 nm × 5.13 nm × 11.829 nm (x × y × z), with the Z-axis representing the direction of atomic diffusion.
Figure 7.
Initial model of the interface.
The entire simulation system was maintained under zero external pressure conditions, with a time increment of 0.001 picoseconds selected for dynamic evolution calculations. The constructed atomic model, operating within a constant volume framework, was composed of a total of 27,216 particles. To achieve precise thermal control during molecular dynamics runs, the nose–hoover thermostatic algorithm was implemented, maintaining the system at four distinct temperature setpoints: 850 K, 950 K, 1050 K, and 1150 K, respectively. To thoroughly investigate the atomic diffusion behavior at the interface between the transition layer weld and the base layer weld, the simulation calculated the mean square displacement, diffusion coefficient, and diffusion activation energy of the interfacial atoms.
3.3.2. Conduct a Verification of the Potential Function
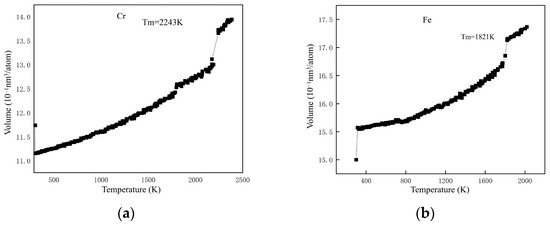
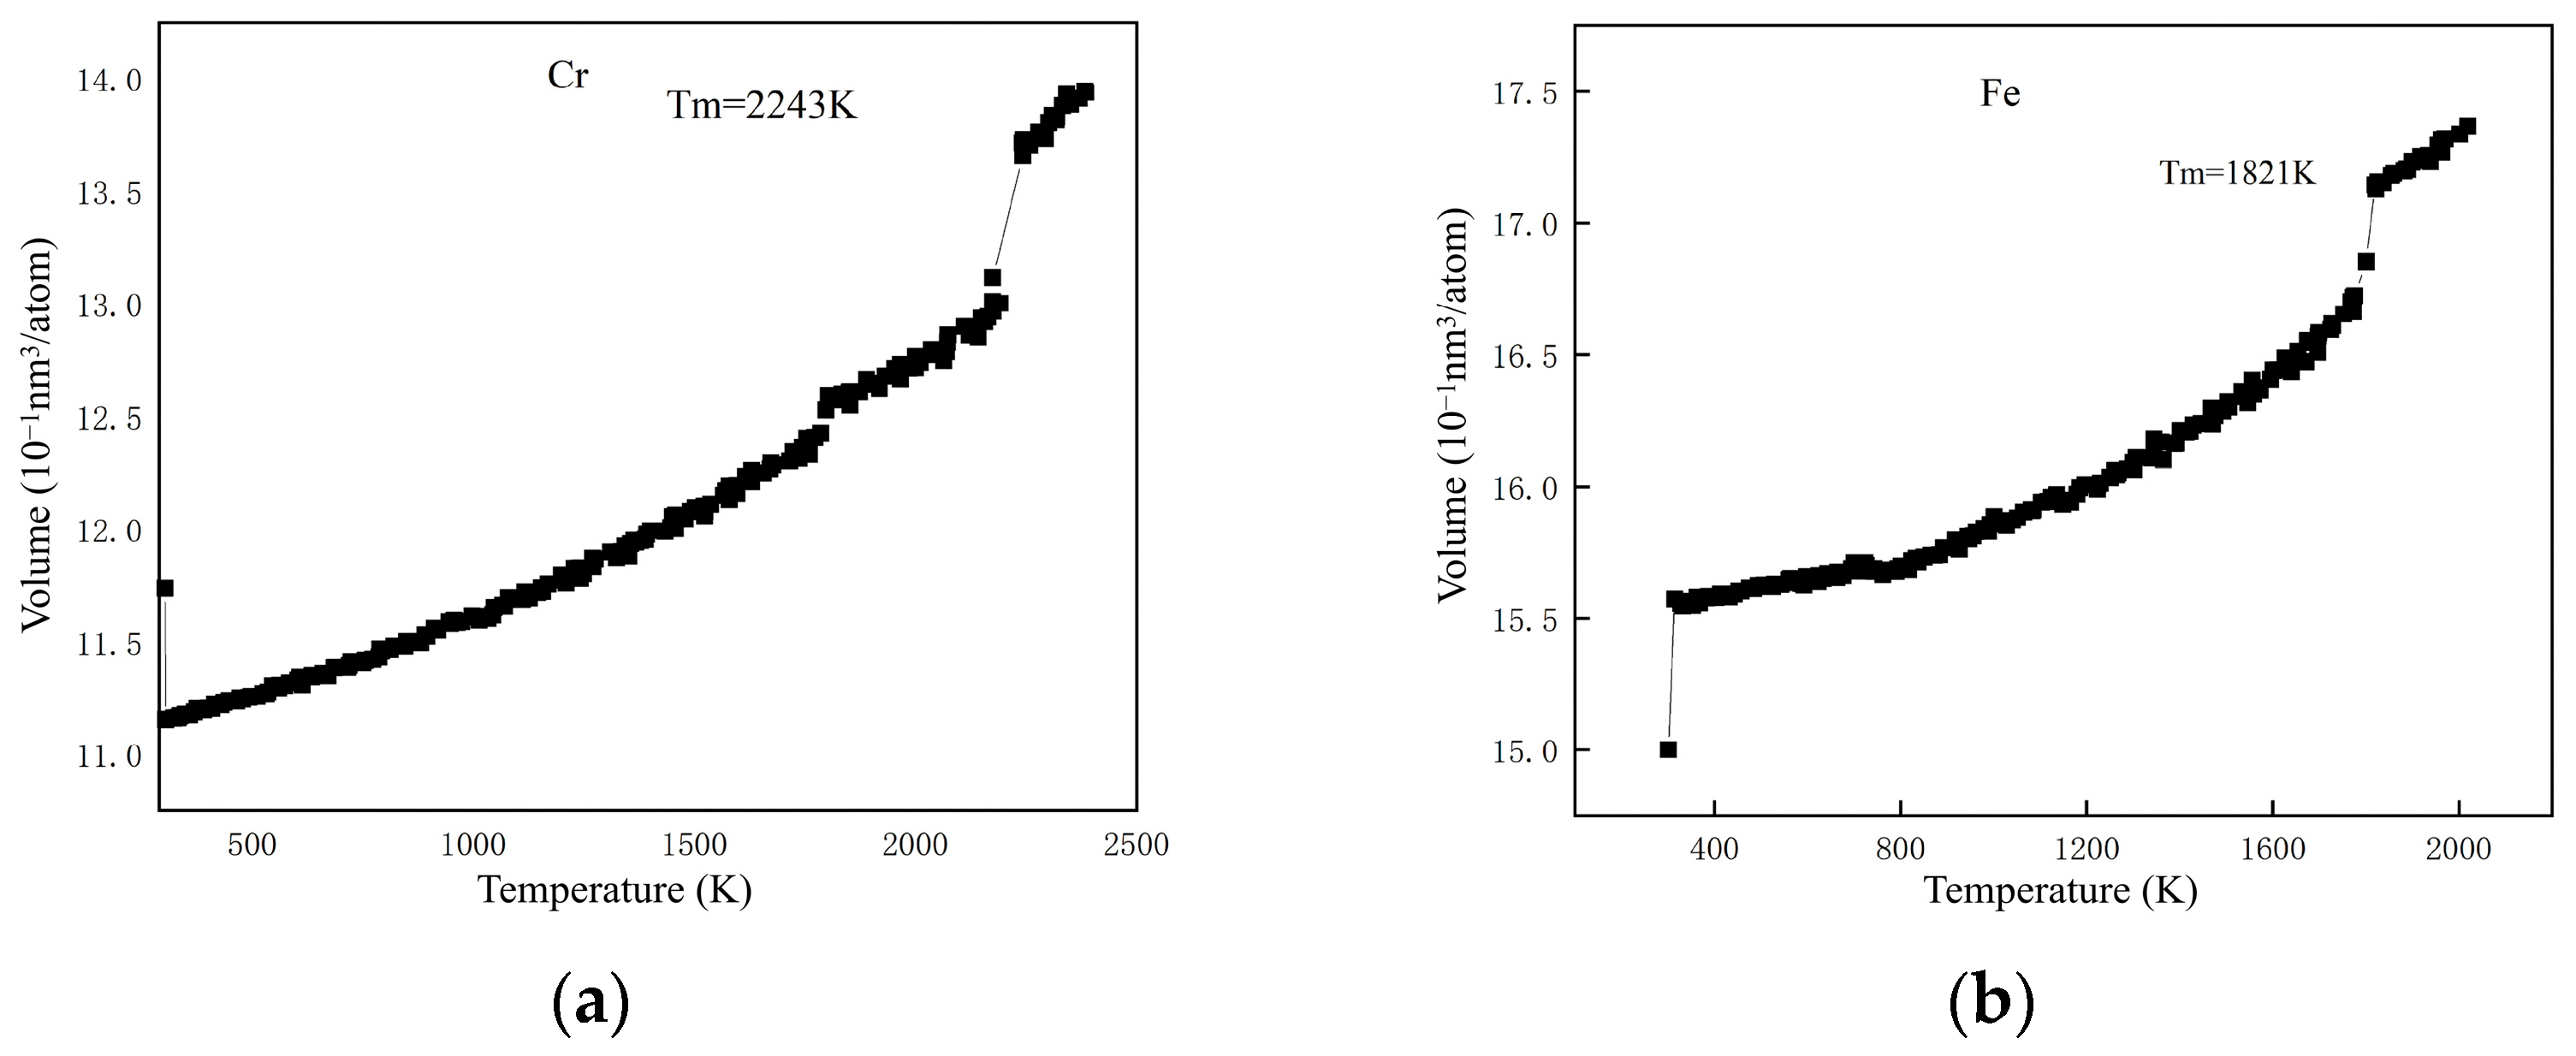
In this study, molecular dynamics simulations were performed with the embedded-atom method (EAM) potential selected as the interatomic interaction model. To assess the reliability of both the established simulation framework and the chosen EAM potential parameters, we computationally determined the melting temperatures of iron (Fe) and chromium (Cr) and subsequently compared these simulation results with their respective theoretical melting point values. Under the framework of the selected EAM potential, the simulations were conducted using an NVT ensemble to maintain thermal equilibrium during the molecular dynamics process. The full English name of NVT is the canonical ensemble, where the three letters stand for N: number of particles, V: volume, and T: temperature. Then, the system was gradually heated up to a temperature of 2500 K. The melting points of Fe and Cr atoms were ascertained by plotting their respective temperature–potential energy curves. The potential energy curves of Fe and Cr atoms in relation to temperature, which were derived from this simulation, are presented in Figure 8. In the context of low-temperature conditions, the potential energy of Fe and Cr atoms showed a linear increase in tandem with the temperature. When the temperature continued to climb, an obvious inflection point emerged. This inflection point signified a transformation in the crystal structure; more precisely, it marked the melting process of the alloy material. In the Fe-Cr alloy system, the computed melting point of Cr is 2243 K, while in the Fe-C alloy, the calculated melting point of Fe is 1821 K. There was a high level of consistency between the calculated values and the theoretically predicted melting points, validating both the reliability of the simulation model and the appropriateness of the EAM potential function for this system.
Figure 8.
Curve of the potential energy variation with temperature in Fe-Cr and Fe-C systems: (a) Fe-Cr system; (b) Fe-C system.
3.3.3. Atomic Diffusion Coefficient
In the dynamic simulation procedure, the movement paths of atoms are documented. By analyzing these migration paths, the atomic root–mean square displacement curve can be acquired. Based on Einstein’s diffusion law, the diffusion coefficient is calculated from the atomic mean square displacement, which is expressed by the equation below:
In the present mathematical formulation, D corresponds to the diffusion coefficient, while LMSD refers to the mean square displacement. Specifically, denotes the initial position vector of the atom i at the starting moment (t = 0), whereas represents the position vector of the same atom i at a subsequent time point t.
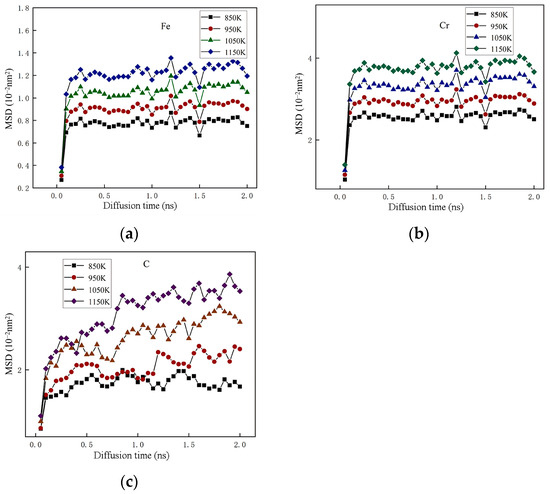
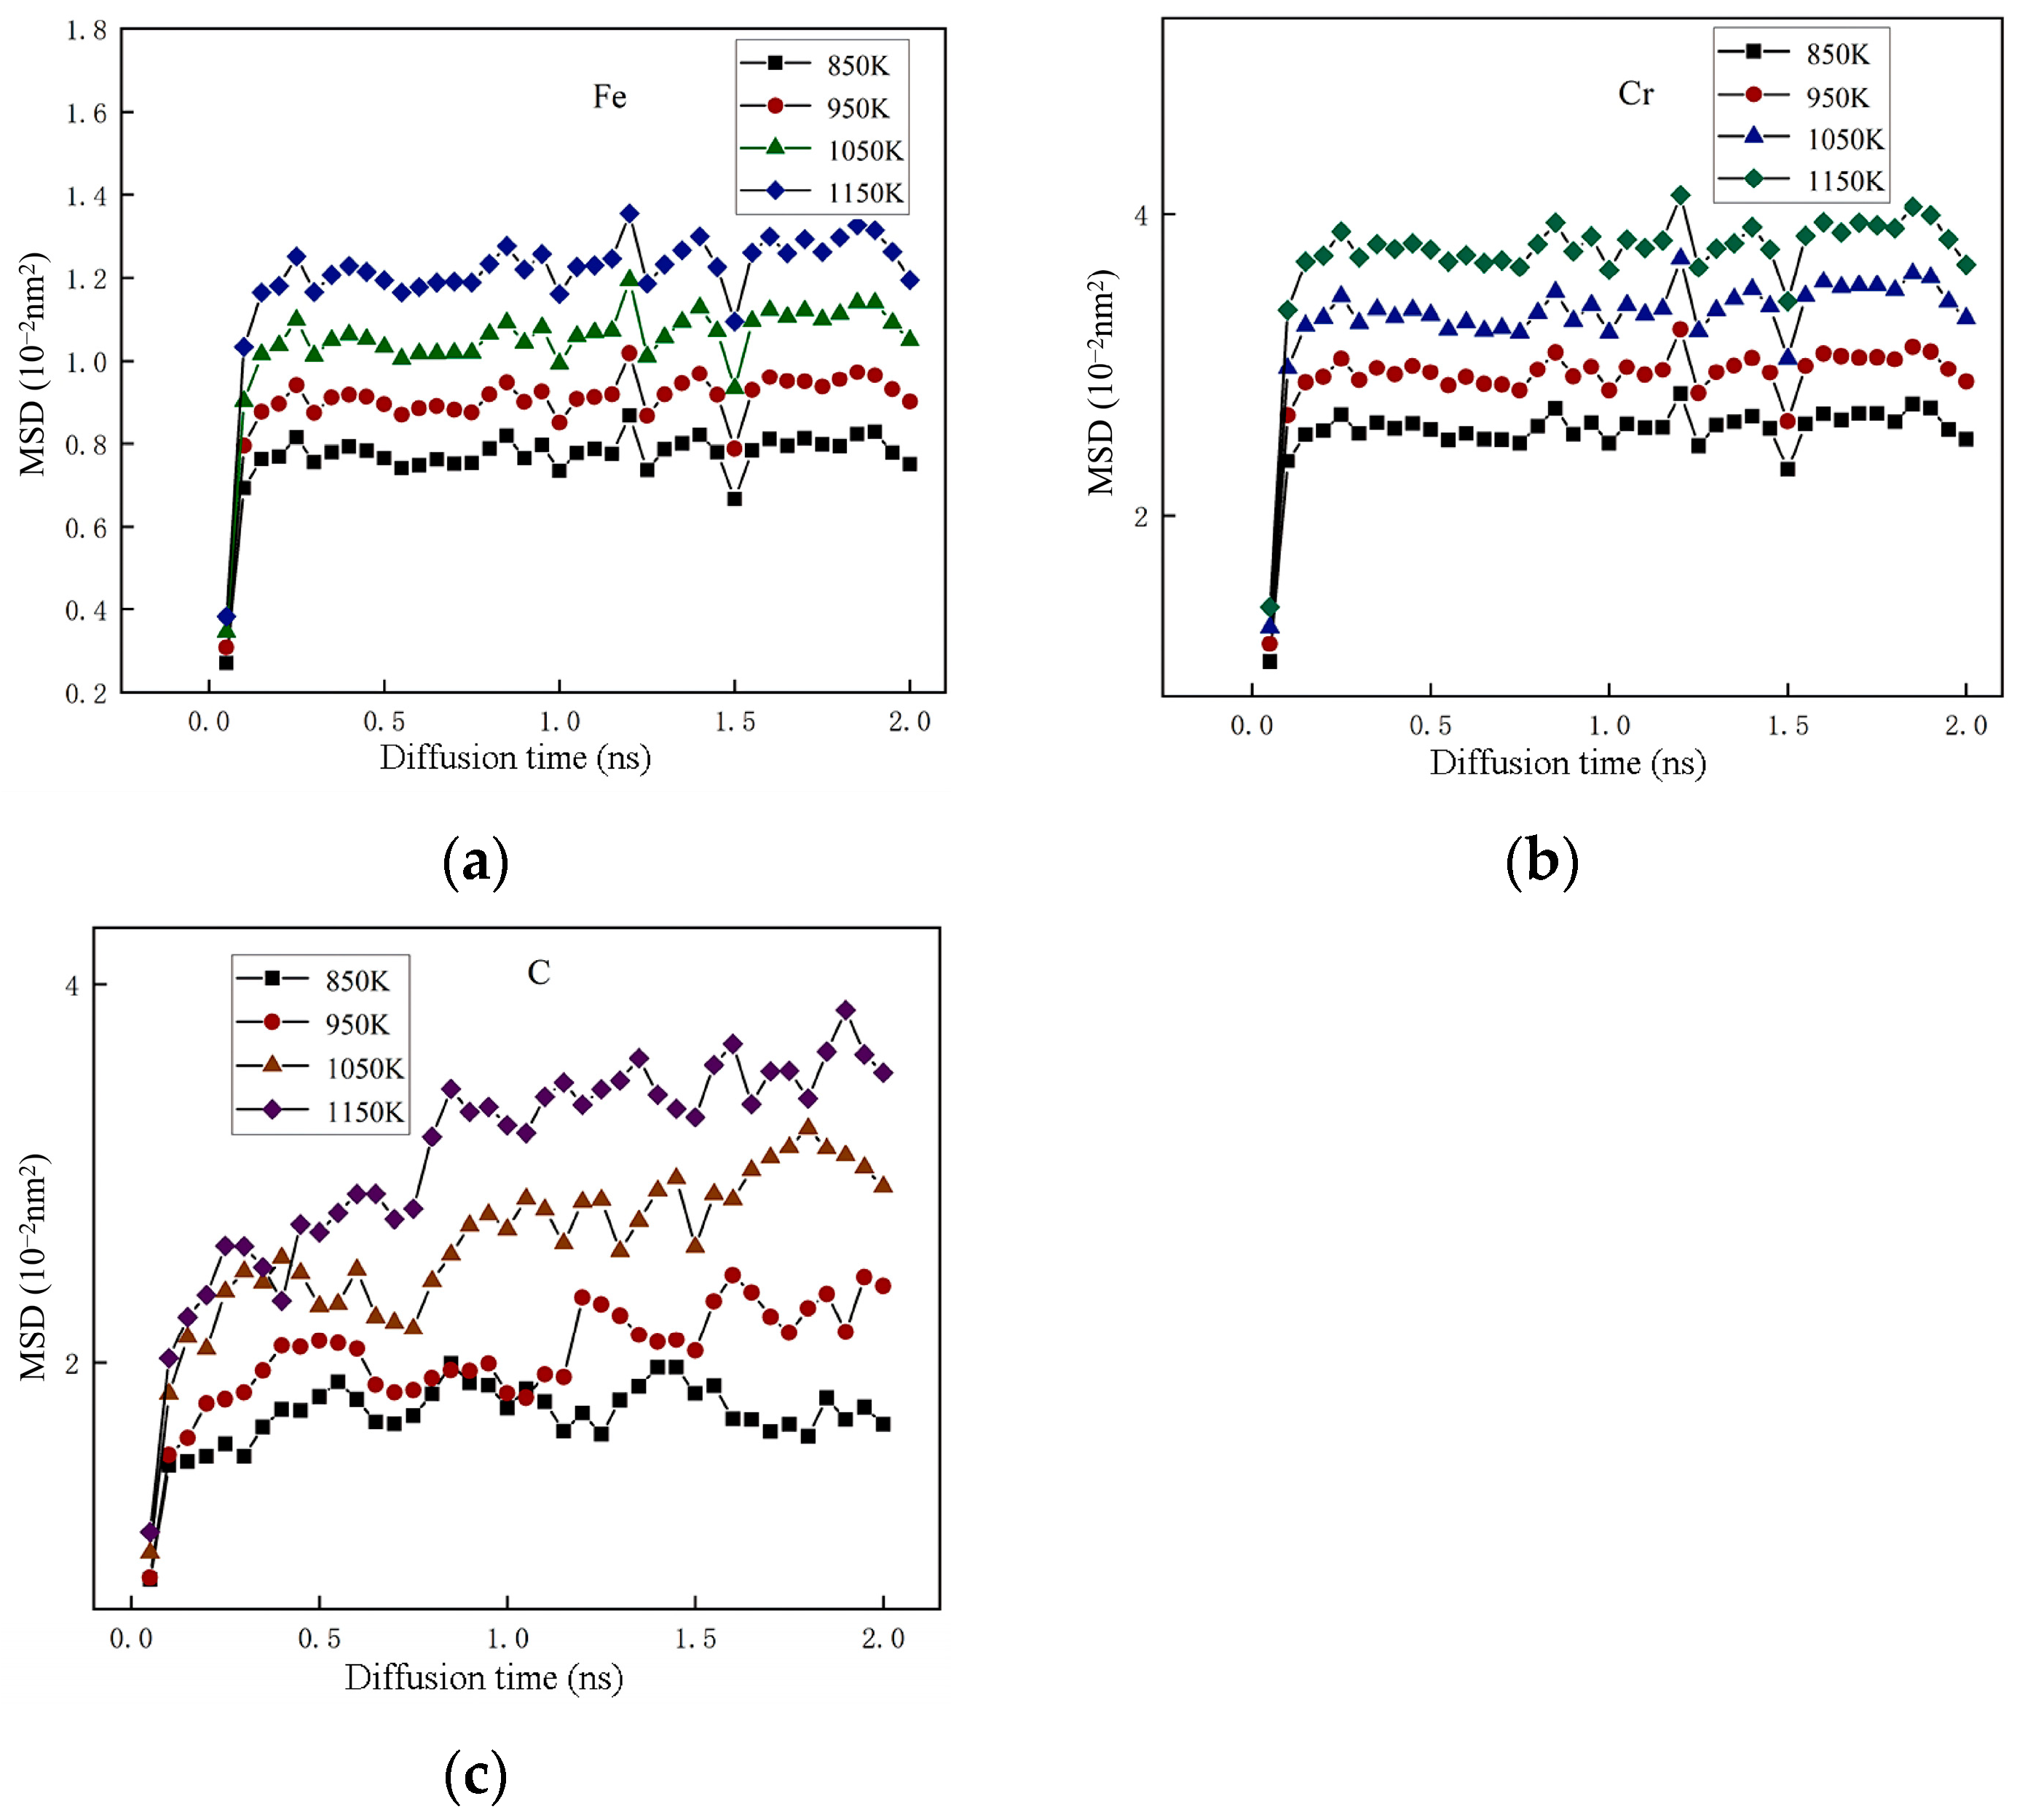
Figure 9 presents the root–mean square displacement (MSD) curves of Fe, Cr, and C atoms at the interface region. The results show that during the transition layer welding process, as the welding heat input increases and the diffusion duration extends, the migration distance of C atoms exhibits a gradual increasing trend. During the period from 0.10 to 2 ns, the atomic displacement values of both iron (Fe) and chromium (Cr) exhibit a synchronous upward trend as the simulation time progresses. However, beyond this range, their displacement remains essentially constant over time but gradually increases with the welding heat input. Evidently, when the welding heat input is the same, C atoms experience the greatest displacement, followed by Cr atoms, while Fe atoms have the least. This indicates that C atoms diffuse preferentially under the same welding heat input conditions, followed by Cr atoms, and Fe atoms are the least likely to diffuse.
Figure 9.
Depicts the MSD curves corresponding of the atoms of the interface. (a) Fe atom; (b) Cr atom; (c) C atom.
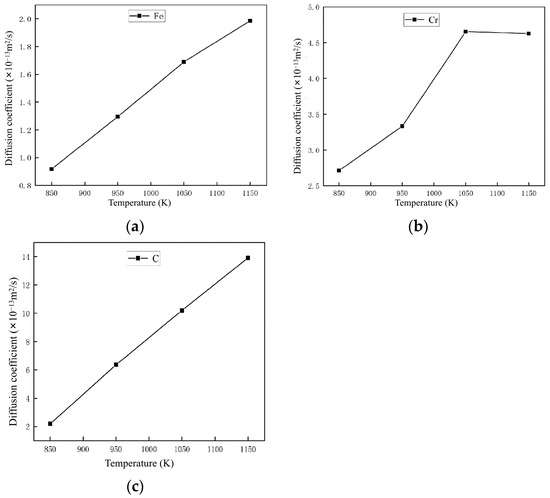
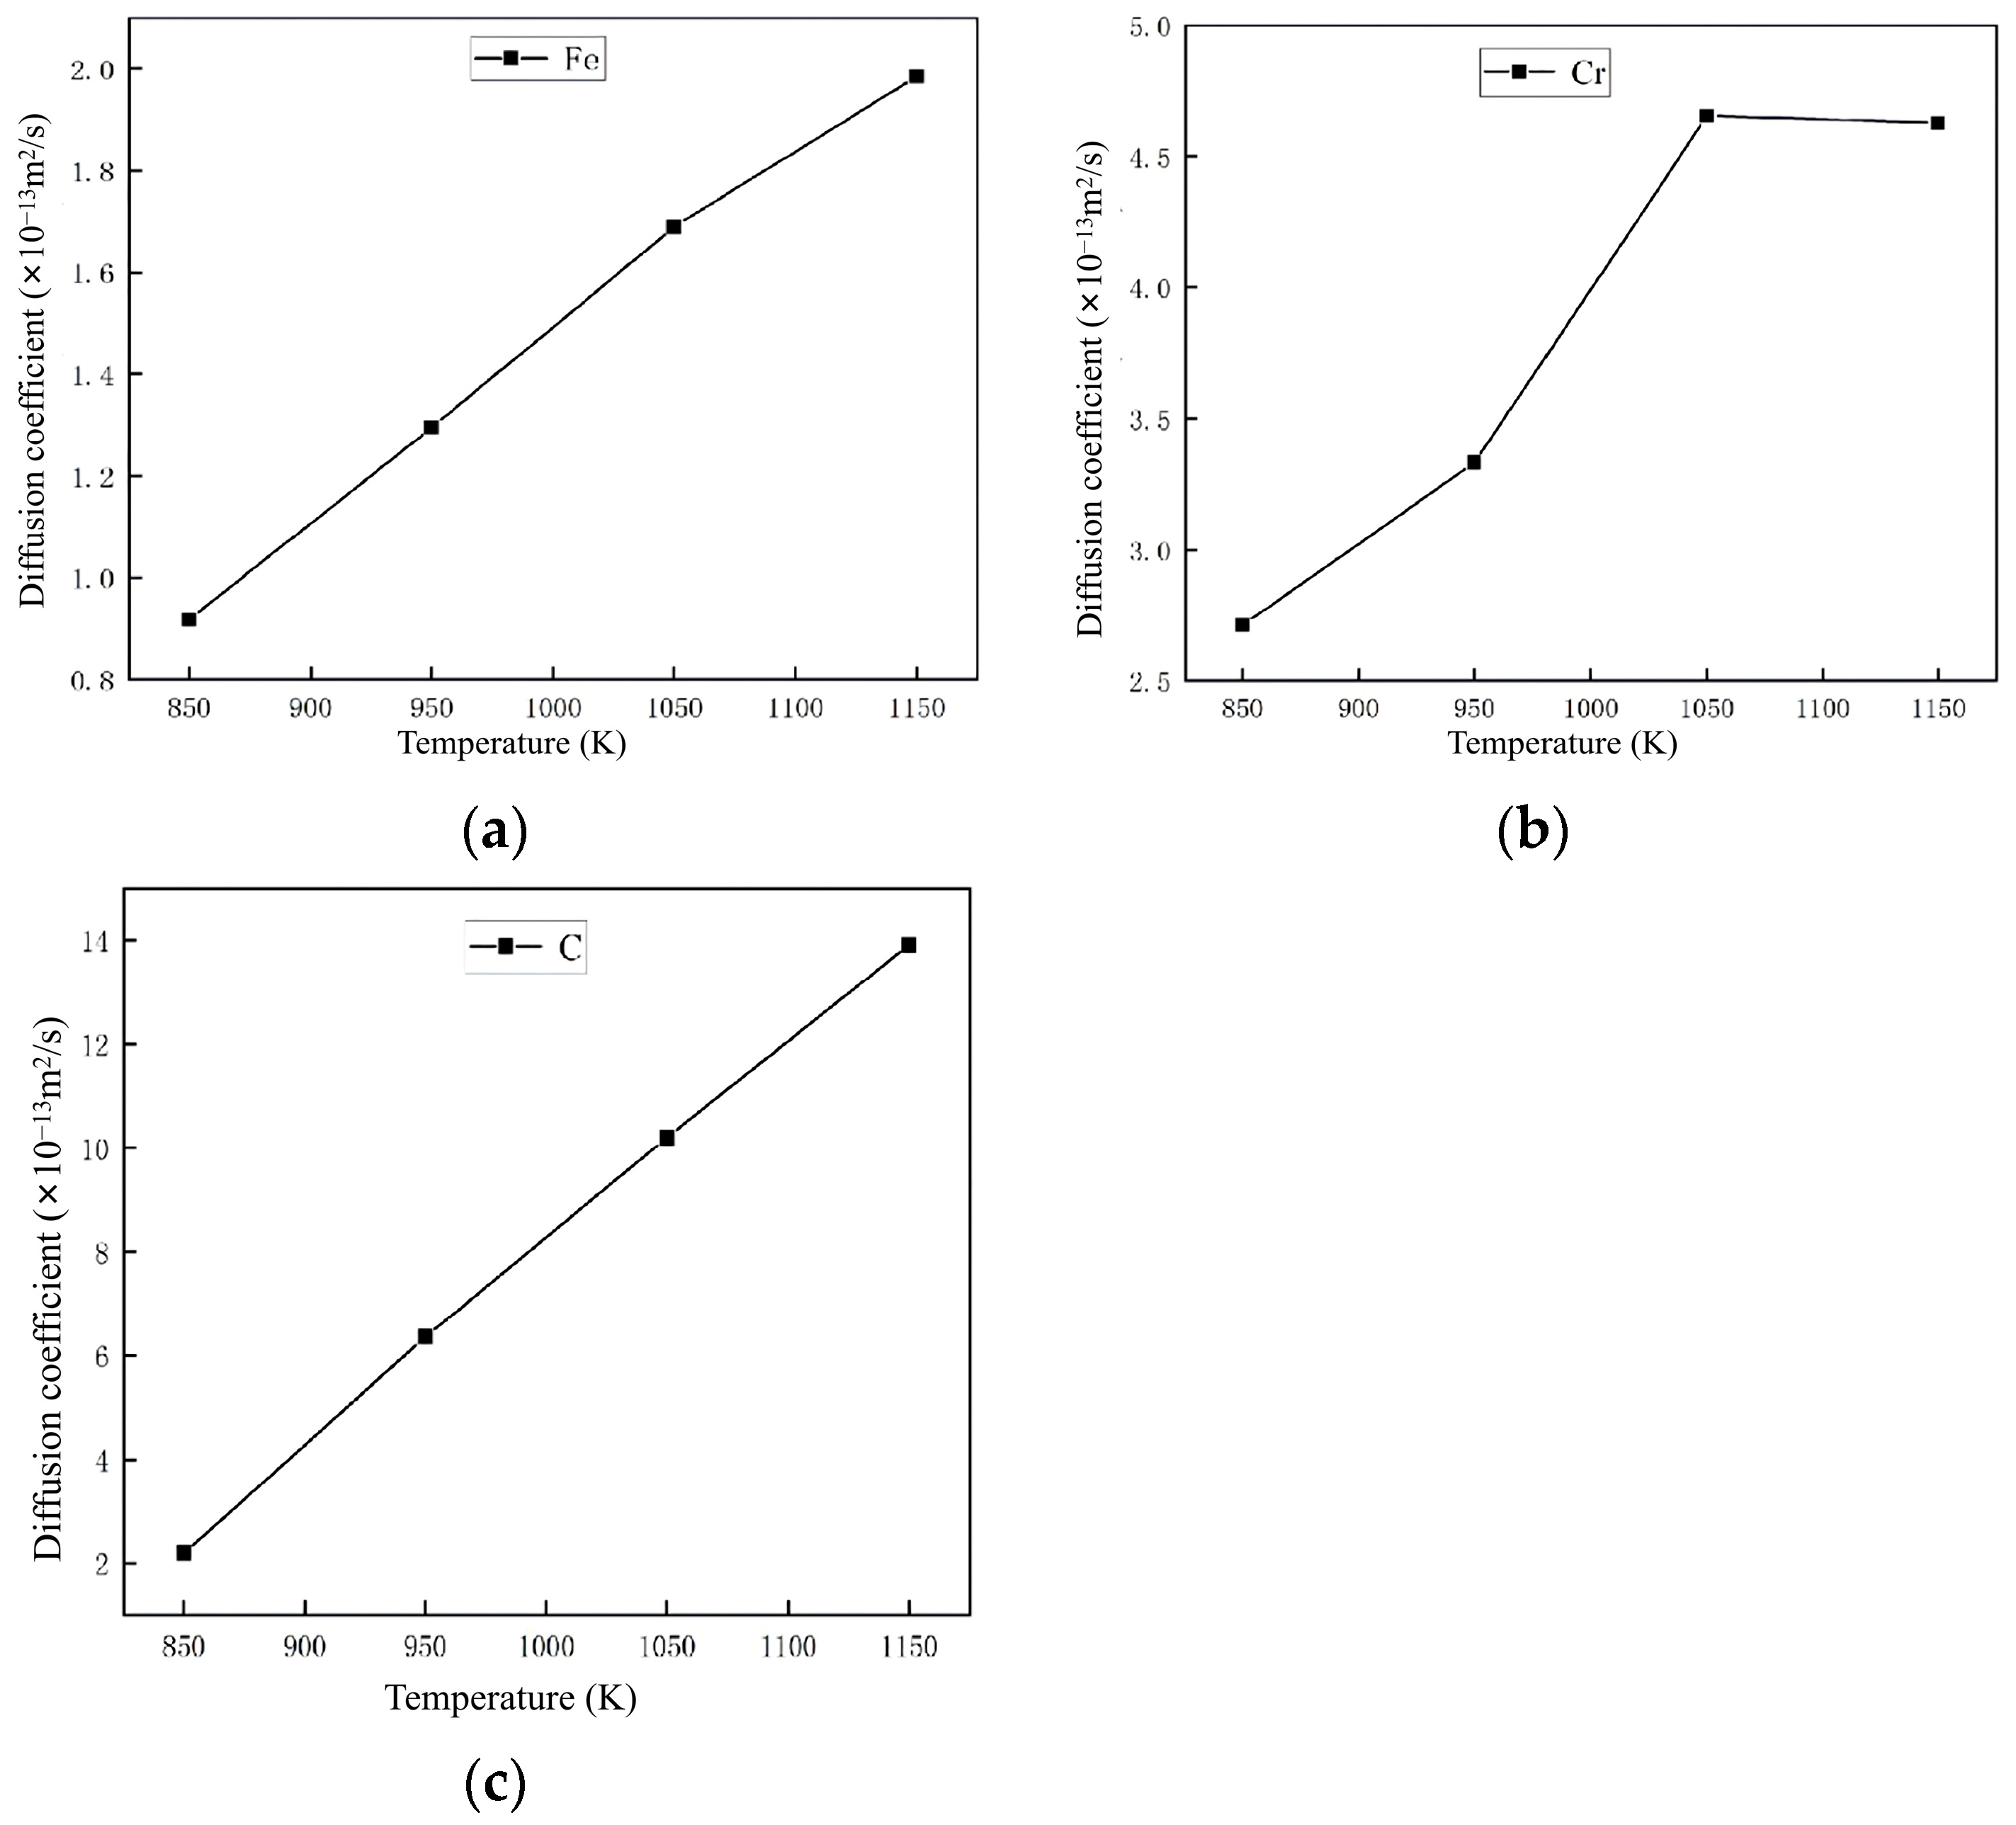
The diffusion coefficients of Fe, Cr, and C atoms can be ascertained through linear fitting of the correlation between their mean squared displacement (MSD) and time. For each atom, its diffusion coefficient is equivalent to one-sixth of the slope within the linear zone. Figure 10 illustrates the variations in diffusion coefficients of Fe, Cr, and C atoms under different temperature conditions. Table 4 presents the statistical values associated with the diffusion coefficients of Fe, Cr, and C atoms at the interface when subjected to varying temperature conditions. The diffusion coefficients of Fe, Cr, and C atoms exhibit an increasing tendency with the elevation of temperature. Under isothermal conditions, the diffusion coefficient of carbon atoms exceeds those of both iron and chromium atoms. Additionally, as the temperature climbs steadily, the disparity in diffusion coefficients among carbon, iron, and chromium atoms progressively expands.
Figure 10.
Diffusion coefficients of the atoms of the interface. (a) Fe atom; (b) Cr atom; (c) C atom.
Table 4.
Statistics of diffusion coefficients of Fe, Cr and C atoms of the interface.
3.3.4. Atomic Diffusion Activation Energy
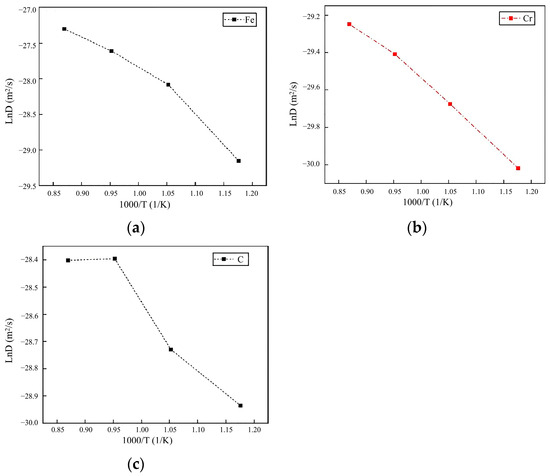
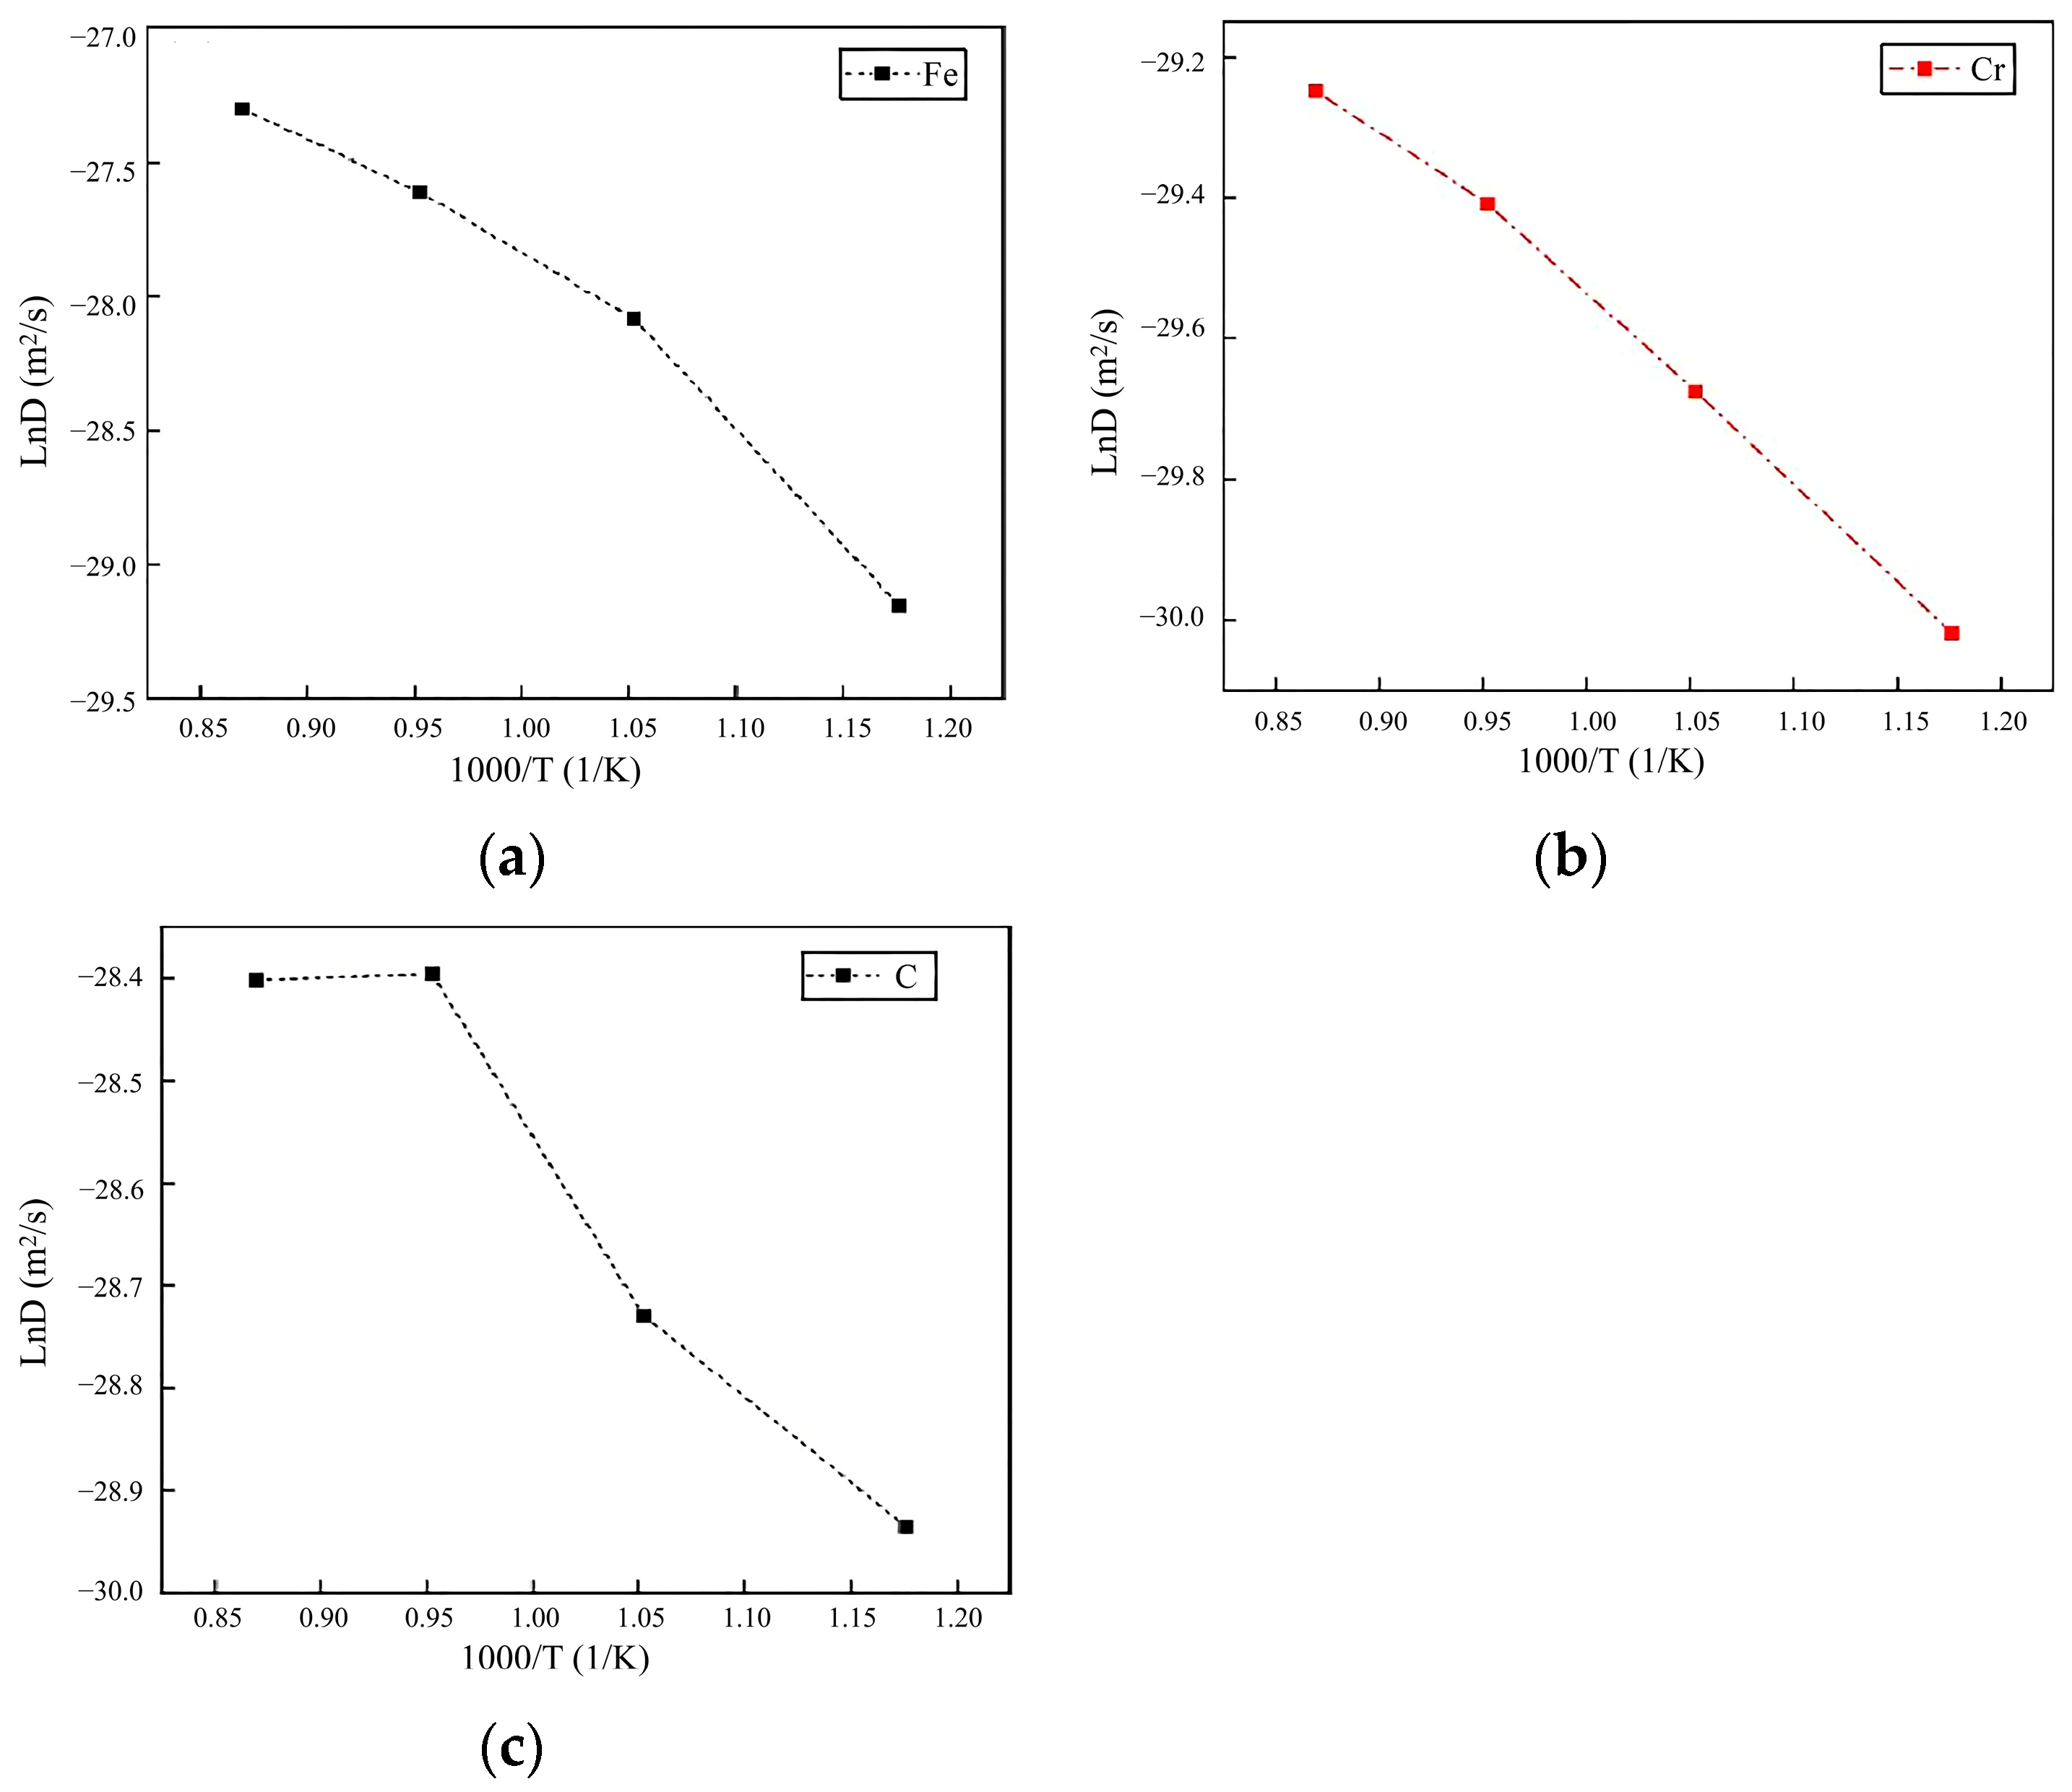
The Arrhenius relationships for Fe, Cr, and C atoms at the interface are presented in Figure 11. Over the temperature range of 850 K to 1150 K, linear regression analysis was utilized to determine the activation energies for the diffusion of Fe, Cr, and C atoms across the interface between the transition layer weld and the base layer weld. These calculated activation energy values were found to be 49.884 J·mol−1 for Fe, 21.126 J·mol−1 for Cr, and 15.954 J·mol−1 for C. This temperature-dependent analysis provides quantitative insight into the atomic mobility characteristics at the weld interface, with carbon exhibiting the lowest diffusion barrier followed by chromium and iron.
Figure 11.
The relationship between the coefficient of diffusion and temperature variation in material systems. (a) Fe atom; (b) Cr atom; (c) C atom.
3.3.5. Atomic Diffusion Process
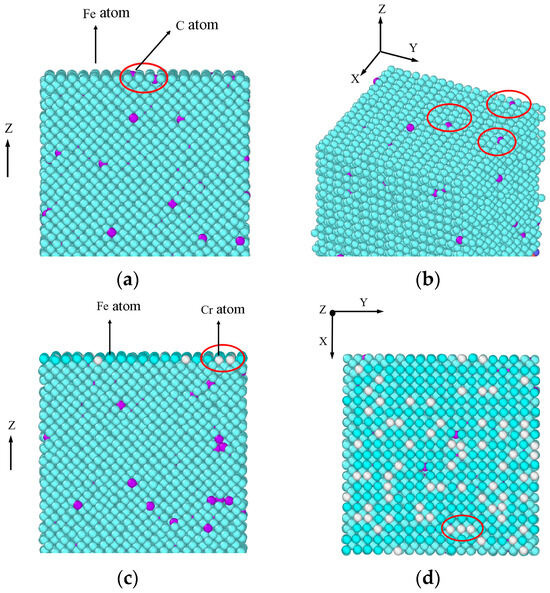
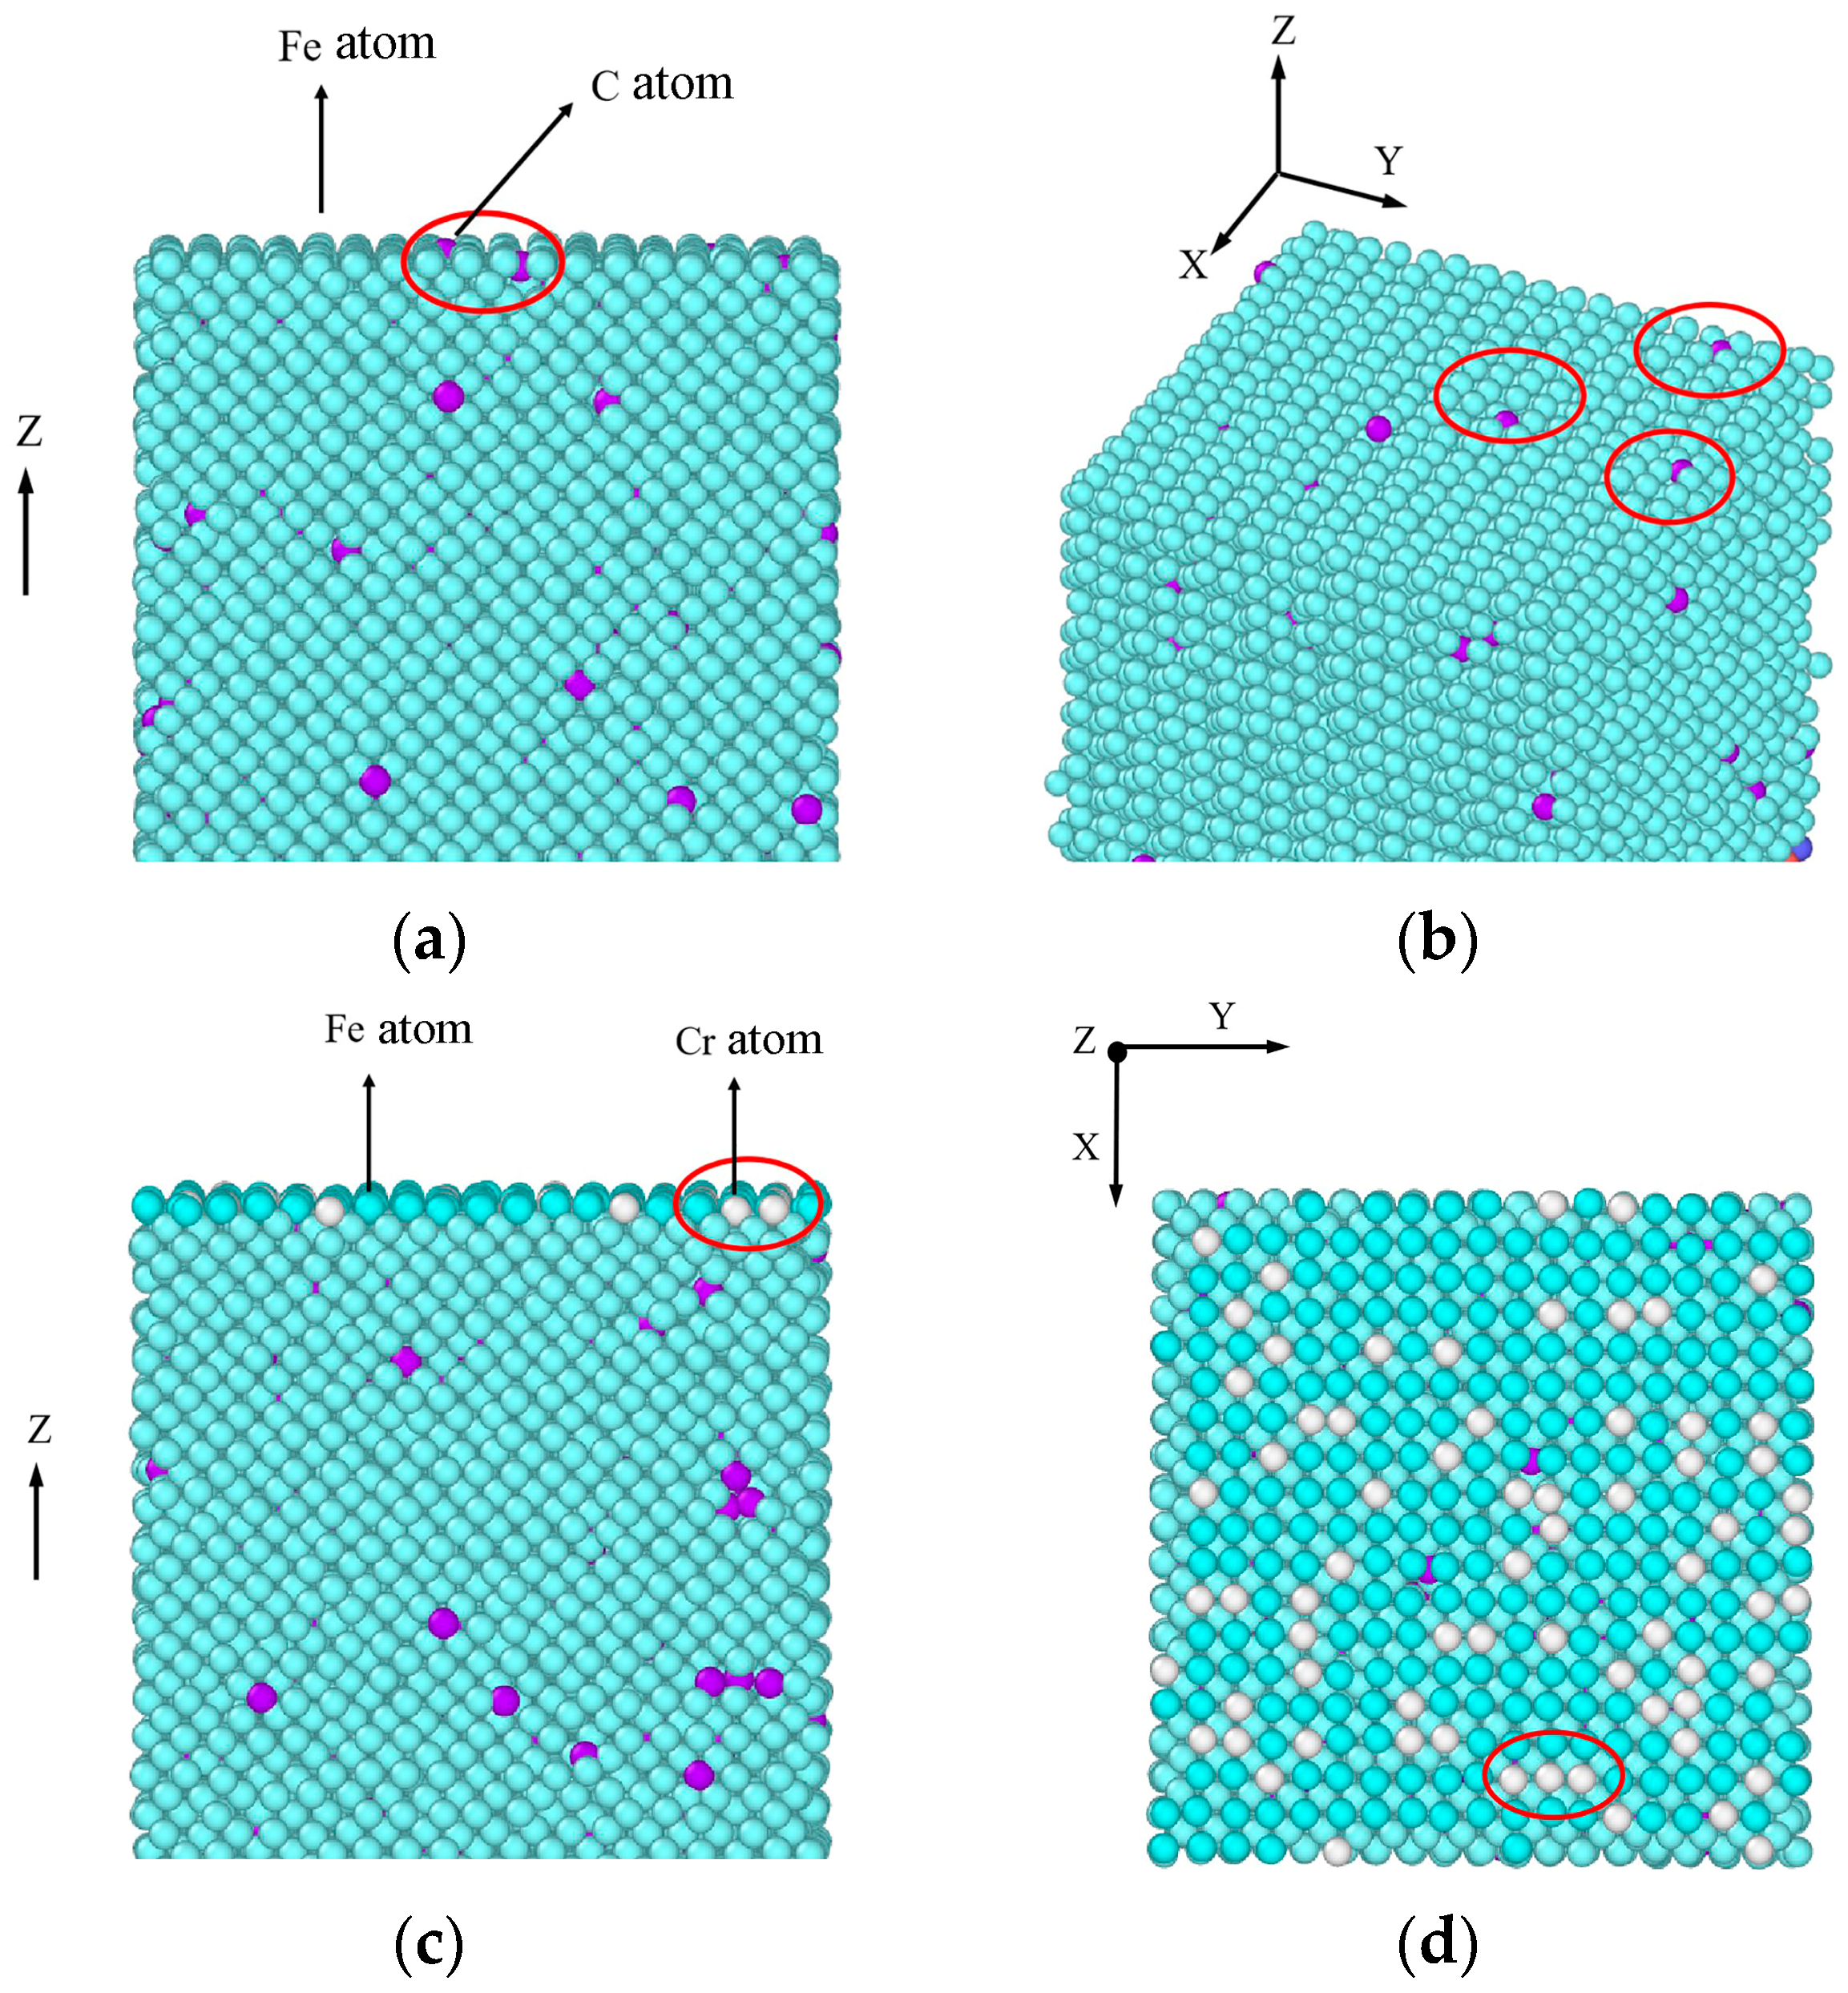
Figure 12 presents the spatial distribution characteristics of interfacial atoms during the entire diffusion process. To be more specific, Figure 12a,b illustrate the distribution of C atoms within the transition layer weld at a temperature of 850 K. Meanwhile, Figure 12c,d exhibit the spatial distribution characteristics of Cr and C atoms at the interface region and within the weld transition layer under the condition of temperature reaching 1150 K. In these figures, Cr atoms are represented by the color white, C atoms by purple, and Fe atoms by blue–green. The figures reveal that during the atomic diffusion process, Cr and Fe atoms occupy lattice positions, while C atoms occupy interstitial positions. This suggests that the diffusion mechanism of C atoms is interstitial diffusion, whereas the diffusion mechanisms of Cr and Fe atoms are substitutional diffusion. Additionally, the distribution of C and Cr atoms at 850 K and 1150 K indicates that as the interfacial temperature rises, C atoms migrate from the base layer weld through the interface boundary into the transition weld region, while Cr atoms within the transition weld layer concurrently diffuse toward the interface area.
Figure 12.
The positional distribution of interface atoms during the diffusion process. (a,b): C atom distribution in transition layer weld at 850 K; (c,d): Spatial distribution of Cr and C atoms in interface zone and transition layer weld at 1150 K.
4. Discussion
Within this investigation, EBSD techniques were applied to characterize the crystallographic orientation and microstructure at the transition layer weld/base layer weld interface of S32304/Q390C composite plate, while the GND density at the interface region was computed. Additionally, numerical simulation approaches were utilized to examine the atomic diffusion behavior at the interface across varying welding heat input conditions. Key findings derived from this work are presented below.
(1) Microstructural characterization analysis conducted on the bonding interface region connecting the transition layer weld and base layer weld reveals that within the base layer weld region adjacent to the interface, a distinct equiaxed grain morphology is observed, and with two structural zones of different grain sizes. The structure of the zone close to the interface was a coarse ferrite structure, while the structure of the zone far from the interface was finer grains of ferrite. When the heat input of the transition layer weld undergoes an increase from the initial range of 1.68 kJ/mm and 1.96 kJ/mm to the higher range of 1.92 kJ/mm and 2.24 kJ/mm, several distinct microstructural changes are observed. Specifically, the average geometrically necessary dislocation density exhibits a noticeable rise, increasing from 1.4985 × 10¹⁴ m2 to 1.8101 × 10¹⁴ m2. Concurrently, the width of the coarse ferrite zone expands from 100 μm to 150 μm, while the average grain size increases from 3.98 μm to 4.65 μm. Furthermore, this thermal input variation also leads to the formation of Cr23C6 precipitates within the material structure.
(2) Molecular dynamics simulation analysis conducted on the interface reveals that with the increase in heat input applied to the transition layer weld, the diffusion coefficients of iron (Fe), chromium (Cr), and carbon (C) atoms on both sides across the interface exhibit a concurrent increasing trend. At an identical temperature condition, carbon (C) atoms exhibit the highest diffusion coefficient among the three elements examined, with chromium (Cr) atoms following in terms of diffusion capacity, while iron (Fe) atoms demonstrate the minimum diffusion coefficient value. In the temperature interval of 850–1150 K, the interfacial region exhibits distinct diffusion behaviors for C and Cr atoms. For C atoms within this region, the diffusion activation energy is measured as 15.954 J·mol−1, operating through an interstitial diffusion mechanism, and it first diffuses towards the transition layer weld. In comparison, Cr atoms present a higher diffusion activation energy of 21.126 J·mol−1, and their diffusion process follows a substitutional mechanism. In the initial phase of transition layer seam welding, as interfacial temperature rises, chromium (Cr) atoms diffuse from the transition layer weld to the base layer weld. Fe atoms exhibit a diffusion activation energy of 49.884 J·mol−1, with the diffusion mechanism identified as substitutional diffusion. In this process, Fe atoms migrate from the base layer weld toward the transition layer weld. As the heat input increases and welding duration is extended during the welding process of the transition layer, the interfacial diffusion distances of Fe, Cr, and C atoms are found to be longer, with carbon atoms exhibiting the most pronounced enhancement in their diffusion range.
5. Patents
A method for simulating the atomic diffusion behavior of stainless steel composite plates based on molecular dynamics simulation. Invention patent. Patent number: 202410366994.2.
Author Contributions
Conceptualization, Y.F. and Z.W.; methodology, Z.W.; software, Y.F.; validation, Y.F. and Z.W.; formal analysis, Z.W.; investigation, Y.F.; resources, Y.F.; data curation, Y.F.; writing—original draft preparation, Y.F.; writing—review and editing, Y.F.; visualization, Y.F.; supervision, Z.W.; project administration, Z.W.; funding acquisition, Y.F. All authors have read and agreed to the published version of the manuscript.
Funding
This research was funded by the National Natural Science Foundation of China (grant number U23A20627), university-level research fund project of Shanxi Vocational University of Engineering Science and Technology (grant number KJ202412), Electromagnetic Protection Materials Technology and Engineering Research Center of Shanxi Vocational University of Engineering Science and Technology (grant number PT202408), and The APC was funded by KJ202412.
Data Availability Statement
The original research data supporting the reported findings of this study are fully included within the article. Further inquiries regarding the data can be directed to the corresponding author for additional clarification or verification.
Acknowledgments
We acknowledge all authors for supporting this article.
Conflicts of Interest
The authors declare no conflicts of interest.
References
- Kumar, S.; Yadav, V.K.; Sharma, S.K.; Pandey, C.; Goyal, A.; Kumar, P. Role of dissimilar Ni-based ERNiCrMo-3 filler on the microstructure, mechanical properties and weld induced residual stresses of the ferritic/martensitic P91 steel welds joint. Int. J. Press. Vessel. Pip. 2021, 193, 104443. [Google Scholar] [CrossRef] [Scilit]
- Zhu, Q.C.; Zhu, Y.C.; Wang, J.; Jiang, L.; Li, Z.J. The Strain Evolution and Fracture of GH3535 Alloy Welded Joint Characterized by DIC at Different Temperatures. Crystals 2025, 15, 916. [Google Scholar] [CrossRef] [Scilit]
- Yang, Y.; Jiang, Z.; Liu, X.; Sun, J.; Wang, W. Enhanced interfacial strength and ductility of stainless steel/carbon steel laminated composite by heterogenous lamella structure. J. Mater. Res. Technol. 2022, 18, 4846–4858. [Google Scholar] [CrossRef] [Scilit]
- Gagliardi, G.M.; Kulkarni, M.D.; Marulo, F. Continuum Approach to Shape Sensitivity Analysis in Composite Laminates. J. Mater. Eng. Perform. 2025, 34, 15359. [Google Scholar] [CrossRef] [Scilit]
- Chen, Y.; Liu, Y.; Chen, C.; Cui, H. Metallurgical and Mechanical Properties of Fibrous Laser Welded Thick Q890 High Strength Low Alloy Steel with Varying Weld Geometries. J. Mater. Eng. Perform. 2022, 31, 4434. [Google Scholar] [CrossRef] [Scilit]
- Gonya, E.M.; Makhatha, M.E.; Siyasiya, C.W.; Silubane, N.M.; Kibambe, N.M. Investigating Optimum Hot Working Window of 2205 Duplex Stainless Steel Using Modified Dynamic Material Modeling. J. Mater. Eng. Perform. 2024, 33, 13879. [Google Scholar] [CrossRef] [Scilit]
- Ban, H.; Yang, X.; Shi, Y.; Chung, K.-F.; Hu, Y.-F. Micro-macro properties of stainless-clad bimetallic steel welded connections with different configurations. J. Constr. Steel Res. 2024, 217, 108637. [Google Scholar] [CrossRef] [Scilit]
- Rathore, S.; Kumar, A.; Sirohi, S.; Singh, V.; Gupta, A.; Fydrych, D.; Pandey, C. Role of buttering layer composition on microstructural heterogeneity and mechanical properties of Alloy 617 and P92 steel dissimilar welded joints for future Indian AUSC program. Int. J. Adv. Des. Manuf. Technol. 2024, 133, 671. [Google Scholar] [CrossRef] [Scilit]
- Zhang, Y.; Yang, S.; Wang, Z.; Ren, L.; Li, P.; Zhang, J. Research on hybrid technology involving laser penetration and narrow gap laser filler welding for thick bimetallic composite plates. Opt. Laser Technol. 2024, 175, 110710. [Google Scholar] [CrossRef] [Scilit]
- Kumar, N.; Kumar, P.; Pandey, C. Influence of filler materials on GTAW dissimilar welds: Inconel 718 and austenitic stainless steel 304L. Arch. Civ. Mech. Eng. 2024, 24, 231. [Google Scholar] [CrossRef] [Scilit]
- Shao, Q.; Shi, Y.; Wang, X.; Li, M.; Chang, Y.; Gan, Y.; Cai, B. Study of repair welding on microstructure, mechanical properties and corrosion resistance of dissimilar welded joints of SUS304 and Q345B steel. J. Mater. Process Technol. 2023, 23, 4173–4189. [Google Scholar] [CrossRef] [Scilit]
- Yi, Y.; Feng, K.K.; Zhang, S.; Jin, H. Analysis of microstructure and properties evolution of asynchronous hot rolled stainless steel clad plate with interlayer. Mater. Today Commun. 2025, 42, 111380. [Google Scholar] [CrossRef] [Scilit]
- Wang, L.; Ding, Y.; Lu, Q.; Guo, Z.; Liu, Y.; Cui, Z. Microstructure and corrosion behavior of welded joint between 2507 super duplex stainless steel and E690 low alloy steel. Corros. Commun. 2023, 11, 1–11. [Google Scholar] [CrossRef] [Scilit]
- Yang, X.; Shi, Y.; Ban, H. In-plane bending tests on stainless-clad bimetallic steel welded tubular T-joints. Eng. Struct. 2025, 340, 120726. [Google Scholar] [CrossRef] [Scilit]
- Nawaz, B.; Long, X.; Li, Y.; Yang, Z.; Zhan, F. Effect of Ferrite/Martensite on Microstructure Evolution and Mechanical Properties of Ultrafine Vanadium Dual-Phase Steel. J. Mater. Eng. Perform. 2022, 31, 4305. [Google Scholar] [CrossRef] [Scilit]
- Cao, J.; Wang, Y.; Liu, X.; Xu, G.; Zeng, X.; Wei, K. Single-pass high-power laser-Arc hybrid welding of thick stainless steel clad plates: Microstructure and mechanical properties. J. Mater. Res. Technol. 2024, 30, 5733. [Google Scholar] [CrossRef] [Scilit]
- Li, C.A.; Qin, G.L.; Tang, Y.S.; Zhang, B.G.; Lin, S.B.; Geng, P.H. Microstructures and mechanical properties of stainless steel clad plate joint with diverse filler metals. J. Mater. Res. Technol. 2020, 9, 2522. [Google Scholar] [CrossRef] [Scilit]
- Wei, T.; Fripp, N.; Anthony, B.; Begley, B.A.; Miller, V.M. Laser Bending Behavior of Austenitic Stainless Steels and Characterization of the Resultant Microstructures. J. Mater. Eng. Perform. 2025, 34, 8941. [Google Scholar] [CrossRef] [Scilit]
- Kumar, R.R.; Singh, R.K.; Anoop, C.R.; Das, R.; Murty, S.V.S.N.; Tharian, K.T.; Alex, A. Influence of Filler Metal on the Microstructure and Mechanical Properties of 316Ti-15-5 PH Stainless Steel Weld joints. J. Mater. Eng. Perform. 2022, 31, 10099. [Google Scholar] [CrossRef] [Scilit]
- Yang, Y.; Sun, J.; Liu, X.; Wang, W. Heat transfer behavior and formation mechanism of stainless steel cladding carbon steel plate during horizontal continuous liquid-solid composite casting. Lett. Heat. Mass. Transf. 2024, 159, 108105. [Google Scholar] [CrossRef] [Scilit]
- Xu, R.; Zhu, Y.; Li, B.; Yang, H.; Zhang, C. Interface behaviors and mechanical properties of diffusion bonded 45 steel/additive manufactured 316L steel joints. J. Mater. Process Technol. 2024, 30, 1279. [Google Scholar] [CrossRef] [Scilit]
- Ranjan, R.; Das, A. Protection from corrosion and wear by different weld cladding techniques: A review. Mater. Today Proc. 2022, 57, 1687. [Google Scholar] [CrossRef] [Scilit]
- Su, Y.; Xia, H.; Chen, S.; Wang, C.; Xu, S.; Lu, W. Thermo-mechanical-fluid coupled modeling for residual stress prediction in thick plate welding. J. Mater. Res. Technol. 2025, 36, 7557. [Google Scholar] [CrossRef] [Scilit]
- Xia, Y.; Zhou, D.; Qin, W.; Gao, Z.; Lv, C.; Hu, W. The synergistic effect of microstructure evolution on corrosion resistance-mechanical properties of carbon steel/stainless steel cladding tubes during heat treatment. Corros. Sci. 2025, 256, 113185. [Google Scholar] [CrossRef] [Scilit]
- Wei, Z.; Yuan, M.; Shen, X.; Han, F.; Yao, Y.; Xin, L.; Yao, L. EBSD investigation on the interface microstructure evolution of Ti-Al3Ti laminated composites during the preparation process. Mater. Charact. 2020, 165, 110374. [Google Scholar] [CrossRef] [Scilit]
- Zhuang, Z.; Qian, X.; Zeng, L.; Lu, W.; Li, Z.; Xiang, Y. Response characterization on the microstructure, and mechanical and corrosion behavior of clad rebars of different weld materials. Case Stud. Constr. Mater. 2025, 22, e04316. [Google Scholar] [CrossRef] [Scilit]
- Maurya, A.K.; Bhattacharyya, A.; Chhibber, R.; Pandey, C. Structural integrity and corrosion behavior assessment of the dissimilar gas tungsten arc welded joint of SDSS 2507/IN625 superalloy. Mater. Chem. Phys. 2023, 58, 8597. [Google Scholar] [CrossRef] [Scilit]
- Thakur, R.K.; Kishore, K.; Shajan, N.; Kumar, D.V.; Kumar B, N.; Prabhakaran, A.; Paul, S.K.; Tiwari, M.; Arora, K.S. Effect of number of deposition layers on the microstructure, corrosion and fretting wear of duplex stainless-steel weld cladding. Surf. Coat. Technol. 2025, 502, 131924. [Google Scholar] [CrossRef] [Scilit]
- Li, Z.; Xie, K.; Kong, X.; Song, M.; Xie, X.; Zhan, X.; Hu, X. Indentation parameters and corrosion resistance of explosive welded S30400/Q345R clad plates with heat treatment cycles. Mater. Today Commun. 2024, 41, 110450. [Google Scholar] [CrossRef] [Scilit]
- He, J.; Ma, Y.; Yan, D.; Jiao, S.; Yuan, F.; Wu, X. Improving ductility by increasing fraction of interfacial zone in low C steel/304 SS laminates. Mater. Sci. Eng. A 2018, 726, 288–297. [Google Scholar] [CrossRef] [Scilit]

Disclaimer/Publisher’s Note: The statements, opinions and data contained in all publications are solely those of the individual author(s) and contributor(s) and not of MDPI and/or the editor(s). MDPI and/or the editor(s) disclaim responsibility for any injury to people or property resulting from any ideas, methods, instructions or products referred to in the content. |
© 2026 by the authors. Licensee MDPI, Basel, Switzerland. This article is an open access article distributed under the terms and conditions of the Creative Commons Attribution (CC BY) license.