


Abstract
Liquid metal embrittlement (LME) in the copper/iron system, which represents the iron-rich matrix of the copper/steel dissimilar joints used in bearings and wear-resistant components, weakens the grain boundaries of iron and produces intergranular infiltration. Although this phenomenon has been investigated for decades, the mechanism of LME for the copper/iron system is still unclear. In this work, multiscale simulation methods (molecular dynamics simulation and first-principles calculation) and experimental observation were adopted to reveal the mechanism of LME during the copper/iron dissimilar welding process. The results show that during the arc welding process, the solid Fe was in contact with liquid Cu, and tensile stress was also generated on the Fe at the same time. Copper atoms diffused into the grain boundary and the strength of the grain boundary was decreased. The grain boundary fractured under the tensile stress, and massive liquid copper filled the crack to form the intergranular infiltration. This process occurred repeatedly and led to the growth of intergranular infiltration. The intergranular distribution of Cu therefore embrittles the grain boundaries of the iron matrix, although the iron itself remains ductile.
1. Introduction
Copper/steel composite material has been widely used because of its excellent comprehensive properties such as high ductility, electrical conductivity, thermal conductivity, and high strength [1,2]. Copper/steel composite materials are typically fabricated by dissimilar welding technology [3,4]. However, the liquid metal embrittlement (LME) phenomenon is generated during the copper/steel dissimilar welding process [5,6,7]. LME can be described as the loss of ductility of an intrinsically ductile metal when the metal is in contact with another liquid metal [8]. Liquid metal infiltrates into grain boundaries, thereby inducing brittle intergranular fracture of the solid metal matrix [9]. The LME phenomenon can be widely observed in liquid/solid systems such as Cu/Fe, Zn/Fe, Zn/Al, Bi/Ni, Bi/Cu, and Ga/Al [10]; in Al–Ga alloys, LME competes with grain growth and thereby governs the hydrolysis performance used for hydrogen supply [11].
Liquid-copper-induced embrittlement of steel has received great attention. Heiple [12] reported that the austenitic stainless steel was severely embrittled by liquid copper alloys, while ferritic stainless steel could not be embrittled. Vigilante [13] confirmed that LME occurred in copper-plated gun steel at 1100 °C because of the remelting of copper plating, which led to a decrease in strength and plasticity for steel. Deldar [14] investigated the hot shortness in Cu-bearing steel and found that the remelting of the copper phase could embrittle the steel matrix. Chen [15] found that stress accelerates the LME, and LME can be avoided in stress-free conditions. In addition, alloying elements also influence the LME. Sn and Sb elements are considered to aggravate the LME, and Ni, Al, and Si elements typically suppress the LME [16,17,18,19]. Yuasa [20] found that copper segregation at grain boundaries of BCC-Fe (body-centered cubic) can weaken the grain boundaries through the first-principles calculation. However, it cannot precisely explain the LME of the copper/iron system, since that calculation describes a BCC lattice, whereas iron is austenitic (FCC) at the temperature at which liquid copper attacks it. Despite the fact that related research has been conducted, the detailed formation mechanism of LME for the copper/iron system during the arc welding process is still unclear.
The mechanism of LME has been investigated extensively in other liquid/solid material systems. Atomic-scale observation has been done in Bi/Ni, Bi/Cu, and Ga/Al systems, and the results show that embrittling atoms have been detected in the grain boundaries of solid metal by high-resolution transmission electron microscopy (HR-TEM) [21]. This means that the intergranular diffusion of liquid atoms is the premise for LME. However, the dynamic diffusion process of the embrittling atoms and the influence of the embrittling atoms on the properties of the grain boundary are difficult to characterize experimentally. Theoretical simulation is also an important approach for the systematic study of LME, including finite element simulation, molecular dynamics simulation, and first-principles calculation. The temperature and stress for Zn/Fe systems were obtained by finite element simulation, which are important factors for the generation of liquid metal embrittlement [22,23]. Molecular dynamics (MD) simulation can investigate the motion process of atoms [24], and the diffusion behavior of liquid atoms in the grain boundaries of solid metals has been investigated by MD in Ga/Al and Li/Cu systems [25,26]. First-principles calculations can be used to simulate small systems at atomic and electronic scales. It has been adopted to analyze the LME phenomenon through investigating the effect of liquid atoms on the electronic structure, mechanical properties, and thermodynamic properties of grain boundaries in Zn/Fe, Zn/Al, and Ga/Al systems [27,28], and to analyze Cu grain boundaries containing nonmetallic impurities [29]. The three techniques therefore provide complementary rather than interchangeable information, a point that becomes decisive when the process to be described is both rapid and irreversible.
Three specific questions nevertheless remain open for the copper/iron system. First, the order of events is undetermined. Cu has repeatedly been detected at grain boundaries of the iron, but such observations are post mortem and static; whether Cu reached a boundary before it fractured, or entered a crack that was already open, has not been demonstrated, and the two possibilities imply entirely different mechanisms. Second, the origin of the loss of cohesion is unresolved. The atomic radii of Cu (1.28 Å) and Fe (1.24 Å) are almost identical, so the size-mismatch argument invoked for Zn/Fe, Ga/Al, and Bi/Cu systems cannot be transferred to this system; the weakening must be sought in the electronic structure, and its mechanical and chemical contributions have not been separated for Cu/Fe. Third, the crystal structure is unaddressed. The atomistic work available for Cu in Fe was performed on BCC-Fe [20], whereas the iron in contact with liquid Cu during arc welding is austenitic, that is, FCC; the segregation energetics, the electronic structure, and the tensile response of a Cu-containing FCC-Fe grain boundary have, to the best of our knowledge, not been quantified.
No single technique can answer these questions. Post mortem TEM and EDS fix the chemistry of a grain boundary but not the sequence of events; MD resolves the sequence and the kinetics but carries no information on bonding; first-principles calculations yield the bonding and the energetics, but for a static and idealized boundary. The three methods are therefore used here as three constraints on one causal chain, following the cross-scale approach previously applied to hydrogen-induced intergranular cracking [30], and taken in the order in which the chain proceeds. HR-TEM and EDS mapping of the crack tip and of the grain boundary ahead of it establish the state of the boundary that is about to fail. MD then determines whether, and how fast, liquid Cu can deliver atoms to that boundary within the few seconds of an arc pass. First-principles calculations finally determine what those atoms do to the cohesion of the boundary once they are there, and quantify it through the Rice–Wang strengthening energy and its mechanical and chemical decomposition. On this basis we show that (i) the grain boundary ahead of the infiltrated crack is already enriched in Cu while still intact, so that intergranular diffusion of Cu precedes and is a prerequisite for intergranular fracture; (ii) Cu at the boundary lowers the ideal tensile strength from 11.94 to 9.59 GPa and the separation energy from 8.97 to 7.30 eV, the loss being chemical rather than mechanical in origin (1.54 eV against 0.13 eV), while the Cu–Fe bonds remain metallic but weaker than the Fe–Fe bonds they replace; and (iii) solid-state diffusion alone cannot deliver the observed volume of Cu within the 3–5 s of an arc pass, so the crack advances by a self-sustaining cycle of grain-boundary diffusion, embrittlement, fracture under the welding tensile stress, and infiltration of liquid Cu, which repeats until the melt solidifies.
2. Materials and Methods
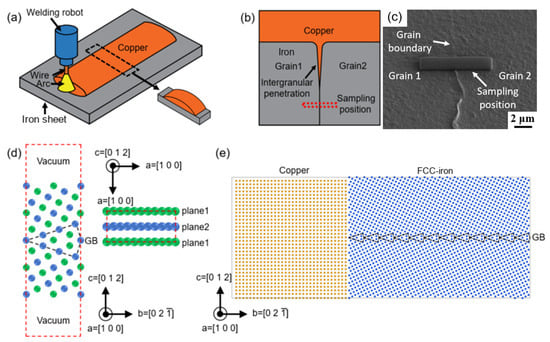
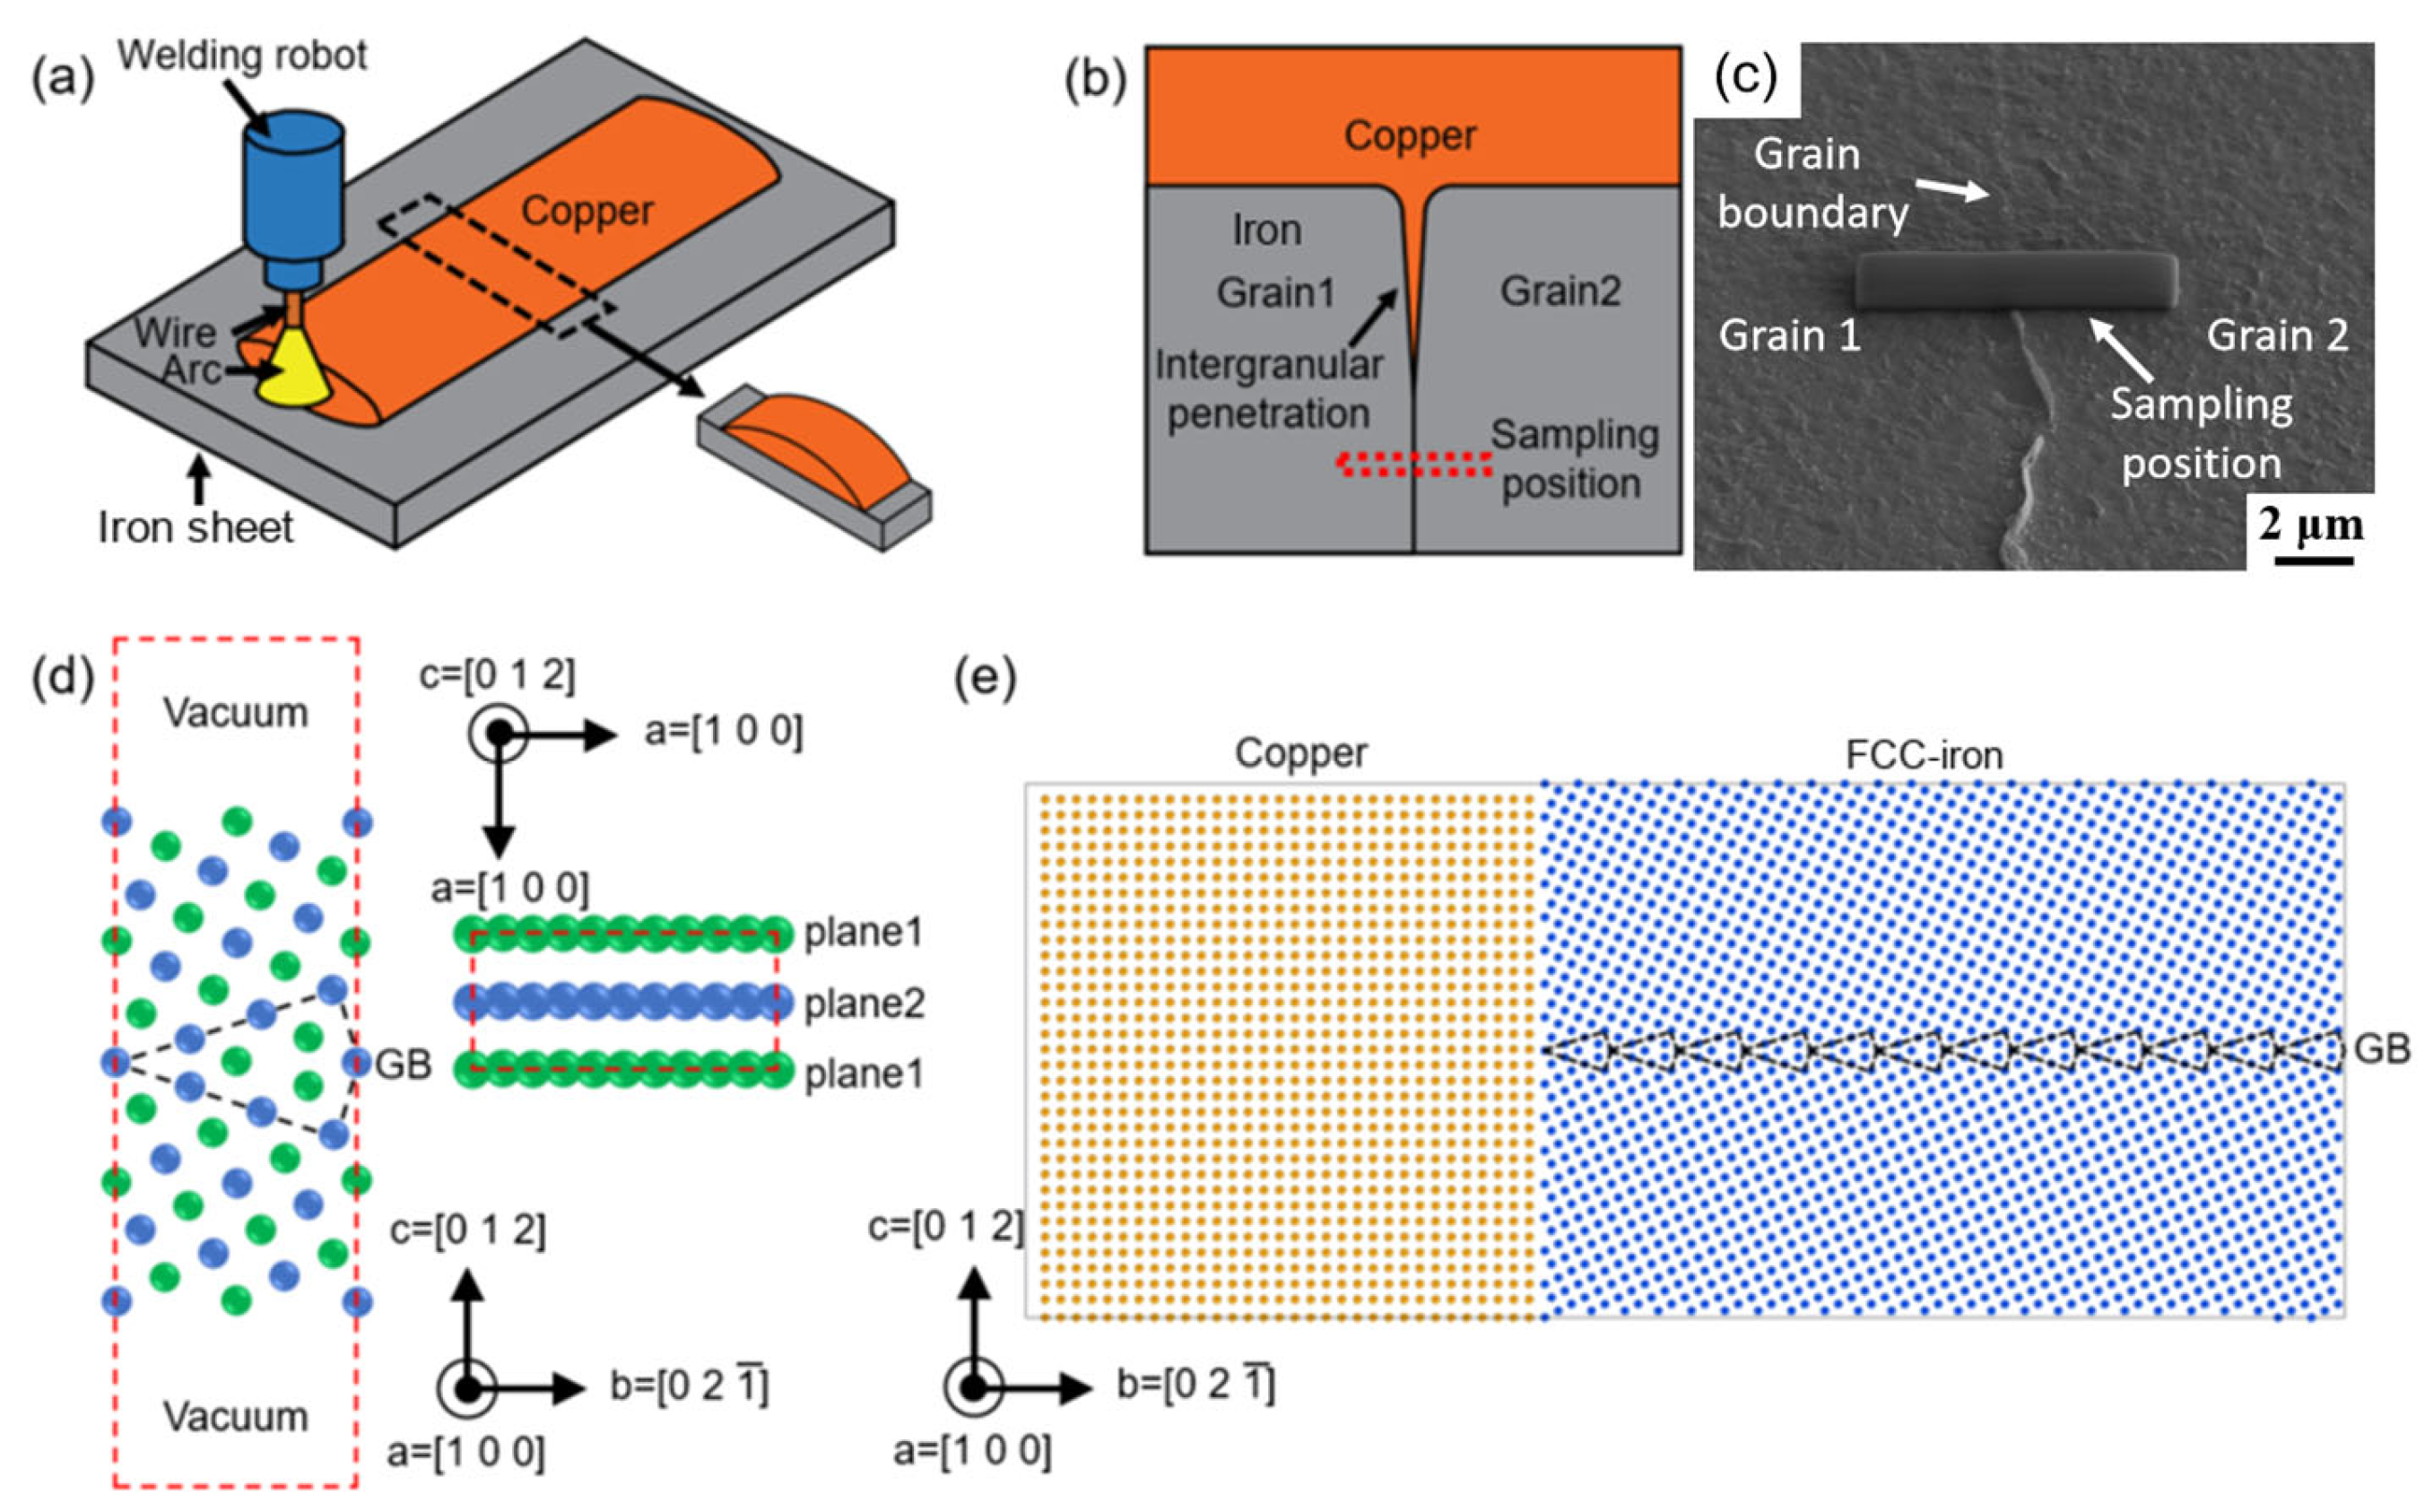
Copper wire of TU1 grade (oxygen-free copper, Cu + Ag ≥ 99.99 wt.%, GB/T 5231-2012 [31]; diameter 1.2 mm) and an iron plate cut from an iron sputtering target (Fe ≥ 99.99 wt.%, 4N, as declared by the supplier; 200 × 60 × 2 mm) were used as the experimental materials. Neither material contains deliberate alloying additions, so that the interaction between liquid Cu and the iron matrix can be studied without interference from elements such as C, Mn, or Si, which segregate to grain boundaries and change their cohesion; the plate represents the iron-rich matrix of the copper/steel system of practical interest and is therefore referred to as the iron substrate below. At the melting point of copper, it is austenitic, that is, FCC, which is the structure assumed in the calculations of Section 3.3. Copper was deposited on the iron plate by cold metal transfer (CMT) arc deposition, as shown in Figure 1a. CMT is a modified gas metal arc welding (GMAW) process in which the molten droplet is detached by a controlled retraction of the wire during the short circuit, so that the transfer takes place at a very low current and therefore at a low heat input; it was selected here because the copper has to be deposited while the iron substrate remains solid. The arc therefore melts the copper wire rather than the substrate, and the procedure is a brazing-type arc deposition rather than the fusion welding of a joint; the term “welding process” in the following text refers to this deposition step. The equipment consisted of a CMT welding power source (Yaskawa RD350), a control cabinet (Yaskawa DX200) and a six-axis welding robot (Yaskawa MA1440), all from Yaskawa Electric Corporation, Kitakyushu, Japan. The copper wire was connected to the positive terminal and the iron plate to the negative terminal, that is, direct current electrode positive (DCEP). Argon of 99.98% purity was used as the shielding gas, at a flow rate of 15–20 L/min. The deposition parameters were as follows: welding current 85 A, arc voltage 13.7 V, travel speed 15 cm/min, contact-tip-to-work distance 12 mm, weaving amplitude 11 mm at a frequency of 2 Hz, and a heat input of 396 J/mm. The wire-feed speed was set by the synergic characteristic of the power source for the selected current. After welding, the sample was cut from the middle position. The cross-section of the sample was observed by optical microscope (OM; BX51, Olympus Corporation, Tokyo, Japan) and scanning electron microscope (SEM; Sirion, FEI Company, Hillsboro, OR, USA) equipped with an energy-dispersive X-ray spectrometer (EDS) to characterize the LME phenomenon. High-resolution transmission electron microscopy (HR-TEM; Talos F200X, FEI Company, Hillsboro, OR, USA) was used to observe the grain boundary of the iron. The film sample for HR-TEM was prepared using the focused ion beam (FIB) method (Strata 400S, FEI Company, Hillsboro, OR, USA). The film sample was taken out at the grain boundary approximately 10 μm ahead of the tip of intergranular infiltration (Figure 1b,c).
Figure 1.
Experimental method: (a) copper/iron dissimilar welding process; (b) sampling position by FIB; (c) morphology of film sample; (d) Σ5 (0 1 2) [1 0 0] grain boundary model for first-principles calculation; (e) copper/iron model for molecular dynamics simulation.
The Vienna Ab-initio Simulation Package (VASP, v5.4)was employed to perform our first-principles calculations. The generalized gradient approximation (GGA) and PAW-PBE pseudopotential were used for calculation. The cutoff energy, convergence energy, and convergence atomic force were set to 400 eV, 10−5 eV/atom, and 0.01 eV/Å, respectively. The k-point mesh was 6 × 3 × 1 for structural optimization and 12 × 6 × 1 for the density of states calculation. The Σ5 (0 1 2) [1 0 0] coincidence lattice grain boundary model was selected for investigation, as shown in Figure 1d. The grain boundary system was composed of two identical FCC (face-centered cubic)-Fe grains, each grain containing 11 layers, with one layer on the grain boundary being shared by the two grains. A vacuum region with a thickness of 12 Å was added on both sides. The dimension of the grain boundary is 3.45 × 7.71 × 39.41 Å3, and the grain boundary model was composed of 42 atoms. The green atoms and blue atoms represent plane 1 and plane 2, respectively. The black dotted line represents the grain boundary. The calculations were not spin-polarized: the iron lattice was treated as non-magnetic face-centered cubic (ISPIN = 1). Austenite is antiferromagnetic, so this is an approximation; because every quantity discussed below is a difference between cells of the same type computed with the same settings, the error is expected to cancel to a large extent between the cells compared, and the conclusions rest on those differences rather than on absolute energies. Absolute values, such as the grain-boundary separation energy, should be regarded as approximate.
Molecular dynamics simulation was performed using LAMMPS (2 Aug 2023) with a time step of 2.0 fs, and a three-dimensional periodic grain boundary model was employed. An NPT ensemble (constant-pressure and constant-temperature) was used for simulation. The interactions between the atoms were described by the ternary Fe–Cu–Ni embedded-atom-method (EAM) potential developed by Bonny et al. [32], distributed as the LAMMPS setfl file FeCuNi.eam.alloy. The potential was fitted to the properties of BCC-Fe, FCC-Cu, and FCC-Ni and to the Fe–Cu heat of mixing, and it was validated in [32] by simulated thermal annealing of Fe–Cu–Ni alloys; it was used here as published, without re-parameterization. The only check made here is that the potential returns the phase state required by the experiment, namely liquid Cu in contact with solid and crystalline Fe over the whole 1200–1400 °C range (Section 3.2). Since the potential is fitted to BCC-Fe, its application to the FCC-Fe lattice of this study is an approximation; the quantities extracted from the simulations are, however, the trajectories and the diffusion distances of Cu along the grain boundary (Section 3.2), which are governed by the liquid Cu and by the structure of the boundary rather than by the BCC–FCC energy difference of Fe, and the trend obtained, namely deeper infiltration at higher temperature and at the weld center, agrees with the experiment (Section 3.1). The copper/iron model is shown in Figure 1e. Two FCC-Fe grains and the Σ5 (0 1 2) [1 0 0] grain boundary (black dotted line) are built, and the dimension is 62.08 × 92.47 × 61.65 Å3. Bulk Cu is assembled with iron, and the dimension is 62.08 × 60 × 61.65 Å3. The numbers of Cu atoms and Fe atoms were 19,406 and 34,560 respectively.
3. Results and Discussion
3.1. Results of the Welding Experiment
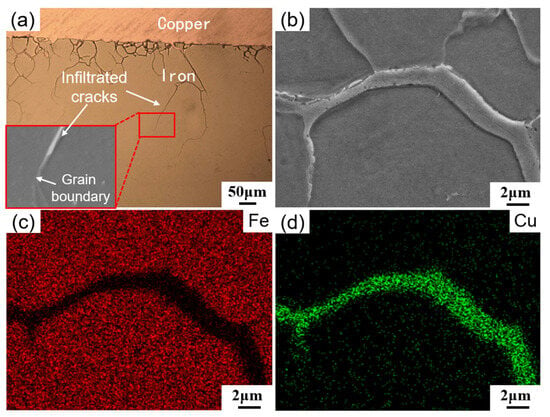
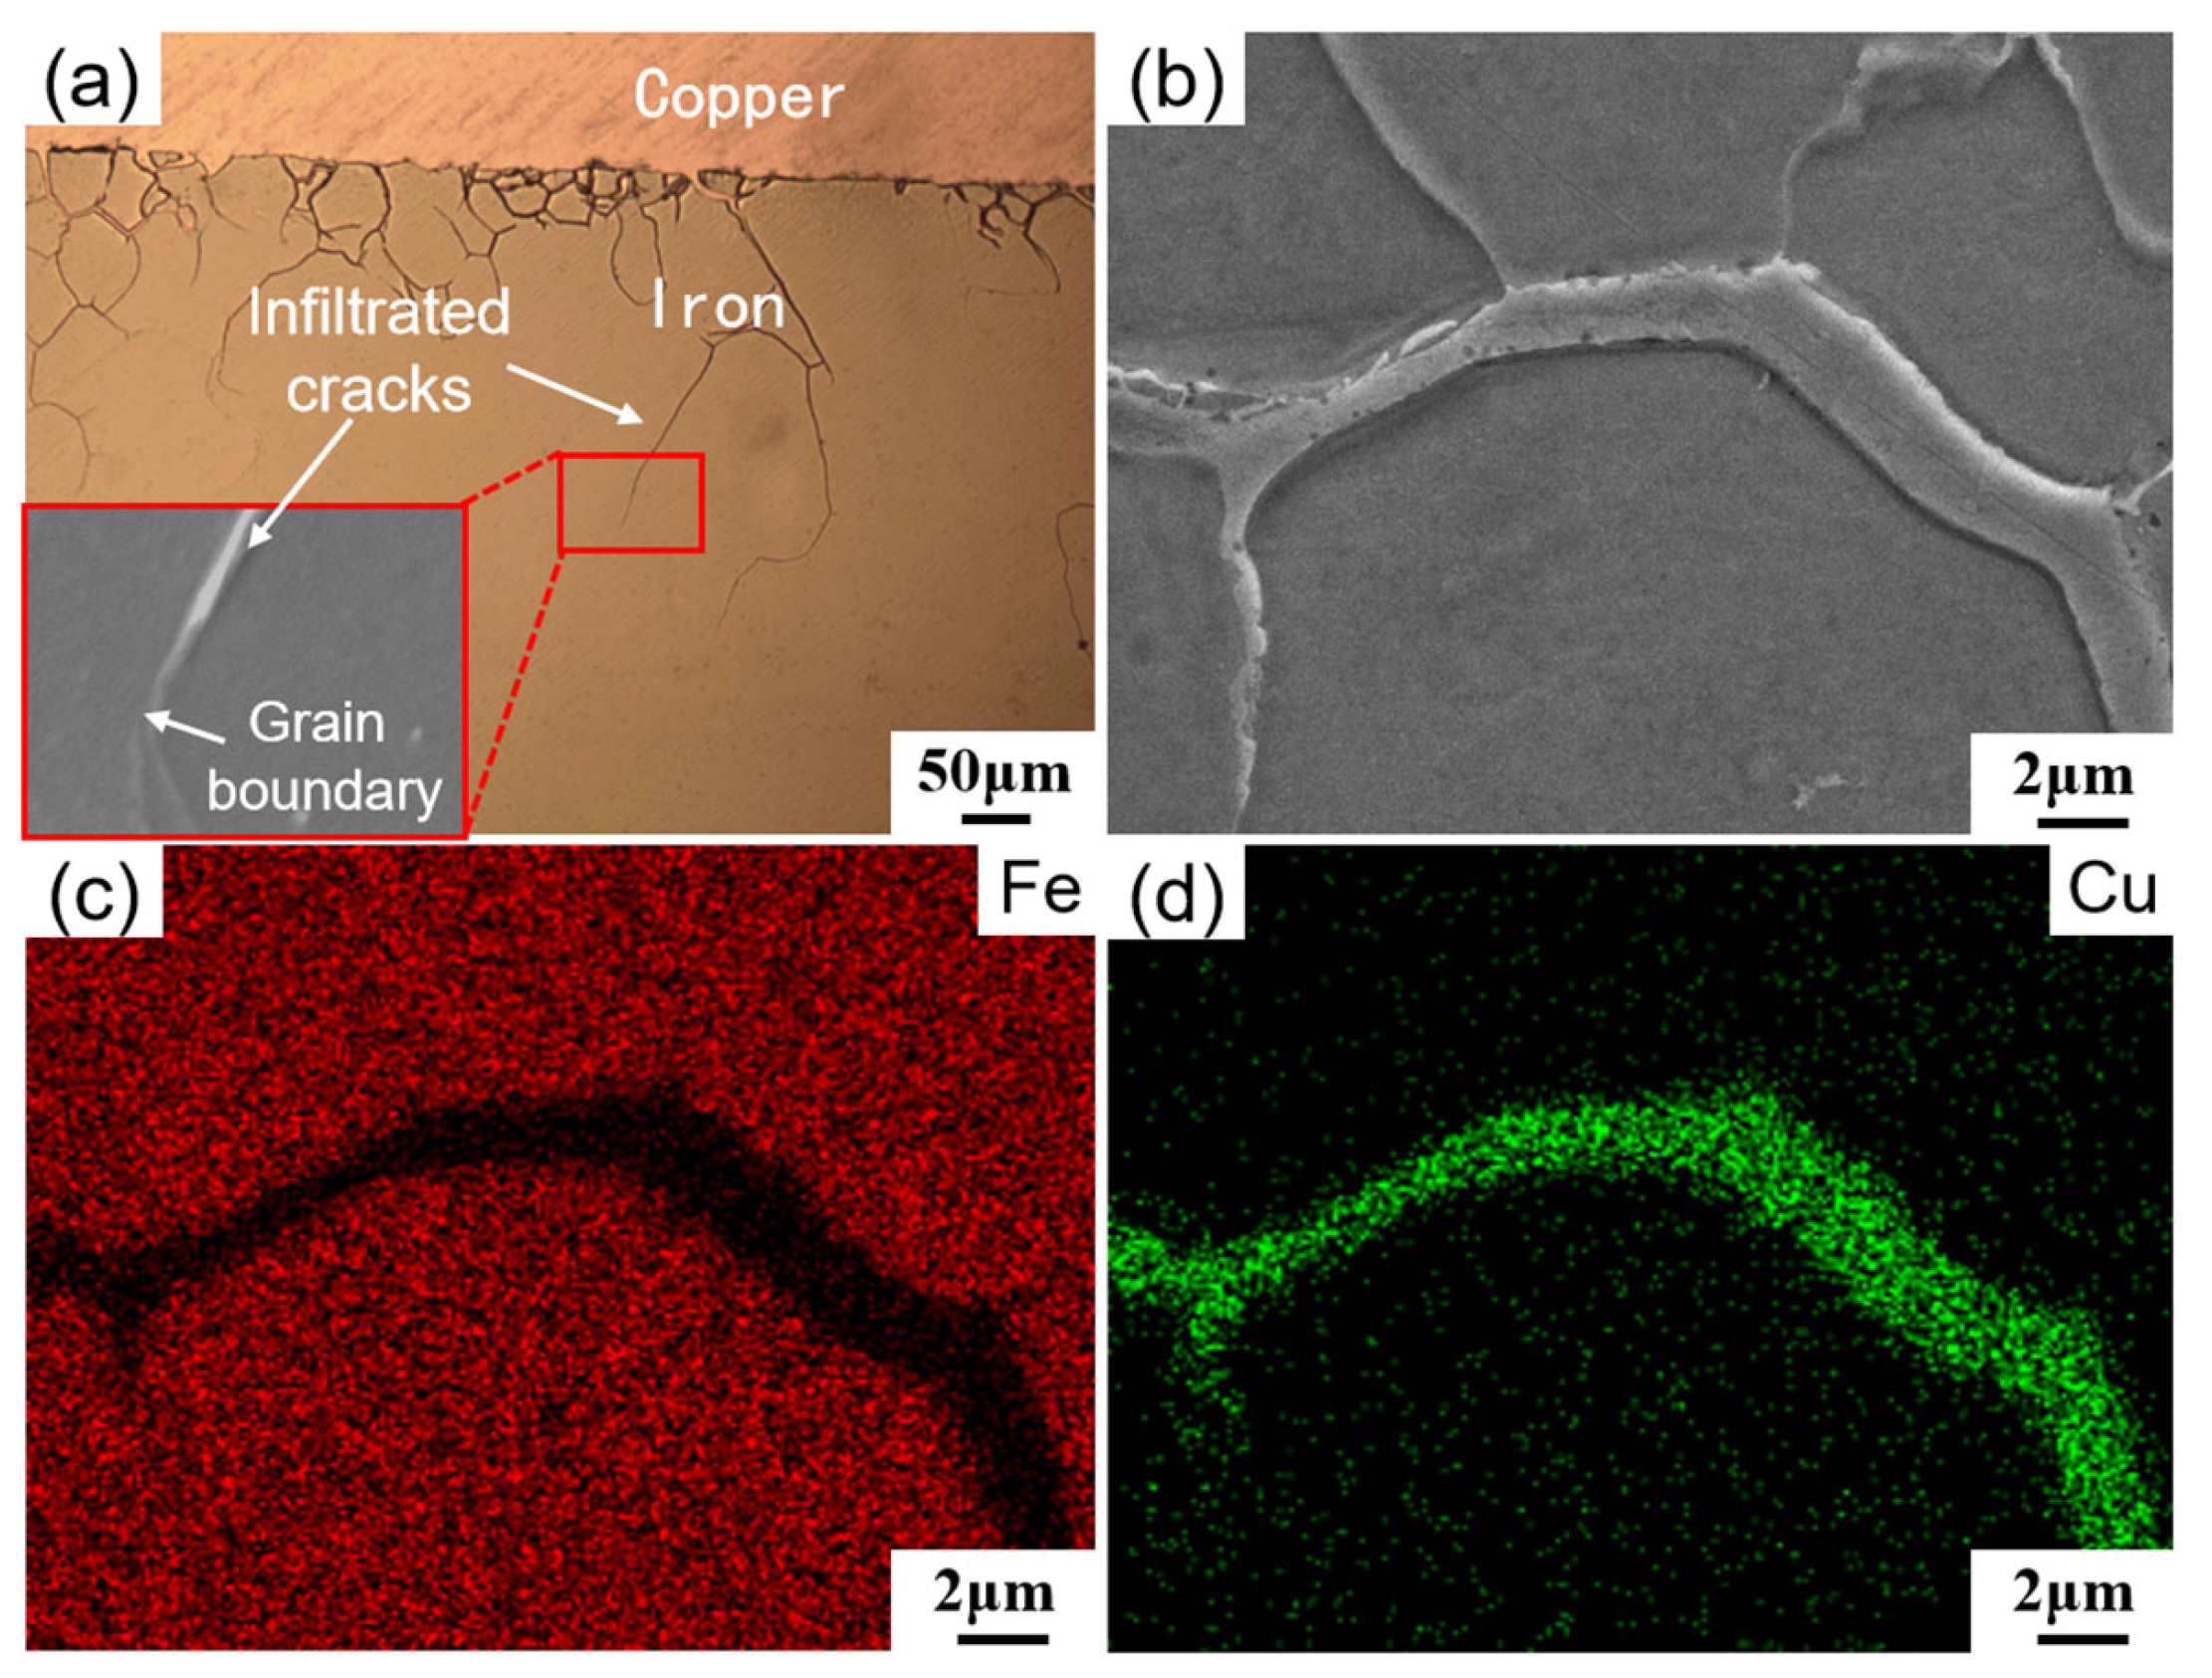
After arc welding, infiltrated cracks were observed on the iron substrate, with their morphology presented in Figure 2a. These cracks originated at the copper/iron interface and propagated along the grain boundaries. Micro-area composition analysis (as shown in Figure 2b–d) revealed that the dominant element within the infiltrated cracks was copper. The depth of intergranular infiltrated cracks at the weld center was greater than that at the weld edge. The depth of each crack was measured on a polished cross-section of the plate in the scanning electron microscope, from the copper/iron interface to the crack tip along the grain boundary. Eleven infiltrated cracks were counted on one cross-section, and all of them were between 20 and 100 µm deep, seven between 20 and 50 µm, and four between 50 and 100 µm. These depths are four orders of magnitude larger than the diffusion distances obtained in the molecular dynamics simulations, which is the point taken up in Section 3.4.
Figure 2.
Copper/iron infiltrated cracks: (a) morphology; (b–d) element map distribution.
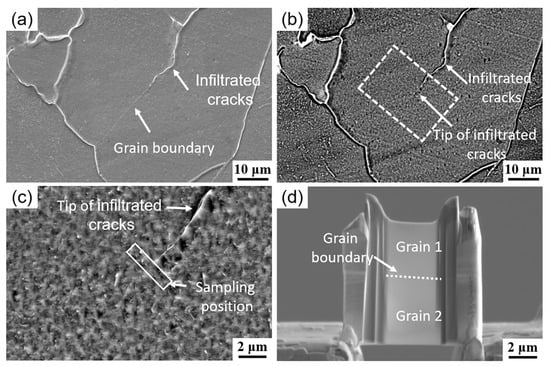
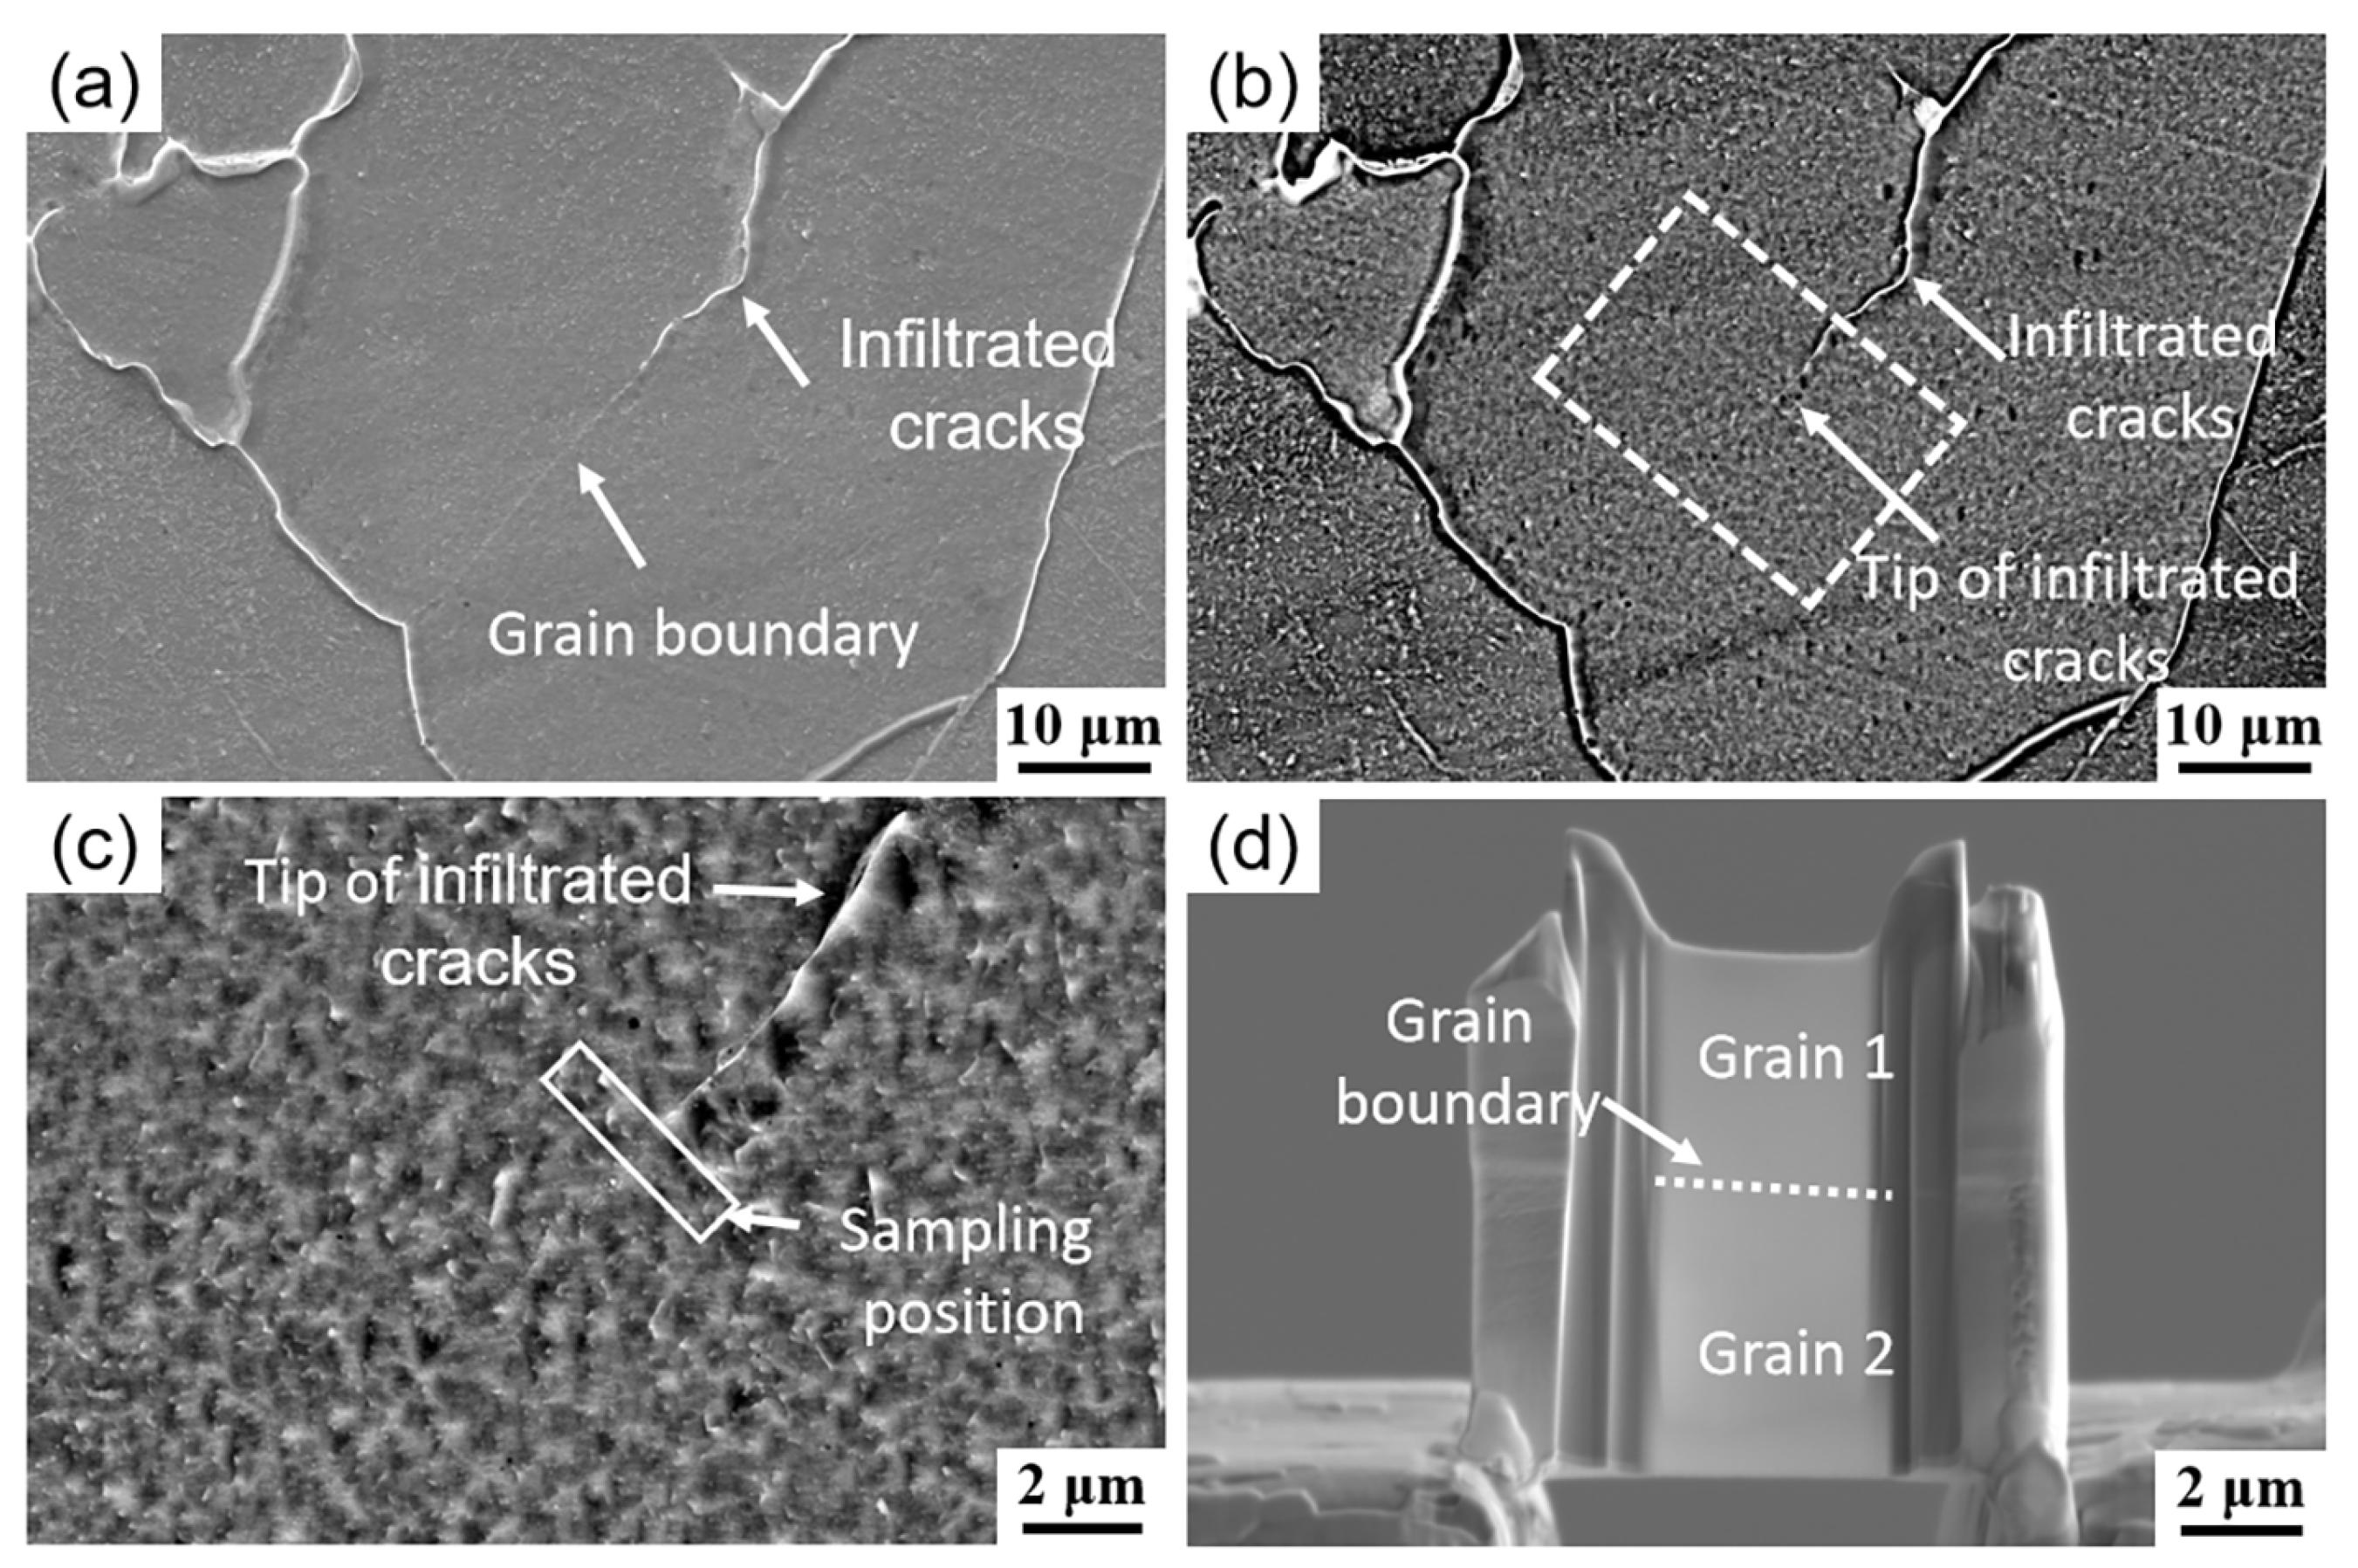
Microscopic examination of the tip region of the infiltrated crack is critical for investigating its formation mechanism. However, due to the small size of the crack tip and its close proximity to grain boundaries, accurate identification can be challenging. In this study, both secondary electron images and backscattered electron images were acquired from the infiltrated crack area to precisely locate the crack tip (Figure 3a,b). Since Cu possesses a higher atomic number than Fe in the iron matrix, the infiltrated crack exhibits brighter contrast in the backscattered-electron (BSE) image. This contrast enables clear identification of the crack tip, which is confined within the box in Figure 3c. The specific sampling position and the prepared focused-ion-beam (FIB) sample are shown in Figure 3c,d, respectively.
Figure 3.
Sampling position: (a) secondary electron image; (b) back-scattered electron image; (c) sampling position; (d) removed sample.
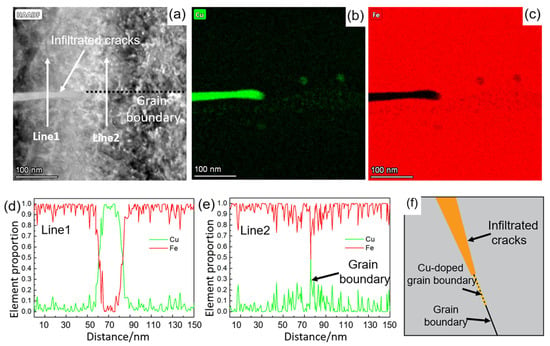
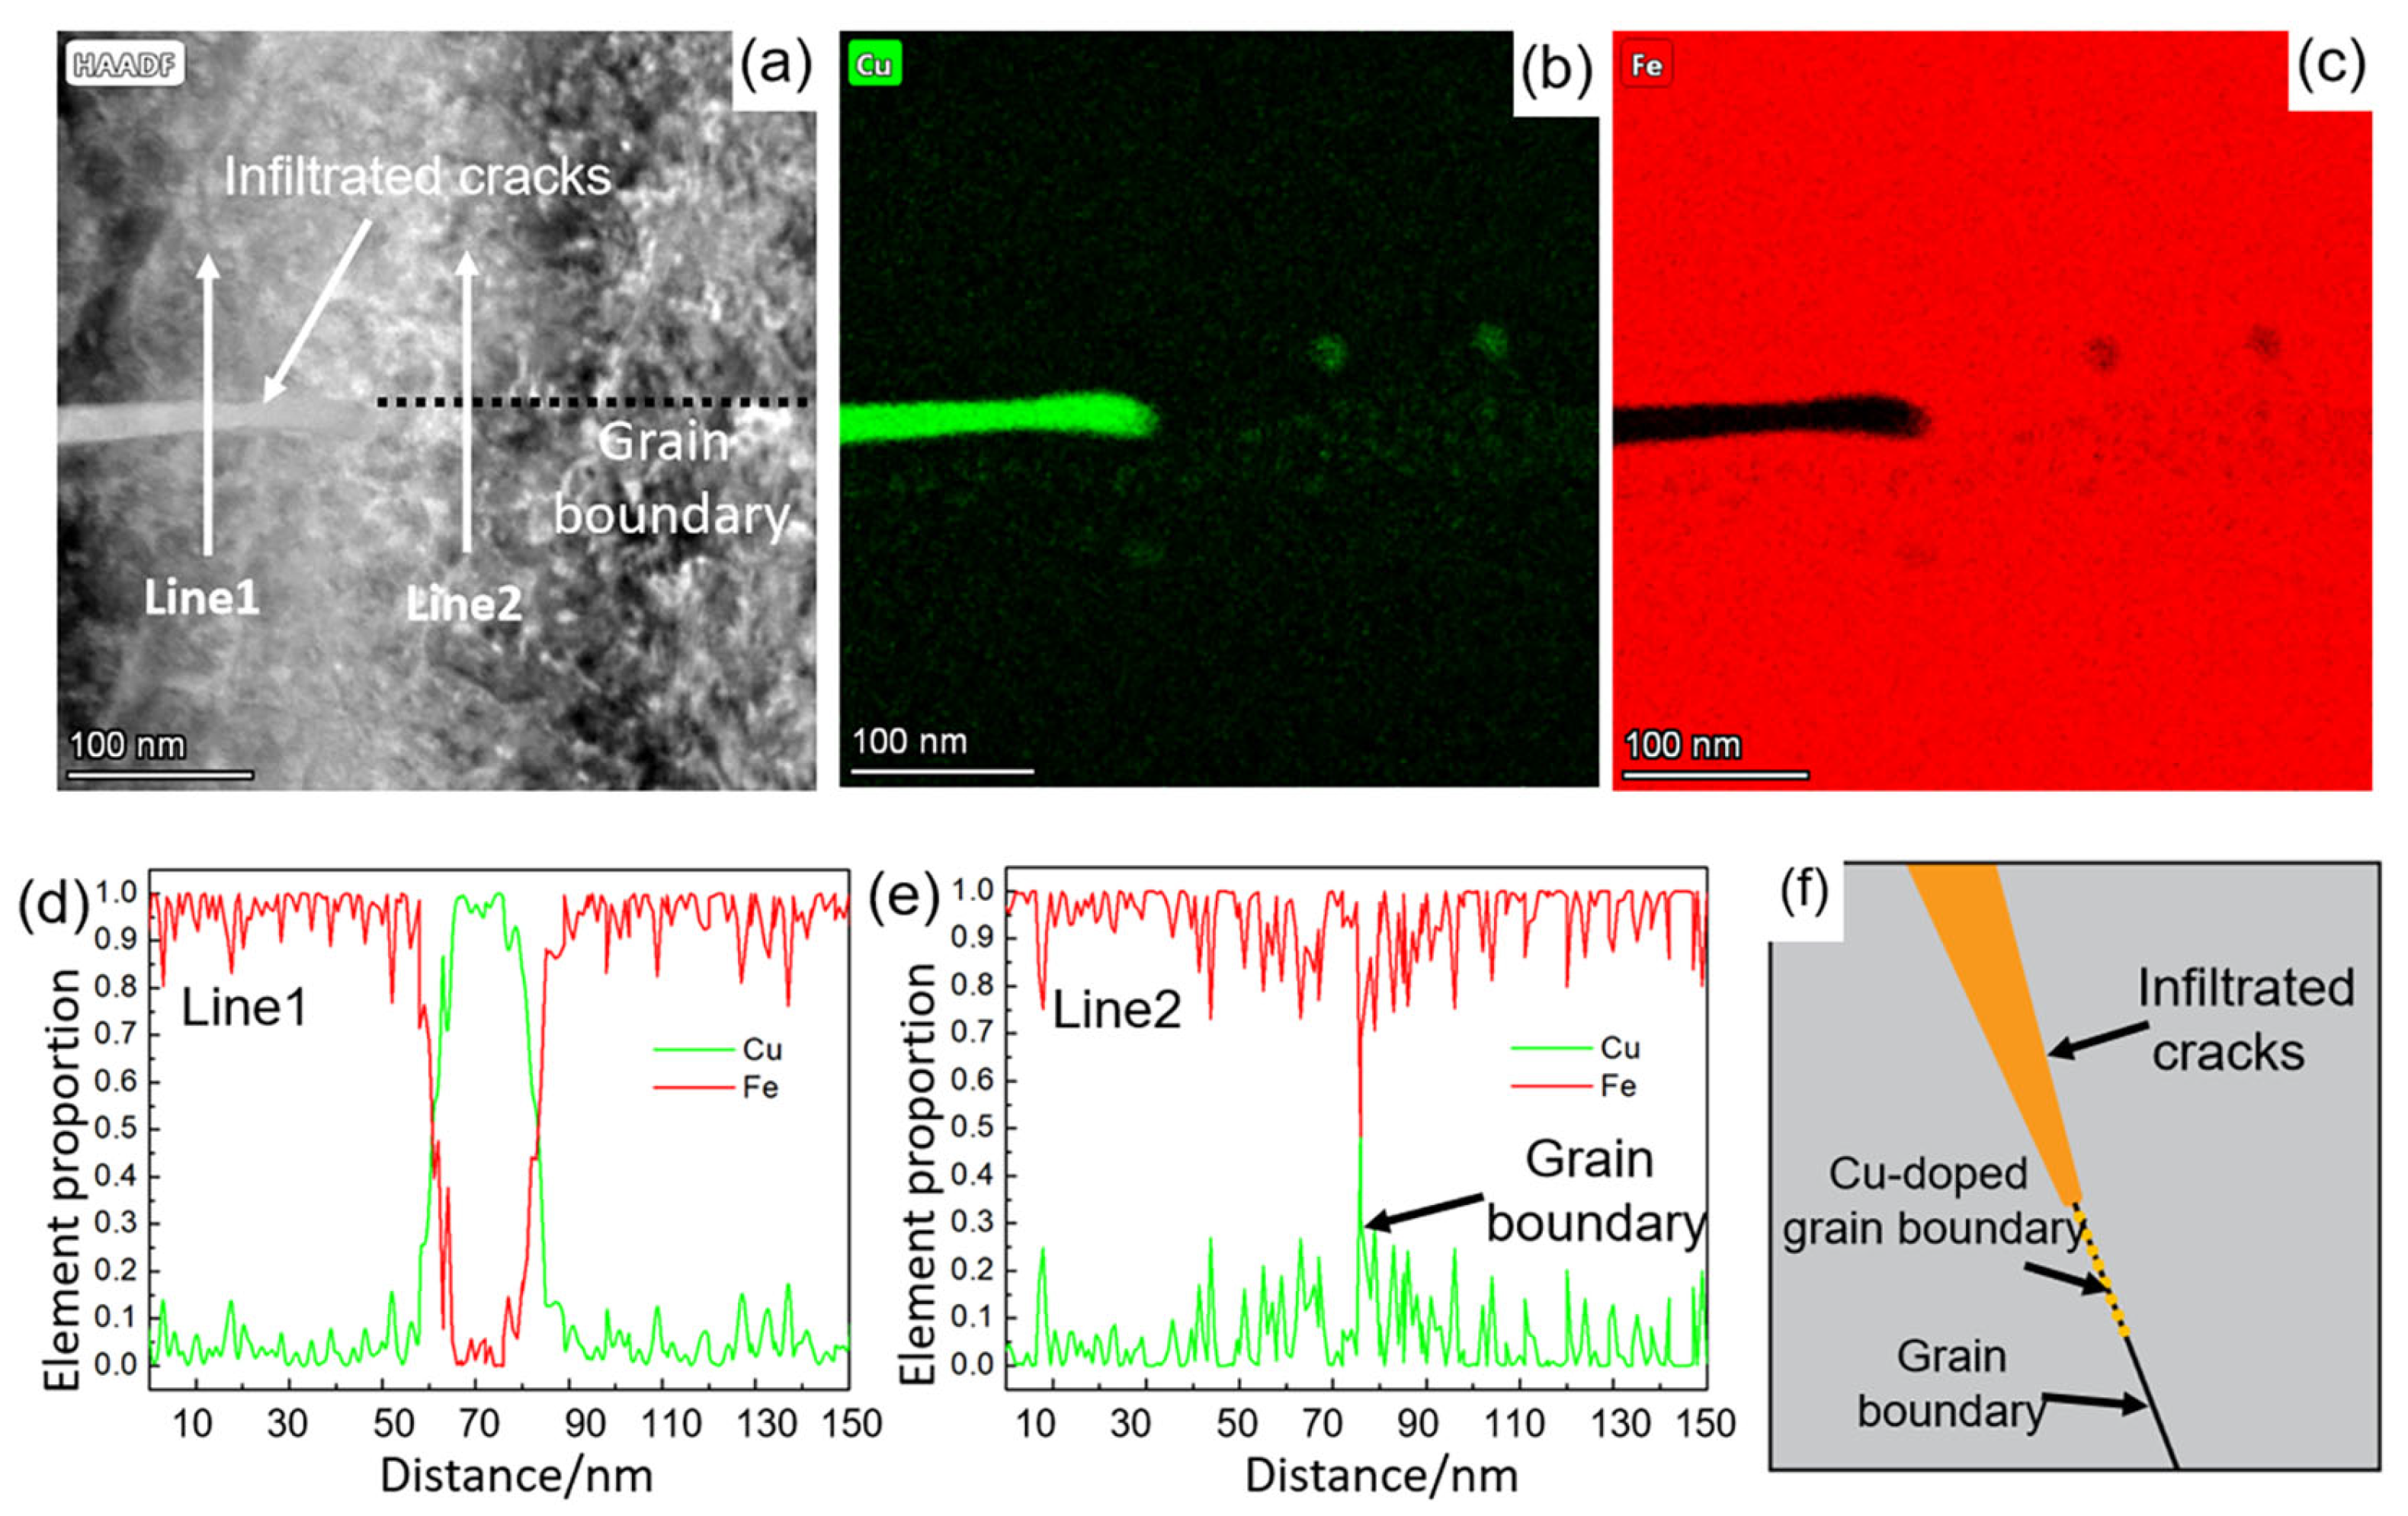
The morphology of the infiltrated crack tip observed by transmission electron microscopy (TEM) is shown in Figure 4a. The width of the crack tip is approximately 20 nm. Elemental mapping and line-scan profiles (Figure 4b–d) indicate that the primary composition of the crack tip region is Cu, with a minor amount of Fe also present. Line-scan analysis of the grain boundary ahead of the crack tip (Figure 4e) reveals a clear enrichment of Cu along this grain boundary. Based on these findings, the schematic representation of the crack tip region is illustrated in Figure 4f. This region consists of the infiltrated crack, Cu-enriched grain boundaries, and unaffected grains, a structure consistent with intergranular infiltration behavior reported in Bi–Cu and Bi–Ni systems [10]. The coexistence of Cu and Fe at these grain boundaries indicates that Cu atoms diffused into the grain boundaries prior to crack initiation. This observation further confirms that intergranular diffusion of Cu atoms is a necessary precursor to the development of infiltrated cracks.
Figure 4.
Morphology and composition analysis of infiltrated crack: (a) tip of infiltrated crack; (b,c) element map distribution at the tip of infiltrated crack; (d) element line distribution for line 1; (e) element line distribution for line 2; (f) tip area of infiltrated crack.
3.2. Results of Molecular Dynamics Simulations
Microscopic characterization revealed the Cu enrichment at the grain boundaries ahead of the crack tip; however, this observation was static and unable to capture the dynamic behavior of Cu atom diffusion along grain boundaries of Fe. To overcome this limitation, the present study employed molecular dynamics (MD) simulations to investigate the diffusion mechanism of Cu atoms at Fe grain boundaries. The detailed modeling and simulation parameters are illustrated in Figure 1, which adopts a widely used grain boundary model for face-centered cubic (FCC) metals in computational materials science.
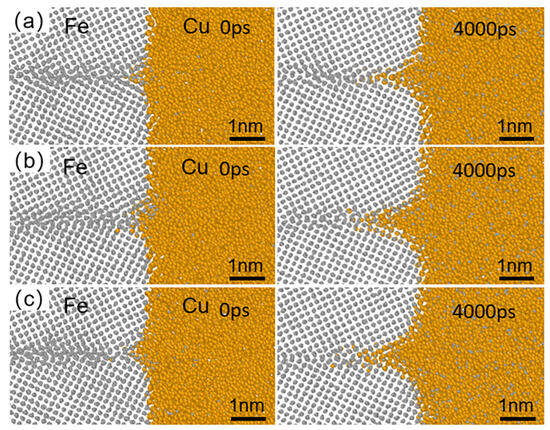
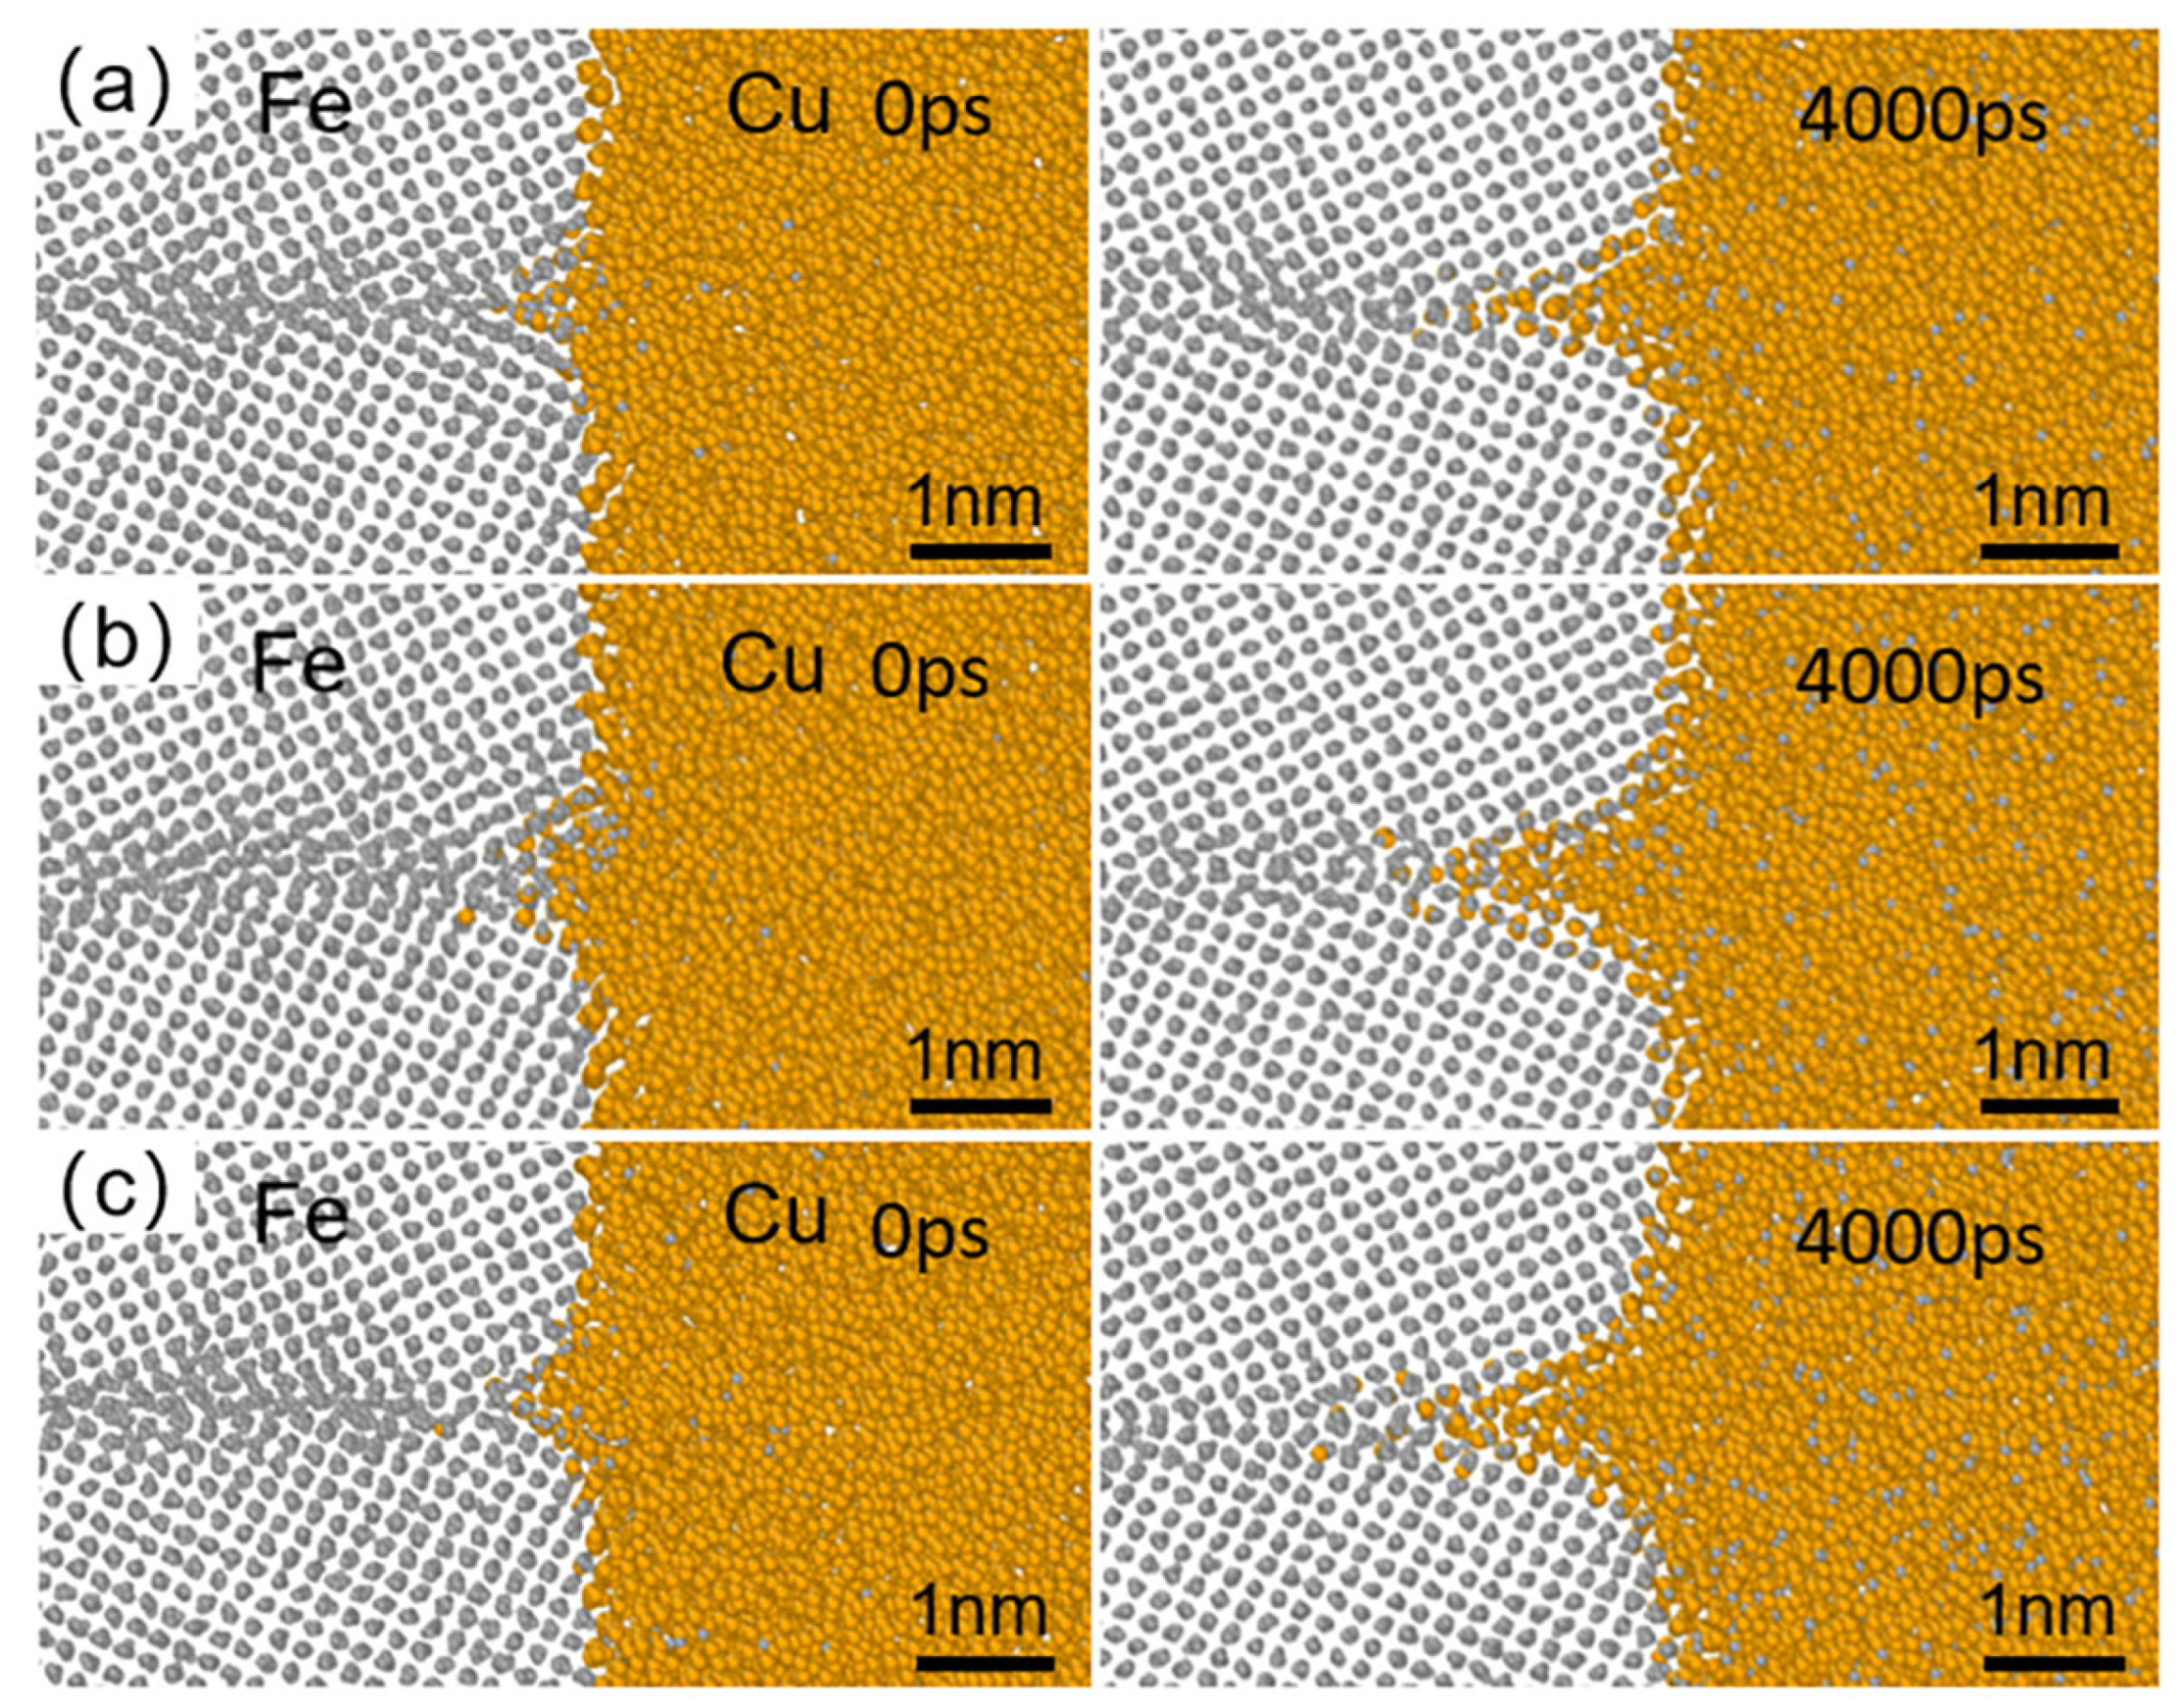
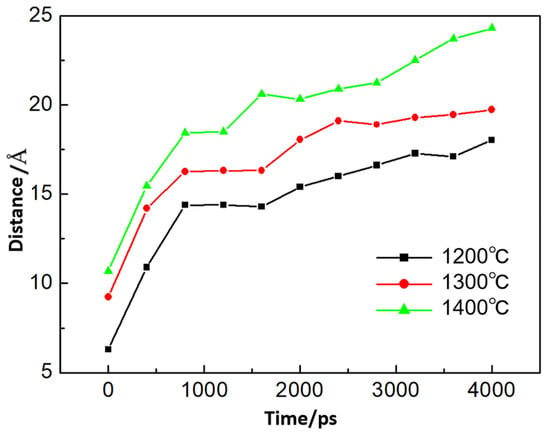
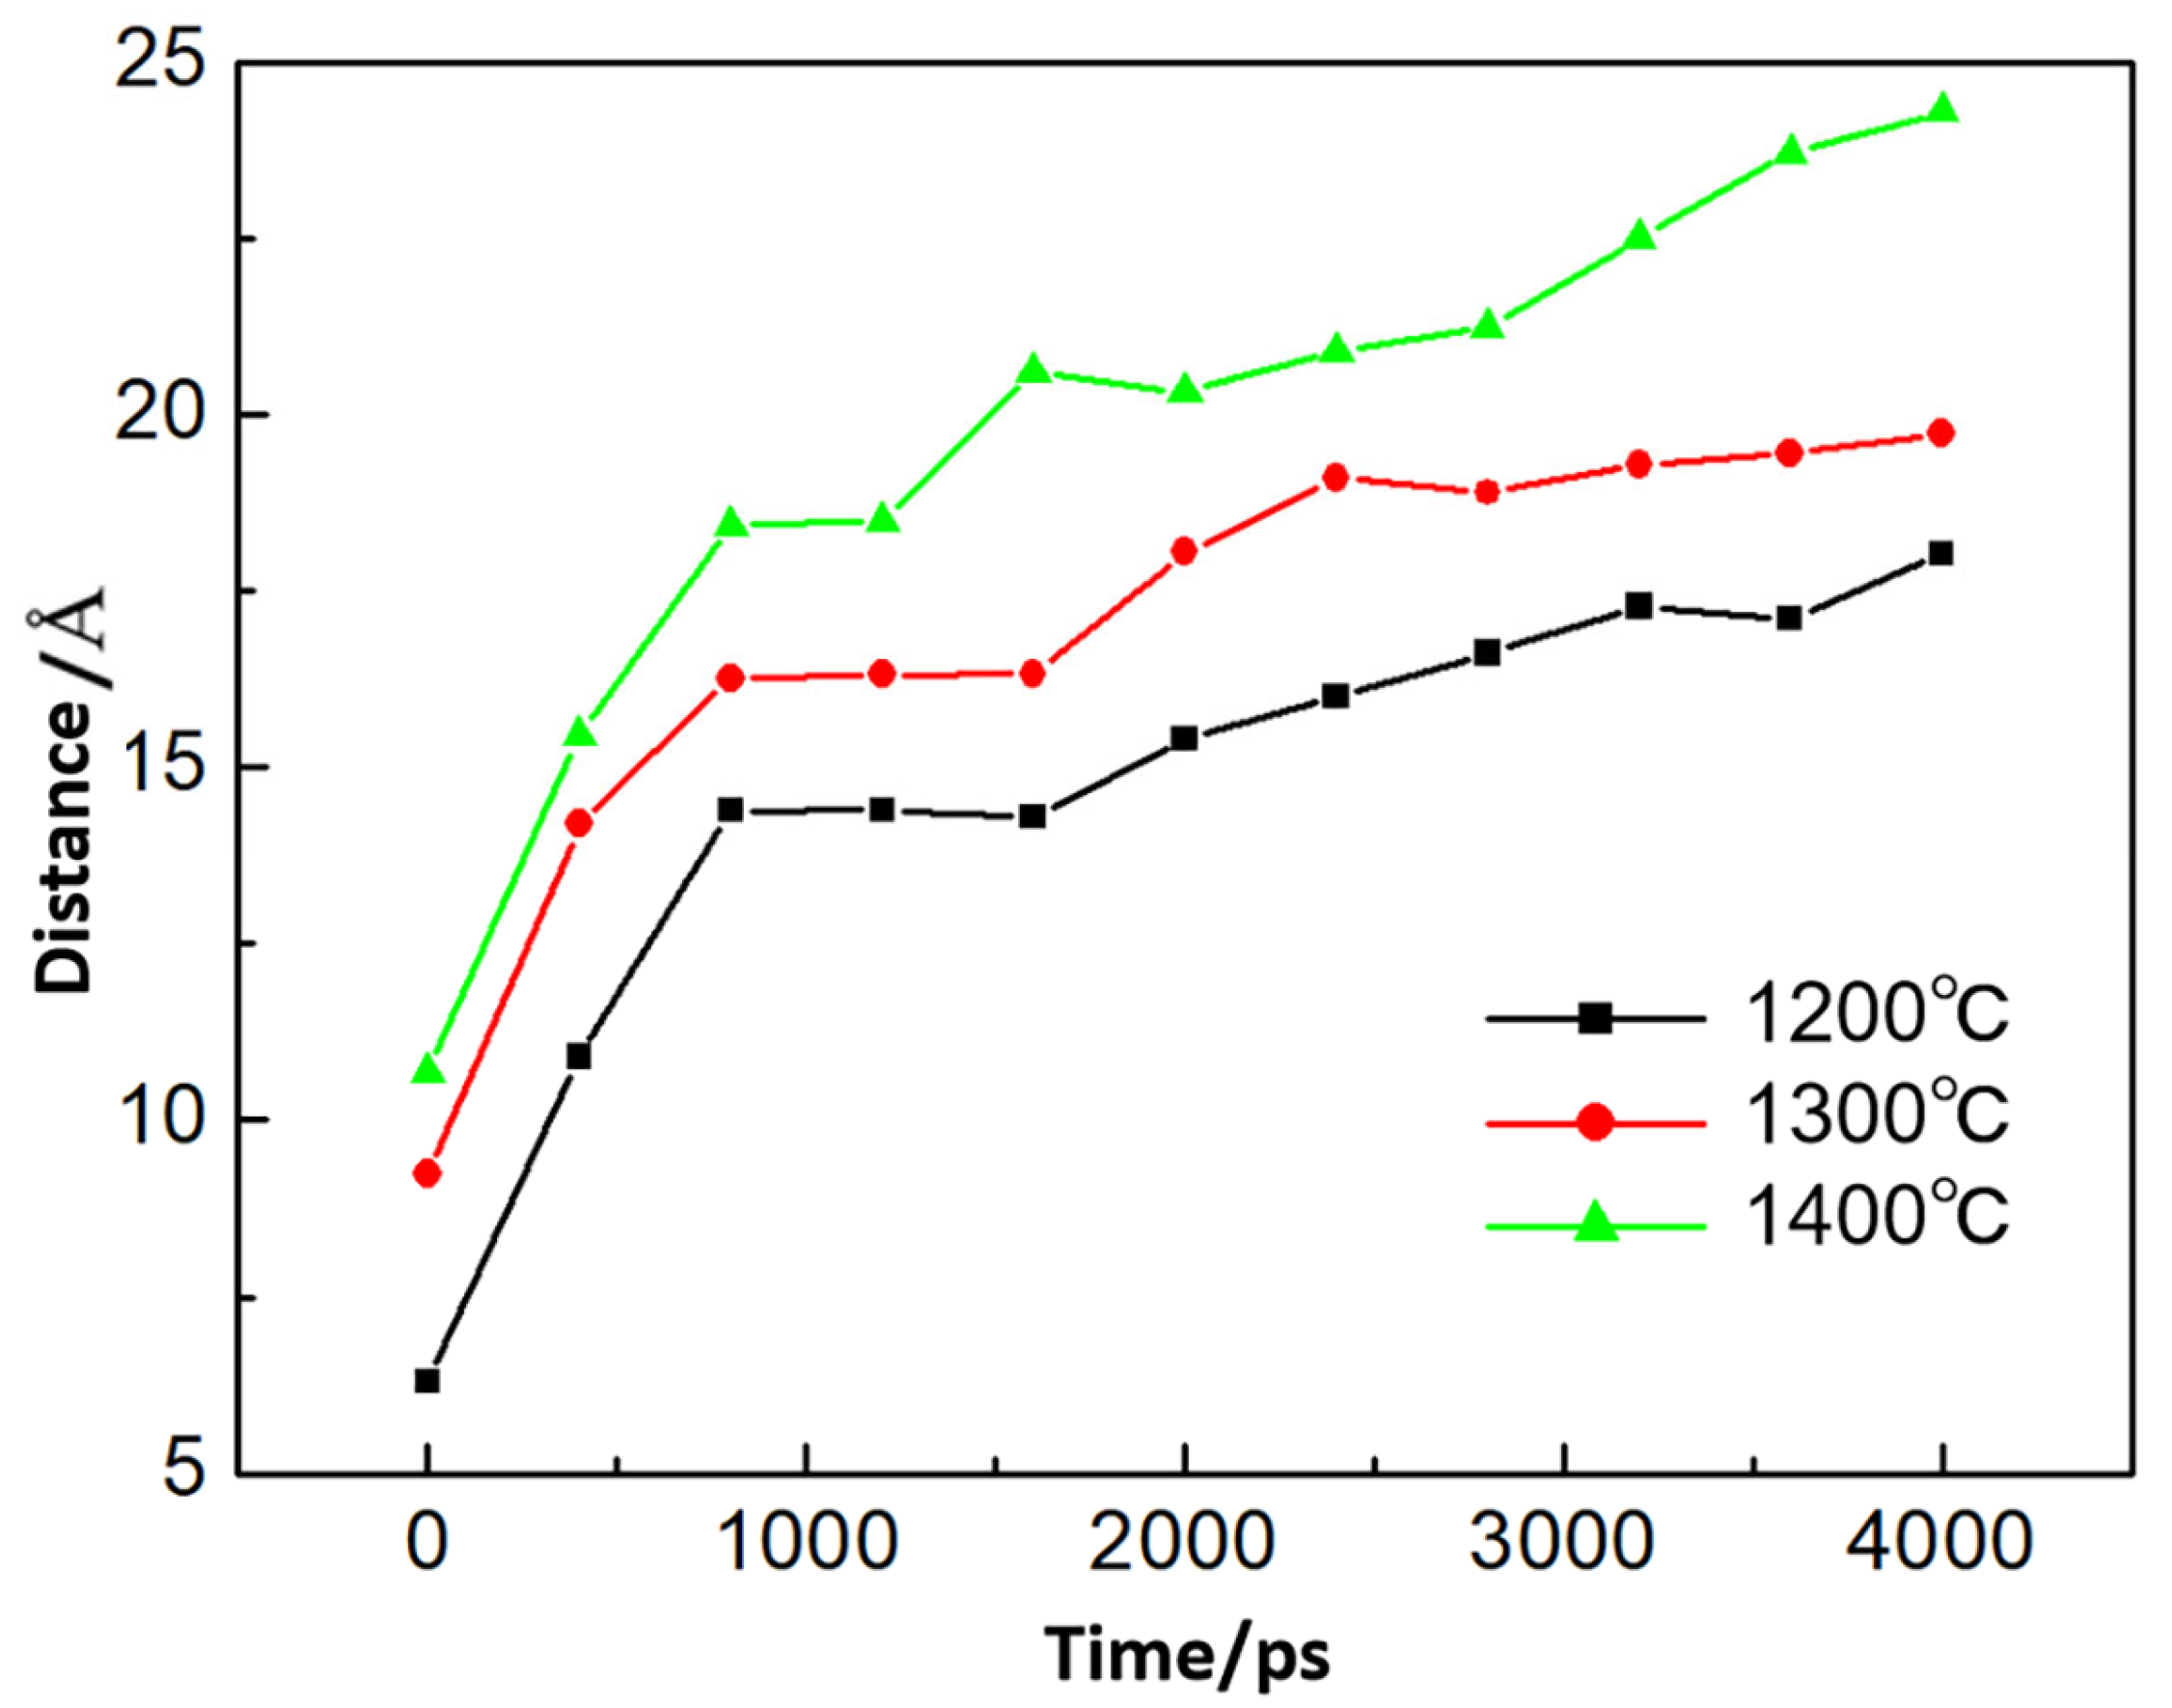
During welding, copper melts while the Fe substrate remains unmelted. Accordingly, the simulation temperature was set in the range of 1200–1400 °C. Pure iron is face-centered cubic between 912 °C and 1394 °C and body-centered cubic above the latter temperature, where it exists as δ-Fe, so the 1400 °C run lies just above the γ/δ boundary. The iron lattice was nevertheless kept face-centered cubic in all runs, for two reasons: the structure of interest is the one in contact with liquid copper, which is austenitic at the interface, and the first-principles calculations of Section 3.3 were carried out on the same FCC grain boundary. The 1400 °C run was therefore used as the upper end of the temperature trend rather than as a representation of δ-Fe. The simulation results are presented in Figure 5. At 1200 °C, Cu existed in the liquid state and exhibited a disordered atomic arrangement, while Fe remained solid, with Fe atoms vibrating around their equilibrium positions. Notably, vibrations were more pronounced near the grain boundaries (Figure 5a). Under these conditions, Cu atoms preferentially diffuse to grain boundaries, with minimal penetration inside grains. At temperatures of 1300–1400 °C, the diffusion degree of Cu atoms along grain boundaries increased substantially (Figure 5b,c). Quantitative analysis of the diffusion distances of Cu atoms at Fe grain boundaries under varying temperatures and time intervals is provided in Figure 6. At the same temperature, the diffusion distance of Cu atoms increases with prolonged holding time. Under the same diffusion holding time, the diffusion distance of Cu atoms along Fe grain boundaries rises as temperature increases. The same ordering is found in the experiment: the infiltrated cracks are deeper at the weld center, where the temperature is higher, than at the weld edge (Section 3.1). The agreement is one of trend rather than of absolute length, because the simulations cover a few nanoseconds, whereas the thermal cycle of a pass lasts a few seconds; how the two time scales are related is set out in Section 3.4. These MD simulation results demonstrate that upon contact between liquid Cu and solid Fe, Cu atoms preferentially migrate along grain boundaries. However, the influence of Cu atoms on the structural and mechanical properties of grain boundaries requires further investigation through first-principles calculations.
Figure 5.
The diffusion of Cu atoms in the Fe grain boundary at different temperatures and times: (a) 1200 °C; (b) 1300 °C; (c) 1400 °C.
Figure 6.
Diffusion distance of Cu atom in the Fe grain boundary at different temperatures and times.
3.3. Results of First-Principles Calculations
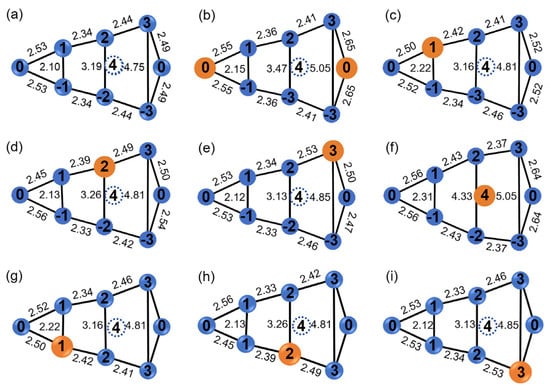
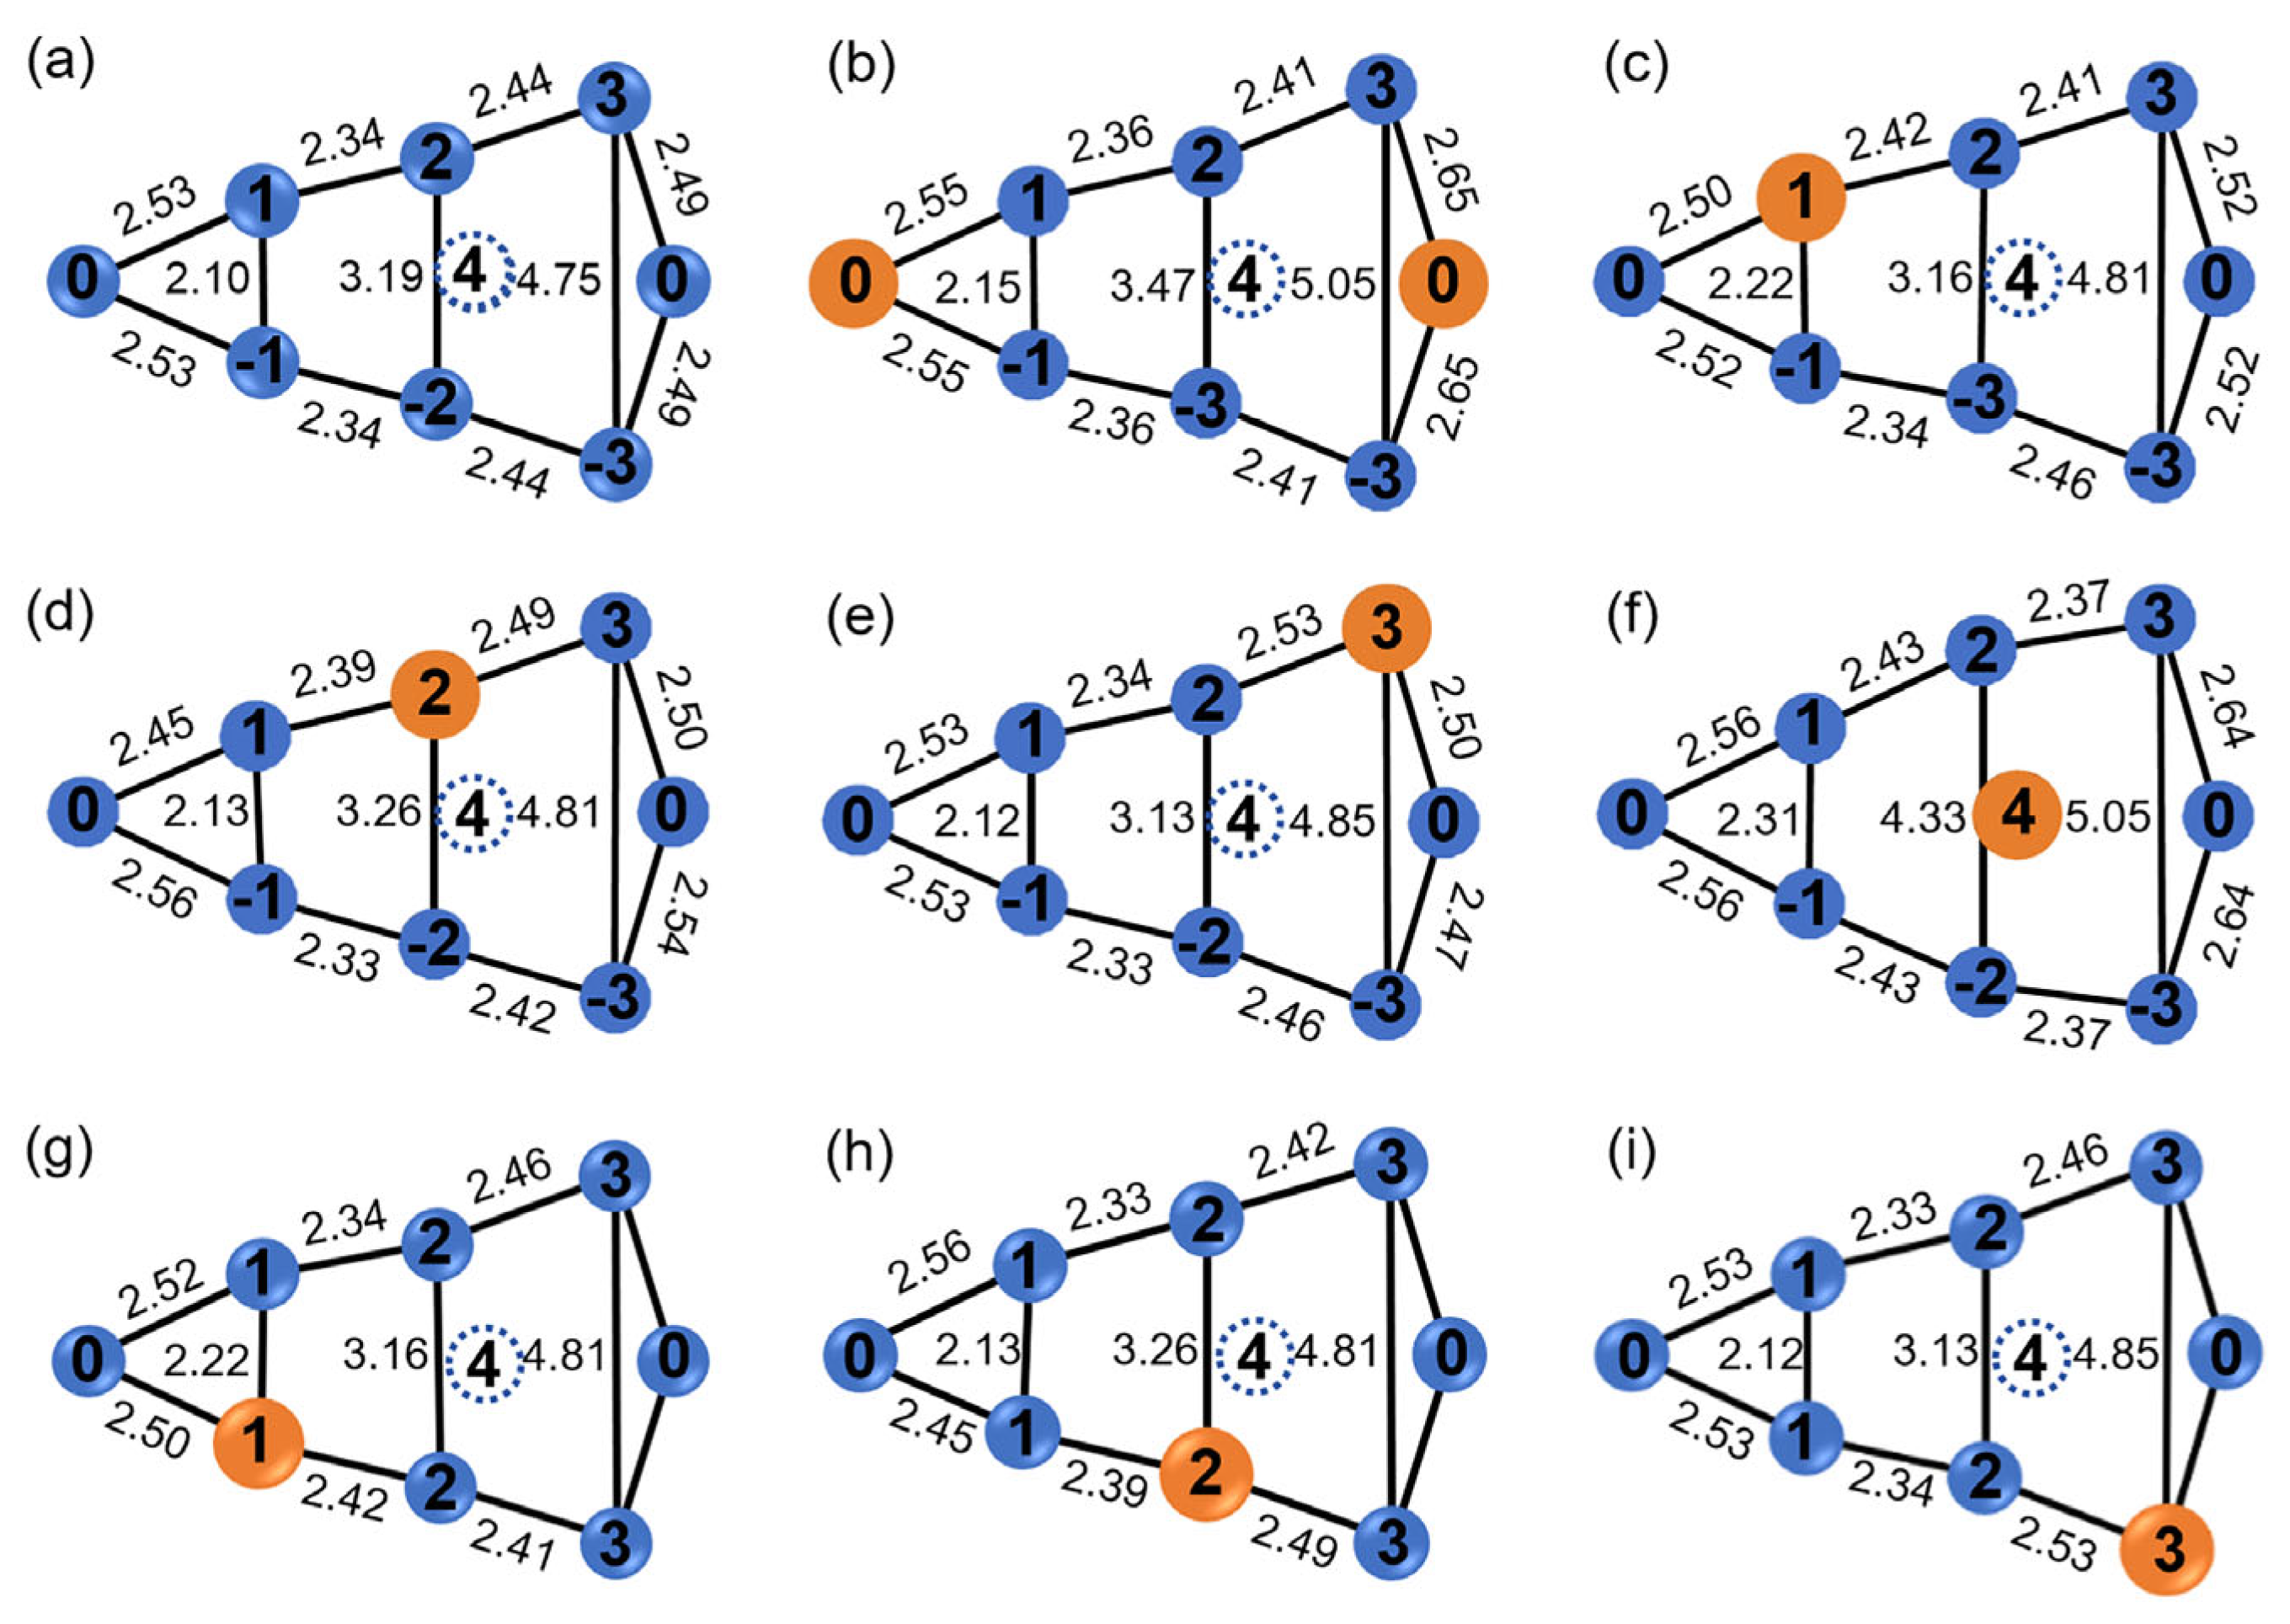
In this study, an FCC-Fe Σ5 (012) [1 0 0] coincidence site lattice (CSL) grain boundary model was constructed, as illustrated in Figure 1. The blue and green spheres represent Fe atoms located on different crystallographic planes. Eight distinct sites are available for Cu-atom placement within the grain-boundary region (Figure 7), in which orange spheres represent Cu atoms. Sites 0, 1, 2, and 3, together with their symmetric counterparts −1, −2, and −3, are substitutional positions, while site 4 corresponds to an interstitial site. Due to the spatial periodicity of the grain-boundary structure, the two atoms labeled site 0 are symmetry-equivalent and therefore correspond to one unique site. Occupation of different sites by Cu atoms alters interatomic bond lengths within the grain boundary, giving rise to different magnitudes of vertical expansion (measured between atoms at sites 3 and −3). Notably, substantial grain-boundary expansion takes place when Cu atoms occupy interstitial sites.
Figure 7.
Different positions of Cu atoms and changes of bond length in grain boundaries (unit: Å): (a) initial Fe grain boundaries; (b) position 0; (c) position 1; (d) position 2; (e) position 3; (f) position 4; (g) site −1; (h) site −2; (i) site −3.
The binding energy () of Cu atoms characterizes their stability within Fe grain boundaries. A lower binding energy corresponds to higher stability of Cu atoms. The binding energy of Cu atoms at substitutional sites is calculated via Equation (1) [33]. It should be noted that this is a binding energy defined with respect to an isolated Cu atom, and not the segregation energy of Cu, which is defined with respect to Cu dissolved in the Fe bulk. For the substitutional sites, the two quantities differ by the same constant, namely the solution energy of Cu in bulk Fe, so that the ordering of the sites, and hence the identification of site 0 as the most stable one, is unaffected. All the conclusions drawn below rest on the strengthening energy of Equation (3), which contains only grain-boundary and fracture-surface energies and is therefore independent of the reference state.
where is the number of Cu atoms in the grain boundary, is the remaining number of Fe atoms in the grain boundary; denotes the number of atoms in the Fe grain boundary and Fe bulk; is the total energy of the Cu-containing system, and is the total energy of an isolated Cu atom. This energy is obtained by performing static self-consistent calculations for an isolated Cu atom placed within a 10 × 10 × 10 Å3 supercell.
For Cu atoms occupying interstitial sites, the binding energy is calculated by Equation (2):
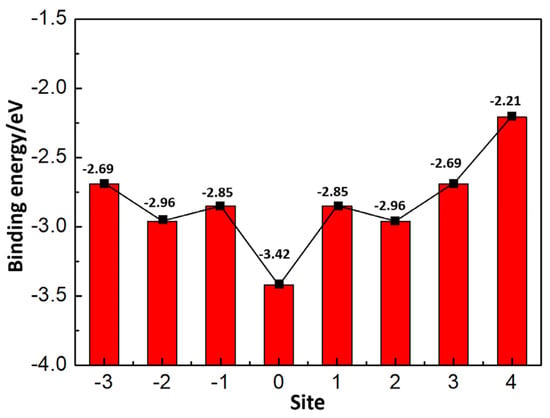
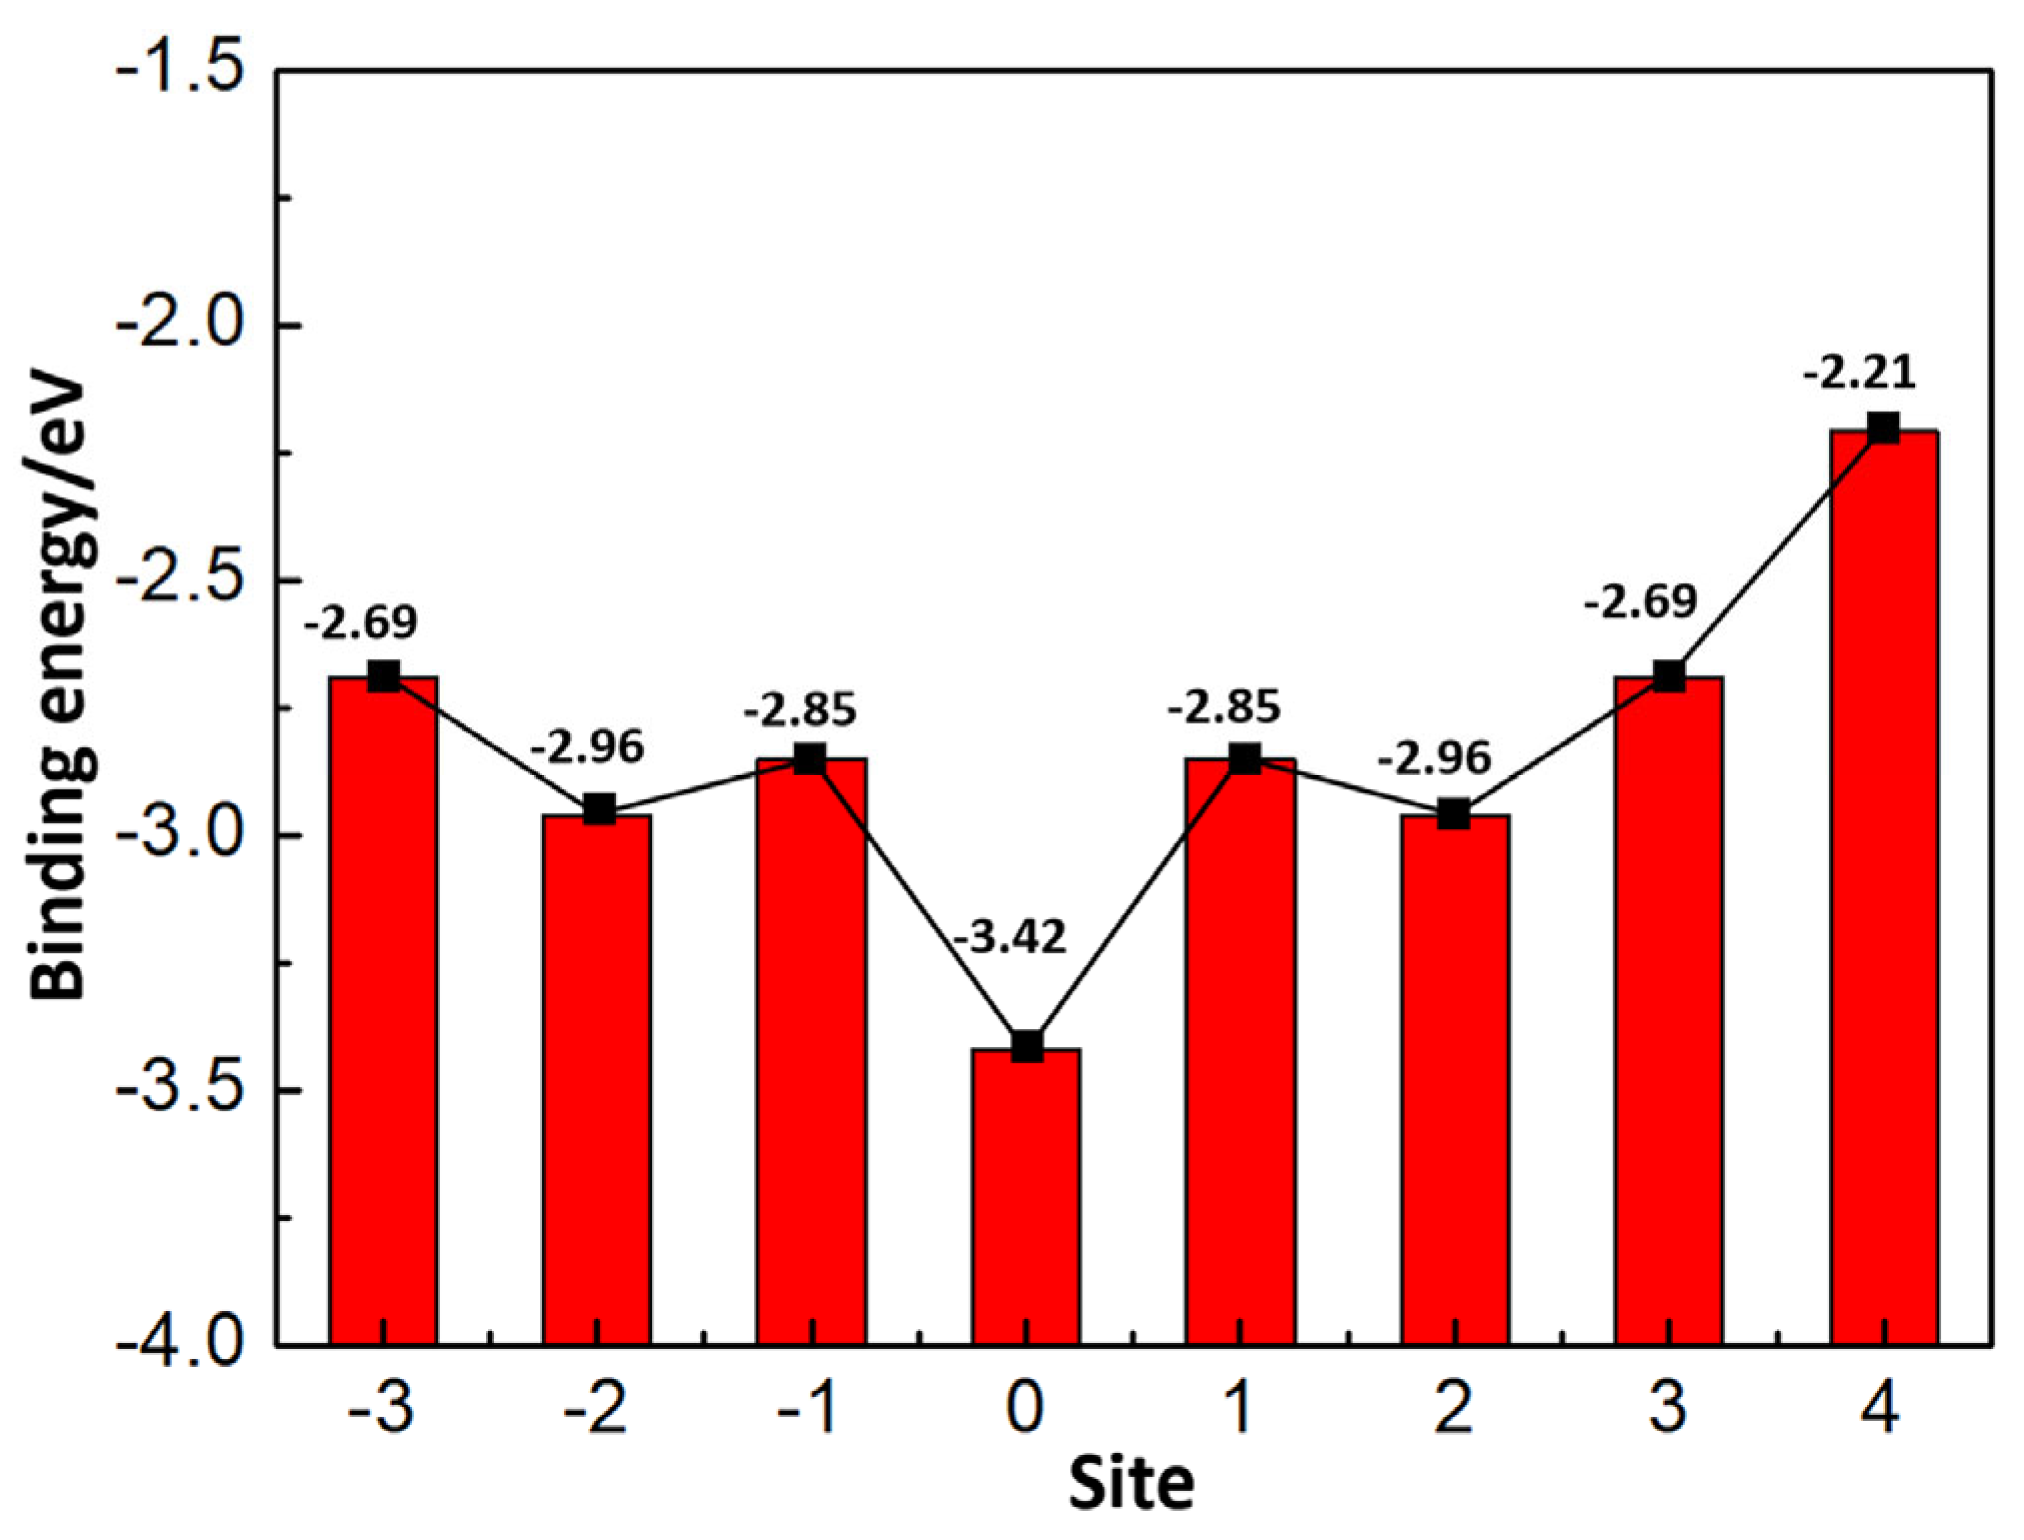
Equation (2) is similar to Equation (1), with the last term in Equation (1) removed. The binding energy values at different grain boundary sites are presented in Figure 8. The results reveal that Cu atoms exhibit the lowest binding energy at site 0, which is the most stable site, while the binding energy reaches its maximum at interstitial site 4, corresponding to the least stable configuration. Due to the structural symmetry of the grain boundary, the binding energies of Cu atoms at sites 1, 2, and 3 are identical to those at sites −1, −2, and −3, respectively.
Figure 8.
Binding energy of a Cu atom at the different grain-boundary positions, defined with respect to an isolated Cu atom.
Since site 0 is the most stable position for Cu atoms in the grain boundary, all subsequent analyses in this work are performed with Cu atoms placed here. In accordance with the Rice–Wang model for grain boundary embrittlement [34], the effect of Cu on grain boundary strength is quantified by the strengthening energy (), defined in Equation (3) [35]:
The strengthening energy is defined as the difference between the grain-boundary separation energy of pure Fe () and that of the Fe grain boundary with Cu atoms (). A negative strengthening energy corresponds to enhanced grain-boundary strength, whereas a positive value indicates weakened grain-boundary strength. The strengthening energy can be further decomposed into a mechanical contribution () and a chemical contribution () [36,37]. The mechanical contribution refers to the influence of grain-boundary structural deformation, originating from the difference in atomic radii between Cu and Fe atoms, on grain-boundary strength. The chemical contribution represents the effect of modified electronic structures, induced by the discrepancy in chemical properties between Cu and Fe atoms, on grain-boundary strength.
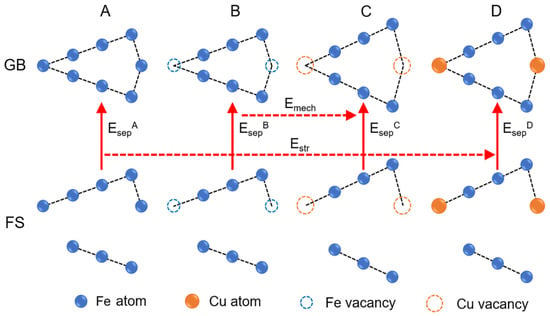
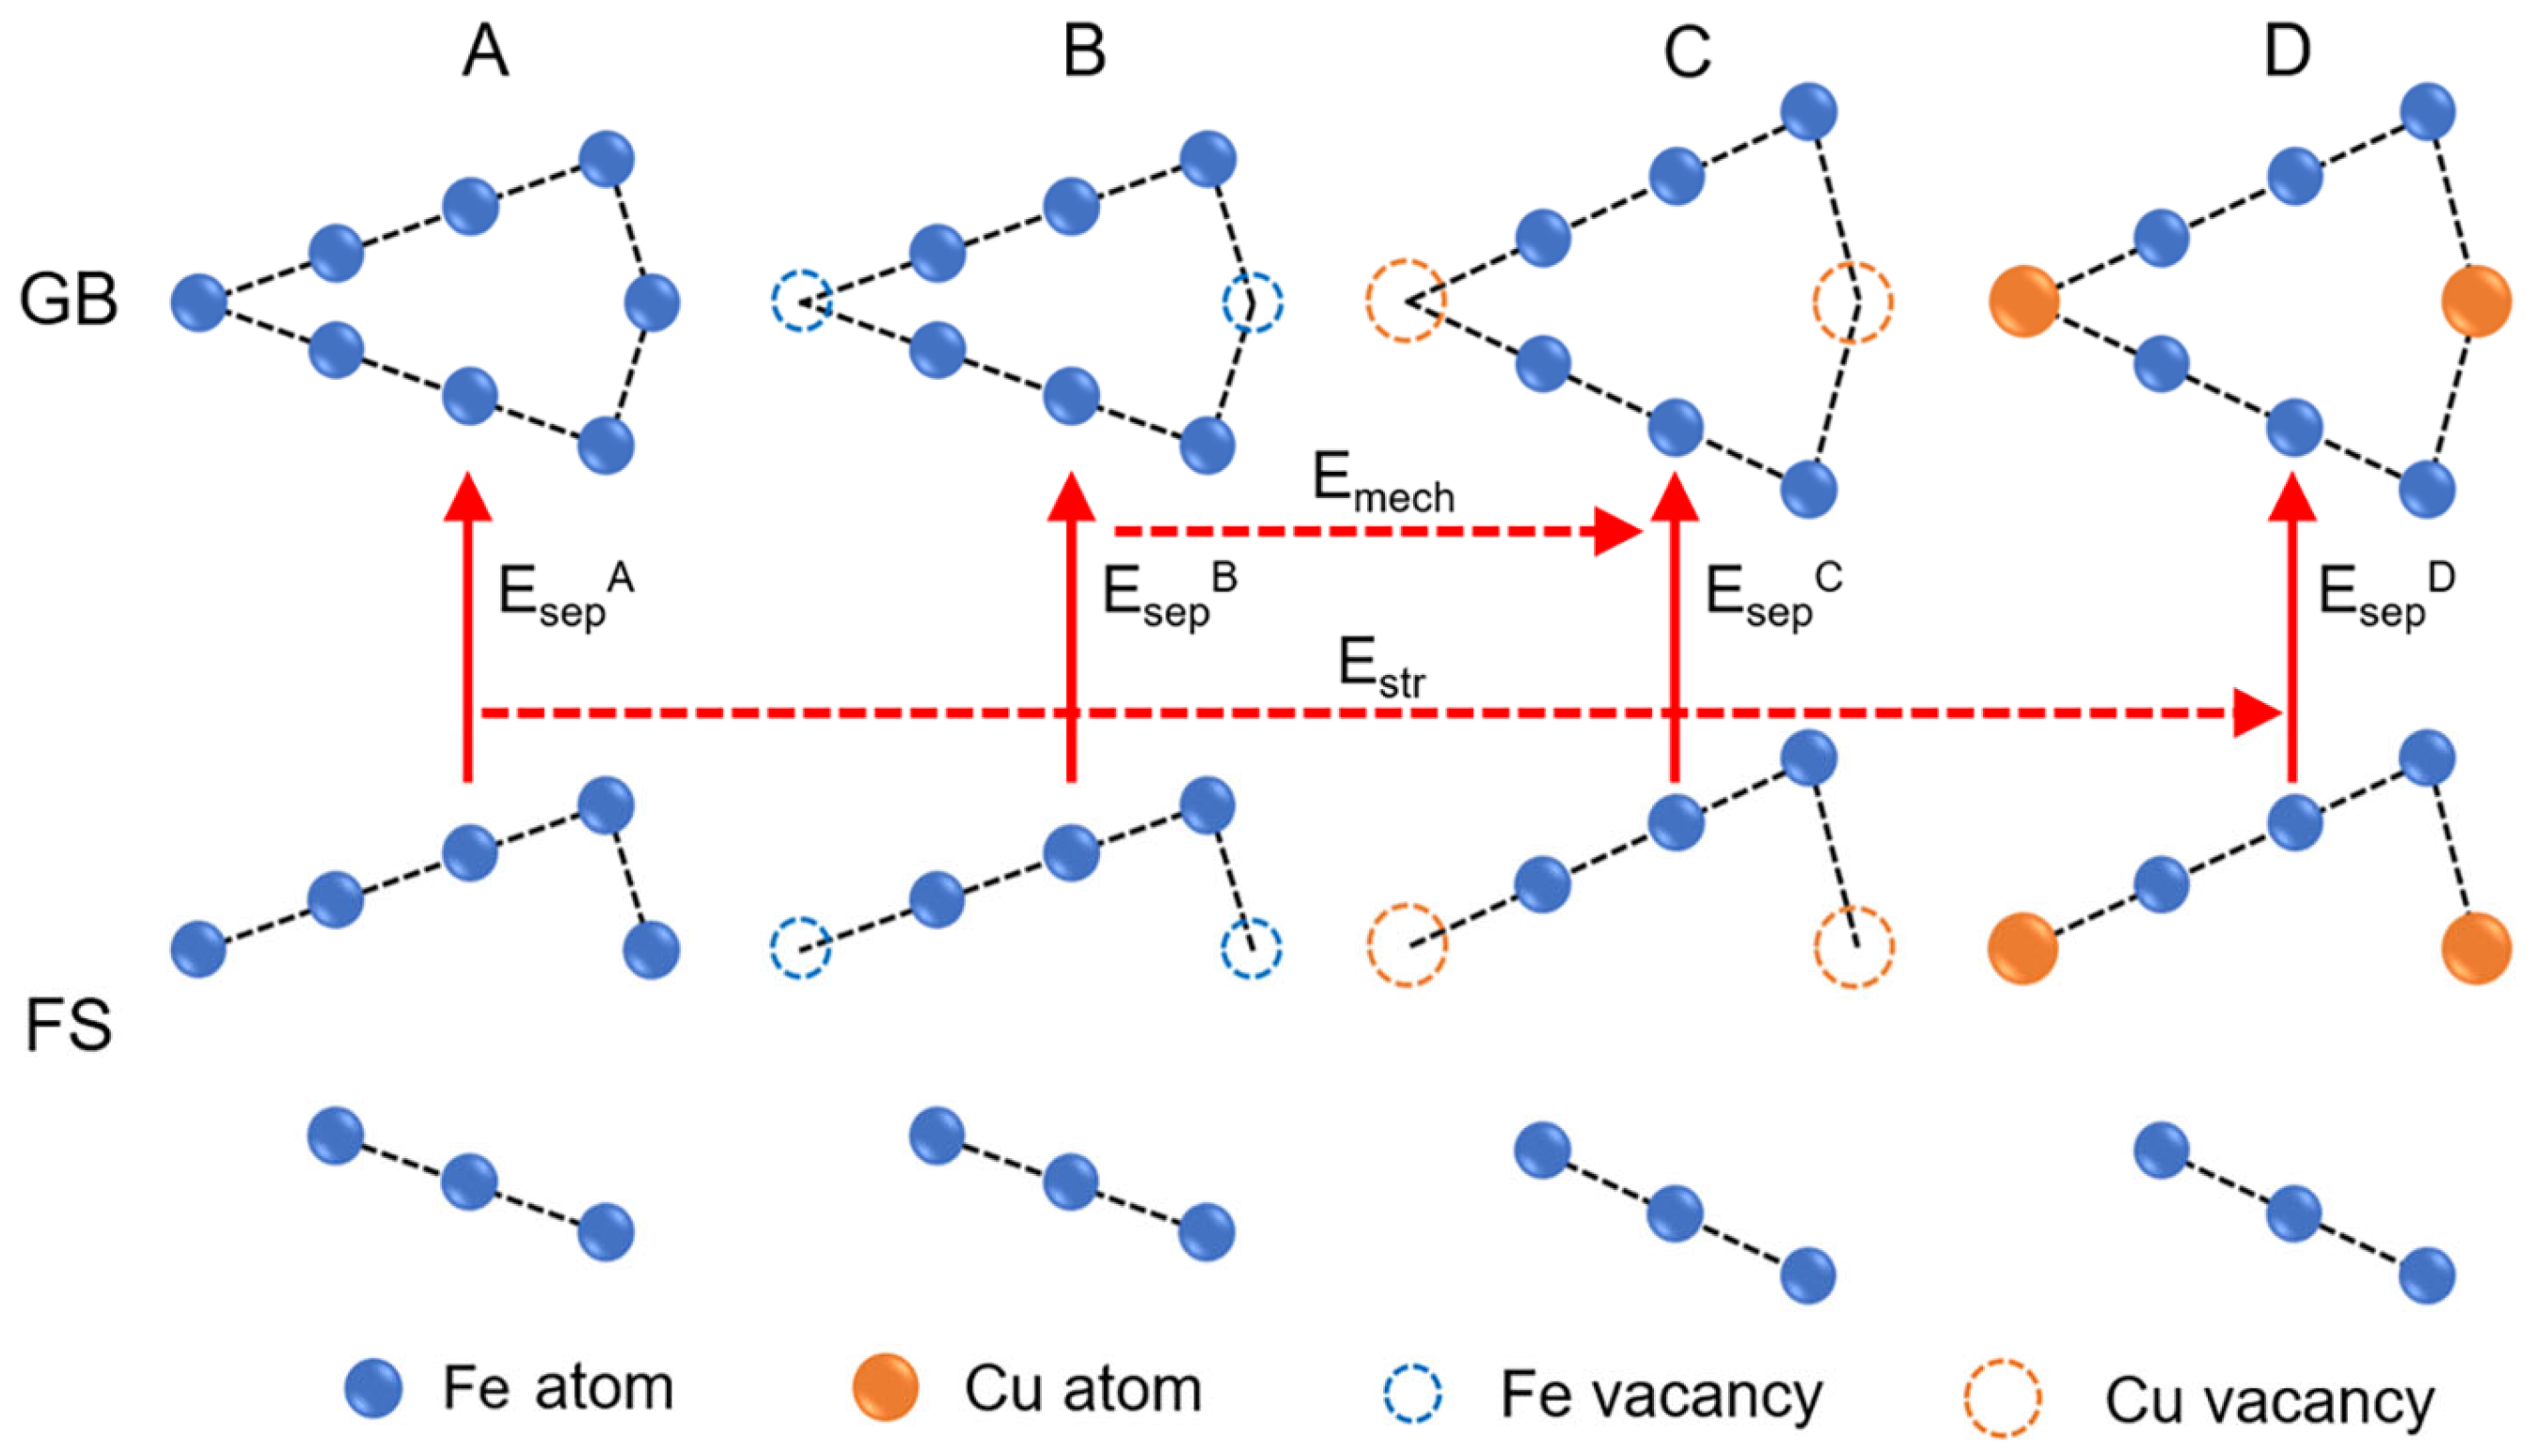
To calculate the specific values of the mechanical and chemical contributions, a series of computational systems were constructed, as illustrated in Figure 9. System A presents the ideal grain-boundary (GB) model and the two separated fracture-surface (FS) models. System B is obtained by removing one Fe atom from System A. System D denotes the deformed Fe grain-boundary model containing Cu atoms as well as the corresponding Cu-doped fracture-surface model. System C is generated by removing one Cu atom from System D.
Figure 9.
Diagram of the strengthening energy, the mechanical contribution, and the chemical contribution. The four computational systems are: (A) the ideal grain-boundary model together with the two separated fracture-surface models; (B) system A with one Fe atom removed; (C) system D with one Cu atom removed; (D) the grain-boundary model containing Cu atoms together with the corresponding Cu-doped fracture-surface model. The vertical arrows indicate the grain-boundary separation energies of systems B and D; the upper horizontal arrow indicates the mechanical contribution, and the lower dashed arrow the strengthening energy.
The calculation of the separation energy () of systems A, B, C, and D is shown in Equations (4)–(7) [38].
Therefore, the calculation of the strengthening energy () is shown in Equation (8):
The mechanical contribution is defined as the difference in separation energy between system B and system C, as expressed in Equation (9):
The chemical contribution can be calculated according to Equation (10):
The results obtained from first-principles calculations of Equations (4)–(10) are shown in Table 1. The strengthening energy is 1.67 eV, with a chemical contribution of 1.54 eV and a mechanical contribution of 0.13 eV. This indicates that Cu atoms reduce the strength of the grain boundary. Since the atomic radii of Cu (1.28 Å) and Fe (1.24 Å) are comparable, Cu-induced grain boundary distortion is slight. Accordingly, the mechanical contribution only accounts for a small fraction of the overall grain boundary weakening. The weakening of the grain boundary is mainly caused by the chemical contribution. The chemical contribution mainly refers to the change in the electronic structure of the Fe grain boundary caused by Cu atoms. The changes in the electronic structure at the grain boundary are usually represented by charge density, electron localization function, and density of states.
Table 1.
Calculation results of Equations (4)–(10).
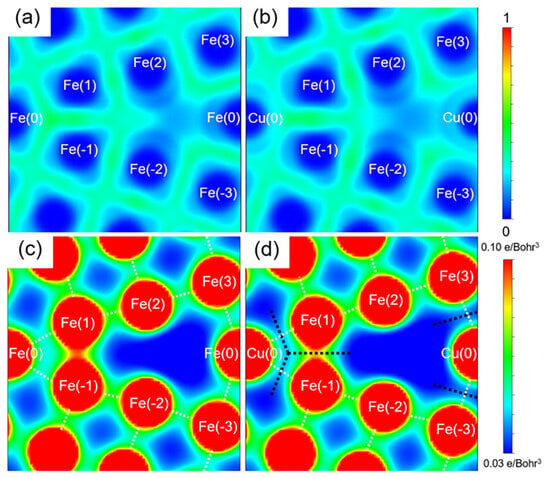
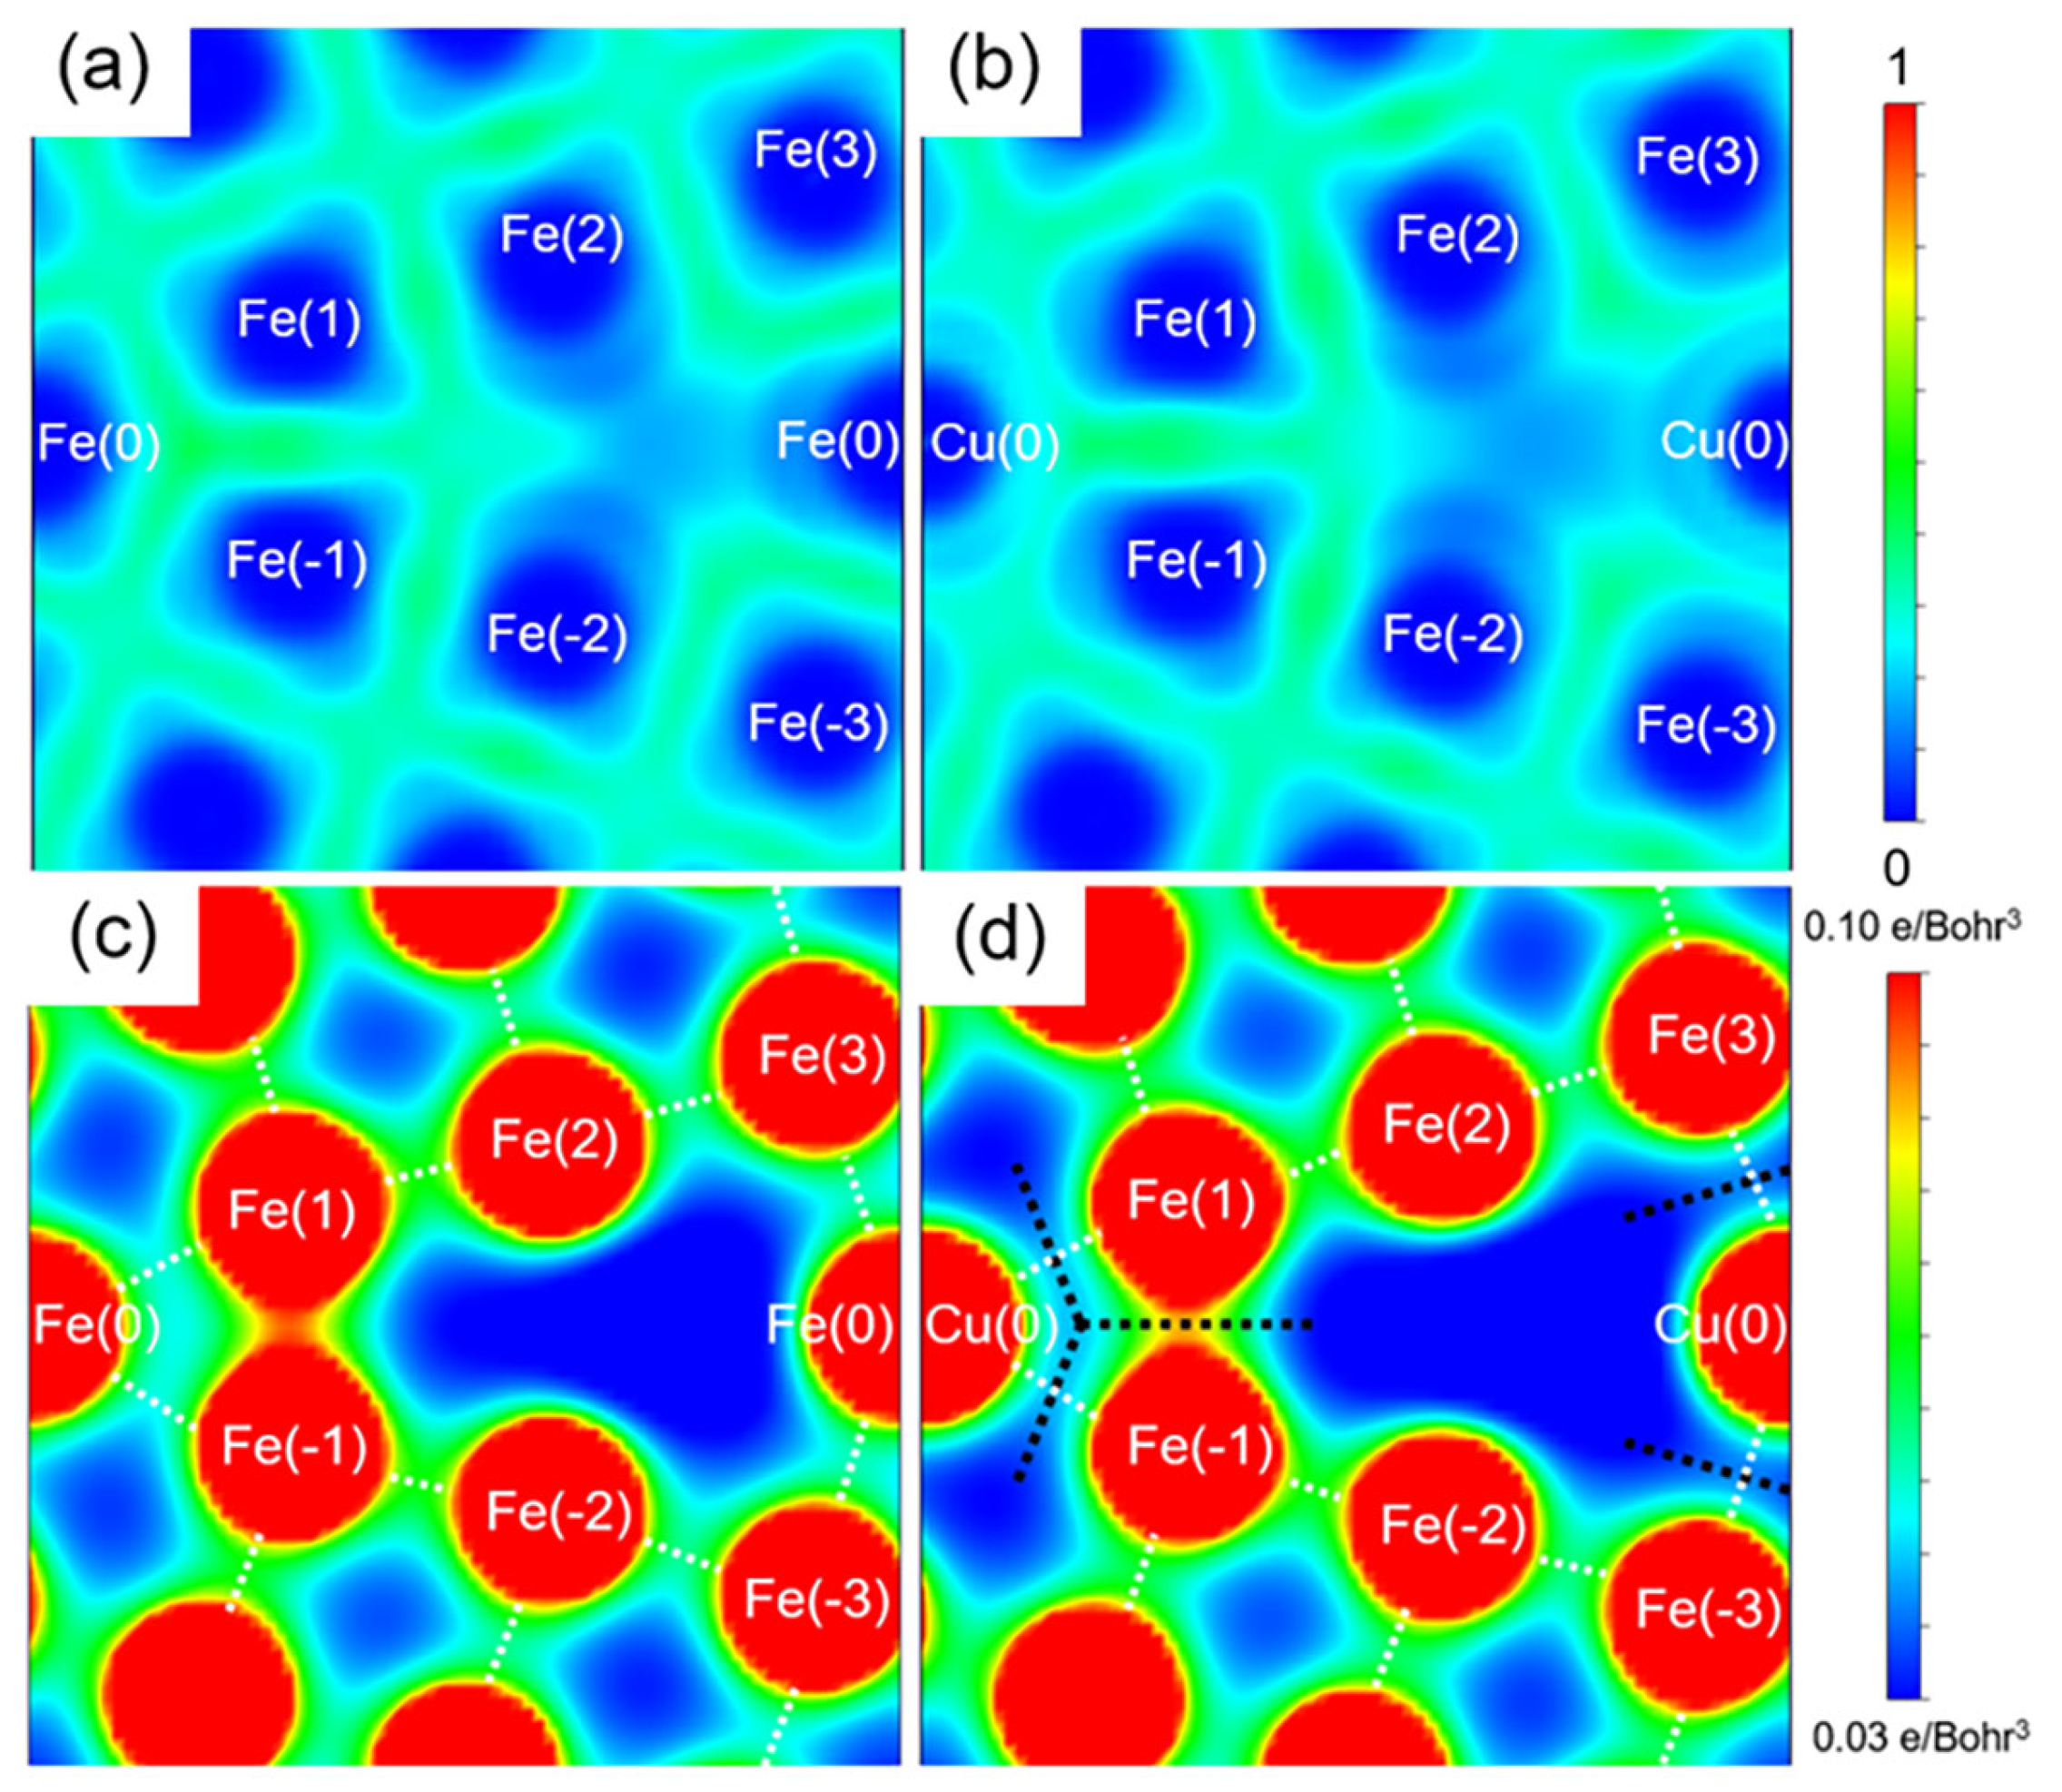
The electron localization function (ELF) distributions of Fe grain boundaries and Cu-containing grain boundaries are shown in Figure 10a,b. The ELF distribution can reflect the type of bond between atoms [39]. Whether it is an Fe grain boundary or a Cu-containing grain boundary, the bonding regions between atoms appear green, with function values around 0.5, indicating that the bonds between atoms are metallic [21]. This is different from the formation of covalent bonds between Zn atoms and Fe grain boundaries, as reported in the relevant literature [27].
Figure 10.
(a,b) Electron localization function; (c,d) charge density.
Charge density plays a crucial role in determining atomic bonding characteristics, with bond strength being closely correlated to the magnitude of charge-density accumulation between atoms. The charge-density distribution at the grain boundary is illustrated in Figure 10c,d, where red regions represent areas of high charge density and blue regions correspond to low charge density. In the undoped Fe grain boundary, metallic bonds formed between Fe(0)–Fe(1), Fe(0)–Fe(−1), Fe(0)–Fe(3), Fe(0)–Fe(−3), and Fe(1)–Fe(−1) atoms serve as the primary cohesive linkages connecting the two adjacent grains. In the Cu-containing grain boundary, a reduction in charge density is observed between these atomic pairs, particularly along the paths indicated by the black dotted line in Figure 10d, which reveals the weakening of the relevant metallic bonds. These findings indicate that Cu–Fe bonds formed by Cu substituting Fe at Site 0 still exhibit metallic characteristics. However, due to the lower charge density between Cu and Fe atoms compared with Fe–Fe pairs, the Cu–Fe bond is weaker. This substitution consequently reduces the overall cohesion of the grain boundary.
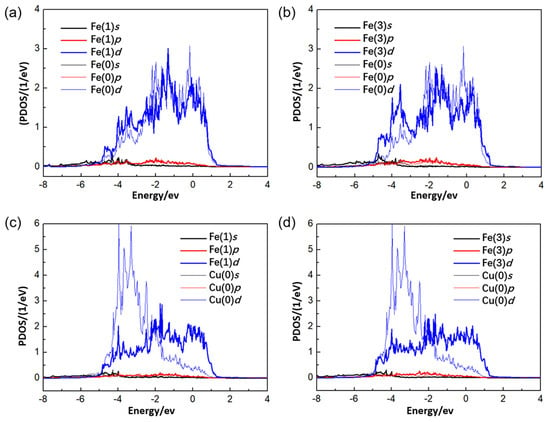
Figure 11 presents the partial density of states (PDOS) of selected atoms for both the undoped Fe grain boundary and the Cu-doped grain boundary. Figure 11a shows the density of states (DOS) of Fe(0) and Fe(1) atoms within the Fe grain boundary. The main peaks originate from d-orbital electrons, while s and p-orbitals contribute negligibly. The substantial overlap of d-orbital states between the two Fe atoms reflects strong electronic interaction, accounting for the high bond strength of the Fe(0)–Fe(1) atomic pair. Similarly, the DOS of Fe(0) and Fe(3) atoms in Figure 11b confirms that the Fe(0)–Fe(3) bond also exhibits strong metallic character. Due to the structural symmetry of the grain boundary, the electronic states of Fe(0)–Fe(−1) and Fe(0)–Fe(−3) are analogous to those of Fe(0)–Fe(1) and Fe(0)–Fe(3), respectively, and hence are not elaborated further. In the Cu-doped grain boundary (Figure 11c,d), the major PDOS peaks of both Fe and Cu atoms remain dominated by d-orbital electrons. Nevertheless, d-orbital overlap between Cu and Fe is suppressed, indicating weakened electronic hybridization and reduced interatomic interactions [40]. Accordingly, Cu–Fe bonds possess lower stability compared with intrinsic Fe–Fe bonds. When Cu substitutes Fe(0), the Cu(0)–Fe(1), Cu(0)–Fe(−1), Cu(0)–Fe(3), and Cu(0)–Fe(−3) bonds become weaker than their Fe–Fe counterparts. This further verifies that Cu segregation at grain boundaries degrades grain-boundary structural integrity.
Figure 11.
Partial wave density of states (PDOS): (a) Fe(0) and Fe(1) atoms; (b) Fe(0) and Fe(3) atoms; (c) Cu(0) and Fe(1) atoms; (d) Cu(0) and Fe(3) atoms.
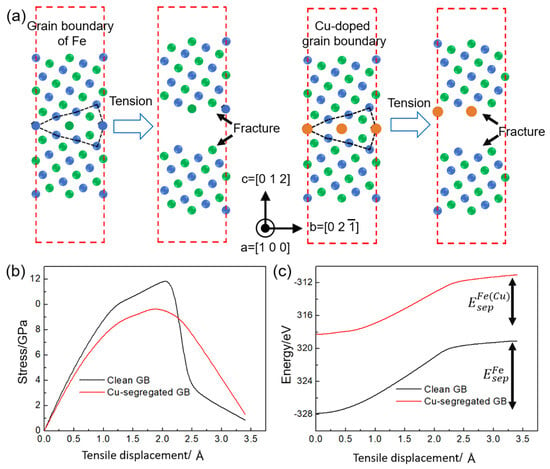
Figure 12a illustrates the first-principles tensile simulation procedure of the grain boundary model. Strain is applied incrementally along the crystallographic [0 1 2] direction, with a displacement increment of 0.1 Å in each iteration. Structural relaxation was conducted after each deformation step to achieve energy minimization. The total tensile displacement amounted to 3.4 Å, and the Poisson effect was ignored throughout the simulation. For the undoped Fe grain boundary model, continuous stretching results in full separation into two individual grains, generating two fresh fracture surfaces. Likewise, fracture of the Cu-containing grain boundary model also generates two separated surfaces, and Cu atoms preferentially reside on the upper fracture surface upon bond rupture. The maximum tensile strength, defined as the peak stress on the stress–displacement curve, reaches 11.94 GPa for the pristine Fe grain boundary and 9.59 GPa for the Cu-doped grain boundary, as shown in Figure 12b. With the increase in tensile displacement, the total energy of the system rises monotonically, while its growth rate decreases gradually. Accordingly, the separation energy adopted in this work is defined as the energy difference between the grain boundary energy at a displacement of 3.4 Å and the initial equilibrium energy. The separation energy of the pristine Fe grain boundary reaches 8.97 eV, whereas that of the Cu-doped grain boundary is only 7.30 eV. The simultaneous decline in tensile strength and separation energy proves that Cu segregation at grain boundaries severely impairs the mechanical integrity of grain boundaries and renders them more prone to fracture (Figure 12c). These are the same quantities as in Equations (4) and (7): at a tensile displacement of 3.4 Å, the two fracture surfaces are fully separated and no longer interact, so that the energy difference between the stretched and the initial cell coincides with the difference between the fracture-surface and grain-boundary energies. Expressed per unit area of the boundary (26.58 Å2, with 1 eV Å−2 = 16.02 J m−2), the separation energies are 5.41 J/m2 for the pure boundary and 4.40 J/m2 for the copper-containing one, and the strengthening energy is 1.01 J/m2.
Figure 12.
First-principles tensile test: (a) tensile process of grain boundary model; (b) stress–displacement curve; (c) energy–displacement curve.
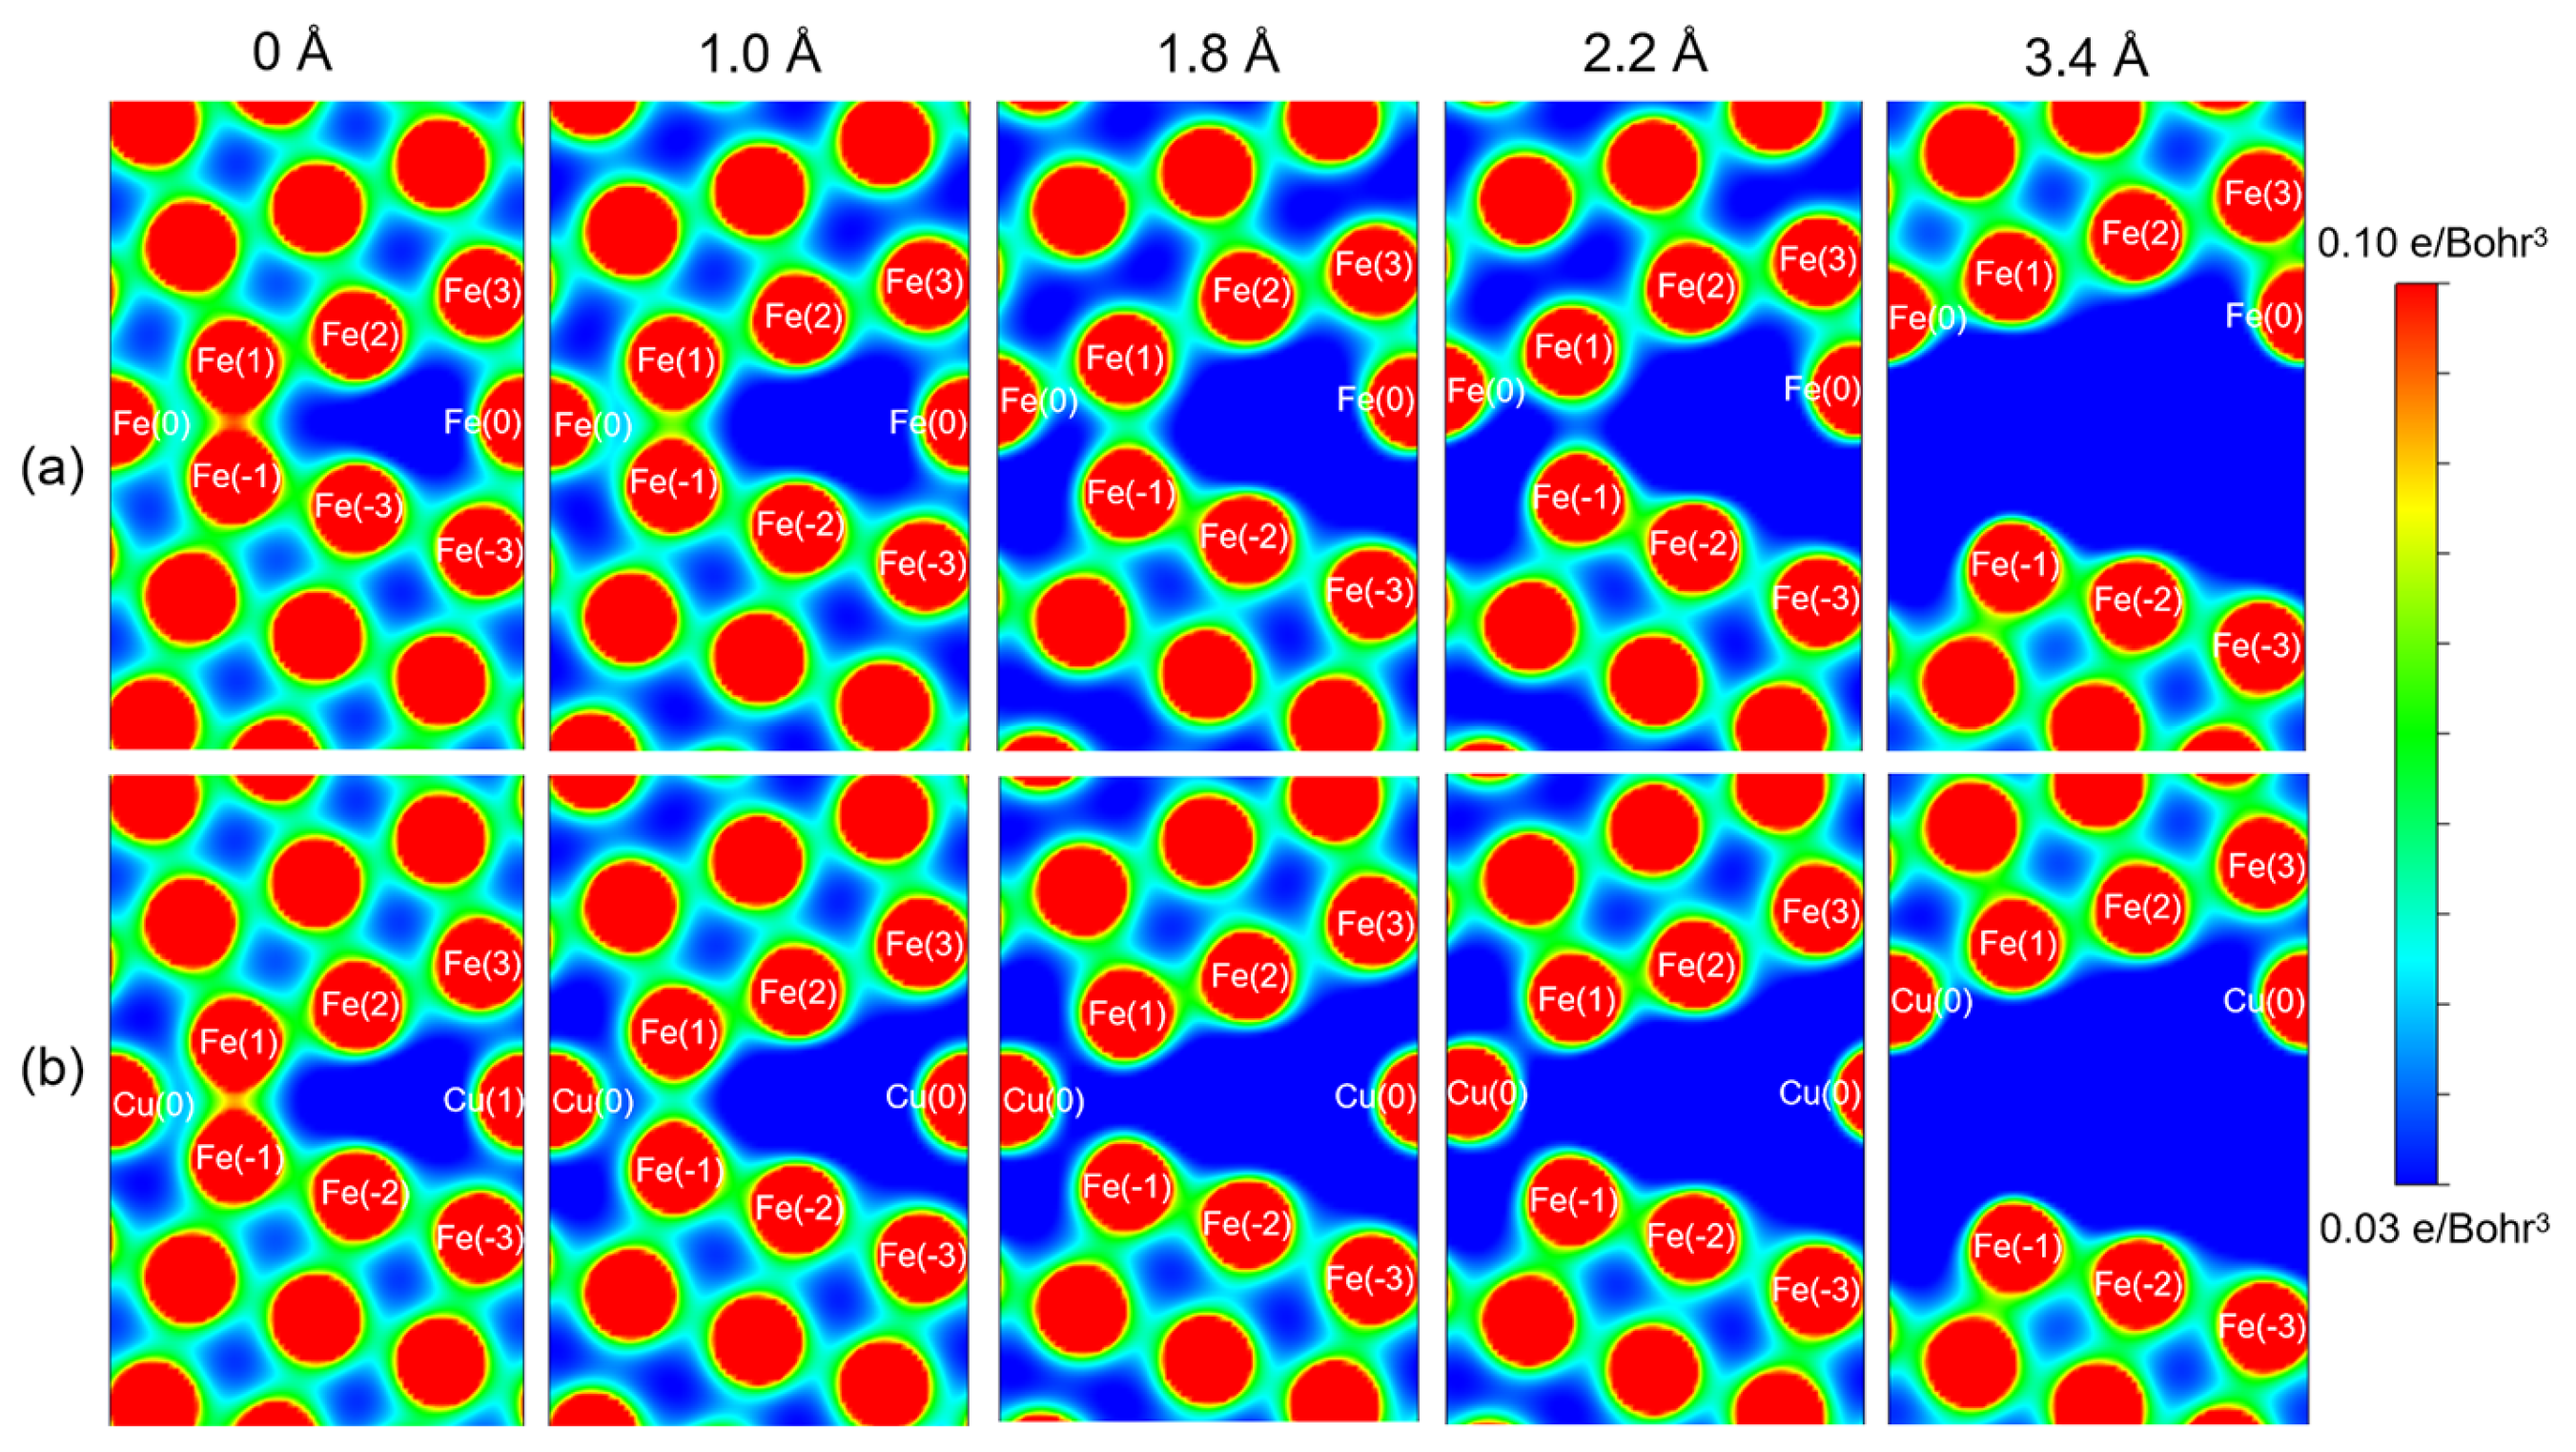
Figure 13a presents the charge density distribution of the pristine Fe grain boundary at various tensile displacements. With the increase in tensile displacement, the charge density between Fe(1)–Fe(−1), Fe(0)–Fe(−1) and Fe(0)–Fe(−3) atomic pairs gradually decreases. When the tensile displacement reaches 2.2 Å, the interatomic bonds between the aforementioned atoms fracture, and the grain boundary splits into two individual grains. In the Cu-segregated grain boundary shown in Figure 13b, the charge density between the aforementioned atoms is already depleted in the initial configuration. At identical tensile displacements, the charge density within these regions is lower than that of the pristine Fe grain boundary, leading to grain boundary fracture at a smaller tensile displacement of 1.8 Å. In summary, based on analyses of charge density, electron localization function, and density of states combined with first-principles tensile simulations, we can draw the conclusion that Cu atoms degrade the bonding strength of Fe grain boundaries.
Figure 13.
Charge density distribution at grain boundaries under different tensile displacement: (a) Fe grain boundary; (b) Cu-containing grain boundary.
3.4. Mechanism Analysis of Liquid Metal Embrittlement (LME)
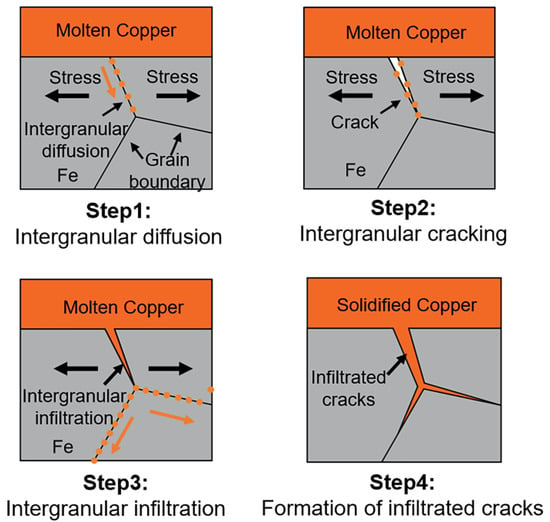
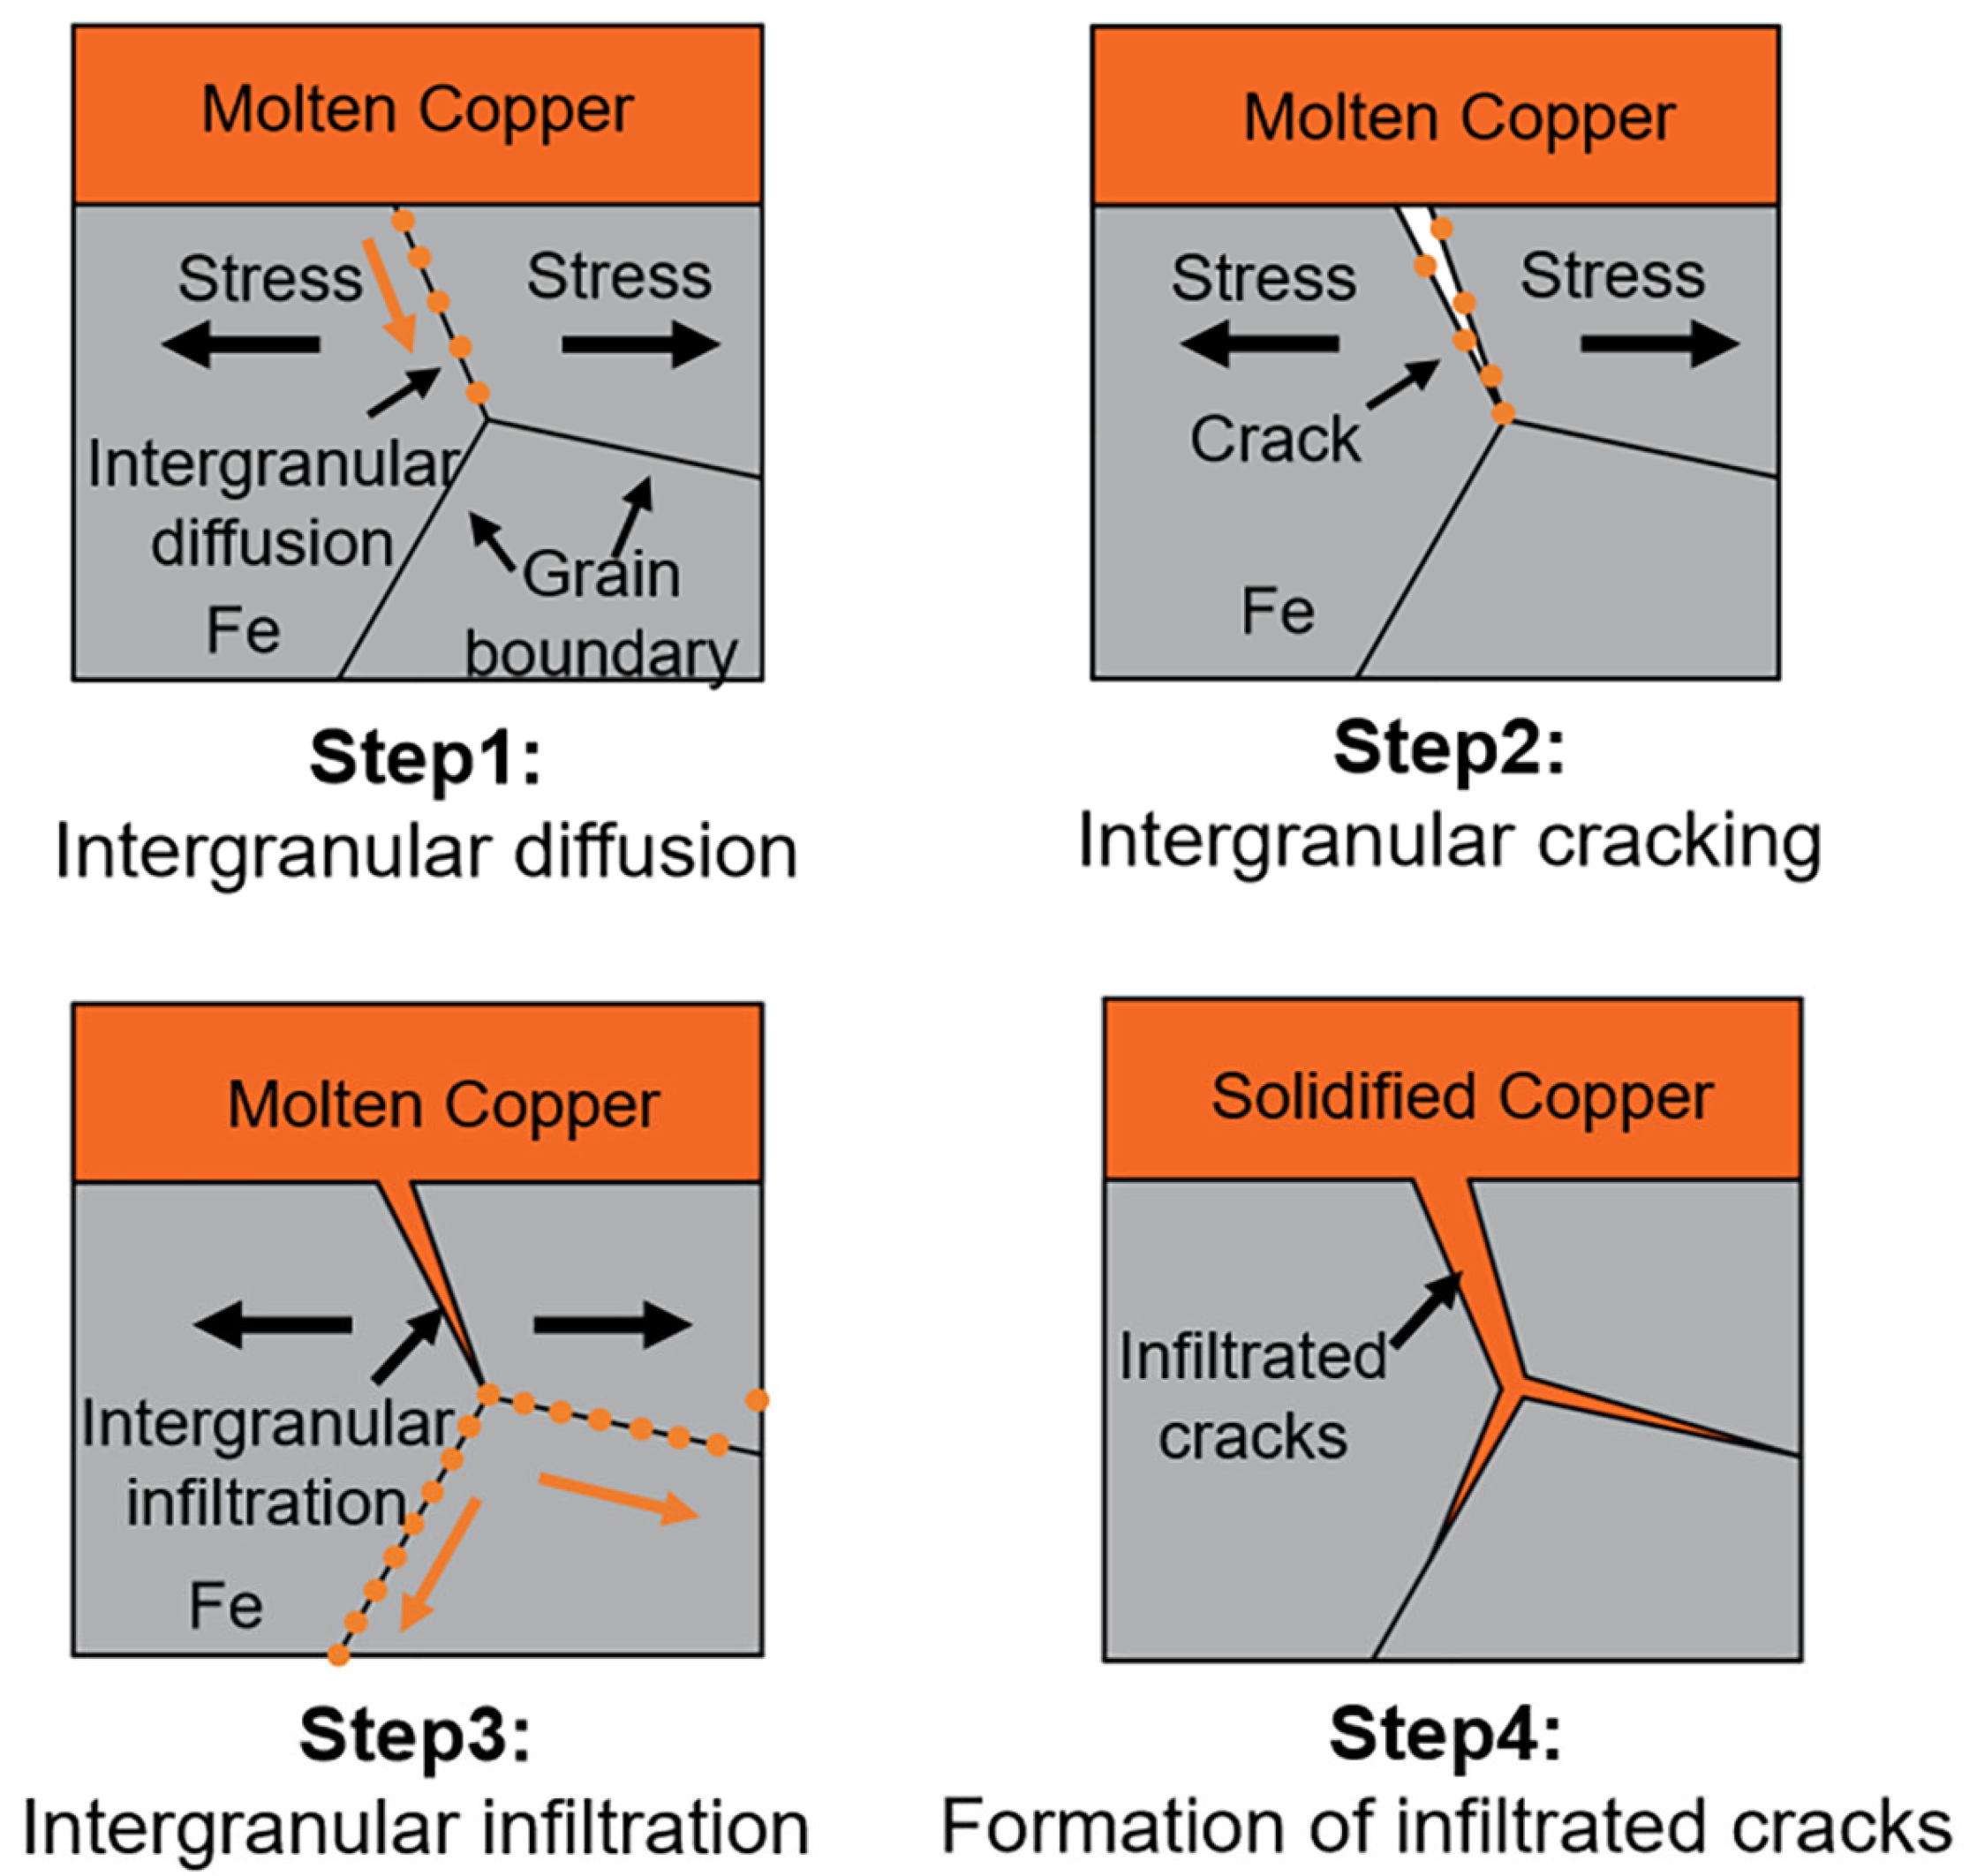
Combined with experimental characterization and simulation calculation results, the formation mechanism of infiltrated cracks during the Cu/Fe welding process is illustrated in Figure 14. In the welding process, solid Fe contacts liquid Cu. According to molecular dynamics simulations and micro-composition analysis, Cu atoms preferentially diffuse toward Fe grain boundaries (step 1). Nevertheless, the diffusion rate decreases as time elapses. Accordingly, infiltrated cracks with specific length, width, and volume cannot form within the short 3–5 s arc welding stage, relying solely on atomic diffusion. First-principles calculations reveal that Cu atoms segregated at Fe grain boundaries reduce the grain boundary bonding strength. Subjected to tensile stress induced by arc welding, Cu-containing grain boundaries initiate cracking (step 2). Massive molten Cu infiltrates the cracked grain boundaries and drives further inward diffusion of Cu atoms along grain boundaries (step 3). The crack path is therefore confined to those boundaries in which Cu has segregated, which is consistent with the atomic-scale finding that the chemistry of the grain boundary determines the crack path in liquid metal-embrittled alloys [41]. The cyclic process consisting of grain boundary diffusion, grain boundary embrittlement, grain boundary cracking, and molten Cu infiltration drives the propagation of infiltrated cracks. This cycle proceeds continuously until Cu solidifies, ultimately forming macroscopic infiltrated cracks (step 4). The Cu-rich phase within infiltrated cracks possesses relatively low mechanical strength. When the iron matrix bears external loads, this copper-rich phase is the weaker constituent and yields first, so that the infiltrated boundaries become the paths along which intergranular cracks propagate, and the continuity of the substrate is reduced locally, although the iron grains themselves remain ductile. The relation between the nanosecond simulations and a welding process that lasts seconds therefore needs to be stated explicitly. The molecular dynamics runs cover 4 ns, whereas the thermal cycle of a single pass lasts 3–5 s, and the simulated diffusion distances—on the order of a few nanometers (Figure 6)—therefore cannot be compared directly with the depth of the macroscopic infiltrated cracks. What is transferred from the simulation is not a length but two properties of the system that do not depend on the duration of the run: that liquid Cu wets and diffuses along the grain boundaries of solid Fe rather than into the lattice, and that the rate of this grain-boundary transport increases with temperature and is far higher than that of lattice diffusion. The gap between the two time scales is bridged not by extrapolating the diffusion length but by the cyclic process described above: each cycle advances the infiltration front by a finite increment along the boundary, and the cycle is driven by the thermal and mechanical loading of the arc, which repeats on a scale of seconds until the melt solidifies. The simulations therefore describe the elementary step of the mechanism, whereas the absolute depth of infiltration is taken from the experiment; the correspondence between the calculated and the observed trend—deeper infiltration at higher temperature and at the weld center—is used as a consistency check and not as a quantitative validation.
Figure 14.
Formation of infiltrated cracks during copper/iron welding.
One further mechanism deserves discussion: liquid copper might simply wet the grain boundaries and be drawn along them by capillarity, without any prior embrittlement. Wetting of this kind is conventionally described by the dihedral angle of the liquid at the boundary, and a liquid that wets a boundary can penetrate it without the boundary having to be broken first. The two routes make different predictions, and three observations in this work favor the second. First, the boundary ahead of an infiltrated crack is enriched in Cu, but intact and free of liquid (Figure 4): the copper reaches that boundary by solid-state diffusion, before a crack exists. Second, the cracks are discrete, with sharp tips and a strong preference for particular boundaries, rather than a continuous capillary front. Third, the weakening produced by substitutional Cu is a solid-state effect of 1.54 eV out of 1.67 eV, and embrittlement of this kind can be avoided altogether when no stress is applied [15], whereas capillary wetting does not require stress. Wetting is nevertheless part of the mechanism proposed here, at a later stage: once the weakened boundary has cracked, capillarity is what draws the liquid into the opening, which is step 3 of the cycle in Figure 14. The two descriptions are therefore sequential rather than alternative.
3.5. Mechanical Response of the Substrate and Fracture Morphology
The mechanism set out above makes a prediction that can be tested directly. If the iron grain boundaries are weakened by segregated Cu, and if the copper that fills the cracks is itself ductile, then the substrate should still deform plastically and the loss of ductility should remain confined to the infiltrated boundaries. The iron substrate containing infiltrated cracks was therefore tested in tension in situ in the scanning electron microscope, and the fracture surfaces were examined afterwards.
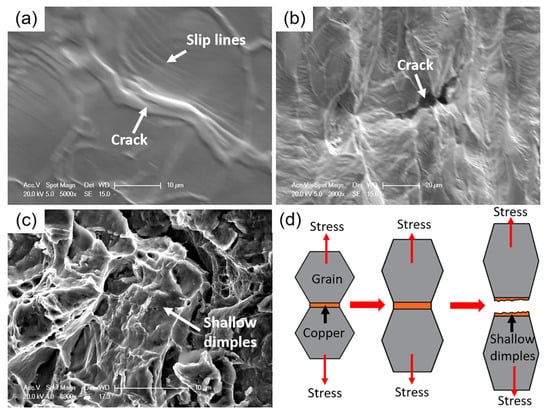
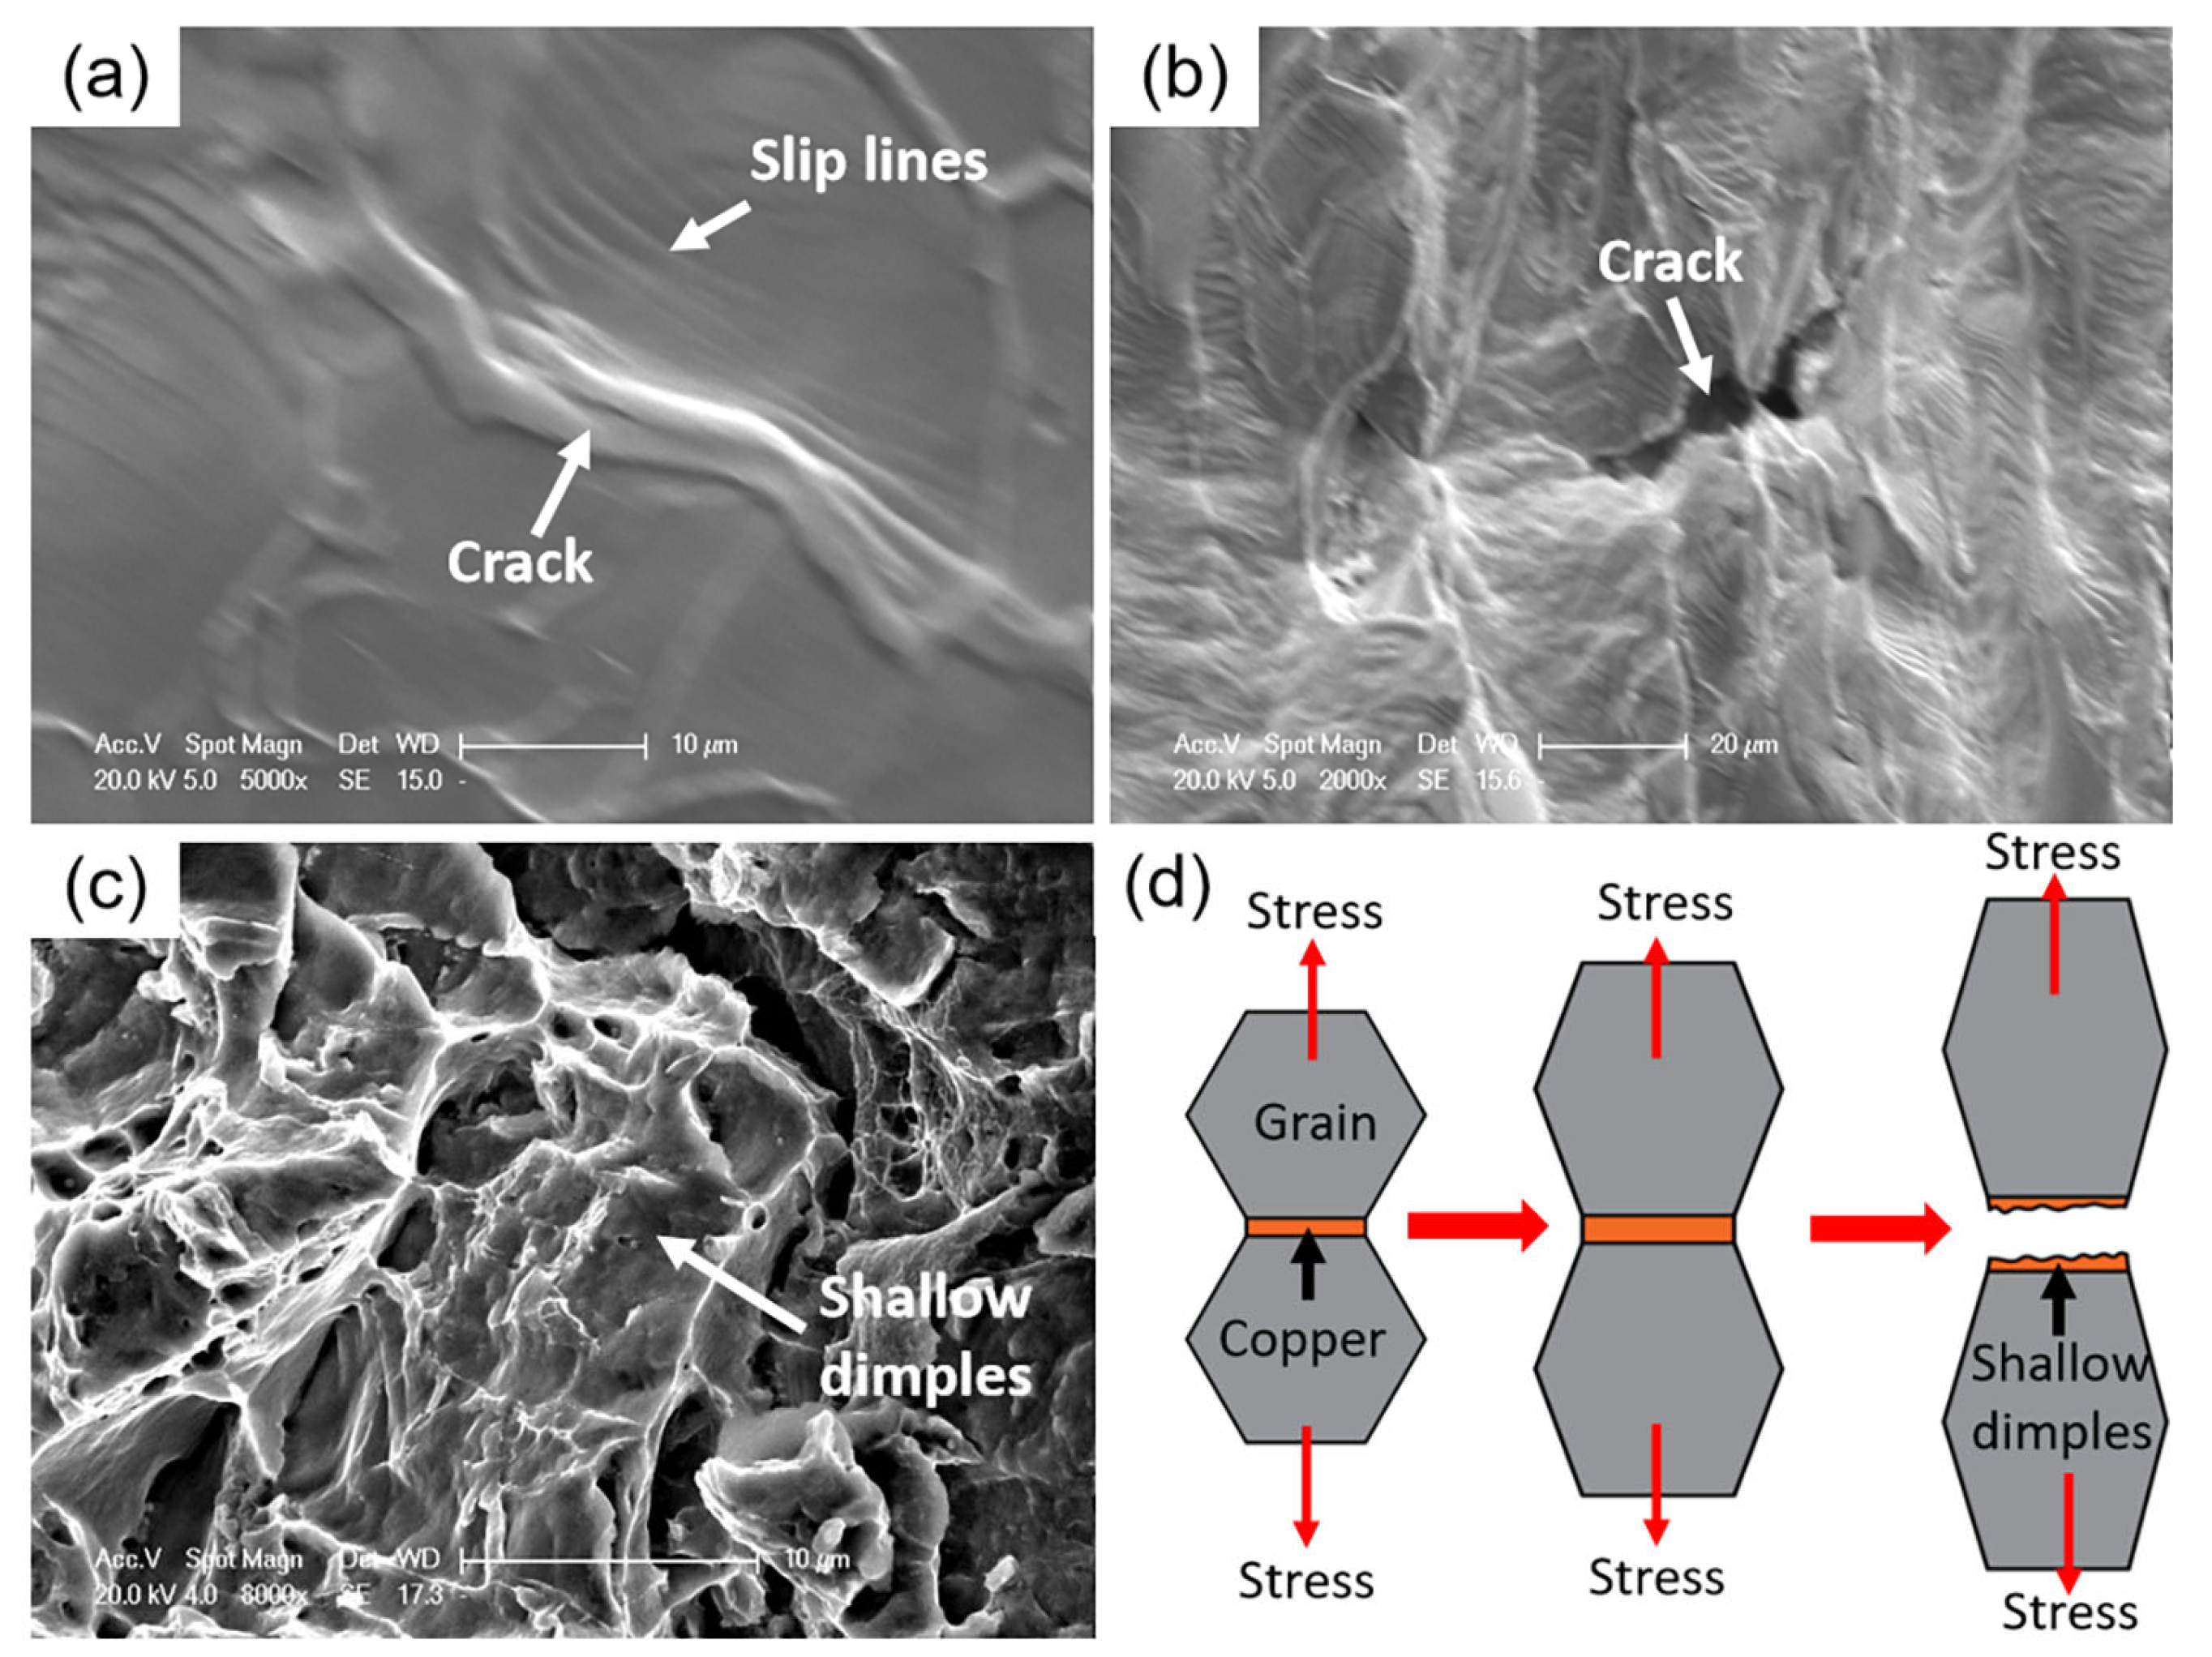
The substrate deformed by necking and showed no crack within the iron grains up to fracture, and slip lines formed inside the grains, so that the matrix deformed plastically. Microcracks initiate at the copper-infiltrated grain boundaries and propagate into macroscopic cracks (Figure 15a,b). The fracture surface is ductile throughout: away from the copper layer, it consists entirely of equiaxed dimples, and closer to the layer, the dimples are shallow, because the thin copper-rich ligament deforms together with the neighboring grains and finally separates within itself rather than at the boundary (Figure 15c,d). This result qualifies the sense in which the term embrittlement is used here. What the Cu/Fe system shows is embrittlement of the grain boundaries: they are weakened by segregated Cu, they crack under the welding stress, and they are infiltrated by liquid copper. The macroscopic embrittlement reported for copper-alloy/steel couples, in which the infiltrated phase is a brittle Sn-bearing solid solution, is therefore not reproduced here, where the infiltrate is pure copper.
Figure 15.
Mechanical response of the iron substrate containing infiltrated cracks: (a) slip lines and a crack opening at the surface during the in situ tensile test; (b) crack propagation; (c) fracture surface close to the copper layer, showing shallow dimples; (d) schematic of the process, in which the copper-filled boundary deforms together with the grains and separates within the copper ligament, leaving shallow dimples.
4. Conclusions
In this work, the mechanism of liquid metal embrittlement (LME) occurring during Cu/Fe dissimilar welding is systematically investigated. Multiscale simulation approaches, including molecular dynamics simulation and first-principles calculation, together with conventional experimental characterizations, are employed to analyze the LME behavior. The main conclusions are summarized as follows:
In the welding process, solid Fe contacts molten Cu. HRTEM observations combined with MD simulations demonstrate the diffusion of Cu atoms into grain boundaries. The strengthening energy, mechanical contribution, and chemical contribution induced by Cu atoms are 1.67 eV, 0.13 eV, and 1.54 eV, respectively. The results demonstrate that Cu atoms degrade grain-boundary (GB) strength, with the chemical contribution being dominant.
Results from the electron localization function, charge-density distributions, and density of states show that the Cu-segregated GB is still dominated by metallic bonds, yet these metallic bonds become weakened. First-principles tensile simulations further confirm the reduction in strength of Cu-segregated GBs.
The mechanism of liquid metal embrittlement (LME) in Cu/Fe dissimilar welding is concluded as follows. Cu atoms diffuse into GBs and reduce the grain boundary strength. Under tensile stress, the GBs fracture, and massive molten copper infiltrates the cracked channels to form intergranular infiltration. The continuous repetition of this process promotes the growth of intergranular infiltrated cracks. Ultimately, the intergranular distribution of Cu embrittles the iron grain boundaries; the substrate retains its ductility when the infiltrated phase is pure copper, so that the macroscopic brittleness reported for copper-alloy/steel joints requires an infiltrated phase that is itself brittle.
Author Contributions
C.C.: conceptualization and methodology; B.H.: investigation; P.Z.: data curation; Z.Y.: supervision; P.D.: software; W.L.: formal analysis. All authors have read and agreed to the published version of the manuscript.
Funding
This research was funded by the Natural Science Foundation of the Jiangsu Higher Education Institutions of China, grant number 24KJD430010.
Data Availability Statement
The original contributions presented in the study are included in the article; further inquiries can be directed to the corresponding author.
Acknowledgments
The authors thank the teachers at the Jiangsu Intelligent Production Line Technology and Equipment Engineering Research Center for their help with the experiments. The authors also used an AI-assisted language-editing tool based on a large language model (DeepSeek-V3) during the preparation of this manuscript, for language polishing of text drafted by the authors and for drafting and organizing the point-by-point responses to the reviewers. The tool was not used to generate data, analyses, figures, or conclusions; the authors reviewed and edited all AI-assisted text and take full responsibility for the content of the publication.
Conflicts of Interest
The author Baoyu Huang has been involved as a consultant and expert witness at Changzhou Sveck Photovoltaic New Material Co., Ltd. The remaining authors declare that the research was conducted in the absence of any commercial or financial relationships that could be construed as potential conflicts of interest.
References
- Wang, J.H.; Chen, J.; Du, S.W.; Wu, R.D.; Cao, Y.; Feng, Y.L. Enhanced strength of copper-steel composite plates prepared by laser assisted rolling bonding process. J. Mater. Res. Technol. 2026, 40, 427–439. [Google Scholar] [CrossRef] [Scilit]
- Zhao, L.; Li, J.; Yang, Q.; Wang, Y.; Zhang, X.; Li, H.; Yang, Z.; Xu, D.; Liu, J. Study on Friction and Wear Properties of New Self-Lubricating Bearing Materials. Crystals 2022, 12, 834. [Google Scholar] [CrossRef] [Scilit]
- Sun, Q.; Zhang, K.; Xue, Y.Y.; Li, Z.X.; Wang, X.A.; Chen, J. Improving the bonding strength of copper/steel joint in the laser lap welding by applying rolling force. Mater. Chem. Phys. 2026, 350, 131950. [Google Scholar] [CrossRef] [Scilit]
- Silvayeh, Z.; Auer, P.; Hitter, A.; Domitner, J. Failure analysis on copper-steel butt joints produced by friction stir welding. Eng. Fail. Anal. 2026, 189, 110661. [Google Scholar] [CrossRef] [Scilit]
- Mahmoudiniya, M.; Hermans, M.J.M.; Kestens, L.A.I. Grain boundary susceptibility to liquid metal embrittlement during wire arc additive manufacturing of a bronze/stainless steel bimetallic structure. J. Manuf. Process. 2025, 224, 115058. [Google Scholar] [CrossRef] [Scilit]
- Yuan, D.; Wang, J.H.; Sun, X.J.; Zhang, Z.; Yang, Z.L.; Jiang, F.C.; Wei, C. Ultrasonic vibration suppresses liquid metal embrittlement in additively manufactured copper/austenitic stainless steel bimetallic structures via α-Fe band regulation. J. Mater. Sci. Technol. 2025, 262, 68–81. [Google Scholar] [CrossRef] [Scilit]
- Sun, Z.C.; Li, P.Y.; Zhang, T.; Wang, J.B.; Xu, D.; Chen, H.; Liu, D.H.; Pei, Y.Y. Effect of stress and Si on liquid metal embrittlement of 316L(N)-copper. Mater. Sci. Technol. 2021, 37, 552–559. [Google Scholar] [CrossRef] [Scilit]
- Cheng, L.Y.; Chen, L.; Wang, F.F.; Yang, G.Q.; Li, J.F.; Kong, L.T. Zn segregation in BCC Fe grain boundaries and its role in liquid metal embrittlement revealed by atomistic simulations. J. Mater. Sci. Technol. 2025, 225, 21–30. [Google Scholar] [CrossRef] [Scilit]
- Brunner, F.; Fioravanti, D.; Maresca, F. Liquid metal embrittlement in Fe-Zn: What can we learn from atomistic simulations? Acta Mater. 2026, 308, 121989. [Google Scholar] [CrossRef] [Scilit]
- Norkett, J.E.; Dickey, M.D.; Miller, V.M. A Review of Liquid Metal Embrittlement: Cracking Open the Disparate Mechanisms. Metall. Mater. Trans. A 2021, 52, 2158–2172. [Google Scholar] [CrossRef] [Scilit]
- Jin, Z.J.; Yang, X.Y.; Qu, H.Y.; Guo, M.Z.; Gao, Q.; Sun, X.L. Manipulating Al-Ga-based alloys’ hydrolysis performance for hydrogen supply by balancing grain growth and liquid metal embrittlement. Renew. Energy 2026, 263, 125467. [Google Scholar] [CrossRef] [Scilit]
- Heiple, C.; Bennett, W.; Rising, T. Embrittlement of several stainless steels by liquid copper and liquid braze alloys. Mater. Sci. Eng. 1982, 52, 277–289. [Google Scholar] [CrossRef] [Scilit]
- Vigilante, G.N.; Bartolucci, S.; Izzo, J.; Witherell, M.; Smith, S.B. Gleeble testing to assess solid/liquid metal embrittlement of gun steels by copper. Adv. Manuf. Process. 2012, 27, 835–839. [Google Scholar] [CrossRef] [Scilit]
- Deldar, S.; Mirzadeh, H.; Parsa, M.H. Prevention of surface hot shortness, development of banded structure, and mechanical properties of hot rolled Cu-bearing steel. Eng. Fail. Anal. 2016, 68, 132–137. [Google Scholar] [CrossRef] [Scilit]
- Chen, Y.; Wu, Q.Q.; Liu, S.X. Effects of Brazing Filler and Method on ITER Thermal Anchor Joint Crack. Mater. Manuf. Process. 2014, 30, 1074–1079. [Google Scholar] [CrossRef] [Scilit]
- Webler, B.; Yin, L.; Sridhar, S. Effects of small additions of copper and copper+nickel on the oxidation behaviour of iron. Metall. Mater. Trans. B 2008, 39, 725–737. [Google Scholar] [CrossRef] [Scilit]
- Yin, L.; Sridhar, S. Effects of small additions of tin on high-temperature oxidation of Fe-Cu-Sn alloys for surface hot shortness. Metall. Mater. Trans. B 2010, 41, 1095–1107. [Google Scholar] [CrossRef] [Scilit]
- Lan, Y.; Sampson, E.; Nakano, J.; Sridhar, S. The effects of nickel/tin ratio on Cu induced surface hot shortness in Fe. Oxid. Met. 2011, 76, 367–383. [Google Scholar] [CrossRef] [Scilit]
- Peng, H.B. The role of silicon in hot shortness amelioration of steel containing copper and tin. Oxid. Met. 2016, 85, 599–610. [Google Scholar] [CrossRef] [Scilit]
- Yuasa, M.; Mabuchi, M. Effects of segregated Cu on an Fe grain boundary by first-principles tensile tests. J. Phys. Condens. Matter 2010, 22, 505705. [Google Scholar] [CrossRef] [Scilit]
- Duscher, G.; Chisholm, M.F.; Alber, U. Bismuth-induced embrittlement of copper grain boundaries. Nat. Mater. 2004, 3, 621–626. [Google Scholar] [CrossRef] [Scilit]
- Bhattacharya, D. Liquid metal embrittlement during resistance spot welding of Zn-coated high-strength steels. Mater. Sci. Technol. 2018, 34, 1809–1829. [Google Scholar] [CrossRef] [Scilit]
- Frei, J.; Biegler, M.; Rethmeier, M.; Böhne, C.; Meschut, G. Investigation of liquid metal embrittlement of dual phase steel joints by electro-thermomechanical spot-welding simulation. Sci. Technol. Weld. Join. 2019, 24, 624–633. [Google Scholar] [CrossRef] [Scilit]
- Duan, R.C.; Zhu, Z.B.; Yu, P.; Ding, J.; Huang, H.F. Effect of grain boundary types on He bubble evolution in Ni-based alloys: Experiment and molecular dynamics simulation. Acta Mater. 2026, 306, 121894. [Google Scholar] [CrossRef] [Scilit]
- Xu, C.; Wei, J.; Huang, B.W.; Meng, X.C.; Xiao, S.F.; Deng, H.Q.; Hu, W.Y. Effect of symmetrical tilt grain boundary on the compatibility between copper and liquid lithium: Atomistic simulations. J. Alloys Compd. 2020, 835, 155212. [Google Scholar] [CrossRef] [Scilit]
- Nam, H.; Srolovitz, D.J. Molecular dynamics simulation of Ga penetration along Al grain boundaries under a constant strain rate condition. Mater. Trans. 2014, 55, 838–841. [Google Scholar] [CrossRef] [Scilit]
- Peng, W.; Peng, H.; Wu, G.; Zhang, J. Effect of zinc-doping on tensile strength of Σ5 bcc Fe symmetric tilt grain boundary. Comput. Mater. Sci. 2020, 171, 109204. [Google Scholar] [CrossRef] [Scilit]
- Zhang, S.; Kontsevoi, O.; Freeman, A. First principles investigation of zinc-induced embrittlement in an aluminum grain boundary. Acta Mater. 2011, 59, 6155–6167. [Google Scholar] [CrossRef] [Scilit]
- Huang, Z.; Chen, F.; Shen, Q.; Zhang, L.; Rupert, T.J. Uncovering the influence of common nonmetallic impurities on the stability and strength of a Σ5(310) grain boundary in Cu. Acta Mater. 2018, 148, 110–122. [Google Scholar] [CrossRef] [Scilit]
- Wei, X.; Dong, C.F.; Li, X.G. The effect of hydrogen on the evolution of intergranular cracking: A cross-scale study using first-principles and cohesive finite element methods. RSC Adv. 2016, 6, 27282–27292. [Google Scholar] [CrossRef] [Scilit]
- GB/T 5231-2012; Wrought Copper and Copper Alloys—Designation and Chemical Composition. Standardization Administration of China: Beijing, China, 2012.
- Bonny, G.; Pasianot, R.C.; Castin, N.; Malerba, L. Ternary Fe–Cu–Ni many-body potential to model reactor pressure vessel steels: First validation by simulated thermal annealing. Philos. Mag. 2009, 89, 3531–3546. [Google Scholar] [CrossRef] [Scilit]
- Yamaguchi, M.; Shiga, M.; Kaburaki, H. Grain boundary decohesion by impurity segregation in a nickel-sulfur system. Science 2005, 307, 393–397. [Google Scholar] [CrossRef] [Scilit]
- Rice, J.R.; Wang, J.S. Embrittlement of interfaces by solute segregation. Mater. Sci. Eng. A 1989, 107, 23–40. [Google Scholar] [CrossRef] [Scilit]
- Tran, R.; Xu, Z.H.; Zhou, N.X. Computational study of metallic dopant segregation and embrittlement at molybdenum grain boundaries. Acta Mater. 2016, 117, 91–99. [Google Scholar] [CrossRef] [Scilit]
- Wu, X.B.; You, Y.W.; Kong, X.S.; Chen, J.L.; Luo, G.N.; Lu, G.H.; Liu, C.S.; Wang, Z.G. First-principles determination of grain boundary strengthening in tungsten: Dependence on grain boundary structure and metallic radius of solute. Acta Mater. 2016, 120, 315–326. [Google Scholar] [CrossRef] [Scilit]
- Razumovskiy, V.I.; Divinski, S.V.; Romaner, L. Solute segregation in Cu: DFT vs. Experiment. Acta Mater. 2018, 147, 122–132. [Google Scholar] [CrossRef] [Scilit]
- Lozovoi, A.Y.; Paxton, A.T.; Finnis, M.W. Structural and chemical embrittlement of grain boundaries by impurities: A general theory and first-principles calculations for copper. Phys. Rev. B 2006, 74, 155416. [Google Scholar] [CrossRef] [Scilit]
- Silvi, B.; Savin, A. Classification of chemical bonds based on topological analysis of electron localization functions. Nature 1994, 371, 683–686. [Google Scholar] [CrossRef] [Scilit]
- Huang, Z.F.; Chen, F.; Shen, Q.; Zhang, L.M.; Rupert, T.J. Combined effects of nonmetallic impurities and planned metallic dopants on grain boundary energy and strength. Acta Mater. 2019, 166, 113–125. [Google Scholar] [CrossRef] [Scilit]
- Razmpoosh, M.H.; Langelier, B.; Marzbanrad, E.; Zurob, H.S.; Biro, E. Atomic-scale investigation of liquid-metal-embrittlement crack-path: Revealing mechanism and role of grain boundary chemistry. Acta Mater. 2021, 204, 116519. [Google Scholar] [CrossRef] [Scilit]

Disclaimer/Publisher’s Note: The statements, opinions and data contained in all publications are solely those of the individual author(s) and contributor(s) and not of MDPI and/or the editor(s). MDPI and/or the editor(s) disclaim responsibility for any injury to people or property resulting from any ideas, methods, instructions or products referred to in the content. |
© 2026 by the authors. Licensee MDPI, Basel, Switzerland. This article is an open access article distributed under the terms and conditions of the Creative Commons Attribution (CC BY) license.