


Abstract
Pillared graphene can undergo origami-like folding under in-plane compression. Such folding reorients the graphene sheets and may change the heat transport pathway. Thus, the reverse nonequilibrium molecular dynamics method is used to investigate how in-plane compression affects directional thermal transport in pillared graphene at room temperature. Separate periodic supercells resolve heat transport along the in-plane and out-of-plane directions. Our results show that increasing the compressive strain to 0.26 reduces the in-plane thermal conductivity from 6.66 to 3.77 W m−1K−1 and increases the out-of-plane value from 1.30 to 2.02 W m−1K−1. Despite the out-of-plane conductivity increase, its area-weighted value remains close to the uncompressed reference, while the conductance proxies decrease by approximately 25% and 18% in the two directions. These results show that origami-like folding changes directional thermal transport in pillared graphene. The outcome of this study can provide insights into developing carbon nanomaterials with tunable thermal properties.
1. Introduction
Pillared graphene is a three-dimensional carbon nanostructure composed of graphene sheets interconnected by carbon nanotube (CNT) pillars. It was originally proposed for enhanced hydrogen storage [1]. Later experiments demonstrated the feasibility of its fabrication [2,3,4,5]. However, experimentally realized architectures do not fully reproduce the ordered geometric networks assumed in idealized models. Such idealized structures nevertheless provide a well-defined platform for examining the intrinsic effects of graphene–CNT networks. Their interconnected sheets and pillars create distinct heat-transfer pathways. The thermal response can therefore depend strongly on sheet orientation and pillar connectivity.
Understanding these structure-dependent thermal properties requires atomistic modeling at different levels of theory. First-principles calculations [6], ab initio molecular dynamics (AIMD) [7,8], and classical molecular dynamics (MD) [9] have all been applied to graphene-related systems. First-principles methods can resolve electronic structure and chemical bonding. AIMD further enables the finite-temperature evolution of atomic configurations to be examined. For example, Sangiovanni et al. used AIMD to identify atomic-scale reaction pathways during AlN growth on graphene [7]. Lundgren et al. applied AIMD to examine the thermal stability and mechanical response of two-dimensional InBi and graphene-containing heterostructures [8]. Classical MD can access larger systems and longer time scales [9]. It is therefore widely used to study deformation and thermal transport in extended graphene-based networks.
Previous classical MD studies have examined thermal transport in pillared graphene over a wide range of structural configurations [10,11,12,13,14,15,16,17,18,19,20,21,22,23]. Pillar height and inter-pillar spacing both affect in-plane and out-of-plane thermal conductivity [15]. Graphene–CNT junctions also play an important role. They connect one-dimensional CNTs and two-dimensional graphene through regions of complex local geometry. Phonon wave-packet calculations have revealed mode-dependent scattering at these junctions [10]. The influence of junction geometry is not always straightforward. For example, asymmetric junctions can enhance in-plane thermal transport [13]. Pillar chirality provides another means of tuning the thermal response [14]. Together, these studies establish a strong link between network geometry and directional thermal transport.
Most previous studies have focused on undeformed structures, while mechanical loading introduces another route for modifying thermal transport. Under uniaxial tension, thermal conductivity can increase, with the response depending on the junction bonding and pillar height [21]. Compression produces a markedly different deformation mode. Bending, folding, and rotation can accommodate substantial compressive strain [24,25,26,27]. A recent study [27] showed that in-plane compression can induce origami-like folding in pillared graphene. During compression, graphene sheets tilt and rotate as the network contracts in-plane. Pronounced out-of-plane corrugation also develops. These changes can alter the orientation and the length of heat-transfer pathways. Their effects on directional thermal transport, however, remain unclear.
This large geometric evolution also raises a second issue. Thermal conductivity must be interpreted carefully in a highly deformable porous architecture [15]. In Fourier’s law, the cross-sectional area may include the pore space. The calculated quantity then represents the effective thermal conductivity of the whole architecture [17]. During compression, both the cross-sectional area and the transport length change. The dimensions used to evaluate conductivity are therefore not constant. This can lead to an apparent increase in effective conductivity even when the overall heat-transfer capability decreases. The issue is especially relevant to folded pillared graphene. In-plane shortening is accompanied by changes in transverse and out-of-plane dimensions [27]. Meanwhile, graphene sheets rotate relative to the transport directions. A conductivity value alone may therefore be insufficient to describe the thermal response during large deformation.
In this study, classical MD simulations are used to investigate the coupled structural and thermal response of pillared graphene under in-plane compression. Separate elongated supercells are used to evaluate transport along two directions. One is parallel to the compression direction. The other is perpendicular to the original graphene planes. Effective thermal conductivity is examined together with area-weighted conductivity and a conductance proxy. Changes in transverse dimensions and local graphene orientation are also analyzed. This study aims to clarify how compression-induced folding affects directional thermal transport. The outcome of this study can provide insights into the design of deformable carbon architectures with tunable thermal responses.
2. Materials and Methods
All MD simulations are performed using LAMMPS version 24 Aug 2024 (Sandia National Laboratories, Albuquerque, NM, USA) [28], and atomic configurations are visualized using OVITO Basic version 3.16.0 (OVITO GmbH, Darmstadt, Germany) [29]. Interatomic interactions are described by the adaptive intermolecular reactive empirical bond-order (AIREBO) potential [30]. The cutoff distance of the REBO term is set to 2.0 Å, consistent with the modified potential adopted in previous studies [31,32,33,34,35]. Periodic boundary conditions are imposed in all three directions. The following subsections describe model construction, thermal conductivity calculation, and structural characterization.
2.1. Model Construction
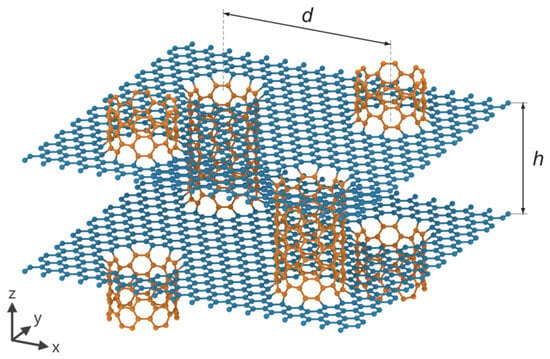
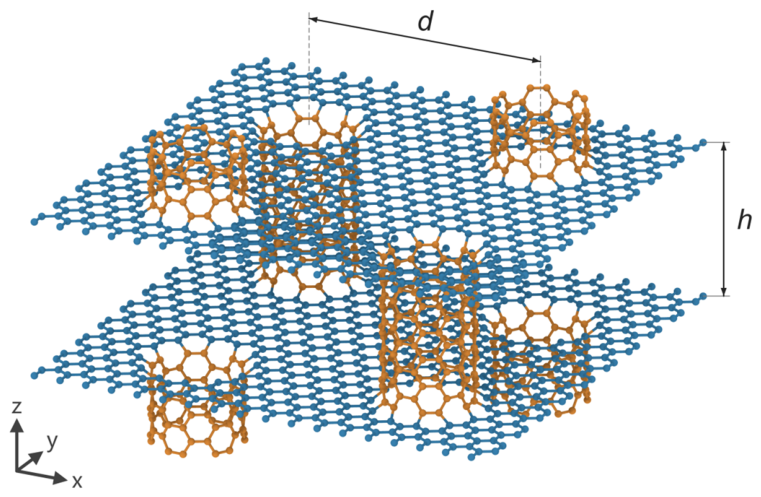
Figure 1 depicts the periodic unit cell of pillared graphene. It consists of stacked graphene sheets interconnected by vertically aligned armchair (6,6) CNTs. Heptagonal carbon rings at the graphene–CNT junctions provide covalent connectivity [23]. The geometry is characterized by two parameters: the inter-pillar spacing d and the pillar height h. A representative unit cell with d ≈ 2.2 nm and h ≈ 1.4 nm, containing 1776 carbon atoms, is selected for thermal transport analyses. Since previous studies have examined how these dimensions affect thermal transport [11,15,17], the present study focuses on compression-induced changes at this fixed initial geometry. The selected geometry also supports the folding deformation reported under in-plane compression [27].
Figure 1.
Periodic unit cell of pillared graphene, showing inter-pillar spacing d and pillar height h. Blue and orange atoms represent graphene and CNTs, respectively.
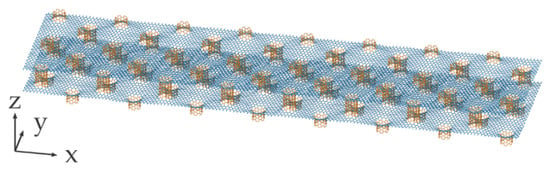
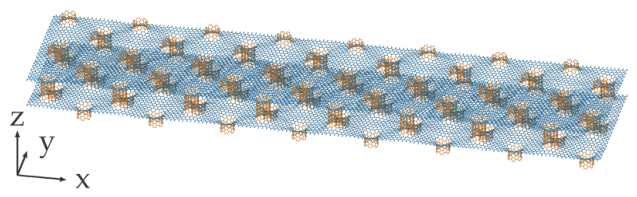
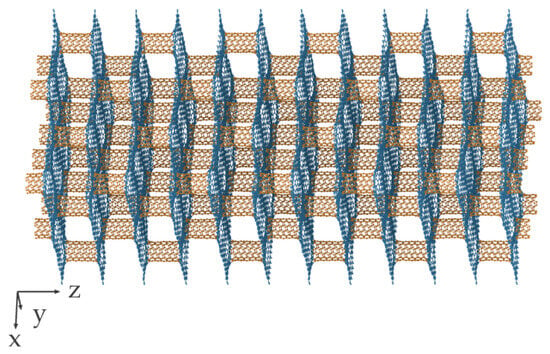
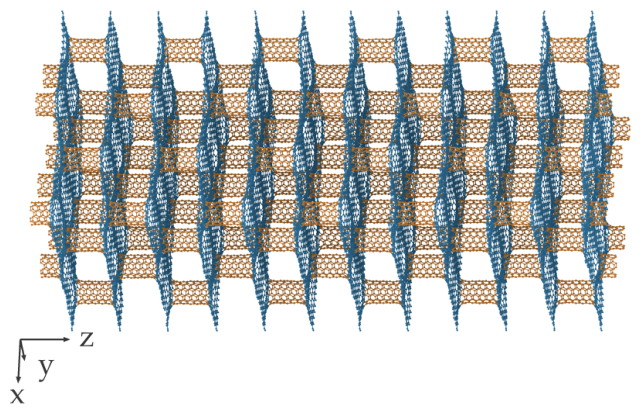
Two supercells are constructed to investigate thermal transport along the in-plane direction and the out-of-plane direction (Figure 2 and Figure 3). The in-plane model comprises an 8 × 2 × 1 supercell containing 28,416 atoms, while the out-of-plane model has a 2 × 2 × 6 supercell containing 42,624 atoms. Both models are compressed along the x-axis before heat transport is imposed. Note that their thermal conductivities are interpreted as finite-size model results rather than components of a converged intrinsic conductivity tensor.
Figure 2.
The 8 × 2 × 1 supercell used to calculate in-plane thermal transport along the x-axis.
Figure 3.
The 2 × 2 × 6 supercell used to calculate out-of-plane thermal transport along the z-axis.
Each supercell is first energy-minimized using the conjugate gradient method. A relative energy tolerance of 10−10, a force tolerance of 10−10 eV Å−1, and maximum iteration and force-evaluation counts of 5000 are used [36,37]. The system is then relaxed for 1 ns at 300 K, with the normal pressures maintained at zero along all three axes. A time step of 1 fs is used.
Following equilibration, uniaxial compression is applied along the x-axis at a strain rate of 0.001 ps−1, selected with reference to previous MD studies [38,39,40]. During loading, the temperature is maintained at 300 K, while the normal pressures along the y- and z-axes are controlled at zero. Six deformed configurations are taken as initial states for subsequent thermal transport calculations. The compressive strain is calculated as ε = 1 − Lx/Lx0, where Lx0 is the relaxed x-direction box length of the corresponding uncompressed supercell. The selected states correspond to approximately ε = 0, 0.05, 0.10, 0.14, 0.19, 0.23, and 0.26.
2.2. Thermal Conductivity Calculation
Thermal conductivity is calculated using the reverse nonequilibrium MD method [41]. For each selected configuration, the simulation-box dimensions are fixed. The system then evolves for 0.5 ns under microcanonical integration before velocity exchanges begin. A time step of 0.5 fs is used.
As shown in Figure 4, the simulation box is divided into 50 equal-width slabs along the transport direction. Every 50 time steps, the velocity of the atoms in slab 1 is exchanged with that in slab 26. This procedure establishes the cold and hot exchange regions, respectively. The cumulative exchanged energy is recorded. The selection of this velocity exchange interval was based on previous studies [34,41,42]. Periodic boundary conditions generate two heat-flow branches, so the heat current assigned to either branch is one-half of the total exchange power.
Figure 4.
Schematic of the reverse nonequilibrium molecular dynamics method.
Each thermal calculation lasts 3 ns. The first 2 ns are used to establish the stable temperature profile, and the final 1 ns is used for averaging. For each atom, the kinetic-temperature estimator is 2Ek/(3kB), where Ek is its kinetic energy, and kB is the Boltzmann constant. Slab temperatures are sampled every ten time steps and averaged over 100 samples, producing one spatial profile every 0.5 ps. The exchange power, Q, is obtained from the slope of a linear fit to the cumulative exchanged energy, Eswap, over the same 2–3 ns interval:
The effective thermal conductivity is calculated as
where A is the cross-sectional area normal to the transport direction, and g is the mean absolute temperature gradient along the two branches. The areas are defined as Ax = LyLz and Az = LxLy, using the current box dimensions and including pore space. No conventional graphene thickness is introduced. The reported thermal conductivity therefore characterizes the entire porous architecture at the simulated dimensions.
The temperature gradients are obtained by independently fitting the two branches using ordinary least squares. The primary fitting regions comprise slabs 4–23 and 29–48, excluding the exchange slabs and their immediate surroundings. Alternative fits over slabs 2–25 and 27–50, and slabs 6–21 and 31–46, are also evaluated to assess sensitivity to the fitting window. These checks are reported in Supplementary Materials S2. To quantify temporal variability, the 1 ns production interval is divided into five 0.2 ns blocks, and thermal conductivity is recalculated within each block. Error bars represent the sample standard deviation of these five values.
2.3. Structural Characterization
To complement effective thermal conductivity with measures that explicitly account for specimen dimensions, two additional quantities are evaluated:
where i denotes the transport direction. The area-weighted thermal conductivity, Bi, has units of W m K−1. The conductance proxy, Γi, is defined using the full periodic box length, Li, and has units of W K−1. Using the length of a single heat-flow branch, Li/2 would yield 2Γi, without changing its normalized strain dependence. Because κi is obtained from the interior temperature gradient, Γi excludes the additional temperature drops at the exchange regions. Both quantities depend on specimen dimensions and deformation and should therefore not be regarded as intrinsic material properties.
An asterisk denotes normalization by the corresponding uncompressed value for the same transport model. The normalized quantities satisfy the following:
These identities separate the measured exchange power, geometric, and gradient factors algebraically. They do not identify independent causal contributions because the factors can change together as the structure deforms.
To relate the transport response to compression-induced structural changes, local graphene orientation is quantified. Neighbor vectors are calculated using the minimum-image convention under periodic boundary conditions. The local unit normal, n, is defined as the eigenvector associated with the smallest eigenvalue of the sum of the bond-vector outer products. The orientation descriptors are
where ni is the component of n along direction i. Angle brackets denote averaging first over eligible graphene atoms and then over the two sampled configurations. The descriptor Si quantifies the alignment of direction i with the local sheet tangent plane. θ measures the tilt of the local normal relative to the original z-direction. These quantities describe orientation and do not represent phonon populations or mode-resolved heat currents.
3. Results
3.1. Compressive Mechanical Response
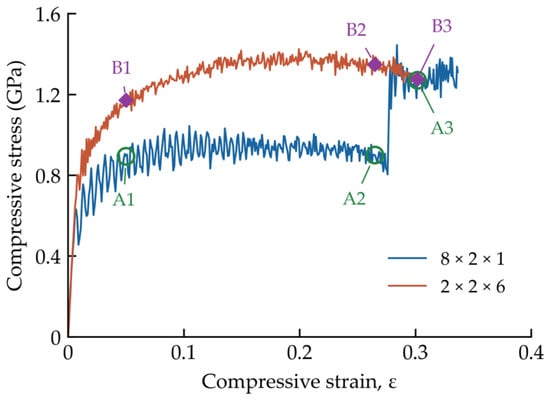
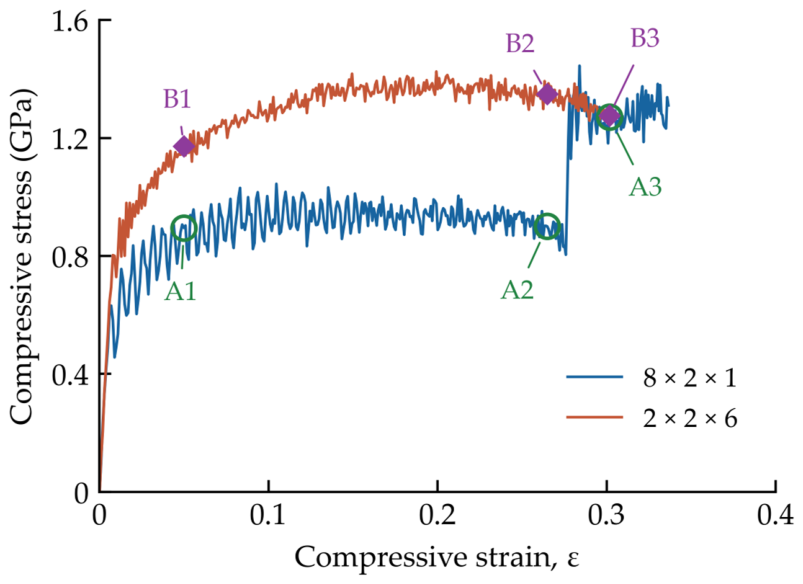
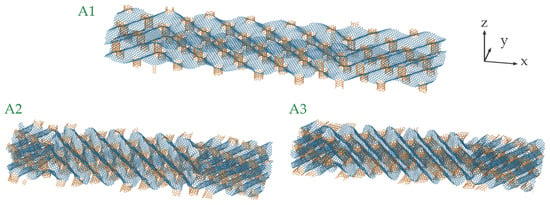
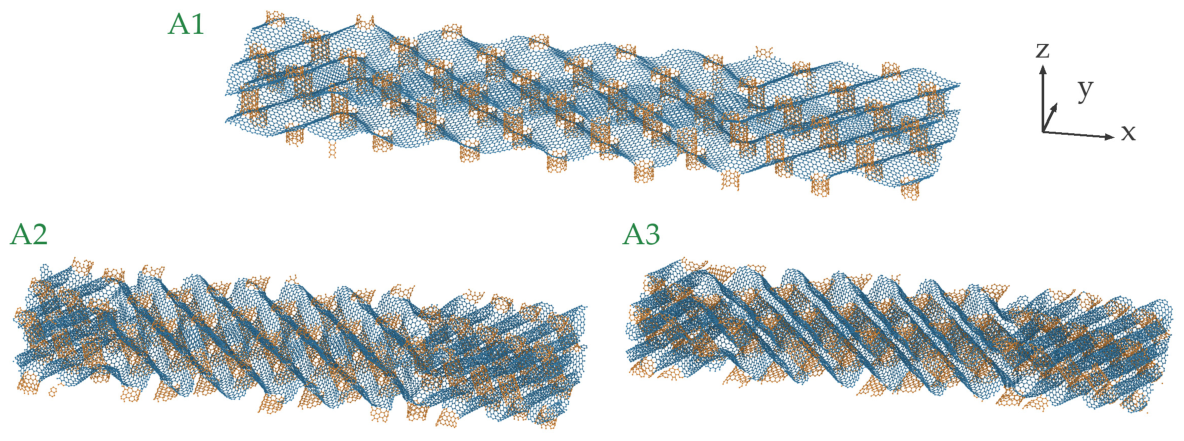
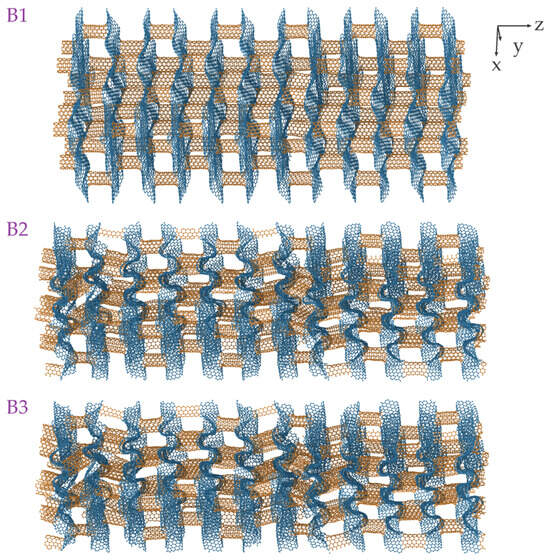
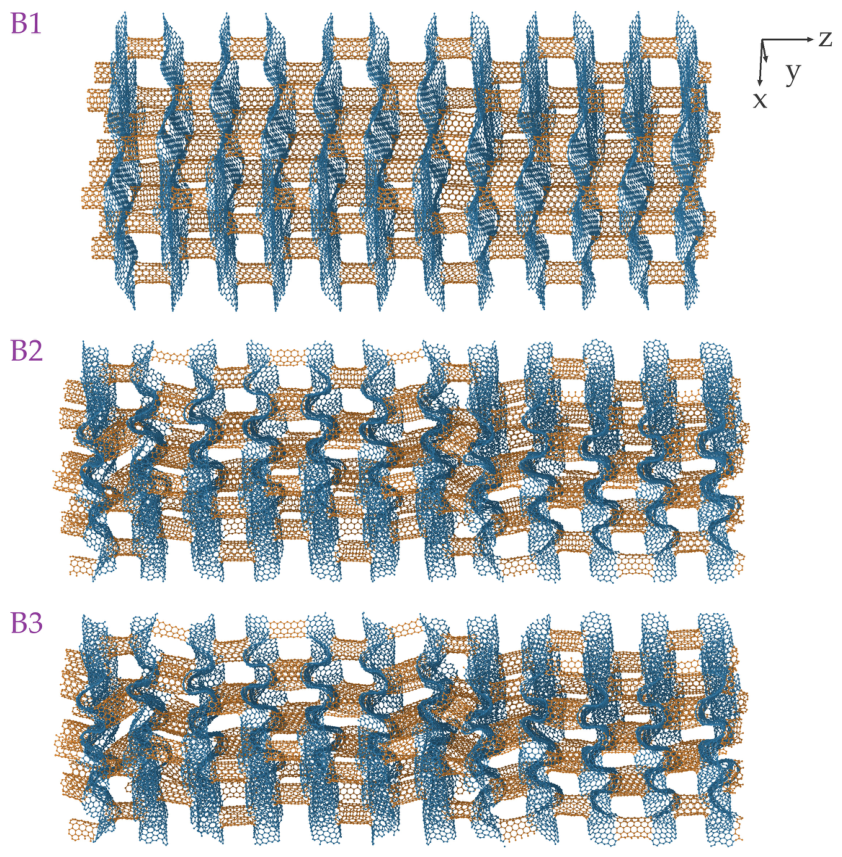
The compressive mechanical response can provide the structural basis for the subsequent thermal analysis. Figure 5 compares the two supercell models under x-directed compression. Both models exhibit a rapid initial increase in stress. Their tangent stiffness then decreases as deformation progresses. The compressive stress is defined as the instantaneous box-averaged axial pressure, pxx, with compression taken as positive. Three strains are selected for comparison: 0.05, 0.26, and 0.30. A1–A3 denote the corresponding configurations of the 8 × 2 × 1 model, while B1–B3 denote those of the 2 × 2 × 6 model.
Figure 5.
Compressive stress–strain curves for the 8 × 2 × 1 and 2 × 2 × 6 models. Green open circles A1–A3 and purple diamonds B1–B3 identify matched strains of approximately 0.05, 0.26, and 0.30.
The 8 × 2 × 1 model exhibits an extended stress plateau. Between ε = 0.05 and 0.26, the stress ranges from 0.78 to 1.04 GPa, with a mean value of 0.93 GPa. Substantial compression is thus accommodated without a sustained increase in stress. The 2 × 2 × 6 model shows a similar reduction in tangent stiffness over this strain range. However, its mean stress is higher, at approximately 1.33 GPa. The difference in stress level is mainly associated with the different supercell lengths along the compression direction.
Figure 6 illustrates the structural evolution of the 8 × 2 × 1 model. At A1, the graphene sheets develop corrugation and rotation between neighboring CNT pillars. At A2, inclined graphene regions and repeated folds become more pronounced. In-plane shortening is therefore accommodated largely through bending and rotation of the graphene sheets. This morphology is consistent with the origami-like folding reported previously [27]. Folding is accompanied by changes in the transverse dimensions. At A2, Ly/Ly0 = 0.83 and Lz/Lz0 = 1.17. A pronounced structural rearrangement occurs around ε = 0.28, followed by a renewed increase in stress. At A3, the instantaneous stress reaches 1.27 GPa. Meanwhile, Lz/Lz0 falls to about 0.94, corresponding to a height reduction of about 19% relative to A2. The A3 configuration therefore represents a more compact state beyond the principal folding plateau.
Figure 6.
Origami-like folding in the 8 × 2 × 1 model under in-plane compression. A1, A2, and A3 correspond to the markers at strains of approximately 0.05, 0.26, and 0.30 in Figure 5.
The 2 × 2 × 6 model exhibits the same overall folding pattern (Figure 7). Graphene sheets also undergo corrugation, tilting, and repeated folding between the CNT pillars. The main difference lies in the evolution of the transverse dimensions rather than in the folding morphology itself. The instantaneous stresses at B1, B2, and B3 are 1.17, 1.35, and 1.28 GPa, respectively. The height of this model changes only slightly at high strain. Specifically, Lz/Lz0 changes from 1.198 at B2 to 1.195 at B3. In contrast, the 8 × 2 × 1 model undergoes a pronounced height reduction over the same strain interval. Thus, the two models share the same basic folding mechanism but differ in their finite-size mechanical response and transverse dimensional evolution. These differences are considered when their thermal responses are compared below.
Figure 7.
Origami-like folding in the 2 × 2 × 6 model under in-plane compression. B1, B2, and B3 correspond to the markers at strains of approximately 0.05, 0.26, and 0.30 in Figure 5.
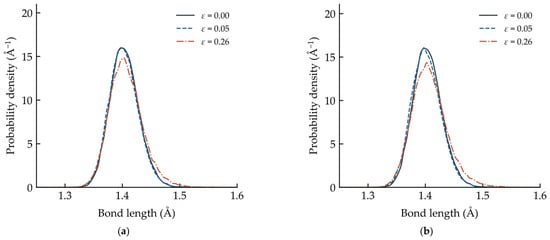
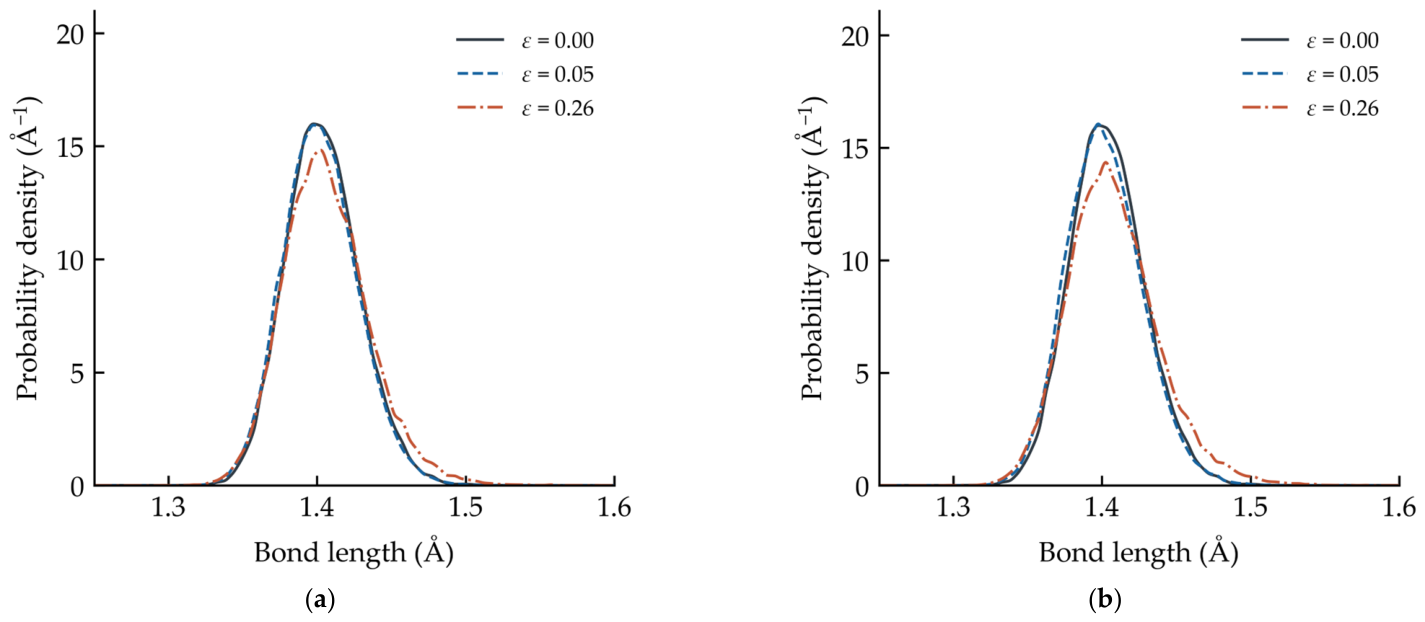
To quantify the evolution of bond length distributions during compression, Figure 8 compares the initial configuration with those at ε = 0.05 and 0.26. Neighboring carbon pairs are identified using the periodic minimum-image convention and a cutoff of 2.0 Å. Similar trends are observed in the two supercells. At ε = 0.05, the distributions nearly overlap with those of the initial configurations. At ε = 0.26, the main peaks decrease slightly in height and broaden toward larger distances. The peak positions shift only modestly, and no additional distinct peaks appear. These results indicate that compression causes only limited changes in the nearest-neighbor bond-length distribution. The large macroscopic strain is therefore accommodated primarily by bending, rotation, and folding of the graphene–CNT network rather than by pronounced C–C bond stretching.
Figure 8.
Evolution of bond length distributions in the (a) 8 × 2 × 1 and (b) 2 × 2 × 6 models.
3.2. Temperature Profiles and Folding-Induced Geometric Changes
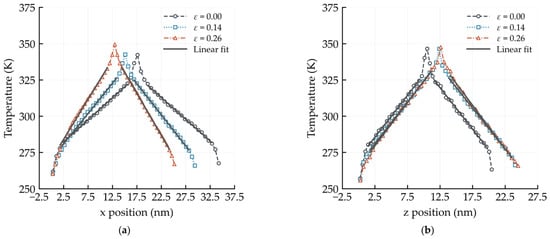
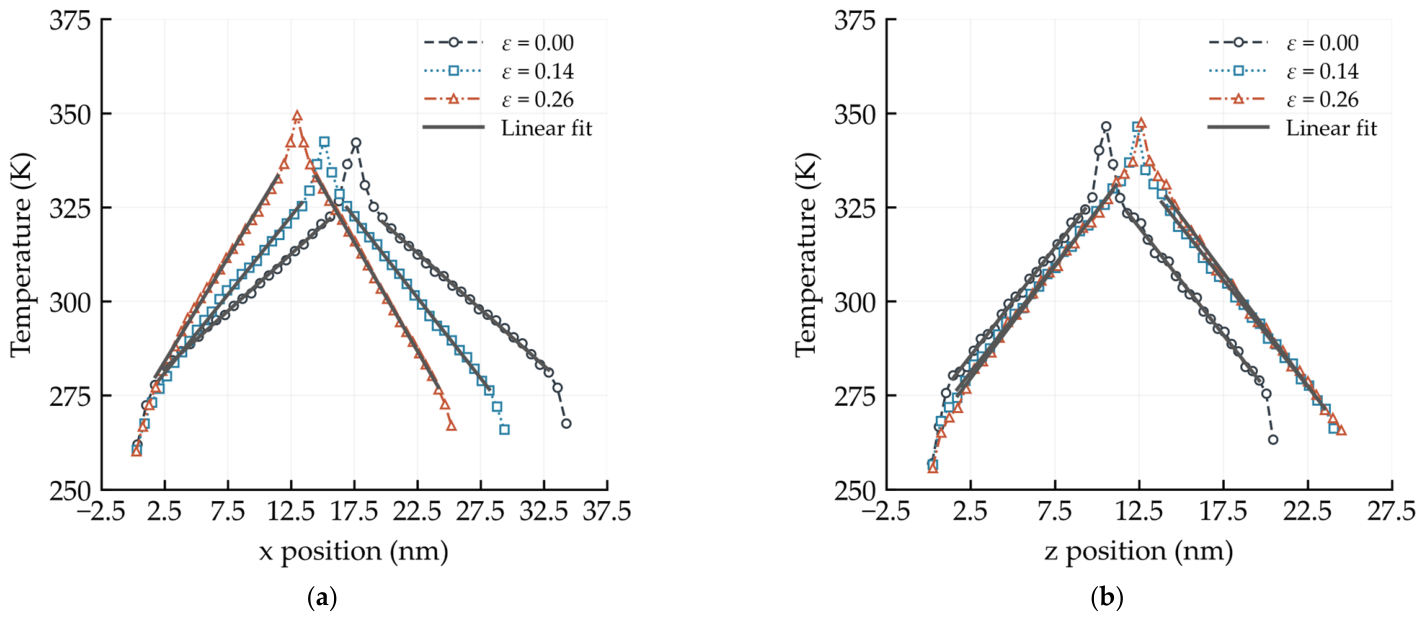
Figure 9 presents representative time-averaged temperature profiles of the two models under various strains. Both periodic heat-flow branches are approximately linear within the fitted interior regions. Their spatial extent changes with the simulation-box length along the transport direction. A separate length-sensitivity analysis is provided in Supplementary Materials S1. The uncompressed in-plane thermal conductivity increases from 6.66 to 7.46 W m−1K−1 when the transport length is increased from 8 to 12 unit-cell repeats. This increase of approximately 12% indicates a residual finite-size dependence. The reported conductivities are therefore treated as effective values of the simulated finite-size models. They are not regarded as fully converged intrinsic conductivities. The mean production temperatures remain close to 300 K through the investigated strain range. They range from 301.25 to 304.64 K for x-directed transport and from 300.79 to 302.23 K for z-directed transport. The thermal responses can therefore be compared under consistent near-room-temperature conditions.
Figure 9.
Time-averaged temperature profiles of pillared graphene at selected compressive strains: (a) in-plane transport along x and (b) cross-plane transport along z. Symbols and dashed line styles represent simulation data at ε = 0.00, 0.14, and 0.26. Gray solid lines indicate linear fits to the interior regions away from the hot and cold slabs.
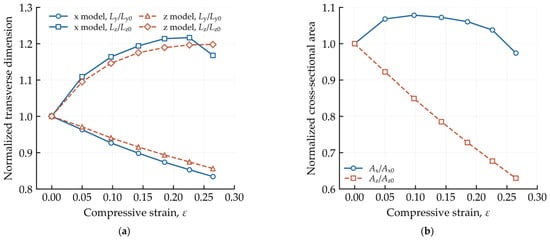
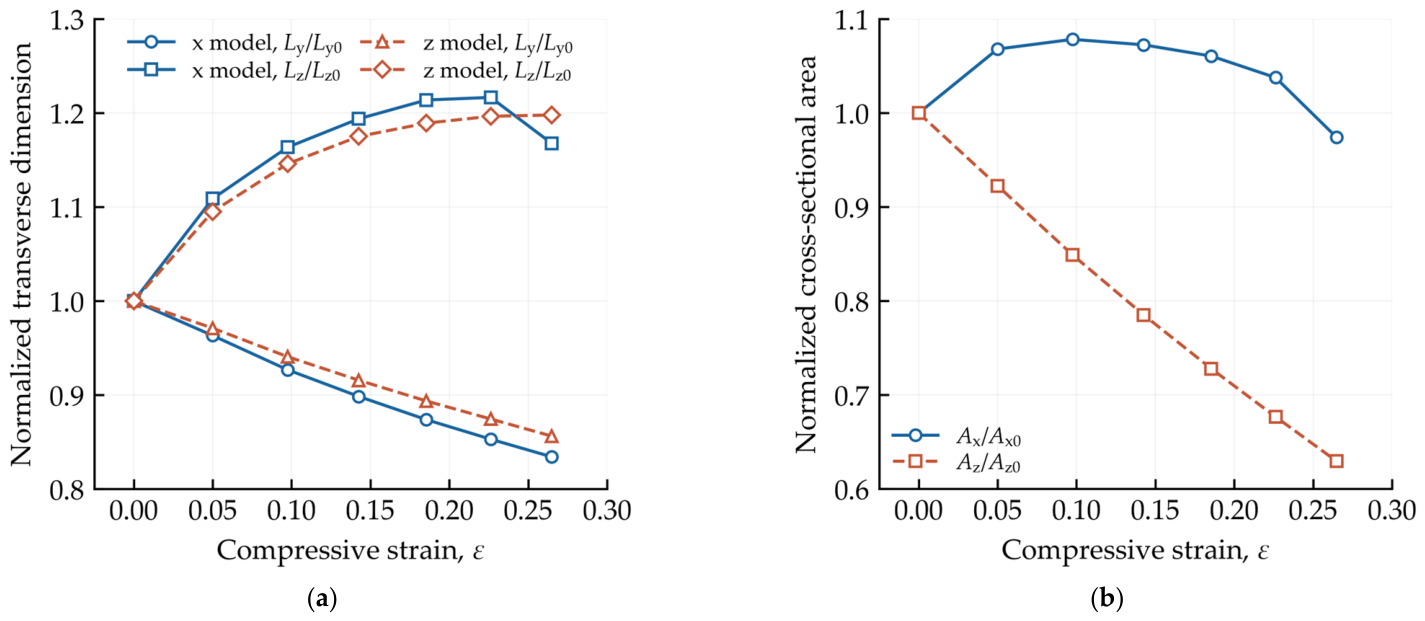
To characterize the geometric changes during compression, the box dimensions are evaluated. At ε = 0.26, the x-transport model has normalized transverse dimensions Ly/Ly0 = 0.83 and Lz/Lz0 = 1.17. The corresponding values for the z-transport model are approximately 0.86 and 1.20 (Figure 10a). These values are consistent with the folding configurations discussed in Section 3.1. The geometric changes directly affect the cross-sectional areas used in Fourier’s law. For x-directed transport, contraction along y partly offsets expansion along z. This gives Ax/Ax0 = 0.97 at ε = 0.26. For z-directed transport, contraction along both x and y reduces Az/Az0 to approximately 0.63 (Figure 10b). The area reduction is therefore much stronger for z-directed transport.
Figure 10.
Folding-induced structural changes in pillared graphene: (a) normalized transverse box dimensions and (b) normalized cross-sectional areas; Ax = LyLz and Az = LxLy. All quantities are normalized by their corresponding uncompressed values.
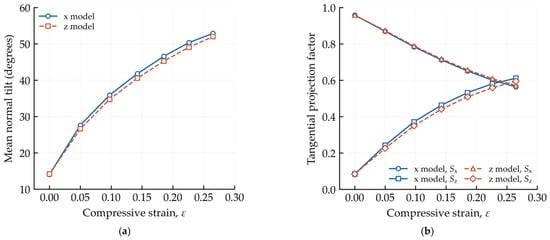
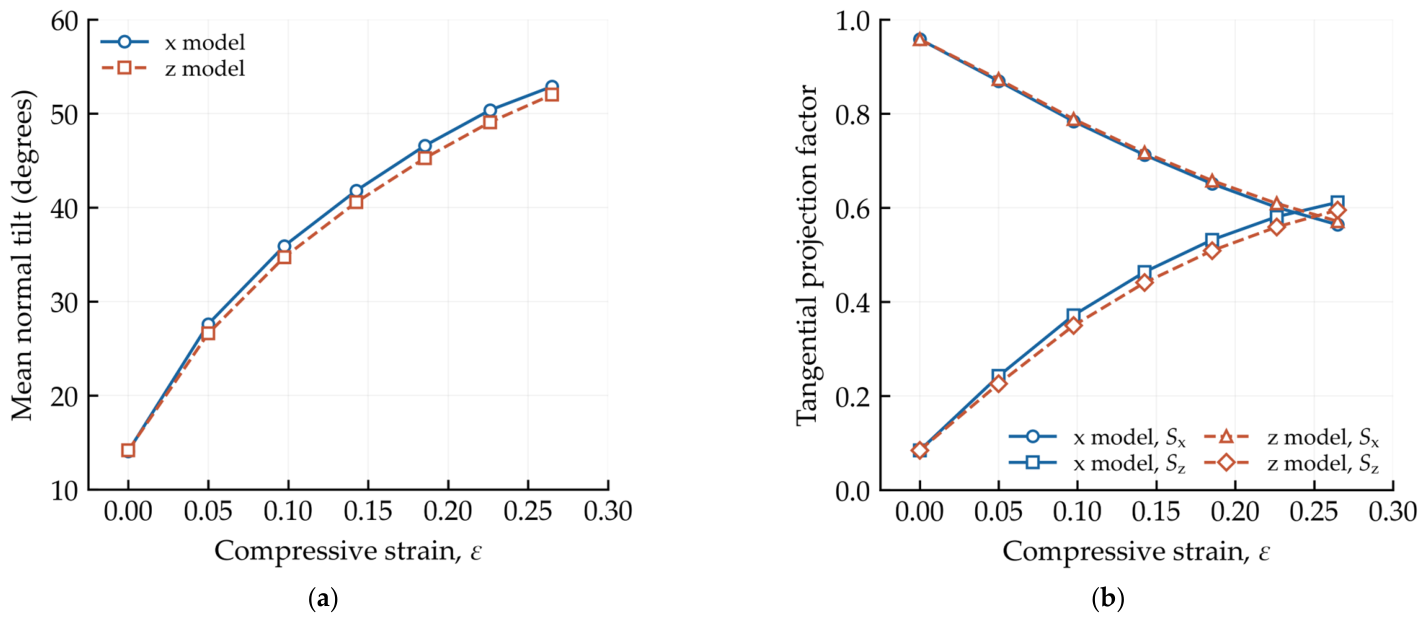
The local graphene normals provide a complementary measure of folding-induced reorientation. From ε = 0.00 to approximately 0.26, the mean normal tilt increases from 14.1° to 52.9° in the x-transport model. It increases from 14.2° to 52.0° in the z-transport model (Figure 11a). In the x-transport model, Sx decreases from approximately 0.96 to 0.56. Meanwhile, Sz increases from 0.08 to 0.61 (Figure 11b). These changes show that the local graphene tangent planes become less aligned with x and more aligned with z. The orientation changes occur together with substantial geometric deformation. They should therefore be interpreted as structural descriptors rather than independent predictors of thermal conductivity. Their relationship with the directional thermal response is examined below.
Figure 11.
Folding-induced reorientation of graphene in pillared graphene: (a) mean graphene normal tilt and (b) tangential projection factors Sx and Sz.
3.3. Directional Thermal Conductivity
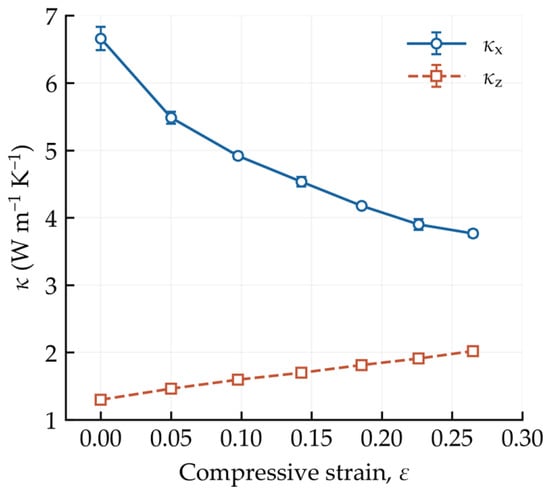
Table 1 and Figure 12 summarize the thermal conductivities across the seven investigated strain states. As ε increases from 0.00 to 0.26, κx decreases from 6.66 to 3.77 W m−1K−1. This corresponds to a reduction of 43.4%. In contrast, κz increases from 1.30 to 2.02 W m−1K−1. The corresponding increase is 55.4%. The decrease in κx is more pronounced at small strains. It becomes more gradual as folding develops. In contrast, κz increases approximately monotonically over the investigated range.
Table 1.
Compressive strain, effective thermal conductivity, conductivity ratio, and mean production temperature for each transport model. Uncertainties are temporal block standard deviations.
Figure 12.
Effective thermal conductivities of the x- and z-transport models across the investigated strain states. Error bars represent the sample standard deviation of five temporal block values.
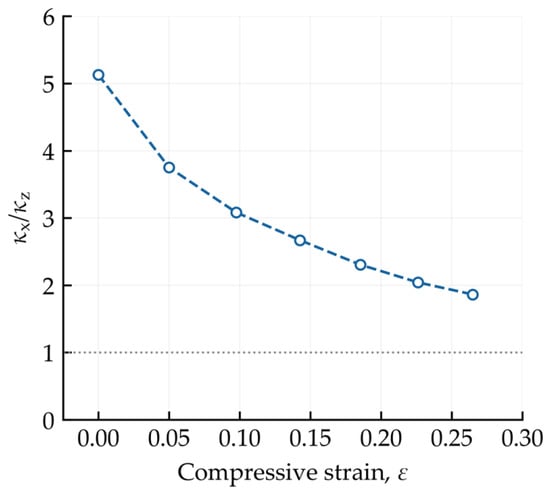
The conductivity trends can be compared with the orientation descriptors in Figure 11. Over the same strain interval, Sx decreases from approximately 0.96 to 0.56, while κx decreases by 43.4%. In contrast, Sz increases from approximately 0.08 to 0.61, while κz increases by 55.4%. These parallel trends show a clear correlation between graphene reorientation and directional thermal response. However, the geometric dimensions also change simultaneously. The conductivity changes therefore cannot be attributed to orientation alone. The opposing trends reduce the conductivity ratio, κx/κz, from 5.13 to 1.86 (Figure 13). The ratio remains above unity throughout the investigated strain range, indicating that the x-transport model retains the higher effective conductivity.
Figure 13.
Ratio of the effective thermal conductivities obtained from the x- and z-transport models.
3.4. Area-Weighted Thermal Conductivity
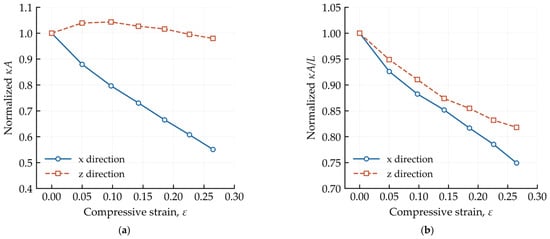
The effective conductivity contains a geometric normalization through the current cross-sectional area. To examine this effect, the area-weighted conductivity is evaluated. As shown in Figure 14a, Bx decreases to approximately 0.55Bx0 at ε = 0.26. In contrast, Bz remains close to its initial value. It reaches 0.98Bz0 at the same strain. This result changes the interpretation of the increasing κz. At ε = 0.26, Az/Az0 decreases to approximately 0.63. The increase in effective κz therefore occurs together with a nearly unchanged area-weighted quantity. The strong cross-sectional contraction makes an important contribution to the calculated effective conductivity.
Figure 14.
Area-weighted thermal conductivity and conductance of compressed pillared graphene: (a) normalized Bi = κiAi and (b) normalized conductance proxy Γi = κiAi/Li for the x- and z-directions. All quantities are normalized by their respective uncompressed values.
Including the axial transport length yields the conductance proxies shown in Figure 14b. At ε = 0.26, Γx/Γx0 = 0.75 and Γz/Γz0 = 0.82. Both values are below unity. For the z-transport model, the inverse-area factor, Az0/Az, is approximately 1.59, while Bz/Bz0 is 0.98. Their product accounts algebraically for the increase in effective conductivity. However, the approximately 19.8% increase in Lz, together with the slight decrease in Bz, reduces Γz. For x-directed transport, axial shortening partly offsets the decline in Bx. Nevertheless, Γx also decreases. Thus, the two directions show opposite trends in effective conductivity but the same decreasing trend in the conductance proxy. These results demonstrate an important distinction. An increase in effective thermal conductivity does not necessarily indicate improved specimen-level heat transfer in a deforming porous architecture. The evolving geometry must also be considered.
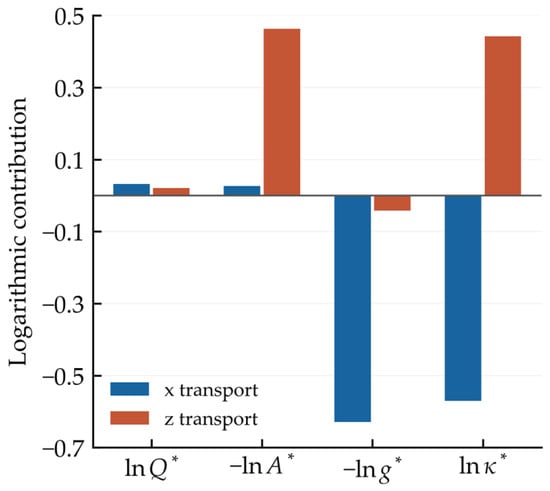
To clarify how the measured factors combine, Figure 15 presents the logarithmic form of Equation (5) at ε = 0.26. The exchange-power terms are comparatively small in both models. For z-directed transport, the positive inverse-area term outweighs the negative temperature-gradient term, accounting for the increase in effective conductivity. For x-directed transport, the negative term associated with the increasing gradient dominates, yielding a net conductivity decrease.
Figure 15.
Logarithmic decomposition of normalized effective conductivity at ε = 0.26. Contributions are calculated separately for the two transport models.
3.5. Vibrational Spectral Characteristics
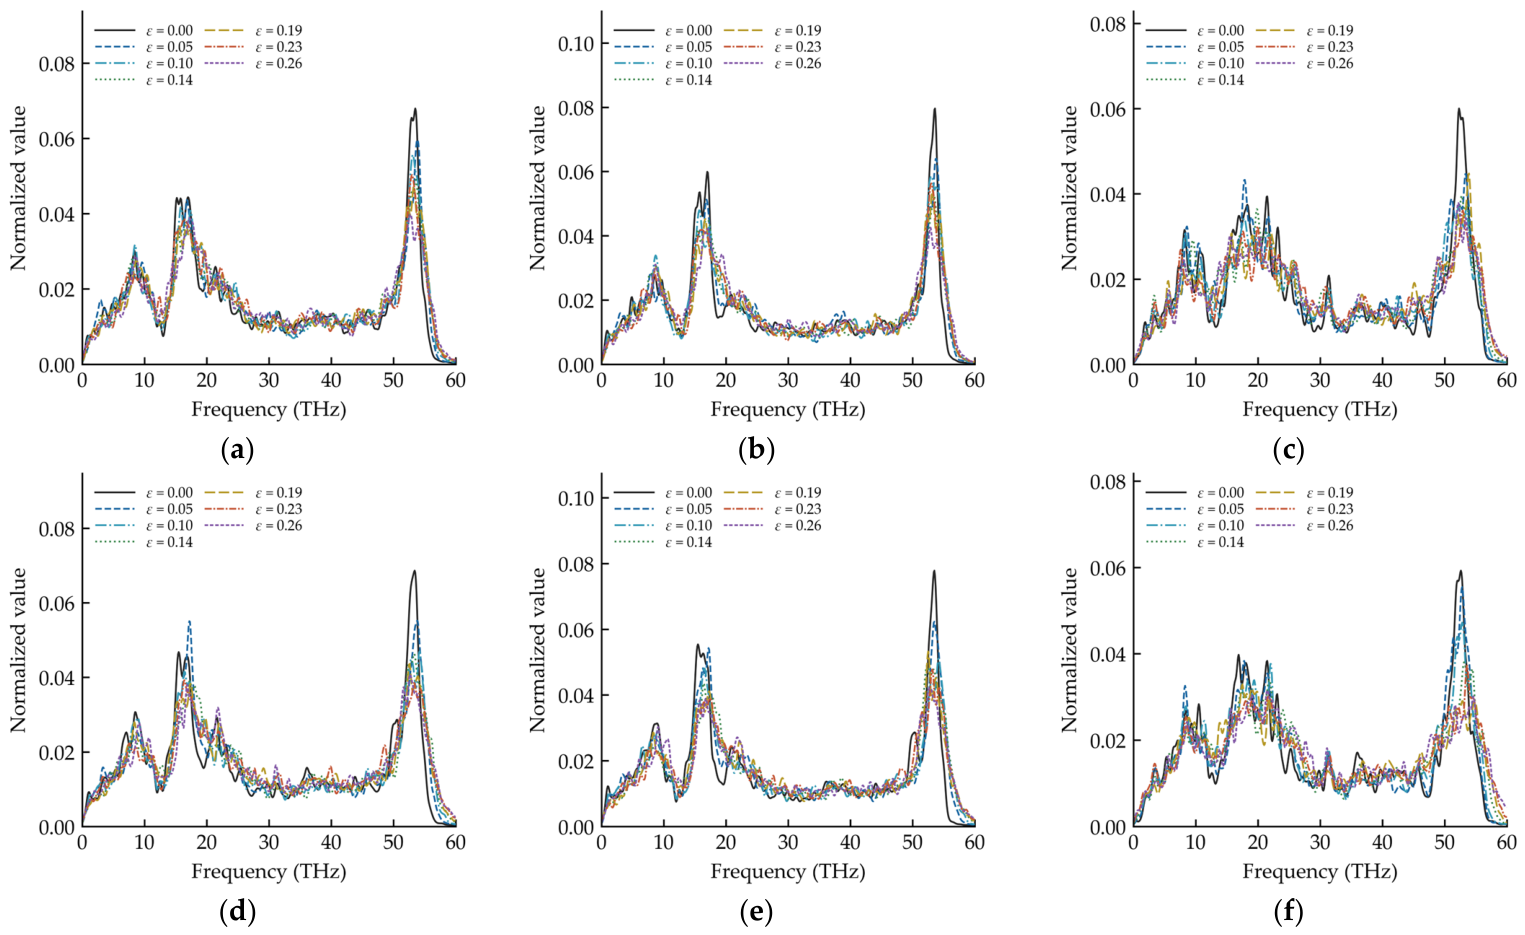
To complement the geometric and thermal analyses, the frequency content of the archived velocity-autocorrelation signals [43] is examined. Separate spectra are evaluated for the complete structure, graphene, and CNT groups in each transport model. Each spectrum is normalized by its integrated intensity over 0–60 THz. A Gaussian kernel with a standard deviation of 0.25 THz is used for smoothing.
As shown in Figure 16, the complete-structure spectrum of the x-transport model retains a dominant high-frequency feature throughout compression. The peak positions are 53.5, 53.8, 53.1, 53.6, 53.3, 53.0, and 52.7 THz across the seven strain states. No monotonic peak shift is observed. The spectral centroid also remains within a relatively narrow range near 29–30 THz. These features indicate redistribution within the vibrational spectrum rather than a uniform shift of the entire spectrum.
Figure 16.
Vibrational spectra of pillared graphene at different compressive strains: (a–c) the complete structure, graphene, and CNT groups in the x-transport model, respectively; (d–f) the corresponding groups in the z-transport model.
The spectral weight below 10 THz decreases from 15.59% initially to 13.90% at ε = 0.26. The graphene spectrum retains a dominant high-frequency feature throughout the investigated range. The CNT spectrum also remains dominated mainly by high-frequency features. Its low-frequency weight is approximately 13.1–13.5% at strains up to ε = 0.14. It decreases to approximately 12.0–12.1% at ε = 0.19–0.26. Thus, graphene and CNT components do not undergo identical spectral redistribution during compression.
The z-transport model exhibits stronger competition between high- and intermediate-frequency features. For the complete structure, the dominant peak occurs at approximately 53.4, 53.8, 54.2, 53.3, and 52.6 THz for the first five states. It shifts to approximately 16.4 THz at ε = 0.23 and returns to approximately 52.7 THz at ε = 0.26. The spectral centroid nevertheless remains near 29–30 THz. This behavior reflects changes in the relative intensity of existing spectral features rather than continuous softening of a single mode.
The graphene component retains a high-frequency dominant feature over the entire investigated strain range. The CNT component shows stronger spectral competition. Its dominant peak occurs near 52.6–53.1 THz at small strains. It changes to approximately 17.5 THz at ε = 0.19, returns to 53.6 THz at ε = 0.23, and shifts to approximately 21.5 THz at ε = 0.26.
The spectral changes provide complementary information on the thermal response. In the x-transport model, the decrease in κx is accompanied by an overall reduction in low-frequency spectral weight. This correspondence is consistent with compression-induced vibrational redistribution. However, the z-transport model behaves differently. Its effective conductivity increases without a systematic increase in low-frequency spectral weight. The increase in κz therefore cannot be explained by a simple enhancement of low-frequency vibrational contributions.
4. Discussion
The results show that origami-like folding is accompanied by pronounced changes in graphene orientation and directional thermal response. Both supercells exhibit the same basic folding morphology, although their transverse dimensional responses differ. From ε = 0.00 to approximately 0.26, Sx decreases together with κx, whereas Sz increases together with κz. This correspondence is consistent with progressive graphene reorientation during folding. However, orientation alone does not determine the conductivity because the specimen dimensions also evolve during compression.
The geometric contribution is particularly important for z-directed transport. At ε = 0.26, Az/Az0 decreases to approximately 0.63, while Bz/Bz0 remains close to unity. Thus, the increase in effective κz is strongly influenced by the changing cross-sectional area. The conductance proxy Γz still decreases. A similar decrease is observed for Γx. These results show that an increase in effective conductivity does not necessarily imply improved specimen-level heat transfer in a deforming porous architecture.
The structural and spectral analyses provide complementary information but do not isolate a unique microscopic mechanism. The nearest-neighbor C–C bond distributions remain largely preserved during the principal folding regime, indicating only modest bond-length changes. The VACF spectra show compression-induced vibrational redistribution. However, they do not directly provide phonon lifetimes, mean free paths, or modal heat currents. Junction scattering and defects may also influence thermal transport. For example, vacancy defects reduce thermal conductivity more strongly than Stone–Wales defects [23]. The present models do not include such additional defects. Their interaction with compression-induced folding therefore remains to be established.
Finite-size effects should also be considered when interpreting the results. The length-sensitivity analysis shows that the absolute in-plane conductivity has not reached full convergence. The reported conductivities are therefore treated as finite-size effective quantities rather than intrinsic tensor components. The conductivity ratio represents the directional contrast between the selected models. Within this scope, the results highlight the importance of geometric evolution when evaluating thermal transport in deformable graphene–CNT architectures. Similar considerations may also apply to other hybrid networks assembled from low-dimensional carbon components.
5. Conclusions
In summary, classical MD simulations were used to investigate the thermal response of pillared graphene under in-plane compression. Compression produces origami-like folding through bending and rotation of the interconnected graphene sheets. The two finite-size supercells show the same basic folding morphology, although their transverse dimensional responses differ. From ε = 0.00 to 0.26, the x-direction thermal conductivity is reduced by 43.4%, while the z-direction conductivity increases by 55.4%. Despite the increase in z-direction thermal conductivity, its area-weighted value remains close to the uncompressed reference, while the conductance proxies decrease in both directions. Effective conductivity enhancement therefore does not necessarily imply improved specimen-level heat transfer. Together, these findings show that folding alters directional thermal transport alongside changes in sheet orientation, cross-sectional area, and axial transport length. They highlight the importance of accounting for the evolving geometry when evaluating thermal performance and inform the design of deformable carbon architectures with tunable directional thermal responses. More broadly, these findings contribute to the understanding of coupled deformation and heat transport in graphene-based networks. They may also aid the interpretation and design of hybrid architectures assembled from graphene, CNTs, and other low-dimensional components.
Supplementary Materials
The following supporting information can be downloaded at: https://www.mdpi.com/article/10.3390/cryst16110697/s1. Figure S1: Length dependence of the uncompressed x-direction effective thermal conductivity; Table S1: Thermal conductivity of uncompressed models with different transport lengths; Table S2: Thermal conductivities from alternative slab-fitting windows.
Author Contributions
Conceptualization, P.S.; methodology, J.J.; software, J.J.; validation, J.J. and P.S.; formal analysis, J.J. and P.S.; investigation, J.J.; resources, Y.C. and Y.T.; data curation, J.J.; writing—original draft preparation, J.J. and P.S.; writing—review and editing, Y.C. and Y.T.; supervision, Y.C., Y.T. and J.F.; project administration, Y.C.; funding acquisition, Y.C. All authors have read and agreed to the published version of the manuscript.
Funding
This research was funded by the National Natural Science Foundation of China (grant number 52478144 and 52408181), the Natural Science Foundation of Jiangsu Province for Distinguished Young Scientists (grant number BK20231517), and the Natural Science Foundation of Jiangsu Province of China (grant number BK20230703).
Data Availability Statement
The data that support the findings of this study are available from the corresponding author upon reasonable request.
Acknowledgments
During the preparation of this manuscript, the authors used ChatGPT (GPT6-Astra; OpenAI, San Francisco, CA, USA) for the purposes of developing the post-processing scripts and drafting the manuscript. The authors have reviewed and edited the output and take full responsibility for the content of this publication.
Conflicts of Interest
The authors declare no conflicts of interest.
References
- Dimitrakakis, G.K.; Tylianakis, E.; Froudakis, G.E. Pillared graphene: A new 3-D network nanostructure for enhanced hydrogen storage. Nano Lett. 2008, 8, 3166–3170. [Google Scholar] [CrossRef] [Scilit] [PubMed]
- Paul, R.K.; Ghazinejad, M.; Penchev, M.J.; Lin, A.; Ozkan, M.; Ozkan, C.S. Synthesis of a pillared graphene nanostructure: A counterpart of three-dimensional carbon architectures. Small 2010, 6, 2309–2313. [Google Scholar] [CrossRef] [Scilit] [PubMed]
- Kamaliya, R.; Singh, B.P.; Gupta, B.K.; Singh, V.N.; Gupta, T.K.; Gupta, R.; Kumar, P.; Mathur, R.B. Large scale production of three-dimensional carbon nanotube pillared graphene network for bi-functional optical properties. Carbon 2014, 78, 147–155. [Google Scholar] [CrossRef] [Scilit]
- Wang, W.; Ruiz, I.; Guo, S.; Favors, Z.; Bay, H.H.; Ozkan, M.; Ozkan, C.S. Hybrid carbon nanotube and graphene nanostructures for lithium ion battery anodes. Nano Energy 2014, 3, 113–118. [Google Scholar] [CrossRef] [Scilit]
- Kondo, D.; Sato, S.; Awano, Y. Self-organization of novel carbon composite structure: Graphene multi-layers combined perpendicularly with aligned carbon nanotubes. Appl. Phys. Express 2008, 1, 074003. [Google Scholar] [CrossRef] [Scilit]
- Lindsay, L.; Li, W.; Carrete, J.; Mingo, N.; Broido, D.A.; Reinecke, T.L. Phonon thermal transport in strained and unstrained graphene from first principles. Phys. Rev. B 2014, 89, 155426. [Google Scholar] [CrossRef] [Scilit]
- Sangiovanni, D.G.; Gueorguiev, G.K.; Kakanakova-Georgieva, A. Ab initio molecular dynamics of atomic-scale surface reactions: Insights into metal organic chemical vapor deposition of AlN on graphene. Phys. Chem. Chem. Phys. 2018, 20, 17751–17761. [Google Scholar] [CrossRef] [Scilit] [PubMed]
- Lundgren, C.; Kakanakova-Georgieva, A.; Gueorguiev, G.K. A perspective on thermal stability and mechanical properties of 2D Indium Bismide from ab initio molecular dynamics. Nanotechnology 2022, 33, 335706. [Google Scholar] [CrossRef] [Scilit] [PubMed]
- Zhang, J.; Xu, F.; Hong, Y.; Xiong, Q.; Pan, J. A comprehensive review on the molecular dynamics simulation of the novel thermal properties of graphene. RSC Adv. 2015, 5, 89415–89426. [Google Scholar] [CrossRef] [Scilit]
- Lee, J.; Varshney, V.; Brown, J.S.; Roy, A.K.; Farmer, B.L. Single mode phonon scattering at carbon nanotube-graphene junction in pillared graphene structure. Appl. Phys. Lett. 2012, 100, 183111. [Google Scholar] [CrossRef] [Scilit]
- Park, J.; Prakash, V. Phonon scattering and thermal conductivity of pillared graphene structures with carbon nanotube-graphene intramolecular junctions. J. Appl. Phys. 2014, 116, 014303. [Google Scholar] [CrossRef] [Scilit]
- Shi, J.; Dong, Y.; Fisher, T.; Ruan, X. Thermal transport across carbon nanotube-graphene covalent and van der Waals junctions. J. Appl. Phys. 2015, 118, 044302. [Google Scholar] [CrossRef] [Scilit]
- Sakhavand, N.; Shahsavari, R. Asymmetric junctions boost in-plane thermal transport in pillared graphene. ACS Appl. Mater. Interfaces 2017, 9, 39122–39126. [Google Scholar] [CrossRef] [Scilit] [PubMed]
- Panneerselvam, V.; Anandakrishnan, A.; Sathian, S.P. Modeling the effect of chirality on thermal transport in a pillared-graphene structure. Phys. Chem. Chem. Phys. 2023, 25, 6184–6193. [Google Scholar] [CrossRef] [Scilit] [PubMed]
- Varshney, V.; Patnaik, S.S.; Roy, A.K.; Froudakis, G.; Farmer, B.L. Modeling of thermal transport in pillared-graphene architectures. ACS Nano 2010, 4, 1153–1161. [Google Scholar] [CrossRef] [Scilit] [PubMed]
- Xu, L.; Wei, N.; Zheng, Y.; Fan, Z.; Wang, H.; Zheng, J. Graphene-nanotube 3D networks: Intriguing thermal and mechanical properties. J. Mater. Chem. 2012, 22, 1435–1444. [Google Scholar] [CrossRef] [Scilit]
- Park, J.; Prakash, V. Thermal transport in 3D pillared SWCNT–graphene nanostructures. J. Mater. Res. 2013, 28, 940–951. [Google Scholar] [CrossRef] [Scilit]
- Yang, X.; Yu, D.; Cao, B.; To, A.C. Ultrahigh thermal rectification in pillared graphene structure with carbon nanotube–graphene intramolecular junctions. ACS Appl. Mater. Interfaces 2017, 9, 29–35. [Google Scholar] [CrossRef] [Scilit] [PubMed]
- Zhang, Z.; Kutana, A.; Roy, A.; Yakobson, B.L. Nanochimneys: Topology and thermal conductance of 3D nanotube–graphene cone junctions. J. Phys. Chem. C 2017, 121, 1257–1262. [Google Scholar] [CrossRef] [Scilit]
- Sihn, S.; Roy, A.K.; Farmer, B.L. Quantized prediction of coefficients of thermal expansion of 3-D CNT-graphene junctioned carbon nanostructures. Compos. Sci. Technol. 2018, 166, 46–53. [Google Scholar] [CrossRef] [Scilit]
- Park, J.; Pena, P.; Tekes, A. Thermal transport behavior of carbon nanotube–graphene junction under deformation. Int. J. Nanosci. 2020, 19, 1950013. [Google Scholar] [CrossRef] [Scilit]
- Yu, Z.; Feng, Y.; Feng, D.; Zhang, X. Thermal conductance bottleneck of a three dimensional graphene–CNT hybrid structure: A molecular dynamics simulation. Phys. Chem. Chem. Phys. 2020, 22, 337–343. [Google Scholar] [CrossRef] [Scilit] [PubMed]
- Panneerselvam, V.; Sathian, S.P. Thermal transport in a defective pillared graphene network: Insights from equilibrium molecular dynamics simulation. Phys. Chem. Chem. Phys. 2024, 26, 10650–10659. [Google Scholar] [CrossRef] [Scilit] [PubMed]
- Wang, Y.; Zhu, Y.; Wang, F.; Liu, X.; Wu, H. Super-elasticity and deformation mechanism of three-dimensional pillared graphene network structures. Carbon 2017, 118, 588–596. [Google Scholar] [CrossRef] [Scilit]
- Lin, Y.; Xu, K.; Cao, X.; Zhang, Z.; Wu, J. Role of nanotube chirality on the mechanical characteristics of pillared graphene. Mech. Mater. 2021, 162, 104035. [Google Scholar] [CrossRef] [Scilit]
- Zhao, Z.; Guo, W.; Zhang, Z. Room-temperature colossal elastocaloric effects in three-dimensional graphene architectures: An atomistic study. Adv. Funct. Mater. 2022, 32, 2203866. [Google Scholar] [CrossRef] [Scilit]
- Shi, P.; Chen, Y.; Xie, T.; Guo, T.; Feng, J.; Sareh, P. Origami folding enables ultrahigh and reversible mechanical energy storage in pillared graphene. Appl. Phys. Lett. 2026, 128, 101701. [Google Scholar] [CrossRef] [Scilit]
- Thompson, A.P.; Aktulga, H.M.; Berger, R.; Bolintineanu, D.S.; Brown, W.M.; Crozier, P.S.; Veld, P.; Kohlmeyer, A.; Moore, S.G.; Nguyen, T.D.; et al. LAMMPS simulation tool for particle-based materials modeling at the atomic, meso, and continuum scales. Comput. Phys. Commun. 2022, 271, 108171. [Google Scholar] [CrossRef] [Scilit]
- Stukowski, A. Visualization and analysis of atomistic simulation data with OVITO–The open visualization tool. Modell. Simul. Mater. Sci. Eng. 2010, 18, 015012. [Google Scholar] [CrossRef] [Scilit]
- Stuart, S.J.; Tutein, A.B.; Harrison, J.A. A reactive potential for hydrocarbons with intermolecular interactions. J. Chem. Phys. 2000, 112, 6472–6486. [Google Scholar] [CrossRef] [Scilit]
- Shenderova, O.A.; Brenner, D.W.; Omeltchenko, A.; Su, X.; Yang, L.H. Atomistic modeling of the fracture of polycrystalline diamond. Phys. Rev. B 2000, 61, 3877–3888. [Google Scholar] [CrossRef] [Scilit]
- Zhang, Y.; Gu, Y. Mechanical properties of graphene: Effects of layer number, temperature and isotope. Comput. Mater. Sci. 2013, 71, 197–200. [Google Scholar] [CrossRef] [Scilit]
- Zhao, H.; Min, K.; Aluru, N.R. Size and chirality dependent elastic properties of graphene nanoribbons under uniaxial tension. Nano Lett. 2009, 9, 3012–3015. [Google Scholar] [CrossRef] [Scilit] [PubMed]
- Cai, J.; Akbarzadeh, A. Hierarchical kirigami-inspired graphene and carbon nanotube metamaterials: Tunability of thermo-mechanic properties. Mater. Des. 2021, 206, 109811. [Google Scholar] [CrossRef] [Scilit]
- Zhao, H.; Aluru, N.R. Temperature and strain-rate dependent fracture strength of graphene. J. Appl. Phys. 2010, 108, 064321. [Google Scholar] [CrossRef] [Scilit]
- Shi, P.; Chen, Y.; Wei, Y.; Feng, J.; Guo, T.; Tu, Y.; Sareh, P. Deformation response of highly stretchable and ductile graphene kirigami under uniaxial and biaxial tension. Phys. Rev. B 2023, 108, 134105. [Google Scholar] [CrossRef] [Scilit]
- Shi, P.; Chen, Y.; Feng, J.; Sareh, P. Highly stretchable graphene kirigami with tunable mechanical properties. Phys. Rev. E 2024, 109, 035002. [Google Scholar] [CrossRef] [Scilit] [PubMed]
- Shi, P.; Chen, Y.; Zhou, H.; Feng, J.; Sareh, P. Enhanced damping capacity of graphene origami reinforced metal matrix nanocomposites. Phys. Rev. B 2025, 112, 064108. [Google Scholar] [CrossRef] [Scilit]
- Shi, P.; Chen, Y.; Guo, T.; Tu, Y.; Feng, J. Folded graphene reinforced metal matrix nanocomposites with comprehensively enhanced tensile mechanical properties. Adv. Eng. Softw. 2025, 200, 103829. [Google Scholar] [CrossRef] [Scilit]
- Zhao, S.; Zhang, Y.; Yang, J.; Kitipornchai, S. Folded graphene reinforced nanocomposites with superior strength and toughness: A molecular dynamics study. J. Mater. Sci. Technol. 2022, 120, 196–204. [Google Scholar] [CrossRef] [Scilit]
- Müller-Plathe, F. A simple nonequilibrium molecular dynamics method for calculating the thermal conductivity. J. Chem. Phys. 1997, 106, 6082–6085. [Google Scholar] [CrossRef] [Scilit]
- Shi, P.; Chen, Y.; Xie, T.; Zhou, H.; Tu, Y.; Guo, T.; Feng, J. Deformation-triggered pattern transformation and thermal modulation in periodic nanoporous graphene. Thin-Walled Struct. 2025, 215, 113448. [Google Scholar] [CrossRef] [Scilit]
- Leroy, F.; Müller-Plathe, F.; Böhm, M.C.; Alaghemandi, M. Thermal rectification in nanosized model systems: A molecular dynamics approach. Phys. Rev. B 2010, 81, 125410. [Google Scholar] [CrossRef] [Scilit]



Disclaimer/Publisher’s Note: The statements, opinions and data contained in all publications are solely those of the individual author(s) and contributor(s) and not of MDPI and/or the editor(s). MDPI and/or the editor(s) disclaim responsibility for any injury to people or property resulting from any ideas, methods, instructions or products referred to in the content. |
© 2026 by the authors. Licensee MDPI, Basel, Switzerland. This article is an open access article distributed under the terms and conditions of the Creative Commons Attribution (CC BY) license.