


Abstract
Chemical short-range order (CSRO) is associated with heterogeneous lattice distortion in refractory multi-principal-element alloys, but its relationship with cyclic dislocation organization remains unresolved. Hybrid Monte Carlo and molecular dynamics simulations were combined with statistical field reconstruction and three-dimensional discrete dislocation dynamics to examine cyclic deformation in HfNbTa. Structure–function analysis of the atomistic strain fields provided the descriptors used to reconstruct heterogeneous strain fields for the as-cast and annealed samples. These reconstructed fields served as the direct inputs to the DDD simulations. Under the simulated loading conditions, the as-cast sample exhibited wider hysteresis loops and approximately four times the final dislocation density of the annealed sample. In the examined network realization, the annealed sample developed a lower-density network with a narrower diagonal concentration of dislocations. Projected band width characterized the transverse extent of this feature. Additional comparisons showed comparable macroscopic stress responses across the tested initial dislocation arrangements and field phases. These results distinguish dislocation storage from spatial organization under the two sample-specific CSRO-associated reconstructed fields; the diagonal morphology is an observation within the examined realizations.
1. Introduction
Refractory multi-principal-element alloys (RMPEAs) combine high-temperature strength with a chemically complex body-centered-cubic (BCC) lattice. Their monotonic plasticity has received substantial attention, whereas the mechanisms governing repeated loading remain less established. Low-cycle and stress-controlled fatigue experiments on Hf-containing RMPEAs have reported cyclic softening, localized slip, and strong sensitivity to microstructure [1,2]. Identifying the early microstructural precursors is therefore essential for connecting atomic-scale chemical structure to fatigue-relevant deformation.
Persistent slip bands (PSBs) concentrate irreversible plastic strain and generate surface relief from which fatigue cracks may initiate. In situ microfatigue experiments show that PSBs nucleate heterogeneously and expand gradually, while slip traces formed during the earliest cycles can identify their eventual positions [3]. Continuum and crystal-plasticity approaches reproduce slip-controlled cyclic response and short-crack paths, but they do not explicitly resolve individual dislocation reactions [4]. A dislocation-based description is consequently required to relate cyclic hysteresis to the evolving line network.
The chemical energy landscape of an RMPEA is spatially nonuniform. Severe local lattice distortion has been measured in Zr- and Hf-containing alloys [5], and atomistic studies show that CSRO modifies BCC screw-dislocation mobility, strengthening, and dislocation energetics [6,7,8]. Recent multiscale simulations further showed that SRO changes cross slip probability and plastic-flow localization in irradiated HfNbTa [9]. These results imply that cyclic deformation depends on both the mean mobility law and the spatial statistics of the internal stress field.
Three-dimensional discrete dislocation dynamics (3D DDD) explicitly resolves dislocation multiplication, cross slip, reactions, surface escape, and long-range interactions. Earlier 3D DDD simulations reproduced PSB embryos and linked their development to cross slip-mediated stress redistribution in face-centered-cubic crystals [10]. Direct transfer of an FCC Stage-III cross slip rule is inappropriate for BCC HfNbTa, whose screw mobility is controlled by thermally activated kink-pair processes [6,11]. Dislocation density and imposed strain rate also jointly control strength and localization [12], while heterogeneous lattice-strain fields can produce collective dislocation-flow patterns in HfNbTa [13]. A BCC-consistent multiscale treatment is therefore useful for examining associations between reconstructed internal fields and cyclic slip, provided that field admissibility and causal limitations are made explicit.
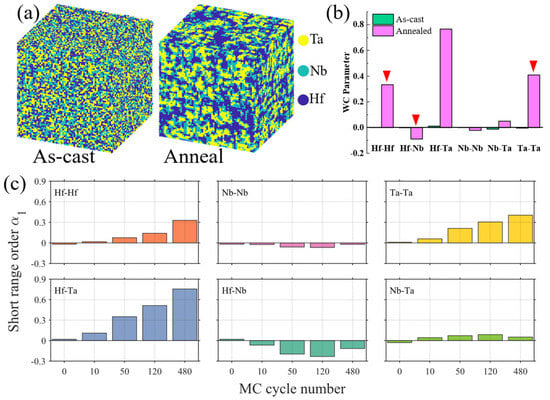
In this work, two atomistic HfNbTa samples were used to obtain descriptors for three-dimensional synthetic strain fields supplied to BCC 3D DDD simulations of a cylindrical domain. The as-cast sample represents the configuration before MC exchange cycling, whereas the annealed sample denotes the configuration obtained after 500 hybrid MC/MD cycles. The development of pair-specific chemical correlations during sampling is documented by the Warren–Cowley parameters in Figure 1. We compared cyclic hysteresis, total dislocation density, and the spatial appearance of the resulting networks. The study asks whether fields associated with these two chemical states can produce different rankings of line accumulation and spatial concentration.
Figure 1.
Atomistic configurations and evolution of chemical short-range order in HfNbTa. (a) Atomic distributions in the as-cast and annealed samples. (b) First-nearest-neighbor Warren–Cowley parameters for the two samples, averaged over the simulation cell. Under the sign convention defined in Section 2.1, positive like-pair parameters indicate clustering, whereas negative unlike-pair parameters indicate preferential unlike-neighbor association. (c) Evolution of the Hf–Hf, Nb–Nb, Ta–Ta, Hf–Ta, Hf–Nb, and Nb–Ta parameters at the sampled MC cycle numbers.
2. Materials and Methods
2.1. Atomistic Samples and Chemical Short-Range Order
Two atomistic HfNbTa samples were constructed by hybrid Monte Carlo and molecular dynamics simulations in LAMMPS [14]. The equiatomic body-centered cubic cell measured 22 × 22 × 22 nm3, contained 549,250 atoms, and was oriented with x||[100], y||[010], andz||[001]. Interatomic forces were evaluated using the embedded atom method parameterization adopted from Maiti and Steurer [15]. A time step of 1.0 fs was used. The cell was first energy minimized and then equilibrated at 300 K under an isothermal isobaric NPT ensemble. After equilibration, chemical configurations were sampled by alternating MC species exchanges with MD relaxation. Each hybrid cycle contained 10 attempted swaps between randomly selected atoms of different species, evaluated with the Metropolis criterion in a canonical ensemble, followed by 100 MD steps. The configuration before MC exchange cycling was designated as the as-cast sample, and the configuration obtained after 500 hybrid MC/MD cycles was designated as the annealed sample (Figure 1a). These labels distinguish the initial, approximately random chemical configuration from the configuration with more pronounced local chemical correlations generated by MC sampling. Here, “annealed sample” identifies the computationally generated chemical state rather than a calibrated experimental heat treatment. The evolution of the first-nearest-neighbor Warren–Cowley parameters during sampling is presented in Figure 1c. At 10 attempted exchanges and 100 MD steps per cycle, the stated 500-cycle protocol corresponds to 5000 attempted exchanges and 50,000 MD steps (50 ps), excluding initial relaxation.
Atomic configurations and per atom deformation measures were processed in OVITO [16]. For each equilibrated configuration, the local displacement gradient was evaluated relative to the initial reference lattice. The infinitesimal atomic strain was calculated as εij = (ui,j + uj,i)/2, where u is the atomic displacement and i, j ∈ {x, y, z}. This procedure yielded the three normal and three shear components used in the subsequent reconstruction. Chemical order was quantified using first-nearest-neighbor Warren–Cowley parameters [17,18]:
Here, Pij is the conditional probability of finding a j-type atom in the first-neighbor shell of an i-type atom, cj is the global concentration of species j, and δij is the Kronecker delta. For like pairs, a positive αii indicates clustering or segregation (Figure 1b). For unlike pairs, a negative αij indicates preferential unlike-neighbor association. The near-zero values in the as-cast sample and the pronounced Hf–Hf, Ta–Ta, and Hf–Ta signals in the annealed sample were used to distinguish the two chemical configurations.
2.2. Three-Dimensional Reconstruction of the Residual Strain Field
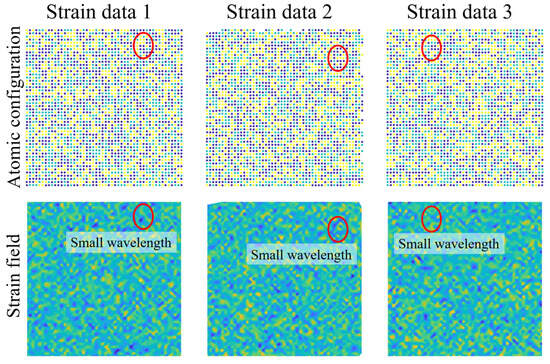
Local lattice distortion in Hf-containing RMPEAs varies with spatial position and strain-tensor component [5,13]. The atomic strain maps in Figure 2 and Figure 3 were therefore characterized through their spatial distributions and scale-dependent fluctuations. Three representative atomic strain datasets were analyzed for each chemical state, with the atomic strain dataset serving as the unit of comparison. Each dataset was processed using the same structure–function procedure. The root-mean-square strain was evaluated as a function of scan size, and the fitted regions of the log–log structure functions in Figure 4 yielded the componentwise fractal dimensions and strain-amplitude parameters. These descriptors provided a consistent basis for comparing the spatial characteristics of the as-cast and annealed strain fields and for constructing the corresponding three-dimensional heterogeneous fields. Similar trends across the three datasets showed that the characteristic differences between the two chemical states were reproduced within the available atomistic analysis.
Figure 2.
Atomistic structure and normal-strain maps for the as-cast sample. Three representative [100] datasets illustrate local chemical fluctuations and associated strain textures. These datasets are not independent alloy specimens.
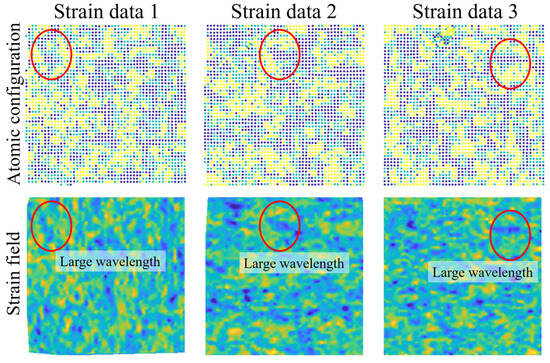
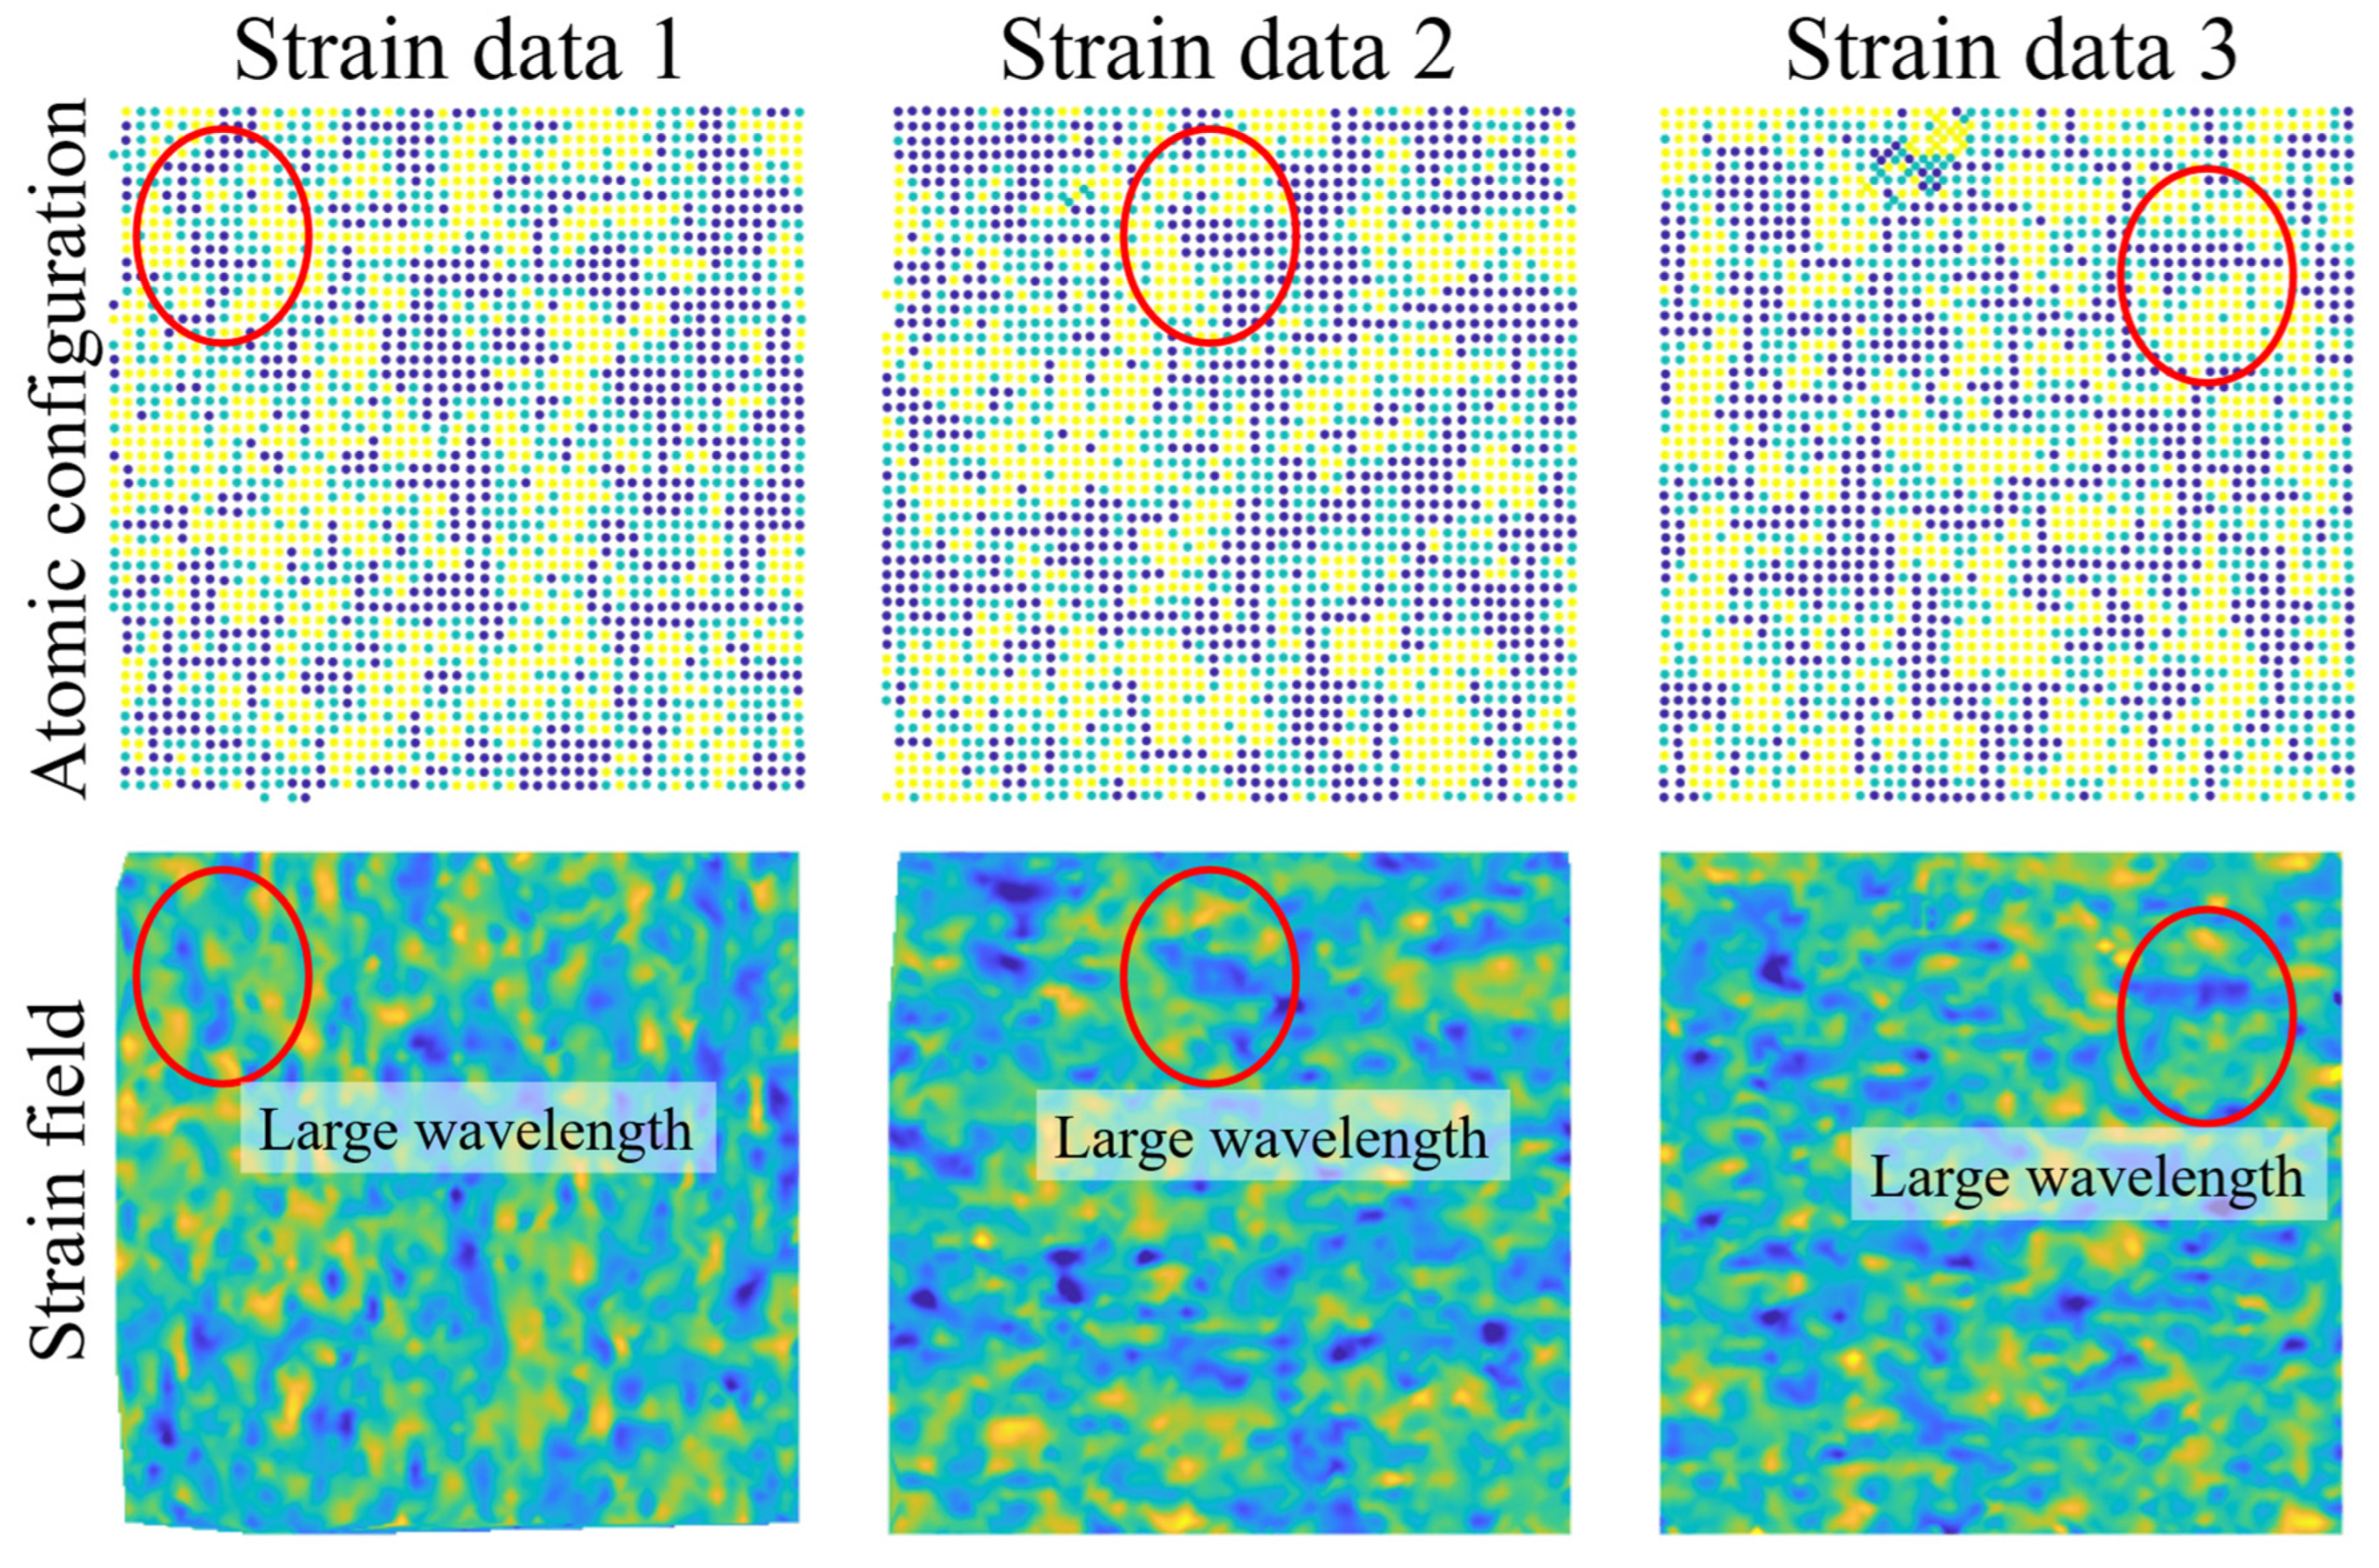
Figure 3.
Atomistic structure and normal-strain maps for the annealed sample. Three representative [100] datasets were analyzed using the same procedure as for the as-cast sample; they do not represent independent DDD realizations.
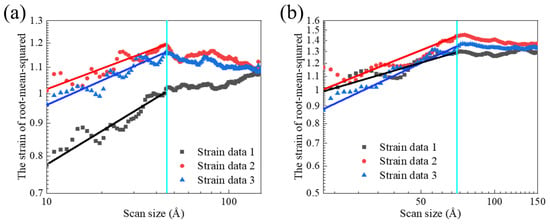
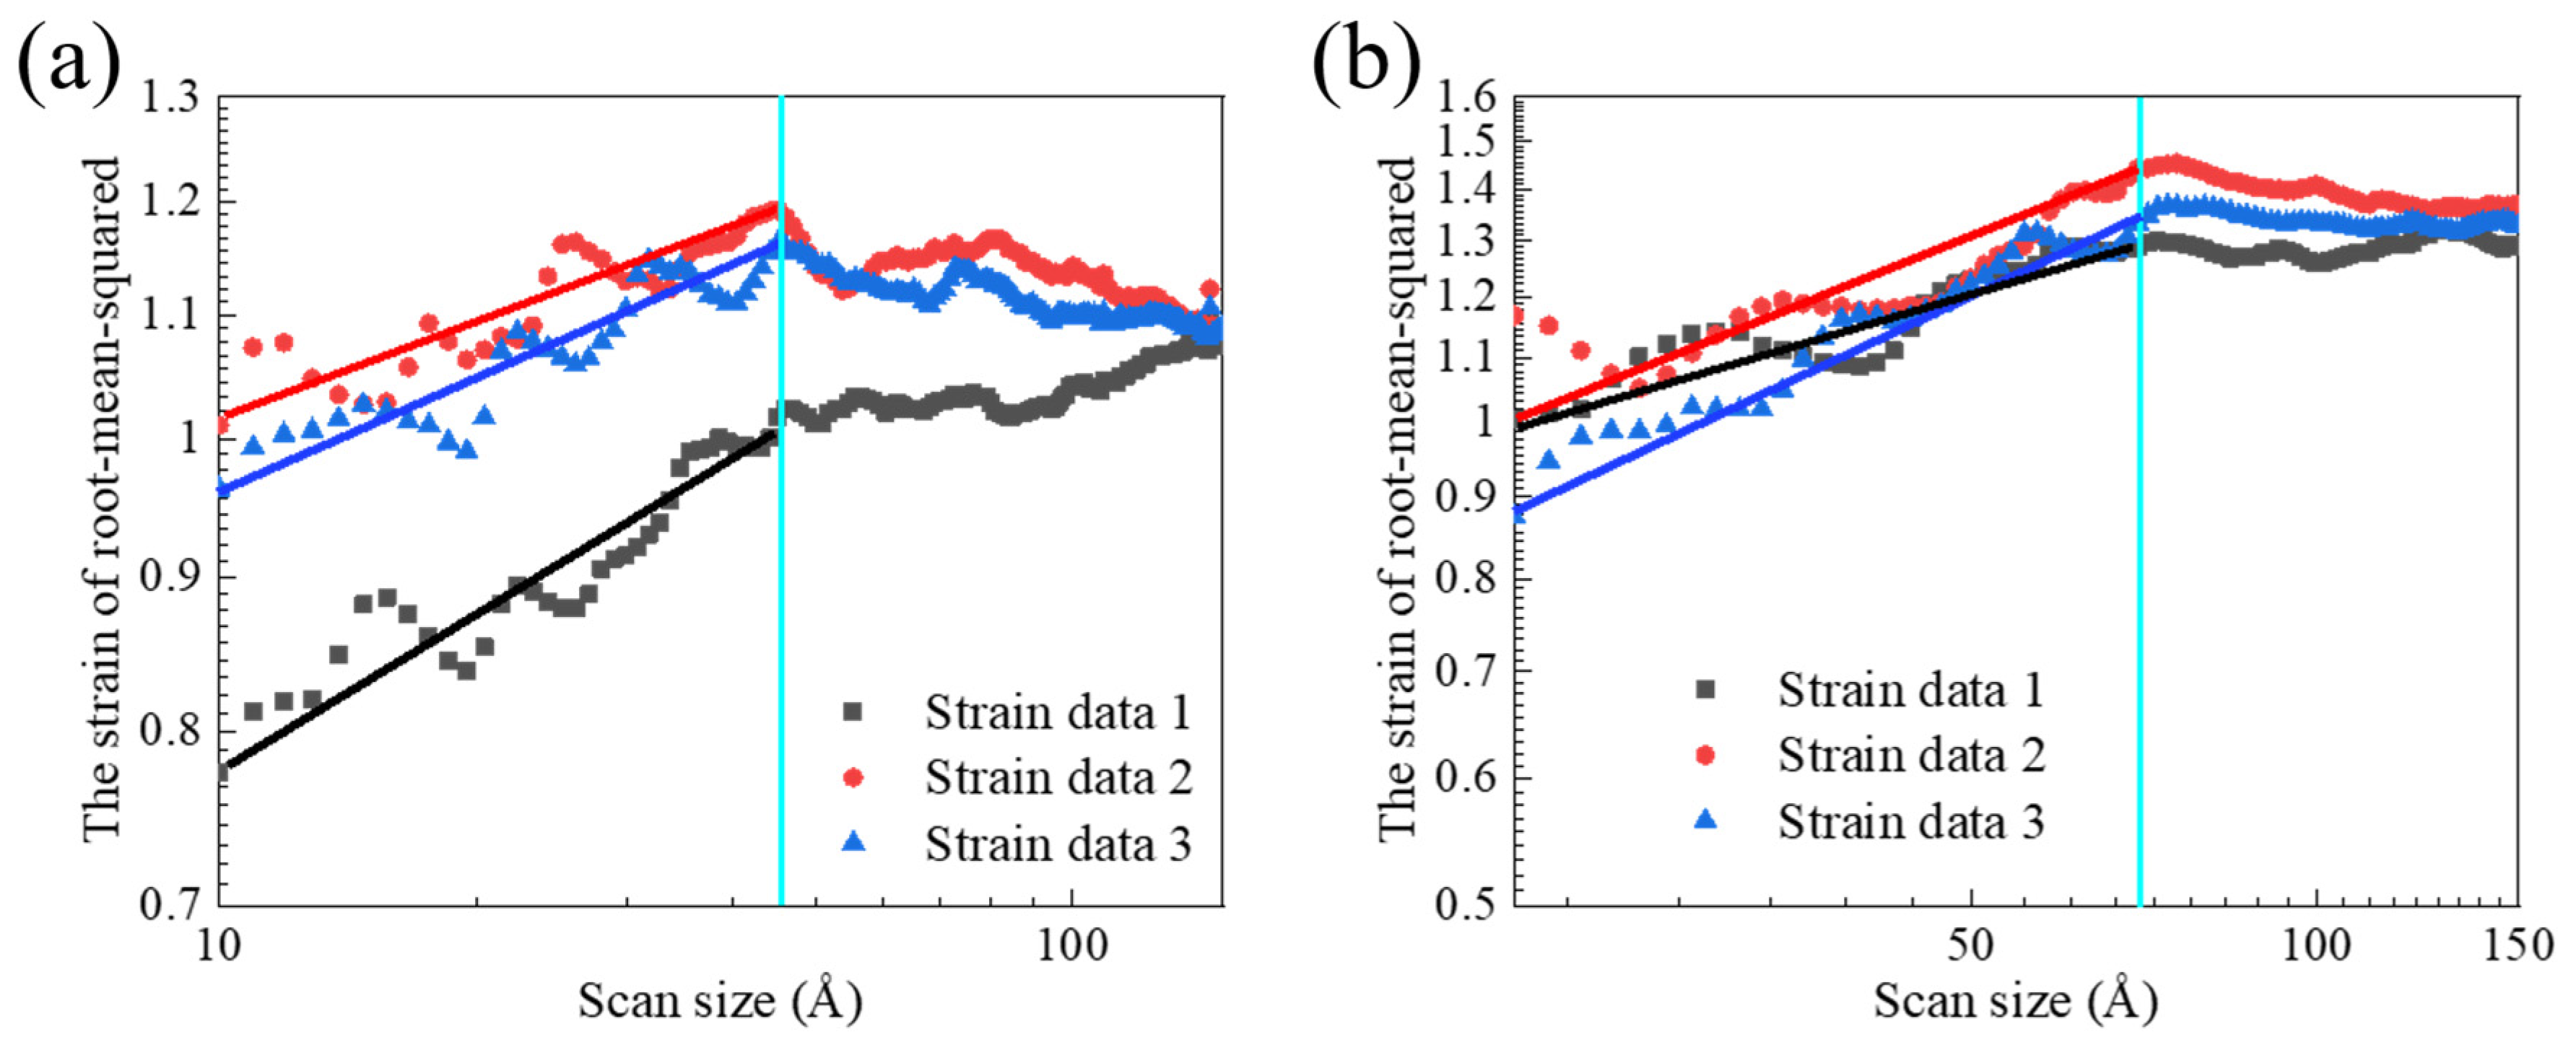
Figure 4.
Structure–function analysis of the residual strain. Root-mean-square strain is plotted against scan size on logarithmic axes for (a) the as-cast and (b) annealed samples.
For transfer to the micrometer-scale DDD domain, each strain component was represented by a three-dimensional Weierstrass–Mandelbrot random field [19,20], with descriptors extracted using structure–function analysis [21]. The reconstruction represents selected amplitudes and scaling characteristics of the atomistic fields. It does not retain the positions of individual atoms or chemical clusters, and it is not a spatially resolved continuation of the atomistic configuration.
The lower summation limit was n = 0, and nmax = int[log(L/Ls)/log γ], where L is the reconstructed domain size and Ls is the lower cutoff. The phase φm,n was sampled independently, γ = 1.5 controlled the frequency spacing, and M = 50 ridges were superposed for each component. Separate Dij and Hij values from Table 1 were used for εxx, εyy, εzz, εxy, εxz, and εyz.
Table 1.
Fractal dimension Dij and strain amplitude Hij for the six reconstructed residual strain components.
To avoid introducing a spurious net pre-stress, the spatial mean is evaluated on a 100 × 100 × 100 uniformly spaced grid over the DDD domain and subtracted from the non-uniform strain field function: .
The principal comparison used one reconstructed field realization for each chemical state. Additional initial-dislocation and field-phase sensitivity comparisons are presented in Section 3.2. The synthetic strain tensor was mapped to an imposed model stress through the isotropic relation below and supplied to the DDD calculation. It is a constitutive approximation, not an equilibrium reconstruction of the actual atomistic residual stress:
Here, G is the shear modulus, λ is the first Lamé parameter, δij is the Kronecker delta, and εkk is the trace of the reconstructed tensor. The same isotropic elastic constants were used for both states, so chemical-state differences enter through the reconstructed fields rather than state-dependent elastic constants. This choice permits a comparison within one elastic approximation but does not establish that elastic anisotropy is negligible in BCC HfNbTa. Atomic deformation relative to a reference lattice is not automatically a purely elastic strain: chemical eigenstrain and local structural relaxation may also contribute. Direct use of Equation (3) does not separate these contributions. We therefore refer to its output as a reconstructed model stress associated with the chemical state, rather than a uniquely determined physical chemical residual stress.
2.3. DDD Geometry and Cyclic Loading
The DDD simulations were performed with ParaDiS using straight perfect dislocation segments connected by nodes [22]. The stress acting on each segment combined the applied stress, the stress of all other segments, the cylindrical free-surface image stress [23], and the reconstructed chemical state-dependent stress. Dislocation-induced stresses were calculated with the non-singular isotropic segment formulation of Cai et al. [24], which spreads the Burgers vector over a finite core radius and avoids the unphysical divergence of classical line solutions. The Peach–Koehler force was then evaluated from the total local stress. Coupling of the reconstructed field followed barrier field strategies used in heterogeneous DDD calculations [25,26].
The domain was a [001]-oriented cylinder with a diameter and height of 2 μm. Periodic boundary conditions were applied along the cylinder axis, and segments reaching the lateral free surface were removed. Fully reversed uniaxial strain cycling was imposed along [001] between ±4 × 10⁻³ at 104 s−1. The initial network contained one Frank–Read source on a primary {110}<111> system with a Schmid factor of 0.408. The target segment length was xl = 10b. Eight of the twelve {110}<111> systems had a Schmid factor of 0.408, while four had zero resolved shear stress under ideal [001] loading (Table 2). Source geometry, free-surface escape, and stochastic source operation are known to control micrometer-scale dislocation response [27,28,29,30,31,32]. The principal network-evolution results describe this early-cycle single-source model. Additional randomly distributed initial configurations were examined for macroscopic stress-response sensitivity (Section 3.2).
Table 2.
Schmid factors of the twelve {110}<111> slip systems under uniaxial loading along [001].
2.4. BCC Dislocation Mobility Law
The DDD model resolved the coupled evolution of edge and screw segments in BCC HfNbTa. The mixed-segment velocity was interpolated between edge and screw mobilities using the phenomenological BCC law of Po et al. [11], with parameters informed by atomistic HfNbTa mobility data [6] and finite-size BCC DDD behavior [33]:
Here, θ is the angle between the local line direction and the Burgers vector, and w(θ) = sin 2θ weights the edge contribution. The edge velocity followed a linear drag relation:
The resolved driving stress included the external, reconstructed chemical-state-dependent, dislocation-interaction, and image-stress contributions. The screw velocity was described by a thermally activated kink-pair branch at positive activation free energy and by a drag-controlled branch after the barrier vanished:
The stress- and temperature-dependent screw drag coefficient was evaluated as [11]:
The Gibbs free energy for kink-pair formation was evaluated as [11]:
The fitted mobility parameters are listed in Table 3, and the remaining HfNbTa material constants are listed in Table 4.
Table 3.
Fitted parameters in the phenomenological HfNbTa dislocation-mobility law.
Table 4.
Material parameters used for the HfNbTa RMPEA.
2.5. Screw Dislocation Cross Slip
Cross slip was treated as a thermally activated stochastic event for eligible screw-oriented segments and candidate BCC cross slip planes. Following the probability form used for HfNbTa localization and earlier BCC DDD implementations [9,35,36,37], the acceptance probability for each trial was
where = 0.05 is the normalization factor, is the effective shear stress resolved in the candidate cross slip direction, τ* is the critical stress, V is the activation volume, k is the Boltzmann constant, and T = 298.15 K. The probability was capped at unity. A uniformly distributed random number ξ in [0, 1) was generated for each eligible trial, and cross slip was accepted when ξ < P. Table 5 lists the parameters used in Equation (9).
Table 5.
Parameters used in the thermally activated cross slip probability.
3. Results
3.1. Chemical Ordering and Residual Strain Statistics
The as-cast sample exhibited Warren–Cowley parameters close to zero, consistent with an approximately random first-neighbor distribution (Figure 1b). Figure 1c resolves the development of pair-specific chemical correlations during MC sampling. The Hf–Hf and Ta–Ta parameters became increasingly positive over the sampled cycles, indicating enhanced like-species clustering under the adopted sign convention. The Hf–Ta parameter also increased markedly, indicating a reduced preference for Hf–Ta first-neighbor contacts. In contrast, the Hf–Nb parameter became negative, reflecting preferential Hf–Nb association. Its magnitude increased through the intermediate sampling stages and then decreased at the final plotted point, while remaining negative. The Nb–Nb and Nb–Ta parameters stayed comparatively close to zero throughout the sampled sequence.
These contrasting trends show that MC sampling reorganized the local chemical environment in a pair-dependent manner. The resulting configuration combined enhanced Hf–Hf and Ta–Ta clustering with preferential Hf–Nb association and reduced Hf–Ta neighboring. Figure 1c therefore complements the endpoint comparison in Figure 1b by documenting how the chemical distinction between the as-cast and annealed samples developed during sampling. These two chemical configurations provide the atomistic basis for the subsequent strain-field characterization and reconstruction.
Figure 2 and Figure 3 show three representative [100] strain datasets for each sample. The as-cast maps contain small, spatially dispersed chemical fluctuations and predominantly short-wavelength strain variations. The positions of local extrema differ among datasets 1, 2, and 3. The recurrence of this texture supports a qualitative comparison of the available maps, without establishing independence of the sampled atomic regions.
The annealed sample showed a different spatial organization. Chemically enriched regions extended over larger projected areas, and the corresponding strain maps contained broader connected domains with slower spatial variation. The red ellipses in Figure 3 mark examples in which a larger chemical feature coincided with a larger wavelength strain feature. The positions and shapes differed across the three datasets, but the transition from fine mottling to broader domains was reproduced in each case. The conclusion is therefore based on repeatability of the spatial scale, not on one-to-one matching of a single cluster.
Figure 4 provides an independent scale-dependent comparison. At small scan sizes, the structure functions increased approximately linearly on logarithmic axes because each sampling window progressively captured more of the heterogeneous strain. The change in slope near the cyan boundary identified the upper end of the fitted scaling regime. The annealed curves reached their transition at a larger scan size and remained at a higher root mean square level over much of the fitted range. This behavior is consistent with the longer-wavelength fields visible in Figure 3 and with the SRO-dependent strain correlation reported for HfNbTa [13].
The fitted descriptors quantify two simultaneous changes (Table 4). The mean fractal dimension decreased from 3.834 to 3.710, a reduction of 3.2%, whereas the mean amplitude decreased from 13.22 × 10⁻⁴ to 7.09 × 10⁻⁴, a reduction of 46.4%. Componentwise amplitude reductions ranged from 34.6% for Hxz to 56.3% for Hyy. These percentages describe fitted parameters, not uncertainty estimates or an independently measured reduction in every local stress. The lower fitted amplitude coexists with broader spatial features in the annealed maps. The consequences of these changes cannot be separated in the present paired comparison.
Figure 1, Figure 2, Figure 3 and Figure 4 provide the atomistic observations and fitted descriptors used to construct the mesoscale inputs. The two samples differ in chemical pair correlations, and the three datasets show similar qualitative differences in strain texture. This consistency does not validate the complete reconstructed tensor or its mechanical equilibrium. Nor do the three datasets provide confidence intervals for the DDD response, because they were not propagated into an ensemble of independent cyclic simulations.
The six component parameter sets were used to generate the synthetic DDD input fields. This transfers selected statistical descriptors across scales; it does not directly transfer the actual atomic stress field or isolate the effect of chemical order from the other differences between the two inputs.
3.2. Cyclic Response and Dislocation Accumulation
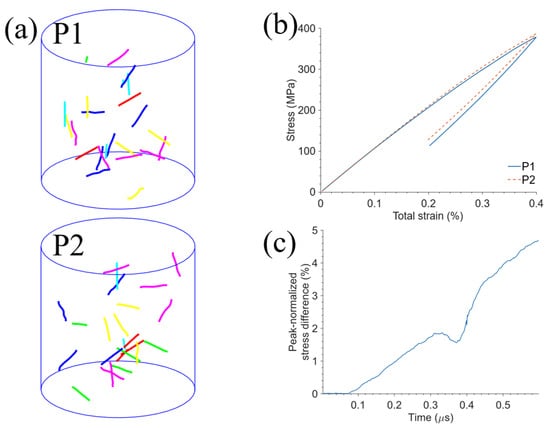
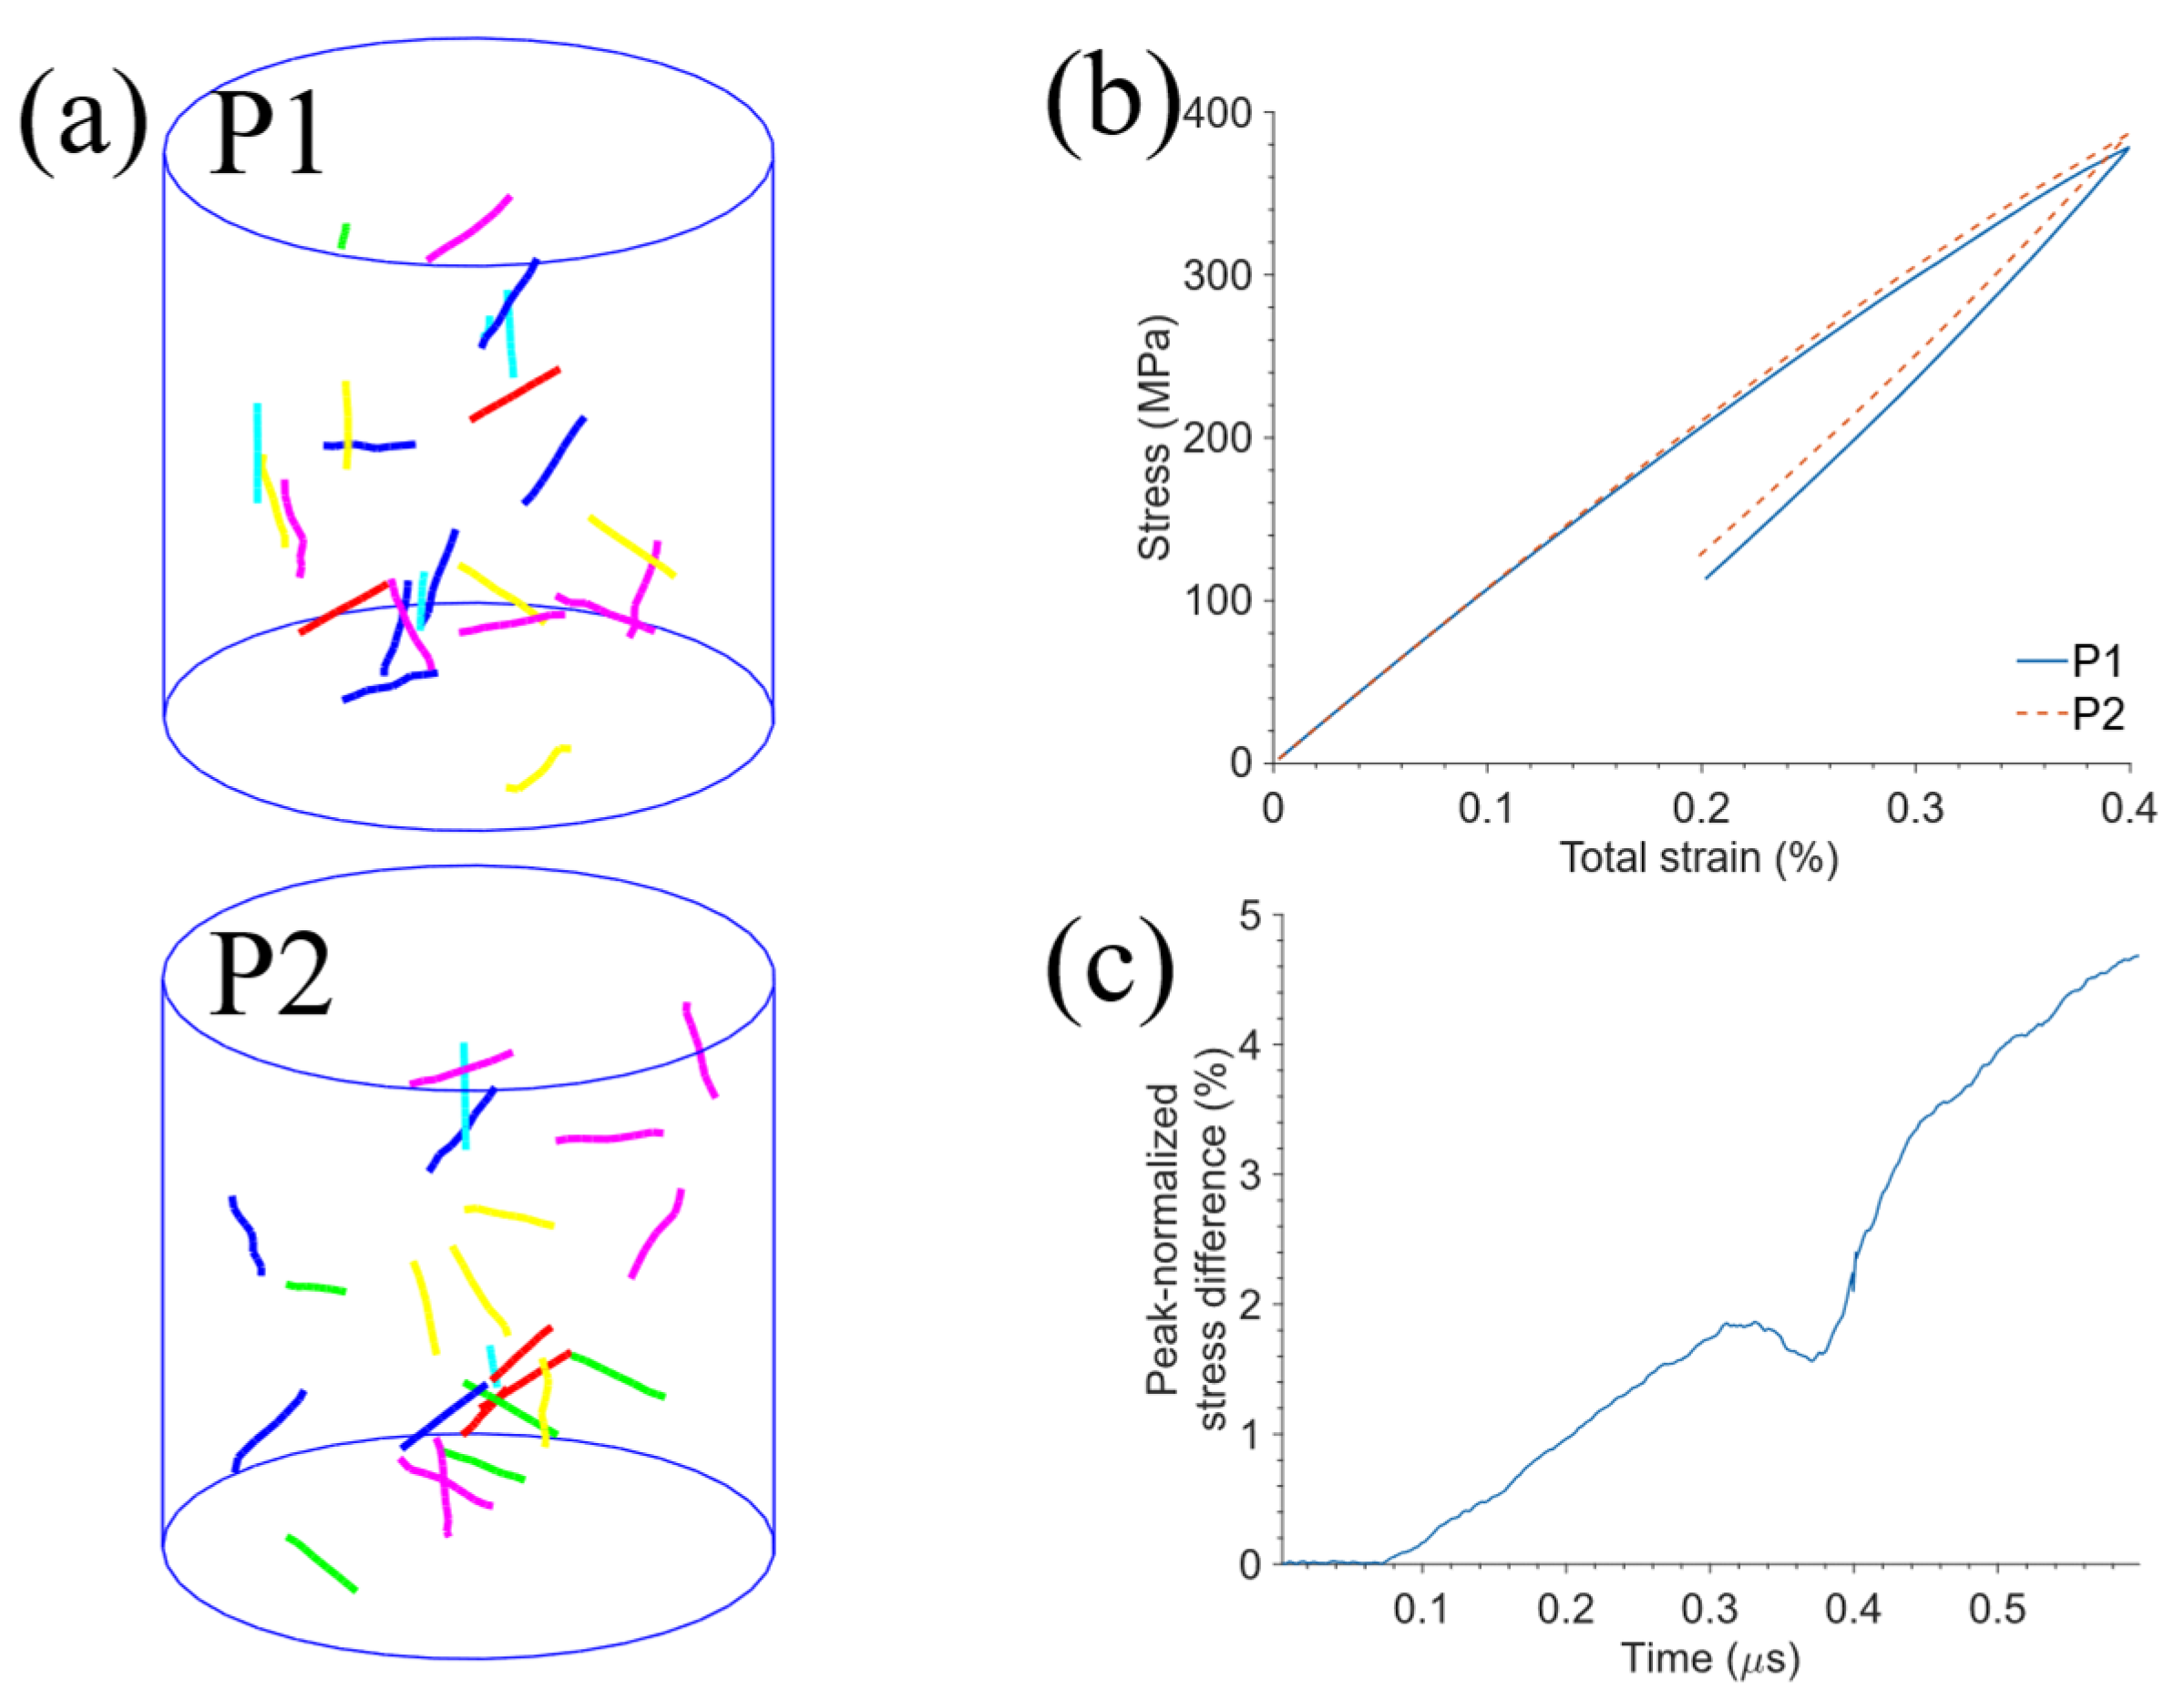
To examine the influence of the initial dislocation arrangement, two configurations with identical total dislocation density but different random spatial distributions were compared (Figure 5a). The stress–strain curves closely followed each other during the initial loading stage and developed a modest separation at larger strains (Figure 5b). Both configurations retained the same overall loading and unloading pattern. The comparison therefore shows that changing the initial spatial arrangement modifies the stress response while preserving its overall form within the investigated interval.
Figure 5.
Sensitivity of the stress response to the initial dislocation arrangement at a fixed dislocation density. (a) Two initial dislocation configurations with identical total dislocation density but different random spatial arrangements. (b) Corresponding stress–strain curves during tensile loading and subsequent partial unloading at a strain-rate magnitude of 104 s−1. (c) Time evolution of the absolute stress difference normalized by the peak absolute stress over the common comparison interval. The maximum peak-normalized difference is approximately 4.69%. This comparison assesses the macroscopic stress response to the tested initial arrangements.
The peak-normalized stress difference provides a quantitative measure of this configuration sensitivity (Figure 5c). The difference remained small initially, increased during loading, and became more pronounced after load reversal near 0.4 μs. It reached approximately 4.69% at the end of the common comparison interval, corresponding to an absolute stress difference of approximately 17.72 MPa. The larger separation during unloading indicates that the response depends on the deformation history developed from each initial configuration. Thus, identical initial dislocation density does not imply an identical subsequent stress response. For the two configurations examined, the initial spatial arrangement produced a bounded variation in stress while retaining comparable macroscopic loading behavior.
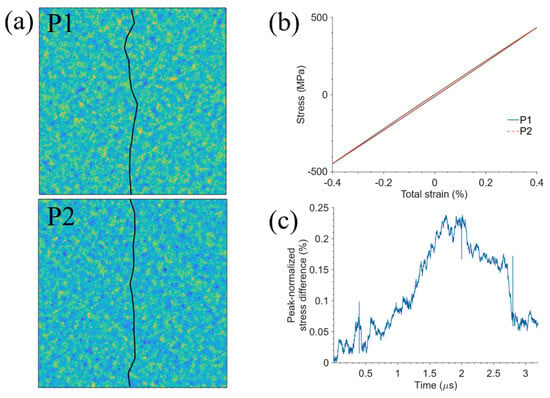
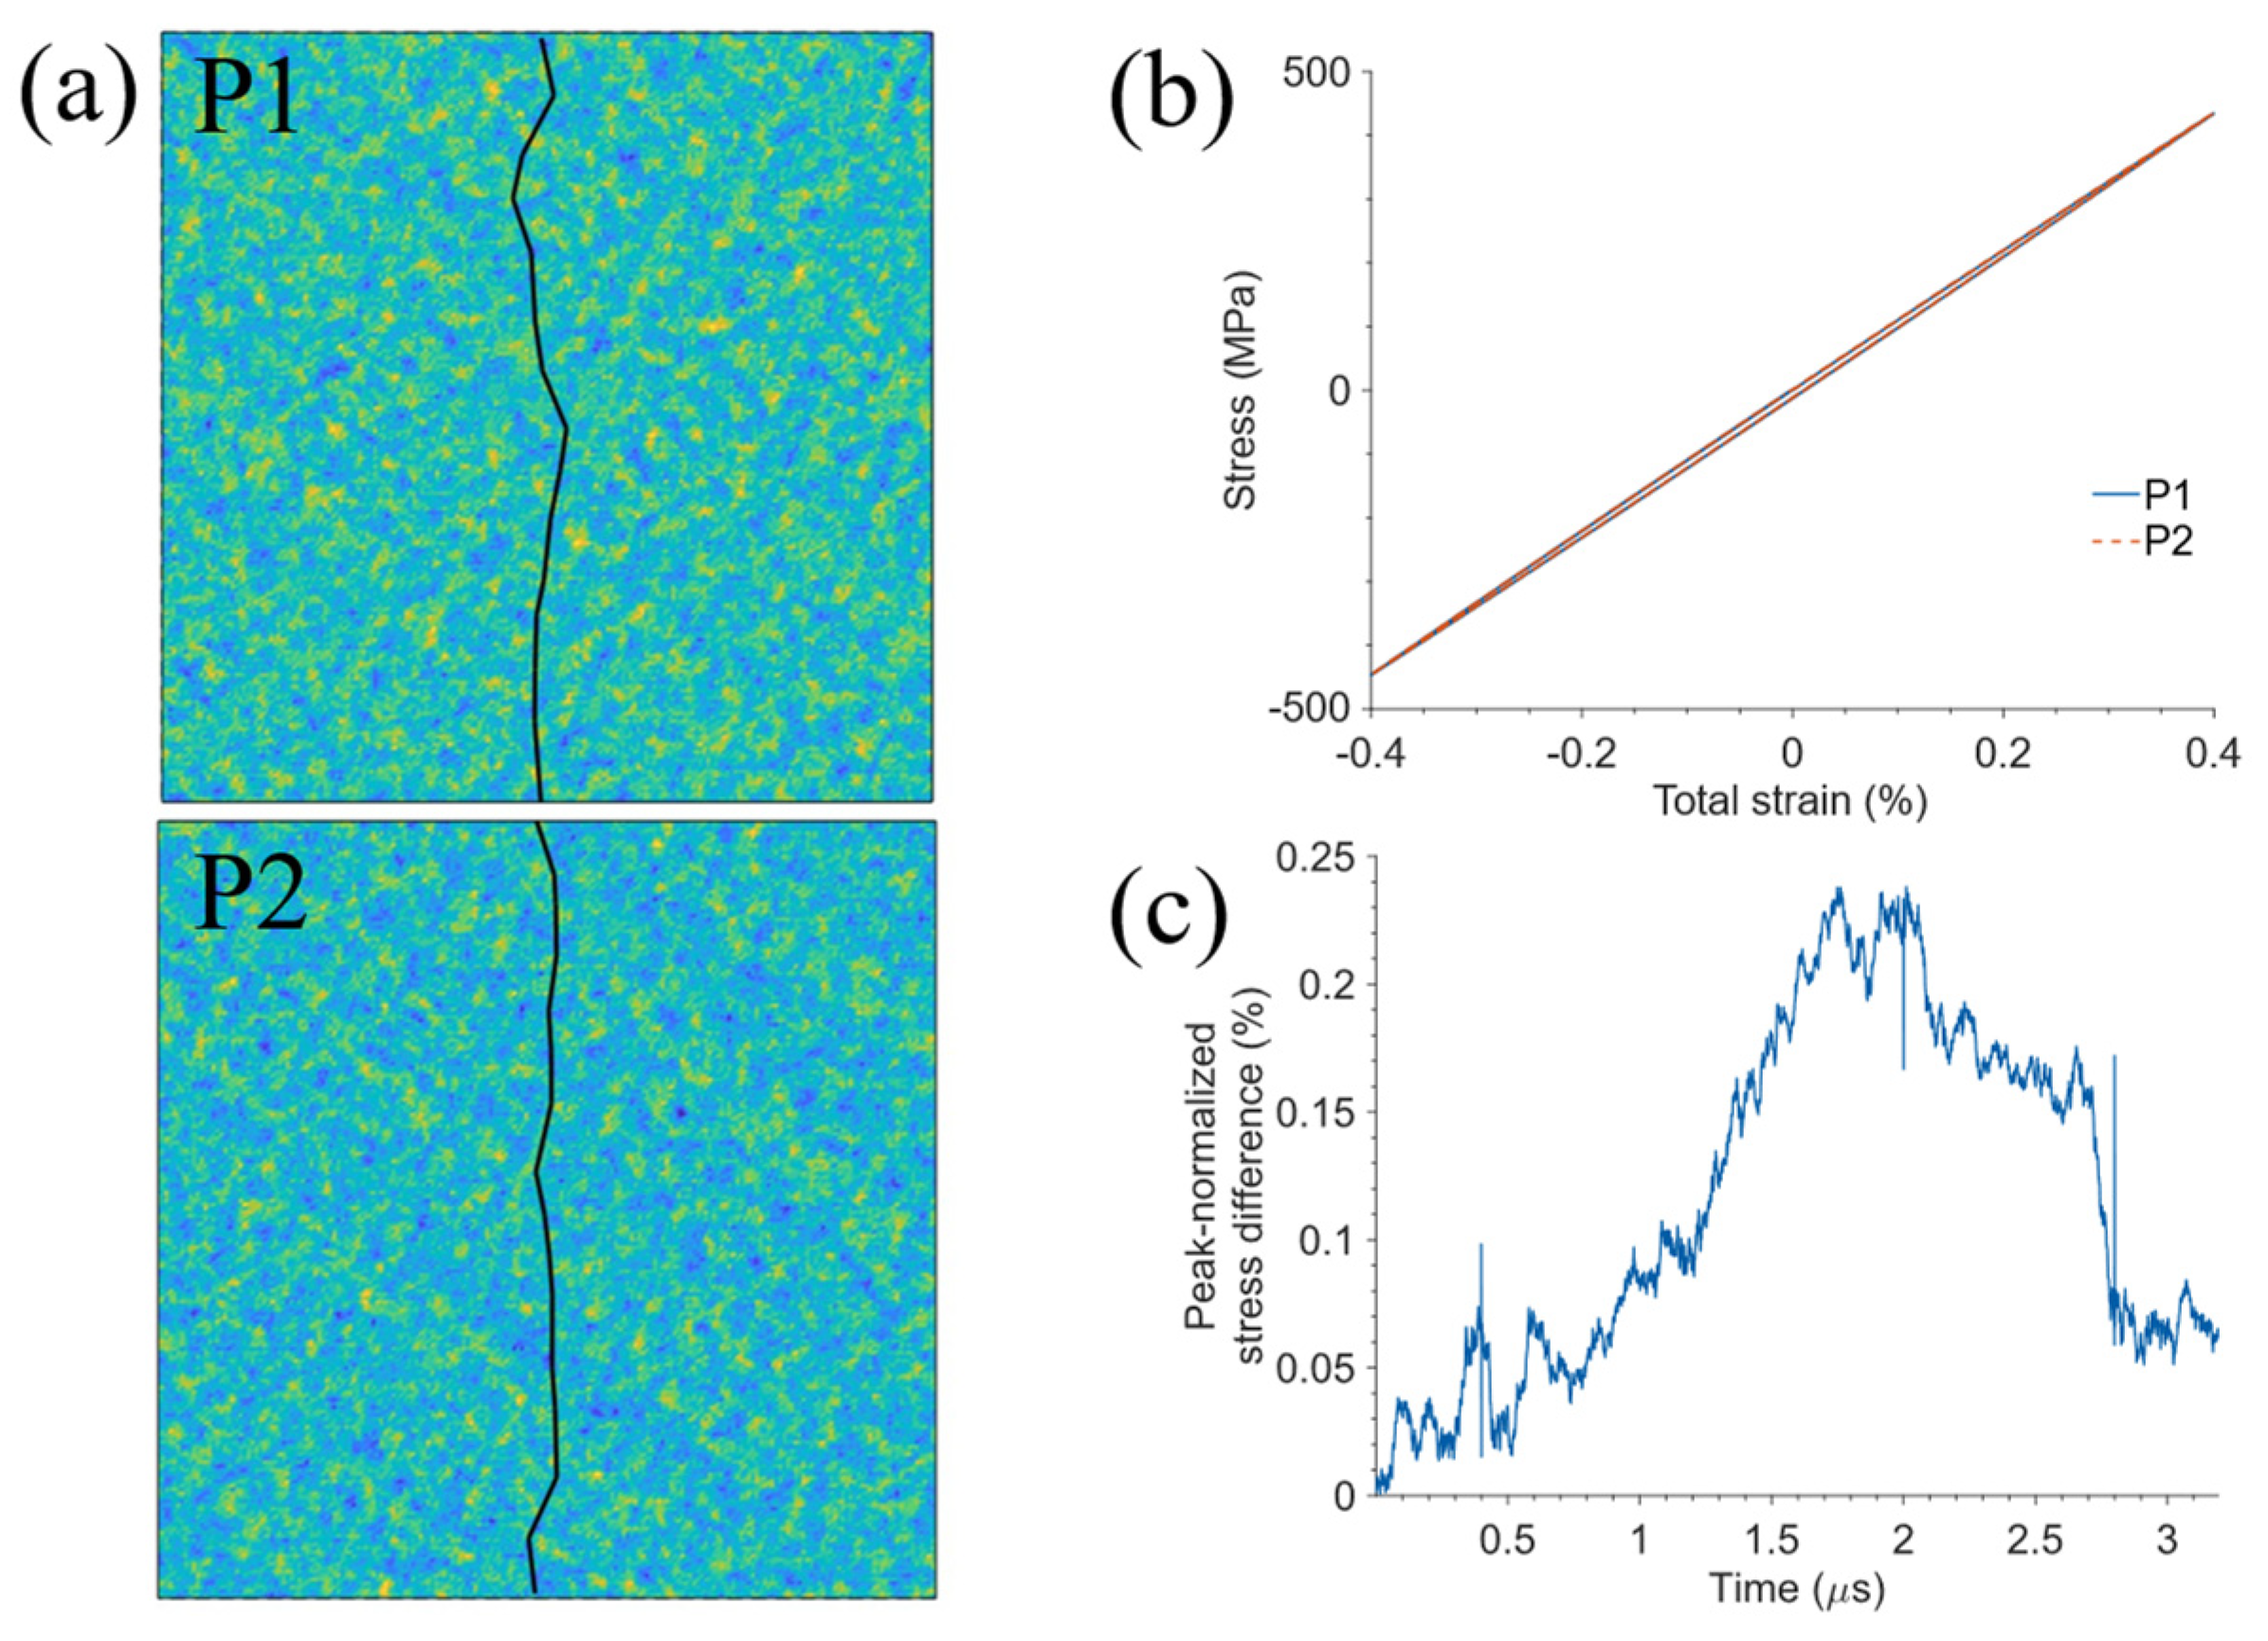
To assess sensitivity to the phase of the reconstructed strain field, two realizations were generated with identical fractal-dimension and strain-amplitude parameters but different phase values (Figure 6a). This comparison varied the spatial realization of the heterogeneous field while retaining the prescribed reconstruction parameters. The resulting cyclic stress–strain curves nearly overlapped throughout the simulated interval, including both tensile and compressive loading branches (Figure 6b). The close agreement indicates that the macroscopic stress response was only weakly sensitive to the phase change examined here.
Figure 6.
Sensitivity of the cyclic stress response to the phase of the reconstructed heterogeneous strain field. (a) Two reconstructed strain-field realizations generated using different phase values while retaining identical fractal-dimension and strain-amplitude parameters. (b) Corresponding cyclic stress–strain curves at a strain-rate magnitude of 104 s−1. (c) Time evolution of the absolute stress difference normalized by the peak absolute stress over the common comparison interval. The maximum peak-normalized difference is approximately 0.238%. This comparison assesses the macroscopic stress response to the tested phase change.
The time-resolved comparison resolves the small differences obscured by the overlapping stress–strain curves (Figure 6c). The peak-normalized stress difference increased during the intermediate portion of the simulation and subsequently decreased toward the end of the recorded interval. Its maximum was approximately 0.238%, corresponding to an absolute stress difference of approximately 1.06 MPa. These results demonstrate close agreement of the macroscopic cyclic response between the two tested phase realizations at fixed fractal dimension and strain amplitude. The phase change altered the field realization without producing an appreciable change in the overall stress–strain response under the investigated conditions. This test therefore constrains the robustness of the macroscopic response, but it does not evaluate whether the detailed localization morphology is reproduced across independent field realizations.
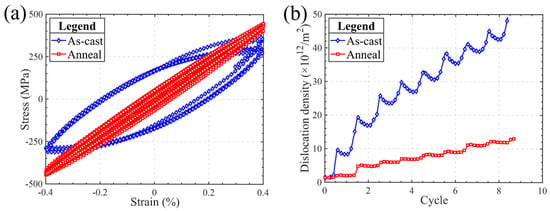
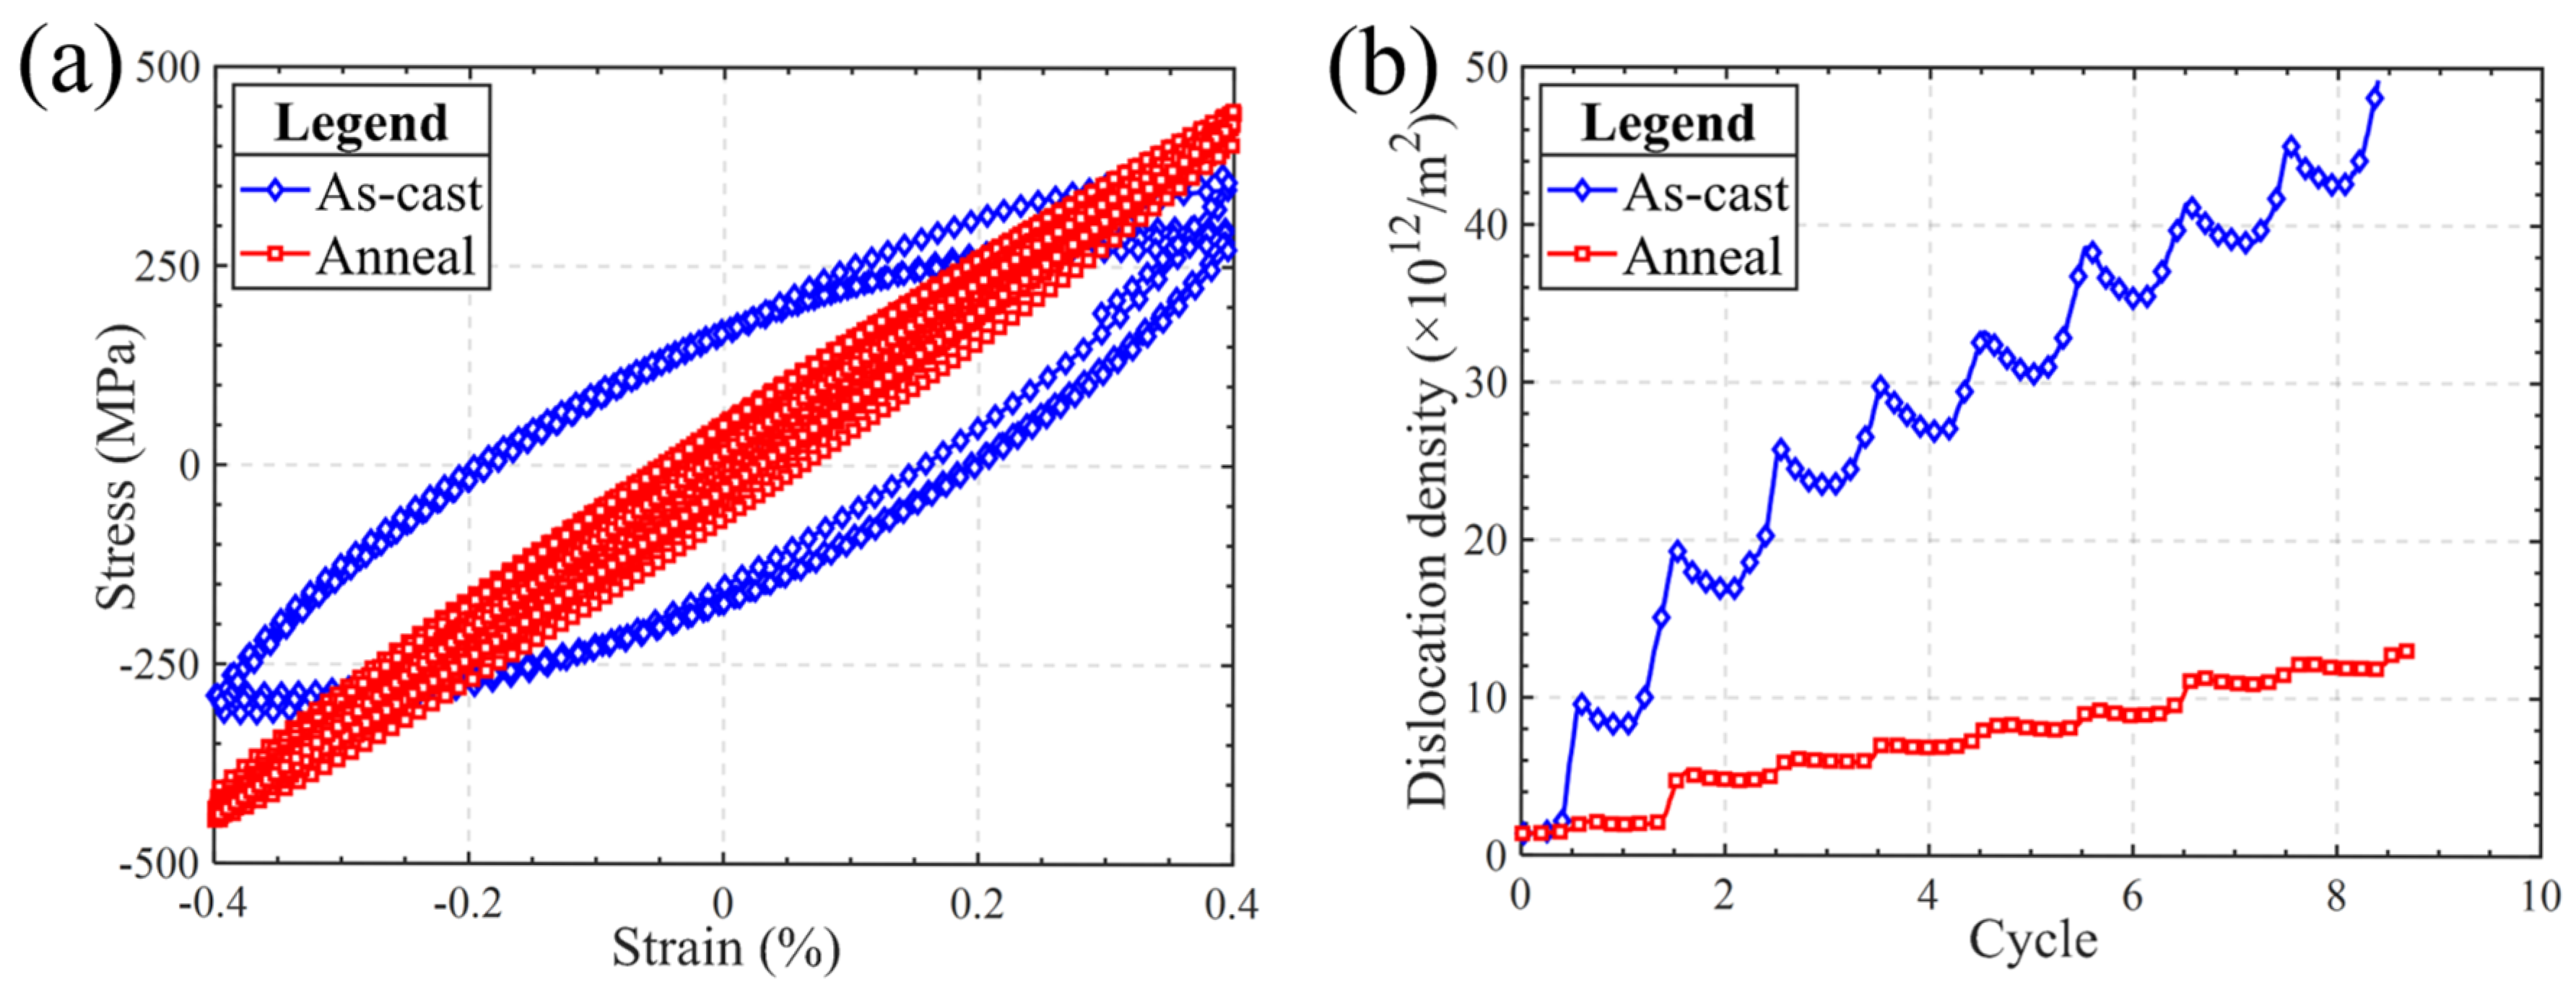
Figure 7 compares the cyclic response at a nominal strain amplitude of 4 × 10⁻³. The as-cast sample developed a substantially wider hysteresis loop, whereas the annealed sample reached larger tensile and compressive stress magnitudes with a narrower loop (Figure 7a). The larger enclosed area for the as-cast sample indicates greater irreversible work per cycle within the simulated window. The narrower loop indicates lower apparent dissipation in this realization; it does not independently establish the microscopic origin of the difference.
Figure 7.
Cyclic response and dislocation accumulation at a nominal strain amplitude of 4 × 10⁻³. (a) Stress-strain hysteresis loops for the as-cast and annealed samples. (b) Total dislocation density as a function of cycle number. Each curve represents the examined realization for its chemical-state-associated reconstructed field.
The loop shapes differ in more than peak stress. The as-cast branches remain more widely separated during reversal, whereas the annealed branches are closer over much of the strain range. These observations are consistent with different amounts of irreversible work in the available realizations. Loop shape alone cannot identify the fraction of reversible segment motion or allocate dissipation among cross slip, reactions, and surface escape.
The total dislocation density provided an independent measure of network evolution (Figure 7b). The as-cast sample density rose rapidly and exhibited repeated within-cycle oscillations consistent with changing net line storage during cycling. By the end of the record, it approached 5 × 10¹³ m−2, approximately four times the annealed value. The annealed sample density increased gradually and remained below approximately 1.3 × 10¹³ m−2. Neither curve reached a plateau, so these data describe early cyclic organization rather than a saturated state.
3.3. Spatial Development of PSB-like Localization
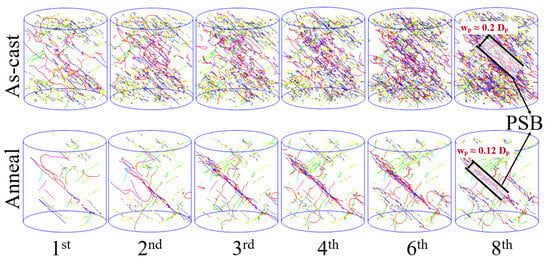
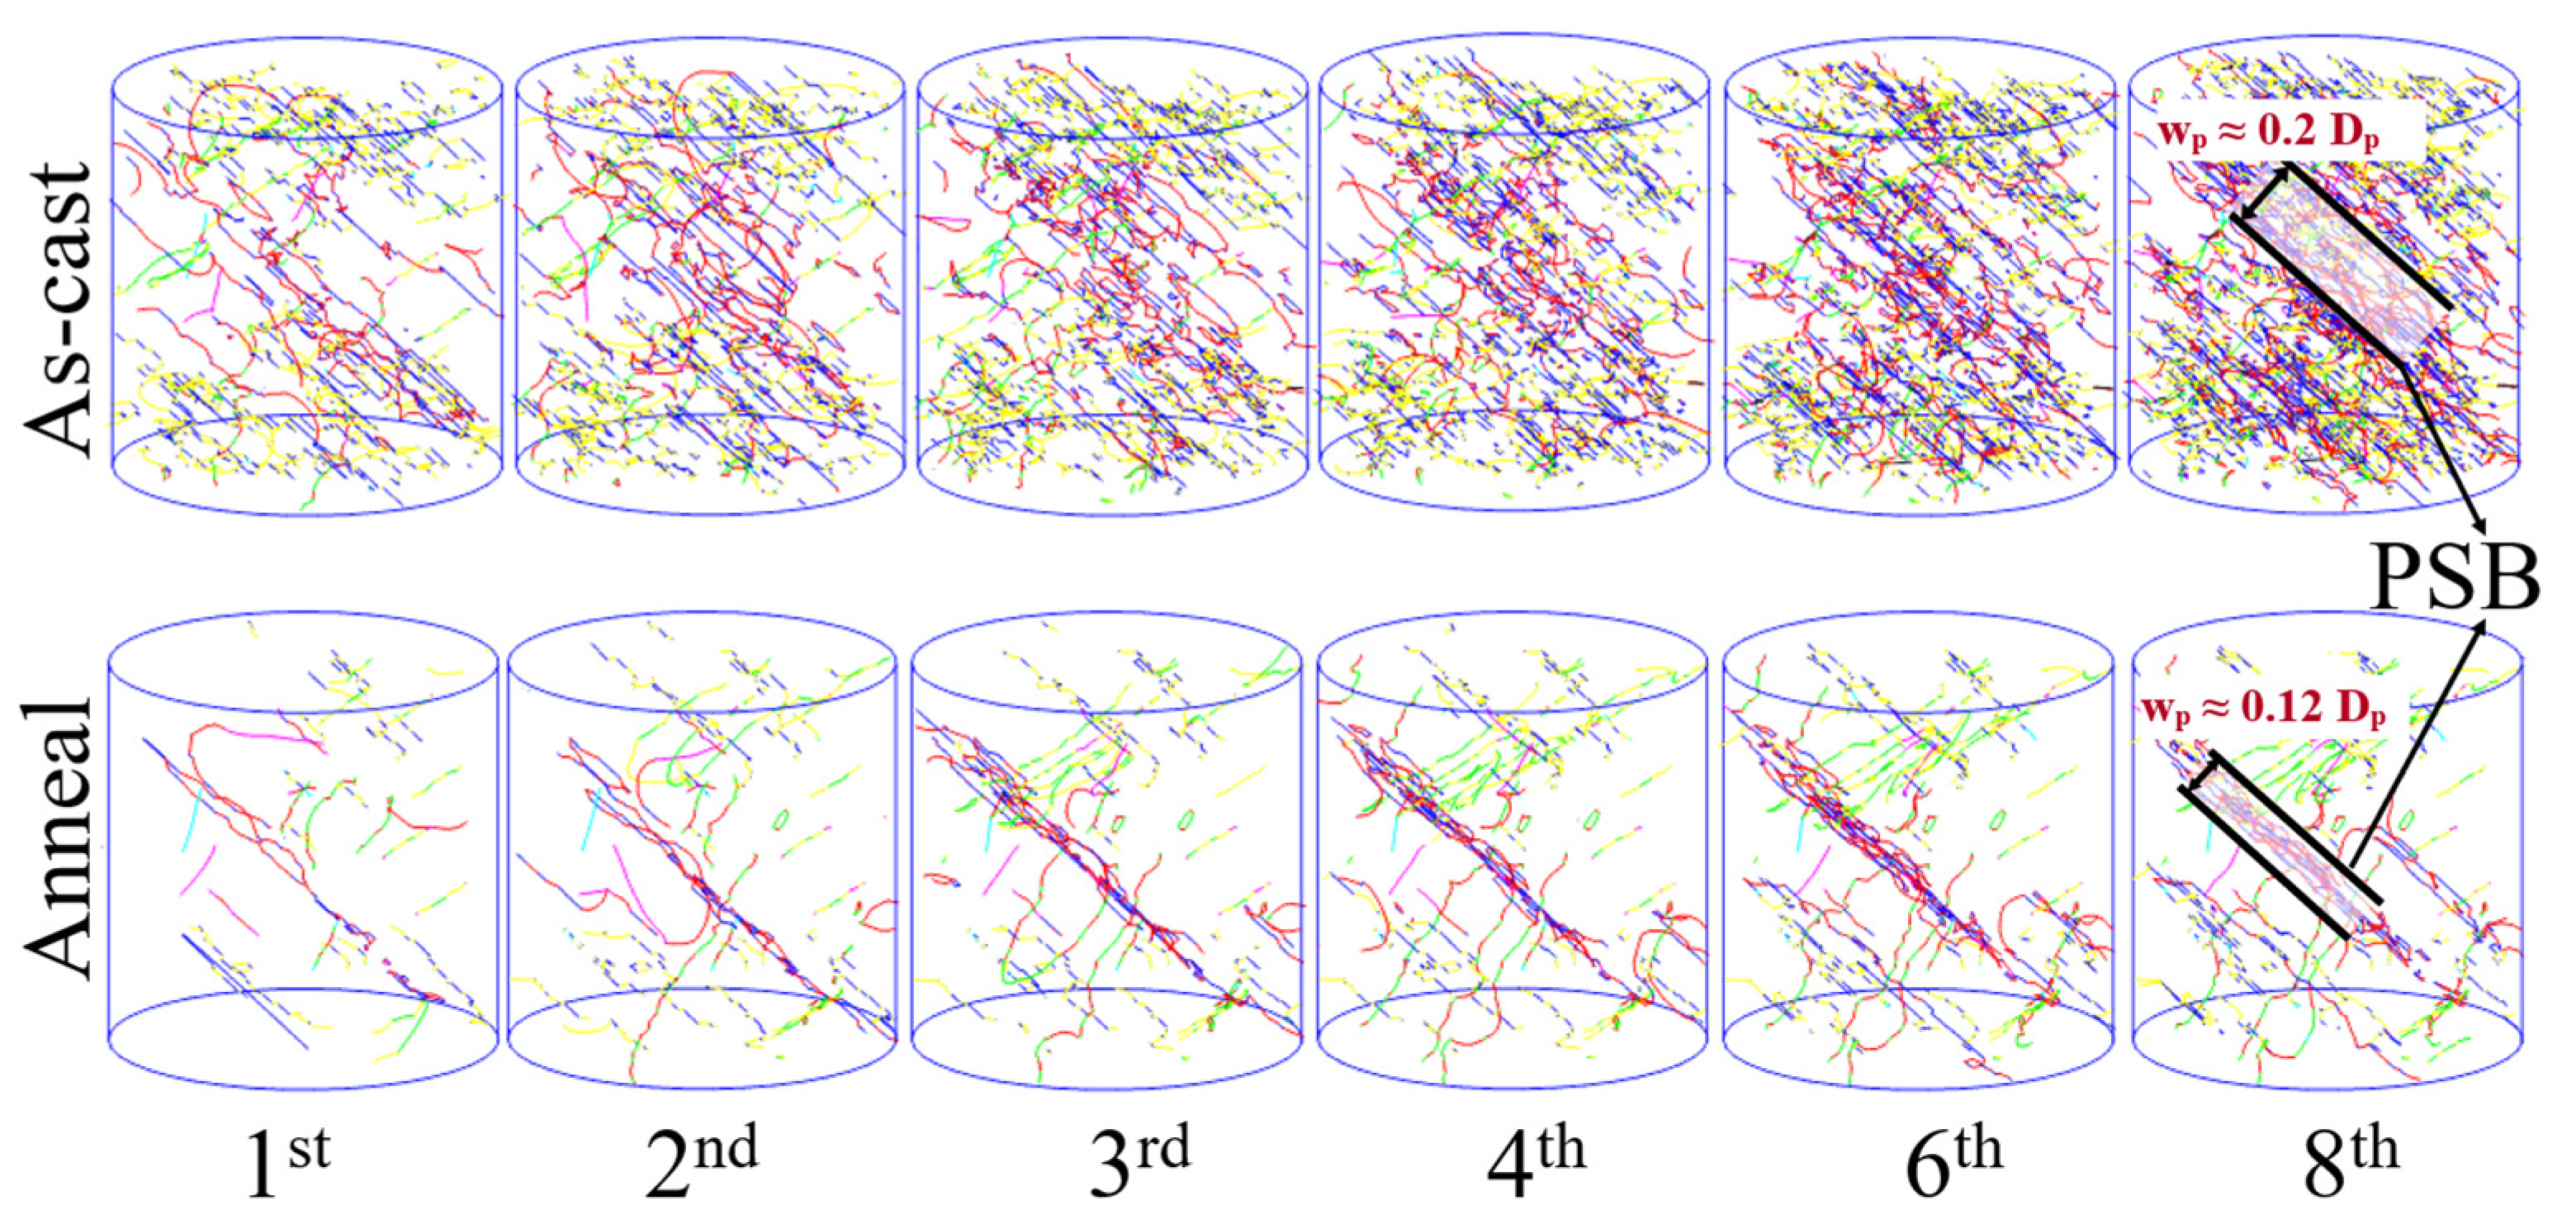
Figure 8 illustrates dislocation storage and spatial organization during cyclic loading in the examined realization for each reconstructed-field condition. In the as-cast sample, the network progressively becomes denser across much of the cylinder, with dislocation lines distributed over several slip systems. In contrast, a diagonal concentration of dislocations becomes visible in the annealed sample by Cycle 2 and remains identifiable in the selected snapshots through Cycle 8. The annealed sample thus develops a distinct band within a lower-density network, whereas the as-cast sample exhibits more extensive dislocation accumulation throughout the simulated domain.
Figure 8.
Dislocation configurations during cyclic straining. The top and bottom rows show the as-cast and annealed samples, respectively. Columns correspond to Cycles 1, 2, 3, 4, 6, and 8 at the same loading phase. Line colors denote active slip systems. In the Cycle 8 panels, the marked boundaries indicate the apparent projected band width, wp, defined by the full width at half maximum of the transverse colored-line-pixel occupancy profile. The measured width is approximately 0.20 Dp for the as-cast sample and 0.12 Dp for the annealed sample. Here, Dp denotes the projected cylinder diameter. These widths describe the two-dimensional band geometry at Cycle 8 in the examined realizations.
To quantify the transverse extent of the diagonal feature, the apparent projected band width, wp, was defined as the full width at half maximum of the transverse colored-line-pixel occupancy profile. Normalization by the projected cylinder diameter, Dp, provides a dimensionless measure for comparing the two samples. At the same loading phase in Cycle 8, wp is approximately 0.20 Dp for the as-cast sample and 0.12 Dp for the annealed sample, corresponding to an approximately 40% narrower projected band in the annealed sample. The boundaries used to indicate these widths are marked in the final column of Figure 8. This measurement describes the two-dimensional projected extent of the band. This descriptor quantifies the transverse extent at the selected loading phase. The approximately 40% reduction refers specifically to projected width, rather than to a corresponding increase in localization intensity or persistence.
Together with the dislocation-density evolution, the width comparison distinguishes the amount of stored dislocation line from the geometry of its spatial organization. The as-cast sample combines greater net dislocation storage with a broader diagonal feature and an extensive surrounding network. The annealed sample combines lower total dislocation density with a narrower band. These observations suggest that, in the present comparison, reduced dislocation storage can coexist with a more spatially confined band-associated structure under the two CSRO-associated reconstructed strain fields. Throughout this work, ‘PSB-like’ denotes the observed early-cycle diagonal morphology. Its identification in the selected snapshots describes the examined realization; it does not establish a mature, persistent slip band or statistical reproducibility of the band position.
3.4. Internal Stress Localization
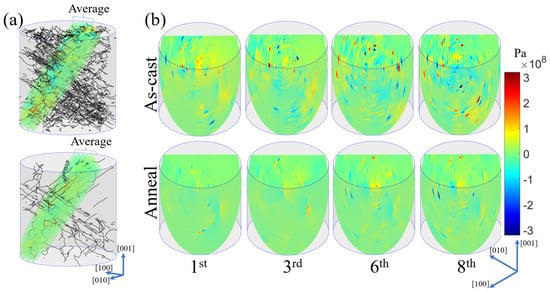
Figure 9 compares the dislocation configurations and the associated spatial distributions of the first stress invariant in the as-cast and annealed samples. Each stress component was calculated by superposing the non-singular stress fields of all straight dislocation segments [24]. The first invariant was then evaluated pointwise as
where denotes the dislocation-induced stress tensor, and , , and are its Cartesian normal components. Here, is the mean normal stress. With tension taken as positive, positive and negative values represent tensile and compressive mean normal stresses, respectively. characterizes the hydrostatic contribution and is not a measure of the deviatoric stress magnitude. All maps use the same color scale, spanning to Pa, allowing direct visual comparison across samples and cycles.
Figure 9.
Dislocation configurations and distributions of the first stress invariant in the as-cast and annealed samples. (a) Dislocation configurations showing the oblique sampling region. (b) Spatial maps of at cycles 1, 3, 6, and 8, from left to right. The top and bottom rows correspond to the as-cast and annealed samples, respectively. All maps share a color scale from to Pa. Positive and negative values indicate tensile and compressive mean normal stresses, respectively.
The as-cast sample displayed more widespread departures from the near-zero background, with neighboring positive and negative regions throughout the displayed field. These contrasting regions became more prominent at later cycles, indicating increasing spatial heterogeneity of the dislocation-induced mean normal stress. The annealed sample retained a larger near-zero background, although localized positive and negative features remained visible and evolved during cycling. Thus, the annealed sample did not exhibit a uniformly stress-free state; instead, its pronounced stress fluctuations were less spatially extensive in the displayed maps.
Together with the configurations in Figure 9a, these patterns are consistent with differences in the spatial organization of the dislocation networks. Superposition of the segment stress fields can reinforce or cancel local normal stresses, depending on the positions and orientations of the dislocations. Consequently, the distribution of reflects both dislocation content and network arrangement, rather than dislocation density alone. The maps qualitatively suggest more spatially distributed hydrostatic-stress heterogeneity in the as-cast sample and more restricted fluctuations in the annealed sample. Glide is driven by the resolved shear components of the total local stress, as specified in Section 2.4. The first-invariant maps characterize hydrostatic stress organization and are interpreted as a description of the evolving network, rather than direct evidence of the glide-driving mechanism. The stress maps in Figure 9 describe the contribution generated by the evolving dislocation network. This contribution changes during cycling and is distinct from the prescribed reconstructed chemical field, which provides the background heterogeneity for each sample. Future work could compare the magnitudes and spatial distributions of the reconstructed chemical stress and the dislocation-induced stress using consistent sampling and stress measures. This would help resolve their relative contributions during cyclic deformation.
4. Discussion
4.1. Association Between Field Statistics and Dislocation Organization
Within the examined reconstructed-field realizations, the as-cast and annealed samples exhibited distinct combinations of cyclic hysteresis, dislocation storage, and spatial organization. The as-cast sample developed wider hysteresis loops and greater net dislocation storage, whereas the annealed sample retained a lower dislocation density and a narrower diagonal network feature. Together, these results connect the macroscopic cyclic response with two complementary characteristics of the evolving microstructure: the amount of stored dislocation line and its spatial distribution.
In the as-cast sample, the wider hysteresis loops accompanied greater net line storage during cycling. The hysteresis response records the different loading and unloading paths, while the density evolution describes the accumulation of dislocation line within the simulated volume. Their combined evolution provides a more complete description of the cyclic response than either measure alone. The dislocation configurations add the spatial dimension to this comparison, showing how the stored line is distributed throughout the sample. Thus, the as-cast response is characterized by both substantial dislocation storage and a spatially distributed network.
The annealed sample exhibited a different combination of these features. Its lower total dislocation density coexisted with a narrower diagonal network structure in the examined realization. This contrast distinguishes dislocation accumulation from spatial concentration. Total density measures the line length per unit volume, whereas the network configuration identifies where that line is stored. A relatively small dislocation population can therefore form a distinct band when its spatial distribution is sufficiently concentrated. The narrower diagonal feature highlights this distinction between the quantity and organization of stored dislocations. The projected-width measurement supplies one geometric descriptor; the sensitivity comparisons in Figure 5 and Figure 6 assess macroscopic stress responses, rather than statistical reproducibility of this morphology.
This comparison places the reconstructed field statistics in the context of previous work on chemically complex BCC alloys. Atomistic studies have linked CSRO to changes in screw-dislocation barriers and mobility [6,7,8]. HfNbTa simulations have also reported SRO-associated reorganization of regions with a high probability of cross slip [9]. These findings establish the relevance of local chemical environments to the spatial distribution of dislocation activity. Earlier observations of collective dislocation motion in HfNbTa further emphasize the importance of spatial organization alongside dislocation density [13]. The present cyclic results add a complementary observation: greater net storage and a more concentrated network occur in different samples. Accordingly, cyclic deformation is most clearly understood by considering hysteresis, density evolution, and network morphology together. Their combined analysis distinguishes a storage-rich, distributed response in the as-cast sample from a lower-density, band-concentrated response in the annealed sample. The fractal dimensions and strain amplitudes were fitted together for each chemical state and entered the reconstruction as coupled descriptors. Accordingly, the network contrast is associated with the complete sample-specific prescribed fields. The phase-control comparison holds these fitted descriptors fixed, but does not separate the individual effects of amplitude and spatial scaling or isolate CSRO as a unique causal variable.
4.2. Cross Slip-Mediated First-Cycle Processes
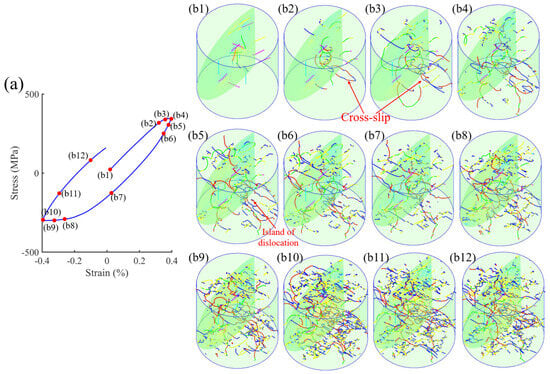
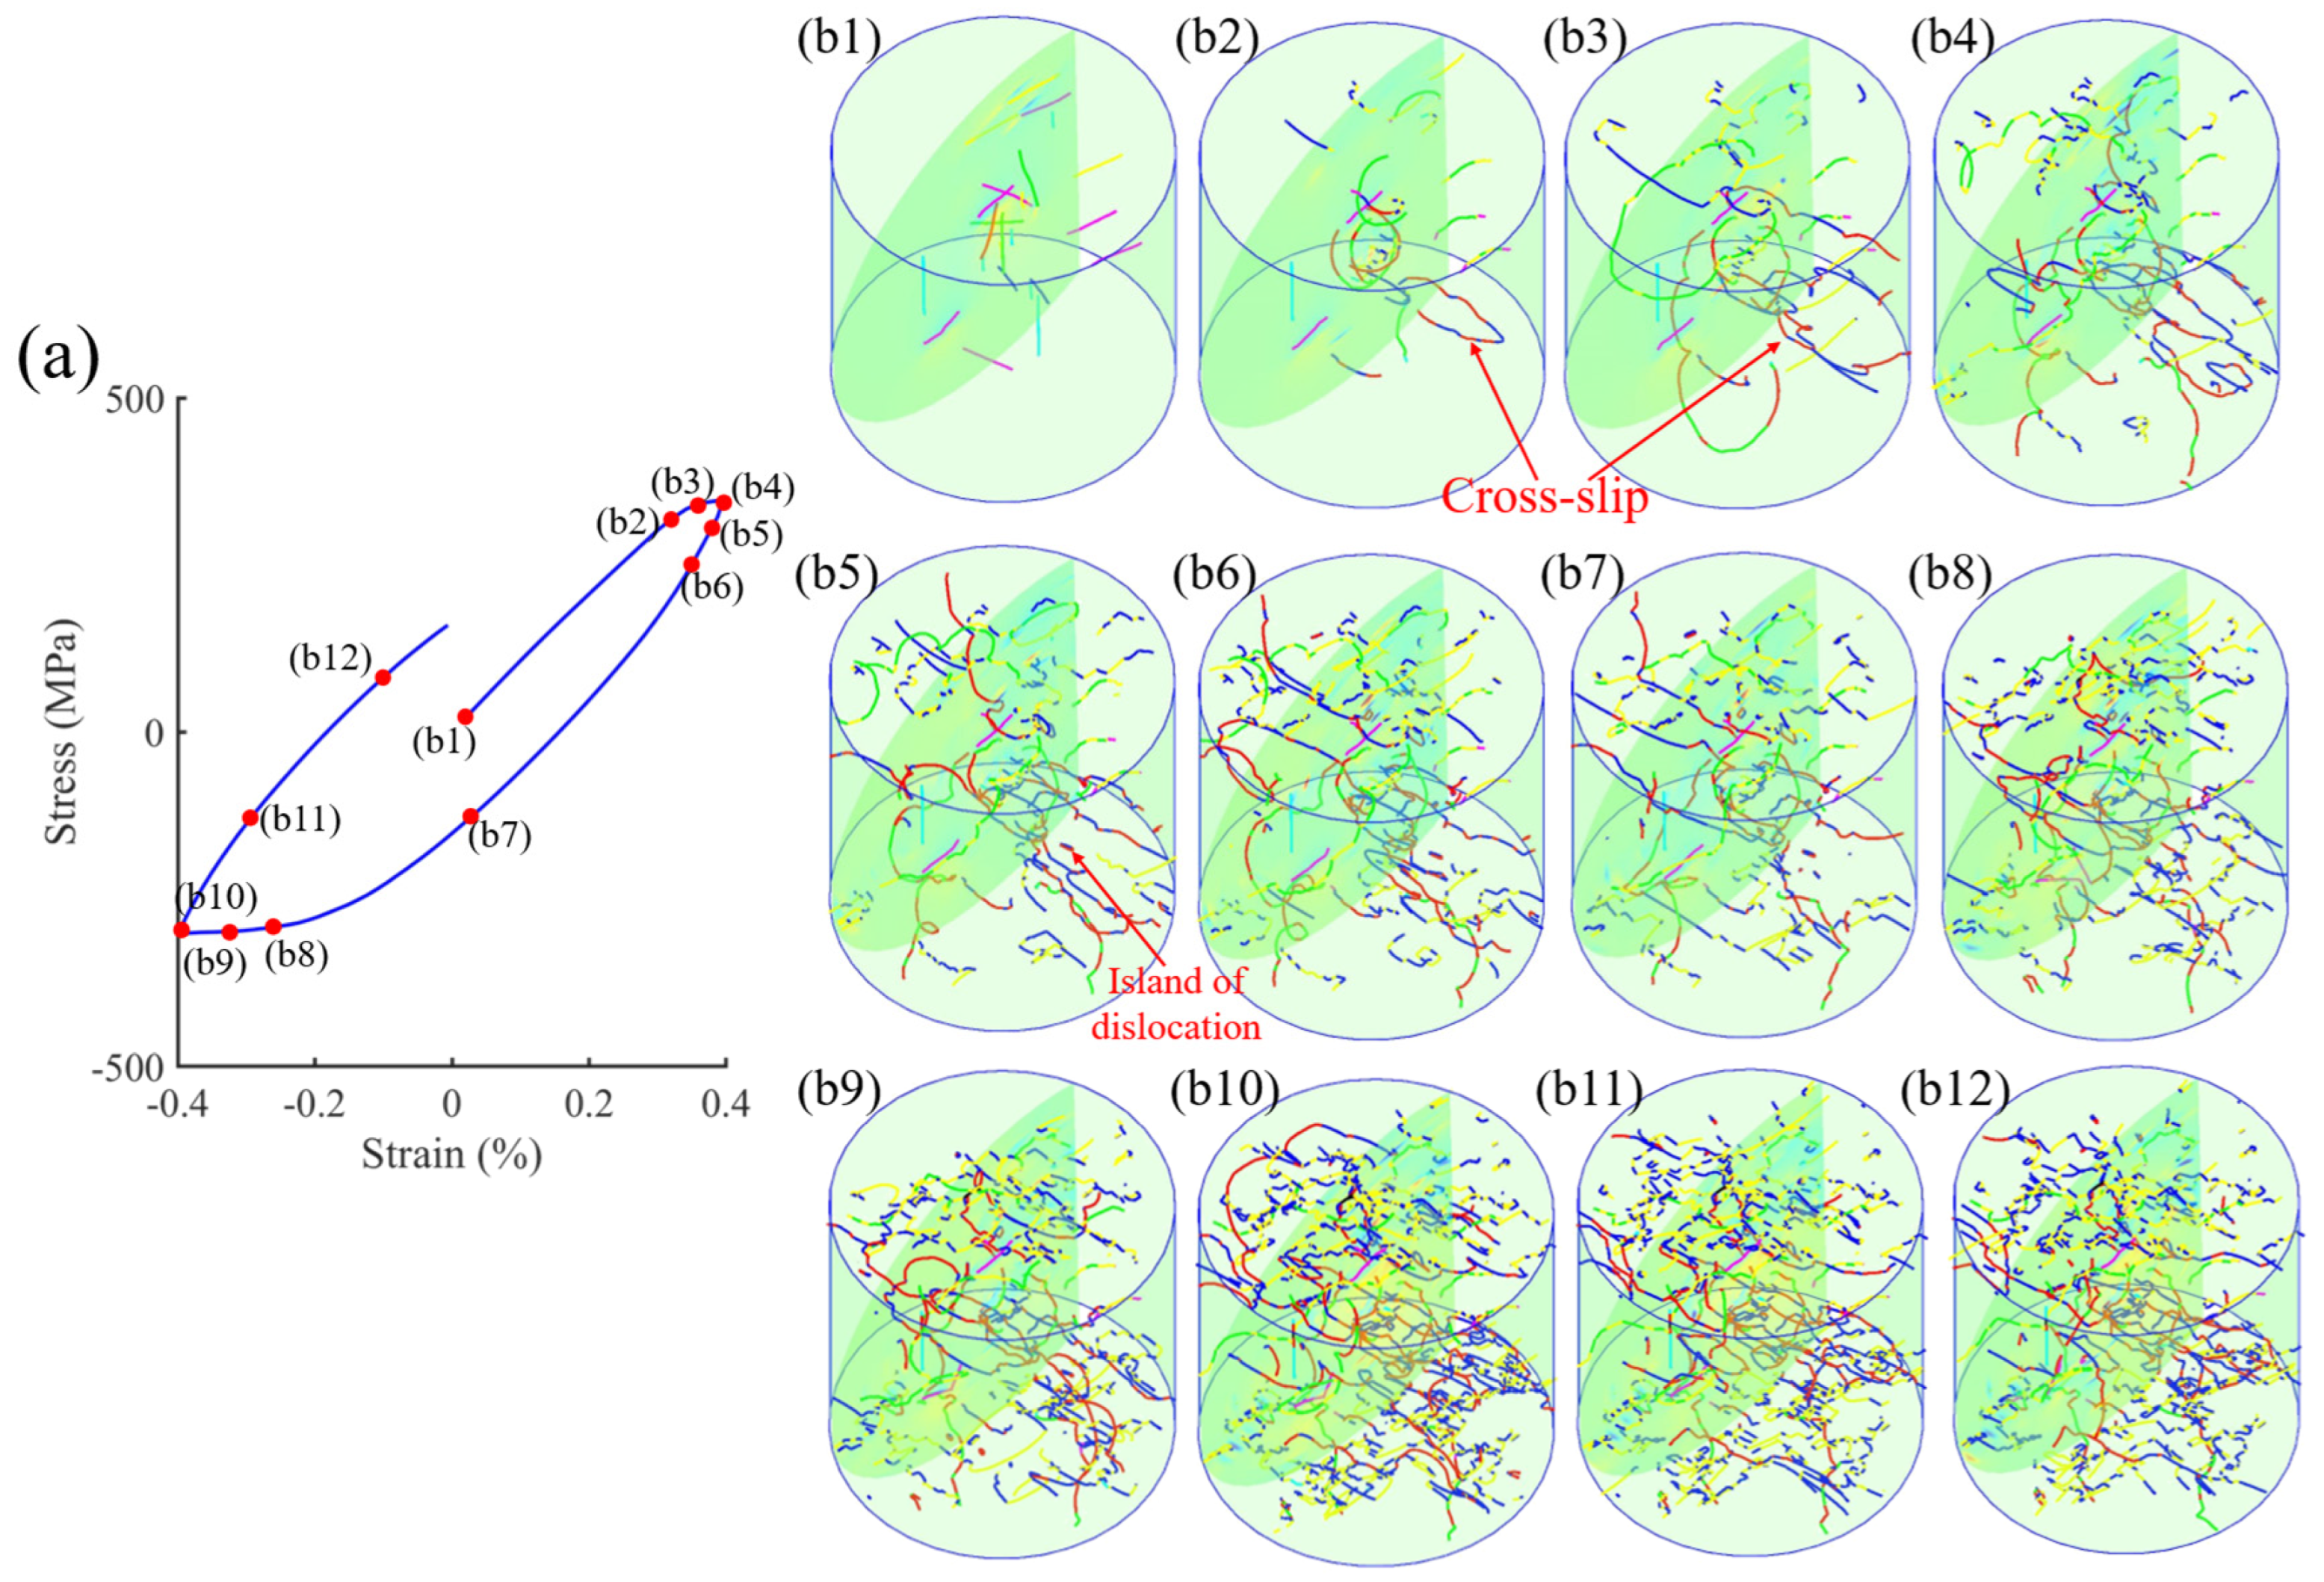
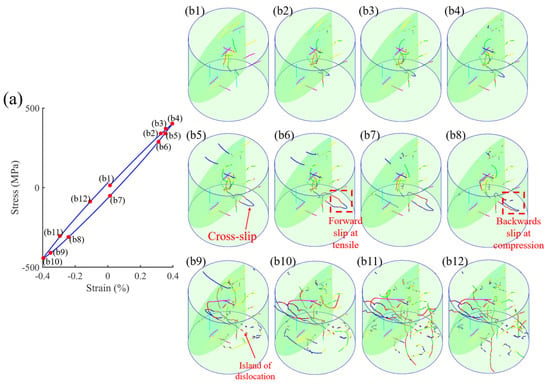
Figure 10 and Figure 11 connect the first-cycle stress–strain trajectories with the evolution of the dislocation configurations in the as-cast and annealed samples. The selected loading points reveal how forward glide, reverse glide, and changes in network connectivity accompany the cyclic response. The as-cast sample develops a progressively more extensive network, whereas the annealed sample retains a comparatively sparse configuration over much of the displayed sequence. Cross slip is identified in both samples, showing that it participates in the evolution of both networks.
Figure 10.
First-cycle dislocation evolution in the as-cast sample. (a) Stress-strain trajectory with selected loading points. (b1–b12) Corresponding dislocation configurations showing network development, a marked cross-slip event, and an isolated dislocation structure. Panels (b1–b12) correspond to the marked trajectory points. Line colors denote slip systems.
Figure 11.
First-cycle dislocation evolution in the annealed sample. (a) Stress–strain trajectory with selected loading points. (b1–b12) Corresponding configurations showing a marked cross-slip event, forward glide during tension, partial reverse glide during compression, and isolated-loop formation. Dashed boxes highlight the segment used to illustrate forward and reverse motion.
In the as-cast sample, the initially sparse dislocation configuration expands into a network containing numerous curved and intersecting lines (Figure 10). The marked cross-slip event identifies a transfer between glide planes during this development. Such a transfer changes the spatial path of the participating segment and brings it into a different local arrangement of neighboring dislocations. The subsequent configurations contain an increasingly complex network, together with the isolated structure indicated in the figure. These retained structures distinguish the evolving network from a simple collection of dislocations moving back and forth along unchanged paths. The extensive network development accompanies the wider hysteresis response of the as-cast sample.
Figure 11 more clearly resolves the coexistence of reverse motion and retained structures in the annealed sample. The highlighted segment moves forward during tension and partially retraces its motion during compression. This sequence provides a local example of reversible glide following load reversal. Meanwhile, the marked cross-slip event and isolated-loop formation show that the network also undergoes configurational changes during the same cycle. Reverse glide and irreversible structural rearrangement therefore coexist within the annealed sample. The lower overall line content makes these individual processes more readily distinguishable than in the denser as-cast network.
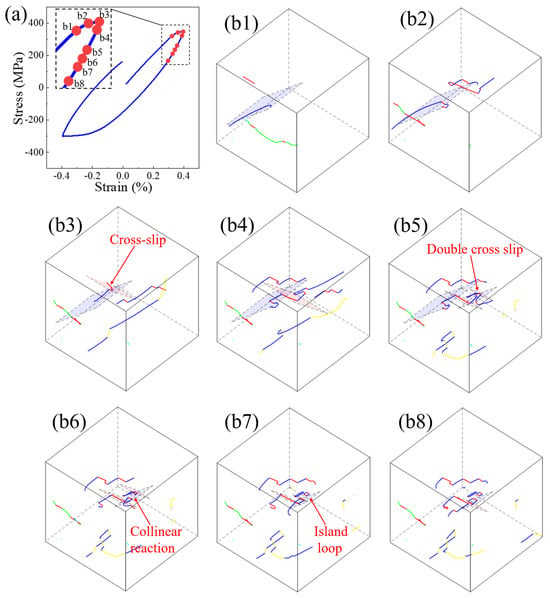
Figure 12 resolves a specific pathway linking cross slip to isolated-loop formation in the as-cast sample. The marked screw segment first transfers from its original glide plane to another plane. Subsequent double cross slip returns part of the line to the original slip-plane family, producing a rearranged configuration spanning the illustrated planes. The following collinear reaction changes the connectivity of the interacting segments and leaves an isolated dislocation loop. The loop remains visible in the subsequent configuration, providing a direct example of retained line structure following the reaction.
Figure 12.
Cross-slip-mediated reaction sequence in the as-cast sample. (a) First-cycle stress–strain trajectory with selected loading points. (b1–b8) Corresponding local configurations showing cross slip, double cross slip, a collinear reaction, and the resulting isolated dislocation loop. The illustrated planes identify the geometry of the slip-plane transfers.
This sequence explains why a return between slip planes does not necessarily restore the initial dislocation configuration. Once the transferred segment interacts with neighboring lines, the resulting topology differs from that before cross slip. The isolated loop is therefore a structural outcome of the combined transfer and reaction sequence, rather than simply a displaced portion of the original line. This interpretation complements earlier descriptions of cross-slip-mediated network development in DDD [10] and dislocation redistribution in heterogeneous HfNbTa stress fields [9].
Together, Figure 10, Figure 11 and Figure 12 identify two complementary aspects of first-cycle deformation. Forward and reverse glide describe the motion of existing segments, while cross slip and subsequent reactions alter their spatial arrangement and connectivity. The as-cast sample exhibits extensive network development and retained line structures, whereas the annealed sample shows readily identifiable reverse glide within a comparatively sparse network. The resolved reaction sequence links the observed cross-slip events to the formation of stored dislocation structures and provides a mechanistic interpretation of the contrasting first-cycle configurations.
4.3. High-Stress Regions and Model Boundaries
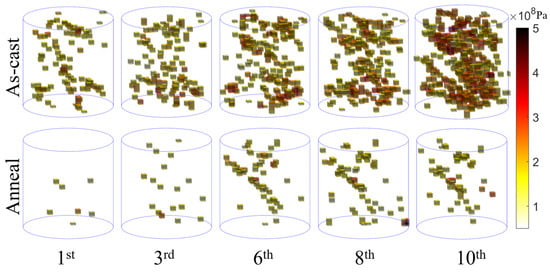
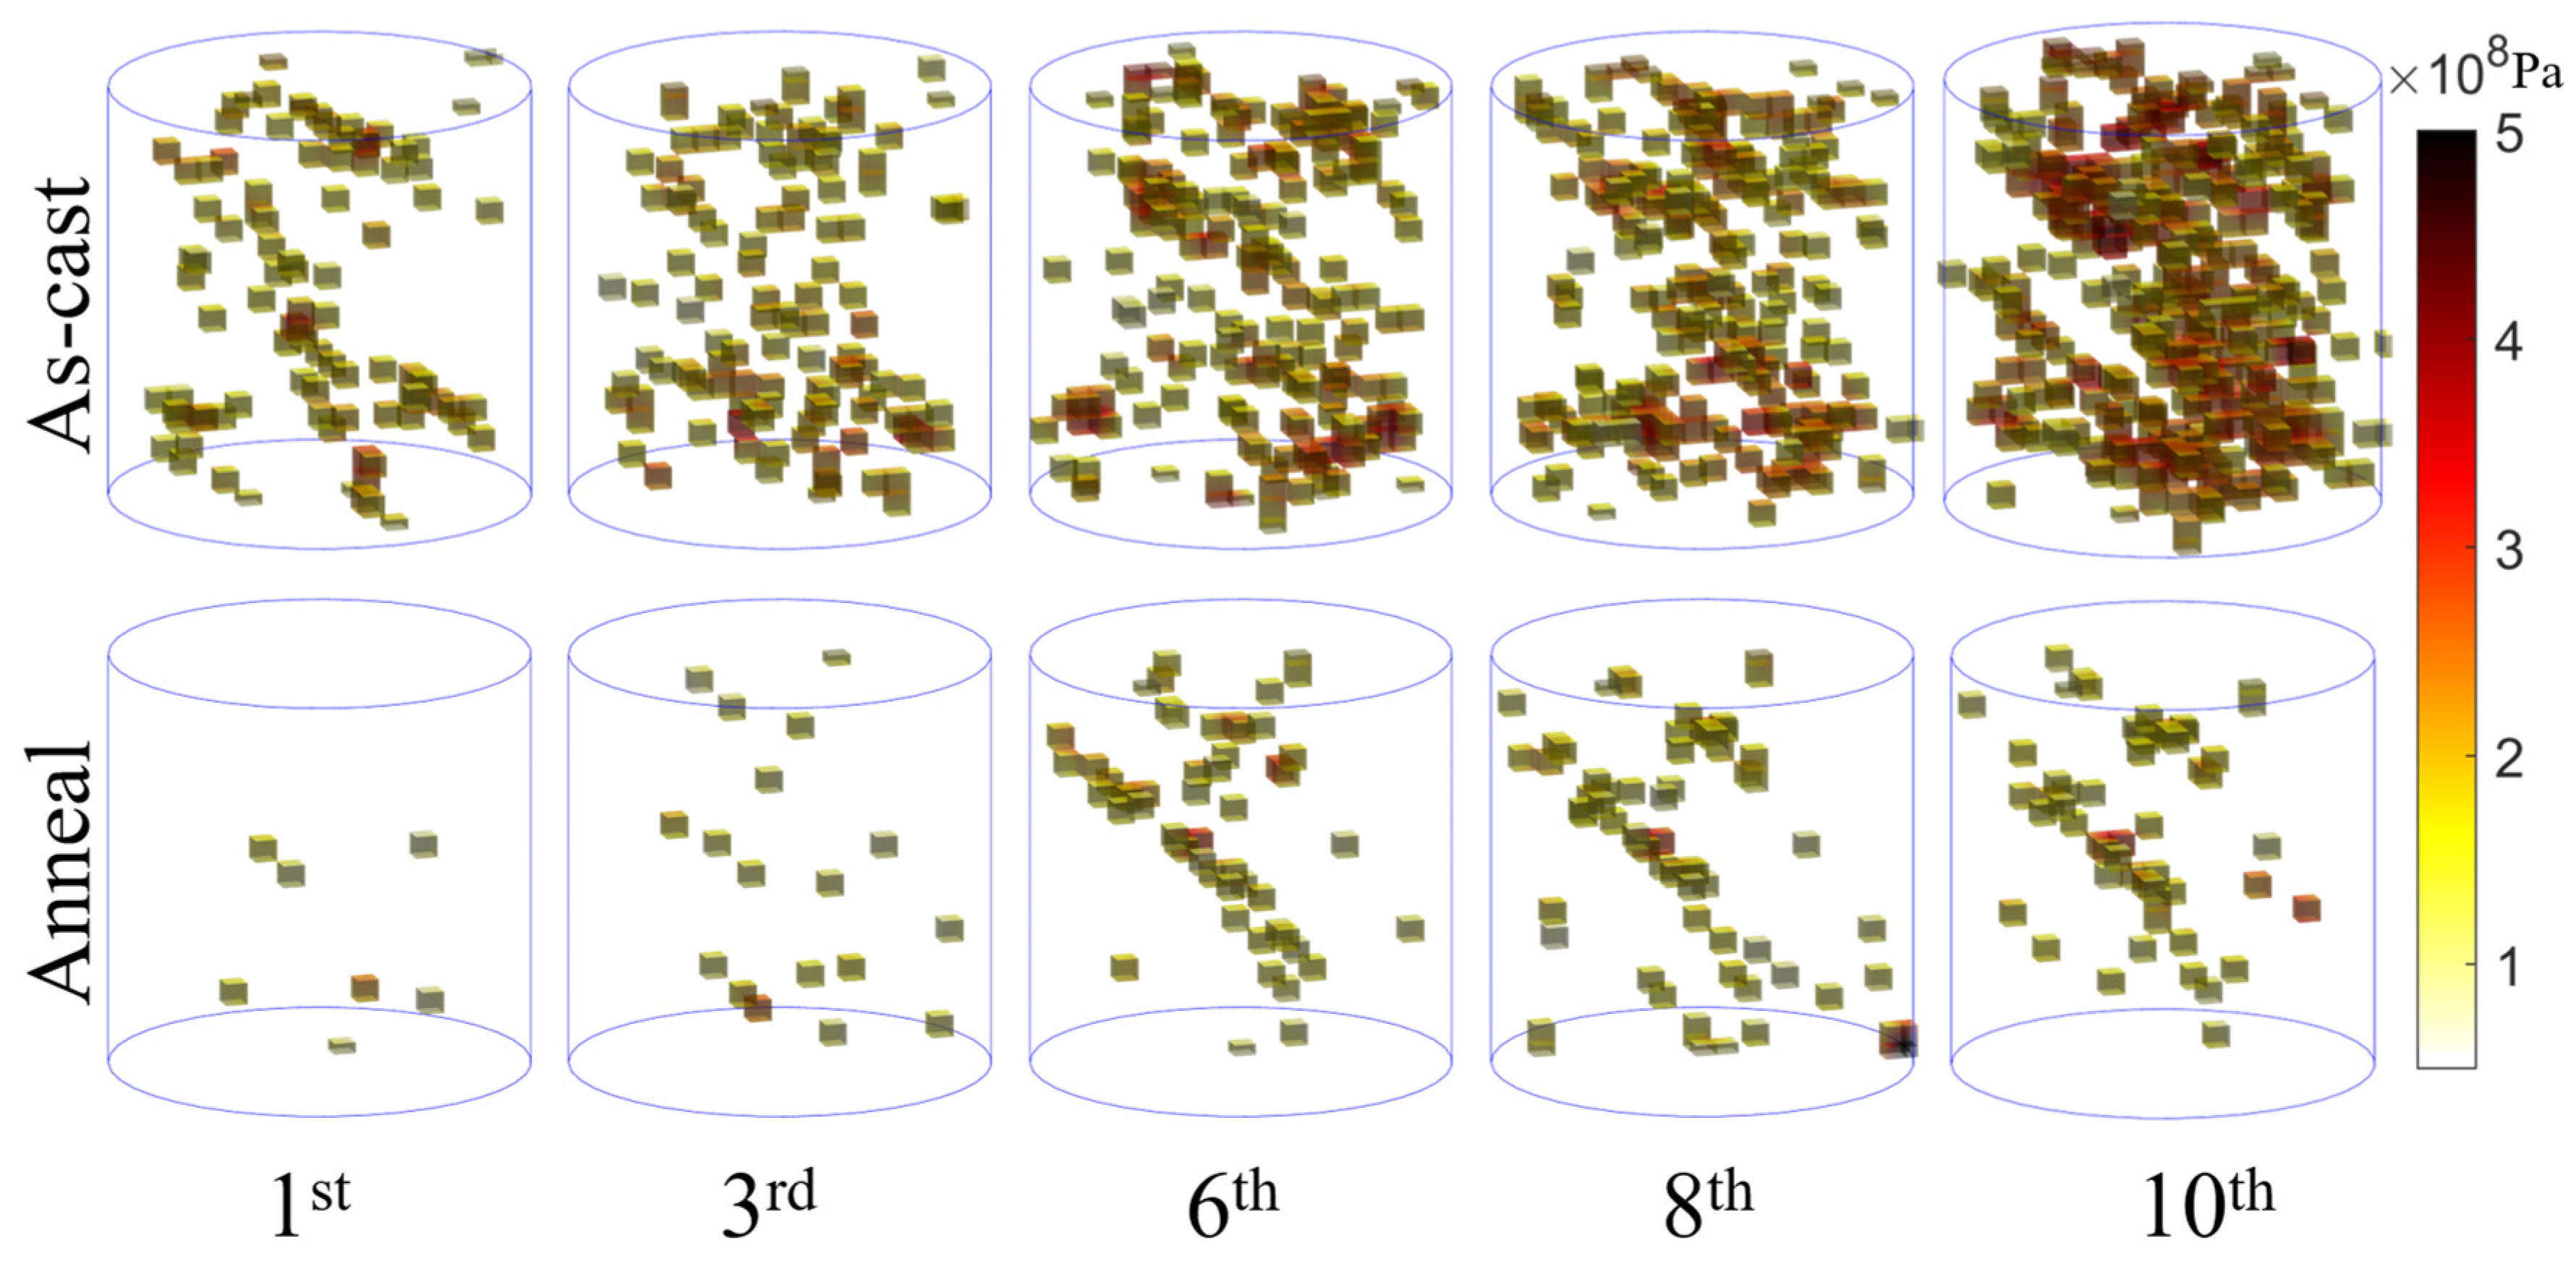
Figure 13 shows the spatial distribution of regions where the von Mises stress exceeds 300 MPa during cyclic loading. In the as-cast sample, the selected regions were distributed across much of the cylinder from the early snapshots. As cycling progressed, these regions formed a more extensive pattern, with additional concentrations appearing at different heights and transverse positions. The later snapshots exhibited a crowded distribution encompassing both the central region and locations near the cylindrical surface. This evolution accompanies the development of the dense, spatially distributed dislocation network shown in Figure 8.
Figure 13.
Spatial distribution of regions selected by a von Mises stress threshold of 300 MPa at the indicated cycles. The top and bottom rows show the as-cast and annealed samples, respectively. In the examined realizations, the as-cast sample exhibits broadly distributed high-stress regions, whereas the annealed sample exhibits fewer selected regions with a distinct diagonal arrangement. The threshold selects elevated equivalent stress; it does not directly measure resolved shear stress on a slip system.
The annealed sample exhibited a different spatial pattern. The early snapshots contained relatively few isolated regions exceeding the threshold. During subsequent cycles, the selected regions developed a recognizable diagonal arrangement, while several isolated concentrations remained outside this feature. This arrangement remained visible in the later snapshots and resembled the orientation of the diagonal dislocation structure in Figure 8. Compared with the as-cast sample, the annealed sample therefore exhibited a more spatially confined distribution of the selected high-stress regions.
Together, Figure 8 and Figure 13 distinguish the extent of dislocation accumulation from the spatial organization of elevated stresses. The as-cast sample combines greater net dislocation storage with a widespread distribution of regions exceeding the von Mises stress threshold. The annealed sample combines lower total dislocation density with a narrower diagonal network and a similarly oriented arrangement of high-stress regions. Thus, lower overall dislocation storage coexists with localized stress concentrations along a preferred direction. These complementary observations characterize different patterns of network development and stress organization under the two CSRO-associated reconstructed strain fields. Von Mises stress characterizes the magnitude of the deviatoric stress and is distinct from the hydrostatic measure displayed in Figure 9. Its thresholded distribution describes elevated equivalent stress, whereas the resolved shear stress on each slip system determines the glide-driving contribution. The spatial correspondence is therefore interpreted as co-organization of the network and its stress pattern. The diagonal arrangement remains an observation from the examined realizations; connected-region statistics and comparisons across additional realizations would extend this spatial characterization.
5. Conclusions
This work presents a framework combining hybrid MC/MD sampling, statistical strain-field reconstruction, and DDD simulations to compare the early cyclic deformation of as-cast and annealed HfNbTa. The direct DDD inputs were reconstructed heterogeneous fields containing sample-specific descriptors fitted to the atomistic strain data. Within the reconstructed-field realizations examined, the as-cast sample exhibited wider hysteresis loops, greater net dislocation storage, and a more spatially distributed network. The annealed sample retained a lower dislocation density while developing a narrower diagonal concentration of dislocations. At Cycle 8, the apparent projected band widths were approximately 0.20 and 0.12 times the projected cylinder diameter, respectively. This geometric comparison describes the transverse band extent and complements the total-density measurement; it does not quantify localization intensity or long-term persistence. The additional initial-configuration and phase comparisons demonstrated comparable macroscopic stress responses across the tested cases. The diagonal PSB-like morphology remains an early-cycle observation in the examined network realizations. The first-invariant maps characterize dislocation-induced hydrostatic stress organization, while the von Mises threshold maps characterize elevated equivalent stress; glide is driven by resolved shear components of the total local stress. Taken together, the results distinguish stored dislocation content from its spatial organization under complete CSRO-associated reconstructed fields. Because the fitted field descriptors vary together, the comparison does not assign separate causal effects to amplitude, fractal dimension, or CSRO. The effectiveness of the framework may be influenced by many factors with uncertainty, and future work is required to refine the key parameters for adapting to different materials systems and experimental conditions. Future calculations with additional network and field realizations, together with controlled descriptor variations, would extend the assessment of morphology reproducibility and parameter sensitivity.
Author Contributions
Conceptualization, Y.W. and F.Z.; methodology, Y.W., S.S. and F.Z.; software, Y.W. and S.S.; validation, S.S. and F.Z.; formal analysis, Y.W.; investigation, Y.W. and S.S.; data curation, Y.W. and S.S.; visualization, Y.W. and S.S.; writing—original draft preparation, Y.W.; writing—review and editing, S.S. and F.Z.; supervision, F.Z.; project administration, F.Z.; funding acquisition, F.Z. All authors have read and agreed to the published version of the manuscript.
Funding
This research was funded by the Guangxi Science and Technology Major Program, grant numbers 2024AA26001-GUIKEAA24263071-1 and GUIKE LT2504240017-3, and the Key Scientific Research Project of the Hunan Provincial Department of Education, grant number 25A0670.
Data Availability Statement
The simulation data and post-processing files supporting the findings of this study are available from the corresponding author upon reasonable request.
Acknowledgments
The authors thank the School of Automotive and Transportation Engineering at Hunan University for providing computational resources for the coupled MC/MD-3D DDD simulations.
Conflicts of Interest
The authors declare no conflicts of interest.
References
- Xu, L.; Jia, Y.; Wu, S.; Mu, Y.; Jia, Y.; Wang, G. Low cycle fatigue properties of refractory high-entropy HfNbTiZr alloy. Intermetallics 2023, 152, 107751. [Google Scholar] [CrossRef] [Scilit]
- Chen, S.; Li, W.; Wang, L.; Yuan, T.; Tong, Y.; Tseng, K.-K.; Yeh, J.-W.; Xiong, Q.; Wu, Z.; Zhang, F.; et al. Stress-controlled fatigue of HfNbTaTiZr high-entropy alloy and associated deformation and fracture mechanisms. J. Mater. Sci. Technol. 2022, 114, 191–205. [Google Scholar] [CrossRef] [Scilit]
- Lavenstein, S.; Gu, Y.; Madisetti, D.; El-Awady, J.A. The heterogeneity of persistent slip band nucleation and evolution in metals at the micrometer scale. Science 2020, 370, eabb2690. [Google Scholar] [CrossRef] [Scilit] [PubMed]
- Zhang, P.; Zhang, L.; Baxevanakis, K.; Lu, S.; Zhao, L.; Bullough, C. Discrete crystal plasticity modelling of slip-controlled cyclic deformation and short crack growth under low cycle fatigue. Int. J. Fatigue 2021, 145, 106095. [Google Scholar] [CrossRef] [Scilit]
- Tong, Y.; Zhao, S.; Bei, H.; Egami, T.; Zhang, Y.; Zhang, F. Severe local lattice distortion in Zr- and/or Hf-containing refractory multi-principal element alloys. Acta Mater. 2020, 183, 172–181. [Google Scholar] [CrossRef] [Scilit]
- Yin, S.; Zuo, Y.; Abu-Odeh, A.; Zheng, H.; Li, X.-G.; Ding, J.; Ong, S.P.; Asta, M.; Ritchie, R.O. Atomistic simulations of dislocation mobility in refractory high-entropy alloys and the effect of chemical short-range order. Nat. Commun. 2021, 12, 4873. [Google Scholar] [CrossRef] [Scilit] [PubMed]
- Wang, S.D.; Liu, X.J.; Lei, Z.F.; Lin, D.Y.; Bian, F.G.; Yang, C.M.; Jiao, M.Y.; Du, Q.; Wang, H.; Wu, Y.; et al. Chemical short-range ordering and its strengthening effect in refractory high-entropy alloys. Phys. Rev. B 2021, 103, 104107. [Google Scholar] [CrossRef] [Scilit]
- Wang, W.; Walsh, F.; Ritchie, R.O.; Asta, M. Elucidating the roles of chemistry, compositional complexity, and short-range order in the dislocation energetics of body-centered-cubic concentrated solid solutions. Phys. Rev. Mater. 2024, 8, 013608. [Google Scholar] [CrossRef] [Scilit]
- Zhang, Q.; Chen, Y.; Liu, B.; Zhang, R.; Fang, Q.; Liaw, P.K.; Li, J. Short-range order governs plastic flow localization in irradiated multi-principal element alloys. Scr. Mater. 2026, 274, 117141. [Google Scholar] [CrossRef] [Scilit]
- Meng, F.; Ferrié, E.; Déprés, C.; Fivel, M. 3D discrete dislocation dynamic investigations of persistent slip band formation in FCC metals under cyclical deformation. Int. J. Fatigue 2021, 149, 106234. [Google Scholar] [CrossRef] [Scilit]
- Po, G.; Cui, Y.; Rivera, D.; Cereceda, D.; Swinburne, T.D.; Marian, J.; Ghoniem, N. A phenomenological dislocation mobility law for bcc metals. Acta Mater. 2016, 119, 123–135. [Google Scholar] [CrossRef] [Scilit]
- Fan, H.; Wang, Q.; El-Awady, J.A.; Raabe, D.; Zaiser, M. Strain rate dependency of dislocation plasticity. Nat. Commun. 2021, 12, 1845. [Google Scholar] [CrossRef] [Scilit] [PubMed]
- Chen, Y.; Feng, H.; Li, J.; Liu, B.; Jiang, C.; Liu, Y.; Fang, Q.; Liaw, P.K. Dislocation flow turbulence simultaneously enhances strength and ductility. Proc. Natl. Acad. Sci. USA 2024, 121, e2316912121. [Google Scholar] [CrossRef] [Scilit] [PubMed]
- Plimpton, S. Fast Parallel Algorithms for Short-Range Molecular Dynamics. J. Comput. Phys. 1995, 117, 1–19. [Google Scholar] [CrossRef] [Scilit]
- Maiti, S.; Steurer, W. Structural-disorder and its effect on mechanical properties in single-phase TaNbHfZr high-entropy alloy. Acta Mater. 2016, 106, 87–97. [Google Scholar] [CrossRef] [Scilit]
- Stukowski, A. Visualization and analysis of atomistic simulation data with OVITO-the Open Visualization Tool. Model. Simul. Mater. Sci. Eng. 2010, 18, 015012. [Google Scholar] [CrossRef] [Scilit]
- de Fontaine, D. The number of independent pair-correlation functions in multicomponent systems. J. Appl. Crystallogr. 1971, 4, 15–19. [Google Scholar] [CrossRef] [Scilit]
- Cowley, J.M. Short-range ordering in crystals. In Advances in High Temperature Chemistry; Eyring, L., Ed.; Academic Press: New York, NY, USA, 1971; Volume 5, pp. 35–85. [Google Scholar] [CrossRef] [Scilit]
- Ausloos, M.; Berman, D.H. A multivariate Weierstrass-Mandelbrot function. Proc. R. Soc. Lond. A 1985, 400, 331–350. [Google Scholar] [CrossRef] [Scilit]
- Yan, W.; Komvopoulos, K. Contact analysis of elastic-plastic fractal surfaces. J. Appl. Phys. 1998, 84, 3617–3624. [Google Scholar] [CrossRef] [Scilit]
- Kulesza, S.; Bramowicz, M. A comparative study of correlation methods for determination of fractal parameters in surface characterization. Appl. Surf. Sci. 2014, 293, 196–201. [Google Scholar] [CrossRef] [Scilit]
- Bulatov, V.V.; Hsiung, L.L.; Tang, M.; Arsenlis, A.; Bartelt, M.C.; Cai, W.; Florando, J.N.; Hiratani, M.; Rhee, M.; Hommes, G.; et al. Dislocation multi-junctions and strain hardening. Nature 2006, 440, 1174–1178. [Google Scholar] [CrossRef] [Scilit] [PubMed]
- Weinberger, C.R.; Cai, W. Computing image stress in an elastic cylinder. J. Mech. Phys. Solids 2007, 55, 2027–2054. [Google Scholar] [CrossRef] [Scilit]
- Cai, W.; Arsenlis, A.; Weinberger, C.R.; Bulatov, V.V. A non-singular continuum theory of dislocations. J. Mech. Phys. Solids 2006, 54, 561–587. [Google Scholar] [CrossRef] [Scilit]
- Cui, Y.; Po, G.; Ghoniem, N.M. A coupled dislocation dynamics-continuum barrier field model with application to irradiated materials. Int. J. Plast. 2018, 104, 54–67. [Google Scholar] [CrossRef] [Scilit]
- Arsenlis, A.; Rhee, M.; Hommes, G.; Cook, R.; Marian, J. A dislocation dynamics study of the transition from homogeneous to heterogeneous deformation in irradiated body-centered cubic iron. Acta Mater. 2012, 60, 3748–3757. [Google Scholar] [CrossRef] [Scilit]
- Ryu, I.; Nix, W.D.; Cai, W. Plasticity of bcc micropillars controlled by competition between dislocation multiplication and depletion. Acta Mater. 2013, 61, 3233–3241. [Google Scholar] [CrossRef] [Scilit]
- Ryu, I.; Cai, W.; Nix, W.D.; Gao, H. Stochastic behaviors in plastic deformation of face-centered cubic micropillars governed by surface nucleation and truncated source operation. Acta Mater. 2015, 95, 176–183. [Google Scholar] [CrossRef] [Scilit]
- Senger, J.; Weygand, D.; Motz, C.; Gumbsch, P.; Kraft, O. Aspect ratio and stochastic effects in the plasticity of uniformly loaded micrometer-sized specimens. Acta Mater. 2011, 59, 2937–2947. [Google Scholar] [CrossRef] [Scilit]
- Tang, H.; Schwarz, K.W.; Espinosa, H.D. Dislocation-Source Shutdown and the Plastic Behavior of Single-Crystal Micropillars. Phys. Rev. Lett. 2008, 100, 185503. [Google Scholar] [CrossRef] [Scilit] [PubMed]
- Senger, J.; Weygand, D.; Motz, C.; Gumbsch, P.; Kraft, O. Evolution of mechanical response and dislocation microstructures in small-scale specimens under slightly different loading conditions. Philos. Mag. 2010, 90, 617–628. [Google Scholar] [CrossRef] [Scilit]
- Motz, C.; Weygand, D.; Senger, J.; Gumbsch, P. Initial dislocation structures in 3-D discrete dislocation dynamics and their influence on microscale plasticity. Acta Mater. 2009, 57, 1744–1754. [Google Scholar] [CrossRef] [Scilit]
- Cui, Y.; Po, G.; Ghoniem, N. Temperature insensitivity of the flow stress in body-centered cubic micropillar crystals. Acta Mater. 2016, 108, 128–137. [Google Scholar] [CrossRef] [Scilit]
- Eleti, R.R.; Stepanov, N.; Yurchenko, N.; Klimenko, D.; Zherebtsov, S. Plastic deformation of solid-solution strengthened Hf-Nb-Ta-Ti-Zr body-centered cubic medium/high-entropy alloys. Scr. Mater. 2021, 200, 113927. [Google Scholar] [CrossRef] [Scilit]
- Rhee, M.; Zbib, H.M.; Hirth, J.P.; Huang, H.; Diaz de la Rubia, T. Models for long-/short-range interactions and cross slip in 3D dislocation simulation of BCC single crystals. Model. Simul. Mater. Sci. Eng. 1998, 6, 467–492. [Google Scholar] [CrossRef] [Scilit]
- Diaz de la Rubia, T.; Zbib, H.M.; Khraishi, T.A.; Wirth, B.D.; Victoria, M.; Caturla, M.J. Multiscale modelling of plastic flow localization in irradiated materials. Nature 2000, 406, 871–874. [Google Scholar] [CrossRef] [Scilit] [PubMed]
- Akarapu, S.; Zbib, H.; Bahr, D. Analysis of heterogeneous deformation and dislocation dynamics in single crystal micropillars under compression. Int. J. Plast. 2010, 26, 239–257. [Google Scholar] [CrossRef] [Scilit]

Disclaimer/Publisher’s Note: The statements, opinions and data contained in all publications are solely those of the individual author(s) and contributor(s) and not of MDPI and/or the editor(s). MDPI and/or the editor(s) disclaim responsibility for any injury to people or property resulting from any ideas, methods, instructions or products referred to in the content. |
© 2026 by the authors. Licensee MDPI, Basel, Switzerland. This article is an open access article distributed under the terms and conditions of the Creative Commons Attribution (CC BY) license.