


Abstract
Mali garnet is a gem-quality variety of the grossular–andradite solid-solution series and exhibits a wide range of colors, from near-colorless through light yellow, medium yellow, yellow, yellow-green, green with a yellow tint, to green. In this study, 38 faceted samples commercially represented as Mali garnet were investigated using energy-dispersive X-ray fluorescence (ED-XRF), ultraviolet–visible (UV–Vis) reflectance spectroscopy, Fourier transform infrared (FTIR) spectroscopy, and Commission Internationale de l’Éclairage (CIE) 1976 L*a*b* (CIELab) colorimetry. The samples are dominated by SiO2, CaO, Al2O3, and Fe2O3. Fe2O3 ranges from 1.22 to 9.96 wt%, whereas Cr2O3 is generally low, mostly below 0.3 wt%. Fe3+ contents were stoichiometrically inferred from ED-XRF data, and trace-element data were treated as semi-quantitative. Inferred Fe3+ shows a positive trend with the CIELab yellowness parameter b*, whereas Cr-bearing samples tend to have more negative a* values and show a reflectance minimum near 582 nm. A Fe3+-related reflectance feature occurs at approximately 430–440 nm. FTIR spectra display an approximate red shift of the ν3 band from ~960 to ~940 cm−1, consistent with Fe3+ substitution for Al3+ at the Y site. In the a*–b* plane, the samples form a continuous distribution broadly corresponding to their visual colors. These observations are consistent with the color variation of Mali garnet being mainly associated with Fe3+ and Cr3+ contents: Fe3+ contributes to yellow hues, while Cr3+ enhances green hues. The observed trends provide a useful reference for understanding the color characteristics of Mali garnet and for further quantitative color–composition studies.
1. Introduction
Mali garnet is a gem-quality variety of the grossular–andradite solid-solution series (grossular, Ca3Al2Si3O12; andradite, Ca3Fe2Si3O12), with the general formula X3Y2Si3O12. It was first reported in the mid-1990s from the Kayes Region of the Republic of Mali, West Africa [1,2], where it occurs in contact-metamorphic skarn deposits associated with Jurassic diabase intrusions (ca. 200 Ma) within carbonate sequences of the West African Craton [1,2]. The X site is predominantly occupied by Ca2+, whereas the Y site is occupied by trivalent cations such as Al3+ and Fe3+ [3,4,5,6]. Owing to Fe3+–Al3+ substitution, Mali garnet displays a broad range of colors, including near-colorless, light yellow, medium yellow, yellow, yellow-green, green with a yellow tint, and green.
Previous studies have commonly attributed the color of Mali garnet mainly to Fe3+. When Fe3+ substitution for Al3+ is limited, samples tend to be pale yellow-green; with increasing Fe3+ content, the color has been reported to shift toward yellow, orange, and brownish red [7,8]. Trace elements such as Cr3+, V3+, and Mn2+ have also been considered as possible modifiers of coloration [9,10,11,12,13]. Johnson et al. [1] systematically reported the gemmological properties of Mali garnet from contact-metamorphic deposits near Diakon (approximately 130 km east of Kayes), where garnet-bearing skarn assemblages formed along the margins of diabase intrusions within magnesian and dolomitic limestones. Subsequent studies using electron probe microanalysis (EPMA) and laser ablation–inductively coupled plasma–mass spectrometry (LA-ICP-MS) further confirmed the grossular–andradite solid-solution nature of Mali garnet and determined its major chemical composition [2]. The reported geological setting of Mali garnet is characterized by Fe3+–Al3+ substitution, which provides a relevant context for compositional–colorimetric investigation.
Color research using the Commission Internationale de l’Éclairage (CIE) 1976 L*a*b* (CIELab) color space plays an increasingly important role in gemmology. The CIE 1976 L*a*b* uniform color space transforms X, Y, and Z tristimulus values into lightness L* and chromatic coordinates a* and b*, from which chroma C* and hue angle h° are derived [14,15,16]. This system has facilitated the quantitative description of gemstone color in numerous studies. In garnet color research, CIELab has been applied to tsavorite [17], violet-red pyrope–almandine [18], and spessartine [19]. It has also been widely used for the color characterization and grading of other colored gemstones, including jadeite [20], “Feizhoucui” [21], turquoise [22], opal [23], tourmaline [24], and peridot [25]. However, systematic studies integrating CIELab color parameters with chemical composition across the color range of Mali garnet remain limited.
In this study, 38 faceted samples commercially represented as Mali garnet were investigated. The samples span a color range from near-colorless through light yellow, medium yellow, yellow, yellow-green, green with a yellow tint, to green. Their exact geographic origin cannot be independently verified. The samples were analysed using energy-dispersive X-ray fluorescence (ED-XRF), ultraviolet–visible (UV–Vis) reflectance spectroscopy, Fourier transform infrared (FTIR) spectroscopy, and CIELab colorimetry. Total Fe is reported as Fe2O3, and Fe3+ contents are stoichiometrically inferred rather than directly measured; trace-element data are treated as semi-quantitative. The compositional and colorimetric data were examined for descriptive trends, and the distribution of samples in the a*–b* plane was assessed. The observed trends were compared with previously reported Fe- and Cr-related coloration mechanisms. No validated classification or color-grading framework is proposed.
2. Materials and Methods
2.1. Samples
A total of 38 faceted samples commercially represented as Mali garnet were obtained from commercial jewelry suppliers. All samples are transparent to translucent, exhibit a vitreous luster, show no visible fractures to the naked eye, and range in size from approximately 5 to 10 mm. The exact geographic origin of the samples cannot be independently verified. Their gemological properties, chemical compositions, and spectral characteristics are consistent with reference data for Mali garnet from the Kayes Region [1,2]; therefore, they are described here as Mali-type grossular–andradite solid-solution samples.
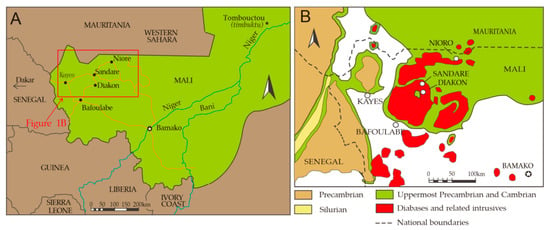
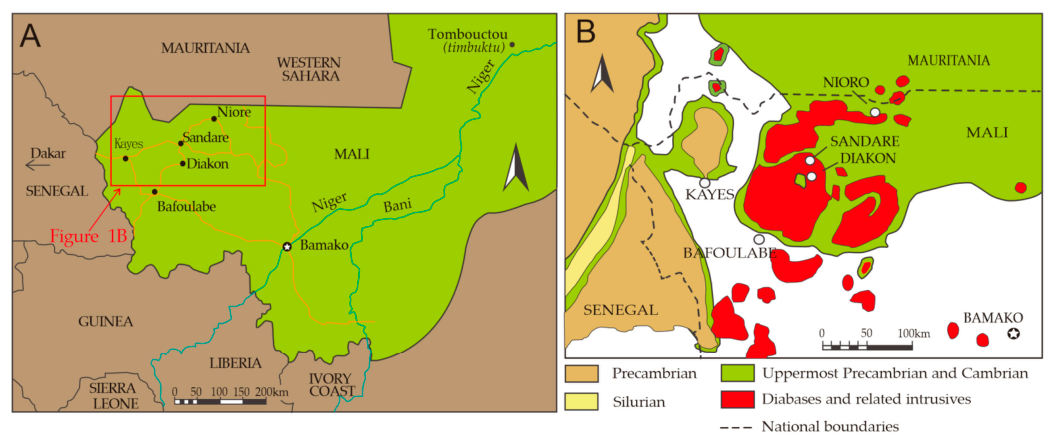
The geological setting of the reported Mali garnet occurrence is shown in Figure 1. As documented by Johnson et al. [1] and Zheng et al. [2], Mali garnet occurs in contact-metamorphic skarn deposits in the Kayes Region of western Mali, near Diakon (approximately 130 km east of Kayes). This region is underlain by the Precambrian West African Craton and includes the Taoudeni Basin, a broad sedimentary basin filled with Cambrian to Mesozoic magnesian and dolomitic limestones [26]. These carbonate sequences were intruded by NNW–SSE-trending Jurassic diabase dikes (ca. 200 Ma) [1,2]. Contact metamorphism along the margins of these intrusions produced garnet-bearing skarn assemblages, with gem-quality material recovered from both primary skarn occurrences and secondary alluvial deposits [1,2]. This literature-reported setting is characterized by Fe3+–Al3+ substitution and provides context for the compositional and colorimetric trends examined here, but it does not document the collection locality of the samples analyzed in this study.
Figure 1.
Schematic geological map of the reported Mali garnet occurrence [2]. (A) Location of the Kayes Region within the Republic of Mali, West Africa (red rectangle); (B) simplified geological map of western Mali and adjacent parts of Senegal and Mauritania, showing the distribution of diabase intrusions and contact-metamorphic garnet occurrences along their margins. The star marks the approximate location of gem-quality grossular–andradite garnet deposits near the village of Diakon, as reported in the literature. Reprinted from Zheng et al. [2] under a CC BY license. This map illustrates the reported source region from the literature and does not document the collection locality of the commercially purchased samples analyzed in this study.
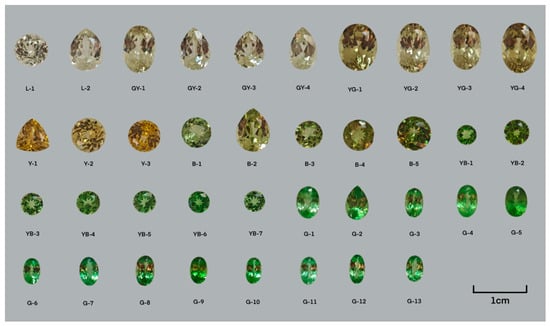
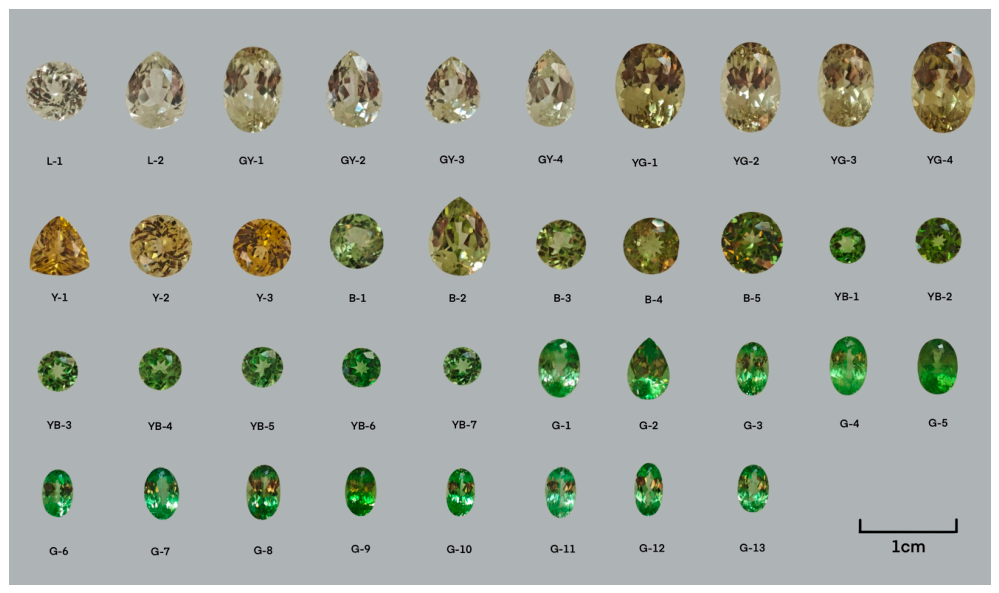
The samples were identified as grossular–andradite solid solution based on their gemological properties (refractive index (RI) = 1.742 – 1.772; specific gravity (SG) = 3.58–3.64), chemical compositions, and spectral characteristics, all of which are consistent with reference data for Mali garnet from the Kayes Region [1,2]. The original sample labels L, GY, YG, Y, B, YB, and G are retained only as sample identifiers and do not represent strictly defined or mutually independent color categories. For clarity, these identifiers correspond to the following visual descriptions: L = near-colorless; GY = light yellow; YG = medium yellow; Y = yellow; B = yellow-green; YB = green with a yellow tint; G = green. Sample counts under the original labels are L (n = 2), GY (n = 4), YG (n = 4), Y (n = 3), B (n = 5), YB (n = 7), and G (n = 13). Representative photographs are arranged according to visual color in Figure 2. The RI and SG values in Table 1 are representative values for each original label and are provided for sample identification only; they are not a statistical summary. For each original label, Table 1 reports the mean of three measurements of one representative sample; no within-group standard deviation or range was calculated.
Figure 2.
Color photographs of the 38 samples commercially represented as Mali garnet, arranged by visual color. The original sample labels are retained only as identifiers: L = near-colorless; GY = light yellow; YG = medium yellow; Y = yellow; B = yellow-green; YB = green with a yellow tint; G = green. These labels do not represent strictly defined or mutually independent color categories. Scale bar = 1 cm.
Table 1.
Representative refractive index (RI) and specific gravity (SG) of the samples according to the original sample labels. Note: Only one representative RI and SG value is listed for each original label. No within-group statistical summary, standard deviation, or range was calculated. RI was measured with a gem refractometer using sodium yellow light (589 nm) and contact liquid; measurements did not reach the refractometer limit. The sample count n denotes the number of samples under each original label.
2.2. Methods
2.2.1. Chemical Composition Analysis
The chemical compositions of all 38 samples were analysed using an energy-dispersive X-ray fluorescence spectrometer (EDX-7000, Shimadzu, Kyoto, Japan) under vacuum, with a measurement time of 120 s per sample. Quantification was based on the instrument’s factory-established calibration for silicate matrices. Weight percentages (wt%) of SiO2, CaO, Al2O3, Fe2O3, MnO, Cr2O3, V2O5, TiO2, and MgO were obtained. The manufacturer-specified instrumental detection limit (IDL) for Cr is approximately 0.02 wt% (elemental Cr basis); the IDLs for V and Mn are approximately 0.01 wt% each. However, no method detection limit (MDL) was determined in this study because matrix-matched certified reference materials were not measured. On the basis of observed spectral noise in faceted gemstone samples, the practical limit of quantification (LOQ) for Cr is approximately 0.3 wt% (expressed as Cr2O3). Cr concentrations below this level should therefore be regarded as semi-quantitative. Analytical precision is stated by the manufacturer as <5% relative standard deviation (RSD) for major elements and <15% RSD for trace elements near detection limits, but these values were not independently verified on the analysed material. The total oxide sums reported in Table 2 are normalized values; unnormalized totals and quality assurance/quality control (QA/QC) data are not available, and these totals should not be interpreted as evidence of analytical accuracy. ED-XRF has higher detection limits than EPMA or LA-ICP-MS, but its non-destructive nature is advantageous for faceted gemstones.
Table 2.
Oxide contents (wt%) measured by energy-dispersive X-ray fluorescence (ED-XRF) and calculated cation proportions (atoms per formula unit (apfu), normalized to 12 oxygen atoms) of representative samples.
Crystal chemical formulae were calculated using the Excel spreadsheet of Locock [27], normalized to 12 oxygen atoms and a total cation sum of X + Y + Si = 8 atoms per formula unit (apfu). Total Fe is reported as Fe2O3 (wt%). Because ED-XRF cannot distinguish Fe2+ from Fe3+, the Fe3+ values reported here are stoichiometrically inferred under the assumptions of full Y-site occupancy and charge balance; they are not directly measured. Trace-element data, particularly for Cr and V, are treated as semi-quantitative. These data were used to examine descriptive compositional–colorimetric trends rather than to establish quantitative relationships.
2.2.2. UV–Vis Spectroscopy
Ultraviolet–visible (UV–Vis) reflectance spectra were collected at the Gemmological Experimental Teaching Center, China University of Geosciences (Beijing), using a GEM-3000 UV–Vis fibre-optic spectrometer (Guangzhou Biaoqi, Guangzhou, China). Measurements were performed in reflectance mode with an integration time of 240 ms, a wavelength range of 300–800 nm, and a spectral resolution of 1 nm. Each sample was measured three times, and the average spectrum was used for analysis. The reflectance reference standard, illumination/collection geometry, and spot size were not systematically recorded. No reflectance-to-absorbance transformation was applied. The Fe3+-related reflectance feature near 430–440 nm and the Cr3+-related reflectance minimum near 582 nm were identified by visual inspection. Band positions were estimated visually; no peak fitting or uncertainty analysis was performed.
2.2.3. Infrared Spectroscopy
Infrared spectra were collected at the Gemmological Experimental Teaching Center, China University of Geosciences (Beijing), using a Bruker Tensor 27 Fourier transform infrared (FTIR) spectrometer (Bruker, Karlsruhe, Germany). Measurements were performed in reflectance mode with a resolution of 4 cm−1 and 64 scans per spectrum. The acquired spectral range was 400–1500 cm−1, and the plotted range was 400–1200 cm−1. Peak positions were estimated visually from the stacked reflectance spectra. No peak fitting or regression against composition was performed. The FTIR data are used for descriptive characterization.
2.2.4. CIELab Colorimetric Analysis
Color measurements were conducted at the Gem Testing Laboratory, School of Gemmology, China University of Geosciences (Beijing), using a LiuLalbs MDIS-8 multifunctional dual-integrating-sphere spectrophotometer (LiuLalbs, Beijing, China). Measurements were performed with illuminant D65 and the 10° standard observer against a neutral gray background. White/black calibration was performed automatically before each measurement session according to the manufacturer’s protocol. Each sample was measured three times, and the average value was used for analysis. Size/cut correction was applied according to the manufacturer’s protocol (LiuLalbs MDIS-8 operating manual). All samples were measured with the table facet facing downward; no rotational averaging was performed. Cut geometry was not standardized or systematically recorded.
2.2.5. Standard Gemmological Testing
Refractive index (RI) was measured using a gem refractometer (GemMaster, Mildenhall, UK) with sodium yellow light (589 nm) and the contact liquid method. Each sample was measured three times, and the average value was recorded. The measurements did not reach the refractometer limit. Specific gravity (SG) was determined using the hydrostatic weighing method in distilled water at room temperature (25 °C) with an electronic balance (precision 0.0001 g). Each sample was measured three times, and the average value was used. For Table 1, one representative sample per original label was selected, and the average of three measurements is reported; no within-group statistics were calculated. The RI and SG data served as conventional gemmological parameters for sample identification.
3. Results
3.1. Chemical Composition Characteristics
The major-element compositions of 38 samples were analysed by ED-XRF. Table 2 lists the oxide contents and cation proportions (apfu, normalized to 12 oxygen atoms) for seven representative samples. The principal constituents are SiO2, Al2O3, CaO, and Fe2O3, consistent with the chemical framework of calcic garnets. CaO is a major component (35.92–39.84 wt%), and Ca dominates the X site. Al2O3 ranges from 13.88 to 21.56 wt%, whereas Fe2O3 ranges from 1.22 to 9.96 wt%, showing an inverse relationship. SiO2 remains relatively constant at 35.25–40.22 wt%. The total oxide sums in Table 2 are normalized values and should not be interpreted as evidence of analytical accuracy.
Among the trace elements, Cr2O3 is generally low, mostly below 0.3 wt%, and is detected in greenish samples, with a maximum of 0.64 wt% (G-10). V2O5 reaches 1.03 wt% in B-4, but no systematic V-related color trend was observed. MnO is generally below 0.2 wt%, except for 0.61 wt% in YG-3. These trace-element data are treated as semi-quantitative. The uvarovite component is nearly absent.
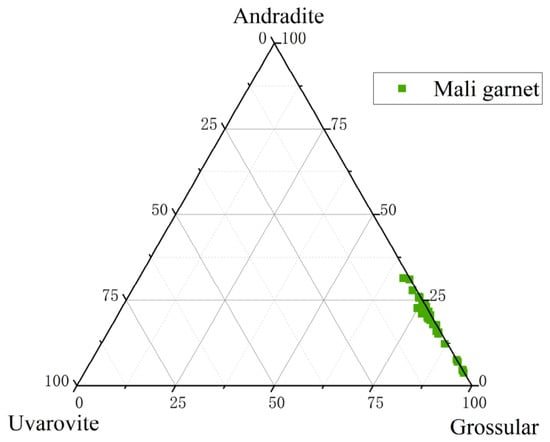
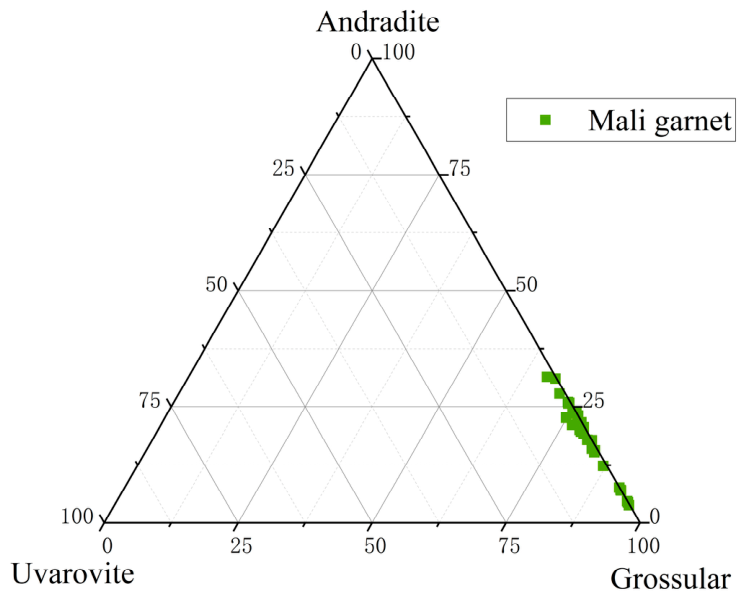
Cation proportions normalized to 12 oxygen atoms were calculated following Locock [27], and an Andradite–Uvarovite–Grossular ternary diagram was constructed (Figure 3). The data plot close to the grossular–andradite join and are strongly concentrated toward the grossular end-member; no trend toward uvarovite is observed. This indicates that the studied samples are dominated by grossular with subordinate andradite. Within this sample set, the data show a continuous distribution along the grossular–andradite join, with no obvious compositional gap; however, this does not by itself demonstrate complete isomorphic substitution.
Figure 3.
Ternary diagram of grossular–andradite–uvarovite compositions for the studied samples.
Variations in major-element composition, especially Fe2O3, are associated with variations in gemological properties. Among the representative samples in Table 2, Fe2O3 increases from about 1.3 wt% in L-1 to about 10.0 wt% in B-4. Low-Fe samples (Fe2O3 < 3 wt%) are closer to the grossular end-member and generally have pale colors and lower RI values. High-Fe samples (Fe2O3 > 5 wt%) are shifted toward the andradite end-member and tend to have deeper colors, but color is also influenced by Cr and cannot be attributed to Fe alone. No dispersion or commercial-value data were obtained.
Cr2O3 (>0.2 wt%) is present in some yellowish green to green samples and may contribute to green hues; however, because Cr is much less abundant than Fe, the green component is commonly mixed with yellow tones, producing yellow-green to green appearances. The role of Cr is discussed further in Section 4.
3.2. CIELab Color Characteristics of the Studied Samples
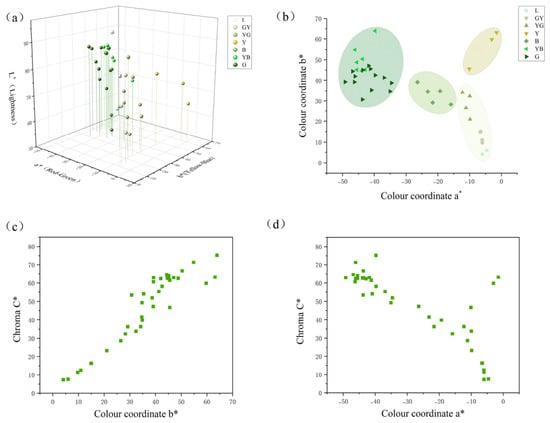
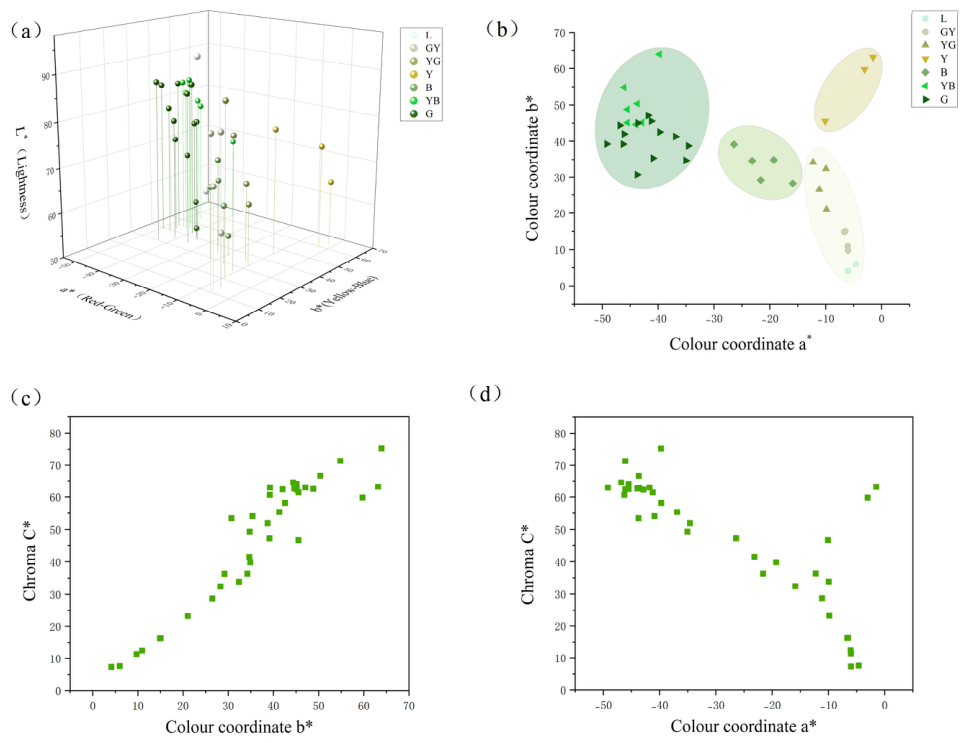
CIELab color parameters were measured for all 38 samples. Table 3 lists the color parameters and color simulations for 14 representative samples. Figure 4a shows the distribution of the samples in the three-dimensional L*–a*–b* color space. L* ranges from 54.51 to 97.80. The near-colorless group generally has L* > 70, corresponding to higher brightness and lower saturation, whereas the green group tends to have L* < 70, indicating relatively darker tones.
Table 3.
CIELab color parameters (L*, a*, b*, C*, h°) and corresponding color renderings for representative samples. Note: Color renderings were generated from the measured color coordinates using the COLORTELL website (http://www.colortell.com, accessed on 25 April 2026) and are provided for visualization only; they do not constitute independent validation. L* denotes lightness, a* the red–green coordinate, b* the yellow–blue coordinate, C* chroma, and h° hue angle. Asterisks are part of the color-parameter notation, not significance markers.
Figure 4.
Commission Internationale de l’Éclairage (CIE) 1976 L*a*b* (CIELab) colorimetric results for the studied samples. (a) Three-dimensional scatter plot in L*–a*–b* space; (b) a*–b* plane projection; (c) C* versus b*; (d) C* versus a*. C* is mathematically derived from a* and b*, so panels (c,d) are descriptive only and are not independent statistical tests. L* denotes lightness, a* the red–green coordinate, b* the yellow–blue coordinate, and C* chroma. Asterisks are part of the color-parameter notation and do not indicate statistical significance. In panels (a,b), colors and symbols identify the original sample labels defined in Figure 2. Green squares in panels (c,d) represent individual samples. Shaded regions in panel (b) are visual guides, not validated classification boundaries.
In the a*–b* plane (Figure 4b), the samples form a continuous distribution. Greenish samples have positive b* and negative a* values, whereas yellow samples are mainly concentrated in the region with a* > −10. The samples can be broadly described as extending from a near-colorless field toward yellow, yellow-green, and green fields. These fields are descriptive and are not proposed as a validated classification.
Chroma C* is mathematically derived from a* and b* (C* = √((a*)2 + (b*)2)). Therefore, the relationships between C* and a* or b* (Figure 4c,d) are not independent tests and are presented only as descriptive observations. No causal or compositional inference is drawn from these plots.
The color simulations generated using the COLORTELL website are visualizations of the measured color coordinates (Table 3). They do not constitute independent validation, and screen appearance depends on display calibration and color profiles. No quantitative color grading is proposed.
3.3. Relationship Between Color Parameters and Chemical Composition
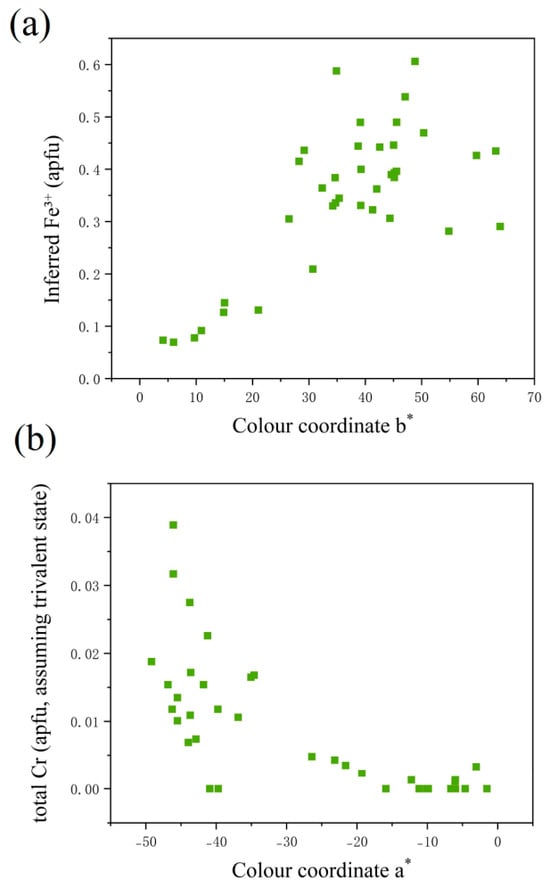
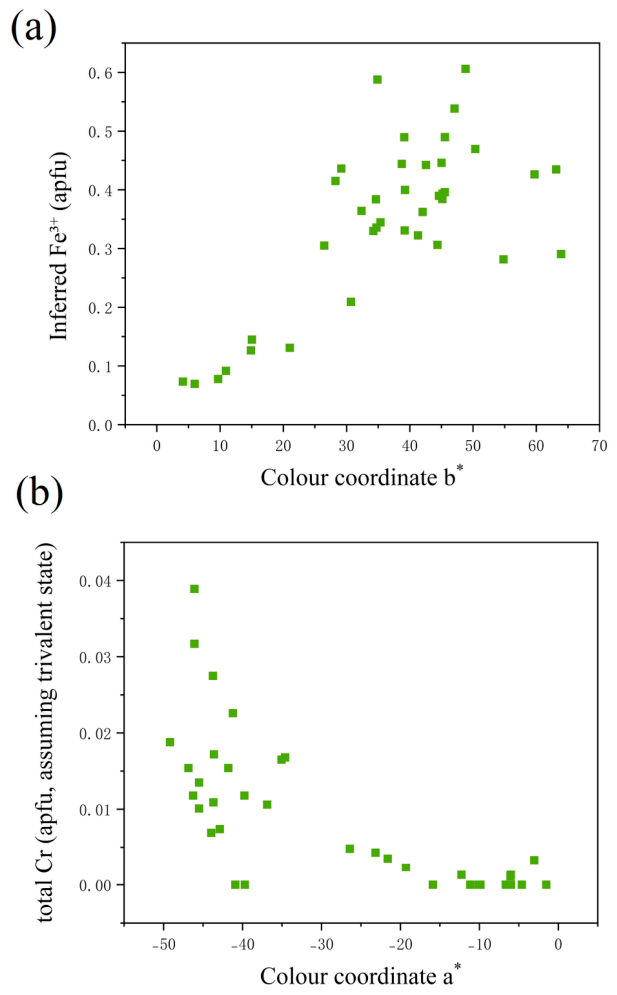
Inferred Fe3+ (apfu) shows a descriptive positive trend with the yellowness parameter b* (Figure 5a). Samples with low inferred Fe3+ contents (L and GY groups) tend to have lower b* values, corresponding to near-colorless to light yellow colors. The YG and Y samples are visually described as medium yellow and yellow, respectively, whereas the B samples are yellow-green and the YB samples are green with a yellow tint. Positive b* values indicate a yellow component, while the overall hue depends on both a* and b*.
Figure 5.
Scatter plots of (a) stoichiometrically inferred Fe3+ (apfu) versus b* and (b) total Cr (apfu, calculated assuming trivalent Cr) versus a* for the 38 samples. Points are unconnected and illustrate descriptive patterns only. Cr values are semi-quantitative; points plotted at 0.00 represent reported zero values and should not be interpreted as confirmed absence of Cr. Green squares represent individual samples. The asterisks in a* and b* are part of the CIELab coordinate notation, not significance markers; apfu denotes atoms per formula unit.
Total Cr (apfu, assuming trivalent state) shows a descriptive negative trend with the a* coordinate (Figure 5b). Samples with higher total Cr tend to have more negative a* values, indicating a stronger green component, whereas samples with negligible Cr have a* values closer to zero. Although Cr occurs at low concentrations, this trend is consistent with Cr being associated with green hues. Cr data are semi-quantitative, and non-detect values are included and plotted as 0.00.
Overall, the observed color variation is consistent with combined contributions from Fe and Cr: Fe is associated with yellow hues, and Cr is associated with green hues. The observed trends are exploratory, and no color-grading scheme is proposed.
Because the sample size is limited, group sizes are unequal, Cr values are censored, and cut-geometry covariates were not recorded, no multiple regression or collinearity diagnostics were performed. The simultaneous contributions of Fe and Cr to the color parameters were therefore not evaluated quantitatively in this study.
3.4. UV–Vis Reflectance Spectral Characteristics
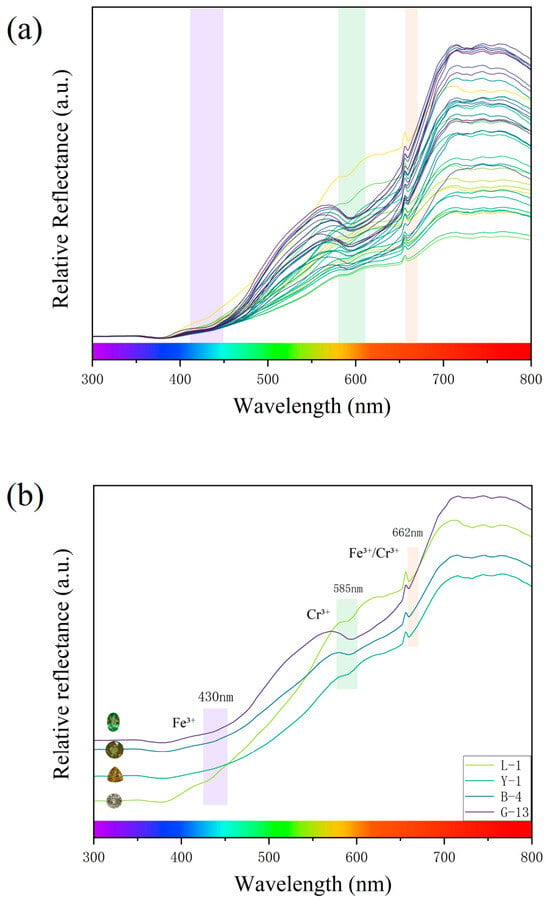
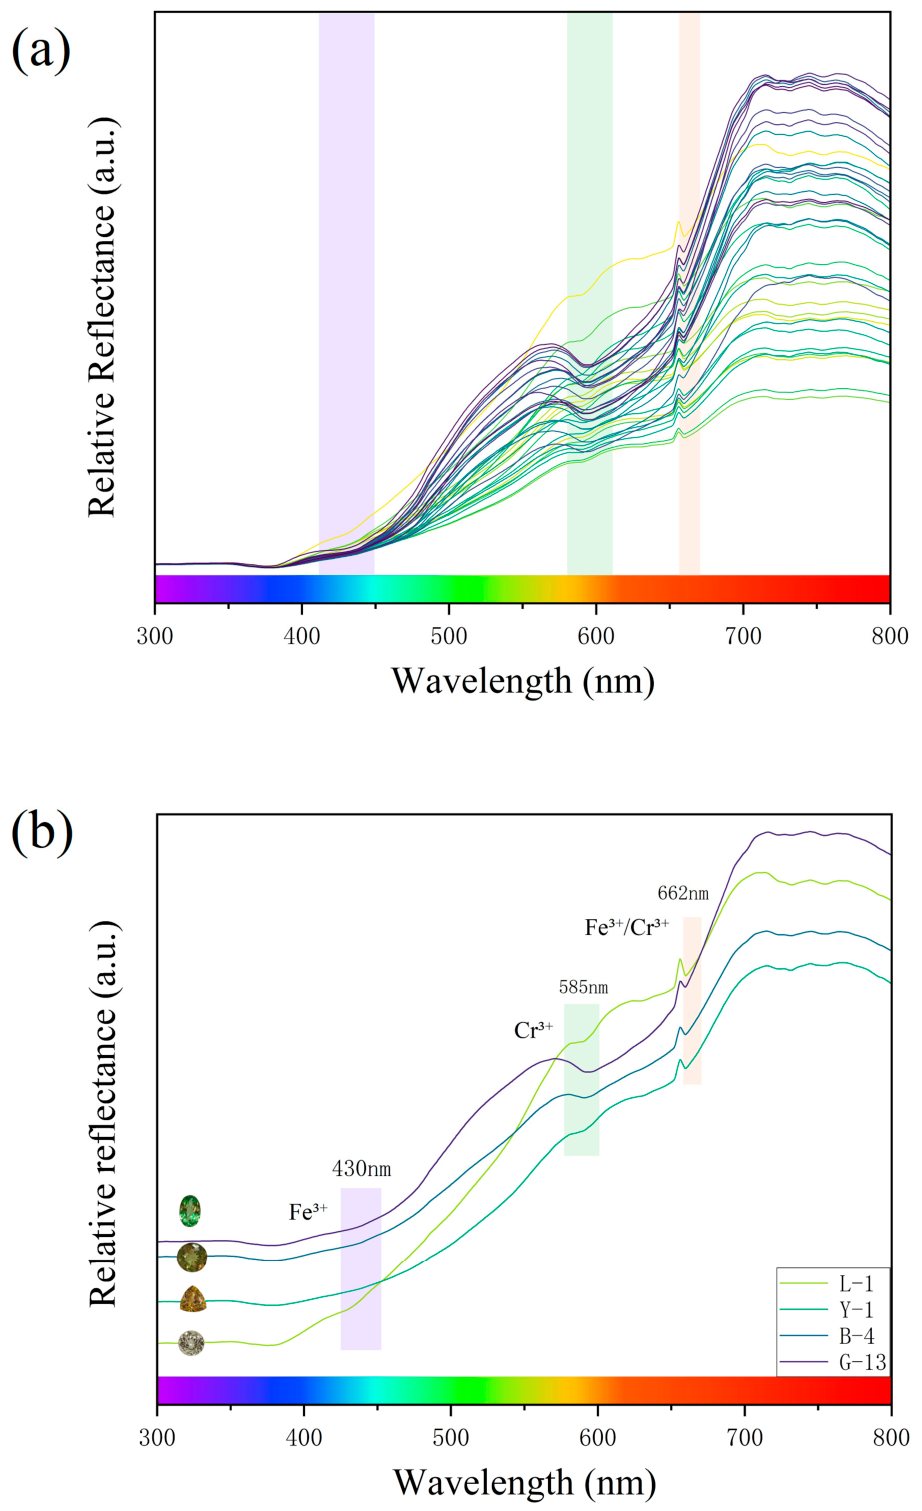
Figure 6a shows the UV–Vis reflectance spectra (300–800 nm) of all 38 samples, and Figure 6b compares four representative samples (L-1, Y-1, B-4, and G-13). In general, reflectance increases with wavelength across the visible region (400–700 nm) and reaches a maximum in the 700–800 nm range. Reflectance band positions, assignments, and literature references are summarized in Table 4.
Figure 6.
UV–Vis reflectance spectra of the studied samples. (a) Spectra of all 38 samples; (b) spectra of four representative samples. Each curve in panel (a) represents one sample; panel (b) identifies the representative samples in its legend. Relative reflectance is expressed in arbitrary units (a.u.).
Table 4.
Summary of ultraviolet–visible (UV–Vis) reflectance band assignments for the studied samples.
The low-Fe sample (L-1) has a relatively flat reflectance curve, with only a very weak minimum near 430 nm and no distinct reflectance features, consistent with its near-colorless appearance. The medium-Fe sample (Y-1) shows a pronounced decrease in reflectance near 430 nm. This feature is attributed to the 6A1g→4A1g/4E_g crystal-field transition of Fe3+ at the octahedral Y site, which appears as a reflectance edge [1,3,4]. This assignment is consistent with previous observations in grossular–andradite garnets from Mali [1] and in andradite from other skarn deposits.
The high-Fe sample (B-4) shows a similar reflectance feature near 430 nm but with lower overall reflectance intensity, corresponding to a darker appearance. The Cr-bearing sample (G-13) displays a more complex spectrum. In addition to the Fe3+-related feature near 430 nm, a distinct reflectance minimum appears near 582 nm, attributed to the 4A2g→4T2g spin-allowed transition of Cr3+ [4,17]; this minimum is more pronounced in samples with higher Cr contents. A broad reflectance feature is also observed near 662 nm. This feature may include the 4A2g→4T1g transition of Cr3+ and possible contributions from Fe3+-related transitions [3,4]. Similar spectral features have been reported in Cr-bearing grossular (tsavorite) [17] and Cr-bearing andradite (demantoid). The fundamental Cr3+ transitions occur at similar positions in Cr3+-doped yttrium aluminum garnet (YAG:Cr3+) [28], although such synthetic systems have higher Cr concentrations and different host compositions.
Spectral differences among the samples are evident. L-1 shows only a weak feature near 430 nm. Y-1 shows a stronger reflectance decrease near 430 nm but no obvious feature near 582 nm. B-4 shows stronger reflectance loss in both the 430 nm and 582–662 nm regions. G-13 shows the most pronounced feature near 582 nm, together with a relatively strong feature near 430 nm.
The UV–Vis reflectance spectra of grossular–andradite solid solutions may contain overlapping features from multiple chromophoric ions [3,4]. The Fe3+-related reflectance edge near 430 nm and the Cr3+-related reflectance minima near 582 and 662 nm may overlap in samples containing both elements, complicating band assignment. In particular, the broad feature near 662 nm cannot be unequivocally attributed to Cr3+ alone, because Fe3+ may also contribute in this region [3]. No spectral deconvolution was performed, and band positions were estimated visually from the reflectance spectra. Assignments of individual bands to single chromophores therefore remain tentative.
These spectral features are consistent with the descriptive trends between color parameters and inferred Fe3+ and total Cr contents (positive trend between b* and inferred Fe3+; negative trend between a* and total Cr). The observations are consistent with Cr contributing to green hues, which, together with the yellow component associated with Fe, produces the observed yellow-green to green appearances. Band assignments and literature references are summarized in Table 4.
3.5. Infrared Spectral Characteristics
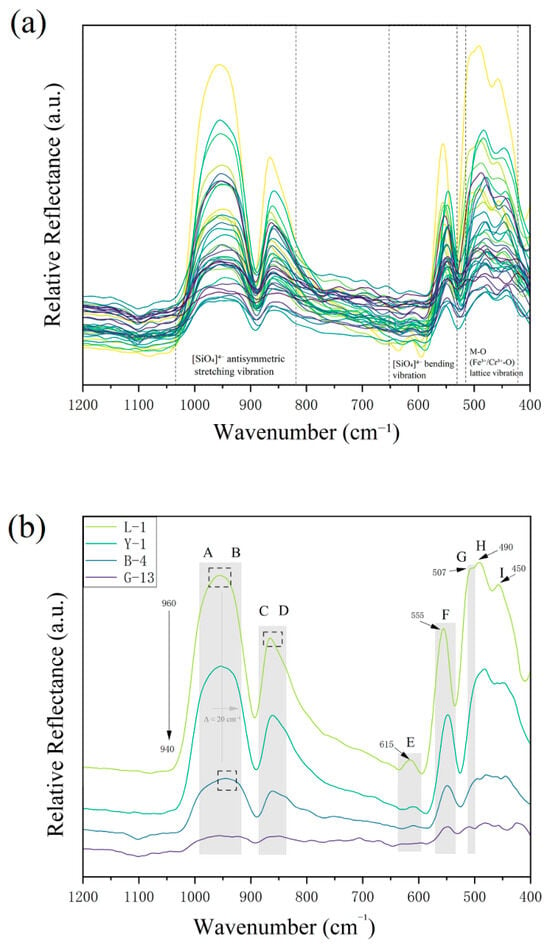
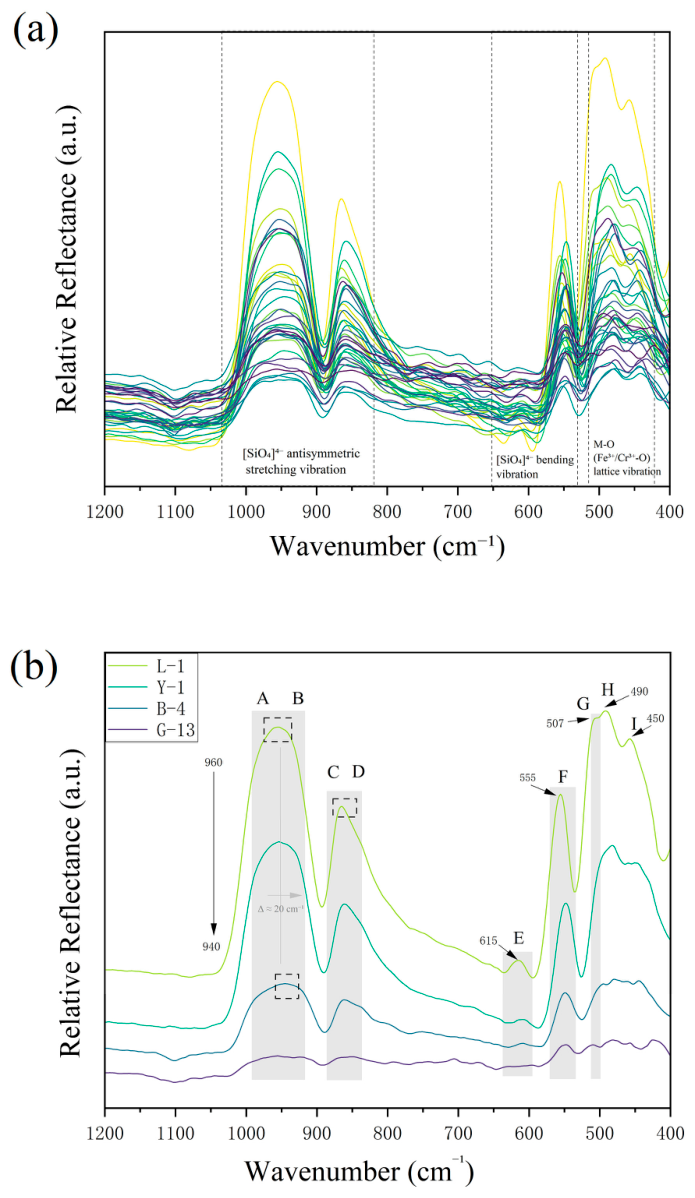
Figure 7a shows the Fourier transform infrared (FTIR) reflectance spectra of all 38 samples, plotted from 400 to 1200 cm−1 (acquired range 400–1500 cm−1), and Figure 7b compares four representative samples (L-1, Y-1, B-4, and G-13). The spectra are broadly similar and show features typical of the grossular–andradite solid-solution series. Three main regions can be distinguished: (i) the high-wavenumber region (1000–800 cm−1), where bands A and B are attributed to antisymmetric stretching vibrations (ν3) of the [SiO4]4− tetrahedra; (ii) the mid-wavenumber region (650–500 cm−1), where bands C–F correspond to bending vibrations (ν2 and ν4) of the [SiO4]4− units; and (iii) the low-wavenumber region (<500 cm−1), where bands G–I are associated with lattice vibrations of metal–oxygen (M–O) bonds. Approximate band positions and assignments are summarized in Table 5.
Figure 7.
FTIR reflectance spectra of the studied samples, plotted from 400 to 1200 cm−1 (acquired range: 400–1500 cm−1). (a) Spectra of all 38 samples; (b) spectra of four representative samples (L-1, Y-1, B-4, and G-13). Different line colors in panel (a) distinguish individual sample spectra, whereas those in panel (b) identify the four representative samples listed in the legend. Labels A–I in panel (b) identify characteristic spectral features: A–B occur within approximately 1000–900 cm−1, C–D within 900–800 cm−1, and E, F, G, H, and I near 615, 555, 507, 490, and 450 cm−1, respectively. These labels correspond to the features summarized in Table 5.
Table 5.
Approximate positions of Fourier transform infrared (FTIR) reflectance features shown in Figure 7b.
The main band in the high-wavenumber region appears near 960 cm−1 in the low-Fe sample (L-1) and near 940 cm−1 in the high-Fe, high-Cr sample (G-13), corresponding to an apparent shift of about 20 cm−1 toward lower wavenumbers. Bands in the mid-wavenumber region also appear at lower wavenumbers in G-13 than in L-1. In the low-wavenumber region, the M–O bands appear more intense in G-13 than in L-1. These differences are described as qualitative observations. Peak positions were estimated visually from the stacked reflectance spectra; no peak fitting, uncertainty analysis, or replicate reproducibility assessment was performed. Because Fe, Cr, and possibly strain/disorder vary simultaneously among these samples, the comparison of L-1 and G-13 cannot isolate the effect of any single substitution.
Spectral differences among the samples are evident. L-1 shows the highest apparent peak positions and the sharpest band profiles. Y-1 shows a slight shift toward lower wavenumbers. B-4 shows a more pronounced shift and stronger reflectance loss in the low-wavenumber region. G-13 shows the lowest apparent peak positions and the broadest bands.
The observed shifts in FTIR band positions are qualitatively consistent with increasing Fe3+ substitution for Al3+ at the Y site. However, no regression analysis between FTIR peak positions and independently measured composition was performed. Compositional disorder, local strain, and bond-angle variations may also contribute to the observed spectral changes [8,29]. Lattice-parameter confirmation would require X-ray diffraction (XRD) refinement, which was not performed in this study.
4. Discussion
4.1. Descriptive Trends Between Fe3+ and Yellow Coloration
The yellow to yellow-green hues of Mali garnet are commonly attributed to Fe3+. After substituting for Al3+ at the octahedral Y site, Fe3+ may contribute to absorption in the blue–violet region through Fe3+-related crystal-field transitions and possible Fe3+–O2− charge-transfer processes. In this study, inferred Fe3+ (apfu) shows a descriptive positive trend with the CIELab yellowness parameter b*. Samples with low inferred Fe3+ contents (e.g., group L) tend to have lower b* values, corresponding to near-colorless to light yellow colors. The positive b* values of the B and YB samples indicate a yellow component in their yellow-green and green-with-a-yellow-tint appearances, respectively. Their negative a* values indicate a green component; therefore, these samples should not be described as having exclusively yellow hues.
Chroma C* is derived from a* and b*, and its variation is therefore not an independent test of chromophore control. No quantitative regression or multivariate analysis was performed. The observed trends are exploratory, and no color-grading guideline is proposed.
Alternative processes may also contribute to the observed coloration. Fe3+–Fe3+ exchange-coupled pairs can produce additional absorption features beyond single-ion transitions [3,4]. Fe2+–Fe3+ intervalence charge transfer may occur in samples containing mixed-valent iron [30,31]. Crystal-field effects also influence the positions and intensities of electronic transitions, which vary with site symmetry and compositional variations in the garnet solid solution [3,4]. Possible interactions between multiple chromophores may further contribute to the final color appearance [3,4]. Because Fe3+ values in this study are stoichiometrically inferred rather than directly measured, the precise valence distribution and the relative contributions of these processes remain unconstrained.
4.2. Descriptive Trends Between Cr and Green Coloration
Total Cr occurs at generally low concentrations in the studied samples (up to approximately 0.04 apfu, assuming trivalent state). Samples with higher total Cr tend to have more negative a* values, and a descriptive negative trend is observed between total Cr content and the a* coordinate. In the UV–Vis reflectance spectra, Cr-bearing samples show a reflectance minimum near 582 nm, which is consistent with the 4A2g→4T2g transition of Cr3+ and with Cr contributing to green hues. Cr data are semi-quantitative, and no quantitative regression was performed.
Because Fe is present in much higher concentrations than Cr, Fe-related reflectance features dominate the blue–violet region. The green component associated with Cr is therefore mixed with the yellow component associated with Fe, resulting in yellow-green to green appearances rather than a more emerald-green appearance. The observed colors are consistent with combined contributions from Fe and Cr: Fe is associated with yellow hues, and Cr is associated with green hues. These trends are exploratory, and no synergistic mechanism or color-grading scheme is proposed.
Regarding the potential contributions of other transition elements, V and Mn are present in some samples, but their concentrations do not show systematic relationships with the observed color variations. Vanadium in garnet may occur as V3+, V4+, or V5+. V3+ and V4+ can produce crystal-field transitions in the visible region, whereas V5+ is optically inactive. In this study, no distinct V-related reflectance features were identified within the sensitivity of the UV–Vis reflectance measurements. Because V concentrations are low and the method sensitivity is limited, minor contributions from V cannot be excluded. Similarly, Mn shows no consistent relationship with the observed hues, but its potential minor contribution cannot be entirely ruled out without direct valence analysis or inclusion characterization. Future work using valence-sensitive techniques would be needed to better constrain the roles of V and Mn.
4.3. Qualitative Relationship Between FTIR Band Positions and Compositional Substitution
In the infrared spectra, the main band in the high-wavenumber region appears near 960 cm−1 in the low-Fe sample (L-1) and near 940 cm−1 in the high-Fe, high-Cr sample (G-13), corresponding to an apparent red shift of about 20 cm−1. This shift is qualitatively consistent with Fe3+ substitution for Al3+. Peak positions were estimated visually; no peak fitting or regression analysis was performed. Because Fe, Cr, and other compositional variables vary simultaneously, this comparison cannot isolate the effect of a single substitution. The observed trend is qualitative only and does not provide crystallographic confirmation of lattice expansion, which would require XRD refinement.
4.4. Descriptive Distribution in Fe–Cr Compositional Space
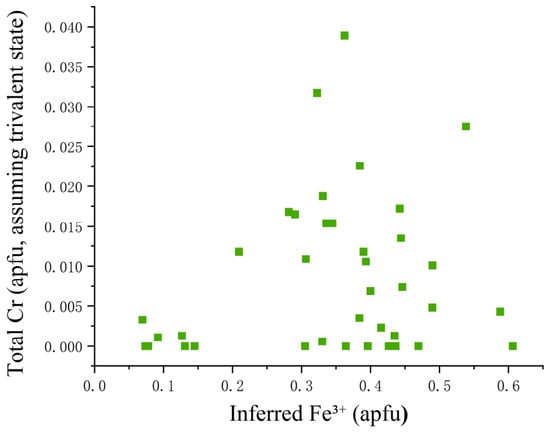
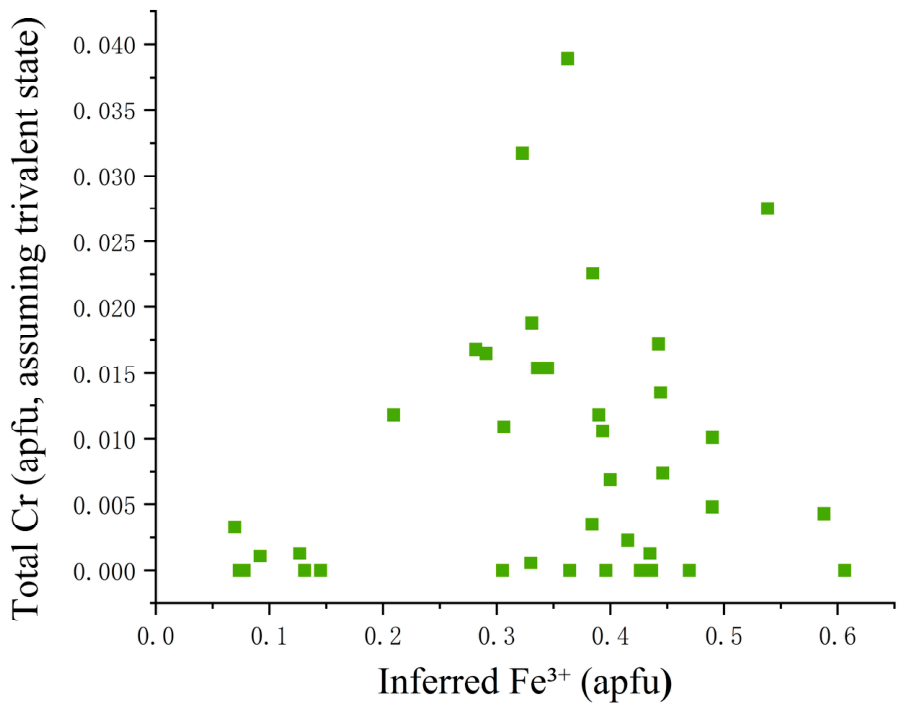
Based on ED-XRF data from 38 samples, inferred Fe3+ (apfu) and total Cr (apfu, assuming trivalent state) were calculated and analysed together with CIELab color parameters. Figure 8 shows the distribution of all samples in Fe–Cr compositional space. Low-Fe samples generally have lower b* values, corresponding to near-colorless to light yellow colors; samples with higher total Cr tend to have more negative a* values and greener hues. Cr data are semi-quantitative. These observations are exploratory and may serve as a reference for future studies.
Figure 8.
Fe–Cr compositional plot for all 38 samples. Inferred Fe3+ (apfu) versus total Cr (apfu, assuming trivalent state). Data points are unconnected, showing sample distribution only. Each green square represents one sample; apfu denotes atoms per formula unit.
5. Conclusions
- (1)
- CIELab color parameters were measured for 38 samples commercially represented as Mali garnet, covering near-colorless, light yellow, medium yellow, yellow, yellow-green, green with a yellow tint, and green. In the a*–b* plane, the samples show a continuous distribution broadly corresponding to their visual colors.
- (2)
- Inferred Fe3+ (apfu) shows a descriptive positive trend with the yellowness parameter b*. Samples with low inferred Fe3+ tend to have lower b* values, corresponding to near-colorless to light yellow colors, whereas increasing inferred Fe3+ tends to increase b*. This trend is consistent with Fe3+ being associated with yellow coloration. A Fe3+-related reflectance feature occurs near 430–440 nm. In the FTIR spectra, the ν3 band shows an apparent shift from about 960 to 940 cm−1, qualitatively consistent with Fe3+ substitution for Al3+. No quantitative regression, peak fitting, or XRD refinement was performed; Fe3+ contents are stoichiometrically inferred.
- (3)
- Total Cr (apfu, assuming trivalent state) shows a descriptive negative trend with a*. Cr-bearing samples show a reflectance minimum near 582 nm, which is consistent with the 4A2g→4T2g transition of Cr3+ and with Cr being associated with green hues. Cr data are semi-quantitative. The observed color variation is consistent with combined contributions from Fe and Cr: Fe is associated with yellow hues, and Cr is associated with green hues. No multivariate statistical analysis was performed.
This study is exploratory. The observed compositional and colorimetric trends may provide a reference for future investigations. Further validation on larger, compositionally balanced sample sets, with validated analytical methods and controlled measurement geometry, is required.
Author Contributions
Conceptualization, H.Y. and G.L.; methodology, H.Y.; software, H.Y.; validation, H.Y.; formal analysis, H.Y.; investigation, H.Y. and G.L.; resources, F.D.S.; data curation, H.Y.; writing—original draft preparation, H.Y.; writing—review and editing, G.L.; visualization, H.Y.; supervision, G.L.; project administration, G.L. and F.D.S.; funding acquisition, F.D.S. All authors have read and agreed to the published version of the manuscript.
Funding
This research received no external funding.
Data Availability Statement
All data supporting the results of this work are included in the main text. Further inquiries can be directed to the corresponding author.
Acknowledgments
The authors are grateful to the Gemological Institute, China University of Geosciences (Beijing) for their help with the data preparation of this study. We also sincerely thank Enore & Anton High Jewelry (Beijing, China) for providing all the commercial Mali garnet samples used in this research.
Conflicts of Interest
Author Fabian Dietmar Schmitz was employed by the company Rhein Main Gem Consulting. The remaining authors declare that the research was conducted in the absence of any commercial or financial relationships that could be construed as a potential conflict of interest.
References
- Johnson, M.L.; Boehm, E.; Krupp, H.; Zang, J.W.; Kammerling, R.C. Gem-quality grossular-andradite: A New Garnet from Mali. Gems Gemol. 1995, 31, 152–166. [Google Scholar] [CrossRef] [Scilit]
- Zheng, Z.; Zhang, M.; Zhao, S.; Xu, B.; Wang, S.; Zhao, M.; Wang, Q. Gemological Characteristics and In Situ U-Pb Dating of Gem-Quality Grossular (var. Mali garnet) from the Republic of Mali, Western Africa. Minerals 2026, 16, 461. [Google Scholar] [CrossRef] [Scilit]
- Novak, G.A.; Gibbs, G.V. The Crystal Chemistry of the Silicate Garnets. Am. Mineral. 1971, 56, 791–825. [Google Scholar]
- Geiger, C.A. A tale of two garnets: The role of solid solution in the development toward a modern mineralogy. Am. Mineral. 2016, 101, 1735–1749. [Google Scholar] [CrossRef] [Scilit]
- Sibi, N.; Subodh, G. Structural and Microstructural Correlations of Physical Properties in Natural Almandine-Pyrope Solid Solution: Al70Py29. J. Electron. Mater. 2017, 46, 6947–6956. [Google Scholar] [CrossRef] [Scilit]
- Akizuki, M. Growth structure and crystal symmetry of grossular garnets from the Jeffrey Mine, Asbestos, Quebec, Canada. Am. Mineral. 1989, 74, 859–864. [Google Scholar]
- Zhao, S. Research on the Gemological Characteristics of Green Garnets. Master’s Thesis, China University of Geosciences, Beijing, China, 2019. [Google Scholar]
- Wang, J.; Wang, Y.; Zhang, D.; Liu, Z.; Wang, C.; Yin, K.; Gao, X.; Xu, Y. FTIR Investigation of Garnet: Indication for Specific Species and Coloration—A Case Study of a Yellow Garnet. J. Gems Gemmol. 2020, 22, 20–25. [Google Scholar]
- Yu, X.Y.; Long, Z.Y.; Zhang, Y.; Qin, L.J.; Zhang, C.; Xie, Z.R.; Wu, Y.R.; Yan, Y.; Wu, M.K.; Wan, J.X. Overview of Gemstone Resources in China. Crystals 2021, 11, 1189. [Google Scholar] [CrossRef] [Scilit]
- Manson, D.V.; Stockton, C.M. Pyrope-spessartine garnets with unusual color behavior. Gems Gemol. 1984, 20, 200–207. [Google Scholar] [CrossRef] [Scilit][Green Version]
- Krzemnicki, M.S.; Hänni, H.A.; Reusser, E. color-change garnets from Madagascar: Comparison of colorimetric with chemical data. J. Gemmol. 2001, 27, 200–207. [Google Scholar] [CrossRef] [Scilit]
- Venkateswarulu, P.; Rao, K.S.; Kasipathi, C.; Ramakrishna, Y. Multielemental analyses of isomorphous Indian garnet gemstones by XRD and external pixe techniques. Appl. Radiat. Isot. 2012, 70, 2746–2754. [Google Scholar] [CrossRef] [Scilit] [PubMed]
- Schmetzer, K.; Hainschwang, T.; Kiefert, L.; Bernhardt, H.J. Pink to Pinkish Orange Malaya Garnets from Bekily, Madagascar. Gems Gemol. 2001, 37, 296–308. [Google Scholar] [CrossRef] [Scilit][Green Version]
- Kirillova, N.P.; Vodyanitskii, Y.N.; Sileva, T.M. Conversion of soil color parameters from the Munsell system to the CIE-LAB system. Eurasian Soil Sci. 2015, 48, 468–475. [Google Scholar] [CrossRef] [Scilit]
- Vodyanitskii, Y.N.; Kirillova, N.P. Application of the CIE-LAB system to characterize soil color. Eurasian Soil Sci. 2016, 49, 1259–1268. [Google Scholar] [CrossRef] [Scilit]
- Goguitchaishvili, A.; Ruiz, R.G.; Bautista, F.; Hernández, R.S. Colorimetric method to estimate the soil organic matter in karst areas. Ecosistemas Recur. Agropecu. 2022, 9, 1. [Google Scholar] [CrossRef] [Scilit]
- Ma, Y.; Guo, Y. Variation in Gemological Characteristics in Tsavorites with Different Tones from East Africa. Crystals 2022, 12, 1677. [Google Scholar] [CrossRef] [Scilit]
- Yang, P.; Guo, Y. New Insights into Coloration Mechanism in Violet-Red Pyrope-Almandine. Crystals 2022, 12, 379. [Google Scholar] [CrossRef] [Scilit]
- Zhu, M.; Guo, Y. New Insights into the Coloration Mechanism in Spessartines and the Impact of Munsell Neutral Grey Backgrounds. Crystals 2023, 13, 1529. [Google Scholar] [CrossRef] [Scilit]
- Liu, Z.; Guo, Y. The Effect of Munsell Neutral Value Scale on the Color of Yellow Jadeite and Comparison between AP and K-Means Clustering Color Grading Schemes. Crystals 2022, 12, 241. [Google Scholar] [CrossRef] [Scilit]
- Hu, J.; Li, P.; Yang, Y.; Yang, L.; Wang, N.; Guo, Y. Chemical Controls on the Green Coloration of the Novel Gem Quartzite “Feizhoucui”: A CIE L*a*b* Colorimetric Study. Crystals 2026, 16, 145. [Google Scholar] [CrossRef] [Scilit]
- Wang, X.; Guo, Y. The Impact of Trace Metal Cations and Absorbed Water on color Transition of Turquoise. R. Soc. Open Sci. 2021, 8, 201110. [Google Scholar] [CrossRef] [Scilit] [PubMed]
- Renfro, N.; McClure, S.F. Dyed purple hydrophane opal. Gems Gemol. 2011, 4, 260–270. [Google Scholar] [CrossRef] [Scilit]
- Liu, Y. color hue change of a gem tourmaline from the Umba Valley, Tanzania. J. Gemmol. 1999, 26, 386–396. [Google Scholar] [CrossRef] [Scilit]
- Tang, J.; Guo, Y.; Xu, C. Metameric Effects on Peridot by Changing Background Color. J. Opt. Soc. Am. A—Opt. Image Sci. Vis. 2019, 36, 2030–2039. [Google Scholar] [CrossRef] [Scilit] [PubMed]
- Furon, R. Geology of Africa; Oliver and Boyd: Edinburgh, UK, 1963. [Google Scholar]
- Locock, A.J. An Excel spreadsheet to recast analyses of garnet into end-member components, and a synopsis of the crystal chemistry of natural silicate garnets. Comput. Geosci. 2008, 34, 1769–1780. [Google Scholar] [CrossRef] [Scilit]
- Kumarbekov, K.K.; Zhilgildinov, Z.S.; Karipbayev, Z.T.; Zhunusbekov, A.M.; Nurmoldin, E.E.; Brik, M.G.; Suchikova, Y.; Kemere, M.; Popov, A.I.; Kassymzhanov, M.T. A novel method of preparation of Y3Al5O12: Cr3+ ceramics and its structural and optical characterization. Opt. Mater. 2025, 159, 116535. [Google Scholar] [CrossRef] [Scilit]
- Li, W.; Zheng, J.; Pei, J.; Xu, X.; Chen, T. Correlations between Garnet Species and Vibration Spectroscopy: Isomorphous Substitution Implications. Crystals 2022, 12, 104. [Google Scholar] [CrossRef] [Scilit]
- Taran, M.N.; Dyar, M.D.; Matsyuk, S.S. Optical absorption study of natural garnets of almandine-skiagite composition showing intervalence Fe2+ + Fe3+ → Fe3+ + Fe2+ charge-transfer transition. Am. Mineral. 2007, 92, 753–760. [Google Scholar] [CrossRef] [Scilit]
- Vigier, M.; Evans, H.; Rossman, G.R.; Jobic, S.; Fritsch, E. Fe-Ti vs. Fe-Fe charge transfers: A comprehensive review and its applications in minerals and glasses. Am. Mineral. 2026, 111, 567–582. [Google Scholar] [CrossRef] [Scilit]

Disclaimer/Publisher’s Note: The statements, opinions and data contained in all publications are solely those of the individual author(s) and contributor(s) and not of MDPI and/or the editor(s). MDPI and/or the editor(s) disclaim responsibility for any injury to people or property resulting from any ideas, methods, instructions or products referred to in the content. |
© 2026 by the authors. Licensee MDPI, Basel, Switzerland. This article is an open access article distributed under the terms and conditions of the Creative Commons Attribution (CC BY) license.