


Abstract
Pearl luster is commonly assessed by expert visual grading, which is subjective and may show limited interlaboratory reproducibility. We developed a dual-indicator imaging method for Chinese freshwater nucleated pearls using surface luminance and interference color. Ninety pearls visually classified as weak-, medium-, or strong-luster were measured by multi-view luminance imaging and interference-color imaging. A background-corrected brightness index (GL) was derived from peak luminance, background luminance, and full width at half maximum, while an interference color index (IGI) was calculated from standardized hue and chroma dispersion in the upper interference-color region. GL showed a strong association with expert luster grade, whereas IGI also exhibited a significant positive relationship and provided complementary information for samples that were difficult to classify from GL alone. In leave-one-out cross-validation, combining GL and IGI improved classification accuracy from 73.3% for GL alone to 78.9%, and inclusion of a GL×IGI interaction further increased accuracy to 80.0%. These results indicate that surface-reflection intensity is the primary determinant of perceived pearl luster, while interference-color variation provides secondary diagnostic information. The proposed dual-indicator framework may therefore serve as an objective complement to conventional expert grading.
1. Introduction
Pearl luster is a core attribute determining pearl quality, market value, and consumer preference, and is also one of the most important evaluation dimensions in gemological grading. The GIA pearl value factor system lists luster as a fundamental factor in pearl quality assessment [1]. In current industry practice, trained graders usually assign ordinal grades such as weak, medium, and strong under standardized illumination and with reference samples, based on the brightness, sharpness, and continuity of surface-reflected highlights. This approach has a mature practical basis, but the results depend on observer experience and viewing conditions, and reproducibility across graders and laboratories may therefore be limited. Moreover, a visual grade is an integrated perceptual judgment and cannot readily separate the relative contributions of different optical processes to the final perception of luster. Establishing instrument-based metrics that correspond to expert perception, have clear physical meaning, and can be standardized is therefore an important basis for objective characterization of pearl luster.
From an optical perspective, the visual appearance of a pearl is not determined by a single signal. Specular and near-specular reflection from the outermost nacre directly produces surface highlights, mainly affecting brightness, sharpness, and perceived clarity of luster. Within the nacre, the layered structure formed by the periodic arrangement of aragonite platelets and organic layers generates iridescence, overtone, and the aurora effect through multiple reflection, transmission, diffraction, and thin-film interference. Ozaki et al. [2] showed that the formation of pearl structural color requires simultaneous consideration of reflection, transmission, and internal scattering, and that aragonite-layer thickness and surrounding observation conditions affect color appearance. Fan et al. [3] further analyzed interference-color fringes to investigate nacre nanostructure, demonstrating that spatial variations in structural color can reflect differences in aragonite-layer thickness and in the optical properties of organic layers. Salman et al. [4] proposed hyperspectral interference tomography, combining multi-angle, polarization-resolved hyperspectral imaging with optical-interference modeling to achieve nondestructive, large-area quantitative characterization of nacreous aragonite platelet thickness, thereby providing additional quantitative support for the layered structural basis of interference color. Thus, surface reflection and layered-structure interference have distinct physical origins, but both may contribute to the observer’s overall judgment of pearl luster.
Research on these two optical contributions has developed along three main directions. The first focuses on nacre microstructure and its influence on surface reflection. Zhou et al. [5], combining colorimetric measurements, laser confocal microscopy, and X-ray computed tomography, found that higher porosity in the nacre layer increases surface roughness, decreases reflectance, and weakens luster, thereby linking nacre compactness to luster variation. The second direction concerns the optical origins of color and structural color. Karampelas et al. [6] proposed a Raman-scattering method to distinguish pigments in cultured freshwater pearls, providing a basis for excluding yellow body-color pigments from the overall color signal; Muhammad et al. [7] examined the relationship between red and blue nacre interference colors of donor and recipient oysters and pearl quality; and Yang et al. [8] further revealed potential structural factors driving freshwater pearl color variation from the relationship between internal structure and overall color appearance. The optical model of Ozaki et al. [2] and the structural-color fringe analysis of Fan et al. [3] likewise demonstrated, theoretically and experimentally, that interference color has a well-defined layered structural basis. A third research direction seeks automated evaluation of pearl quality or luster using instruments and data-driven methods. For example, Salyacheewin et al. [9] measured pearl luster using CIELAB lightness differences under different reflection geometries; Kustrin and Morton [10] combined UV-Vis reflectance spectroscopy with a probabilistic neural network for pearl quality grading; Ota et al. [11] extracted spectral–spatial features using a hyperspectral camera to quantify pearl color, luster, and nacre thickness; and Zhou et al. [12] classified luster grades using optical coherence tomography (OCT) image texture features with support vector machines and random forests. The production and quality characteristics of Chinese freshwater cultured pearls were reviewed by Akamatsu et al. [13], the structure and chemical composition of nacre in shells and pearls were investigated by Gutmannsbauer and Hänni [14], and the nacre nanostructure responsible for pearl iridescence was investigated by Snow et al. [15]. Collectively, these studies demonstrate the value of reflectance, colorimetric, spectral, and structural measurements, but they do not fully resolve how surface brightness and interference color jointly relate to expert luster grades in the same pearl set. In particular, their degree of overlap and the incremental value of interference color for difficult classifications remain unclear.
Accordingly, this study evaluated 90 expert-graded Chinese freshwater nucleated pearls using two interpretable optical descriptors. A background-corrected surface-brightness index (GL) was derived from multi-view luminance profiles, and an interference color index (IGI) was constructed from spatial hue and chroma dispersion in the upper interference-color region. Their associations with expert grade, mutual relationship, and incremental contribution to ordinal classification were assessed using GL-only, additive GL + IGI, and exploratory GL × IGI models with leave-one-out cross-validation.
2. Materials and Methods
2.1. Samples and Reference Grading
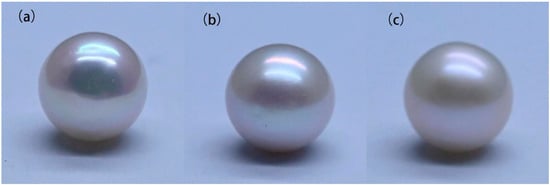
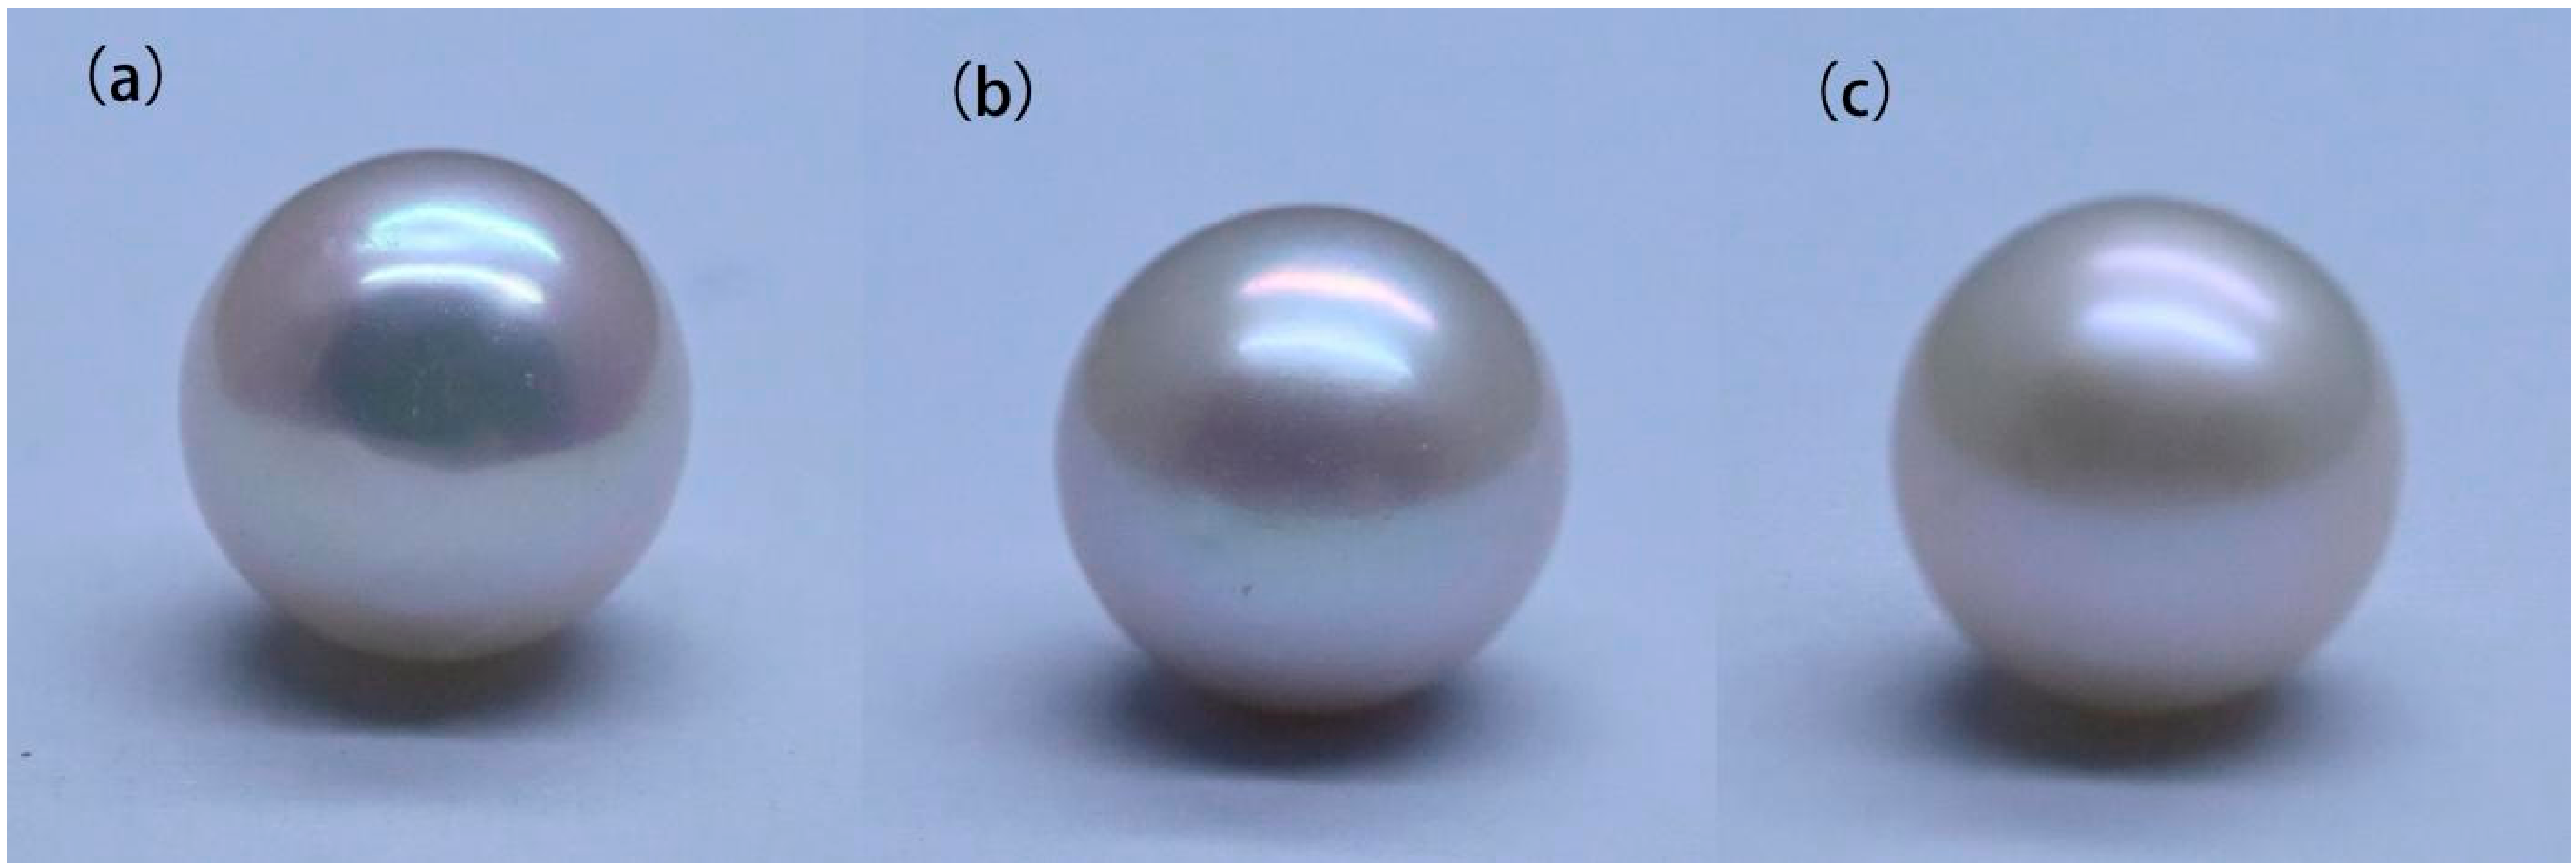
This study selected 90 Chinese freshwater nucleated pearls from Shanxiahu, Zhuji, Zhejiang Province, China. The pearls were 8–10 mm in diameter and had a white body color. They were divided by expert visual assessment into strong-, medium-, and weak-luster groups (Q, Z, and R; n = 30 each). Representative appearances are shown in Figure 1. Visual grading was performed by experienced pearl-grading experts in a T60 color assessment cabinet (Shenzhen Tianyouli Standard Light Source Co., Ltd., Shenzhen, China) under D65 illumination, following GB/T 18781-2023 [16]. The standard defines pearl luster by the intensity of reflected light and the sharpness of the reflected image; the Q, Z, and R groups corresponded to the strong (B), medium (C), and weak (D) categories used in the standard, respectively. Three experts graded each pearl independently under identical conditions. The consensus grade for each pearl was assigned by majority vote among the three experts; no three-way split occurred because all disagreements were between adjacent grades.
Figure 1.
Representative appearances of pearls (a) in the strong-(Q), (b) medium-(Z), and (c) weak-(R) luster groups under standard viewing conditions.
2.2. Luminance Measurement (GL)
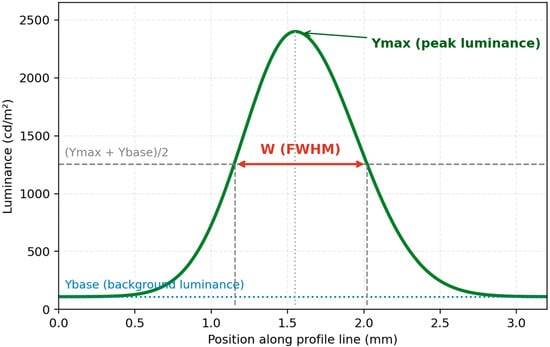
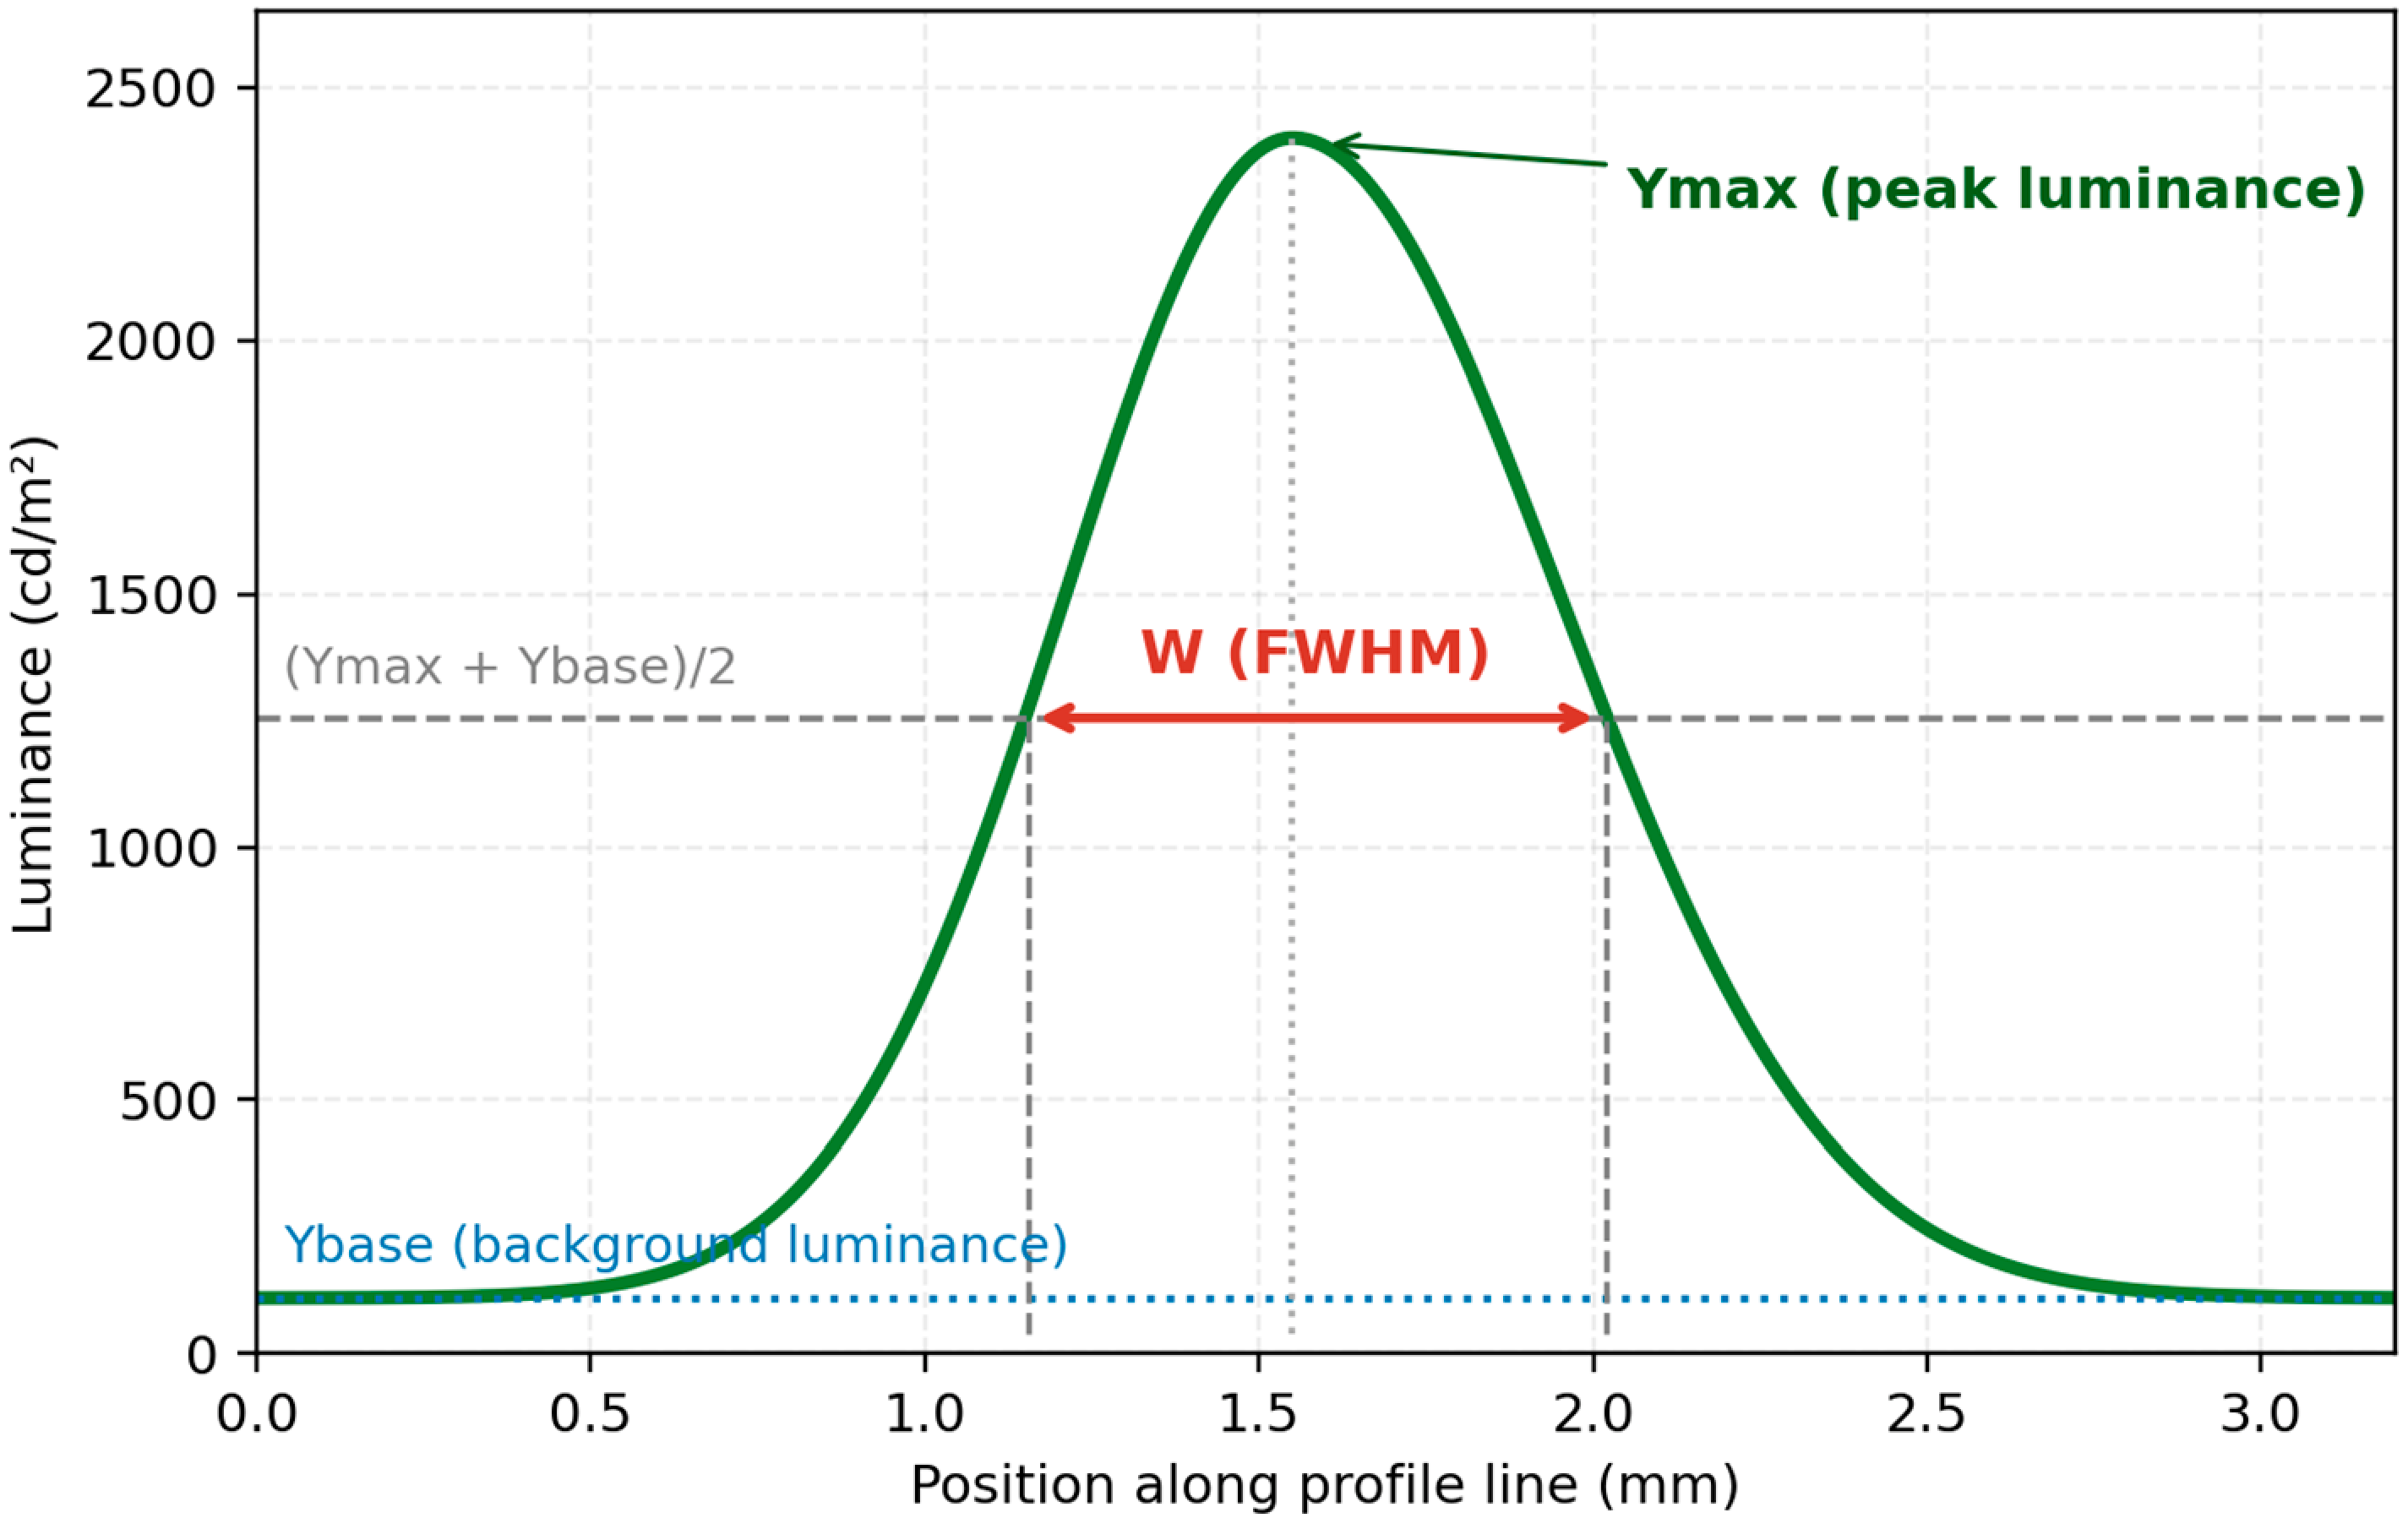
Surface luminance was measured using a Lumicam 1300 Color luminance camera(Instrument Systems GmbH, Munich, Germany). Each pearl was rotated in 30° increments and imaged 12 times, covering the full 360° circumference. For each image, Ymax was obtained from the Max value of spotmeter #001, whereas Ybase was calculated as the mean of the Avg values from background spotmeters #002 and #003. The background-corrected half-maximum level was defined as Yhalf = Ybase + (Ymax − Ybase)/2. As illustrated in Figure 2, the full widths at half maximum along the horizontal and vertical profiles were recorded as FWHMh and FWHMv, respectively, and their arithmetic mean was used as W = (FWHMh + FWHMv)/2. The FWHM was determined from the two intersections between Yhalf and each luminance profile using the profile scale provided by the LumiCam report. For each view, GL = (Ymax − Ybase)/W was calculated, and the 12 view-specific GL values were averaged to obtain the pearl-level GL.
Figure 2.
Schematic definition of Ymax, Ybase, and the background-corrected half-maximum width. For a single horizontal or vertical profile, the FWHM is measured at Yhalf = Ybase + (Ymax − Ybase)/2; the pearl-level width term is W = (FWHMh + FWHMv)/2.
2.3. Interference-Color Measurement (IGI)
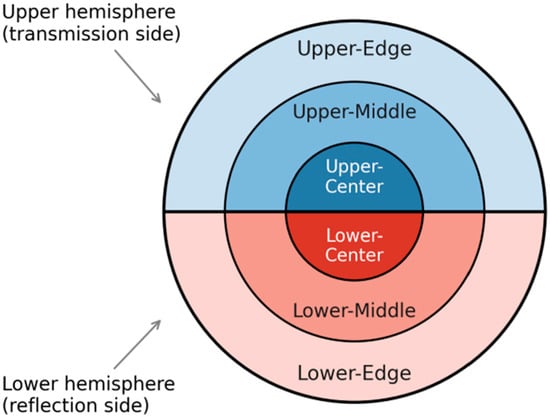
Interference-color measurements were performed with an H-Ar01 Aurora observation instrument (Pearl Science Laboratory, Tokyo, Japan) coupled with an NGI-6 gemological microscope (Nanjing Jiangnan Novel Optics Co., Ltd., Nanjing, China). The Aurora instrument places the pearl on a diffuse-light observation stage so that spatial interference colors generated within the nacre can be imaged under reproducible geometry. Three images were acquired per pearl under identical imaging conditions, with the pearl rotated by approximately 120° between successive acquisitions. In each image, the projected pearl disk was divided into upper and lower halves and then by concentric radii at 0.3R and 0.7R to form center, middle, and edge subregions (Figure 3). CIELAB lightness (L*), hue angle (h*), and chroma (C*) were extracted from each subregion. To avoid unstable hue estimates near the neutral axis, hue statistics were calculated only for pixels with C* ≥ 3, whereas regional C* was calculated from all pixels within the corresponding pearl region. No separate yellow/body-color threshold or neutral-highlight exclusion was applied in the revised analysis. The three repeated measurements for each upper subregion were then combined, with hue averaged using circular statistics and C* using the arithmetic mean.
Figure 3.
Regional sampling scheme for the interference color index (IGI). The visible surface was divided into upper and lower regions and further into center, middle, and edge subregions.
For each pearl, hue dispersion (huestd) was defined as the circular standard deviation of the mean hue values of the Upper–Center, Upper–Middle, and Upper–Edge regions (Figure 3), whereas chroma dispersion (C*std) was defined as the sample standard deviation of the corresponding mean C* values. The two dispersion measures were standardized across the 90 pearls and combined with equal weight: IGI = z(huestd) + z(C*std). Across the dataset, hue_std had a mean of 7.909° and an SD of 7.986°, while C*_std had a mean of 3.117 and an SD of 2.046 (n-1 denominator). For application to an independent dataset, these reference means and SDs should be held fixed rather than re-estimated from the new samples.
This formulation emphasizes spatial variation within the upper interference-color band rather than overall mean color. A larger IGI therefore indicates stronger regional differentiation of hue and chroma between the center, middle, and edge of the projected upper half. Circular statistics were used for hue because angular values near 0° and 360° cannot be treated correctly by ordinary linear averaging. The upper half was selected because the Aurora geometry produced the clearest and most repeatable interference-color band there; the excluded lower half represented approximately 50% of the projected disk in each view. The choice was checked empirically: an IGI constructed from the lower regions alone was not associated with expert grade (r = −0.150, p = 0.160), and pooling all six regions also gave no significant association (r = 0.099, p = 0.352).
As a robustness analysis, the upper-region IGI was recalculated after omitting one subregion at a time. The IGI-grade Pearson correlation remained significant when the center (r = 0.627, p < 0.001), middle (r = 0.531, p < 0.001), or edge (r = 0.404, p < 0.001) was omitted. A 5000-resample pearl-level bootstrap gave a 95% CI of 0.410–0.680 for the default IGI-grade Pearson correlation. These analyses indicate that the association is not dependent on a single region, although the edge contributes appreciably to discrimination.
2.4. Statistical Analysis
The relationships of GL and IGI with the ordinal expert visual grade (weak = 1, medium = 2, strong = 3) were evaluated using Pearson and Spearman correlation analyses. Differences in IGI among the weak-, medium-, and strong-luster groups were tested by one-way analysis of variance (ANOVA), with Kruskal–Wallis analysis as a nonparametric robustness check. The overall and grade-specific relationships between GL and IGI were evaluated using Pearson correlation. Exact p-values are reported for the principal tests unless p < 0.001, and 95% confidence intervals for Pearson correlations were calculated using Fisher’s z transformation. Robustness of IGI was further evaluated by leave-one-region-out recalculation and by nonparametric bootstrap resampling of pearls (5000 resamples). All tests were two-sided with α = 0.05. The final statistical analyses were performed in Python 3.13.5 using NumPy 2.3.5, SciPy 1.17.0, and statsmodels 0.14.6. = 0.05.
2.5. Inter-Rater Agreement of Visual Grading
All 90 pearls were independently graded by three gemological experts under the T60/D65 conditions described in Section 2.1. Agreement was quantified using Fleiss’ kappa (κ), with interpretation following Landis and Koch [14]. Consensus grade was assigned by majority vote, as described above.
Out-of-sample model performance was summarized by classification accuracy, quadratic-weighted Cohen’s kappa, and mean absolute error in ordinal grade units. An exploratory pearl-luster index (PLI) was derived from the standardized coefficients of the interaction model; because the coefficients were estimated from the same 90-sample dataset, the PLI was not treated as a finalized grading equation.
LOO-CV predictions from the GL-only and interaction models were compared sample by sample using an exact McNemar test. Pearls whose classification correctness changed after adding IGI and the interaction term were examined as difficult cases.
3. Results
Expert visual grading showed high inter-rater agreement. Fleiss’ kappa among the three experts was κ = 0.844, which is classified as “almost perfect” according to Landis and Koch [14]. Complete three-rater agreement was obtained for 76 of the 90 samples (84.4%), and pairwise weighted kappa values ranged from 0.841 to 0.927. All disagreements occurred between adjacent grades; no strong-versus-weak cross-grade conflicts were observed. These results indicate that the expert visual grading used in this study had good reliability and could serve as the reference standard for GL and IGI.
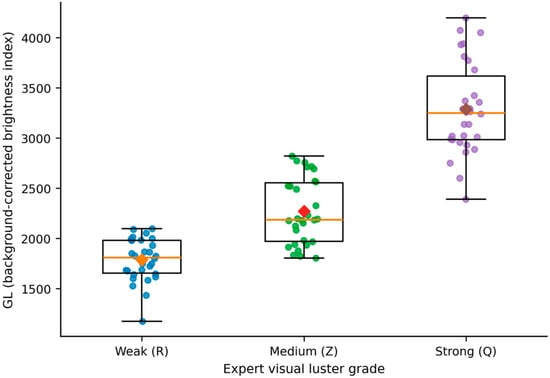
The background-corrected brightness index GL was strongly correlated with expert visual luster grade (Pearson r = 0.859, 95% CI 0.792–0.905, p = 2.86 × 10⁻²⁷; Spearman ρ = 0.881, p = 2.82 × 10⁻³⁰), indicating that the camera-derived metric captured the dominant surface-brightness component of expert luster perception. Mean GL increased from 1788.15 in the weak-luster group (R) to 2268.38 in the medium group (Z) and 3286.99 in the strong group (Q). This relationship is shown in Figure 4.
Figure 4.
Relationship between the background-corrected brightness index (GL) and expert visual luster grade.
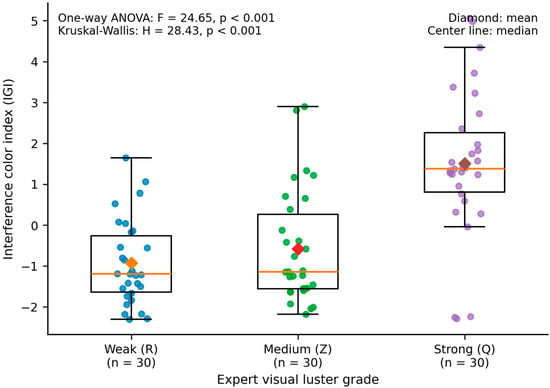
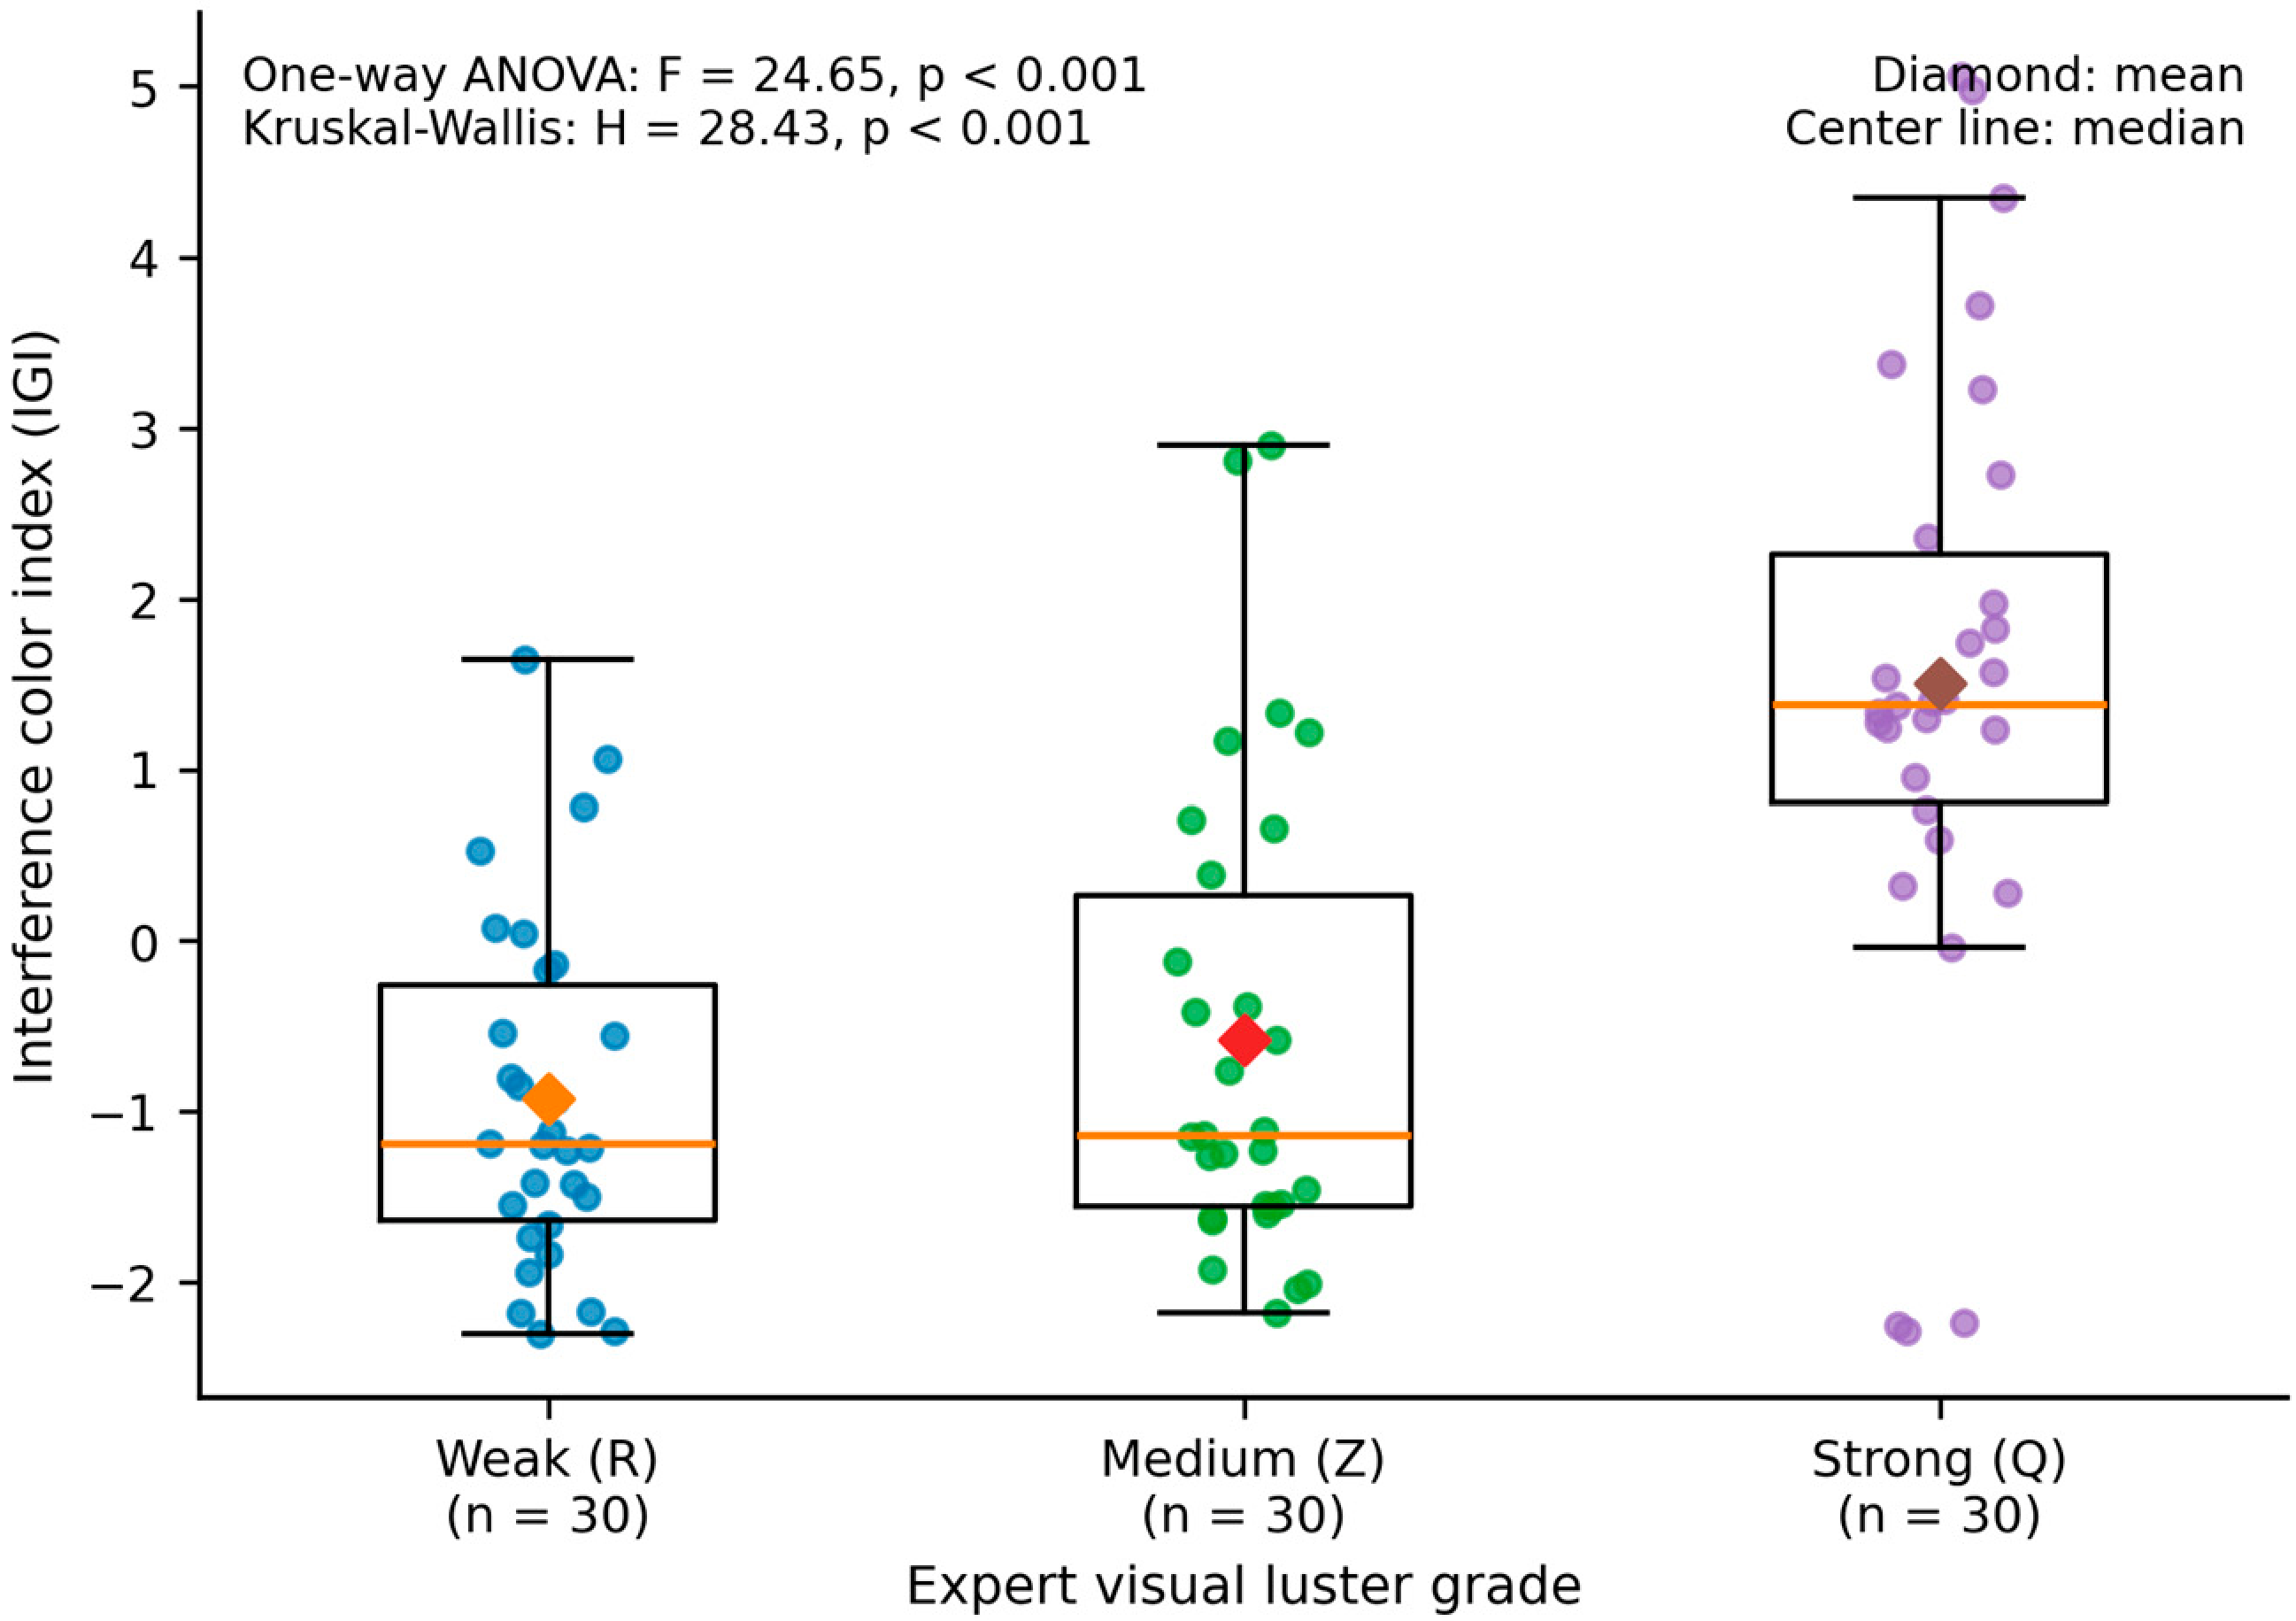
The interference color index IGI also showed a significant positive correlation with expert visual grades (Pearson r = 0.556, 95% CI 0.394–0.684, p = 1.26 × 10⁻⁸; Spearman ρ = 0.521, p = 1.39 × 10⁻⁷).The three groups differed significantly by one-way ANOVA (F = 24.65, p < 0.001), and the Kruskal–Wallis test gave the same conclusion (H = 28.43, p < 0.001). Mean IGI increased in the expected order: −0.926 for weak luster (R), −0.577 for medium luster (Z), and 1.504 for strong luster (Q). The bootstrap 95% CI for the Pearson IGI-grade correlation was 0.410–0.680. Leave-one-region-out recalculation remained significant when the center (r = 0.627), middle (r = 0.531), or edge (r = 0.404) was omitted, although the larger decrease after omitting the edge suggests that this region contributed substantial discriminating information. The IGI distributions are shown in Figure 5.
Figure 5.
Distribution of the interference color index (IGI) in the weak-, medium-, and strong-luster pearl groups. Points represent individual pearls (n = 30 per group); boxes show the interquartile range, center lines indicate medians, and diamonds indicate means.
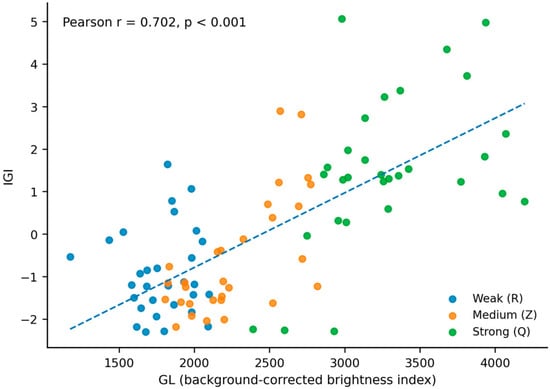
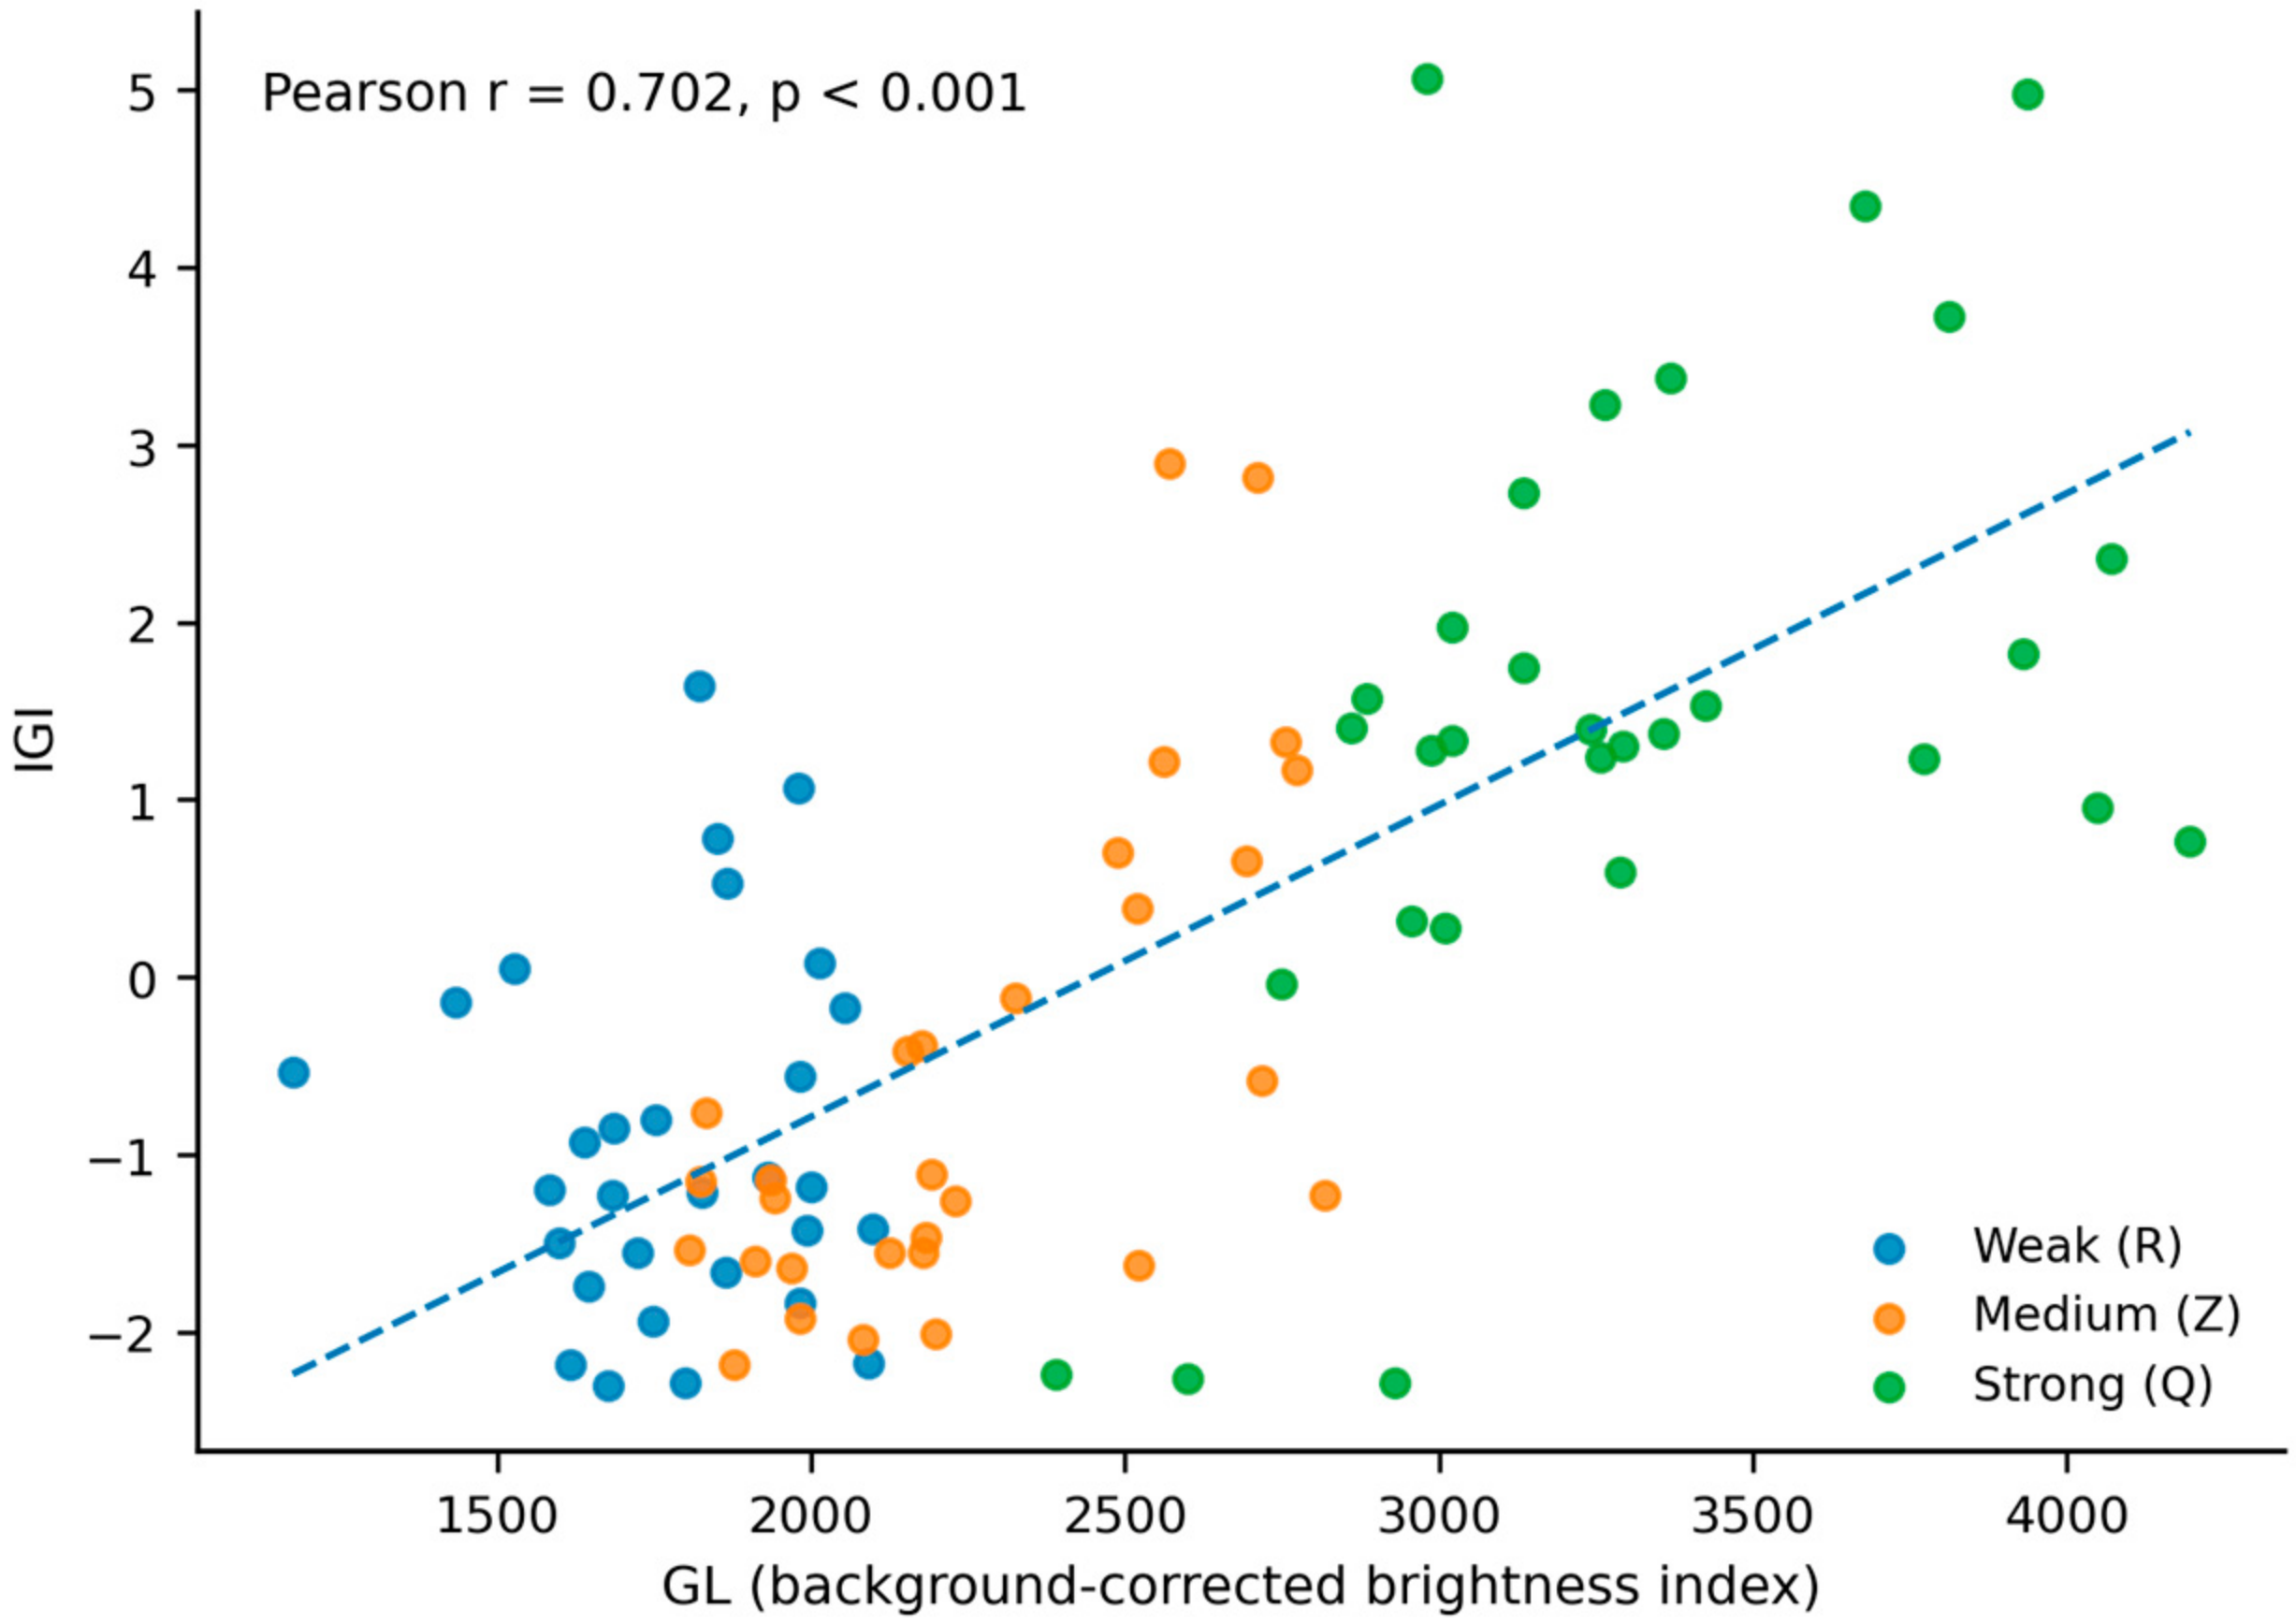
GL and IGI were positively correlated overall (Pearson r = 0.702, 95% CI 0.579–0.793, p = 1.34 × 10⁻¹⁴), indicating partial statistical overlap between surface-highlight intensity/concentration and spatial interference-color variation. However, the association was not uniform across expert grades, so the two indicators should not be regarded as interchangeable or as co-equal surrogates of the same optical property. Their joint distribution is shown in Figure 6.
Figure 6.
Joint distribution of the background-corrected brightness index (GL) and interference color index (IGI).
When analyzed by group, the GL–IGI correlation was negligible in the weak-luster group (R: r = 0.031, p = 0.873), strong in the medium-luster group (Z: r = 0.679, p < 0.001), and moderate in the strong-luster group (Q: r = 0.486, p = 0.006). Fisher’s z comparison showed that the R and Z correlations differed significantly (p = 0.003), whereas the R–Q (p = 0.066) and Z–Q (p = 0.275) differences did not reach significance. These results indicate that the coupling between surface reflection and interference-color variation depends on luster level rather than following a single uniform relationship.
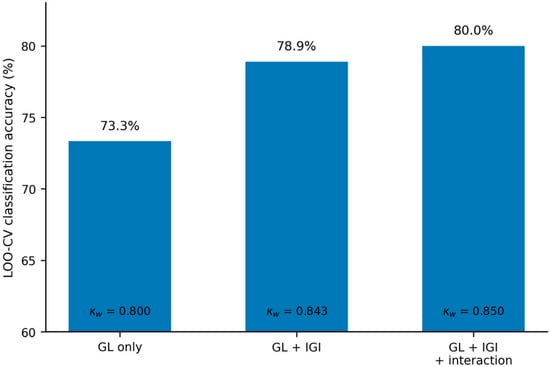
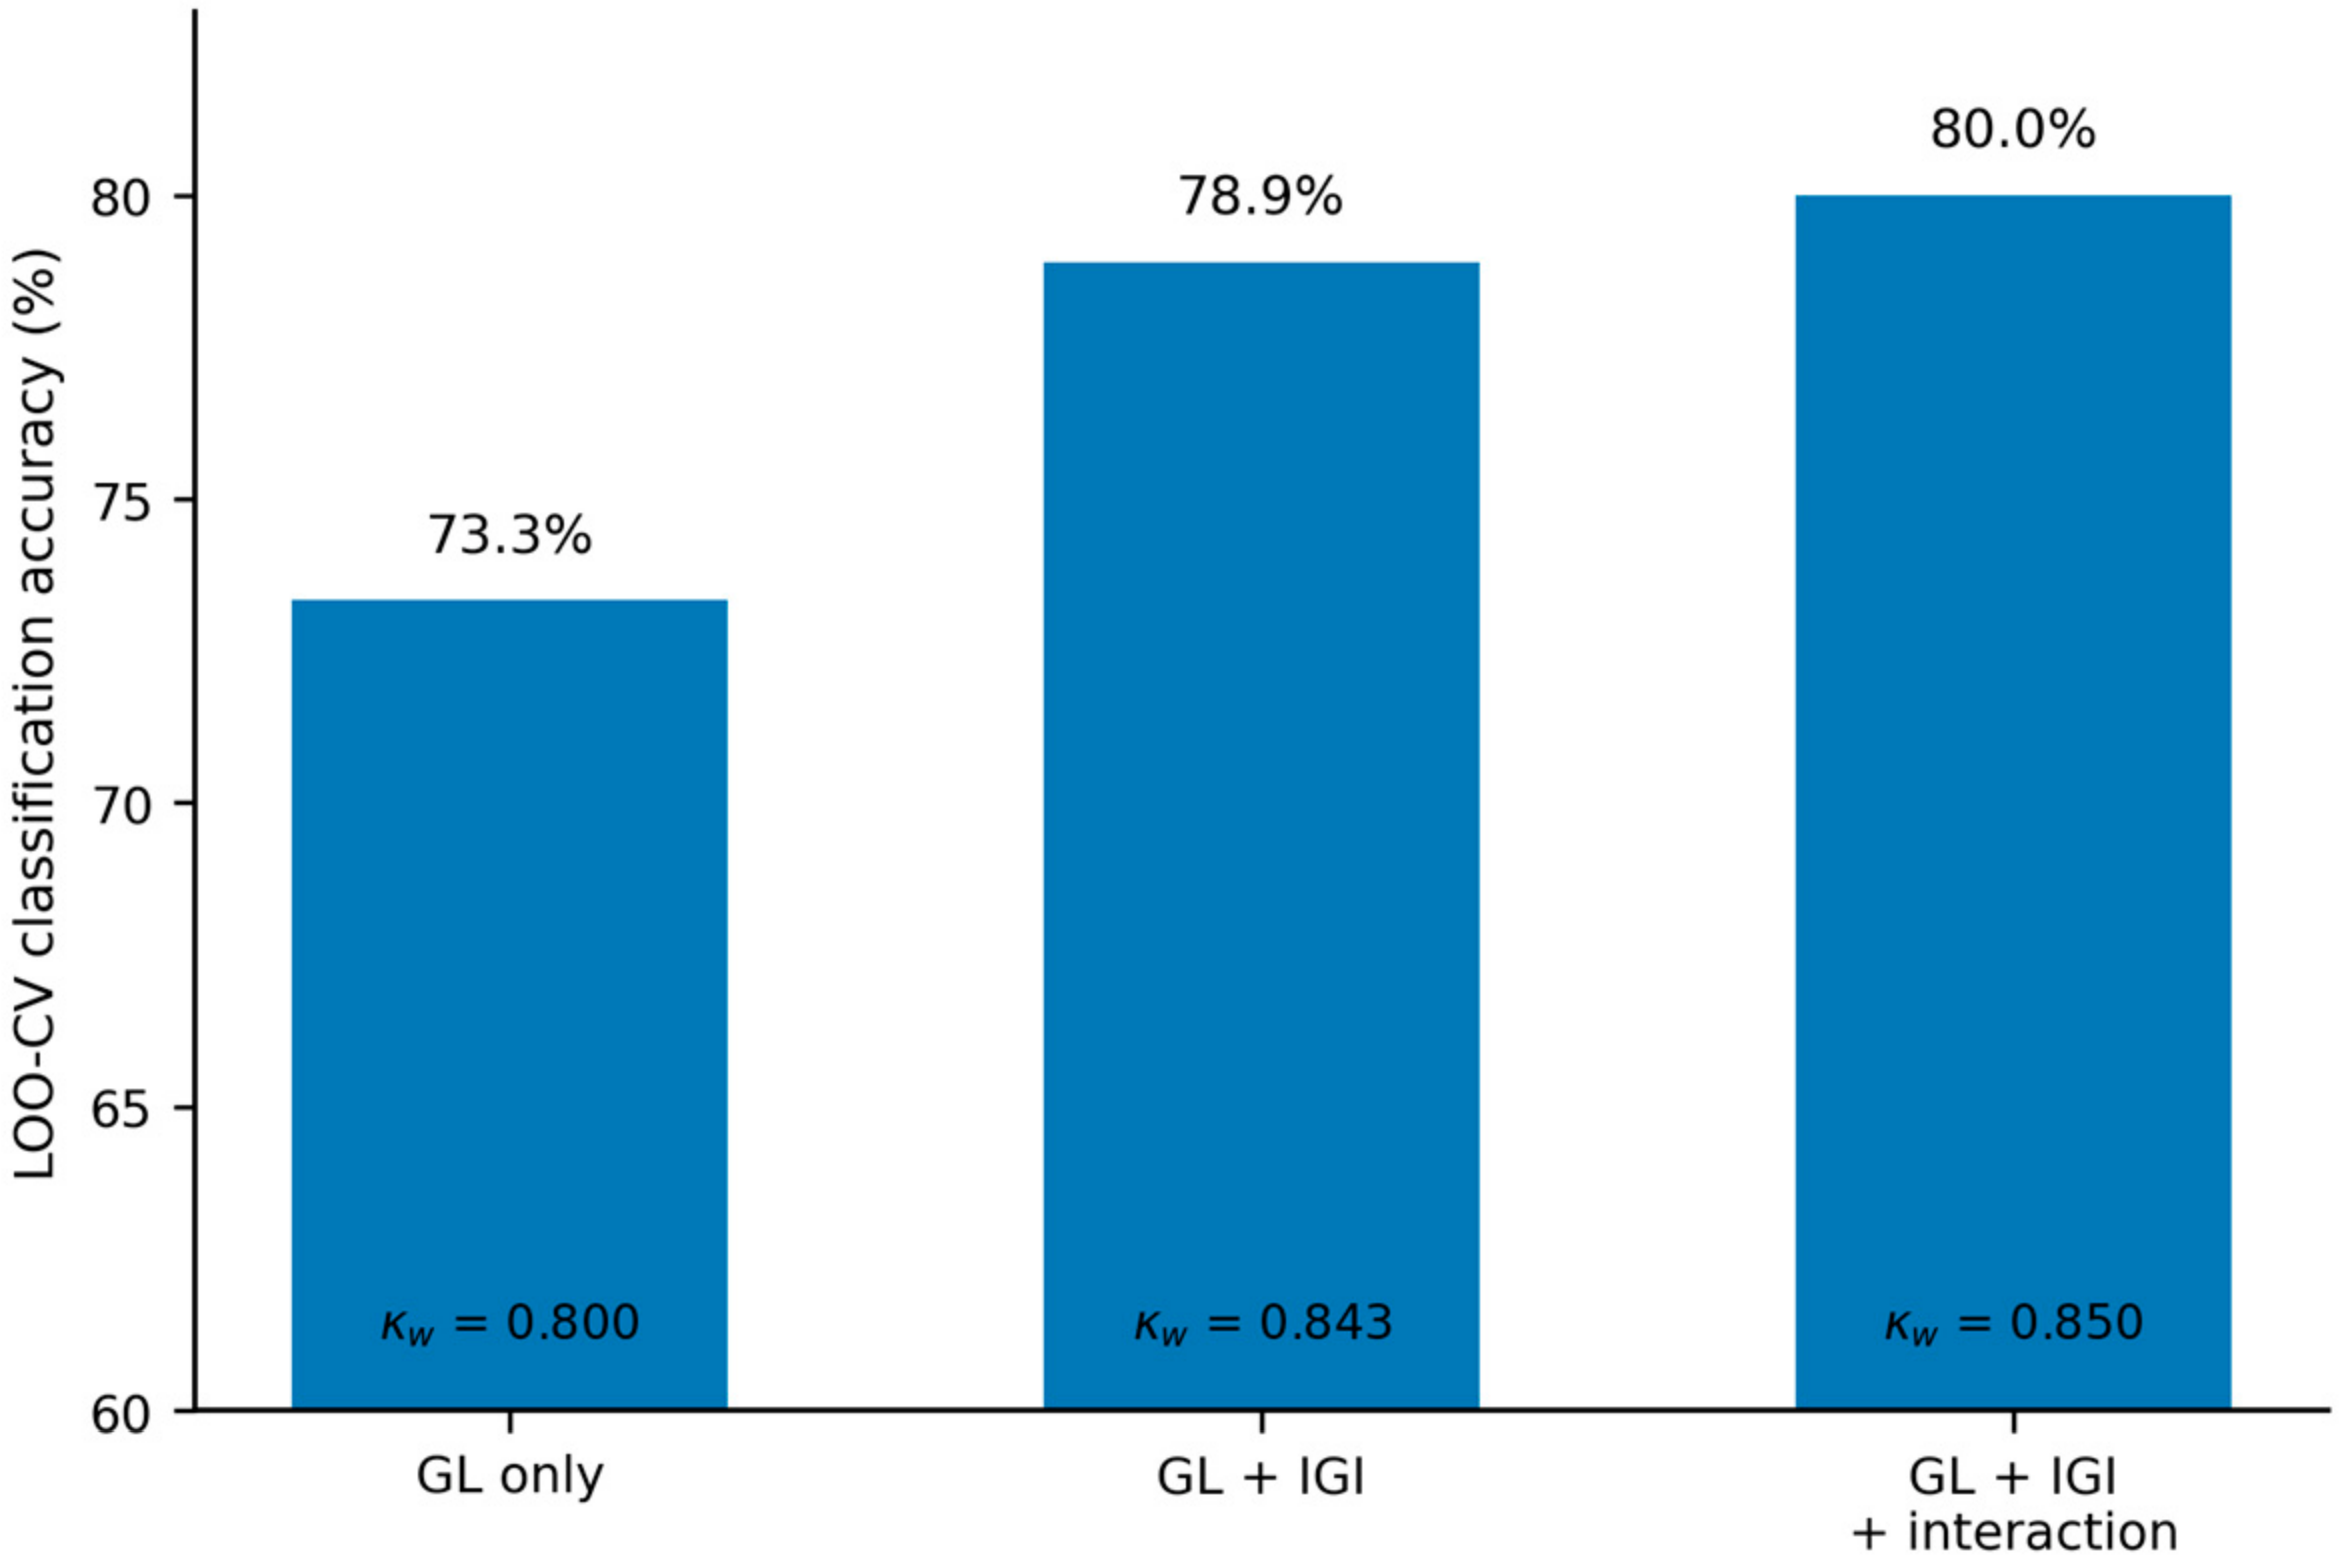
LOO-CV classification performance improved when IGI was added to GL. The GL-only ordinal model correctly classified 66 of 90 pearls (73.3%; quadratic-weighted κ = 0.800; MAE = 0.267). The additive GL + IGI model correctly classified 71 of 90 pearls (78.9%; κ = 0.843; MAE = 0.211), and the GL × IGI interaction model correctly classified 72 of 90 pearls (80.0%; κ = 0.850; MAE = 0.200). The corresponding confusion matrices are given in Table 1 and the model comparison is summarized in Figure 7. The largest practical gain from adding IGI was the reduction in weak-versus-medium errors rather than a wholesale reclassification of the sample set.
Table 1.
LOO-CV confusion matrices for the GL-only, additive GL + IGI, and GL × IGI interaction ordinal logistic models. Rows are expert grades and columns are predicted grades.
Figure 7.
Leave-one-out cross-validation performance of the GL-only, additive GL + IGI, and GL × IGI interaction ordinal logistic models.
In the full-sample ordinal interaction model, coefficients were 7.828 for z(GL) (95% CI 4.737–10.920, p = 6.92 × 10⁻⁷), –1.346 for z(IGI) (95% CI −2.532 to −0.159, p = 0.026), and 1.411 for z(GL) × z(IGI) (95% CI −0.255 to 3.077, p = 0.097). Because the IGI main effect is conditional on z(GL) = 0, its negative coefficient does not contradict the positive marginal IGI-grade association. The interaction term did not reach the 0.05 significance threshold; the model is therefore treated as exploratory and yields the following PLI:
PLI = 7.828 × z(GL) − 1.346 × z(IGI) + 1.411 × z(GL) × z(IGI)
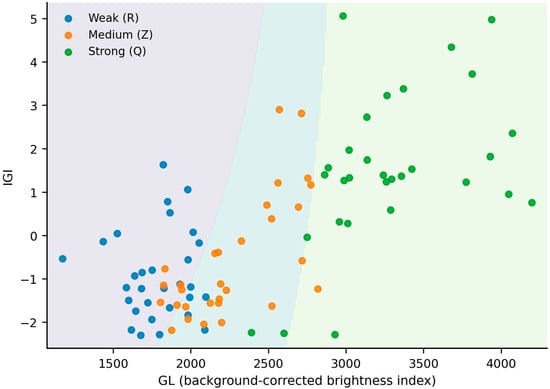
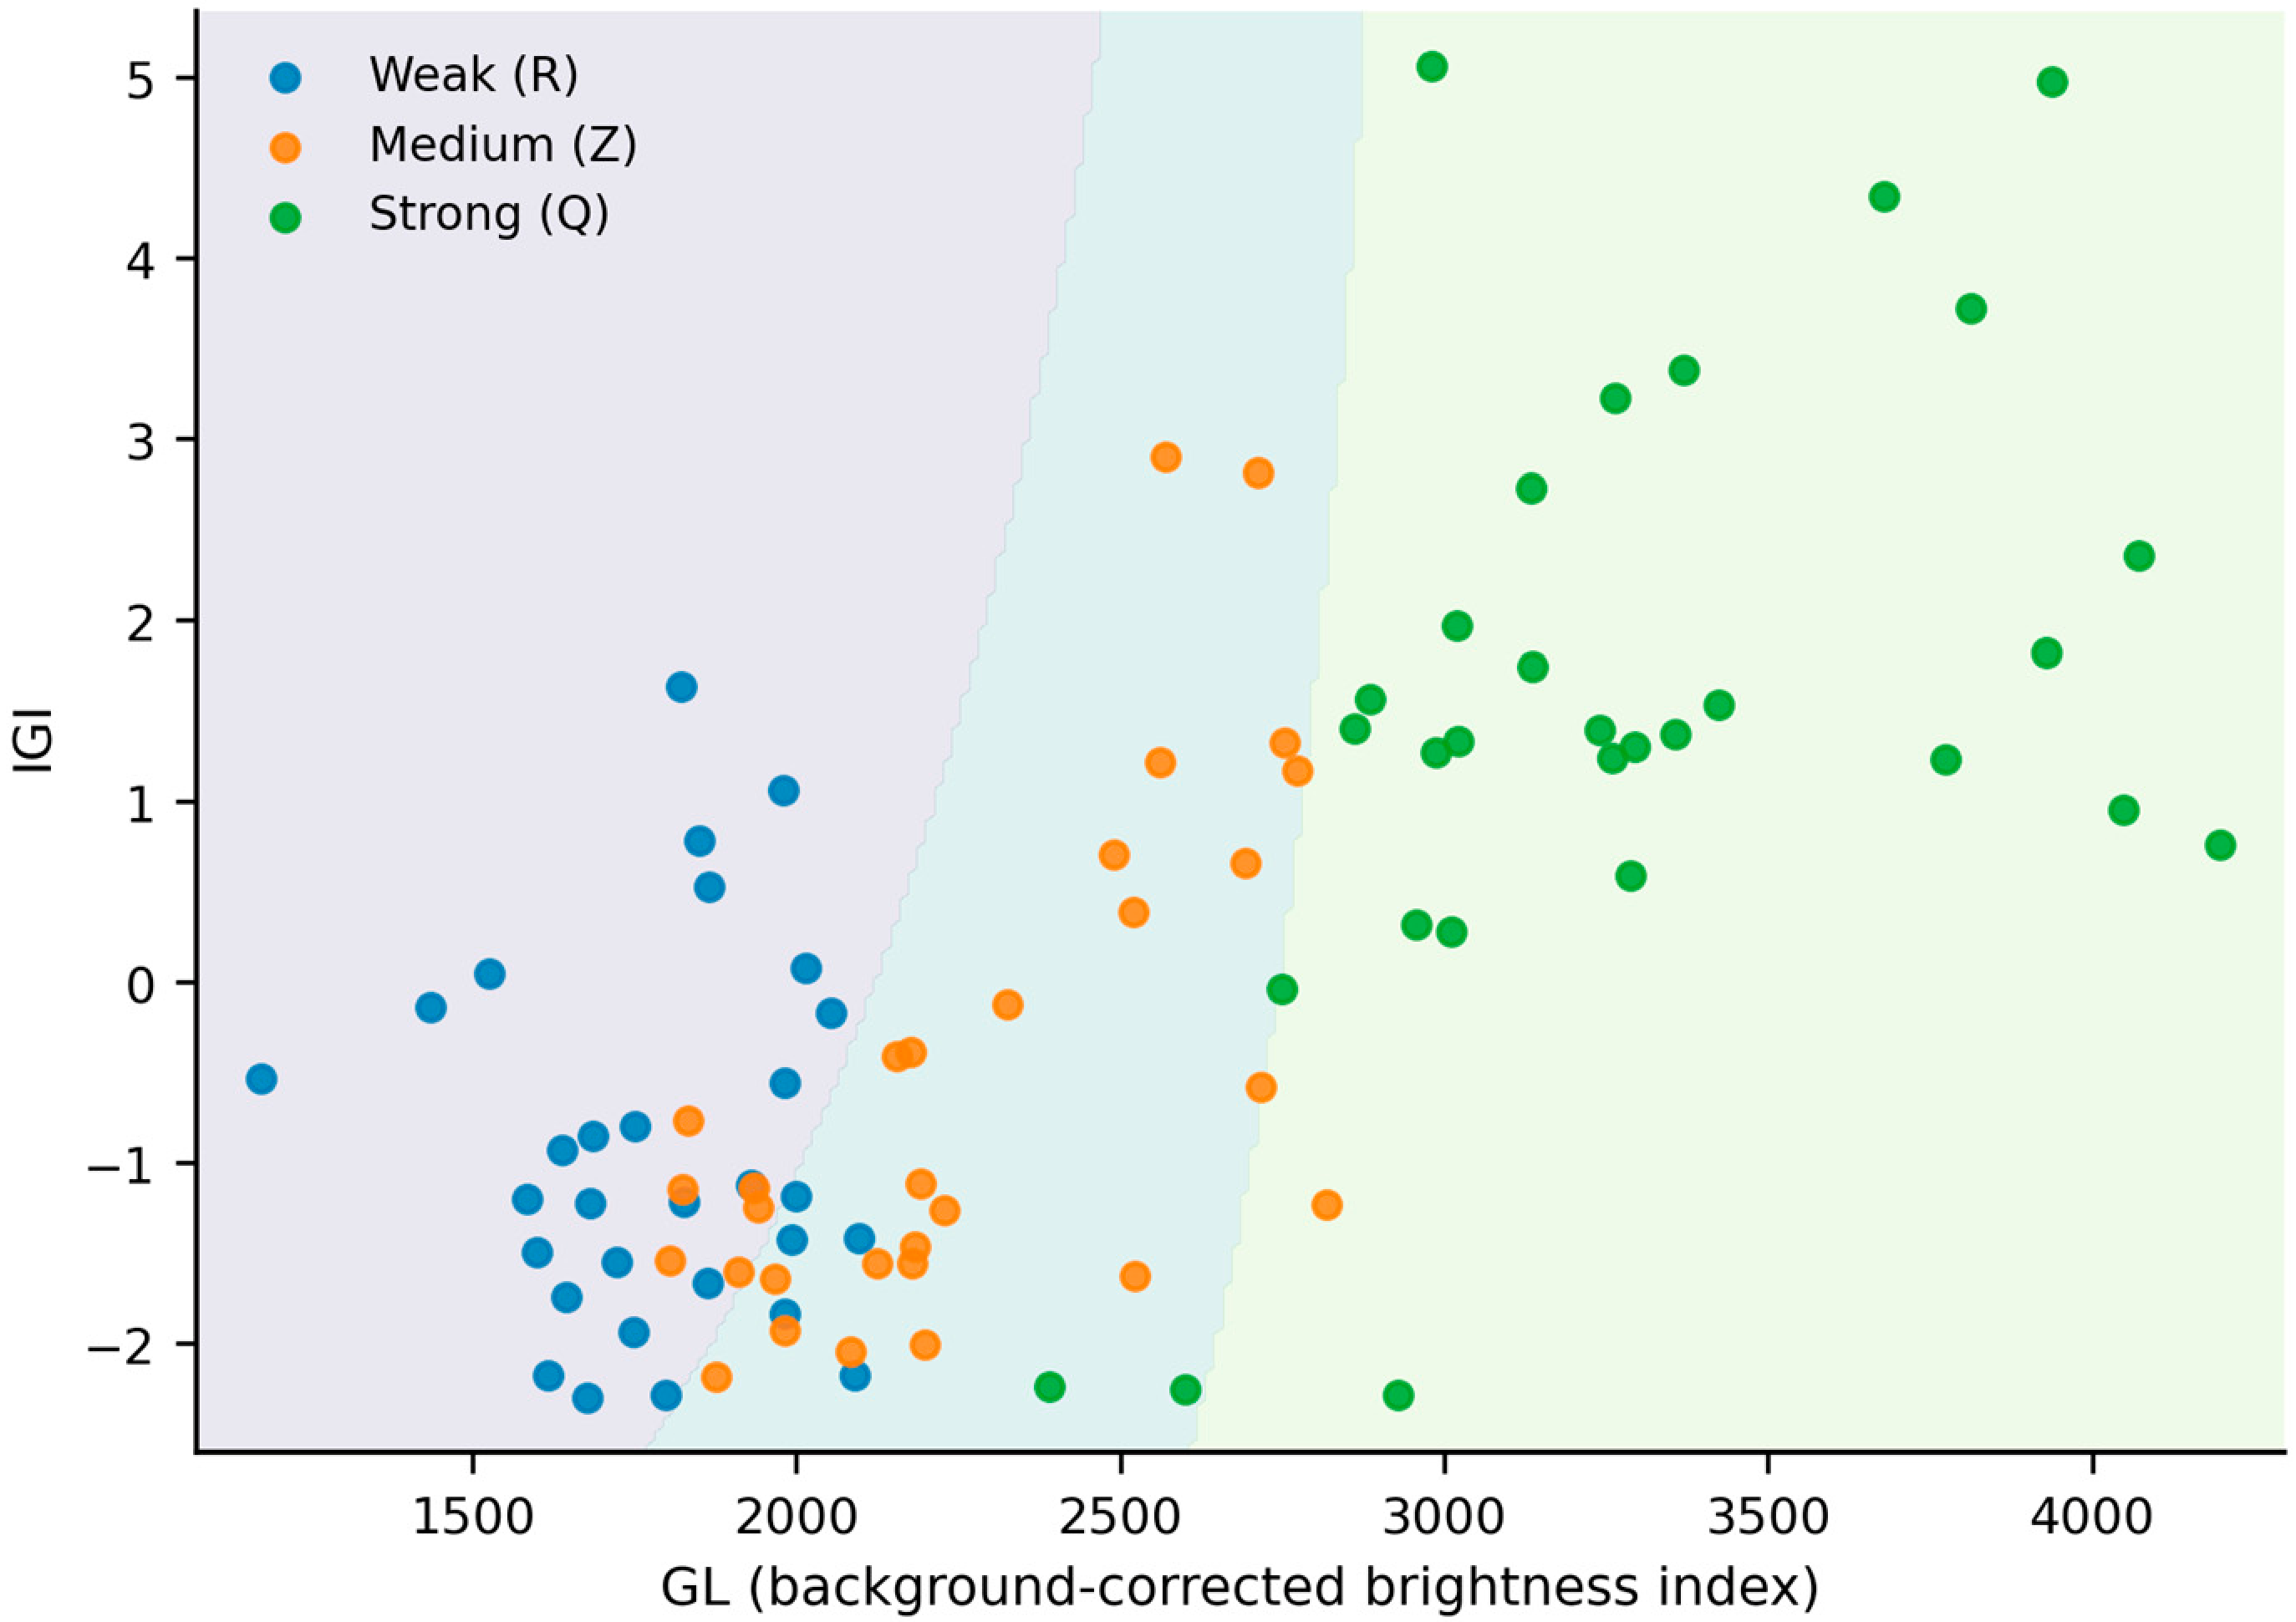
The interaction model achieved the highest LOO-CV accuracy (80.0%, 72/90), but most of the improvement over GL alone was already obtained by the additive GL + IGI model (78.9%, 71/90). Thus, the additional gain from the interaction term was small (Figure 8).
Figure 8.
Predicted pearl-luster grade regions from the exploratory ordinal logistic PLI model based on GL, IGI, and their interaction term.
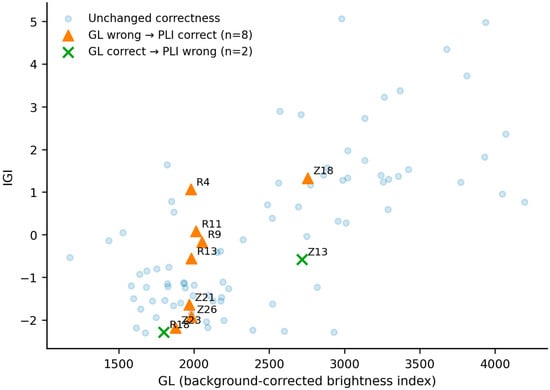
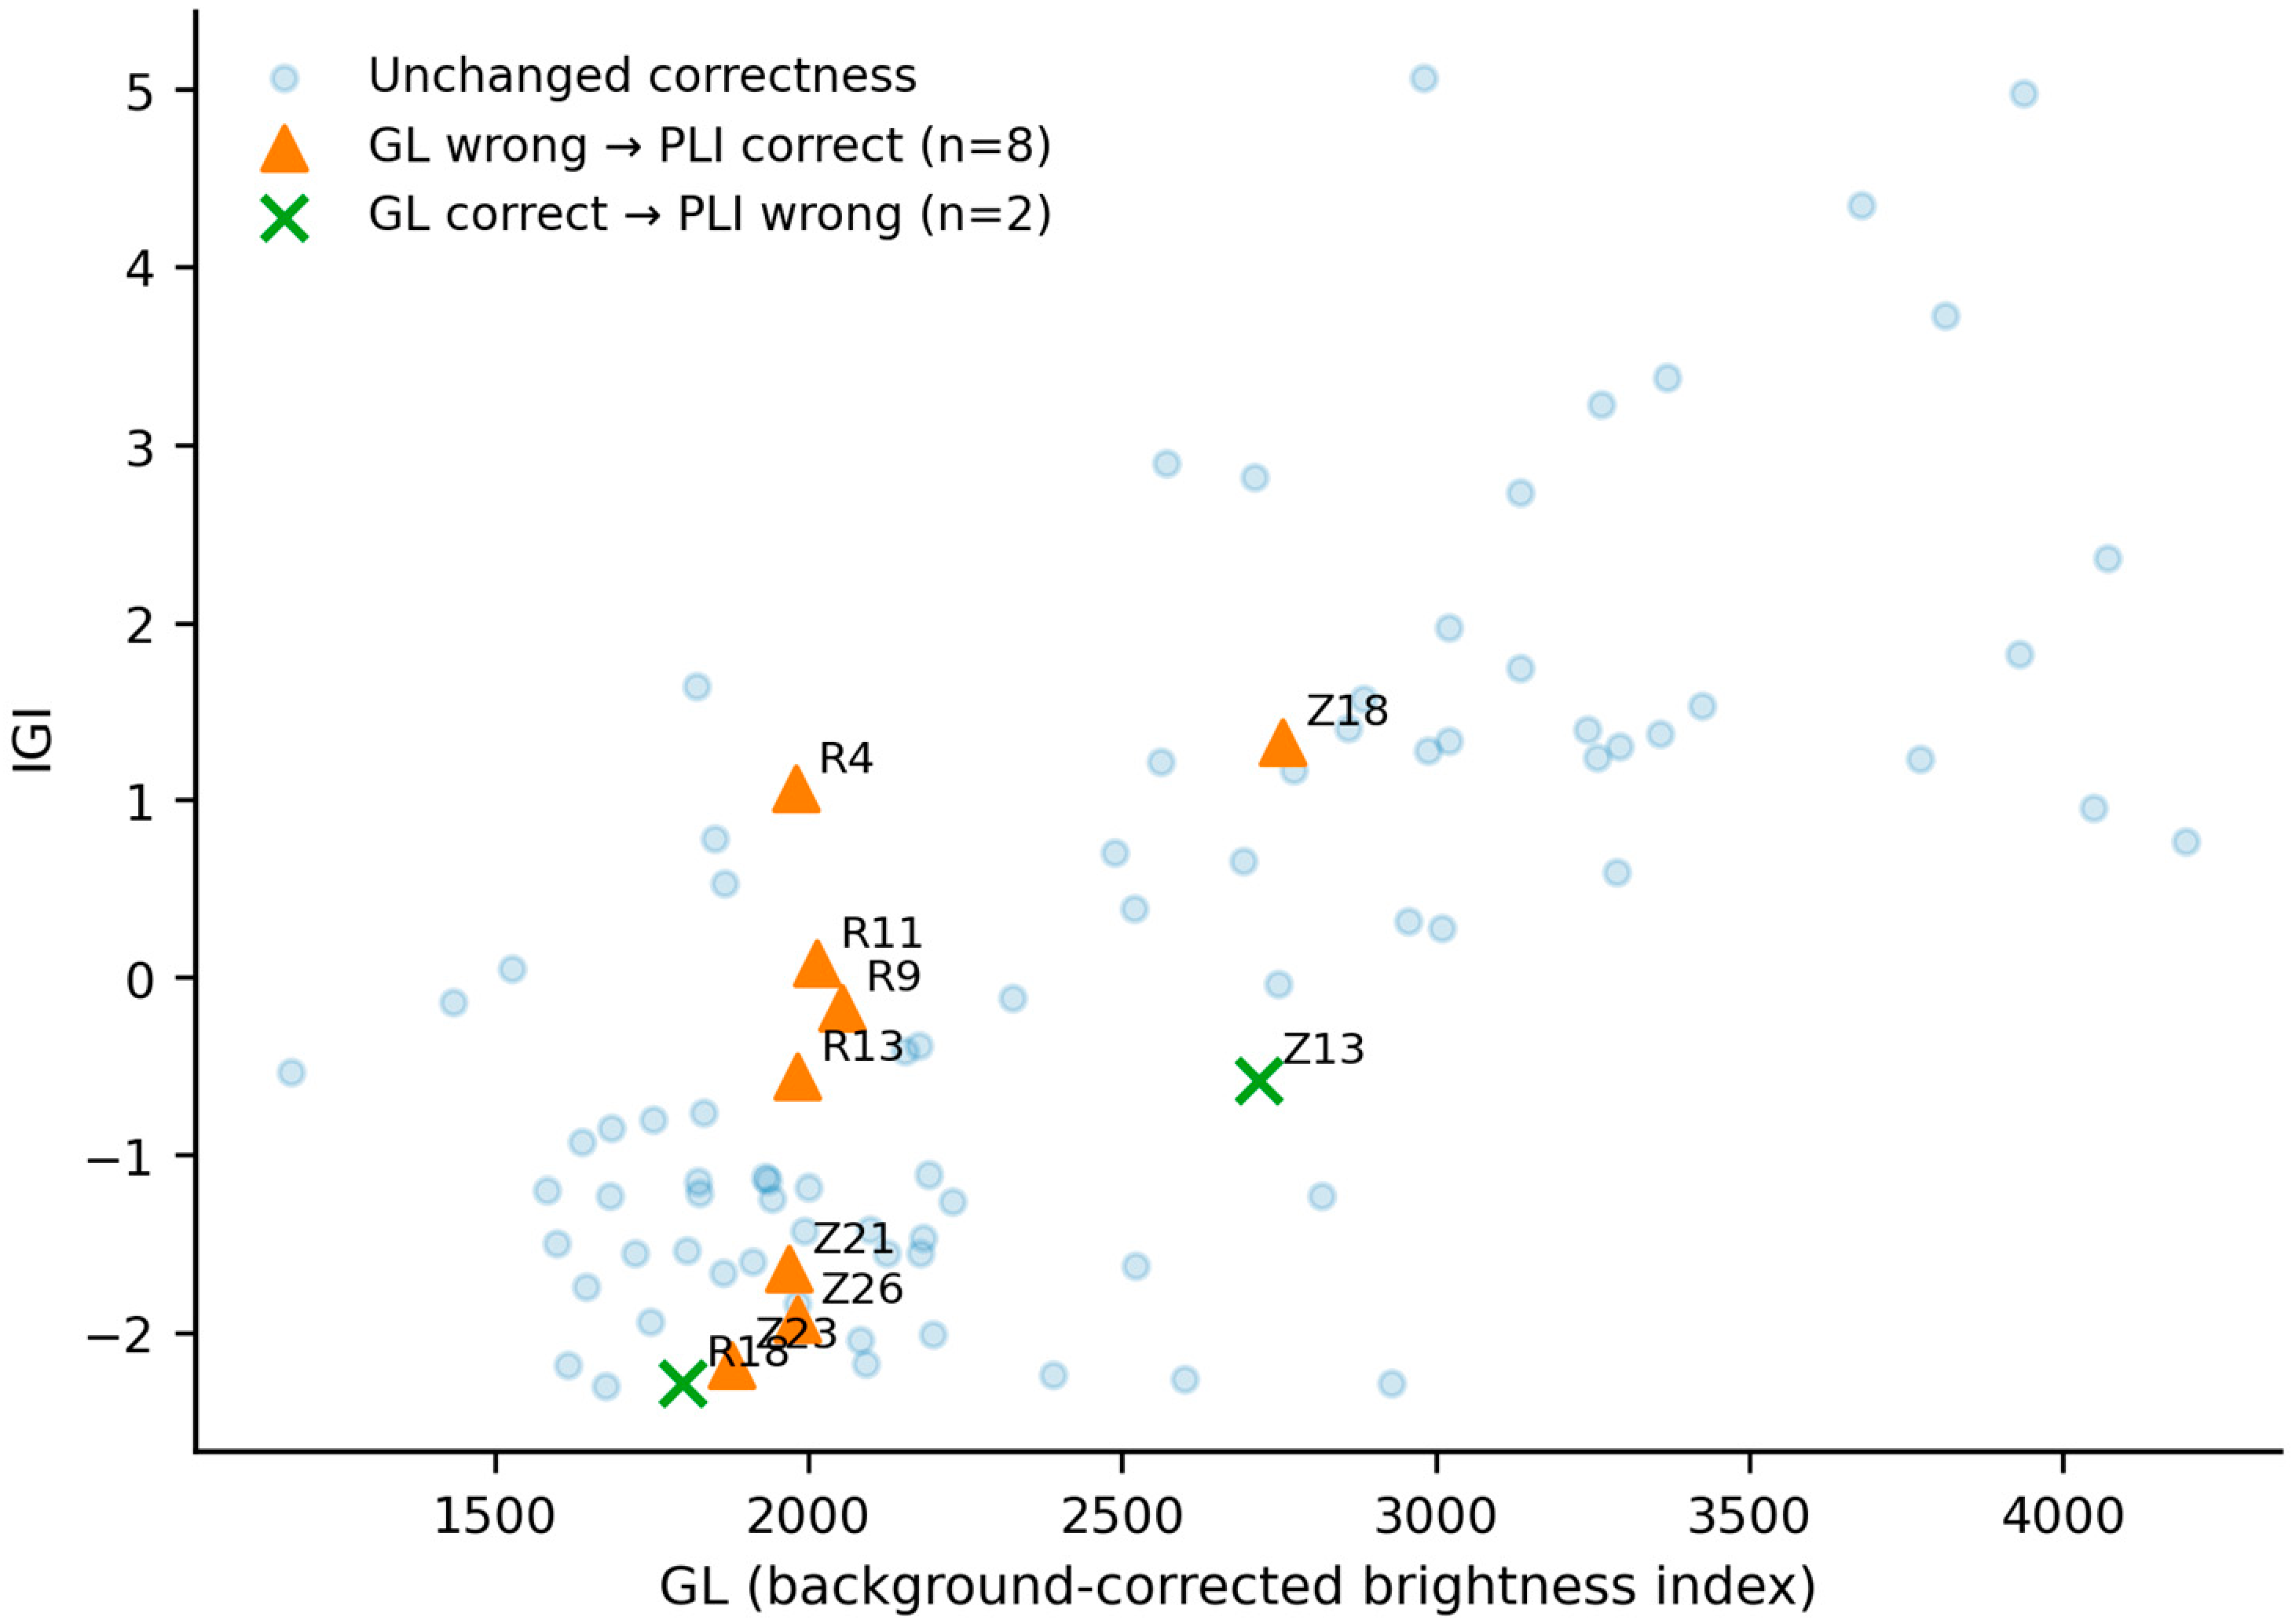
The interaction model corrected eight GL-only errors but introduced two new errors, for a net gain of six correctly classified pearls (66/90 to 72/90). The paired improvement was not statistically significant (exact McNemar p = 0.109). Corrections occurred mainly near the weak-to-medium boundary, with one at the medium-to-strong boundary (Figure 9). These results support GL as the primary measurement and IGI/PLI as a secondary aid for borderline or otherwise difficult cases; operational boundaries require independent calibration.
Figure 9.
Pearls whose classification correctness changed between the GL-only and interaction PLI models.
4. Discussion
The results support a luster model dominated by surface reflection with a smaller but measurable contribution from interference-color structure. GL correlated more strongly with expert grade than IGI (r = 0.859 vs. 0.556), indicating that highlight intensity and concentration are the primary instrumental correlates of visual luster. Nevertheless, the significant IGI-grade association shows that spatial hue and chroma variation provides additional information, consistent with previous studies of nacre structure, iridescence, and interference phenomena [17,18,19,20].
GL and IGI were positively correlated overall (r = 0.702), but their within-grade association was heterogeneous: essentially absent in weak-luster pearls, strong in the medium group, and moderate in the strong group. This pattern suggests partial coupling rather than redundancy. The physical interpretation, however, remains correlative because no SEM, OCT, porosity, or platelet-thickness measurements were obtained from the same pearls. GL is expected to respond mainly to surface and near-surface scattering: increased roughness or porosity can reduce peak luminance and broaden the highlight [5,12]. IGI is expected to respond more strongly to the spatial regularity of nacre layers, because ordered aragonite-organic stacks generate systematic angle-dependent hue and chroma variation across the curved pearl surface [2,3,4,19,20]. These mechanisms may co-vary when nacre growth quality affects both surface smoothness and layer organization, but they can also diverge, providing a plausible basis for the additional information carried by IGI. Direct microstructural validation is required before these mechanistic links can be considered established.
Adding IGI increased LOO-CV accuracy from 73.3% to 78.9%, while the exploratory interaction model reached 80.0%. However, the interaction term (p = 0.097) and the paired improvement over GL alone (McNemar p = 0.109) were not significant. The practical value of IGI is therefore modest and concentrated in a subset of difficult cases rather than representing a general replacement for GL.
At the sample level, the interaction model corrected eight GL-only errors and introduced two new errors, with most corrections near the weak-to-medium boundary. This pattern suggests that interference-color dispersion can help resolve some borderline cases in which surface luminance alone is insufficient.
Accordingly, GL should be regarded as the primary quantitative luster indicator, IGI as an auxiliary descriptor of interference-color structure, and PLI as an exploratory multivariable integration. None should yet be considered a replacement for expert grading.
This study has four main limitations. The sample set comprised only white Chinese freshwater nucleated pearls from one production area and a narrow 8–10 mm size range; generalization to other pearl types and body colors remains uncertain. The default IGI sampled only the upper half of the projected disk in three circumferential views, although lower-only and all-six-region checks supported this choice. IGI and PLI were developed and evaluated within the same 90-sample dataset, so LOO-CV cannot substitute for external validation. Finally, no same-sample microstructural measurements were obtained, and links to surface roughness, porosity, or nacre-layer order remain hypotheses. Future work should expand sample diversity, test interlaboratory repeatability, validate the two-stage strategy externally, and combine optical measurements with SEM or OCT characterization.
5. Conclusions
Both GL and IGI were significantly associated with expert visual luster in Chinese freshwater nucleated pearls, with GL showing the stronger relationship. Adding IGI improved LOO-CV ordinal accuracy from 73.3% to 78.9%, while an exploratory interaction model reached 80.0%; the additional interaction gain was small and not statistically significant. The results therefore support GL as the primary instrumental luster indicator and IGI as a complementary spatial-color descriptor for difficult cases. The proposed multivariable integration remains exploratory and requires independent validation in larger and more diverse pearl datasets.
Author Contributions
Conceptualization, M.L.; methodology, M.L.; investigation, M.L., J.B. and P.Y.; validation, J.B. and P.Y.; formal analysis, M.L.; resources, J.B. and P.Y.; data curation, M.L.; visualization, M.L.; writing—original draft preparation, M.L.; writing—review and editing, H.C. and Z.S.; supervision, H.C. and Z.S. All authors have read and agreed to the published version of the manuscript.
Funding
This research received no external funding.
Data Availability Statement
The data supporting the findings of this study are available from the corresponding author upon request.
Conflicts of Interest
Peiquan Yuan was employed by Zhuji Banjue Information Technology Co., Ltd. The remaining authors declare that the research was conducted in the absence of any commercial or financial relationships that could be construed as a potential conflict of interest.
References
- Ho, J.W.Y.; Shih, S.C. Pearl Classification: The GIA 7 Pearl Value Factors. Gems Gemol. 2021, 57, 135–137. [Google Scholar] [CrossRef] [Scilit]
- Ozaki, R.; Kikumoto, K.; Takagaki, M.; Kadowaki, K.; Odawara, K. Structural Colors of Pearls. Sci. Rep. 2021, 11, 15224. [Google Scholar] [CrossRef] [Scilit] [PubMed]
- Fan, N.; Zhou, C.; Myagkaya, E. Investigation of Nacre Nanostructure by Analyzing Its Structural Color Pattern. Sci. Rep. 2021, 11, 19686. [Google Scholar] [CrossRef] [Scilit] [PubMed]
- Salman, J.; Stifler, C.A.; Shahsafi, A.; Sun, C.-Y.; Weibel, S.; Frising, M.; Rubio-Perez, B.E.; Xiao, Y.; Draves, C.; Wambold, R.A.; et al. Hyperspectral Interference Tomography of Nacre. Proc. Natl. Acad. Sci. USA 2021, 118, e2023623118. [Google Scholar] [CrossRef] [Scilit] [PubMed]
- Zhou, D.; Lu, T.; Sun, R.; Zhang, J. Study on the Influence of Porosity of the Nacre Layer on the Luster and Surface Roughness of Chinese Large Freshwater Nucleated Pearl. Crystals 2022, 12, 234. [Google Scholar] [CrossRef] [Scilit]
- Karampelas, S.; Fritsch, E.; Mevellec, J.-Y.; Gauthier, J.-P.; Sklavounos, S.; Soldatos, T. Determination by Raman Scattering of the Nature of Pigments in Cultured Freshwater Pearls from the Mollusk Hyriopsis cumingi. J. Raman Spectrosc. 2007, 38, 217–230. [Google Scholar] [CrossRef] [Scilit]
- Muhammad, G.; Fujimura, T.; Sahidin, A.; Komaru, A. The Influence of Donor and Recipient Oyster Red and Blue Shell Nacre Interference Color on Pinctada fucata martensii Pearl Quality. Aquaculture 2021, 543, 736947. [Google Scholar] [CrossRef] [Scilit]
- Yang, B.; Xu, B.; Zhao, Y.; Zhang, C.; Zhao, S.; Zhao, Z. Integrated Chromogenic Analysis of Freshwater Pearls: Revealing the Internal Factors Driving Color Variation. Crystals 2025, 15, 797. [Google Scholar] [CrossRef] [Scilit]
- Salyacheewin, C.; Monarumit, N.; Wongkokua, W. Luster Measurement of Pearl by UV–Vis Reflectance Spectroscopy. J. Phys. Conf. Ser. 2021, 2145, 012063. [Google Scholar] [CrossRef] [Scilit]
- Kustrin, S.; Morton, D.W. The Use of UV-Visible Reflectance Spectroscopy as an Objective Tool to Evaluate Pearl Quality. Mar. Drugs 2012, 10, 1459–1475. [Google Scholar] [CrossRef] [Scilit] [PubMed]
- Ota, Y.; Higashi, H.; Nakauchi, S. Objective Assessment and Quantification of Pearl Quality by Spectral-Spatial Features. In Proceedings of the 2015 2nd International Conference on Advanced Informatics: Concepts, Theory and Applications (ICAICTA), Bandung, Indonesia, 16–17 September 2015; pp. 1–6. [Google Scholar] [CrossRef] [Scilit]
- Zhou, Y.; Zhou, L.; Yan, J.; Yan, X.; Chen, Z. Using Optical Coherence Tomography to Assess Luster of Pearls: Technique Suitability and Insights. Sci. Rep. 2024, 14, 11126. [Google Scholar] [CrossRef] [Scilit] [PubMed]
- Fleiss, J.L. Measuring Nominal Scale Agreement among Many Raters. Psychol. Bull. 1971, 76, 378–382. [Google Scholar] [CrossRef] [Scilit]
- Landis, J.R.; Koch, G.G. The Measurement of Observer Agreement for Categorical Data. Biometrics 1977, 33, 159–174. [Google Scholar] [CrossRef] [Scilit]
- McCullagh, P. Regression Models for Ordinal Data. J. R. Stat. Soc. Ser. B 1980, 42, 109–127. [Google Scholar] [CrossRef] [Scilit]
- GB/T 18781-2023; Cultured Pearl Grading. State Administration for Market Regulation: Beijing, China; Standardization Administration of China: Beijing, China; Standards Press of China: Beijing, China, 2023. (In Chinese)
- Akamatsu, S.; Zansheng, L.T.; Moses, T.M.; Scarratt, K. The Current Status of Chinese Freshwater Cultured Pearls. Gems Gemol. 2001, 37, 96–113. [Google Scholar] [CrossRef] [Scilit]
- Gutmannsbauer, W.; Hänni, H.A. Structural and Chemical Investigations on Shells and Pearls of Nacre Forming Salt- and Fresh-Water Bivalve Molluscs. J. Gemmol. 1994, 24, 241–252. [Google Scholar] [CrossRef] [Scilit]
- Snow, M.R.; Pring, A.; Self, P.; Losic, D.; Shapter, J. The Origin of the Color of Pearls in Iridescence from Nano-Composite Structures of the Nacre. Am. Mineral. 2004, 89, 1353–1358. [Google Scholar] [CrossRef] [Scilit]
- Komatsu, H.; Suzuki, C.; Ogura, S. Light Interference Phenomena Observed in Pearls with Pale and Dark Colour and the Measurement. J. Gemmol. Soc. Jpn. 2002, 23, 5–15. (In Japanese) [Google Scholar] [CrossRef] [PubMed]

Disclaimer/Publisher’s Note: The statements, opinions and data contained in all publications are solely those of the individual author(s) and contributor(s) and not of MDPI and/or the editor(s). MDPI and/or the editor(s) disclaim responsibility for any injury to people or property resulting from any ideas, methods, instructions or products referred to in the content. |
© 2026 by the authors. Licensee MDPI, Basel, Switzerland. This article is an open access article distributed under the terms and conditions of the Creative Commons Attribution (CC BY) license.