


Abstract
Tertiary batteries (TBs), or thermo-rechargeable batteries, have attracted attention as an energy harvesting technology that utilizes changes in ambient temperature. Prussian blue analogues (A-MPBAs; AxM[Fe(CN)6]y, where A and M are Li+ or Na+ ions and a transition metal, respectively) are typical active materials for TBs. In this study, we investigated the lithiation effect on the temperature (α) and capacity (β) coefficients of redox potential E, which governs the thermal electromotive force (VTB) and discharge capacity (QTB) of TBs. We fabricated lithiated and non-lithiated TBs composed of A-CoPBA and A-NiPBA and investigated their performance between 20 °C and 39 °C. We found that the observed VTB (=29–30 mV) of the lithiated TB is larger than that (=23–25 mV) of the non-lithiated TB and interpreted the behavior in terms of the smaller ionic radius of Li+.
1. Introduction
There has been a lot of interest in methods that utilize low-temperature waste heat of less than 100 °C in recent years [1,2,3]. Energy harvesting technology is attracting attention as an effective method of utilizing these resources to achieve a sustainable society [4,5,6,7,8,9,10,11]. Specifically, thermo-rechargeable batteries [12,13,14,15,16,17,18,19,20,21,22,23,24,25] have gathered significant attention because they can generate electricity simply from temporal changes in the ambient temperature (T). This thermal charging process is enabled by a difference in the temperature coefficient (α = dE/dT) of the redox potential (E) between their positive (α+) and negative (α−) electrode materials. Hereafter, we refer to thermo-rechargeable batteries constructed from positive and negative electrode active materials and an electrolyte solution as tertiary batteries (TBs). Unlike conventional thermoelectric devices that require a continuous spatial temperature gradient between electrodes, TBs operate as electrochemical heat engines driven by temporal temperature variations between a low temperature (TL) and a high temperature (TH). The operational principle of TBs can be summarized as follows. In a TB composed of positive (α+) and negative (α−) electrodes, a temperature increase by ΔT under open-circuit conditions induces a thermal electromotive force VTB [= (α+ − α−)ΔT] [17]. The electric energy is extracted by discharge process at TH from VTB to 0. Conversely, a temperature drop by −ΔT under open-circuit conditions induces −VTB. The electric energy is extracted by discharge process at TL from −VTB to 0. Therefore, a TB operates as an electrochemical heat engine driven by thermal cycling. The performance parameters of a TB are VTB and discharge capacity (QTB). QTB is governed by capacity coefficient (, where q represents the capacity normalized to unit weight of the active material and the subscript + (−) represents a physical quantity of the positive (negative) electrode) of E, because thermal electromotive force in TBs is rather small (on the order of tens of millivolts). QTB normalized by the total weight of the active material is expressed as , where m+ (m−) is the weight of active material in the positive (negative) electrode) [18].
Prussian blue analogues (A-MPBAs: AxM[Fe(CN)6]y, where A and M denote Li+ or Na+ ions and a transition metal, respectively) have a three-dimensional open-framework structure with large nanopores. A-MPBAs usually show face-centered cubic (Fmm; Z = 4) or trigonal (Rm; Z = 3) structures [26,27,28]. Reflecting the nanoporous and highly symmetric structures, A-MPBAs have been extensively studied as active materials for energy storage systems, including lithium and sodium-ion secondary batteries [29,30,31,32,33,34,35,36,37,38,39,40,41,42,43,44,45,46,47,48,49,50,51], as well as TBs [17,18,22,23,25]. A-MPBAs are advantageous as TB electrode materials due to their robust chemical stability in air and aqueous electrolytes. Furthermore, a TB cell can be composed entirely of A-MPBAs because they exhibit both positive and negative α. For example, Na-FePBA and Na-CoPBA exhibit positive α values while Na-MnPBA, Na-NiPBA, Na-CuPBA, and Na-CdPBA exhibit negative α values [52]. Thermodynamically, α is associated with the reaction entropy change (ΔS) during the redox reaction and is expressed as α = ΔS/nF, where n is the number of reactive electrons and F is the Faraday constant. Moritomo et al. [52] reported a positive correlation between nanopore volume and |α| in a series of Na-MPBAs and explained the empirical relationship in terms of the configurational entropy of the Na sites. Each crystallographic Na site increases from 1 to 4 to 6 as the nanopore volume increases. Consequently, configurational entropy increases with the nanopore volume and, hence, |α|.
Among TBs, the Na-CoPBA/Na-NiPBA TB is the most prototypical and most intensively investigated, such as electrolyte concentration [22] and current dependences [23] on VTB and QTB. Shibata et al. [17] fabricated NaxCo[Fe(CN)6]0.90·2.9H2O/NaxCo[Fe(CN)6]0.71·3.8H2O TB and evaluated its performance between 22 °C and 50 °C. The TB exhibited α+ − α− ≈ 1.0 mV/K and generated VTB = 26 mV at ΔT = 28 K. On the other hand, Na-CdPBA, which possesses six crystallographic Na sites, exhibits both a small β and a large |α| [52]. Sakamoto et al. [25] fabricated NaxCo0.44Mn0.56[Fe(CN)6]0.81·3.4H2O/NaxCd[Fe(CN)6]0.90·1.9H2O TB and evaluated its performance between 20 °C and 50 °C. The TB exhibited enhanced QTB (=4.6 mAh/g). Here, we investigated the effect of guest ion substitution in a Na-CoPBA/Na-NiPBA TB with the aim of enhancing VTB. We note that the ionic radius (rLi = 0.76 Å) of Li+ is much smaller than that (rNa = 1.02 Å) of Na+. The smaller the ionic radius becomes, the larger the spaces around the ion become. The spatial extent around the ions may enhance the configurational entropy of the ions. In this sense, the guest ion effect on α provides useful insights for developing TBs with high VTB.
In this study, we investigated the guest ion effect on α in A-CoPBA and A-NiPBA. We found that |α| for Li-CoPBA (Li-NiPBA) is larger than |α| for Na-CoPBA (Na-NiPBA). We further fabricated Li-CoPBA/Li-NiPBA TB (LTB1 and LTB2) and Na-CoPBA/Na-NiPBA TB (STB), and investigated their performance between 20 °C and 39 °C. We found that the VTB (=29–30 mV) for LTB2 is higher than that (=23–25 mV) for STB. Thus, the Li+ substitution is a promising strategy for enhancing VTB.
2. Materials and Methods
2.1. Materials
All essential reagents, including NaCl, CoCl2·6H2O, NiCl2·6H2O, Na4[Fe(CN)6]·10H2O, NaNO3, LiNO3, acetylene black (AB), and N, N-dimethylformamide (DMF), were purchased from FUJIFILM Wako Pure Chemical Co. (Osaka, Japan). Polyvinylidene fluoride (PVDF) was purchased from ARKEMA K.K. (Tokyo, Japan). A stainless-steel (SUS304) foil (thickness is 20 μm) was purchased from Nilaco Co. (Tokyo, Japan). An indium tin oxide (ITO) glass electrode was purchased from MONOTECH Co., Ltd. (Saitama, Japan).
2.2. Sample Synthesis and Characterization
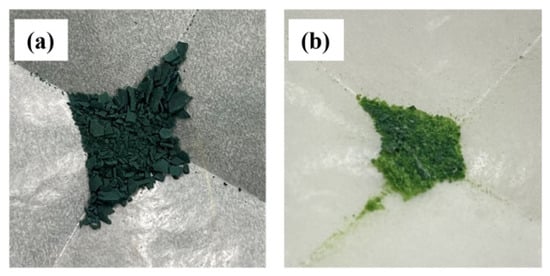
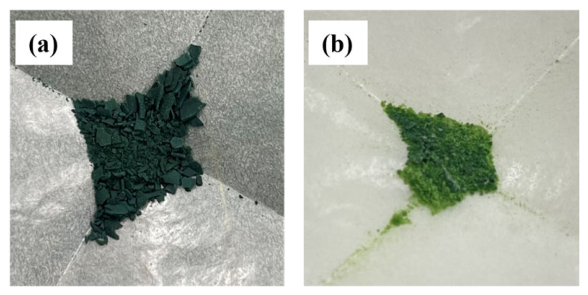
Na-CoPBA and Na-NiPBA were synthesized by the coprecipitation method. Solutions A and B were initially prepared as shown in Table 1. Solution A was slowly dripped into solution B at a regulated flow rate of approximately 100 mL/h using a tube pump (MP-2000; TOKYO RIKAKIKAI Co. Ltd., Tokyo, Japan). This procedure was performed at 40 °C. After the dripping, the mixed solution was kept at 40 °C for 12 h under continuous agitation. The deposited materials were collected using a 0.2 μm polytetrafluoroethylene (PTFE) membrane filter. The collected materials were washed three times with distilled water and dried for 24 h under atmospheric conditions. Figure 1 shows images of as-prepared (a) Na-CoPBA and (b) Na-NiPBA. The color of Na-CoPBA and Na-NiPBA is dark green and light green, respectively. The chemical compositions of Na-CoPBA and Na-NiPBA were evaluated with an electron probe microanalyzer (EPMA, JXA-8230; JEOL Ltd., Tokyo, Japan) and CHN organic elemental analyzer (Yanaco CHN corder MT-5; Anatec Yanaco Co., Kyoto, Japan). We first assume the chemical composition as NaxM[Fe(CN)6]y·zH2O (M = Co and Ni). The molar ratio (y) of the transition metals was evaluated by the EPMA analysis (Table S1). The content (z) of the crystal water was determined by the molar ratio of H and CN, taking the molar amount of CN as the average of the C and N contents (Table S2). The Na concentration (x) was calculated based on the charge neutrality assuming Fe2+, Co2+, Ni2+ and Na+. The chemical compositions for Na-CoPBA and Na-NiPBA are determined as Na1.48Co[Fe(CN)6]0.87·3.2H2O and Na1.32Ni[Fe(CN)6]0.83·3.9H2O, respectively.
Table 1.
Solutes in aqueous solutions A and B, together with the chemical compositions determined by EPMA and CHN analyses.
Figure 1.
Images of as-prepared (a) Na-CoPBA and (b) Na-NiPBA powders.
The lithiation of Na-CoPBA and Na-NiPBA were performed by electrochemical deintercalation of Na+ and subsequent intercalation of Li+ in 6 mol/L LiNO3 aqueous solution (vide infra). Quantitative EPMA and CHN analyses of the lithiated compounds (Li-CoPBA and Li-NiPBA) were difficult because the compound is mixed with AB and PVDF in the electrode. We assume that y and z are unchanged in the ion-exchange process. The Li content for Li-CoPBA (Li-NiPBA) was evaluated assuming the deintercalation and intercalation process as Na1.48Co[Fe(CN)6]0.87·3.2H2O ➔ Co[Fe(CN)6]0.87·3.2H2O ➔ Li1.48Co[Fe(CN)6]0.87·3.2H2O (Na1.32Ni[Fe(CN)6]0.83·3.9H2O ➔ Na0.49Ni[Fe(CN)6]0.83·3.9H2O ➔ Li0.83Na0.49Ni[Fe(CN)6]0.83·3.9H2O). The chemical compositions for Li-CoPBA and Li-NiPBA are Li1.48Co[Fe(CN)6]0.87·3.2H2O and Li0.83Na0.49Ni[Fe(CN)6]0.83·3.9H2O, respectively.
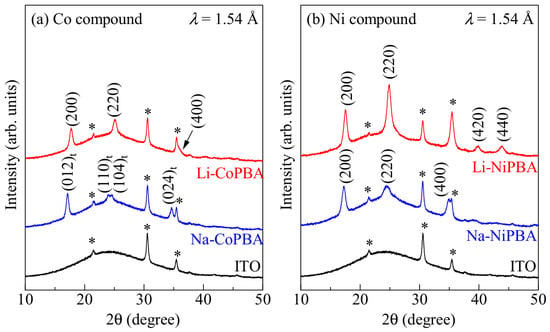
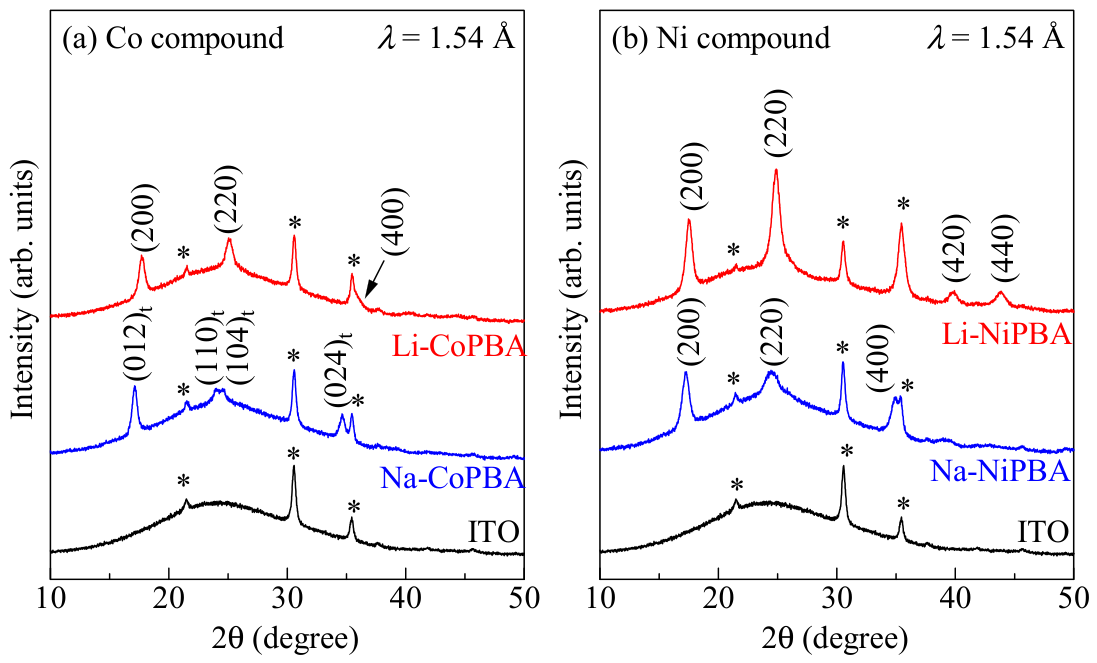
Figure 2a exhibits the X-ray diffraction (XRD) profiles of Na-CoPBA and Li-CoPBA electrodes (vide infra) applied to ITO glasses. The profiles were obtained at room temperature (approximately 24 °C) using a MiniFlex600 diffractometer (Rigaku; Tokyo, Japan). The X-ray source was CuKα (λ = 1.54 Å). The asterisks (*) in the figure indicate the reflections originating from ITO. For Na-CoPBA, all detected diffraction peaks are assigned to a trigonal (Rm; Z = 3) structure. The lattice parameters, evaluated via the Rietveld method (Rietan-FP program [53]), were a = 7.408 (1) Å and c = 17.491 (3) Å. On the other hand, Li-CoPBA exhibited diffraction peaks due to the face-centered cubic (fcc) (Fmm; Z = 4) structure. The lattice constant a was 10.020 (1) Å. Figure 2b shows the XRD patterns of Na-NiPBA and Li-NiPBA electrodes applied to ITO glasses. Both Na-NiPBA and Li-NiPBA exhibited diffraction peaks due to their fcc structure. The lattice constant a was evaluated to be 10.124 (1) Å for Li-NiPBA and 10.271 (1) Å for Na-NiPBA. In Na-CoPBA, the cell volume v per unit chemical formula decreases from 277.1 Å3 to 251.5 Å3 by lithiation. Similarly, in Na-NiPBA, v decreases from 270.9 Å3 to 259.4 Å3 by lithiation. The contraction of v can be attributed to the smaller ionic radius of Li+ (rLi = 0.76Å) as compared with that of Na+ (rNa = 1.02 Å) [54].
Figure 2.
(a) XRD patterns of Li-CoPBA, Na-CoPBA, and ITO glass electrodes. (b) XRD patterns of Li-NiPBA, Na-NiPBA, and ITO glass electrodes. The parentheses for Li-CoPBA, Li-NiPBA and Na-NiPBA represent the Miller indexes for the face-centered cubic (fcc) structure. The parentheses for Na-CoPBA represent the indexes for trigonal structures. Asterisks represent the reflections due to ITO.
2.3. Fabrication and Characterization of Electrodes
The preparation of paste-type electrodes for Na-CoPBA and Na-NiPBA was conducted according to the following procedure. Na-CoPBA and Na-NiPBA powders, AB, and PVDF were added to DMF in a ratio of 7:2:1, and the mixture was thoroughly agitated to form a slurry. SUS304 foil was used for the current collector. The collecting electrode was SUS304 foil (20 μm), whose surface was subjected to O3 treatment and cleaned. The slurry was applied to the foil and subjected to vacuum drying at 60 °C for approximately 24 h. The electrodes featured a 1.0 cm2 active area. The weights of the active material were measured using micro-analytical balances (BM-5; A&D Company Ltd., Tokyo, Japan).
Lithiated electrodes, i.e., Li-CoPBA (Li-NiPBA) electrodes, were obtained by electrochemical deintercalation of Na+ and subsequent intercalation of Li+ in 6 mol/L LiNO3 aqueous solution. The active material weight for the Li-CoPBA (Li-NiPBA) electrode was evaluated by applying a correction for the change in molecular weight to the active material weight for the corresponding Na-CoPBA (Na-NiPBA) electrodes, because the ion-exchange process alters the chemical composition as Na1.48Co[Fe(CN)6]0.87·3.2H2O ➔ Li1.48Co[Fe(CN)6]0.87·3.2H2O (Na1.32Ni[Fe(CN)6]0.83·3.9H2O ➔ Li0.83Na0.49Ni[Fe(CN)6]0.83·3.9H2O).
The electrochemical properties of Na-CoPBA and Na-NiPBA electrodes were investigated in a three-electrode beaker cell using a potentiostat (HJ1001SD8; MEIDEN HOKUTO, Tokyo, Japan). The working, referential, and counter electrodes were the Na-CoPBA (Na-NiPBA), Ag/AgCl standard, and Pt electrodes, respectively. The electrolyte was 5 mol/L NaNO3 aqueous solution. The charge and discharge rates were set to approximately 0.3 C. The potential range of the Na-CoPBA (Na-NiPBA) electrode was set between 0.20 (0.20) V and 1.1 (0.80) V against Ag/AgCl standard electrode. The electrochemical properties of Li-CoPBA and Li-NiPBA electrodes were investigated under the same measurement conditions except for the electrolyte. The electrolyte was 6 mol/L LiNO3 aqueous solution. The charge and discharge were performed at a rate of approximately 0.3 C. The potential range of the Li-CoPBA (Li-NiPBA) electrode was set between 0.20 (0.20) V and 1.1 (0.80) V against the Ag/AgCl standard electrode.
The α value was evaluated in two beaker cells linked by a salt bridge. The same electrodes were inserted in the two beaker cells. The electrolyte for the Na (Li) system was 5 mol/L (6 mol/L) NaNO3 (LiNO3) aqueous solution. A thermobath (BB301; Yamato Scientific Co., Ltd.) was used to control the temperature of one electrode, while the temperature of the other electrode was kept at 25 °C. The potential difference (ΔE) was carefully measured against the temperature difference (ΔT) between the two electrodes. To stabilize ΔE, measurement was performed after a 15-min waiting time for each ΔT.
2.4. Fabrication and Characterization of Tertiary Battery
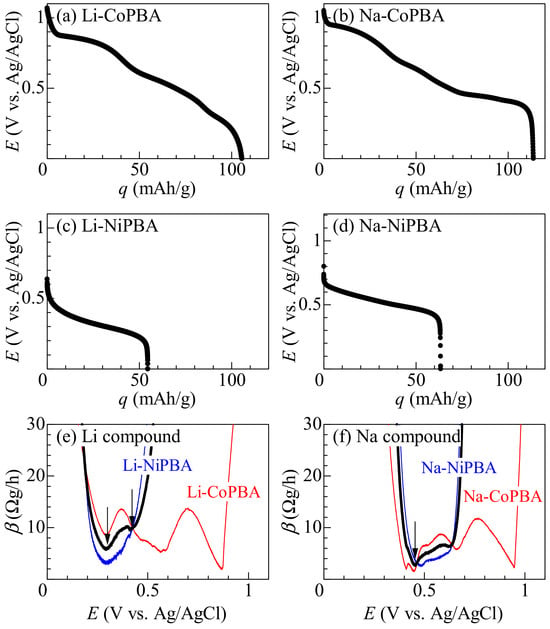
A TB consists of positive and negative electrodes in the electrolyte. Unlike conventional secondary ion batteries, the positive and negative electrode potentials are identical at the initial potential E0. We note that the QTB value is inversely proportional to . In the present investigation, we aimed to fabricate TBs with m+ = m−. We first optimize E0 under this condition so that QTB (=) is maximized. In other words, E0 was selected to minimize the simple average of β+ and β−. Figure 3e shows the β (=−dE/dq) of Li-CoPBA and Li-NiPBA against E. The thick black curve represents the simple average of β+ and β−, which shows a local minimum at 0.30 V and 0.42 V. Therefore, we fabricated two Li-CoPBA/Li-NiPBA TBs, whose E0 is 0.30 V (LTB1) and 0.42 V (LTB2). First, Na-CoPBA and Na-NiPBA electrodes were pre-oxidized to E0 using the three-pole cell. The TB was a two-electrode beaker cell, whose positive and negative electrodes were the pre-oxidized Li-CoPBA and Li-NiPBA electrodes, respectively. The electrolyte was 6 mol/L LiNO3 aqueous solution. Figure 3f shows the β of Na-CoPBA and Na-NiPBA against E. The thick black curve represents the simple average of the β values, which shows a local minimum at 0.46 V. We fabricated a Na-CoPBA/Na-NiPBA TB, whose E0 is 0.46 V (STB). The TB was a two-electrode beaker cell, whose positive and negative electrodes were the pre-oxidized Na-CoPBA and Na-NiPBA electrodes, respectively. The electrolyte was 5 mol/L NaNO3 aqueous solution. In Table 2, electrode parameters (α, β, m, and E0) are listed for LTB1, LTB2, and STB.
Figure 3.
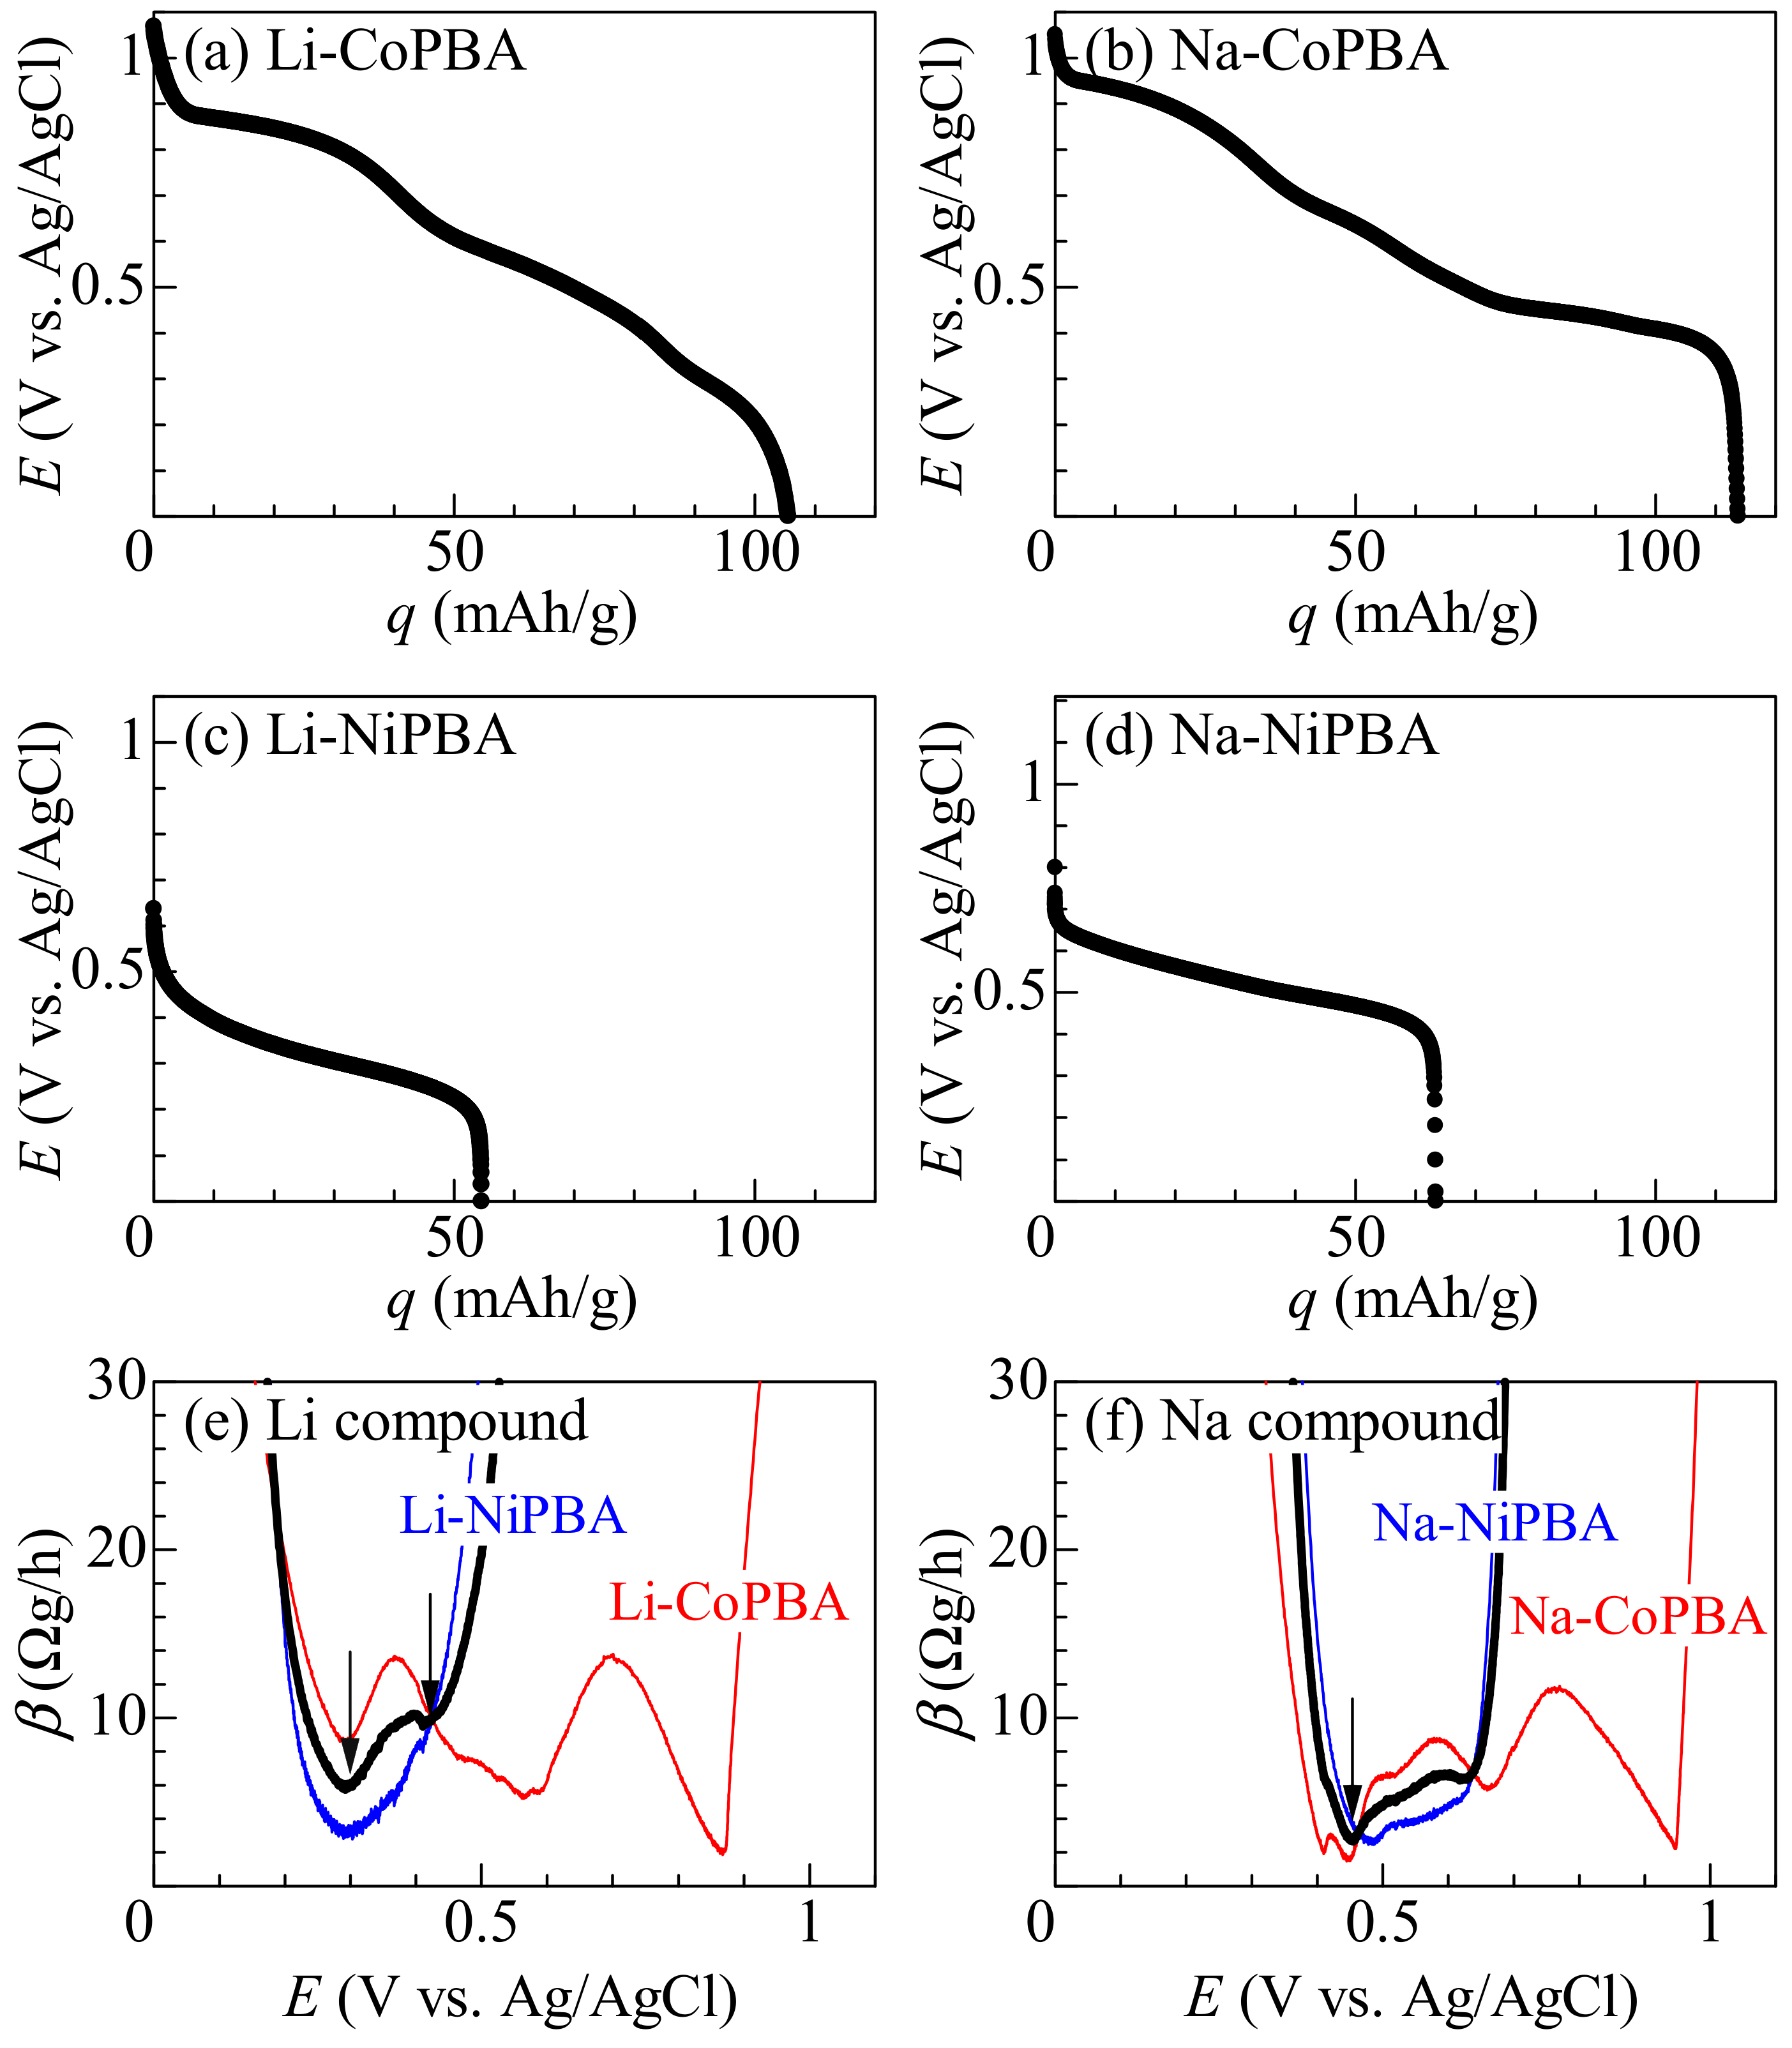
Discharge curves of (a) Li-CoPBA, (b) Na-CoPBA, (c) Li-NiPBA, and (d) Na-NiPBA at 0.3 C and 20 °C against the discharge capacity (q) normalized to unit weight of the active material. (e,f) show β (=−dE/dq) as a function of E for the Li and Na compounds, respectively. Thick black curves in (e,f) represent the simple average of the β values. Arrows in (e,f) indicate the initial potential E0 for LTB1, LTB2, and STB.
Table 2.
Electrode parameters for LTB1, LTB2, and STB. α (=dE/dT), β (=−dE/dq), m, and E0 represent the temperature coefficient of the redox potential E, capacity coefficient of E, weight of the active material, and initial potential (vs. Ag/AgCl standard electrode), respectively. Evaluation of α was performed twice with different electrodes and the mean and standard deviation were calculated.
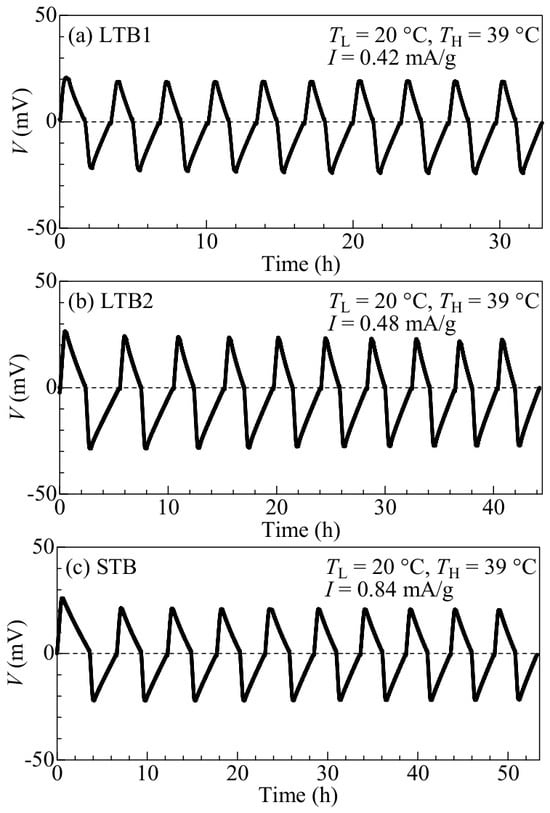
The device performances of LTB1, LTB2, and STB were evaluated via thermal cycle between TL (=20 °C) and TH (=39 °C). The cell temperature T was controlled using a thermobath (BB301; Yamato Scientific Co., Ltd., Tokyo, Japan) and was measured using a K-type thermocouple situated within the electrolyte solution. The thermal cycle consists of four phases: (i) heating process, (ii) discharge process at TH, (iii) cooling process, and (iv) discharge process at TL. In the (i) heating process, T was slowly increased from TL to TH and kept at TH for 15 min under an open-circuit condition. In the (ii) discharge process, a constant current I was supplied until the output voltage V decreased to 0 V at TH. I was set to 0.42 mA/g (0.004 C) for LTB1, 0.48 mA/g (0.005 C) for LTB2, and 0.84 mA/g (0.01 C) for STB. C-rates were defined based on the capacity of the positive electrode. In such low C-rate regions, QTB is free from IR drop and is almost independent of I [23]. In the (iii) cooling process, T was slowly decreased from TH to TL and kept at TL for 15 min under an open-circuit condition. In the (iv) discharge process, I was supplied until V increased to 0 V at TL.
3. Results and Discussion
3.1. Optimization of Initial Potential E0
Figure 3a,b show the discharge curves of Li-CoPBA and Na-CoPBA at 0.3 C and 20 °C, respectively. In Figure 3b Na-CoPBA, the discharge curve is consistent with that reported in the previous study [52]. The two plateaus located at 0.4–0.7 V and ~0.95 V correspond to the redox reactions of Co3+/Co2+ and [Fe(CN)6]3−/[Fe(CN)6]4−, respectively [38]. The observed specific capacity of 113 mAh/g is close to the theoretical value of 118 mAh/g. In (a) Li-CoPBA, the discharge curve is consistent with the previous study [55]. The redox sites corresponding to the lower (0.2–0.5 V) and upper (~0.9 V) plateaus are Co3+/Co2+ and [Fe(CN)6]3−/[Fe(CN)6]4−, respectively [55]. The measured specific capacity of 105 mAh/g is slightly lower than theoretical value of 127 mAh/g. Figure 3c,d show the discharge curve of Li-NiPBA and Na-NiPBA, respectively. The discharge curves of both Li-NiPBA and Na-NiPBA exhibit a single plateau feature, which is due to the redox reactions of [Fe(CN)6]3−/[Fe(CN)6]4−. In Na-NiPBA, the observed specific capacity of 63 mAh/g is close to the theoretical value of 66 mAh/g. In Li-NiPBA, the observed specific capacity of 54 mAh/g is slightly lower than theoretical value of 69 mAh/g. The slight discrepancy in the observed and calculated capacities for Li-CoPBA and Li-NiPBA may be ascribed to the errors in m+ and m−, which were evaluated by correcting for the change in molecular wight resulting from lithiation.
Figure 3e shows the β (=−dE/dq) of Li-CoPBA and Li-NiPBA against E. The thick black curve represents the simple average of the β values, which shows a local minimum at 0.30 V and 0.42 V. We note that QTB is inversely proportional to . In the present investigation, we aimed to fabricate TBs with m+ = m−. We first optimize E0 under this condition so that QTB (=) is maximized. In other words, E0 was set at the local minimum of the simple average of β+ and β−. We fabricated two Li-CoPBA/Li-NiPBA TBs at E0 = 0.30 V (LTB1) and 0.42 V (LTB2), as indicated by downward arrows in Figure 3c. Figure 3f shows the β (=−dE/dq) of Na-CoPBA and Na-NiPBA against E. The thick black curve represents the simple average of the β values, which shows a local minimum at 0.46 V. We fabricated a Na-CoPBA/Na-NiPBA TB at E0 = 0.46 V (STB), as indicated by a downward arrow in Figure 3f.
3.2. Evaluation of α at E0
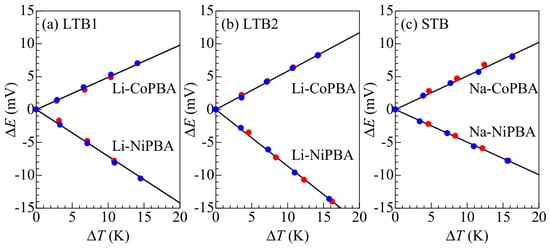
We now proceed to α for three TBs, i.e., LTB1 (E0 = 0.30 V), LTB2 (E0 = 0.42V), and STB (E0 = 0.46 V). Figure 4 shows potential difference ΔE against temperature difference ΔT between the two identical electrodes used in (a) LTB1, (b) LTB2, and (c) STB. The red (blue) filled circles indicate the data obtained in the ΔT-increasing (-decreasing) runs. No thermal hysteresis was observed between the ΔT-increasing and ΔT-decreasing runs. The α values were determined by least-squares fitting of each dataset; +0.490 ± 0.008 mV/K and −0.710 ± 0.012 mV/K for LTB1, +0.584 ± 0.005 mV/K and −0.861 ± 0.007 mV/K for LTB2, and +0.510 ± 0.009 mV/K and −0.495 ± 0.004 mV/K for STB. To verify reproducibility for α, we performed the measurement twice using different electrodes. The mean and standard deviation were evaluated and listed in Table 2. For both LTB1 (E0 = 0.30 V) and LTB2 (E0 = 0.42 V), |α| is larger than that of STB (E0 = 0.46 V). In this sense, it can be said that |α| for the Li compound is larger than that for the corresponding Na compound. Δα (Δα = α+ − α−) is 1.20 mV/K for LTB1, 1.44 mV/K for LTB2, and 1.00 mV/K for STB. The slight difference in the electrolyte concentration, 6 mol/L for LTB1 and LTB2 and 5 mol/L for STB, has a negligible effect on α. Furuuchi et al. [22] fabricated and evaluated the Na1.48Co[Fe(CN)6]0.873.4H2O/Na1.76Ni[Fe(CN)6]0.945.2H2O TB against the electrolyte (NaClO4) concentration. They reported that VTB is almost unchanged against the electrolyte concentration in the high-concentration region (>3.3 mol/L).
Figure 4.
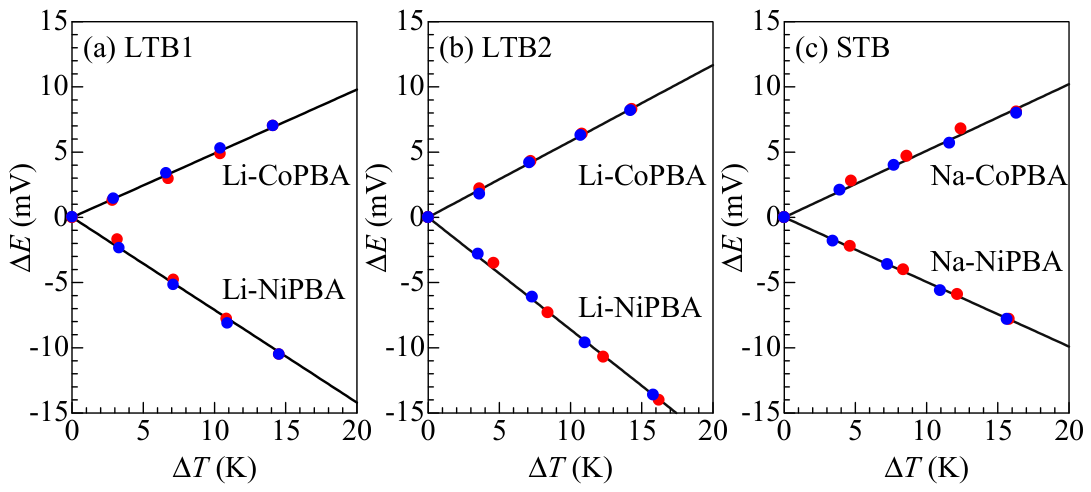
Potential difference ΔE against temperature difference ΔT between the two identical electrodes used in (a) LTB1 (E0 = 0.30 V), (b) LTB2 (E0 = 0.42V), and (c) STB (E0 = 0.46 V). Red (blue) circles were obtained in ΔT-increasing (decreasing) run. The solid straight lines represent the results of the least-squares fitting.
Here, we consider the reason why |α| for the Li compound is larger than that for the corresponding Na compound. To understand the underlying factors, it is necessary to consider parameters such as the guest ion radius, nanopore size, trigonal distortion, iron deficiency (1 − y), and crystal water content (z). Unfortunately, we cannot quantitatively assess the effects of y and z, as we were unable to determine the chemical composition for the lithiated compounds. However, given the robust three-dimensional network of the PBA, the degree of iron deficiency is unlikely to change significantly after the ion-exchange process. On the other hand, while Na-CoPBA exhibits trigonal distortion, the magnitude of this distortion (c/a = 2.361, vs. 2.449 for the cubic structure) is small. Then, it is considered to have a negligible impact on α.
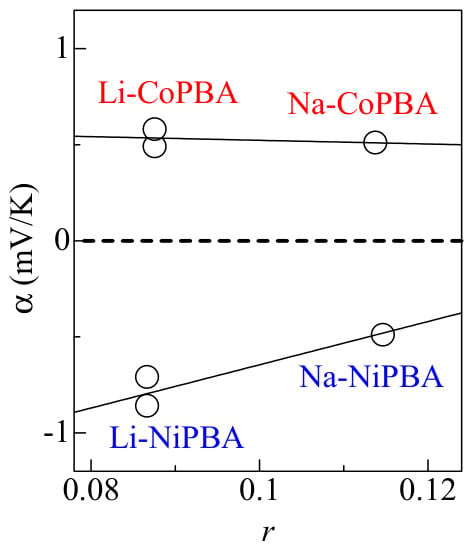
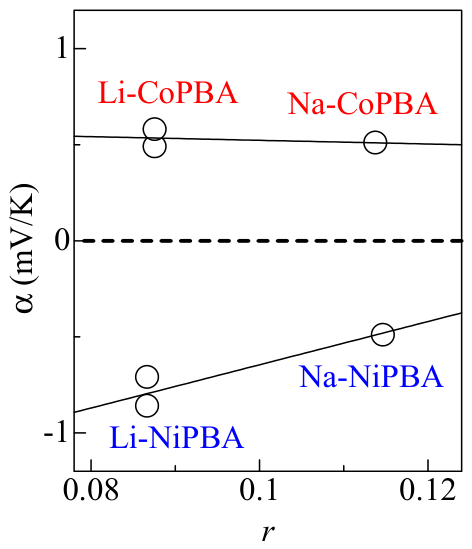
Here, we examine the effects of the guest ion radius and nanopore size on α, as one possible origin of the enhanced |α|. Moritomo et al. [52] reported a positive correlation between nanopore volume and |α| in a series of Na-MPBAs and explained the empirical relationship in terms of the configurational entropy of the Na sites. Each crystallographic Na site increases from 1 to 4 to 6 as the nanopore volume increases. Consequently, configurational entropy increases with the nanopore volume and, hence, |α|. Here, by extending this configuration entropy scenario, we attempt to interpret the enhanced |α| for the lithiated compound in terms of the guest ion radius (rLi and rNa) and nanopore size. We note that rLi (=0.76 Å) is much smaller than rNa (=1.02 Å). To include the effect of the nanopore size, we consider the ratio r between the ionic radius and the nanopore’s diagonal length d. We note that r is a crude measure for the spaces around the ion; the smaller r becomes, the larger the spaces around the ion become. For Na-CoPBA, which exhibits slight trigonal distortion, the average of the four diagonal lengths is used. Although we cannot determine the crystallographic Li sites, the spatial extent around the ions is expected to enhance the configurational entropy of Li+. In Figure 5, α is plotted against r. Reflecting the smaller rLi, r for the Li compound is much smaller than that for the corresponding Na compound. We observed a negative trend between r and |α| for both A-CoPBA and A-NiPBA. This implies that the small rLi, and hence resultant larger spaces around Li+, is a possible origin for the enhancement of |α| in Li compound.
Figure 5.
α against the ratio (r) of the ionic radius to the nanopore’s diagonal length for Li-CoPBA, Na-CoPBA, Li-NiPBA, and Na-NiPBA. For Na-CoPBA, which exhibits trigonal distortion, the average of the four diagonal lengths is used. The solid straight lines are drawn with the eye.
3.3. Thermal Cycle Properties of TBs
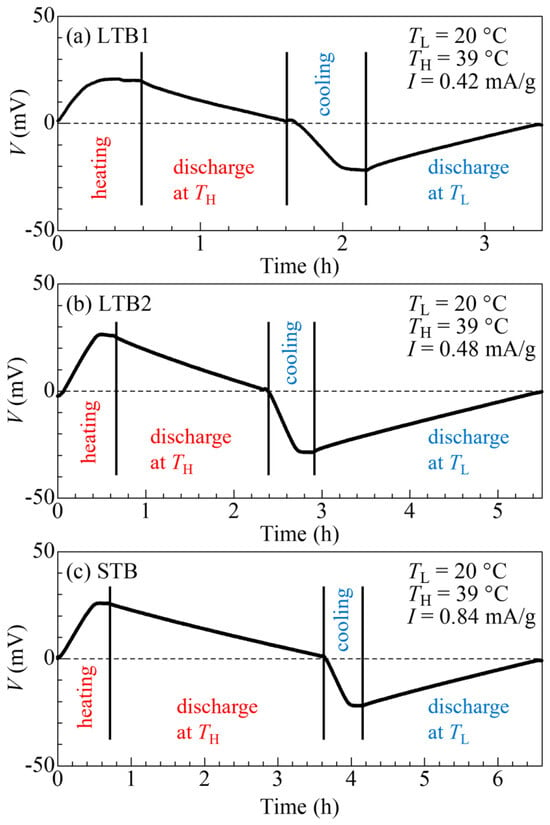
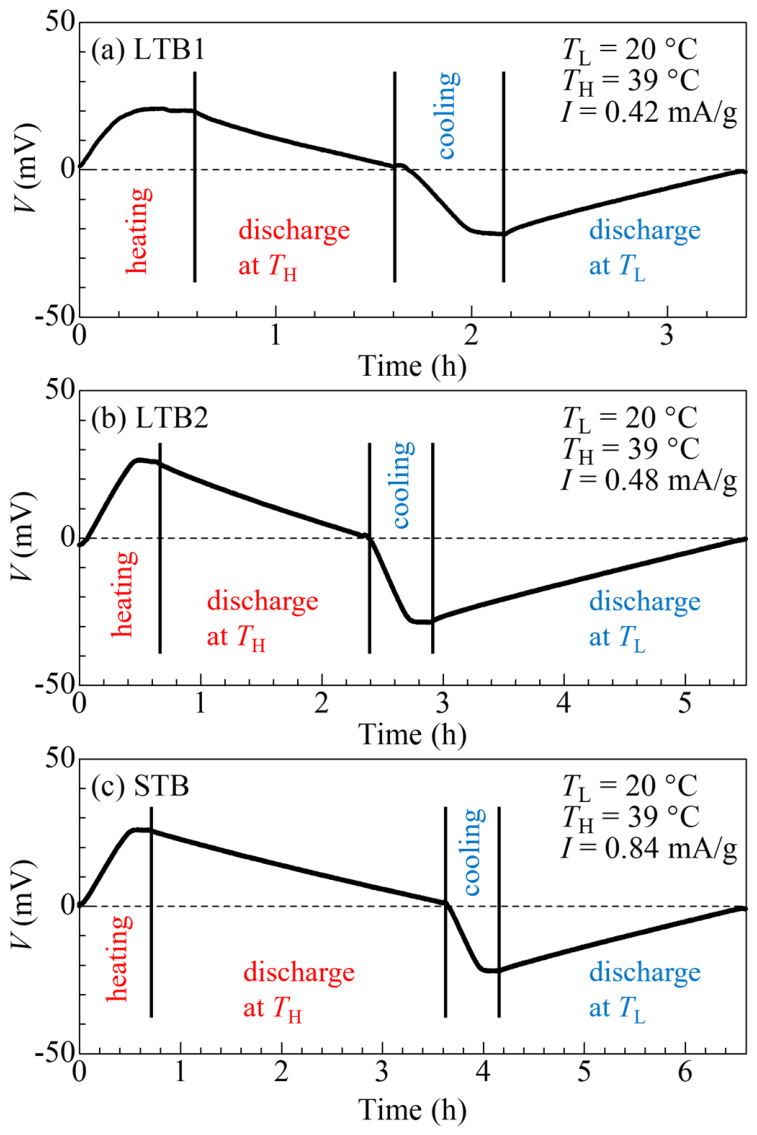
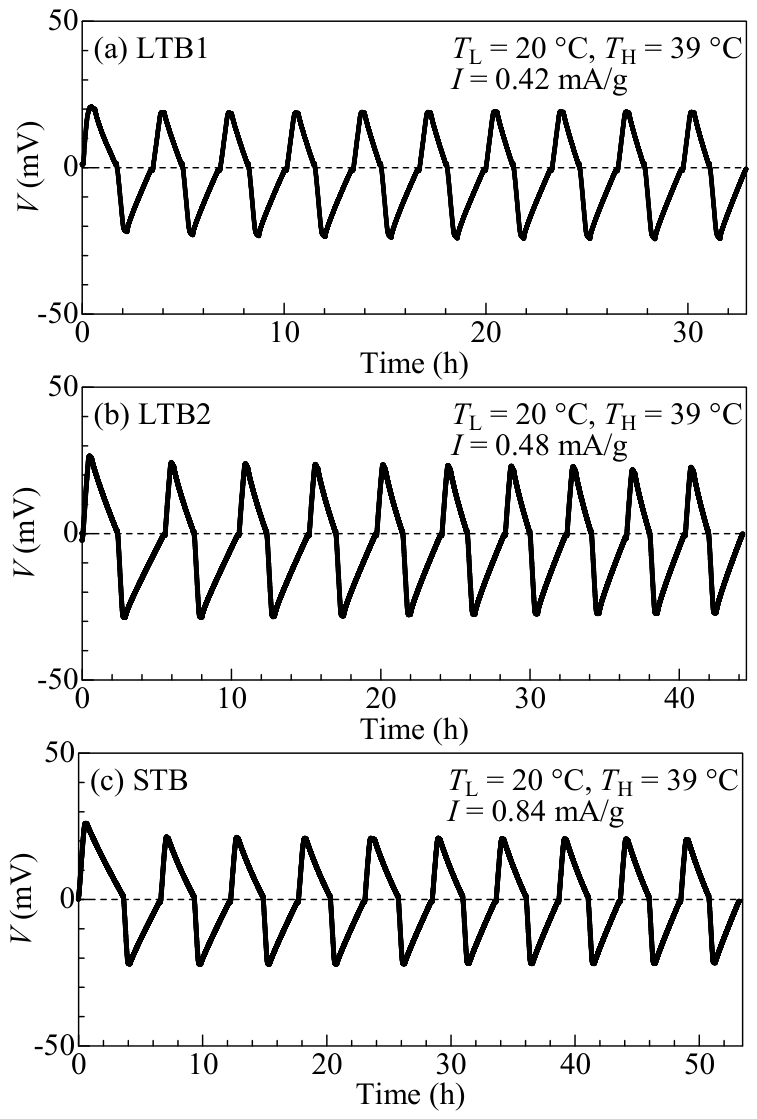
Figure 6 shows the cell voltage V during the first thermal cycle for (a) LTB1 (E0 = 0.3 V), (b) LTB2 (E0 = 0.42 V), and (c) STB (E0 = 0.46 V) operating between TL = 20 °C and TH = 39 °C. For (a) LTB1, in the heating process, V gradually increases from 0 mV to 19.7 mV. In the discharge process at TH, V linearly drops from 19.7 mV to 0 mV. The discharge capacity QTB is evaluated and found to be 0.64 mAh/g. In the cooling process, V decreases from 0 mV to –22.0 mV. In the discharging process at TL, V linearly increases from −22.0 mV to 0 mV. The discharge capacity QTB is evaluated and found to be 0.69 mAh/g. Similar behavior is observed for (b) LTB2 [(c) STB]. V increases from −2.2 mV to 26.3 mV (a net shift V of 28.5 mV) for LTB2 [0 mV to 25.0 mV for STB] in the heating process, while it decreases from 0 mV to −29.6 mV [0 mV to −23.3 mV] in the cooling process. Figure 7 displays the thermal cycles of (a) LTB1, (b) LTB2, and (c) STB over 10 cycles between TL = 20 °C and TH = 39 °C. For all TBs, the thermal cycle is stable up to 10 cycles.
Figure 6.
First thermal cycle of (a) LTB1, (b) LTB2, and (c) STB between TL = 20 °C and TH = 39 °C. Vertical lines represent boundaries between heating process, discharge process at TH, cooling process, and discharge process at TL.
Figure 7.
Thermal cycles of the (a) LTB1, (b) LTB2, and (c) STB over 10 cycles between TL = 20 °C and TH = 39 °C.
3.4. VTB, QTB, and WTB of TBs
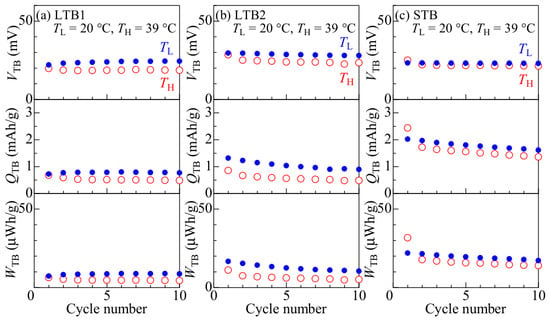
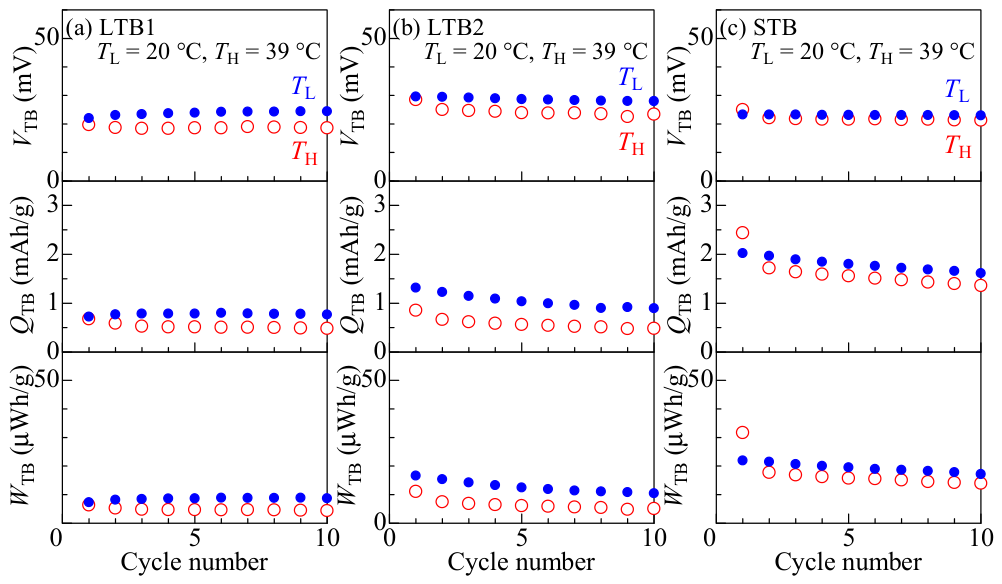
Figure 8a shows the cycle dependence of VTB, QTB and electrical energy output WTB per total weight of the active materials for LTB1. The VTB values were evaluated in the heating (TH) and cooling (TL) processes at each cycle, while the QTB values were evaluated in the discharge processes at TH and TL at each cycle. The open and filled circles represent the data obtained at TH and TL, respectively. Both VTB and QTB remain almost unchanged up to 10 cycles. Figure 8b,c show VTB, QTB, and WTB for LTB2 and STB, respectively. VTB, QTB, and WTB remain almost unchanged up to 10 cycles except for QTB for (c) STB, in which a slight reduction is discernible between the first and second cycles.
Figure 8.
Thermal electromotive force VTB, discharge capacity QTB per total weight of the active materials, and electrical energy output WTB per total weight of the active materials between TL = 20 °C and TH = 39 °C for (a) LTB1, (b) LTB2, and (c) STB. Open and filled circles represent the data obtained at TH and TL, respectively.
Table 3 summarizes the observed VTB, QTB, and WTB at the first cycle together with the calculated values (Vcal and Qcal). Vcal and Qcal were calculated by the equations VTB = (α+ − α−)ΔT [17] and [18], with the parameters shown in Table 2. Assuming a 5% error for m, ΔT, α, and β, error propagation analysis indicates that the errors in VTB and QTB will be 10% and 25%, respectively. VTB and QTB agree with the calculated values within the error except for VTB at TH/TL for STB, VTB at TH for LTB1, QTB at TH for STB, and QTB at TL for LTB2, The unexpected discrepancies may originate in, for example, a slight shift of E0 or variation of the discharge capacity of constituent electrodes. For all TBs, VTB at TH is slightly smaller than VTB at TL, and QTB at TH is slightly smaller than QTB at TL. These observations imply the occurrence of voltage relaxation at higher temperatures, which may contribute to the discrepancy between observed and calculated values. In VTB, QTB, and WTB, LTB2 demonstrated higher performance than LTB1. A comparison of LTB2 and STB reveals the following. First, the VTB (=29–30 mV) of LTB2 is larger than that (=23–25 mV) of STB. This is because the Δα (=1.43 mV/K) for LTB2 is larger than that (=1.01 mV/K) for STB. Second, the QTB (=0.9–1.3 mAh/g) of LTB2 is smaller than that (=2.0–2.4 mAh/g) of STB. This is because the simple average of β+ and β− for LTB2 is higher than that for STB. The flattening of the discharge curves, and resultant suppression of β+ and β−, is indispensable for enhancing QTB for lithiated TB. Third, the WTB (=11–17 μWh/g) of LTB2 is smaller than that (=22–32 μWh/g) of STB owing to the smaller QTB.
Table 3.
VTB, QTB, and WTB in the first cycle for LTB1, LTB2, and STB between TL = 20 °C and TH = 39 °C TL. Calculated Vcal and Qcal are also listed (see text).
4. Conclusions
We compared the performance of the lithiated TB composed of Li-CoPBA and Li-NiPBA and the corresponding non-lithiated TB composed of Na-CoPBA and Na-NiPBA. We demonstrated that the VTB (=29–30 mV) of LTB2 is larger than that (=23–25 mV) of STB between 20 °C and 39 °C. We demonstrated that using smaller ions in TB is an effective approach to enhance VTB. The lithiation, however, exhibits a trade-off behavior; it increases VTB but suppresses QTB.
Supplementary Materials
The following supporting information can be downloaded at: https://www.mdpi.com/article/10.3390/cryst16100640/s1, Table S1. Component ratio of Fe, Co, and Ni for Na-CoPBA and Na-NiPBA determined by electron probe microanalysis; Table S2: Component ratio of C, H, and N for Na-CoPBA and Na-NiPBA determined by CHN analysis.
Author Contributions
Conceptualization, investigation, methodology, funding acquisition, and writing, T.S.; investigation, T.I.; data curation, I.N.; supervision, H.O.; writing, funding acquisition, and supervision, Y.M. All authors have read and agreed to the published version of the manuscript.
Funding
This research was supported by JSPS KAKENHI (Grant No. JP21H01822, 25K01674), the fund program for creating research-based startups from academia (Grant No. JPMJSF23CF), and the Iwatani Naoji Foundation (Iwatani Science and Technology Research Grant).
Data Availability Statement
The data presented in this study are available upon request via the corresponding authors.
Acknowledgments
The chemical composition analysis with an electron probe microanalyzer was carried out at the Office of Management and Strategy for Marine Studies of Tokyo University of Marine Science and Technology, and M. Sudama supported the observations. The CHN organic element analysis was carried out at Rabbit Science Japan Co., Ltd.
Conflicts of Interest
The authors declare no conflicts of interest.
References
- Forman, C.; Muritala, I.K.; Pardemann, R.; Meyer, B. Estimating the global waste heat potential. Renew. Sustain. Energy Rev. 2016, 57, 1568–1579. [Google Scholar] [CrossRef] [Scilit]
- Kishore, R.A.; Priya, S. A Review on Low-Grade Thermal Energy Harvesting: Materials, Methods and Devices. Materials 2018, 11, 1433. [Google Scholar] [CrossRef] [Scilit] [PubMed]
- Cheng, C.; Dai, Y.; Yu, J.; Liu, C.; Wang, S.; Feng, S.P.; Ni, M. Review of Liquid-Based Systems to Recover Low-Grade Waste Heat for Electrical Energy Generation. Energy Fuels 2021, 35, 161–175. [Google Scholar] [CrossRef] [Scilit]
- Bell, L.E. Cooling, heating, generating power, and recovering waste heat with thermoelectric systems. Science 2008, 321, 1457–1461. [Google Scholar] [CrossRef] [Scilit] [PubMed]
- Zhou, H.; Yamada, T.; Kimizuka, N. Supramolecular thermo-electrochemical cells: Enhanced thermoelectric performance by host-guest complexation and salt-induced crystallization. J. Am. Chem. Soc. 2016, 138, 10502–10507. [Google Scholar] [CrossRef] [Scilit] [PubMed]
- Han, C.-G.; Qian, X.; Li, Q.; Deng, B.; Zhu, Y.; Han, Z.; Zhang, W.; Wang, W.; Feng, S.-P.; Chen, G.; et al. Giant thermopower of ionic gelatin near room temperature. Science 2020, 368, 1091–1098. [Google Scholar] [CrossRef] [Scilit] [PubMed]
- Massetti, M.; Jiao, F.; Ferguson, A.J.; Zhao, D.; Wijeratne, K.; Würger, A.; Blackburn, J.L.; Crispin, X.; Fabiano, S. Unconventional Thermoelectric Materials for Energy Harvesting and Sensing Applications. Chem. Rev. 2021, 121, 12465–12547. [Google Scholar] [CrossRef] [Scilit] [PubMed]
- Kondo, S.; Kameyama, M.; Imaoka, K.; Shimoi, Y.; Mathevet, F.; Fujihara, T.; Goto, H.; Nakanotani, H.; Yahiro, M.; Adachi, C. Organic Thermoelectric Device Utilizing Charge Transfer Interface as the Charge Generation by Harvesting Thermal Energy. Nat. Commun. 2024, 15, 8115. [Google Scholar] [CrossRef] [Scilit] [PubMed]
- Matsushita, S. Redox reaction by thermal excitation carriers in semiconductors: Semiconductor-sensitized thermal cell. Chem. Commun. 2025, 61, 5556–5562. [Google Scholar] [CrossRef] [Scilit] [PubMed]
- Nakazawa, Y.; Ochiai, S.; Okano, Y.; Okutsu, R.; Amma, Y.; Takashiri, M. Enhancing heat-source free water-floating single-walled carbon nanotube thermoelectric generators with water-absorbing paper. J. Power Sources 2025, 642, 236966. [Google Scholar] [CrossRef] [Scilit]
- Zhang, Y.; Wang, L.; Lei, Y.; Wang, W.; Bowen, C.; Xu, Y.; Bader, S.; Arafa, M.; Cao, J.; Liao, W.-H. A review on energy harvesting for sustainable IoT monitoring systems. Renew. Sustain. Energy Rev. 2026, 232, 116779. [Google Scholar] [CrossRef] [Scilit]
- Hu, R.; Cola, B.A.; Haram, N.; Barisci, J.N.; Lee, S.; Stoughton, S.; Wallace, G.; Too, C.; Thomas, M.; Gestos, A.; et al. Harvesting waste thermal energy using a carbon-nanotube-based thermo-electrochemical cell. Nano Lett. 2010, 10, 838–846. [Google Scholar] [CrossRef] [Scilit] [PubMed]
- Lee, S.W.; Yang, Y.; Lee, H.-W.; Ghasemi, H.; Kraemer, D.; Chen, G.; Cui, Y. An electrochemical system for efficiently harvesting low-grade heat energy. Nat. Commun. 2014, 5, 3942. [Google Scholar] [CrossRef] [Scilit] [PubMed]
- Yang, Y.; Lee, S.W.; Ghasemi, H.; Loomis, J.; Li, X.; Kraemer, D.; Zheng, G.; Cui, Y.; Chen, G. Charging-free electrochemical system for harvesting low-grade thermal energy. Proc. Natl. Acad. Sci. USA 2014, 111, 17011–17016. [Google Scholar] [CrossRef] [Scilit] [PubMed]
- Wang, J.; Feng, S.-P.; Yang, Y.; Hau, N.Y.; Munro, M.; Ferreira-Yang, E.; Chen, G. “Thermal Charging” Phenomenon in Electrical Double Layer Capacitors. Nano Lett. 2015, 15, 5784–5790. [Google Scholar] [CrossRef] [Scilit] [PubMed]
- Gao, C.; Lee, S.W.; Yang, Y. Thermally Regenerative Electrochemical Cycle for Low-Grade Heat Harvesting. ACS Energy Lett. 2017, 2, 2326–2334. [Google Scholar] [CrossRef] [Scilit]
- Shibata, T.; Fukuzumi, Y.; Kobayashi, W.; Y. Moritomo, Y. Thermal power generation during heat cycle near room temperature. Appl. Phys. Express 2018, 11, 017101. [Google Scholar] [CrossRef] [Scilit]
- Shibata, T.; Nakamura, K.; Nozaki, S.; Iwaizumi, H.; Ohnuki, H.; Moritomo, Y. Optimization of electrode parameters of NaxCo[Fe(CN)6]0.88/NaxCd[Fe(CN)6]0.99 tertiary battery. Sustain. Mater. Technol. 2022, 33, e00483. [Google Scholar] [CrossRef] [Scilit]
- Li, X.; Li, J.; Yun, J.; Wu, A.; Gao, C.; Lee, S.W. Continuous thermally regenerative electrochemical systems for directly converting low-grade heat to electricity. Nano Energy 2022, 101, 107547. [Google Scholar] [CrossRef] [Scilit]
- Wu, A.; Li, X.; Lee, D.; Li, J.; Yun, J.; Jiang, C.; Li, Z.; Lee, S.W. Thermoresponsive ionic liquid for electrochemical low-grade heat harvesting. Nano Energy 2023, 105, 108022. [Google Scholar] [CrossRef] [Scilit]
- Choi, A.; Song, Y.-Y.; Kim, J.; Kim, D.; Kim, M.-H.; Lee, S.W.; Seo, D.-H.; Lee, H.-W. Enhancing Efficiency of Low-Grade Heat Harvesting by Structural Vibration Entropy in Thermally Regenerative Electrochemical Cycles. Adv. Mater. 2023, 35, 2303199. [Google Scholar] [CrossRef] [Scilit] [PubMed]
- Furuuchi, K.; Taniguchi, Y.; Bao, Y.; Niwa, H.; Y Moritomo, Y. Battery resistance and its effects on performance of laminate film-type Co-PBA/Ni-PBA tertiary battery. Jpn. J. Appl. Phys. 2024, 63, 064001. [Google Scholar] [CrossRef] [Scilit]
- Ozaki, E.; Shibata, T.; Nagai, I.; Ohnuki, H.; Moritomo, Y. Current dependence of output voltage and discharge capacity of a tertiary battery. AIP Adv. 2024, 14, 055004. [Google Scholar] [CrossRef] [Scilit]
- Maldifassi, J.T.B.; Russell, J.B.; Kim, J.; Brightman, E.; Chen, X.; Bae, D. Evaluation of redox pairs for low-grade heat energy harvesting with a thermally regenerative cycle. Energy Adv. 2024, 3, 2877–2886. [Google Scholar] [CrossRef] [Scilit]
- Sakamoto, Y.; Y Moritomo, Y. Enhanced discharge capacity of thermorechargeable batteries composed of Cd-PBA and a potential-matched PBA. Sustain. Energy Fuels 2025, 9, 2294–2301. [Google Scholar] [CrossRef] [Scilit]
- Buser, H.J.; Schwarzenbach, D.; Petter, W.; Ludi, A. The crystal structure of Prussian Blue: Fe4[Fe(CN)6]3∙xH2O. Inorg. Chem. 1977, 16, 2704–2710. [Google Scholar] [CrossRef] [Scilit]
- Herren, F.; Fischer, P.; Ludi, A.; Haelg, W. Neutron diffraction study of Prussian Blue, Fe4[Fe(CN)6]3∙xH2O. Location of water molecules and long-range magnetic order. Inorg. Chem. 1980, 19, 956–959. [Google Scholar] [CrossRef] [Scilit]
- Niwa, H.; Kobayashi, W.; Shibata, T.; Nitani, H.; Moritomo, Y. Invariant nature of substituted element in metal-hexacyanoferrate. Sci. Rep. 2017, 7, 13225. [Google Scholar] [CrossRef] [Scilit] [PubMed]
- Imanishi, N.; Morikawa, T.; Kondo, J.; Takeda, Y.; Yamamoto, O.; Kinugasa, N.; Yamagishi, T. Lithium intercalation behavior into iron cyanide complex as positive electrode of lithium secondary battery. J. Power Sources 1999, 79, 215–219. [Google Scholar] [CrossRef] [Scilit]
- Imanishi, N.; Morikawa, T.; Kondo, J.; Yamane, R.; Takeda, Y.; Yamamoto, O.; Sakaebe, H.; Tabuchi, M. Lithium intercalation behavior of iron cyanometallates. J. Power Sources 1999, 81-82, 530–534. [Google Scholar] [CrossRef] [Scilit]
- Okubo, M.; Asakura, D.; Mizuno, Y.; Kim, J.-D.; Mizokawa, T.; Kudo, T.; Honma, I. Switching Redox-Active Sites by Valence Tautomerism in Prussian Blue Analogues AxMny[Fe(CN)6]·nH2O (A: K, Rb): Robust Frameworks for Reversible Li Storage. J. Phys. Chem. Lett. 2010, 1, 2063–2071. [Google Scholar] [CrossRef] [Scilit]
- Shen, L.; Wang, Z.; Chen, L. Prussian Blues as a Cathode Material for Lithium Ion Batteries. Chem. Eur. J. 2014, 20, 12559–12562. [Google Scholar] [CrossRef] [Scilit] [PubMed]
- Nie, P.; Shen, L.; Luo, H.; Ding, B.; Xu, G.; Wang, J.; Zhang, X. Prussian blue analogues: A new class of anode materials for lithium ion batteries. J. Mater. Chem. A 2014, 2, 5852–5857. [Google Scholar] [CrossRef] [Scilit]
- Shi, D.-R.; Fu, J.; Shadike, Z.; Cao, M.-H.; Wang, W.-W.; Fu, Z.-W. All-Solid-State Rechargeable Lithium Metal Battery with a Prussian Blue Cathode Prepared by a Nonvacuum Coating Technology. ACS Omega 2018, 3, 7648–7654. [Google Scholar] [CrossRef] [Scilit] [PubMed]
- Zhang, Z.; Avdeev, M.; Chen, H.; Yin, W.; Kan, W.H.; He, G. Lithiated Prussian blue analogues as positive electrode active materials for stable non-aqueous lithium-ion batteries. Nat. Commun. 2022, 13, 7790. [Google Scholar] [CrossRef] [Scilit] [PubMed]
- Wu, C.; Hu, J.; Chen, H.; Zhang, C.; Xu, M.; Zhuang, L.; Ai, X.; Qian, J. Chemical lithiation methodology enabled Prussian blue as a Li-rich cathode material for secondary Li-ion batteries. Energy Storage Mater. 2023, 60, 102803. [Google Scholar] [CrossRef] [Scilit]
- Lu, Y.; Wang, L.; Cheng, J.; Goodenough, J.B. Prussian blue: A new framework of electrode materials for sodium batteries. Chem. Commun. 2012, 48, 6544–6546. [Google Scholar] [CrossRef] [Scilit] [PubMed]
- Takachi, M.; Matsuda, T.; Moritomo, Y. Redox Reactions in Prussian Blue Analogue Films with Fast Na+ Intercalation. Jpn. J. Appl. Phys. 2013, 52, 090202. [Google Scholar] [CrossRef] [Scilit]
- Yang, D.; Xu, J.; Liao, X.-Z.; He, Y.-S.; Liu, H.; Ma, Z.-F. Structure optimization of Prussian blue analogue cathode materials for advanced sodium ion batteries. Chem. Commun. 2014, 50, 13377–13380. [Google Scholar] [CrossRef] [Scilit] [PubMed]
- Lee, H.W.; Wang, R.Y.; Pasta, M.; Lee, S.W.; Liu, N.; Cui, Y. Manganese hexacyanomanganate open framework as a high-capacity positive electrode material for sodium-ion batteries. Nat. Commun. 2014, 5, 5280. [Google Scholar] [CrossRef] [Scilit] [PubMed]
- You, Y.; Wu, X.L.; Yin, Y.X.; Guo, Y.G. High-quality Prussian blue crystals as superior cathode materials for room-temperature sodium-ion batteries. Energy Environ. Sci. 2014, 7, 1643–1647. [Google Scholar] [CrossRef] [Scilit]
- Wang, L.; Song, J.; Qiao, R.; Wray, L.A.; Hossain, M.A.; Chuang, Y.-D.; Yang, W.; Lu, Y.; Evans, D.; Lee, J.-J.; et al. Rhombohedral Prussian white as cathode for rechargeable sodium-ion batteries. J. Am. Chem. Soc. 2015, 137, 2548–2554. [Google Scholar] [CrossRef] [Scilit] [PubMed]
- Yu, S.; Li, Y.; Lu, Y.; Xu, B.; Wang, Q.; Yan, M.; Jiang, Y. A promising cathode material of sodium iron–nickel hexacyanoferrate for sodium ion batteries. J. Power Sources 2015, 275, 45–49. [Google Scholar] [CrossRef] [Scilit]
- Pasta, M.; Wang, R.Y.; Ruffo, R.; Qiao, R.; Lee, H.-W.; Shyam, B.; Guo, M.; Wang, Y.; Wray, L.A.; Yang, W.; et al. Manganese–cobalt hexacyanoferrate cathodes for sodium-ion batteries. J. Mater. Chem. A 2016, 4, 4211–4223. [Google Scholar] [CrossRef] [Scilit]
- Wu, X.; Wu, C.; Wei, C.; Hu, L.; Qian, J.; Cao, Y.; Ai, X.; Wang, J.; Yang, H. Highly Crystallized Na2CoFe(CN)6 with Suppressed Phase Transition as Superior Cathode for Sodium-Ion Batteries. ACS Appl. Mater. Interfaces 2016, 8, 5393–5399. [Google Scholar] [CrossRef] [Scilit] [PubMed]
- Nakamoto, K.; Sakamoto, R.; Ito, M.; Kitajou, A.; Okada, S. Effect of Concentrated Electrolyte on Aqueous Sodium-ion Battery with Sodium Manganese Hexacyanoferrate Cathode. Electrochemistry 2017, 85, 179–185. [Google Scholar] [CrossRef] [Scilit]
- Rehman, R.; Peng, J.; Yi, H.; Shen, Y.; Yin, J.; Li, C.; Fang, C.; Li, Q.; Han, J. Highly crystalline nickel hexacyanoferrate as a long-life cathode material for sodium-ion batteries. RSC Adv. 2020, 10, 27033–27041. [Google Scholar] [CrossRef] [Scilit] [PubMed]
- Xu, Z.; Sun, Y.; Xie, J.; Nie, Y.; Xu, X.; Tu, J.; Shen, C.; Jin, Y.; Li, Y.; Lu, Y.; et al. High-performance Ni/Fe-codoped manganese hexacyanoferrate by scale-up synthesis for practical Na-ion batteries. Mater. Today Sustain. 2022, 18, 100113. [Google Scholar] [CrossRef] [Scilit]
- Kim, T.; Ahn, S.H.; Song, Y.-Y.; Park, B.J.; Lee, C.; Choi, A.; Kim, M.-H.; Seo, D.-H.; Jung, S.-K.; Lee, H.-W. Prussian Blue-Type Sodium-ion Conducting Solid Electrolytes for All Solid-State Batteries. Angew. Chem. Int. Ed. 2023, 62, e202309852. [Google Scholar] [CrossRef] [Scilit] [PubMed]
- Nakamoto, K.; Tanaka, M.; Sakamoto, R.; Ito, M.; Okada, S. Kinetic Effect of Local pH on High-Voltage Aqueous Sodium-Ion Batteries. Electrochemistry 2024, 92, 017003. [Google Scholar] [CrossRef] [Scilit]
- Xiao, Y.; Xiao, J.; Zhao, H.; Li, J.; Zhang, G.; Zhang, D.; Guo, X.; Gao, H.; Wang, Y.; Chen, J.; et al. Prussian blue analogues for sodium-ion battery cathodes: A review of mechanistic insights, current challenges, and future pathways. Small 2024, 20, 2401957. [Google Scholar] [CrossRef] [Scilit] [PubMed]
- Moritomo, Y.; Yoshida, Y.; Inoue, D.; Iwaizumi, H.; Kobayashi, S.; Kawaguchi, S.; Shibata, T. Origin of the Material Dependence of the Temperature Coefficient of the Redox Potential in Coordination Polymers. J. Phys. Soc. Jpn. 2021, 90, 063801. [Google Scholar] [CrossRef] [Scilit]
- Izumi, F.; Momma, K. Three-dimensional visualization in powder diffraction. Solid State Phenom. 2007, 130, 15–20. [Google Scholar] [CrossRef] [Scilit]
- Shannon, R.D. Revised Effective Ionic Radii and Systematic Studies of Interatomic Distances in Halides and Chalcogenides. Acta Crystallogr. 1976, A32, 751–767. [Google Scholar] [CrossRef] [Scilit]
- Magnússon, R.L.; Kobayashi, W.; Takachi, M.; Moritomo, Y. Temperature effect on redox voltage in LixCo[Fe(CN)6]y. AIP Adv. 2017, 7, 045002. [Google Scholar] [CrossRef] [Scilit]

Disclaimer/Publisher’s Note: The statements, opinions and data contained in all publications are solely those of the individual author(s) and contributor(s) and not of MDPI and/or the editor(s). MDPI and/or the editor(s) disclaim responsibility for any injury to people or property resulting from any ideas, methods, instructions or products referred to in the content. |
© 2026 by the authors. Licensee MDPI, Basel, Switzerland. This article is an open access article distributed under the terms and conditions of the Creative Commons Attribution (CC BY) license.