


Abstract
The secondary dendrite arm spacing (SDAS) is a critical microstructural parameter that directly influences the local mechanical performance of Al–Si casting alloys. Although the power-law relationship between cooling rate and SDAS is widely acknowledged, the existing literature lacks a standardized framework for selecting the most appropriate solidification thermal interval for calculating this characteristic cooling rate. This study introduces an optimized methodological approach by evaluating solidification kinetics across two distinct thermal regimes: a standard non-isothermal sand mold (no chill) and an accelerated cast iron insert configuration (with chill). Cooling curves of a primary hypoeutectic AlSi7 Mg0.3 alloy were continuously recorded via ten calibrated K-type thermocouples along a wedge-shaped casting profile, and the corresponding local SDAS values were quantified using light optical metallography. By mathematically evaluating six distinct thermal analysis boundaries, the results demonstrate that conventional global intervals (e.g., liquidus-to-eutectic) yield lower predictive accuracy (R2 ≈ 0.75) due to the accumulation of thermal “noise” from the early fluidic stage and the final eutectic reaction. In contrast, the localized interval bounded strictly between the Dendrite Coherency Point and the Rigidity Temperature (TDCP − TRigidity) achieved excellent correlation for both the baseline slow-cooling regime (R2 = 0.8509) and the accelerated regime (R2 = 0.9547). This optimized window successfully isolates the exact kinetic timeframe of secondary dendritic evolution and effectively eliminates localized calculation anomalies across the entire spectrum of cooling rates. Thermodynamic analysis reveals a sharp cooling asymmetry in the wedge geometry, where the local solidification timescale collapses by a factor of 34 at the chill base. This extreme kinetic restriction limits the characteristic solute diffusion distance () by a factor of nearly six (using representative solute diffusivities for Mg and Si in liquid aluminum), providing a quantitative physical basis for the significantly flatter coarsening slope (−14.85) under accelerated cooling compared to the baseline regime (−32.63). The proposed methodology establishes a physically grounded, highly accurate microstructural prediction tool suitable for advanced foundry engineering and casting simulations.
1. Introduction
Al–Si–Mg casting alloys, particularly the hypoeutectic AlSi7 Mg0.3 system (equivalent to A356, according to the AA standard from the USA [1,2]), are widely used in high-performance automotive and aerospace applications due to their excellent strength-to-weight ratio, superior castability, and high corrosion resistance [3]. The macroscopic mechanical properties of these components, such as tensile strength, ductility, and fracture toughness, are profoundly dictated by the scale of the local solidified microstructure [4]. Among the various structural parameters, the SDAS is universally recognized as the most critical microstructural feature directly influencing material performance. It is well established that a refined dendritic structure, characterized by a low SDAS value, reduces dislocation motion via grain-boundary-like hardening mechanisms, thereby dramatically improving mechanical properties [5].
The fundamental governing factor controlling the refinement of SDAS is the solidification cooling rate (v). Thermodynamically, this relationship is conventionally modeled using the empirical power law equation [6,7,8]:
where K represents an alloy-dependent material constant, and n is the coarsening exponent, typically around 1/3 for most metallic systems. While this relationship is widespread in computer-aided casting simulations, a critical limitation arises in engineering practice. The existing literature lacks a standardized, physically coherent methodology for calculating the operational cooling rate (v).
SDAS = Kv−n
Conventionally, researchers compute the cooling rate as a broad average over fixed, global temperature ranges. The most common approach involves taking the average temperature drop across the entire liquidus–solidus solidification interval, defined as dT/dt over the total solidification time, or utilizing a fixed arbitrary range such as 620 °C down to the Al–Si eutectic temperature (). However, these macroscale thermodynamic calculations do not accurately represent the local kinetic window in which the physical growth and coarsening of secondary dendrite arms occur [9]. Calculating cooling rates across boundaries where no secondary arm growth occurs introduces statistical “noise,” reducing the predictive accuracy of the resulting microstructural models.
To bridge this gap, computer-aided cooling-curve TA can be employed to determine the exact rheological transitions in the solidifying mushy zone [10]. Thermodynamically, the initial formation and subsequent structural stabilization of secondary dendrites are constrained by two crucial metallurgical boundaries:
- The Dendrite Coherency Point (TDCP). This represents the critical thermal point at which primary aluminum (α-Aluminum) dendrites grow sufficiently to impinge on one another, forming a continuous, self-supporting solid network [11]. Before TDCP, individual dendrites float freely within the melt. Only after the establishment of this coherent network does intensive competitive growth, lateral solute redistribution, and the development of secondary arms truly initiate.
- The Rigidity Temperature (TRigidity). Occurring immediately after the Al–Si eutectic temperature, represents the point where the solid fraction is sufficiently high to lock the mechanical skeleton into place [12]. At this threshold, mass transport and atomic diffusion within the isolated pockets of remaining liquid metal drop dramatically, stopping any further lateral growth or coarsening (coalescence) of the primary and secondary arms.
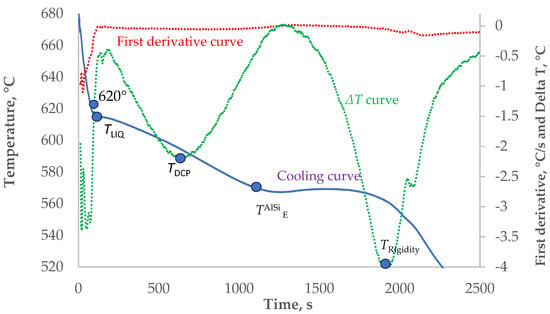
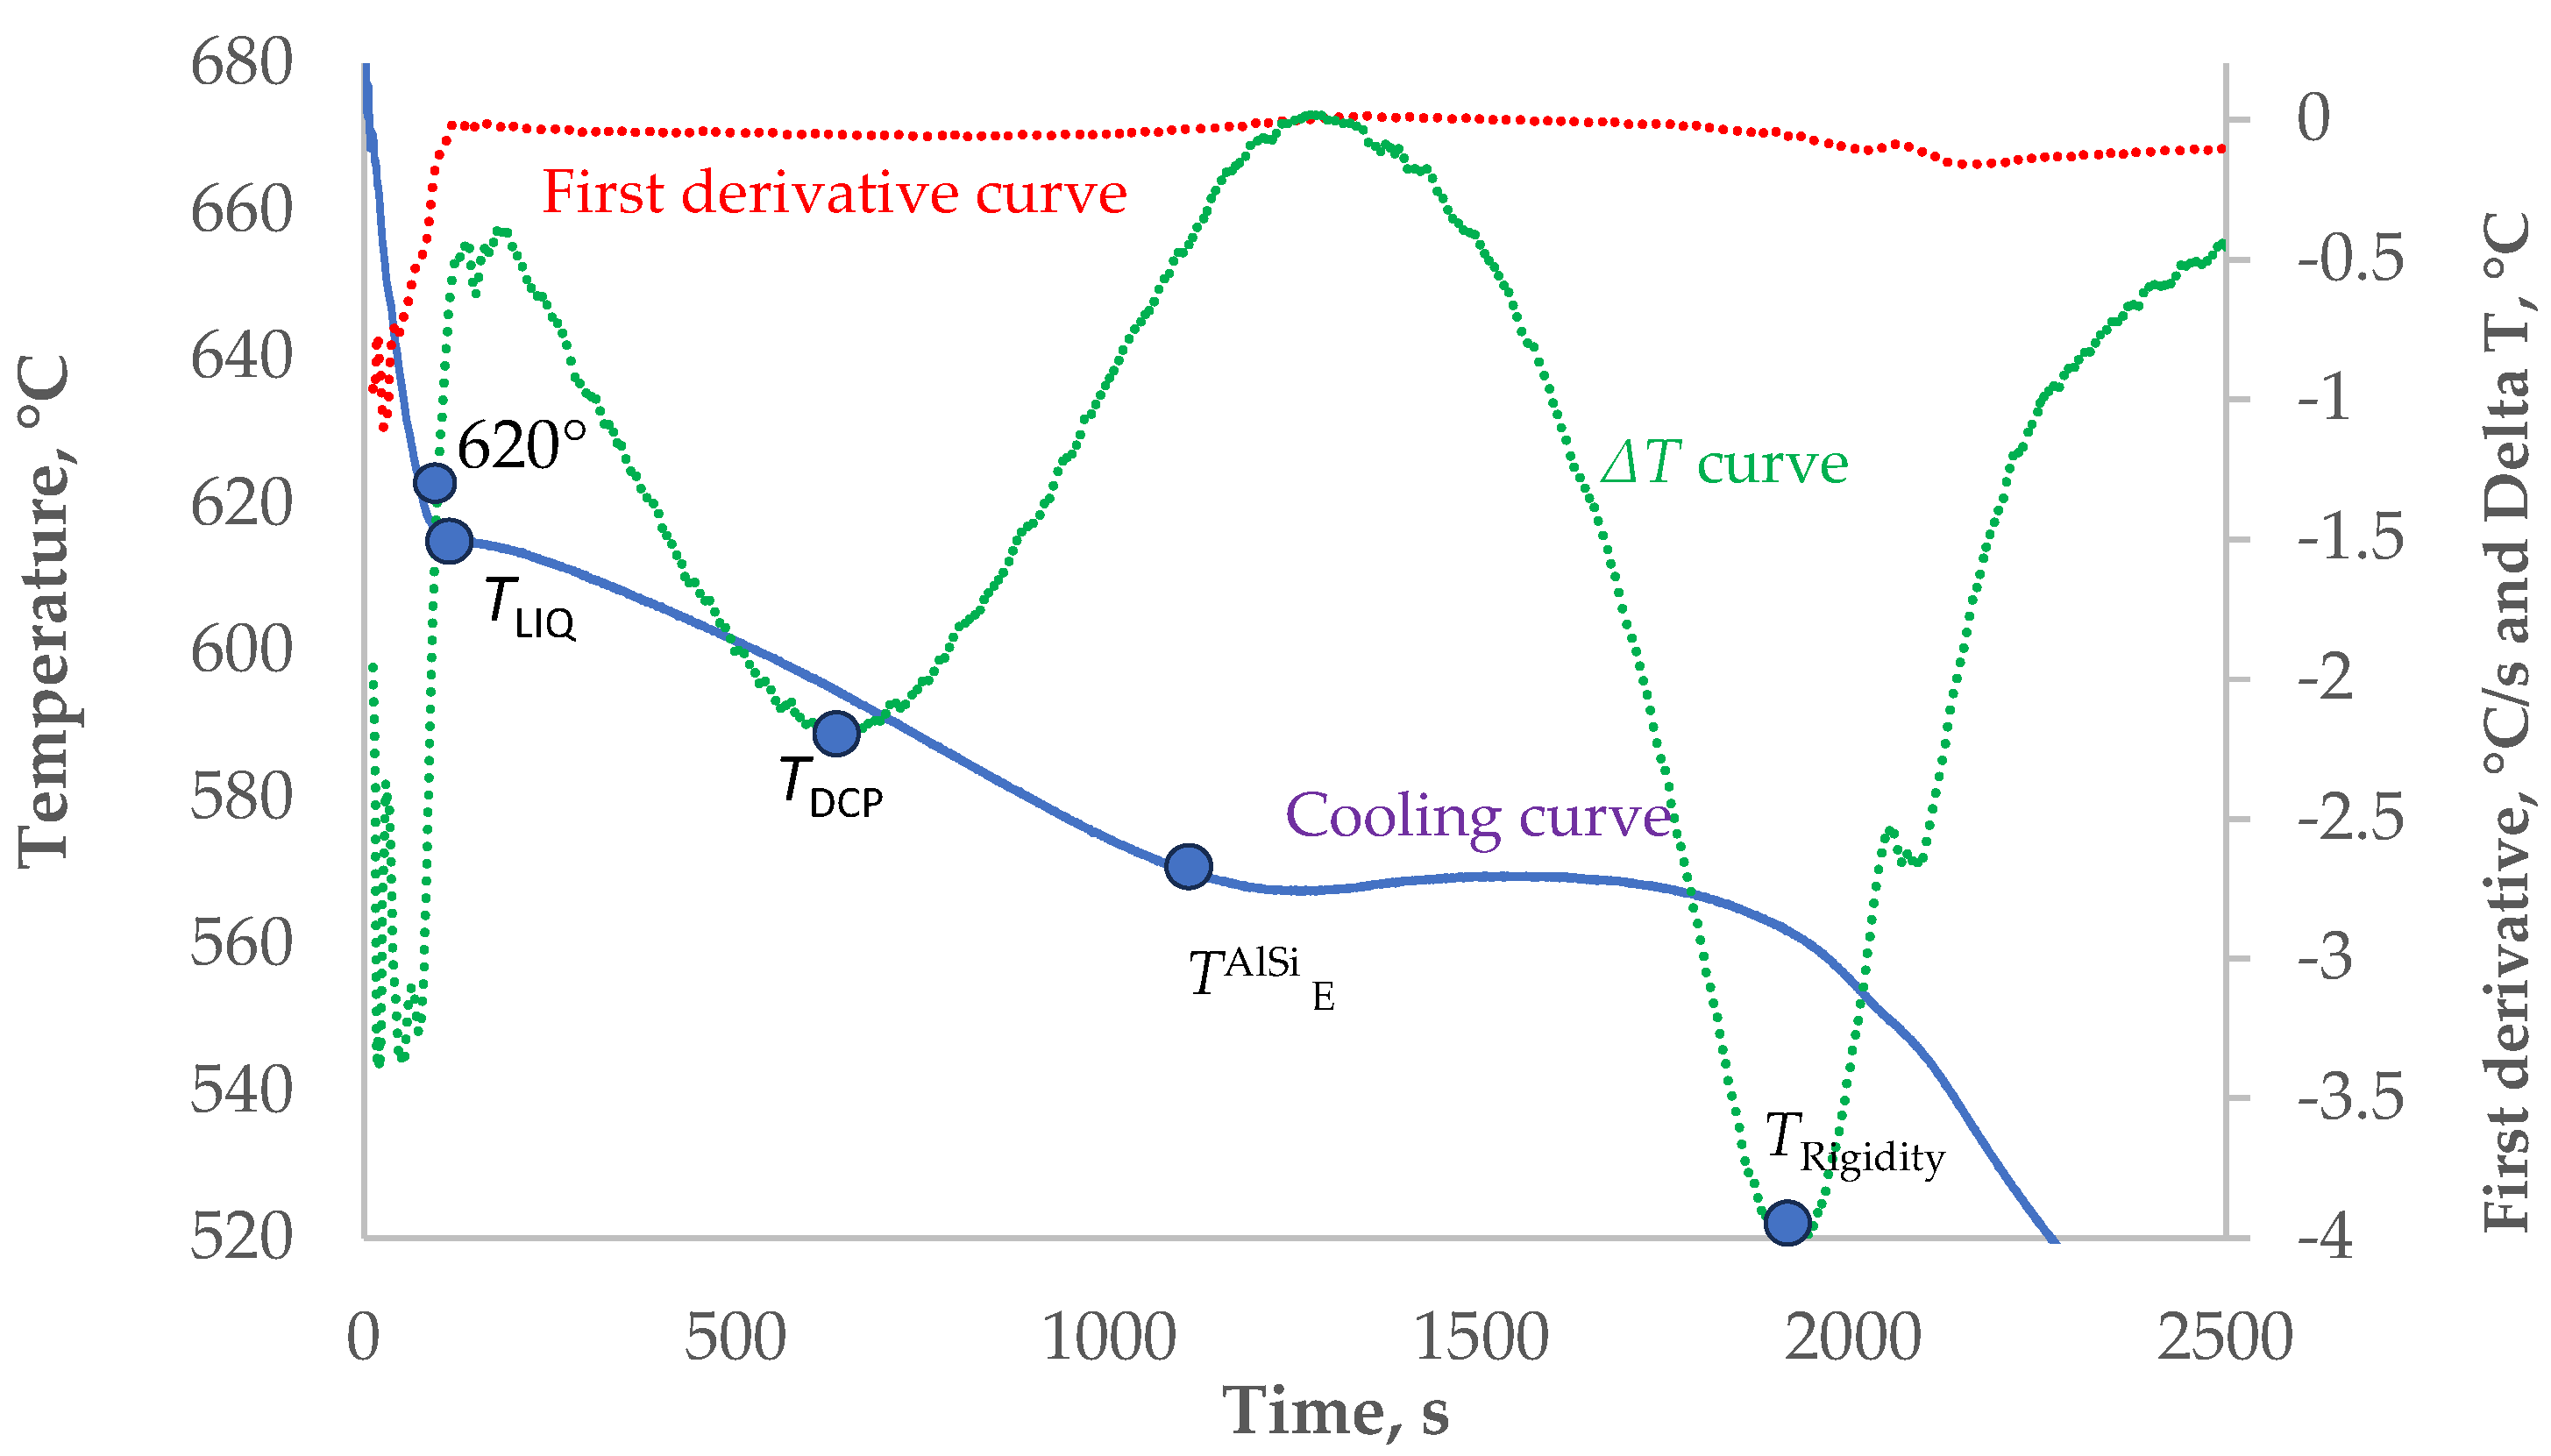
The TDCP and TRigidity were determined from the ΔT curve, where the first minimum of this curve plotted versus time corresponds to TDCP and the second minimum corresponds to TRigidity as Figure 1 illustrates. In contrast, the liquidus temperature (TLiq) and the onset of the aluminum silicon eutectic reaction () were identified from the primary cooling curve and its first derivative (dT/dt) recorded at the thermocouple position itself. Because TDCP and TRigidity are derived from a spatial temperature difference signal (∆T = Tcenter − Tperphery) between two physically separated thermocouples, while TLiq and are derived from a single-point thermal signal, the two pairs of characteristic points are not obtained on a strictly identical time basis. At a limited number of positions, spanning a narrow intermediate range of local cooling rates, the independently derived times for , E and TRigidity were very close to one another, and their relative order was locally reversed. This does not affect any of the reported cooling rates, since each of the six thermal intervals (v1–v6) is defined by its own pair of boundaries and does not require a direct temporal comparison between and TRigidity the raw readings are reported here as obtained, without artificial reordering.
Figure 1.
Cooling curve, first-derivative curve, and ΔT curve, along with selected characteristic solidification temperatures, for the AlSi7 Mg0.3 alloy without chill attachment.
Consequently, the localized physical window for the formation and evolution of SDAS is strictly confined to the microstructural range bounded by TDCP and TRigidity. Despite the theoretical soundness of evaluating cooling kinetics inside this localized window, the broader literature continues to rely heavily on macroscale intervals without mathematical or statistical validation of their predictive accuracy. It should be emphasized that the identification of TDCP and TRigidity by cooling curve thermal analysis is not itself claimed as novel and has been described in detail elsewhere [10,12]; the specific contribution of the present study lies in using these two transitions to define the interval over which the cooling rate is calculated for the purpose of SDAS prediction, and in demonstrating systematically how this choice governs the predictive quality of the resulting correlation. To the best of the authors’ knowledge, no systematic study has yet explicitly quantified and compared how different TA boundaries correlate with the final metallographically measured SDAS values. To address this deficiency, the present study introduces a novel methodological framework evaluated under both conventional and highly accelerated solidification pathways. Utilizing a controlled wedge mold geometry to capture a wide gradient of cooling rates across two distinct experimental regimes, a baseline sand mold setup (no chill) and an accelerated configuration featuring a cast iron insert (with chill), this work systematically evaluates and compares six distinct thermal intervals (; T620 − TRigidity; ; TLiq − TRigidity; ; TDCP − TRigidity) for calculating the characteristic cooling rate of an AlSi7 Mg0.3 alloy. By computing the coefficient of determination (R2) for each region across both solidification setups, this research mathematically validates the kinetic window governing secondary dendritic growth and establishes a precise, versatile, and physically rigorous predictive framework for foundry applications.
2. Experimental Procedure
2.1. Material and Melt Preparation
The commercial primary hypoeutectic AlSi7 Mg0.3 alloy was used in this study. The exact chemical composition of the investigated alloy, verified via optical emission spectrometry, is presented in Table 1.
Table 1.
Chemical composition of the investigated AlSi7 Mg0.3 alloy (wt.%).
The alloy was melted in an electric resistance furnace. To remove dissolved hydrogen gas and non-metallic inclusions, the melt was degassed for 15 min using a rotary degassing unit and inert nitrogen gas. No grain refiners (e.g., AlTi5 B1 master alloy) or additional structure modifiers (e.g., AlSr10 master alloy) were introduced into the melt during preparation, ensuring that dendritic growth kinetics were regulated only by the chemical composition and thermal conditions. The pouring temperature immediately before casting was strictly maintained at 740 °C.
2.2. Casting Setup and Thermal Analysis
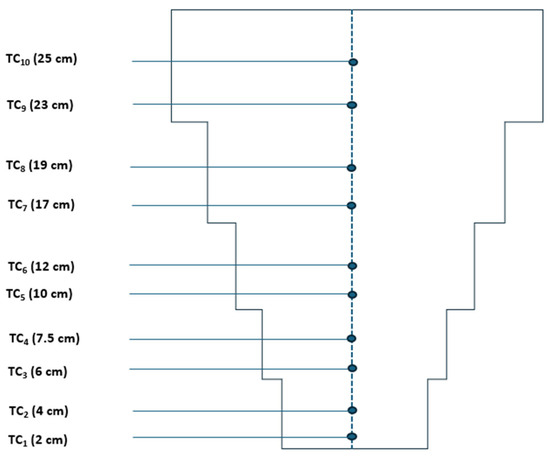
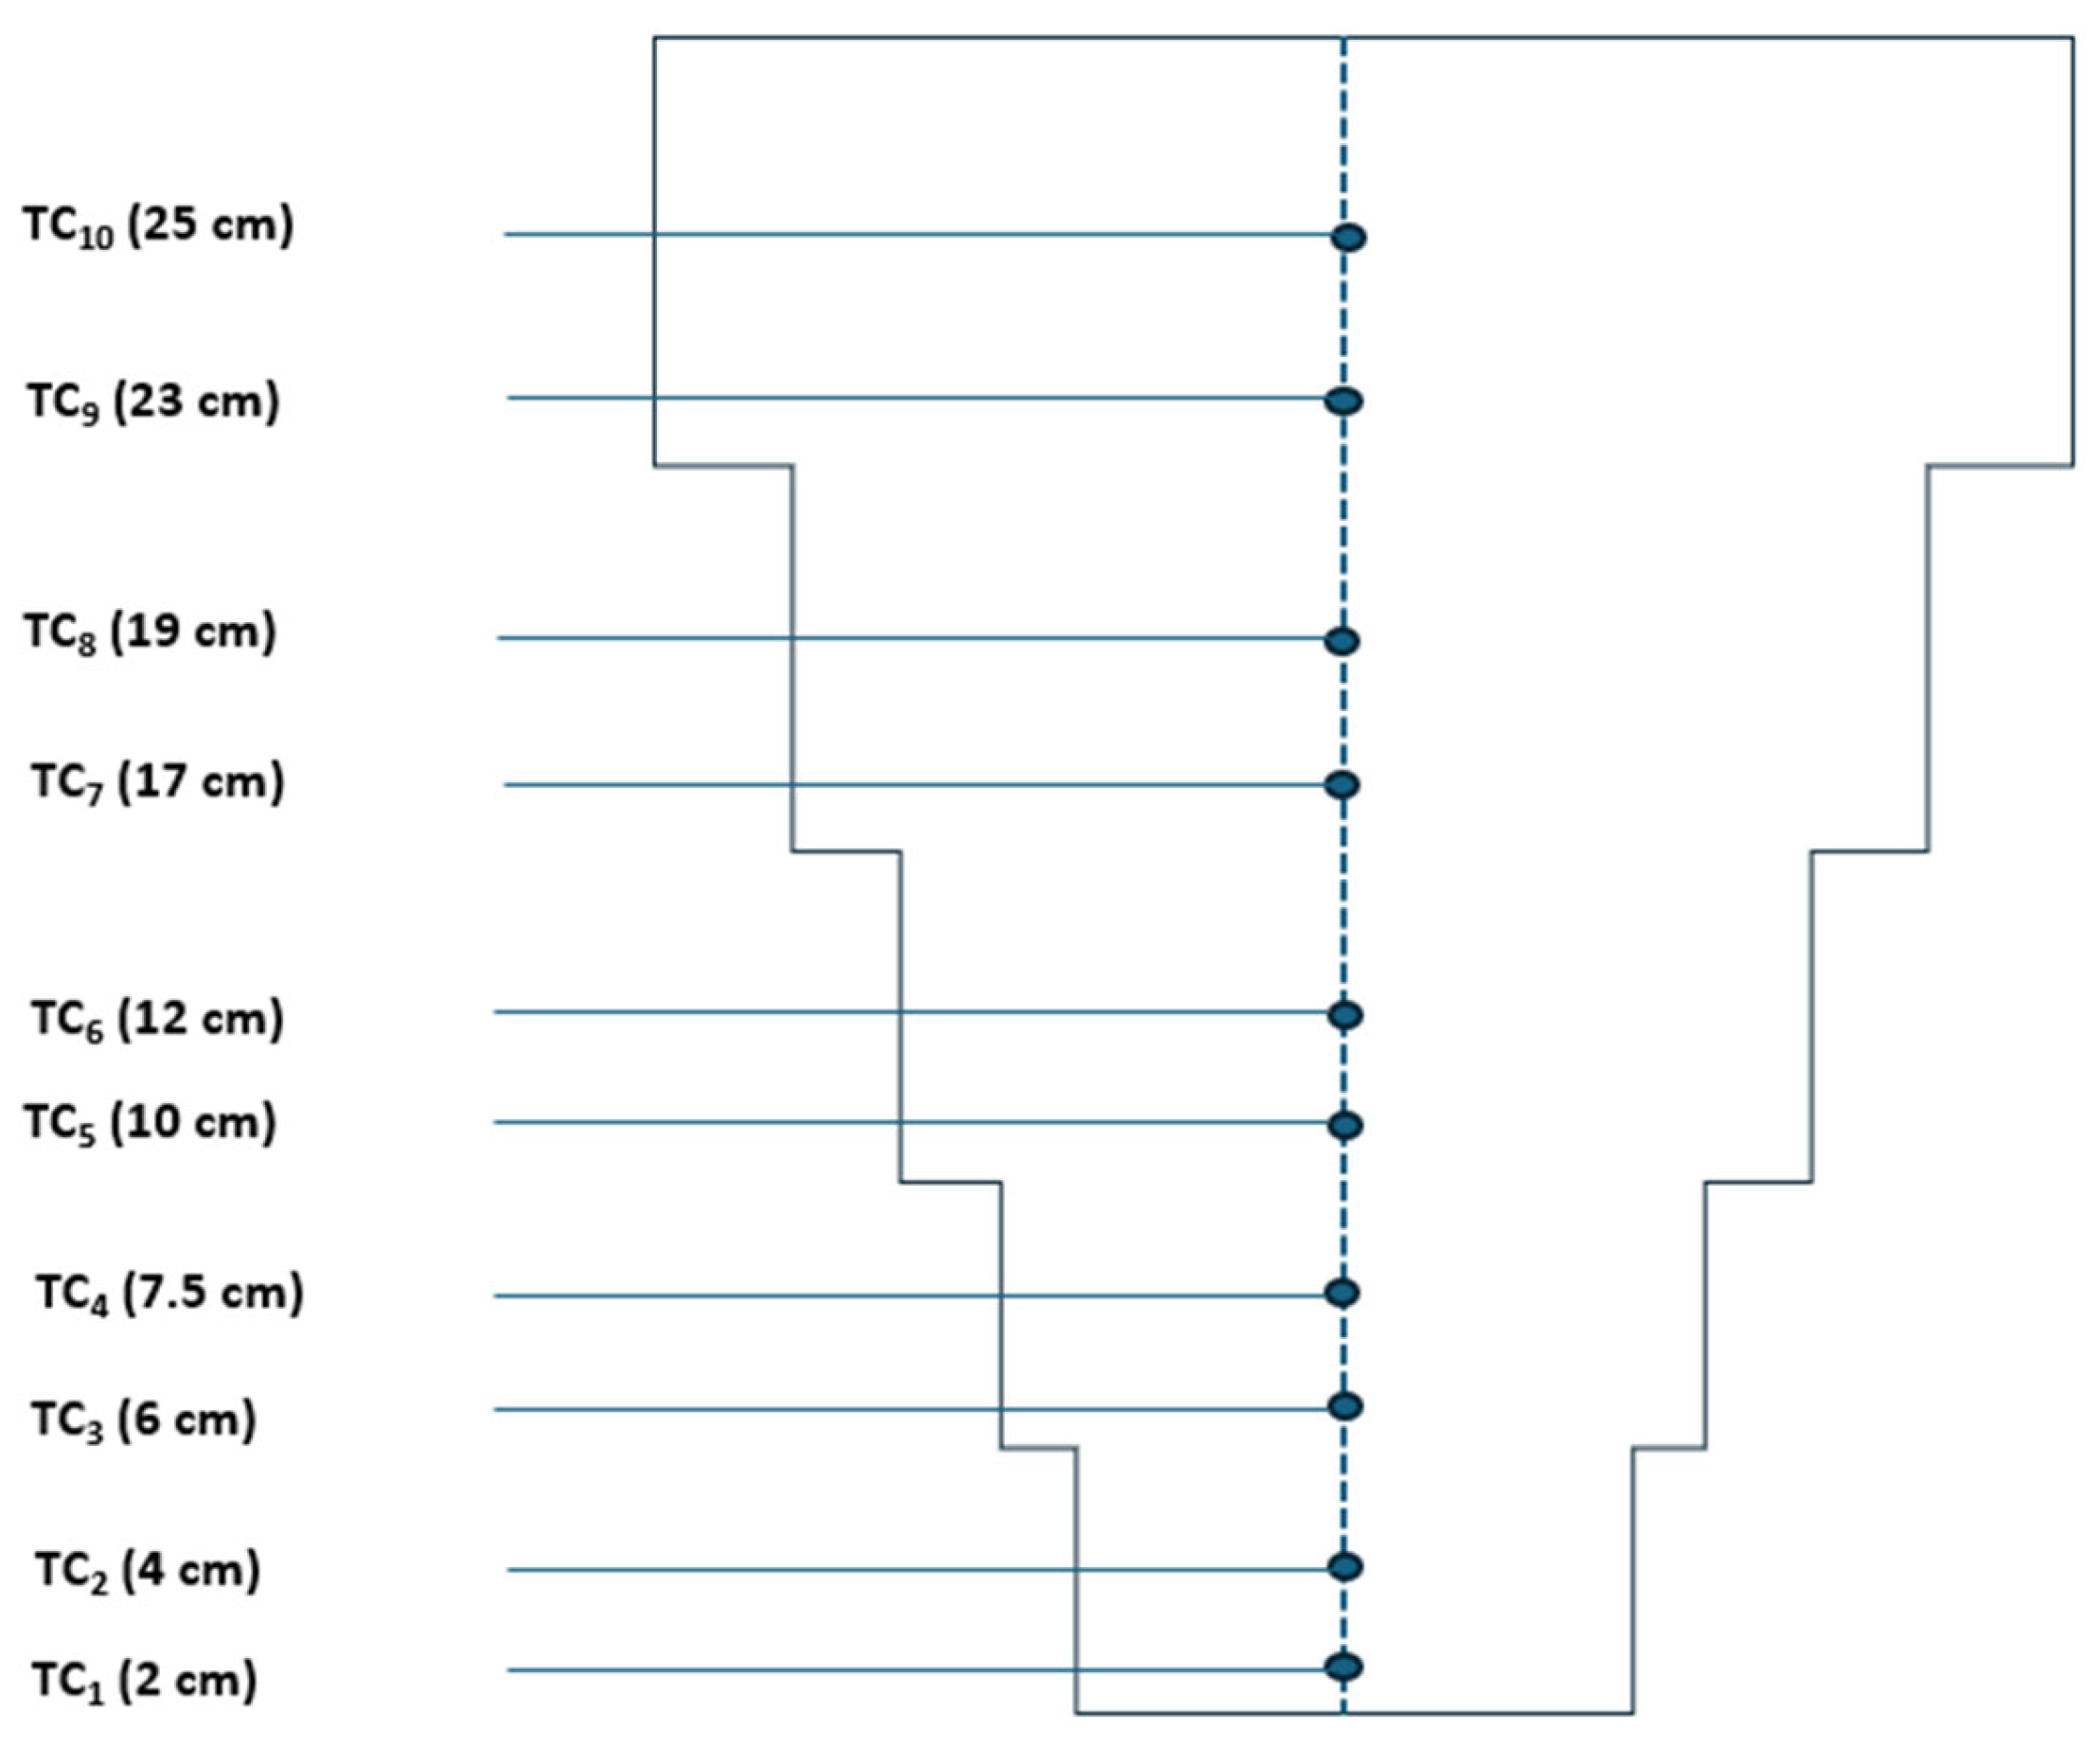
The molten metal was poured by gravity into sand molds prepared using reclaimed sand. To ensure a calm and oxide-free mold filling, a ceramic foam filter was integrated into the gating system. To achieve a wide, controlled gradient in cooling rates, a specific wedge-casting geometry was employed. To evaluate the alloy’s thermal and microstructural response across different solidification regimes, two distinct experimental setups were investigated: a baseline configuration without a chill insert (no chill), and an accelerated configuration utilizing a cast iron chill insert (with chill) positioned at the wedge base. Figure 2 shows a schematic cross-sectional illustration of the experimental wedge-casting geometry (baseline, no-chill configuration), showing the precise centerline locations of the ten K-type thermocouples (TC1 to TC10) and their respective heights above the wedge base. In the accelerated configuration, a cast iron chill insert (150 mm × 110 mm × 30 mm) was mounted at the wedge base.
Figure 2.
Schematic cross-sectional illustration of the experimental wedge-casting geometry (baseline, no-chill configuration).
The only difference between the two experimental configurations was the presence of the cast iron chill insert; all other casting parameters were kept identical. The chill insert (dimensions: 150 mm × 110 mm × 30 mm; weighing approximately 3 kg) was manufactured from gray cast iron (EN-GJL-250) and positioned at the bottom section of the wedge mold. The insert was mounted on the inner mold surface to ensure direct contact with the molten alloy immediately after pouring, thereby providing intensive heat extraction over the lower region of the casting. This configuration was deliberately selected to establish an accelerated solidification regime and extend the experimentally accessible range of cooling rates within the same casting geometry.
Solidification paths were recorded using 10 calibrated K-type thermocouples (TCn, n = 1, 2, …, 10) inserted along the vertical centerline of the wedge casting. The thermocouples were factory-calibrated K-type (Chromel–Alumel) sensors with a nominal accuracy of ±1.5 °C over the relevant temperature range. As illustrated schematically in Figure 2, the sensors were precisely positioned at fixed distances from the narrow base (bottom) of the wedge: 2.0, 4.0, 6.0, 7.5, 10.0, 12.0, 17.0, 19.0, 23.0, and 25.0 cm. Temperature data were collected continuously over time at a high sampling frequency of 5 Hz (5 records per second), ensuring high resolution for subsequent derivative calculations. Under these casting conditions, the average cooling rate for the baseline configuration (no chill) ranged from approximately 0.37 °C/s at the fast-cooling bottom to 0.04 °C/s at the slow-cooling top of the wedge. Conversely, the accelerated configuration utilizing the cast iron insert (with chill) exhibited substantially higher cooling kinetics, with average cooling rates ranging from approximately 9.90 °C/s at the chill-contact base to 0.07 °C/s at the top of the mold.
2.3. Quantitative Metallography and SDAS Measurement
Following complete solidification and decoring, the wedge casting was sectioned vertically along the centerline plane containing the thermocouple tips. For each thermocouple position, three small metallographic specimens (approximately 10 mm × 10 mm each) were extracted in the immediate vicinity of the thermocouple tip, one centered at the tip and one each directly above and below it, to ensure an exact correlation between the local thermal history and the resulting microstructural features while also capturing local microstructural variability at each position. The samples were prepared according to standard metallurgical procedures, involving sequential grinding with SiC papers up to 2500 grit, followed by diamond polishing (down to 1µm) and final etching to reveal the dendritic boundaries. Secondary dendrite arm spacing was defined as the perpendicular distance between the centerlines of adjacent, well-aligned secondary arms branching laterally from a common primary dendrite stem, measured along a line transecting several consecutive arms. Quantitative characterization of the SDAS was conducted using a light optical microscope. To obtain statistically reliable data, the linear intercept method was utilized at a constant magnification of 25×. Within each of the three fields per position, at least 10 independent linear intercept measurements were taken across well-defined, parallel secondary dendrite branches, yielding approximately 30 measurements per thermocouple position. The final SDAS value (µm) reported for each position was calculated as the arithmetic mean of all measurements obtained from the three fields, and the corresponding standard deviation was used to characterize local microstructural variability.
3. Results and Discussion
3.1. Evaluation of Thermal Analysis Intervals on SDAS Prediction
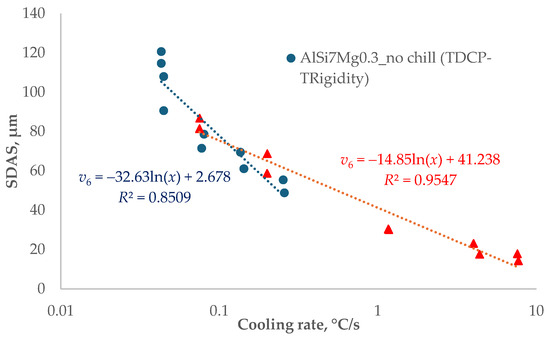
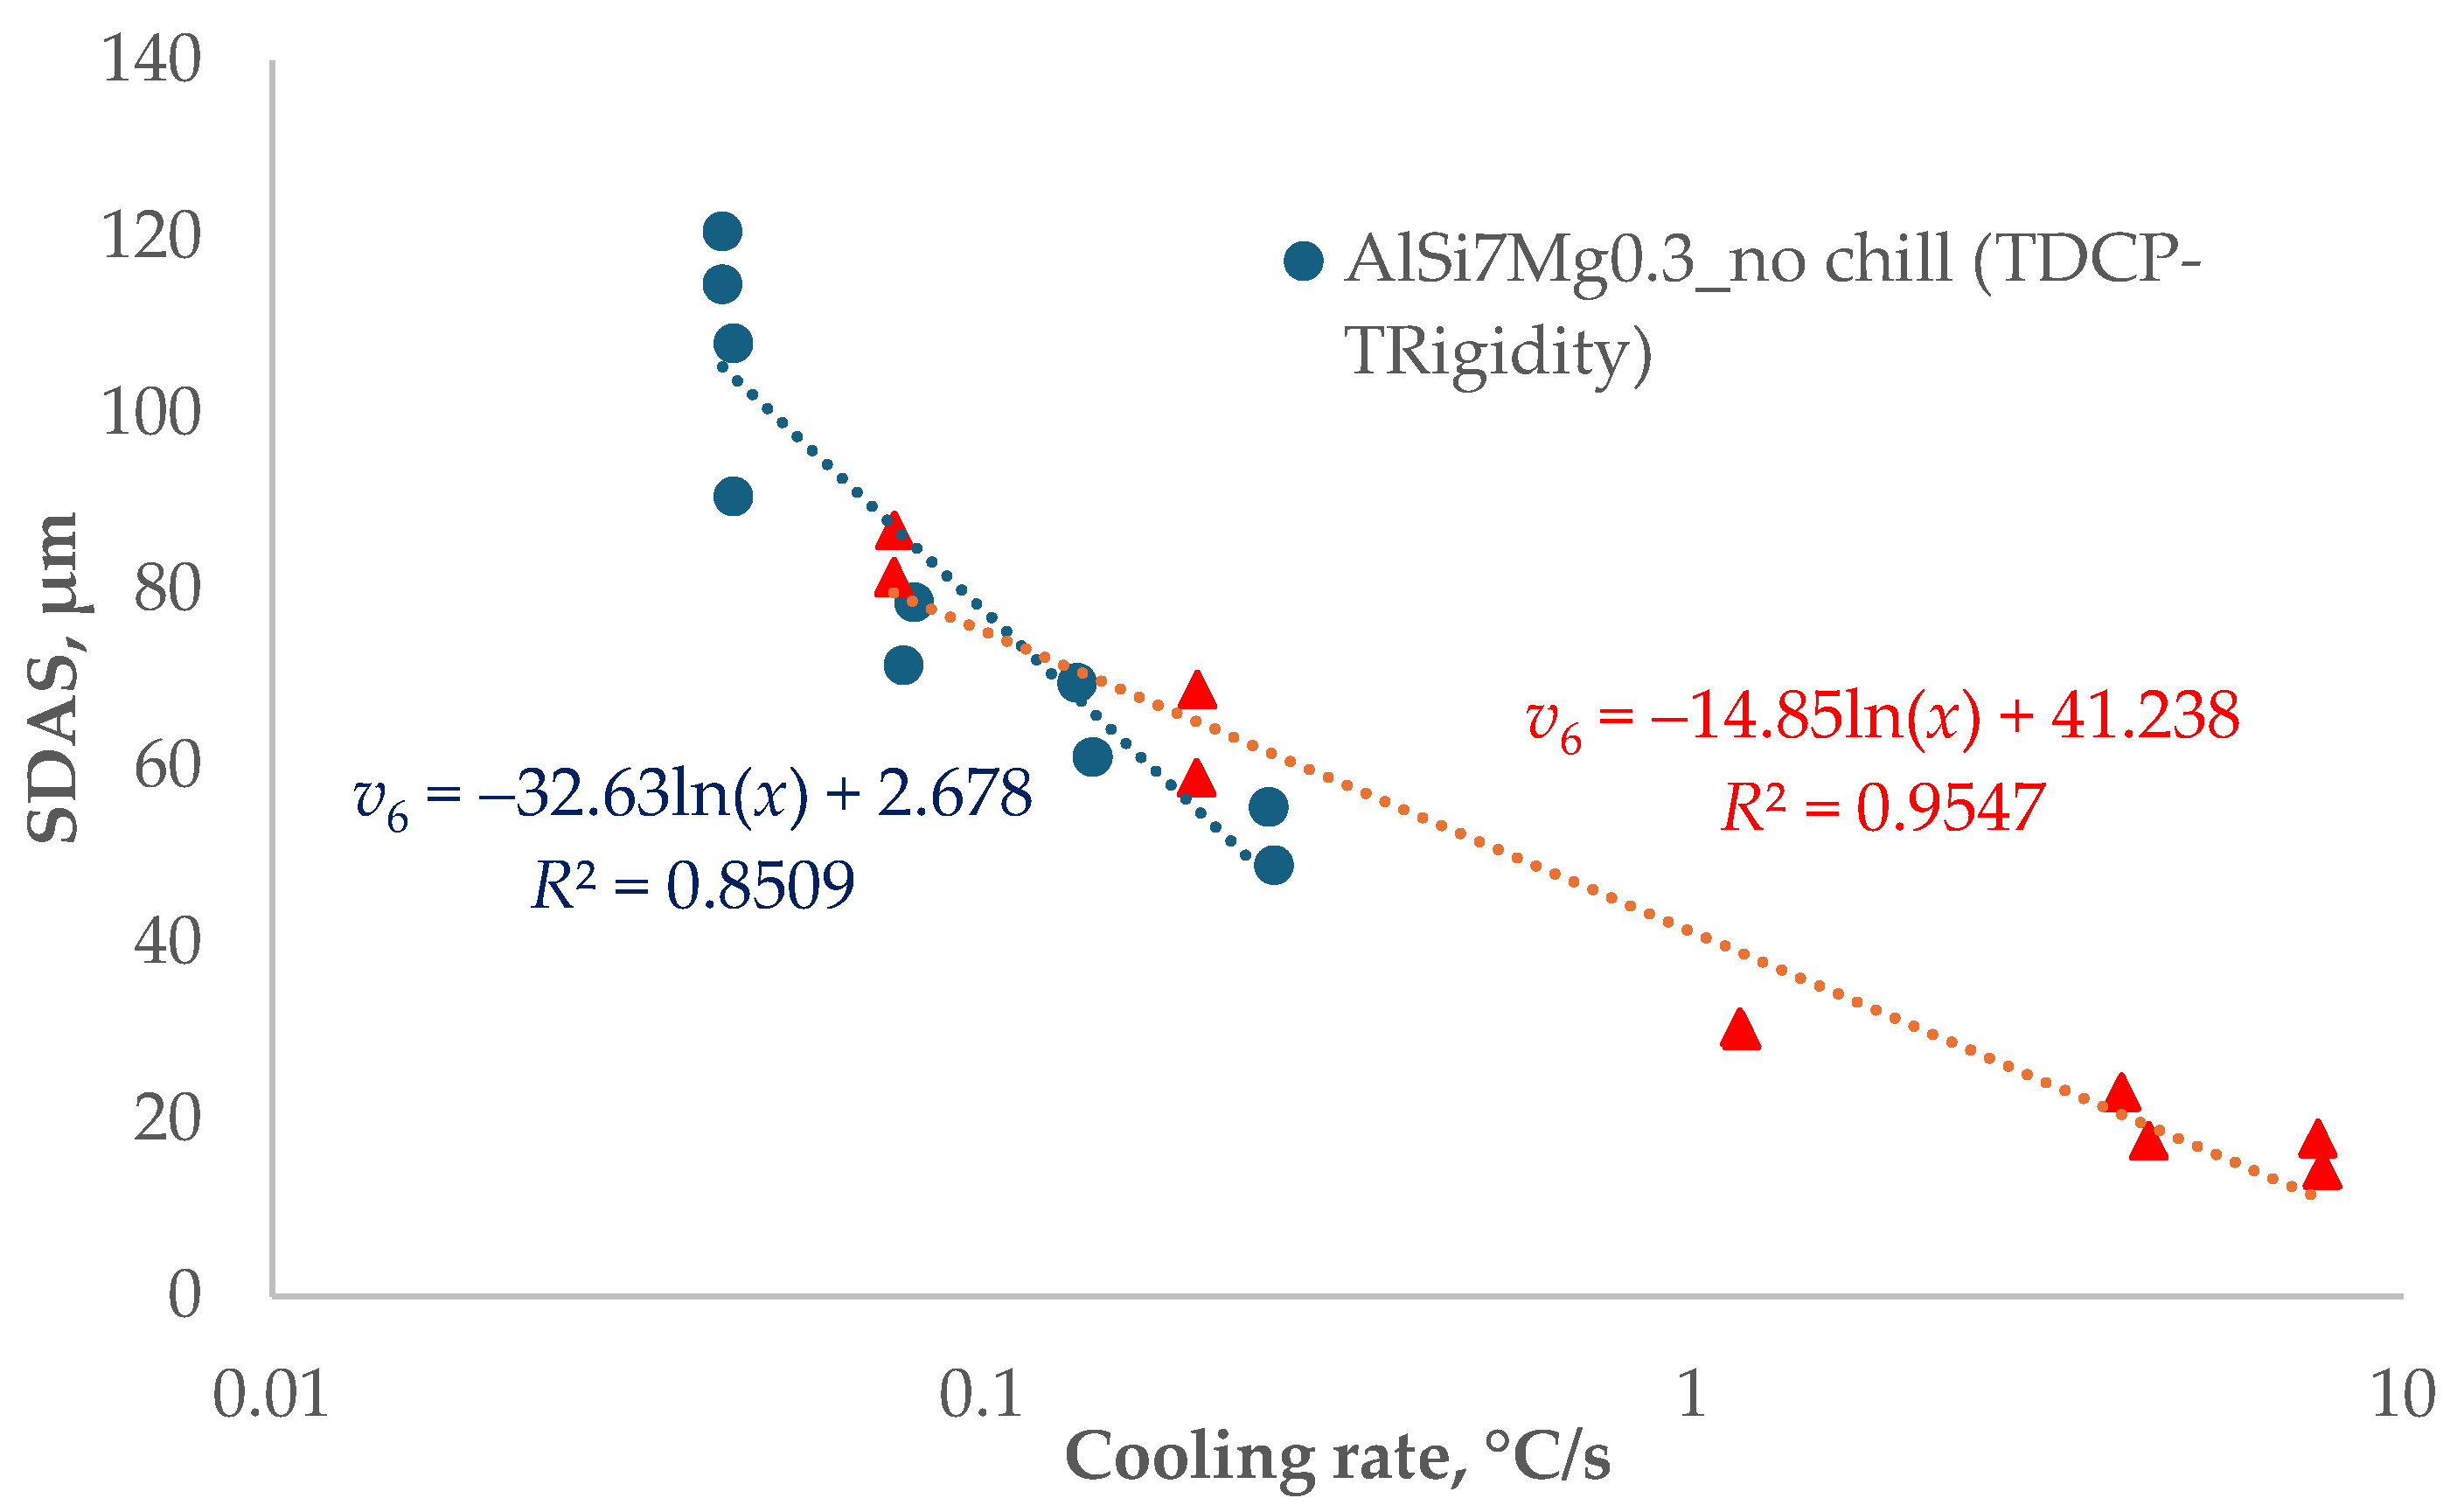
To systematically determine the most physically coherent and statistically accurate cooling rate parameter for predicting the SDAS, the solidification behavior of the AlSi7 Mg0.3 alloy was evaluated under both standard and highly accelerated thermal regimes. Based on the recorded cooling curves within the optimized dendritic growth interval between the Dendrite Coherency Point and the Rigidity Temperature (TDCP − TRigidity), the characteristic cooling rates (°C/s) and the corresponding metallographically measured SDAS values (µm) were plotted on a semi-logarithmic scale for both the baseline sand mold configuration (no chill) and the accelerated cast iron insert configuration (with chill), as illustrated in Figure 3.
Figure 3.
The SDAS as a function of the optimized characteristic cooling rate (v6) for the AlSi7 Mg0.3 alloy under non-isothermal (no chill) and accelerated (with Chill) solidification conditions.
The empirical relationships for both solidification regimes were mathematically modeled using logarithmic regression equations, and their predictive performance was quantified via the coefficient of determination (R2). To provide a comprehensive and continuous overview of the extracted thermodynamic parameters, localized cooling times, and calculated cooling rates across all ten thermocouple positions, the complete experimental dataset for the baseline non-isothermal setup is presented in Table 2a,b. In contrast, the corresponding high-velocity dataset for the accelerated casting configuration utilizing the chill insert is detailed in Table 3a,b.
Table 2.
(a) Characteristic solidification temperatures (°C) and corresponding times (s) recorded across the ten thermocouple positions (TC1 to TC10) under non-isothermal conditions (no chill insert applied). (b) Calculated cooling rates (°C/s) for the six investigated thermal intervals and the corresponding metallurgically measured SDAS (µm) (without chill insert).
Table 3.
(a) Characteristic solidification temperatures (°C) and corresponding times (s) recorded across the ten thermocouple positions (TC1 to TC10) under non-isothermal conditions (with chill insert applied). (b) Calculated cooling rates (°C/s) for the six investigated thermal intervals and the corresponding metallurgically measured SDAS (µm) (with chill insert).
3.2. Limitations of Conventional Fixed-Temperature Intervals
The models utilizing fixed reference temperatures, such as a constant start temperature of 620 °C or the liquidus temperature (TLiq) exhibit lower statistical correlations than the optimized growth window. To systematically evaluate these limitations without overcomplicating the graphical presentation, logarithmic regression analysis was performed on all six calculated thermal intervals using the datasets compiled in Table 2b and Table 3b. For the baseline slow solidification regime (no chill), the interval defined from 620 °C to the Al–Si eutectic reaction point () yielded an R2 of only 0.7609, while the interval from TLiq to yielded an R2 of 0.7558. A matching statistical decay was observed in the accelerated regime (with chill), where these broad conventional boundaries consistently failed to exceed an R2 threshold of 0.78, indicating a general lack of predictive accuracy across widely varying cooling rates.
Since the coefficient of determination alone does not fully characterize predictive performance, the six thermal intervals were additionally compared using error-based metrics and a resampling criterion. For each interval and both solidification regimes, the power-law model given by Equation (1) was fitted by linear regression in logarithmic coordinates, and the resulting parameters were evaluated in terms of the root mean square error (RMSE), the mean absolute error (MAE), the mean absolute percentage error (MAPE), the 95% confidence interval of the growth exponent n, and a leave-one-out cross-validation error (LOO-RMSE). Leave-one-out resampling was selected because it is the appropriate validation scheme for the present sample size of ten thermocouple positions per regime. All error metrics are expressed on the original SDAS scale in µm. The complete comparison is summarized in Table 4. It should be noted that Figure 3, the Abstract, and the Conclusions describe the TDCP − TRigidity relationship using a simplified logarithmic regression (SDAS = aln(v) + b), selected for clarity of graphical presentation, whereas Table 4 reports the parameters of the classical power-law model Equation (1) fitted to the same underlying data. The two formulations describe the same physical trend but yield different, non-comparable coefficients and R2 values by construction, and should not be interpreted as conflicting results.
Table 4.
Power-law regression parameters and predictive performance metrics for the six investigated thermal intervals across both solidification regimes.
The error-based metrics confirm the ranking obtained from R2 and provide a considerably stronger basis for discriminating between the competing interval definitions. In the baseline regime, the localized TDCP − TRigidity window (v6) yields the lowest prediction error of all six intervals, with RMSE = 8.30 µm and MAE = 6.89 µm, compared with RMSE values of 11.41–12.09 µm for the three intervals terminating at the Al–Si eutectic temperature. The same ordering is reproduced in the accelerated regime, where v6 again returns the lowest errors (RMSE = 3.55 µm, MAE = 2.70 µm) despite the cooling rates being roughly two orders of magnitude higher.
The cross-validation results are particularly informative, since they quantify predictive rather than descriptive performance. For the baseline regime, the LOO-RMSE of the optimized interval is 10.28 µm, whereas the conventional broad intervals reach up to 14.70 µm, corresponding to approximately a 30% larger out-of-sample prediction error. The corresponding values for the accelerated regime are 4.46 µm and up to 5.66 µm. The relative ranking of the intervals is therefore preserved under resampling, indicating that the advantage of the localized window is not an artifact of overfitting the ten available positions.
The confidence intervals of the growth exponent show the same tendency. The narrowest interval is obtained for v6 in both regimes (±0.108 and ±0.041, respectively), while the widest values are observed for v5 and v1 in the baseline regime (±0.136 and ±0.123). The exponent is therefore estimated most stably when the thermal interval is restricted to the dendritic growth window, which is consistent with the interpretation that this window isolates the period during which the secondary arms actually evolve. Residuals were examined for systematic trends, and none was detected; the deviations are distributed without a discernible dependence on cooling rate in either regime.
It should be noted that the six regressions are not statistically independent, since they are all derived from the same set of ten SDAS measurements per regime and differ only in the definition of the thermal interval over which the cooling rate is calculated. The metrics reported in Table 4 should therefore be interpreted as a relative comparison between competing interval definitions applied to a common dataset, rather than as independent validations obtained from separate experiments.
From a metallurgical perspective, these conventional approaches introduce significant mathematical “noise” into the derivation of the cooling rate. In the early stages of solidification (immediately below the liquidus line and before the dendrite network impinges), the primary α-Aluminum phase nuclei float freely within the remaining liquid melt. During this fluidic stage, individual dendrites do not influence one another’s growth kinetics, meaning that the structural development and competitive coarsening of secondary dendrite arms have not yet initiated. Consequently, integrating the thermal history of this pre-coherency liquid window artificially increases the solidification time frame, diluting the calculated cooling rate and weakening the model’s predictive capability.
Similarly, boundaries extending down to the final Al–Si eutectic temperature () capture the broad thermal plateau associated with the main eutectic reaction. Since the eutectic phase changes occur at a nearly constant temperature and involve a distinct nucleation mechanism (co-precipitation of aluminum and silicon flakes), this thermal energy does not influence the geometry or spacing of the primary aluminum dendrites. The primary dendritic skeleton is established before this phase, so the thermal energy of the eutectic reaction is an analytical artifact in calculating the kinetic cooling rate that governs SDAS.
3.3. Quantitative Analysis of Thermodynamic Data Anomalies
The detailed thermodynamic data presented in Table 2a,b highlight why traditional global intervals lead to localized calculation errors, particularly at positions TC2 and TC6.
At position TC2, the cooling rate calculated over the broad liquidus-to-eutectic interval (v3 = 0.2186 °C/s) is disproportionately low relative to its neighbor TC1 (v3 = 0.3381 °C/s): the calculated rate drops by approximately 35%, whereas the measured SDAS increases by only 13% (from 48.80 µm at TC1 to 55.40 µm at TC2). When the true dendritic window is isolated (v6, between TDCP and TRigidity. The corresponding rates are 0.2574 °C/s at TC1 and 0.2529 °C/s at TC2, a difference of less than 2%, which is far more consistent with the modest structural change actually measured. The same interval also correctly reproduces the reduction in SDAS from 61.10 µm at TC3 to 55.40 µm at TC2.
A similar anomaly occurs at position TC6, where the broad interval cooling rate (v1 = 0.0466 °C/s) matches the much slower cooling rate at position TC7 (v1 = 0.0466 °C/s), despite TC6 having a significantly finer SDAS (78.62 µm versus 90.64 µm). By deploying the optimized dendritic growth interval, the calculated cooling rate for TC6 increases to 0.0801 °C/s, while TC7 drops to 0.0446 °C/s.
A prominent calculation discrepancy is also observed under the accelerated solidification regime (Table 3b) at position TC4. Metallographic measurements indicate that position TC4 possesses a highly refined SDAS of 17.60 µm, which is finer not only than that of position TC3 (23.10 µm) but also than that of position TC2 (17.90 µm), even though TC2 lies closer to the chill. However, evaluating the cooling kinetics via the conventional broad liquidus-to-eutectic interval (v3) yields a cooling rate of 2.791 °C/s for TC4, which is lower than the 4.194 °C/s calculated for TC3. This inverse thermodynamic trend fails to justify the physical refinement of the dendrites. In sharp contrast, restricting the analysis to the true dendritic growth window yields an optimized cooling rate (v6) of 4.388 °C/s for position TC4, exceeding the v6 rate for position TC3 (4.017 °C/s). This accurate mathematical correction perfectly aligns with the measured structural refinement.
A further apparent inconsistency is observed at the chill contact end of the accelerated regime, involving positions TC1 and TC2. Position TC1, located closest to the chill, exhibits a finer structure (SDAS = 14.3 µm) than TC2 (17.9 µm), which is physically consistent with its greater proximity to the heat-extracting surface. However, when the cooling rate is evaluated over the conventional 620 °C interval, TC1 yields v1 = 6.330 °C/s, compared with v1 = 8.893 °C/s at TC2, indicating that the finer structure corresponds to the slower cooling rate. This artifact arises because the broad interval at TC1 includes the initial period of extremely steep heat extraction immediately after mold filling, before the dendritic network has formed, and averaging the cooling rate over this period distorts the derived value. When the analysis is restricted to the TDCP − TRigidity window, the physically consistent ordering is restored: v6= 7.698 °C/s at TC1, compared with v6 = 7.592 °C/s at TC2. A rigorous decoupling of the local thermal gradient (G) from the solidification front velocity (V) would require directional solidification experiments with independently controlled G and V, which the wedge casting geometry employed here does not permit; this remains a limitation of the present analysis.
These localized discrepancies provide clear evidence that broad, nonspecific solidification intervals fail to capture the actual thermal kinetics that drive the local mushy zone. By limiting the thermal calculations strictly to the TDCP − TRigidity interval, the model automatically accounts for localized changes in solute redistribution and dendritic impingement, successfully eliminating analytical anomalies.
3.4. Validation of the Kinetic Window and Thermal Regime Effects
The integration of accelerated solidification data via the cast iron chill insert expands the predictive capability of the developed model over a comprehensive range of thermal gradients. As illustrated in Figure 3, the characteristic cooling rate (v6), calculated strictly within the localized TDCP − TRigidity interval, maintains an exceptionally high statistical reliability under both solidification regimes. The logarithmic regression model for the accelerated setup yielded an outstanding coefficient of determination (R2 = 0.9547), expressed by the trendline equation: y = −14.85ln(x) + 41.238.
A comparative metallurgical analysis between the two thermal regimes reveals a distinct transition in dendritic growth kinetics. In the lower-cooling-rate spectrum (no chill, v6 < 0.37 °C/s), the solidification kinetics allow sufficient time for extensive solute redistribution and competitive coarsening (coalescence) of secondary arms, resulting in a steep structural response to changes in cooling rate (slope coefficient of −32.63). Conversely, under the highly accelerated thermal regime imposed by the chill insert (with chill, R2 = 0.8509 is significantly elevated), the slope coefficient flattens remarkably to −14.85.
This structural stabilization at high solidification rates is governed by the dominance of thermal undercooling over constitutional undercooling. At rapid cooling rates, the local solidification timescale shrinks to mere seconds, thereby mathematically restricting the diffusion distance available to alloying elements. The extreme thermal shock suppresses the competitive ripening mechanism in the arms, forcing the system toward a structural saturation limit, where the final SDAS values stabilize within a highly refined range of 15–25 µm.
This mechanistic interpretation is further supported by the local solidification time available for solute redistribution within the TDCP − TRigidity interval. In the baseline (no chill) configuration, this interval extends from approximately 179.1 s at TC1 to more than 1000 s at TC10. In contrast, under the accelerated (with chill) configuration, it is reduced to approximately 5.3 s at TC1 and to just over 500 s at TC10 across the same casting profile.
Using a representative liquid-state diffusion coefficient for solute species such as magnesium and silicon in molten aluminum (D ≈ 10−9–10−8 m2/s [13]), the characteristic diffusion distance () [14,15]) available for lateral arm coarsening decreases by a factor of nearly six between the two regimes, driven by a 34-fold collapse in the local solidification timeframe at the casting base. This extreme kinetic restriction at position TC1 suppresses secondary arm ripening; a comparable refinement of the eutectic silicon morphology under rapid solidification is expected on the basis of established solidification theory [14,15], although this was not independently quantified in the present study and remains to be verified metallographically. Furthermore, the thermodynamic data reveal a sharp cooling asymmetry along the wedge profile. At the same time, the cast iron insert accelerates solidification by an order of magnitude at the baseline (TC1), its quenching efficiency predictably decays toward the top (TC10), where the local timeframe is only halved from 1139 s to 515.2 s. This substantial reduction in diffusion distance at the chill interface directly impedes the coalescence of adjacent secondary arms, providing a quantitative, physically grounded explanation for the markedly flatter slope coefficient (−14.85) observed under accelerated solidification, compared with the steeper baseline slope (−32.63). The seamless mathematical alignment between the two regimes confirms that isolating the thermal history within the true dendritic mushy zone window provides a robust microstructural prediction tool for the AlSi7 Mg0.3 alloy and casting conditions investigated in this study.
4. Conclusions
In this study, a novel methodological approach was developed to evaluate the statistical and physical correlations between various solidification cooling-rate intervals (v) and the resulting SDAS in a primary hypoeutectic AlSi7 Mg0.3 alloy. Based on computer-aided cooling curve TA and quantitative metallography across a wide thermal gradient, the following main conclusions can be drawn:
Inadequacy of global intervals: Conventional fixed-temperature intervals, such as those calculated from a constant 620 °C threshold or the liquidus temperature down to the eutectic reaction point, yield lower predictive accuracy (R2 ≈ 0.75–0.76) during slow solidification. These broad ranges include non-contributing fluidic stages and the final eutectic plateau, which introduce mathematical noise and fail to capture the actual kinetic timescale of secondary dendritic growth.
Superiority of the TDCP − TRigidity window: The localized thermal interval bounded by the TDCP and the TRigidity was mathematically validated as a highly accurate predictor of microstructural refinement under the conditions investigated herein. It achieved a strong correlation for the baseline slow-cooling regime (R2 = 0.8509) and an exceptional correlation for the accelerated solidification regime with the chill insert (R2 = 0.9547), proving that isolating the true mushy-zone kinetics works reliably across widely different cooling rates. This superiority was independently confirmed by RMSE, MAE, and leave-one-out cross-validation metrics (Table 4).
Resolution of localized anomalies: Calculating the characteristic cooling rate (v6) within the TDCP − TRigidity window effectively eliminates analytical discrepancies along the casting profile (such as those observed at positions TC2 and TC6). This confirms that isolating the true mushy zone kinetics provides a highly reliable reflection of local microstructural evolution.
Metallurgical significance: The statistical excellence of the optimized model aligns perfectly with the physics of solidification. It isolates the exact window between the physical impingement of the primary dendritic network (TDCP), which initiates intensive secondary branching via constitutional undercooling, and the final structural stabilization (TRigidity), where mass transport is kinetically suppressed.
Diffusion kinetics and structural transformation: The 34-fold collapse in the local solidification timeframe at the chill base restricts the characteristic solute-diffusion distance () by a factor of nearly six. This mechanism provides a quantitative, physically grounded explanation for the markedly flatter SDAS coarsening slope under accelerated cooling (−14.85) compared to the baseline regime (−32.63). A concurrent refinement of the eutectic silicon morphology is anticipated under these conditions but was not directly measured in this study and requires separate metallographic verification.
Scope and preliminary evidence of broader applicability: The present validation is restricted to the AlSi7 Mg0.3 alloy, the wedge geometry investigated, and the two solidification regimes examined here (with and without a chill insert). Preliminary analyses of two further alloys, AlSi7 MgCu0.5 and AlSi10 MnMg, indicate that the same TDCP − TRigidity interval provides the strongest correlation with SDAS in those systems as well; these results are the subject of a separate manuscript currently in preparation. A systematic validation across a wider range of alloy compositions, casting dimensions, and cooling conditions remains necessary before the proposed interval can be regarded as a general design tool for foundry practice.
The methodology demonstrated in this paper establishes a physically grounded, highly accurate predictive tool. This robust framework is recommended for integration into advanced foundry casting simulations to significantly enhance the accuracy of local microstructural and property predictions in Al–Si components.
Author Contributions
Conceptualization, M.B.D. and S.M.; methodology, M.B.D. and S.M.; software, M.B.D., S.M. and P.N.; validation, M.B.D. and S.M.; formal analysis, M.B.D., S.M. and P.N.; investigation, M.B.D., S.M. and P.N.; resources, M.B.D., S.M. and P.N.; data curation, M.B.D. and S.M.; writing—original draft preparation, M.B.D.; writing—review and editing, S.M.; visualization, M.B.D. and S.M.; supervision, M.B.D. and S.M.; project administration, S.M. All authors have read and agreed to the published version of the manuscript.
Funding
This research received no external funding.
Data Availability Statement
The original contributions presented in this study are included in the article. Further inquiries can be directed to the corresponding author.
Acknowledgments
This research has been financially supported by the Ministry of Science, Technological Development, and Innovation of the Republic of Serbia (Contract No: 451-03-33/2026-03/200066).
Conflicts of Interest
Authors Srecko Manasijevic and Predrag Nikolic were employed by the company Lola Institute Ltd. The remaining authors declare that the research was conducted without any commercial or financial relationships that could be construed as potential conflicts of interest.
References
- AMS Handbook. Casting; AMS International: Cleveland, OH, USA, 1988; Volume 15, ISBN 0-87170-007-7. [Google Scholar]
- Davis, J.R. (Ed.) Aluminum and Aluminum Alloys; ASM International: Cleaveland, OH, USA, 1993. [Google Scholar]
- Kaufman, J.G.; Rooy, E.L. Aluminum Alloy Castings: Properties, Processes, and Applications; ASM International: Cleaveland, OH, USA, 2004. [Google Scholar]
- Altenpohl, D.G. Aluminum: Technology, Applications, and Environment, 6th ed.; The Aluminum Association Inc.: Arlington, VA, USA; TMS: Pittsburgh, PA, USA, 1998. [Google Scholar]
- Robles Hernández, F.C.; Herrera Ramírez, J.M.; Mackay, R. Al-Si Alloys. Automotive, Aeronautical, and Aerospace Applications; Springer International Publishing AG: Cham, Switzerland, 2017. [Google Scholar]
- Spear, R.E.; Gardner, G.R. Dendrite cell size. AFS Trans. 1963, 71, 209–215. [Google Scholar]
- Shabani, M.O.; Mazahery, A. Prediction of Mechanical Properties of Cast A356 Alloy as a Function of Microstructure and Cooling Rate. Arch. Metall. Mater. 2000, 56, 671–675. [Google Scholar]
- Easton, M.; Davidson, C.; St John, D. Effect of Alloy Composition on the Dendrite Arm Spacing of Multicomponent Aluminum Alloys. Metall. Mater. Trans. A 2010, 41, 1528–1538. [Google Scholar] [CrossRef] [Scilit]
- Djurdjevic, B.M.; Pavlovic, J.; Byczynski, G. The impact of major alloying elements and refiner on the SDAS of Al-Si-Cu alloy. Prakt. Metallogr. 2009, 46, 97–114. [Google Scholar] [CrossRef] [Scilit]
- Huber, G.; Djurdjevic, B.M.; Manasijevic, S. Quantification of feeding regions of hypoeutectic Al-Si (5_7_9 wt.%)-Cu (0–4 wt.%) alloys using cooling curve analysis. In Mass Production Processes; Akdogan, A., Vanli, A.S., Eds.; IntechOpen: London, UK, 2019; pp. 1–16. [Google Scholar]
- Chai, G.; Bäckerud, L.; Rolland, T.; Arnberg, L. Dendrite Coherency during Equiaxed Solidification in Binary Aluminum Alloys. Metall. Mater. Trans. A 1995, 26, 965–970. [Google Scholar]
- Djurdjevic, B.M.; Huber, G. Determination of Rigidity Point/Temperature using Thermal Analysis Method and Mechanical Technique. J. Alloys Compd. 2014, 590, 500–506. [Google Scholar] [CrossRef] [Scilit]
- Du, Y.; Chang, Y.; Huang, B.; Gong, W.; Jin Zh Xu, H.; Yuan, Z.; Liu, Y.; He, Y.; Xie, F.Y. Diffusion coefficients of some solutes in fcc and liquid Al: Critical evaluation and correlation. Mater. Sci. Eng. 2003, 363, 140–151. [Google Scholar] [CrossRef] [Scilit]
- Flemings, C.M. Solidification Processing; McGraw-Hill: New York, NY, USA, 1974; ISBN 007021283X. [Google Scholar]
- Kurz, W.; Fisher, D.J. Fundamentals of Solidification, 3rd ed.; Trans Tech Publications: Wollerau, Switzerland; CRC Press: Boca Raton, FL, USA, 1998; ISBN 100878498044. [Google Scholar]

Disclaimer/Publisher’s Note: The statements, opinions and data contained in all publications are solely those of the individual author(s) and contributor(s) and not of MDPI and/or the editor(s). MDPI and/or the editor(s) disclaim responsibility for any injury to people or property resulting from any ideas, methods, instructions or products referred to in the content. |
© 2026 by the authors. Licensee MDPI, Basel, Switzerland. This article is an open access article distributed under the terms and conditions of the Creative Commons Attribution (CC BY) license.