


Abstract
This study investigated the relationship between fracture toughness (Kc) and energy release rate (Gc) through fracture morphology analysis, emphasizing the critical role of fractal dimensions in accurately characterizing fracture surfaces. Traditional linear elastic fracture mechanics (LEFM) models relate Gc to Kc by combining energy principles with the nominal area of the fracture surface. However, real materials often exhibit plasticity, and their fracture surfaces are not regular planes. To address these issues, this research applied fractal theory and introduced the concept of ubiquitiform surface area to refine the calculation of fracture surfaces, leading to more accurate estimates of Gc and Kc. The method was validated through standard compact tensile specimen tests on a nickel-based superalloy at 550 °C. Additionally, the analysis of fractal dimension differences and dispersion in various fracture regions provides a novel perspective for evaluating the fracture toughness of materials.
1. Introduction
Fracture toughness (KC) and energy release rate (GC) are fundamental properties that characterize a material’s resistance to crack propagation, serving as essential parameters for assessing structural reliability [1]. KC and GC have emerged as critical factors in the design of structural materials across various industries [2,3], including aerospace [4], transportation [5], and nuclear plants [6]. Consequently, numerous countries have developed standards for testing the plane strain fracture toughness and energy release rate of metallic materials, with ASTM E399 and ASTM D5045-99 being prominent examples [7,8].
In linear elasticity, the relationship between KC and GC is given by GC = K2C/E′, where E′ equals E under plane stress conditions, and E′ = E/(1 − v2) under plane strain conditions, with E and v representing the elastic modulus and Poisson’s ratio, respectively. The energy release rate GC, representing the energy dissipated per unit of crack surface area during propagation, is calculated as GC = Wt/A0, where W denotes the total applied load work, and A0 is the nominal crack area. However, significant challenges have arisen in the use of the above transformation relationships [9,10].
These challenges develop because the relationship is based on linear elasticity. For numerous materials, such as metals and plastics, describing their fracture behavior solely in terms of linear elasticity is inadequate. Several experimental results have demonstrated that the relationship between GC and KC does not align well with the previous equation [11,12]. Consequently, some experts have proposed that GC should be calculated using the true crack area rather than the nominal area [10,13]. This true fracture area can be determined not only from a precise 3D topographic map of the fracture but also by the fractal dimension of the fracture crack.
Fractal theory is used to assess the irregularities of fractured surfaces and delineate their intricacy. The pioneering work by Mandelbrot et al. [14] elucidated the correlation between the fractal attributes of impact fracture surfaces in metals and material toughness. Subsequent research has primarily focused on the relationship between the fractal dimensions of fracture surfaces and macroscopic mechanical properties, including tensile properties [15,16], fracture toughness [17,18,19,20], dynamic tearing energy [21,22,23], and fatigue life [24,25]. However, certain limitations of fractal theory have been identified during these studies. For instance, if the minimum scale selected during calculations approaches zero, the length of the irregular curve calculated using the fractal dimension becomes infinitely large, which is unrealistic.
To address these issues, Ou et al. [26,27] introduced constraints on the minimum scale to refine fractal theory, proposing the ubiquitiform theory. Building on this foundation, Yang et al. [28] utilized a combination of experimental and numerical simulation methods to investigate the ubiquitiformal fracture energy and crack extension of slate and granite, as well as the impact of heterogeneity on the characteristics of ubiquitiformal cracks. Shi et al. [29] proposed a method for GC measurement using fractal theory to correct the fracture area A0. However, the majority of studies on the fractal dimension of fractures [29,30,31,32,33,34] have primarily focused on describing the overall fractal properties of fracture surfaces. To date, there is a notable absence of research on the fractal dimensions of the plane stress fracture region and the plane strain fracture region, as well as their dispersion.
This paper proposes a modified method for assessing the relationship between KC and GC based on a three-dimensional topographic map of the fracture. The method is adjusted by computing the surface area of the fracture using fractal dimensions. Additionally, we investigated the fractal dimension of the region with different fracture forms and its dispersion. This paper is structured as follows: Section 2 presents the test methods for fracture toughness and related constraints, along with the calculation method for fractal dimension. Section 3 delineates the experimental materials, specimens, and testing procedures, while Section 4 discusses the analysis of the test results. Finally, Section 5 provides a summary of this study.
2. Methods
2.1. The Test Methods for Fracture Toughness and Related Constraints
The initial stage of the test involved specimen design. ASTM E399 offers various fracture toughness specimen types; therefore compact tensile (CT) specimens were selected. Stringent requirements regarding specimen dimensions for KIC testing, ensuring compliance with the plane strain conditions established by Brown et al. [35] and Sawley et al. [36], are presented in Equation (1).
where a0 represents the initial crack length, B stands for the specimen thickness, W represents the width of the specimen, KIC denotes the plane strain fracture toughness, and σy represents the yield strength of the specimen material under test conditions.
The second step involved prefabricating the crack and applying the load. Following the acquisition of force and CT specimen notch opening displacement data, known as the P-V curve, derived from linear elastic fracture mechanics, the conditional fracture toughness (KQ value) of the compact tension specimen was determined using Equations (2) and (3).
where Pq represents the critical load, and another criterion equation is introduced,
where Pmax denotes the maximum load. When these requirements (Equations (1) and (4)) are satisfied, the measured conditional fracture toughness value (KQ) from the test can be equated to the effective KIC.
2.2. Fractal Dimension Calculation Method
Fracture toughness specimens demonstrating fractal effects were analyzed using several methods to determine the fractal dimension. These methods encompassed the density correlation function method, transformation method, compass dimension, and box-counting dimension method. Among these, the box-counting dimension method is preferred for its high accuracy and straightforward implementation [37].
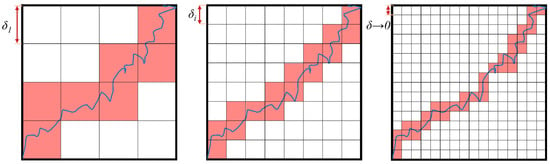
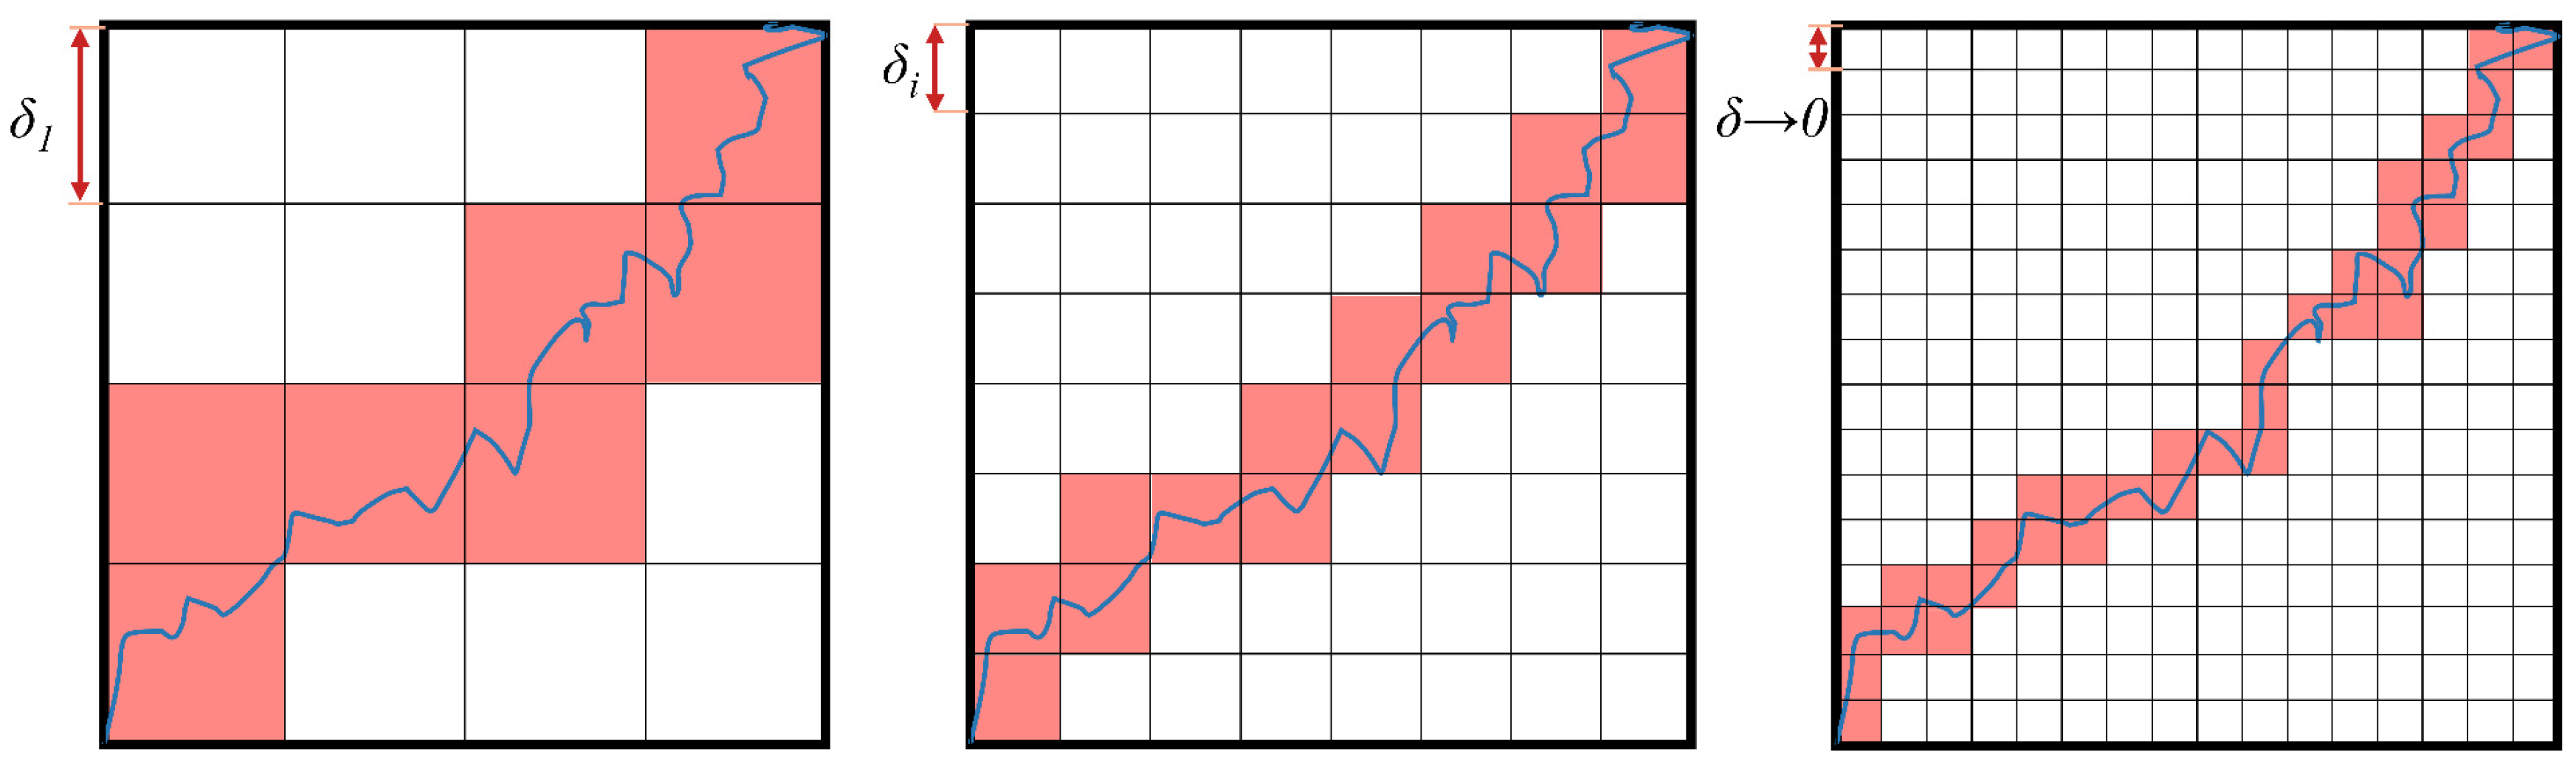
Figure 1 illustrates the principle of the box-counting dimension method. The procedure for determining the fractal dimension using this method is as follows: In a two-dimensional Euclidean space, the curve is examined by covering it with squares of side length δ1. The side length δ of the squares and the corresponding number of squares N(δ) follow a power law relationship N(δ)~δ−dF, where dF represents the fractal dimension. By systematically varying the square side length and recording the number of squares, a set of N(δi) and δi data is obtained. These data are logarithmically transformed, revealing a linear relationship among the discrete points (lnN(δi), lnδi). As δ → 0, the fractal dimension obtained through box counting can be expressed as Equation (5).
Figure 1.
Schematic diagram illustrating the principle of calculating the fractal dimension using the box-counting method.
Let l represent the nominal straight-line length of the two-dimensional crack growth curve, and let lF denote the corresponding fractal curve length, expressed as Equation (6).
However, as δ → 0, lF tends toward infinity, a scenario that clearly contradicts reality. In practice, physical objects undergo a finite process where δ → δmin is applicable to physical objects, where δmin represents the minimum square side length determined by the object’s properties [31,32]. This length is termed the ubiquitiform length luf, and its formula is given by Equation (7).
In this context, D represents the ubiquitiform complexity, which corresponds numerically to the fractal dimension dF of the object.
3. Experimental Section
3.1. Materials and Specimen
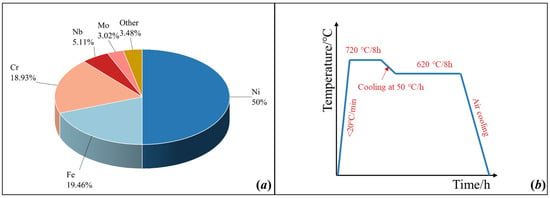
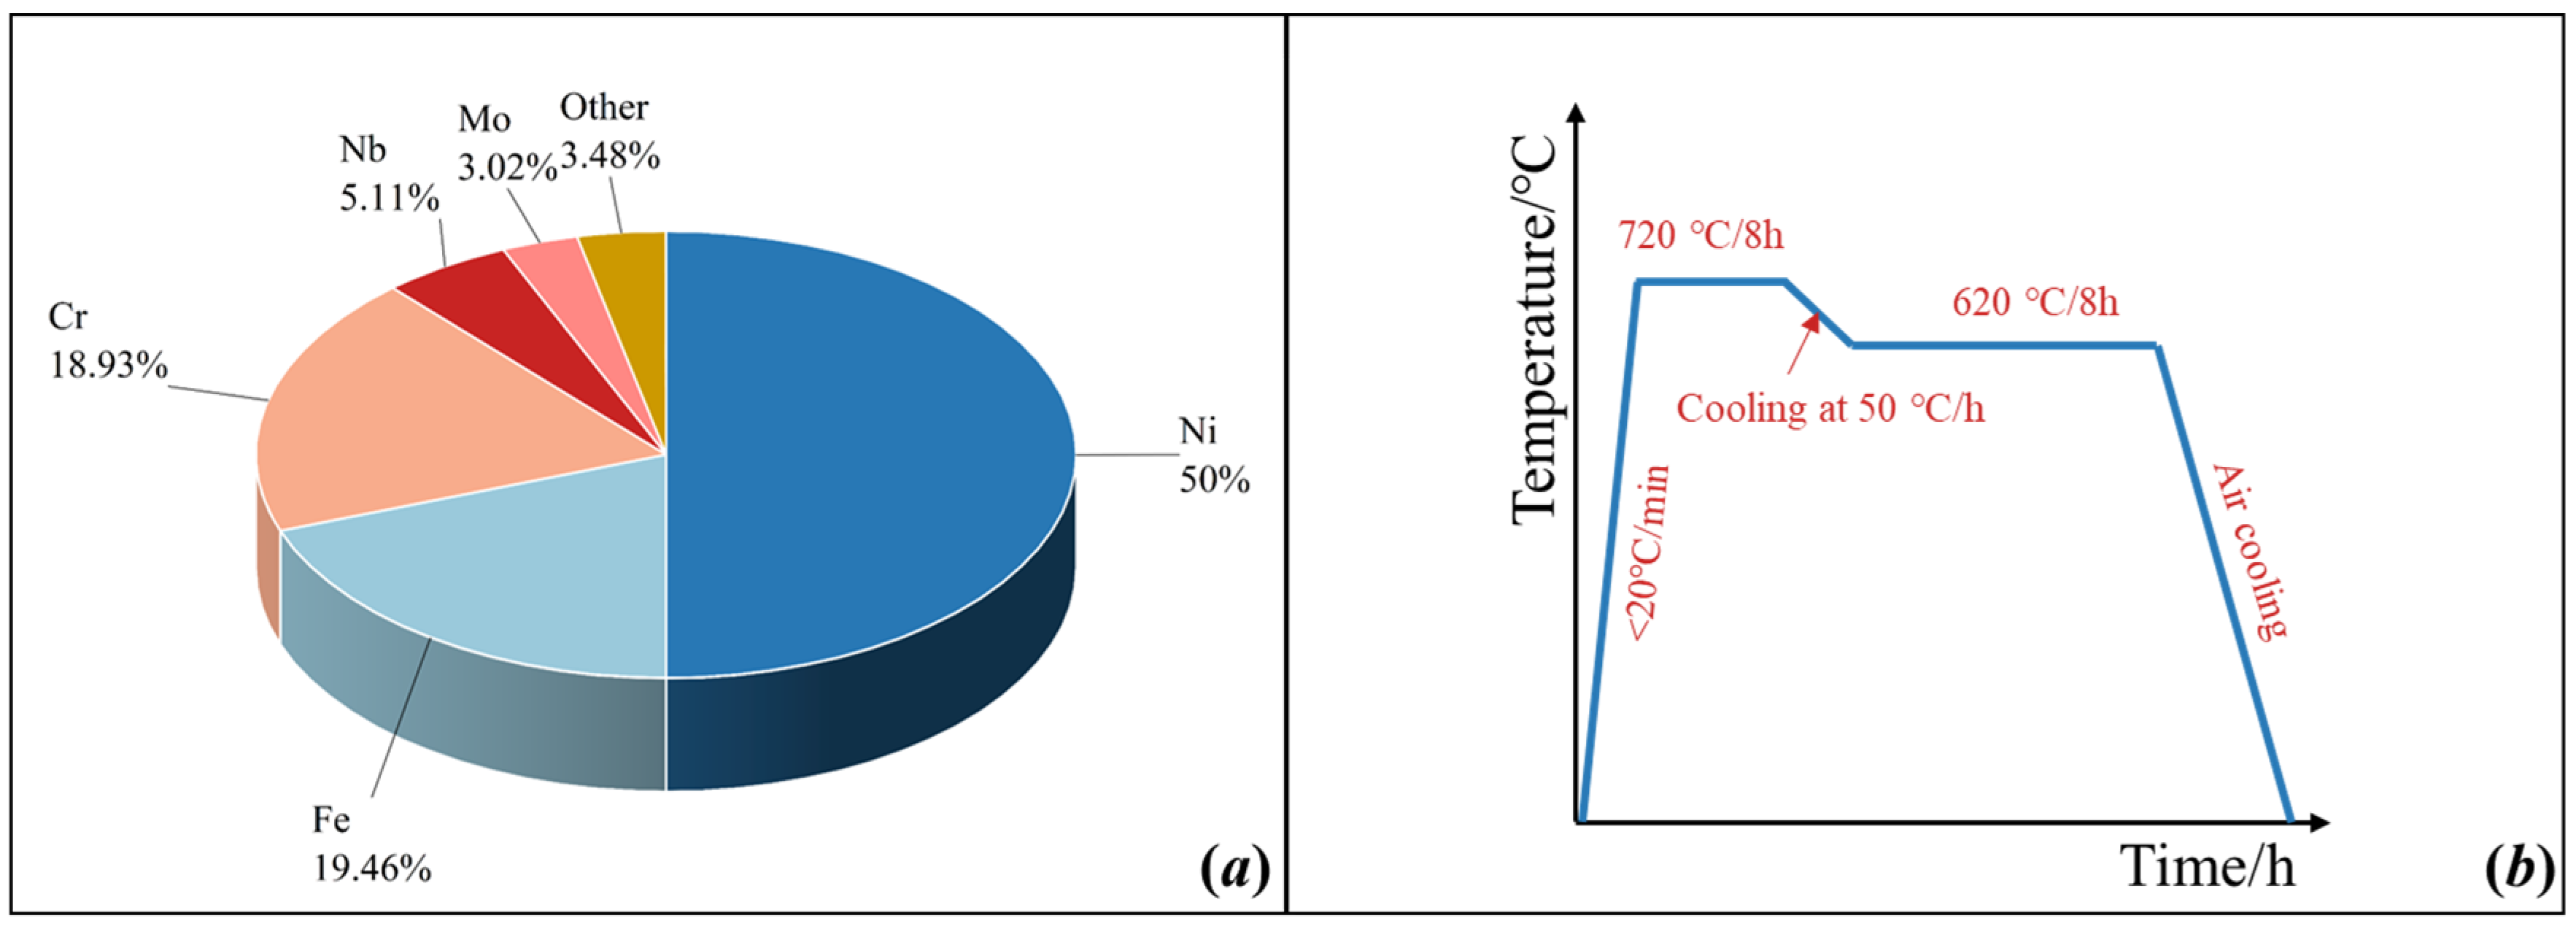
This study used GH4169 superalloy as the research subject because it exhibits good plasticity and is easily obtainable. Figure 2 illustrates the chemical composition of the superalloy used in this experiment. Solid solution and stable aging treatments are commonly used to regulate the grain size and mechanical properties of a material. The heat treatment process involved direct aging at 720 °C for 8 h, followed by a controlled cooling rate of 50 °C/h to 620 °C. Subsequently, the alloy was aged at 620 °C for 8 h and then air-cooled [38].
Figure 2.
Chemical composition and heat treatment of GH4169 test material: (a) chemical composition; (b) heat treatment method.
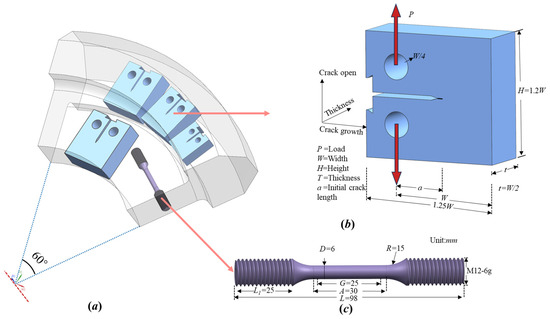
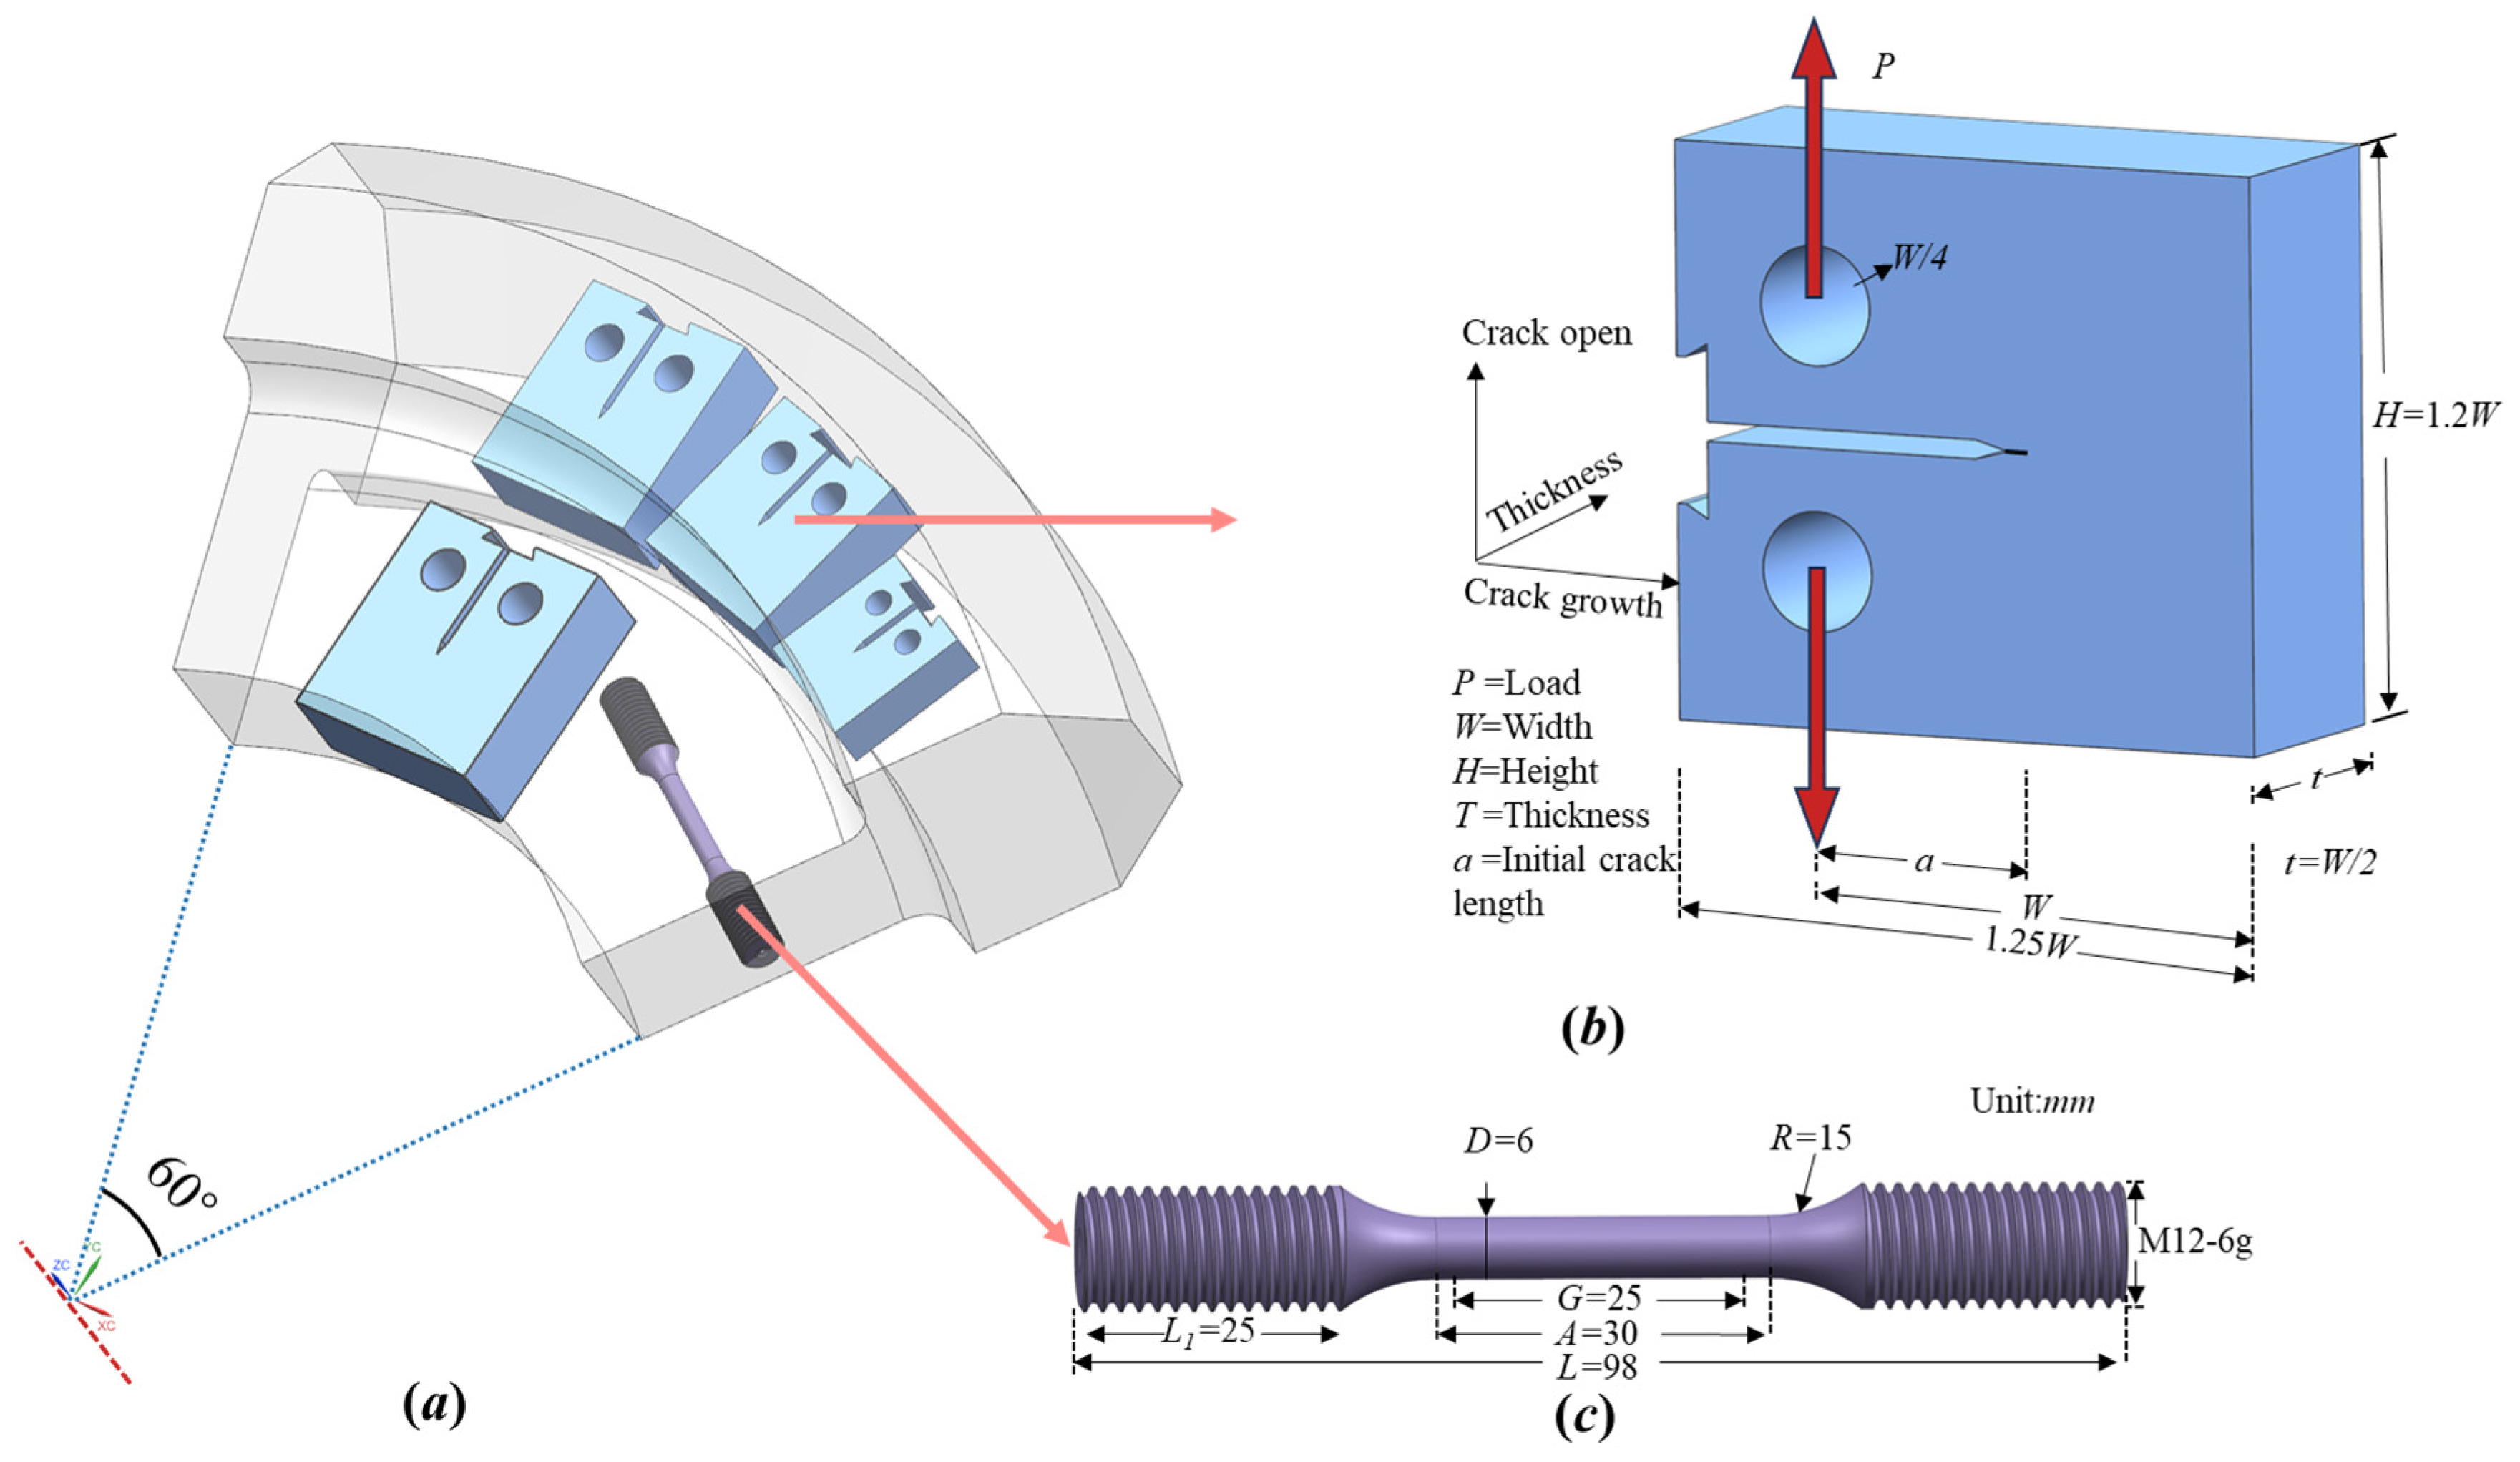
The specimen for the fracture toughness test was extracted from an authentic turbine disk, exhibiting a relatively uniform grain distribution, as depicted in Figure 3a. Following the ASTM E399 [7] standard, a CT specimen was used for this experiment, as illustrated in Figure 3b. The four specimens of different thicknesses were labeled R-15, R-20, R-22.5, and R-25, where R indicates radial crack propagation direction, and the number represents the specimen’s thickness. Essential mechanical properties, including yield strength, modulus of elasticity, and elongation, were obtained using a standard round bar specimen designed according to ASTM E8 [25] and tested at the same location as the turbine disk. Uniaxial tensile tests were performed with the tensile shaft oriented parallel to the loading direction of the fracture toughness test force, as shown in Figure 3c.
Figure 3.
Specimen size and sampling method: (a) sampling method; (b) fracture toughness specimen size; (c) constitutive specimen size.
3.2. Experiment Procedure
To better replicate the operational conditions of turbine disks, all experiments in this study were carried out at a temperature of 550 °C, consistent with the disk’s operating temperature. Initially, tensile tests [39] were performed using a universal testing machine, an extensometer, and a furnace. Data from force–displacement curves were collected and processed to derive stress–strain curves and associated tensile mechanical properties.
Subsequently, fracture toughness tests were conducted in two stages, employing a high-frequency fatigue testing machine for both stages. In the first stage, precracking of the specimen was performed at room temperature, with the precrack length on the surface set to approximately 0.5 times the specimen width (a = 0.5W).
The second stage comprised fracture toughness tensile tests. Initially, the compact tension specimen was heated in a furnace to the test temperature of 550 °C and maintained for 1.5 h. Subsequently, the specimen was subjected to tension until fracture, while recording load and crack mouth opening displacement, referred to as the P-V curve. The fracture toughness (KQ value) of the compact tension specimen was calculated using linear elastic fracture mechanics equations (Equations (2) and (3)).
The fracture surface of CT samples was examined using an ultra-depth-of-field three-dimensional microscope. This allowed for the acquisition of a 3D image of the fracture surface and corresponding point cloud data, facilitating the calculation of the fracture surface’s fractal dimension in the subsequent section.
4. Results and Discussion
4.1. Experiment Results
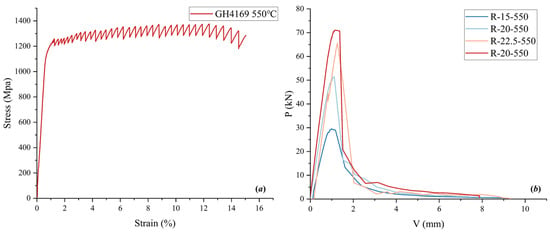
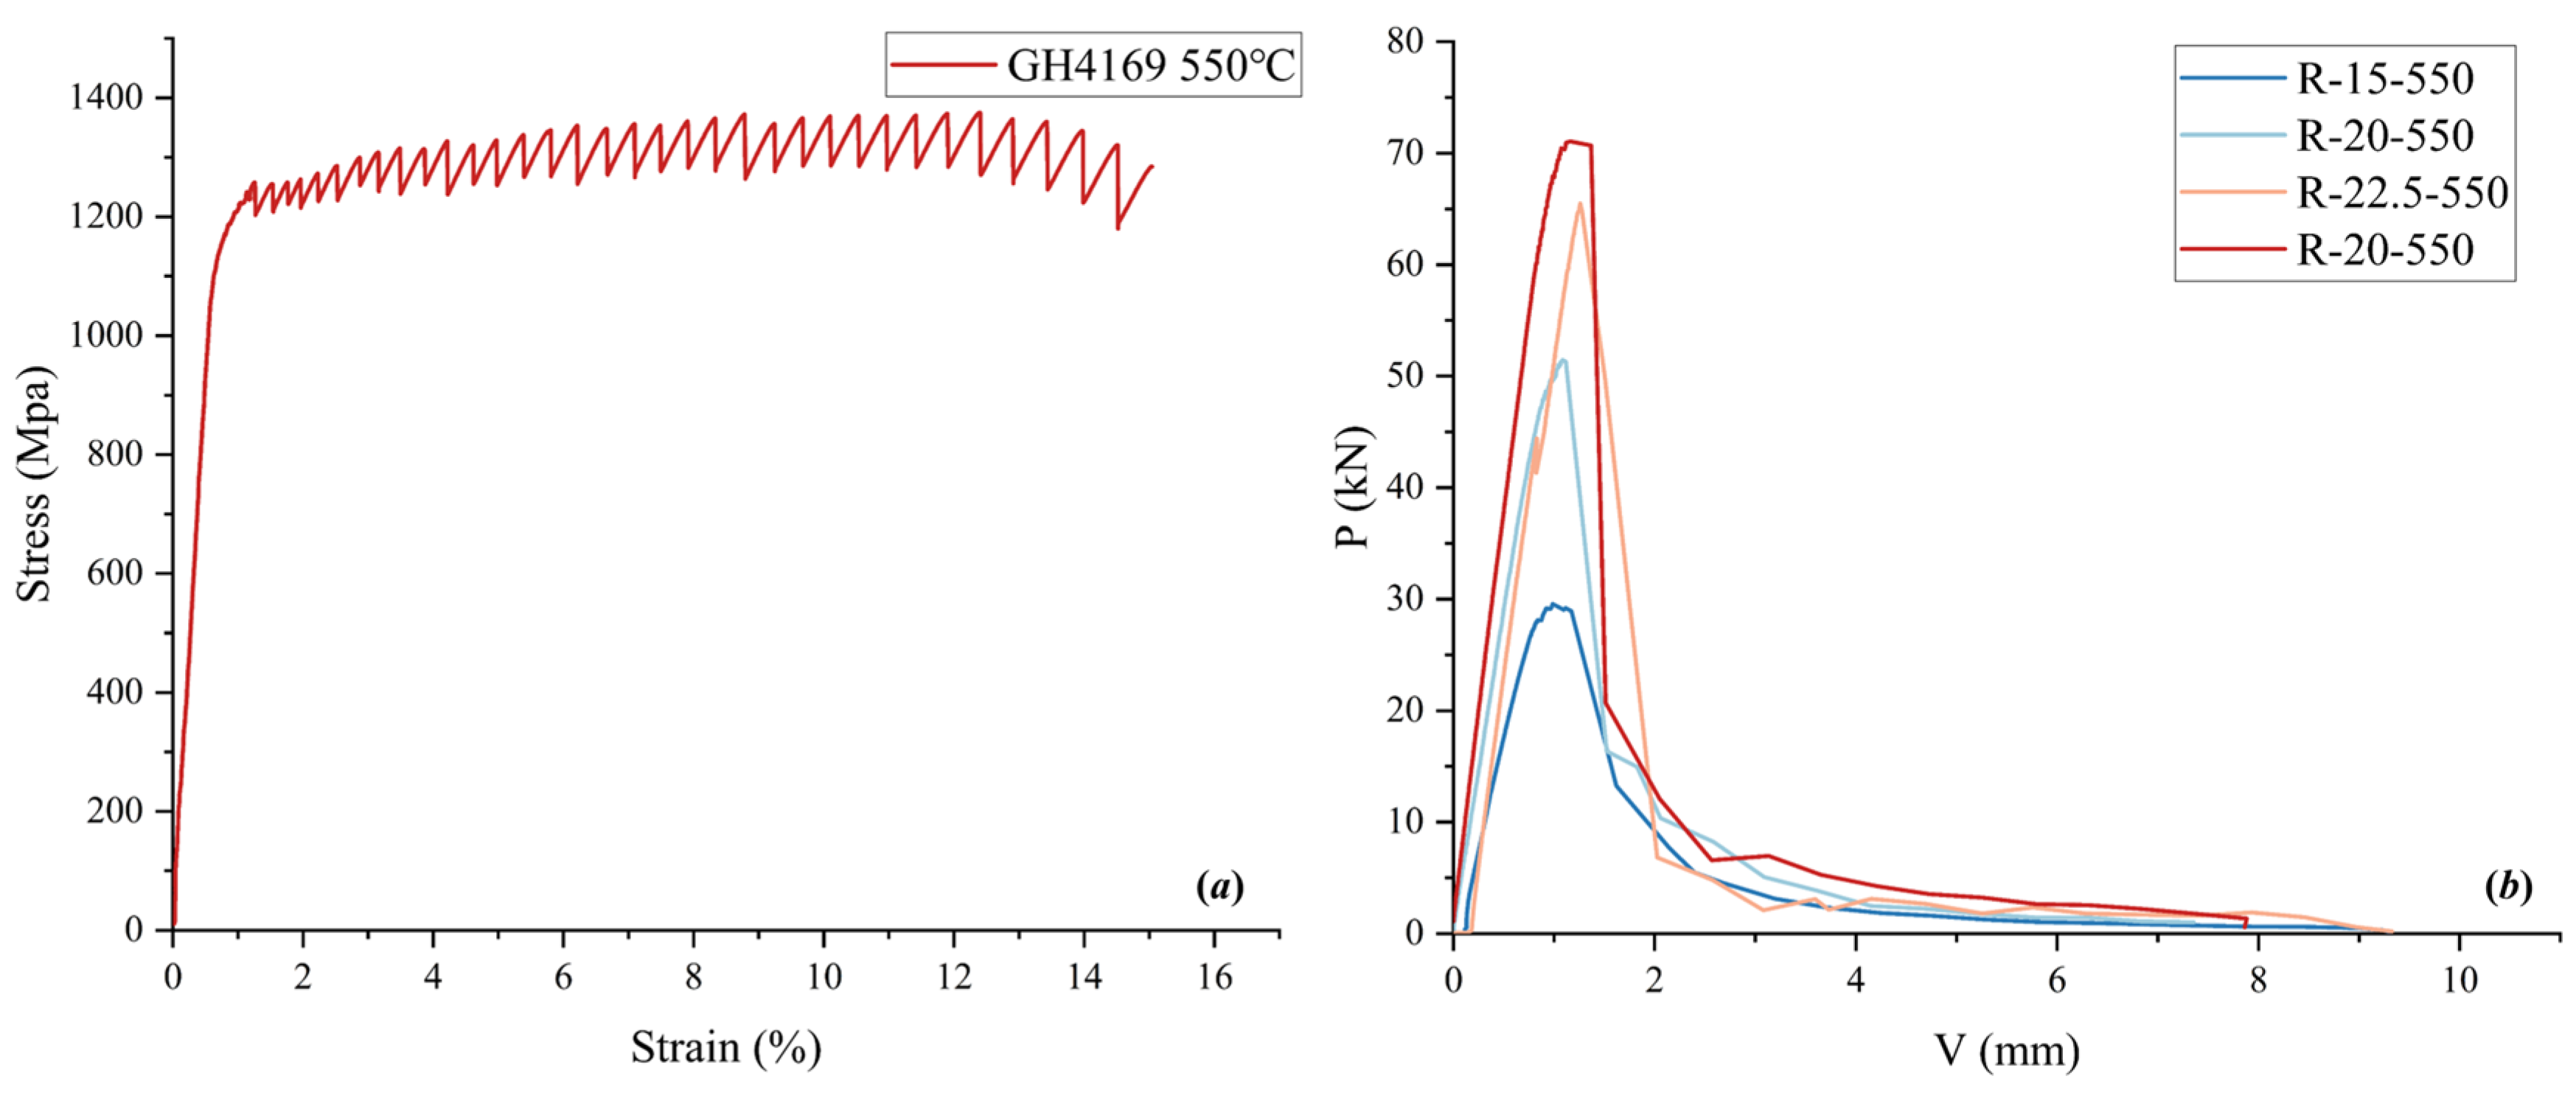
Figure 4a illustrates the tensile stress–strain curve of the material used in this study at 550 °C. Post-yielding, the stress–strain curve of the specimen exhibits sawtooth fluctuations, known as the Potvin–Le Chatelier effect. These fluctuations arise due to dynamic strain aging during the material’s microstructural evolution [40]. The material properties obtained from the uniaxial tensile test at this condition are listed in Table 1.
Figure 4.
Test curve of the material at 550 °C: (a) tensile stress–strain curve; (b) P-V curve for fracture toughness test.
Table 1.
The mechanical properties of the GH4169 material used in this study.
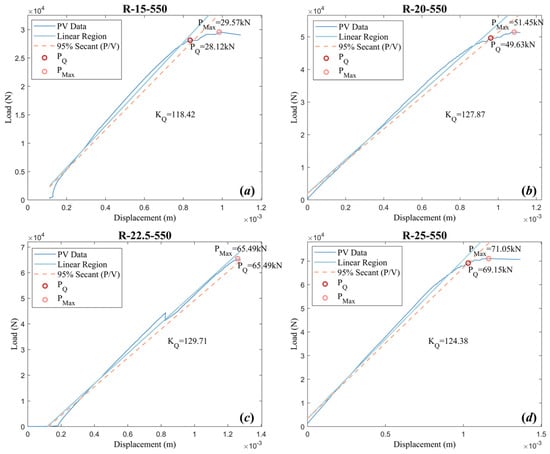
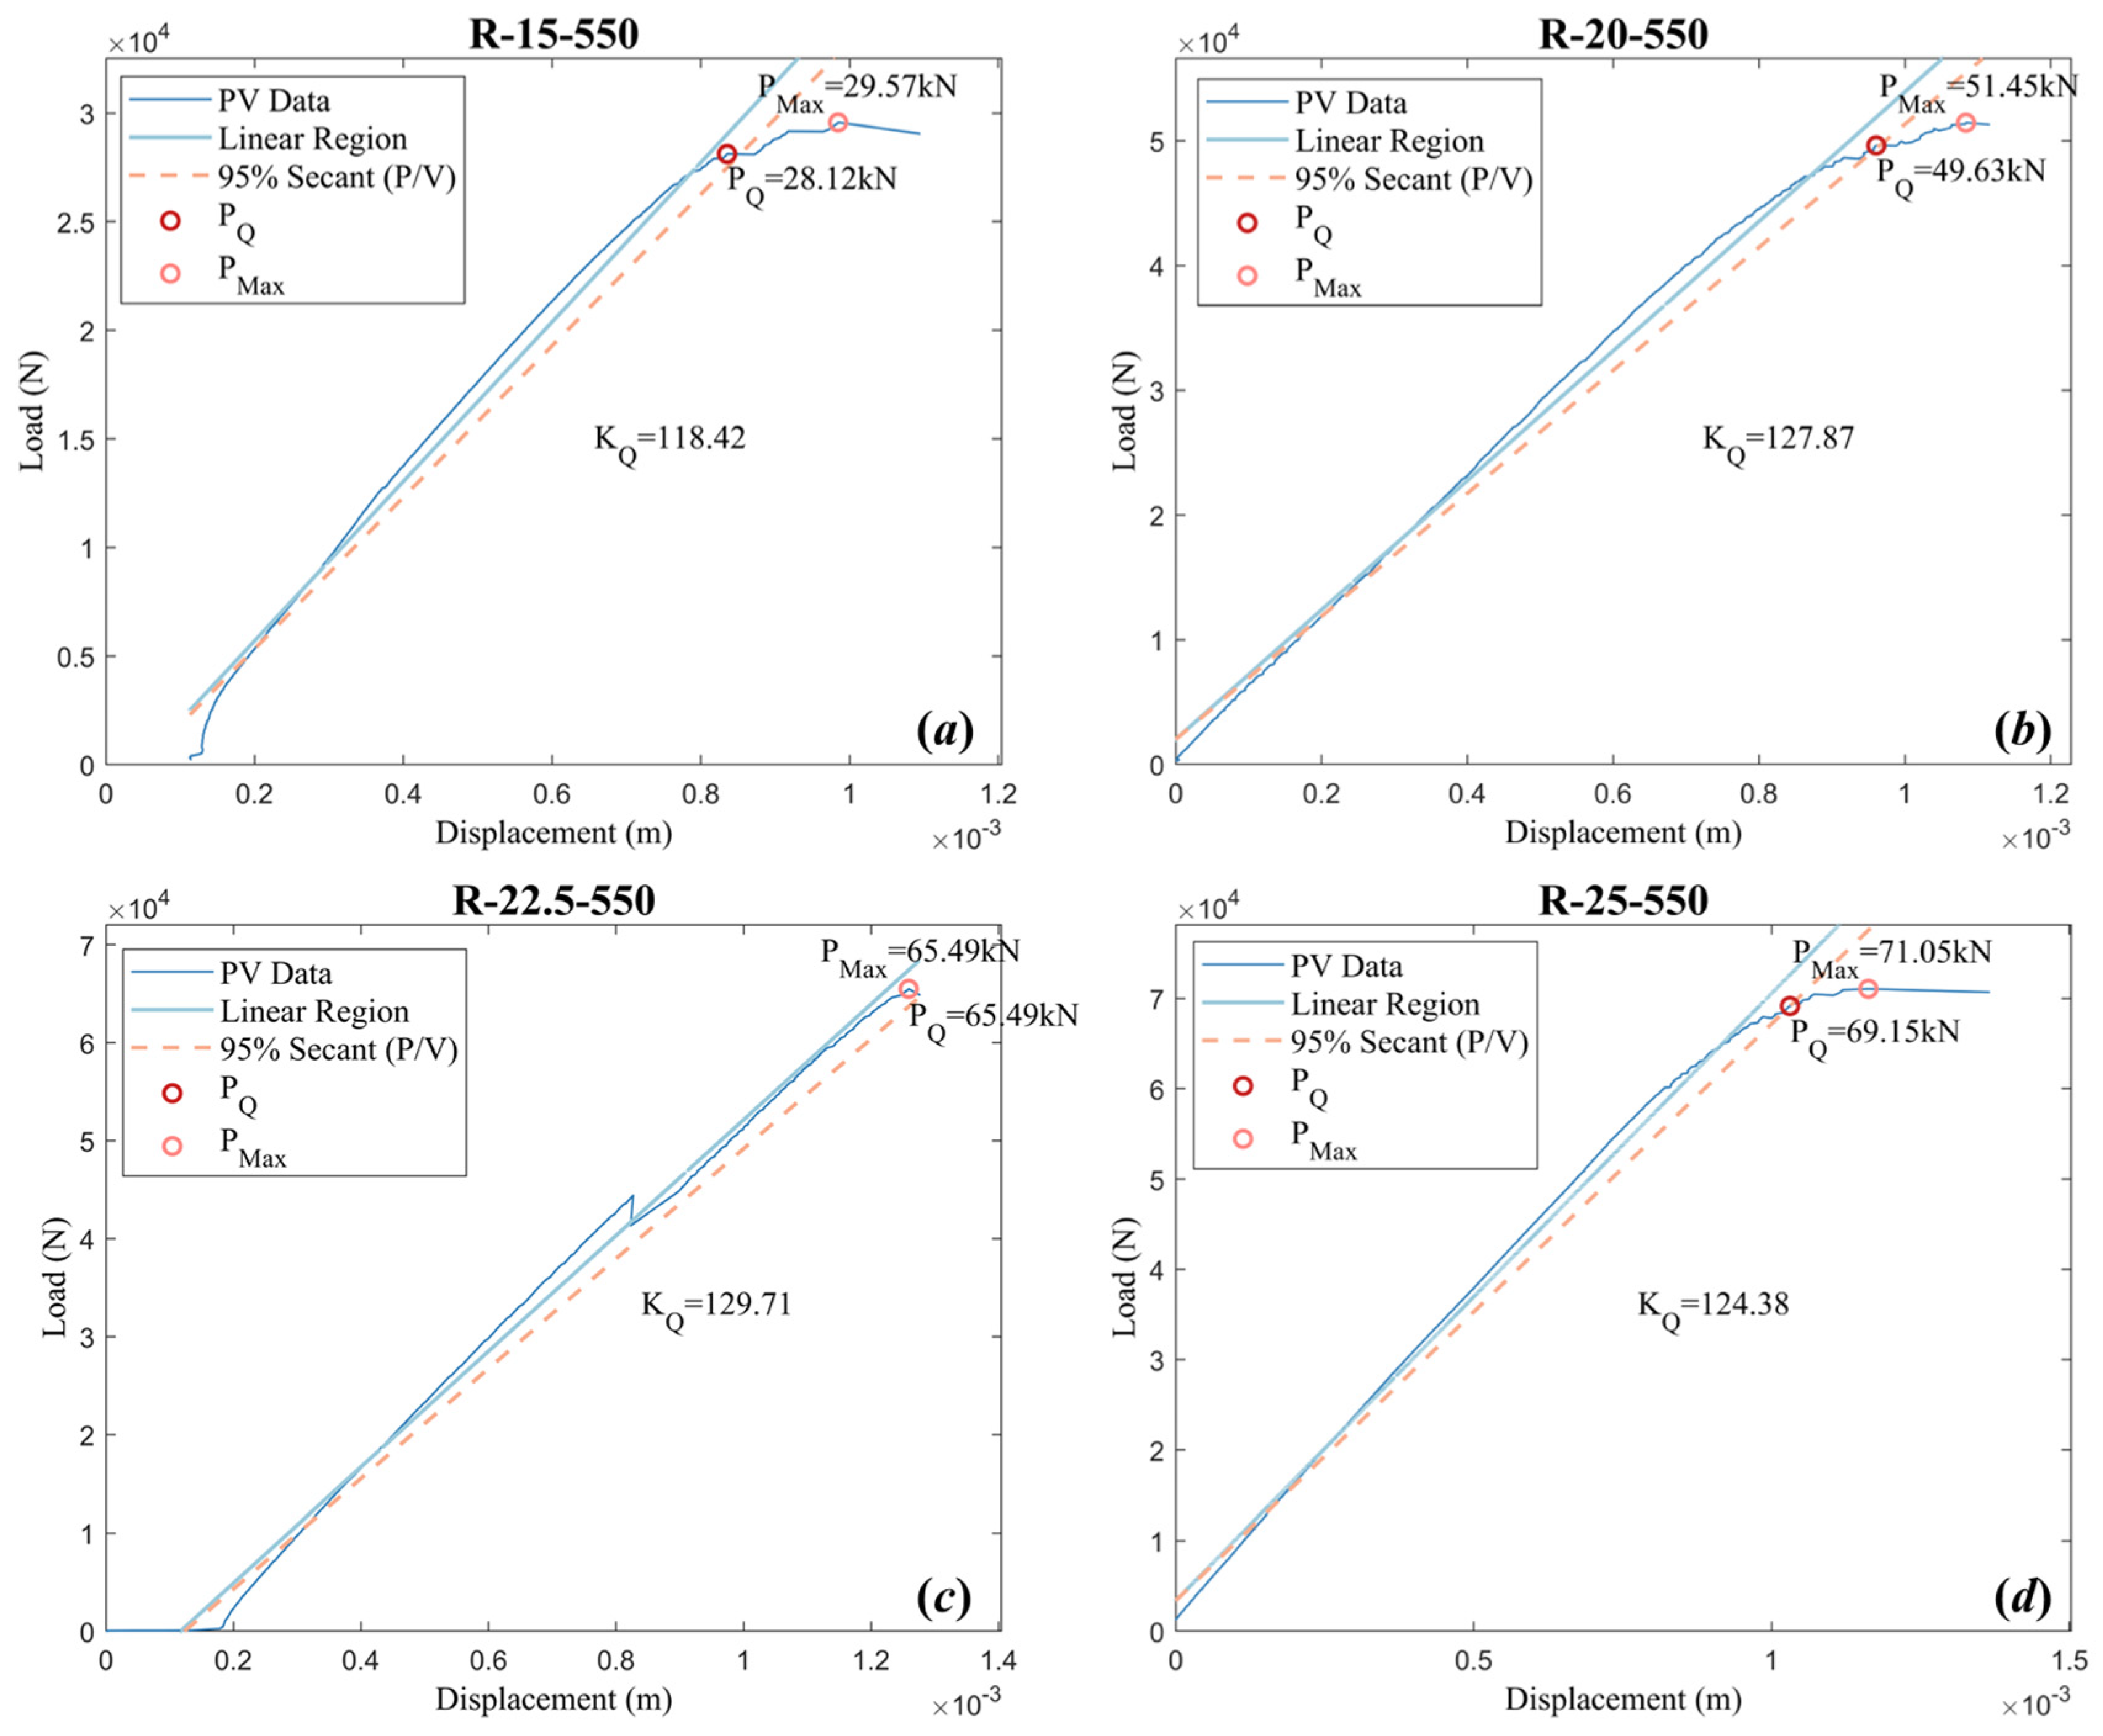
Figure 4b illustrates the force–displacement (P-V) curves obtained during the fracture toughness tests for various specimen sizes. The results of the fracture toughness tests are depicted in both Figure 5 and Table 2. Fracture toughness initially increased and then decreased with increasing size. However, none of the specimens met the criteria outlined in Equation (1). Consequently, the obtained data represent KQ instead of the plane strain fracture toughness KIC.
Figure 5.
Fracture toughness test data processing and results: (a) R-15-550, (b) R-20-550, (c) R-22.5-550, (d) R-25-550.
Table 2.
Test conditions and results of fracture toughness.
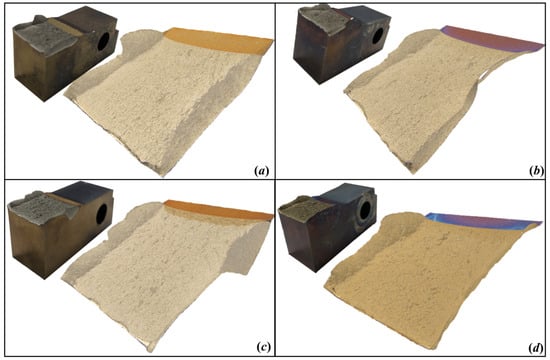
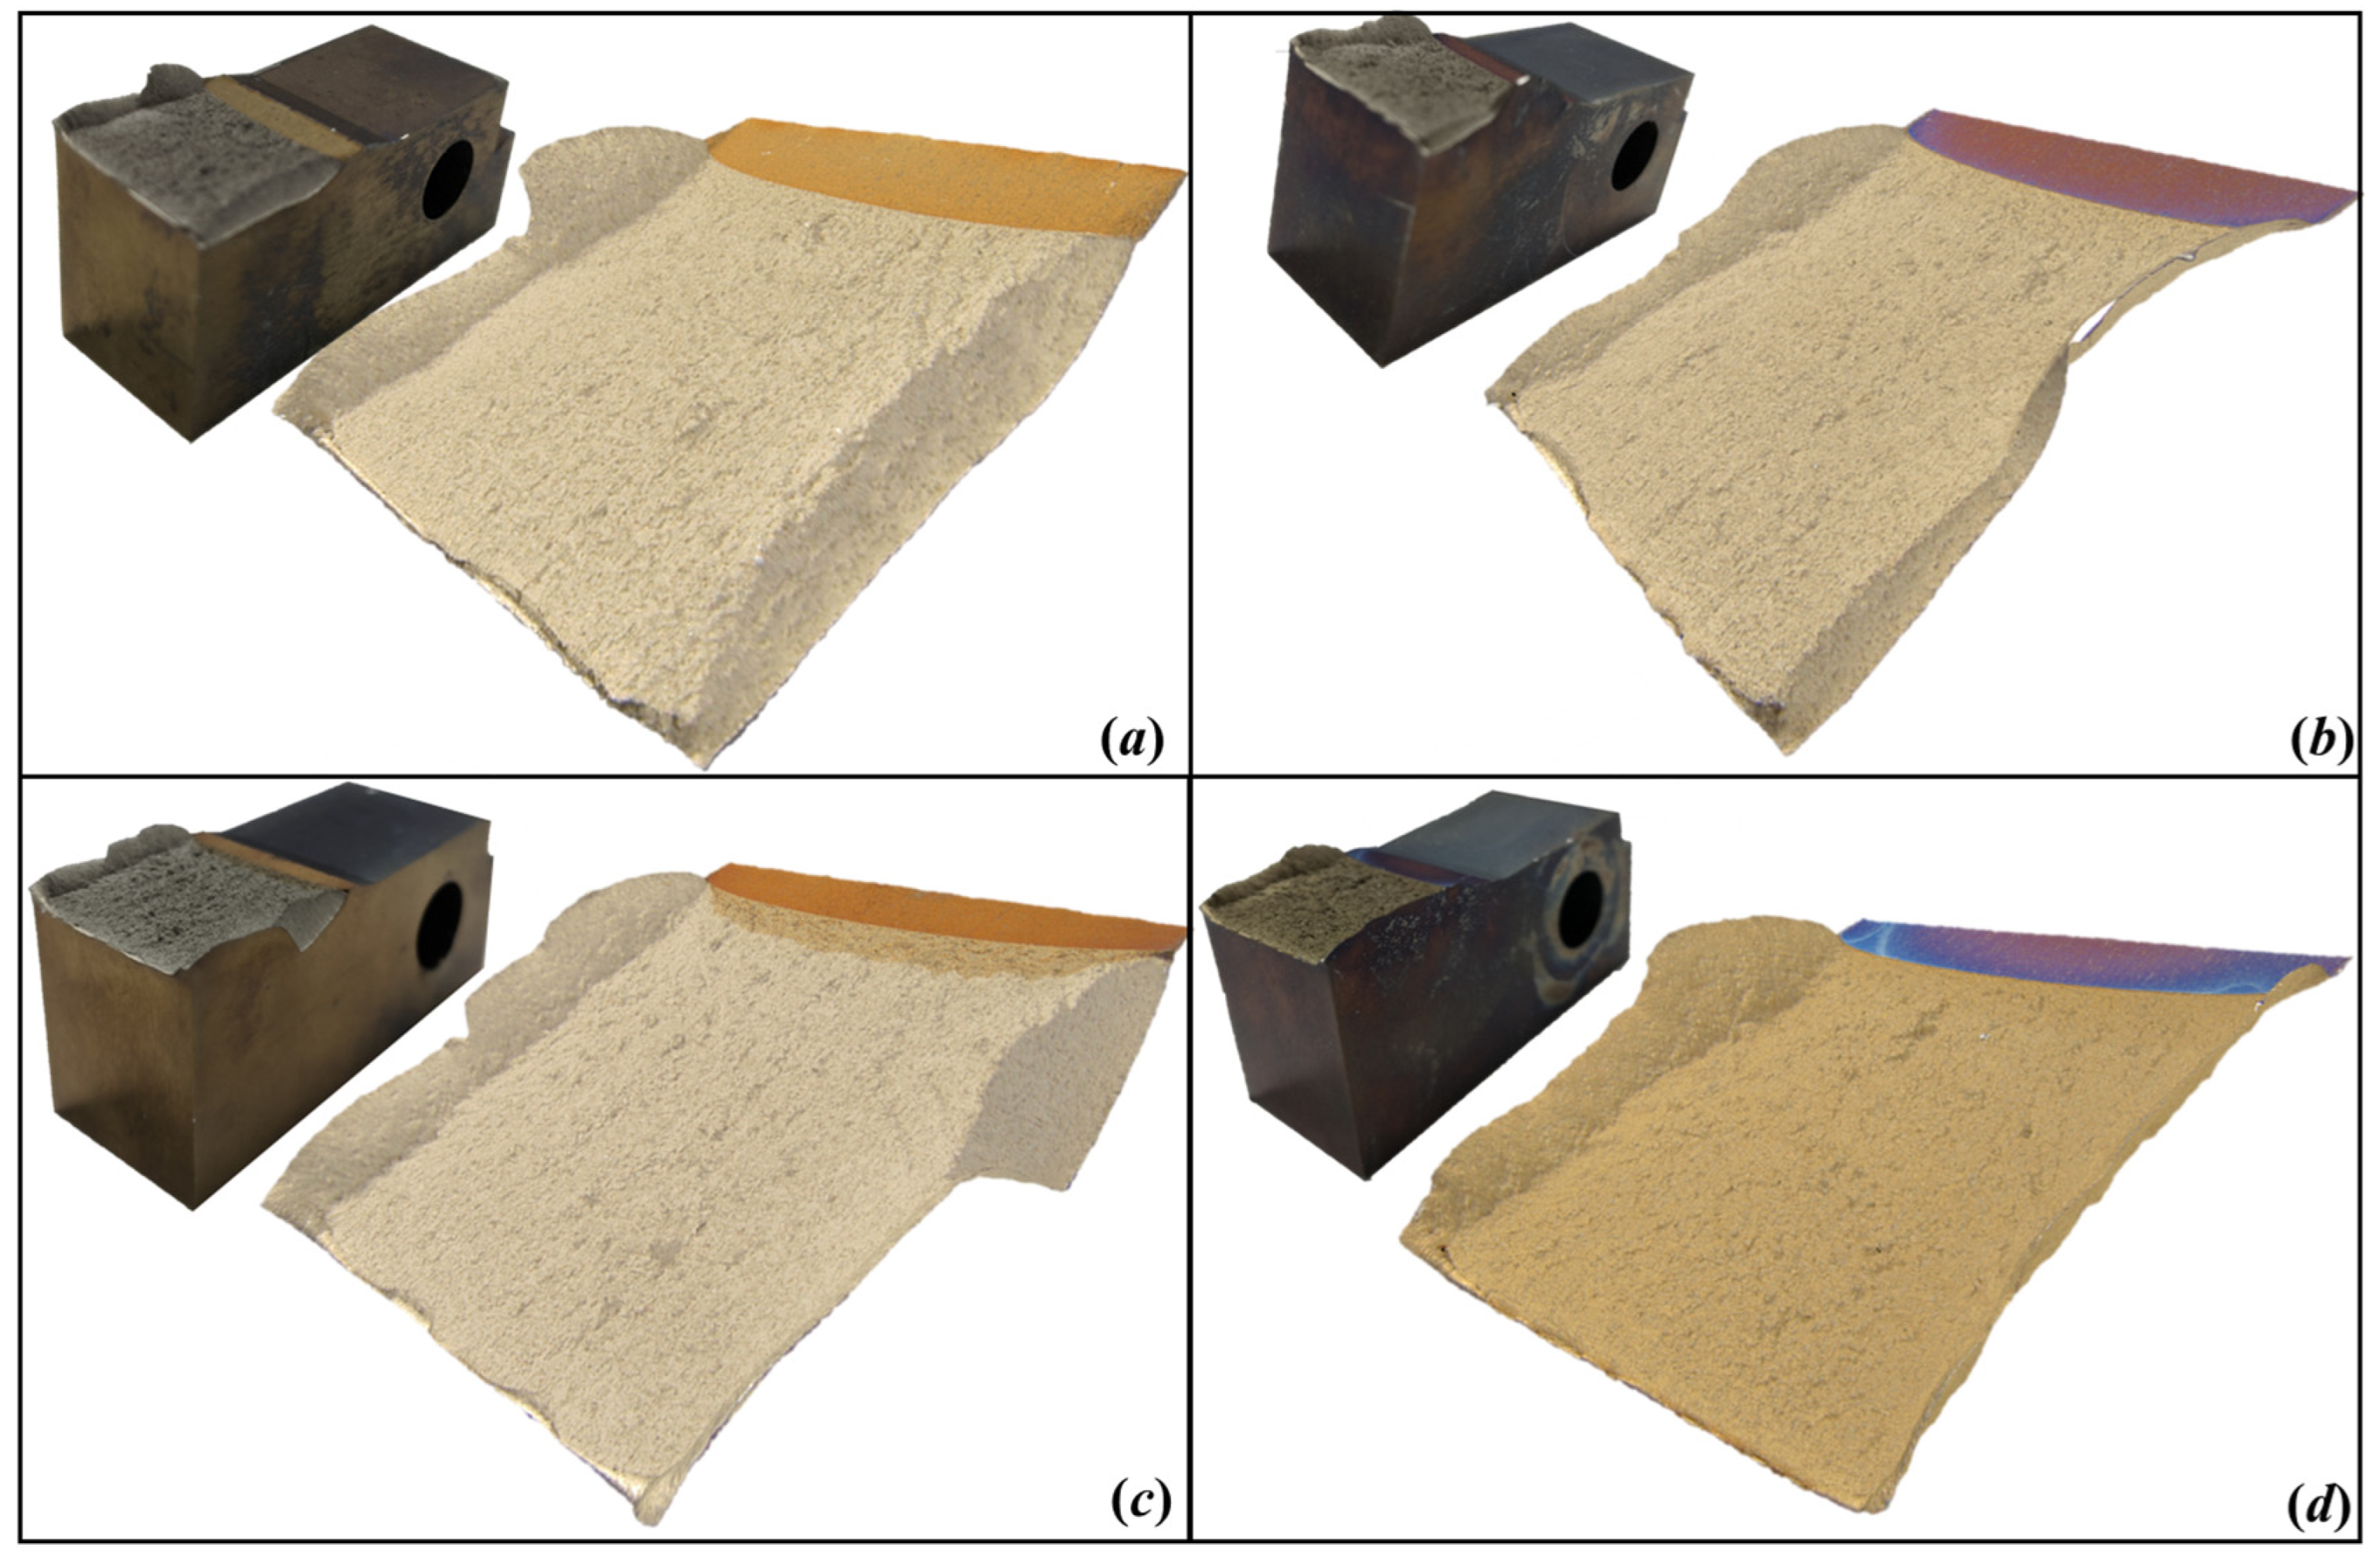
Figure 6 displays three-dimensional images of the fractured specimens and their surfaces after the fracture toughness test. The fracture shows a clear division into a plane stress fracture region on the outer surface and a plane strain fracture region internally. Moreover, the proportion of the plane strain fracture toughness region increased gradually with larger specimen sizes.
Figure 6.
Real fracture and three-dimensional morphology of the fracture after fracture toughness testing: (a) R-15-550, (b) R-20-550, (c) R-22.5-550, (d) R-25-550.
4.2. Fractal Dimension Analysis of Fractures
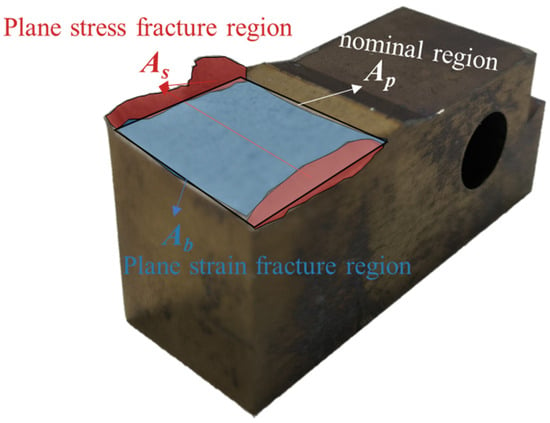
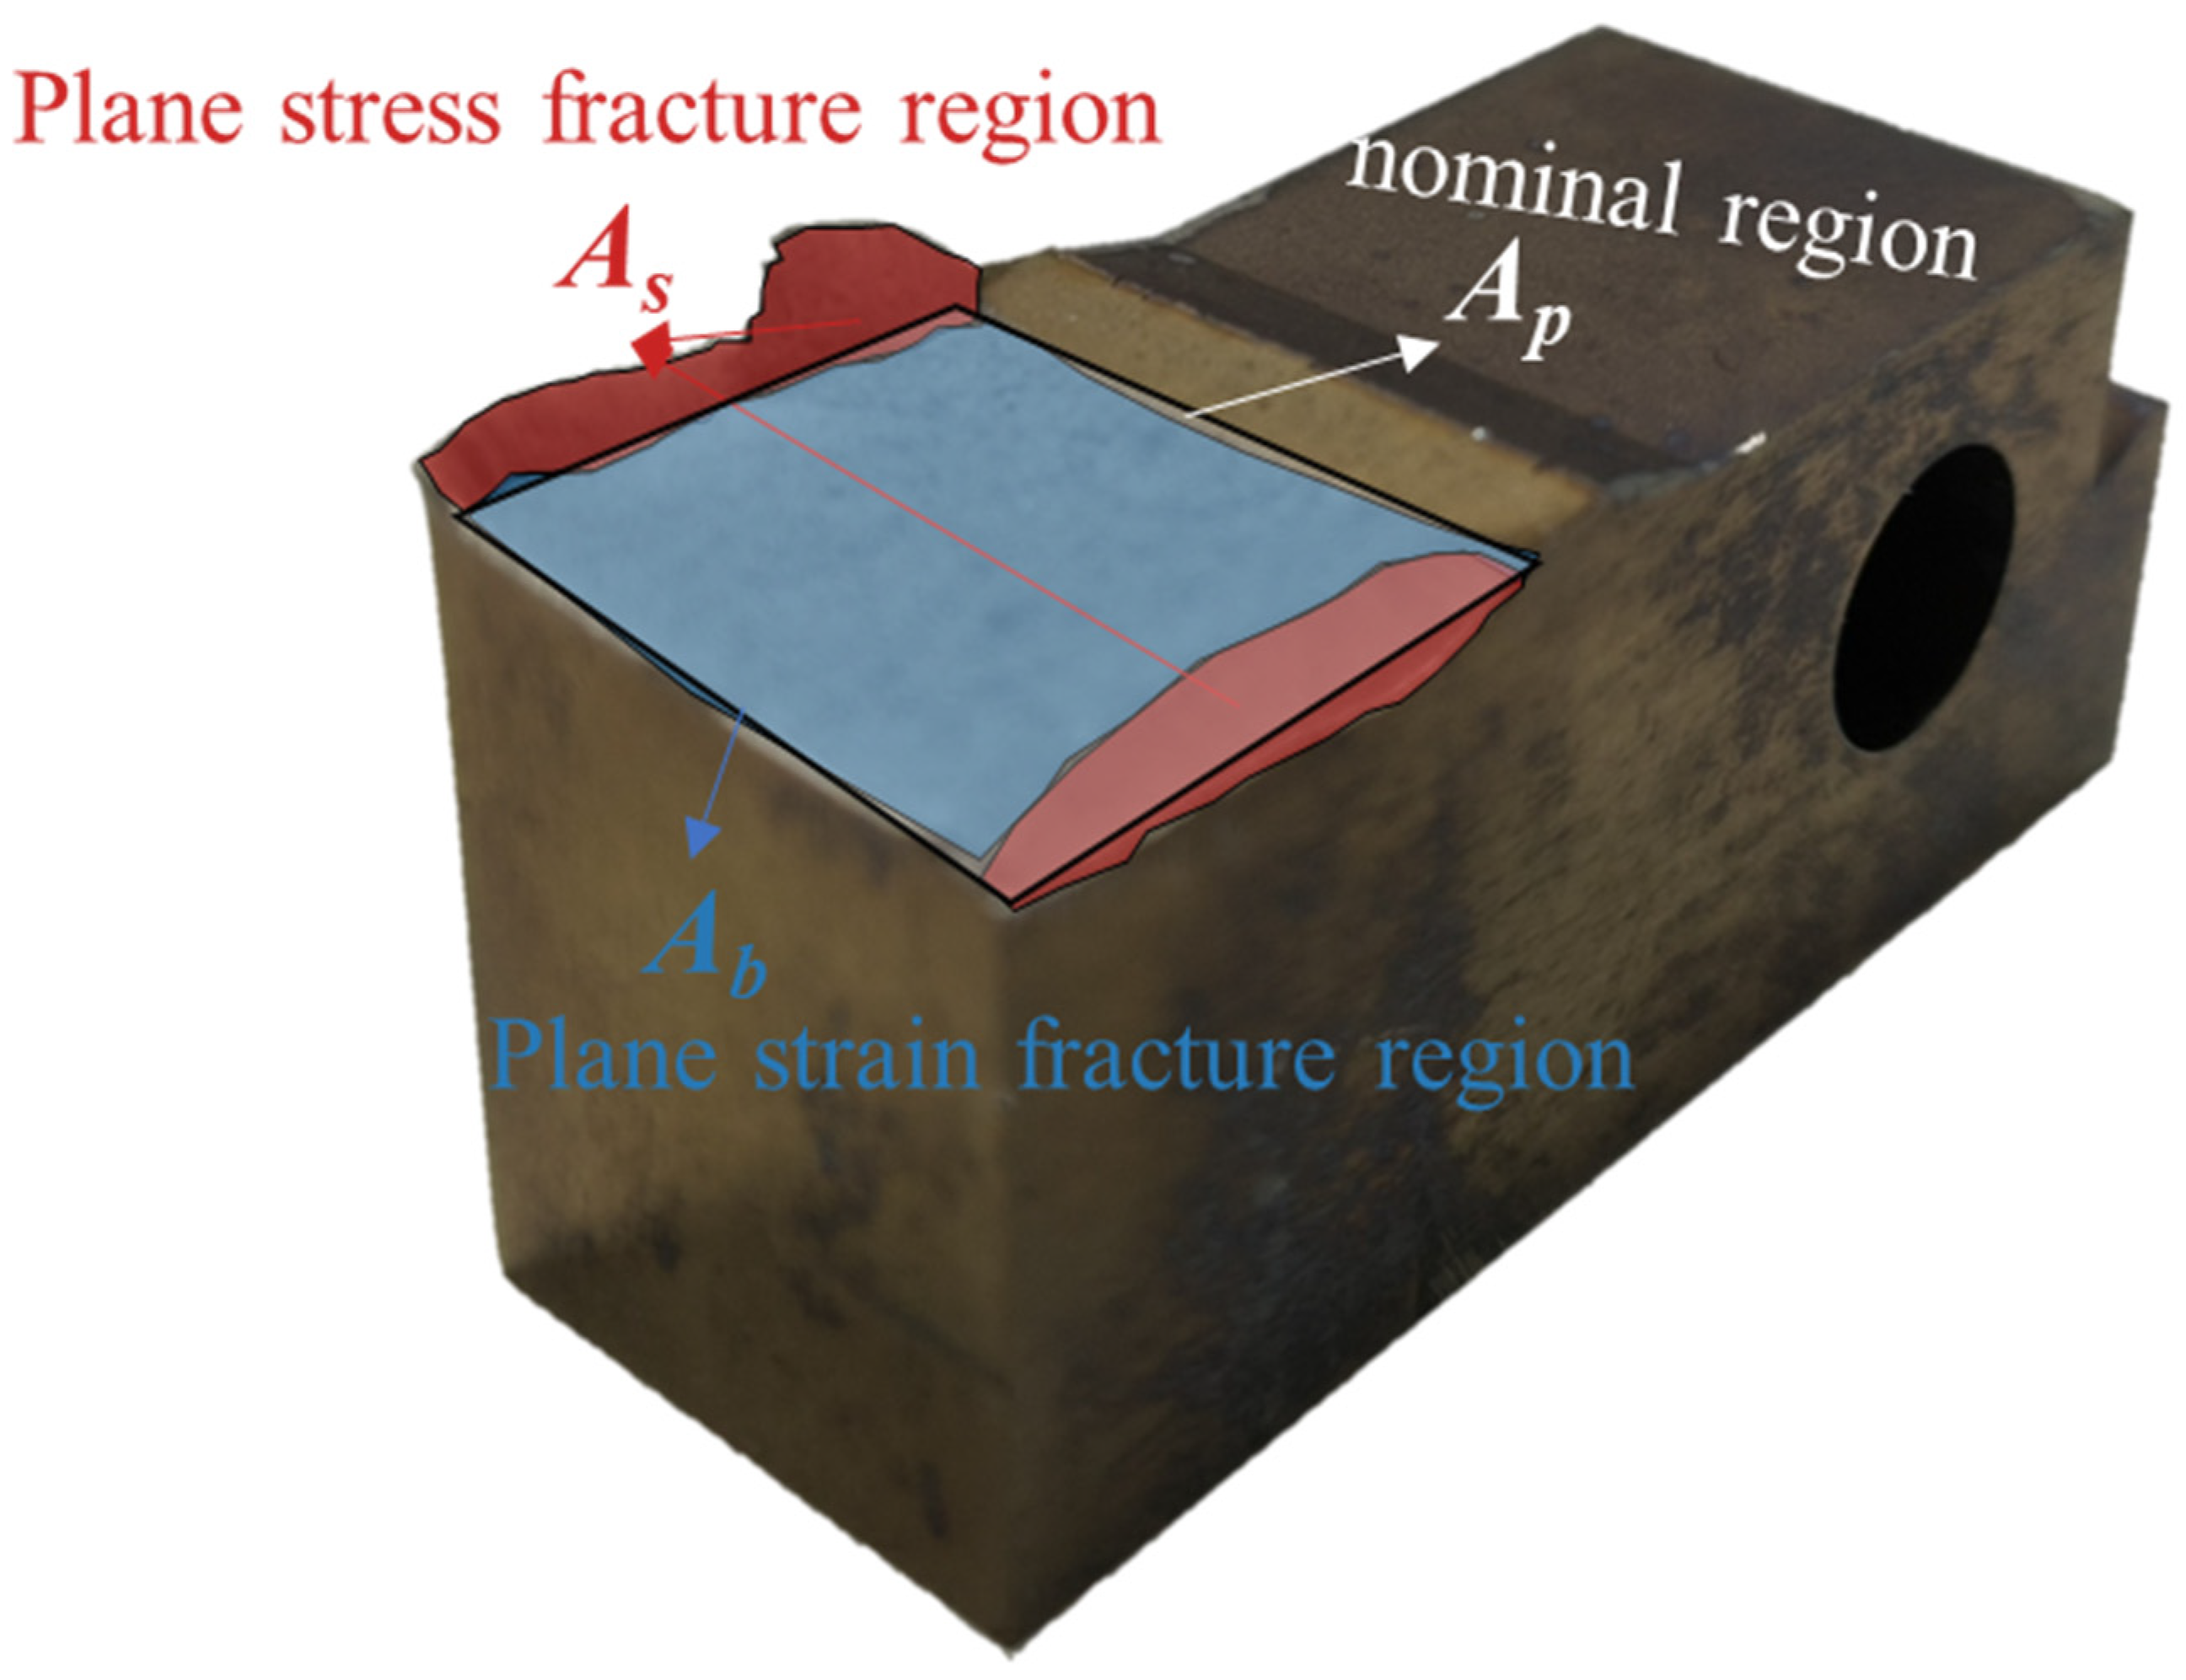
A fracture can be classified into an area of plane stress fracture region As and an area of a plane strain fracture region Ab, with the total area of all regions defined as At and the area of the nominal region denoted as Ap, as illustrated in Figure 7.
Figure 7.
Different regions of the R-15-550 fracture surface.
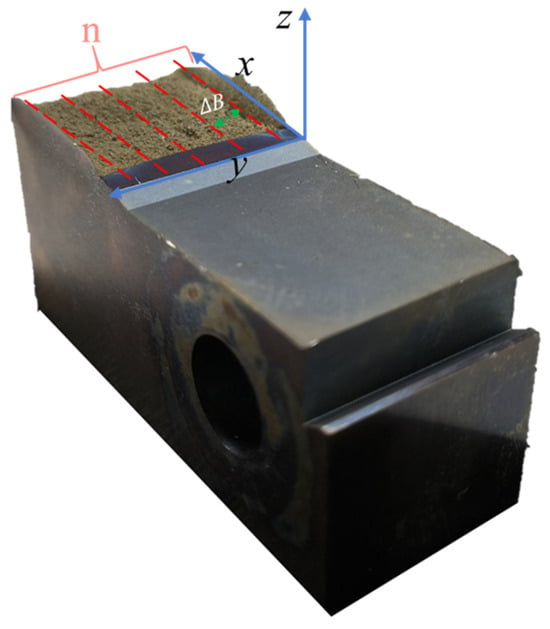
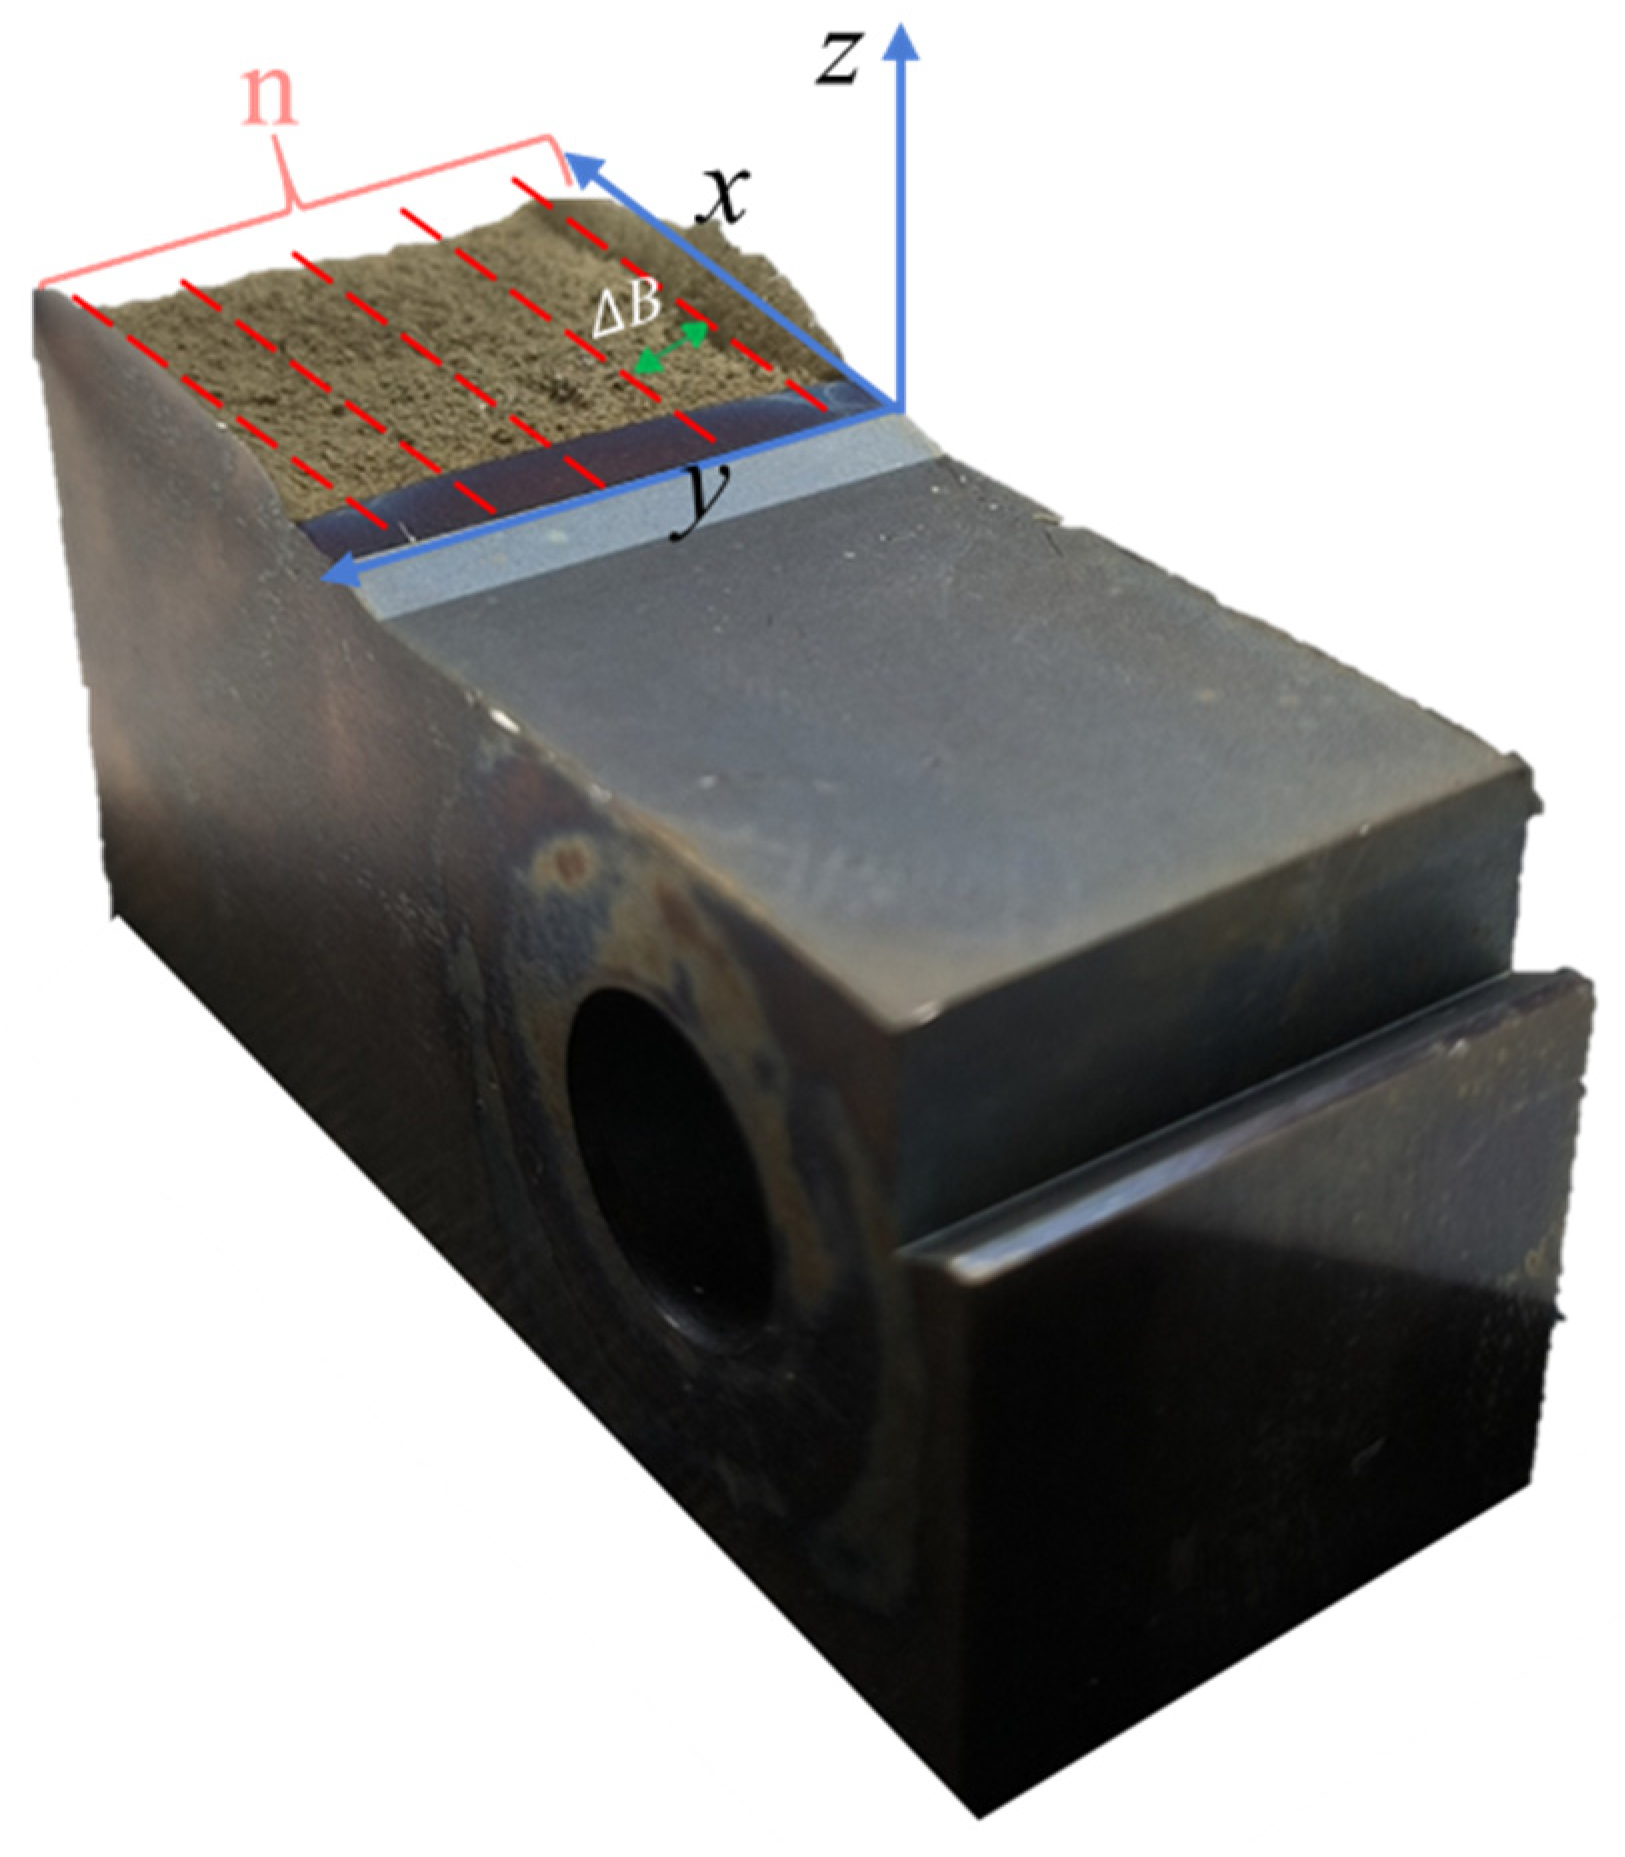
Several studies have investigated the overall fractal dimension of fractures, but few have examined the fractal dimension within specific plane stress and plane strain regions [28,29,30,31,32]. This section explores the fractal dimension of fractures both perpendicular to the thickness direction and along the crack propagation direction, as depicted in Figure 8.
Figure 8.
Schematic of fracture direction, with R-15-550 as an example.
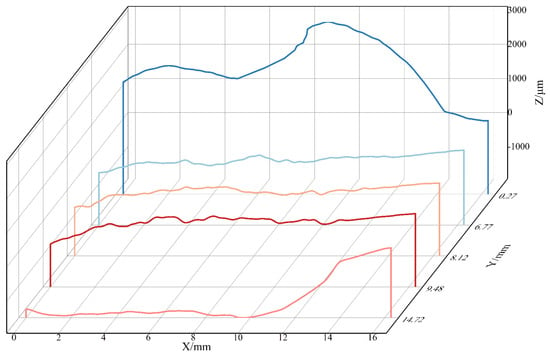
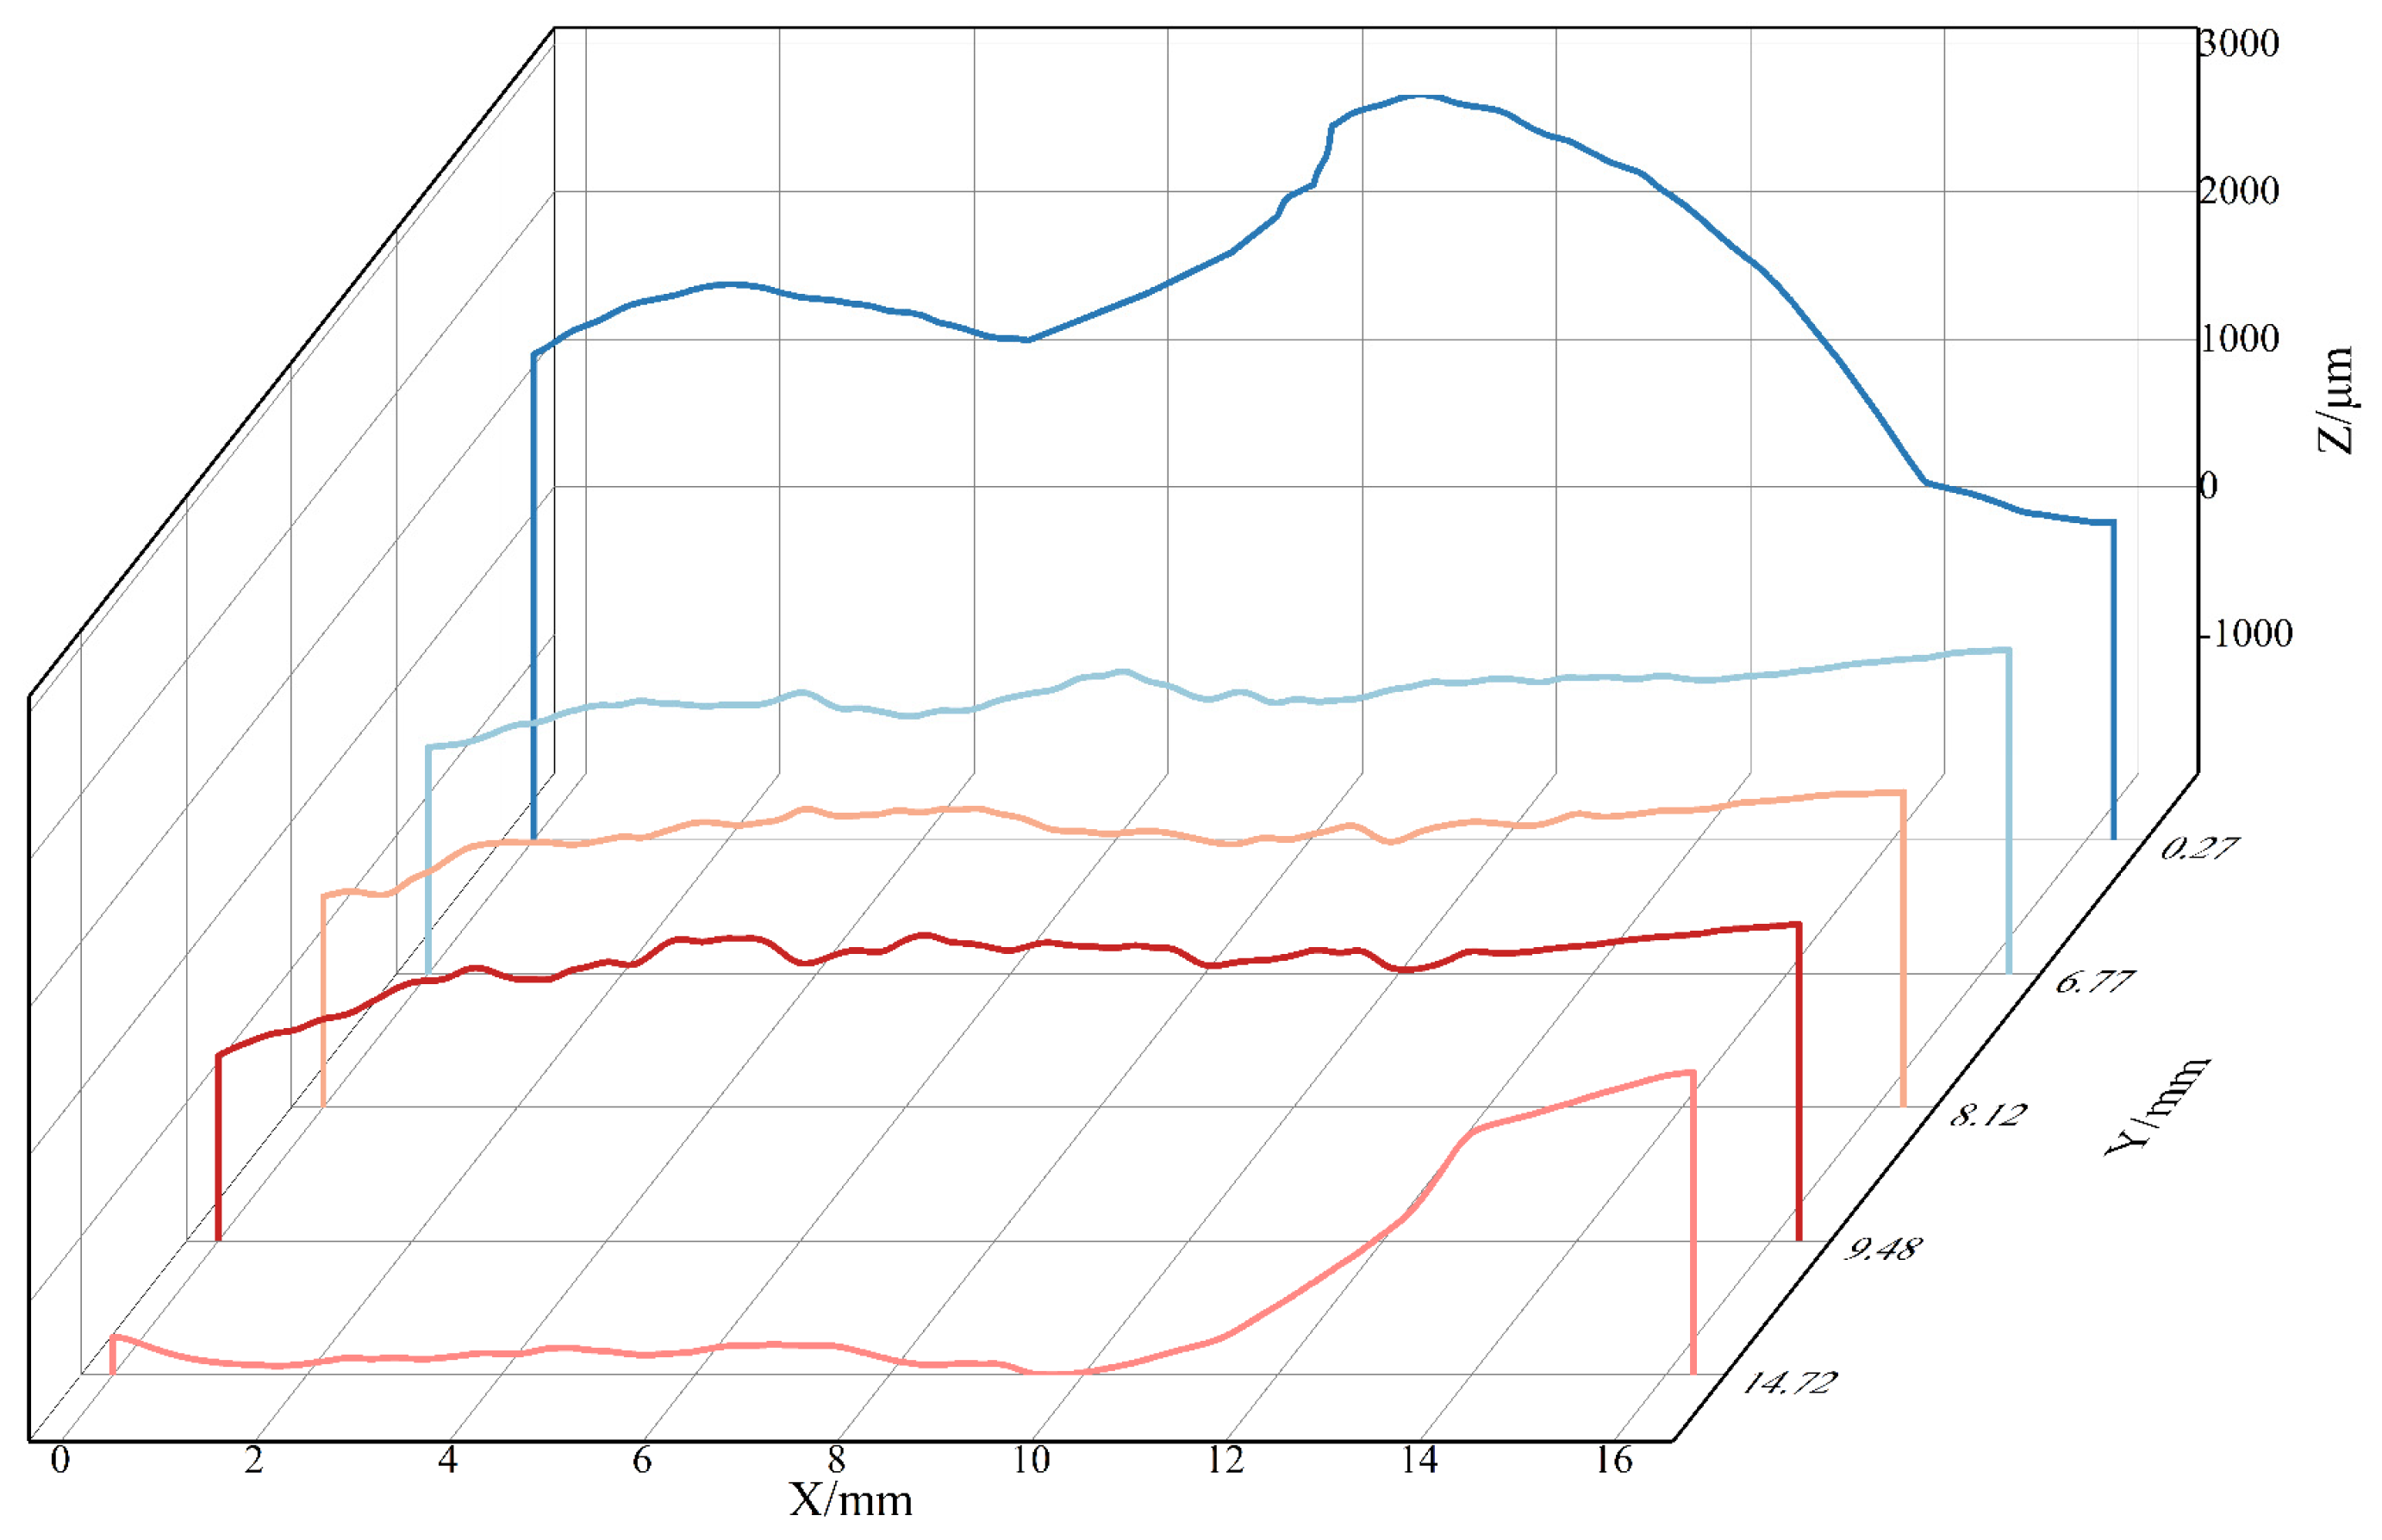
Figure 9 illustrates the variation in the fracture height along the crack propagation direction for different thicknesses. It reveals that in the plane stress fracture region near the outer surface, the fracture height, exhibits greater variation, though the overall variation appears smoother and less intricate. Conversely, in the plane strain fracture region within the specimen’s interior, the fracture height shows less variation, but the overall pattern is more zigzag and intricate.
Figure 9.
Variation in fracture height along the crack propagation direction for different thicknesses of R-15-550.
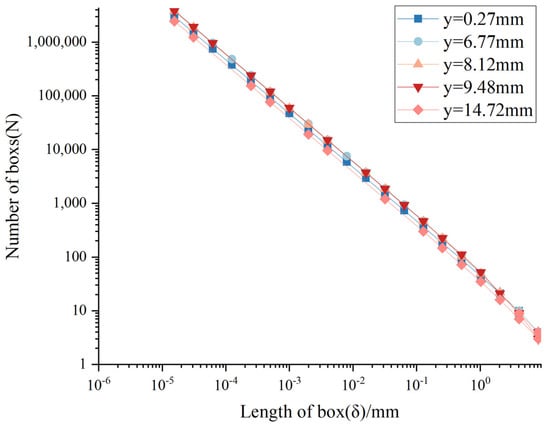
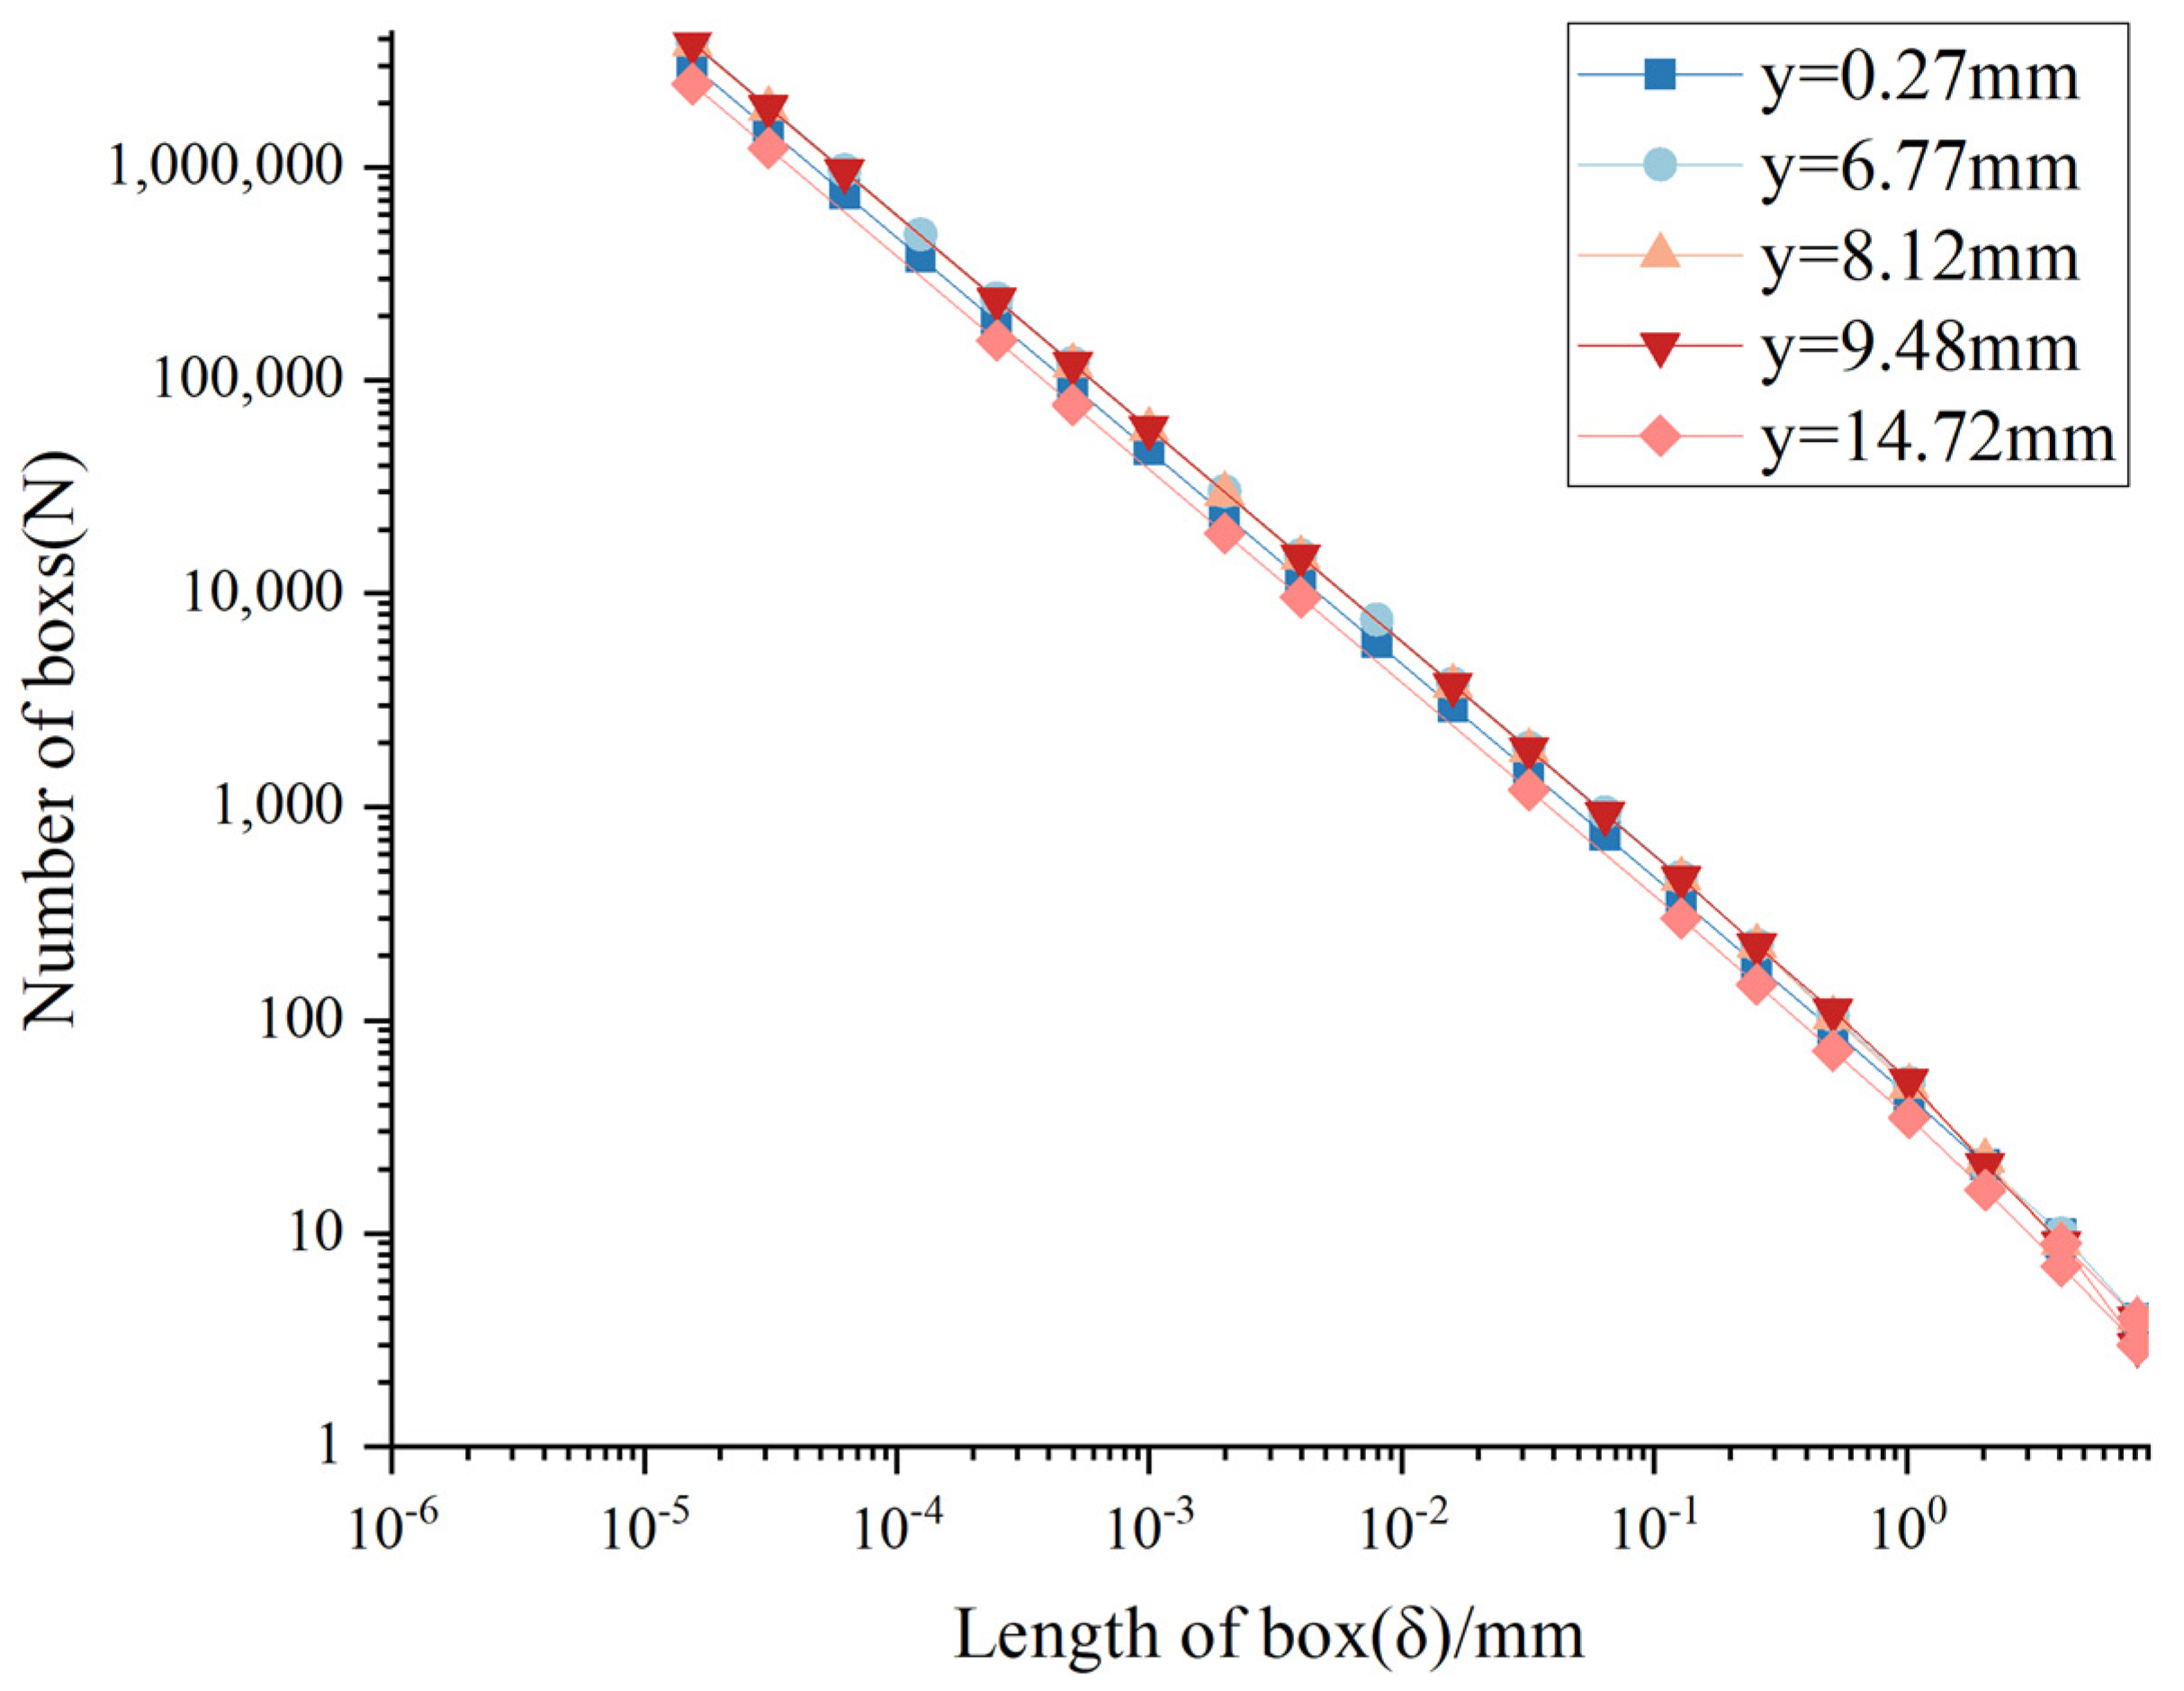
Equation (5) was used to compute the fractal dimension of the two-dimensional curve, as illustrated in Figure 9. The relationship between the number of squares (N) and the length of square sides (δ) is illustrated in Figure 10.
Figure 10.
Box-counting method used to calculate the fractal dimension of 2D curves.
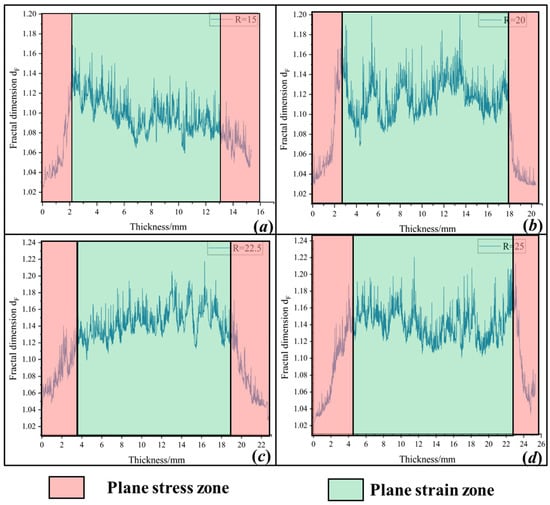
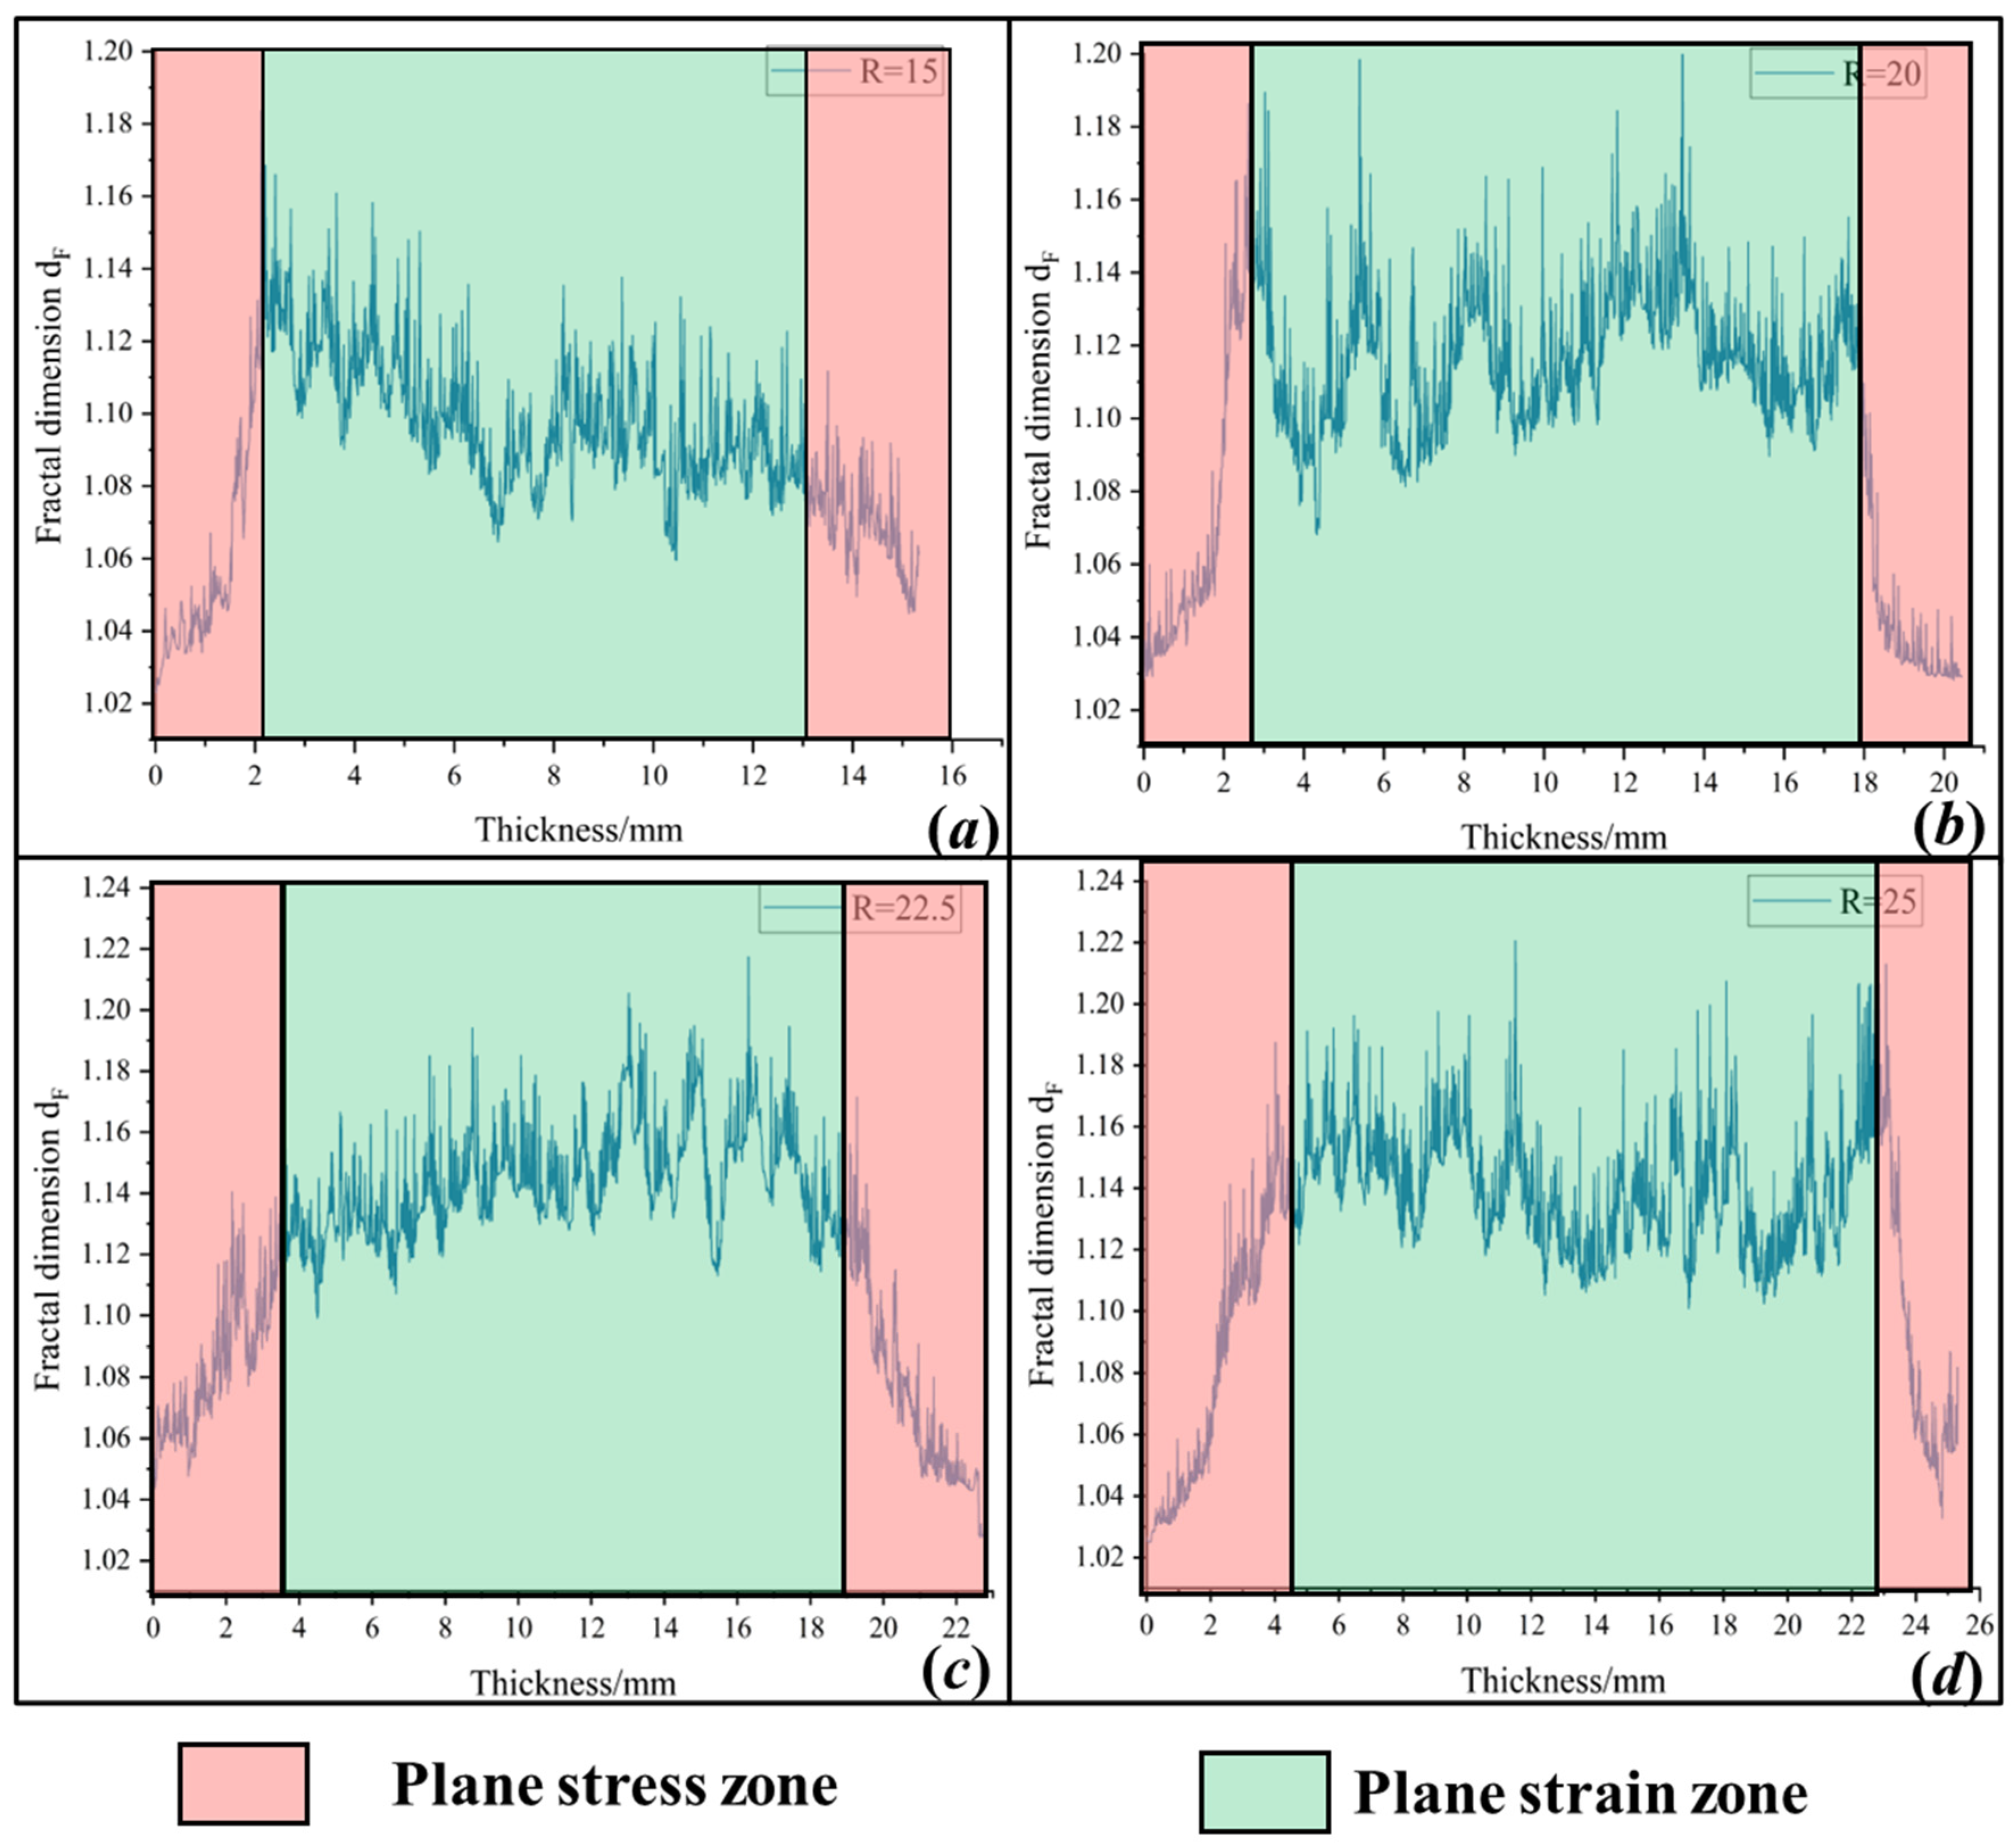
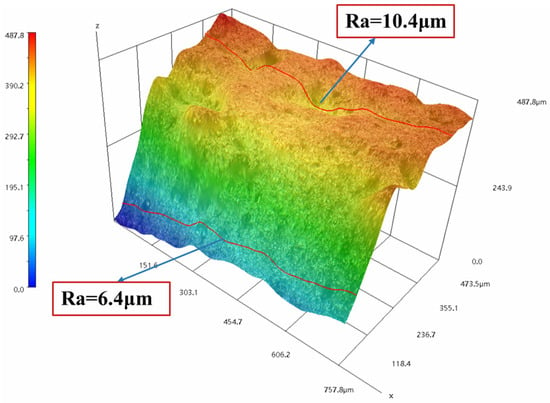
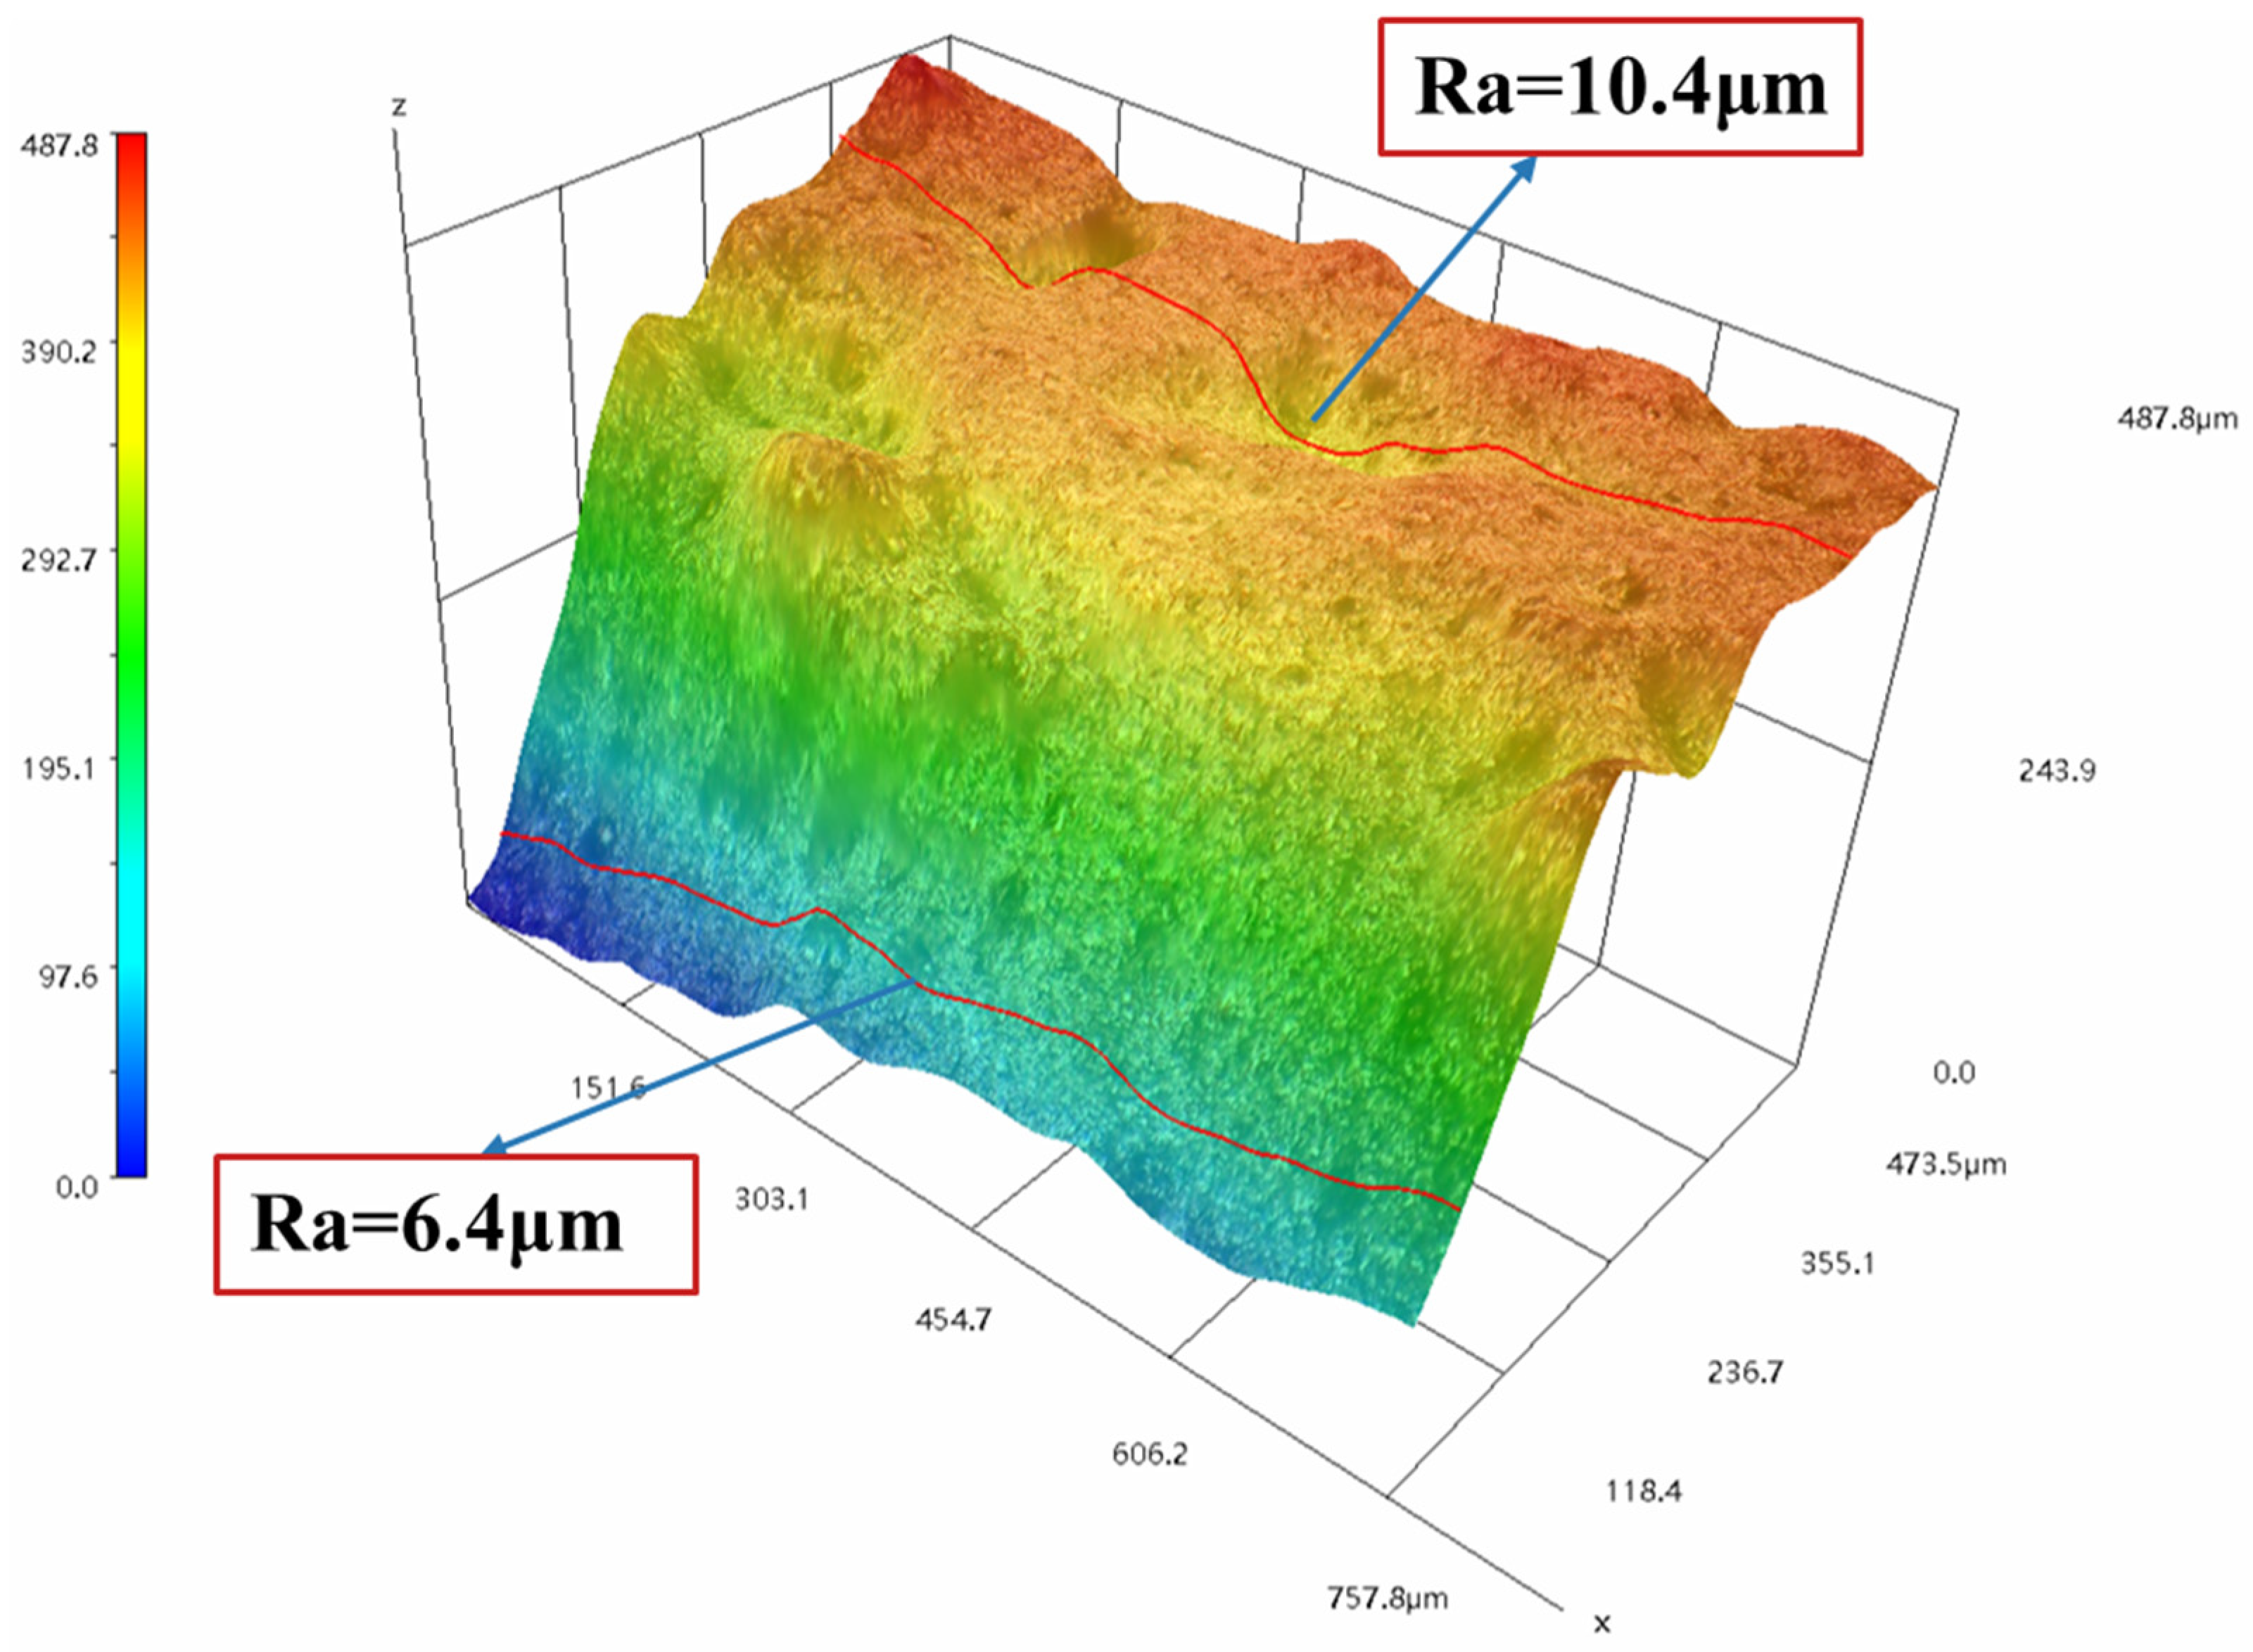
The fractal dimension of the curve was determined through linear fitting. Figure 11 illustrates the overall fractal dimension along the thickness direction. It is evident that the fractal dimension was smaller in the plane stress fracture region and larger in the plane strain fracture region. Figure 12 depicts measurements of the fracture roughness in these two regions, indicating that the roughness in the plane stress region was significantly smaller than that in the plane strain fracture region.
Figure 11.
Fractal dimension of crack propagation direction in different regions of different specimens: (a) R-15-550, (b) R-20-550, (c) R-22.5-550, (d) R-25-550.
Figure 12.
Roughness of different zones of the fracture with R-15-550 as an example.
By combining Equation (7), the ubiquitiform surface area Atuf of the fracture can be expressed as Equation (8).
where n represents the number of crack propagation regions divided into n curves, i represents the ith curve, dFi represents the fractal dimension of the ith curve, ΔB represents the interval between each curve, and δmin = 100 μm in this study. To enhance computational efficiency, the fractal dimensions were averaged across the entire region, as detailed in Table 3. The calculation of the ubiquitiform surface area Aauf of the fracture involved using the average fractal dimension, computed using the following Equation (9).
where dFa denotes the average fractal dimension of each curve. The areas calculated are displayed in Table 3, indicating that Equations (8) and (9) yield similar results.
Table 3.
Mean value of fracture fractal dimension, ubiquitiform surface area, and corresponding fracture toughness correction.
Additionally, The work done by the external force Wt, can be calculated by integrating the area under the P-V curve using Equation (10).
Based on the ubiquitiform surface area, GC = K2C/E′ and GC = Wt/A0 can be revised as shown in Equation (11).
A comprehensive assessment of the material’s fracture toughness was conducted by integrating the fractal dimension and fracture energy. The resulting fracture toughness KCu values obtained through this evaluation are presented in Table 3. Notably, incorporating the ubiquitiform surface area correction brought the calculated results closer to the experimental data. In this scenario, the material’s fracture toughness is enhanced due to the smaller fractal dimension of the plane stress fracture region. This reduction in the mean value of the overall fractal dimension consequently increases the material’s fracture toughness.
As specimen size increased, the influence of the proportion of the plane stress fracture region on the overall fractal dimension diminished. Consequently, at this juncture, the plane strain fracture toughness KIC can be expressed as Equation (12).
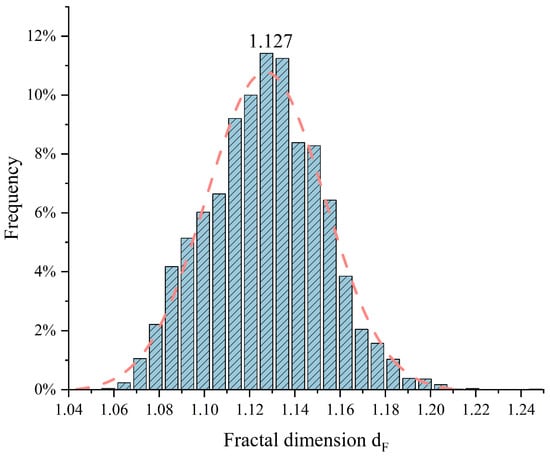
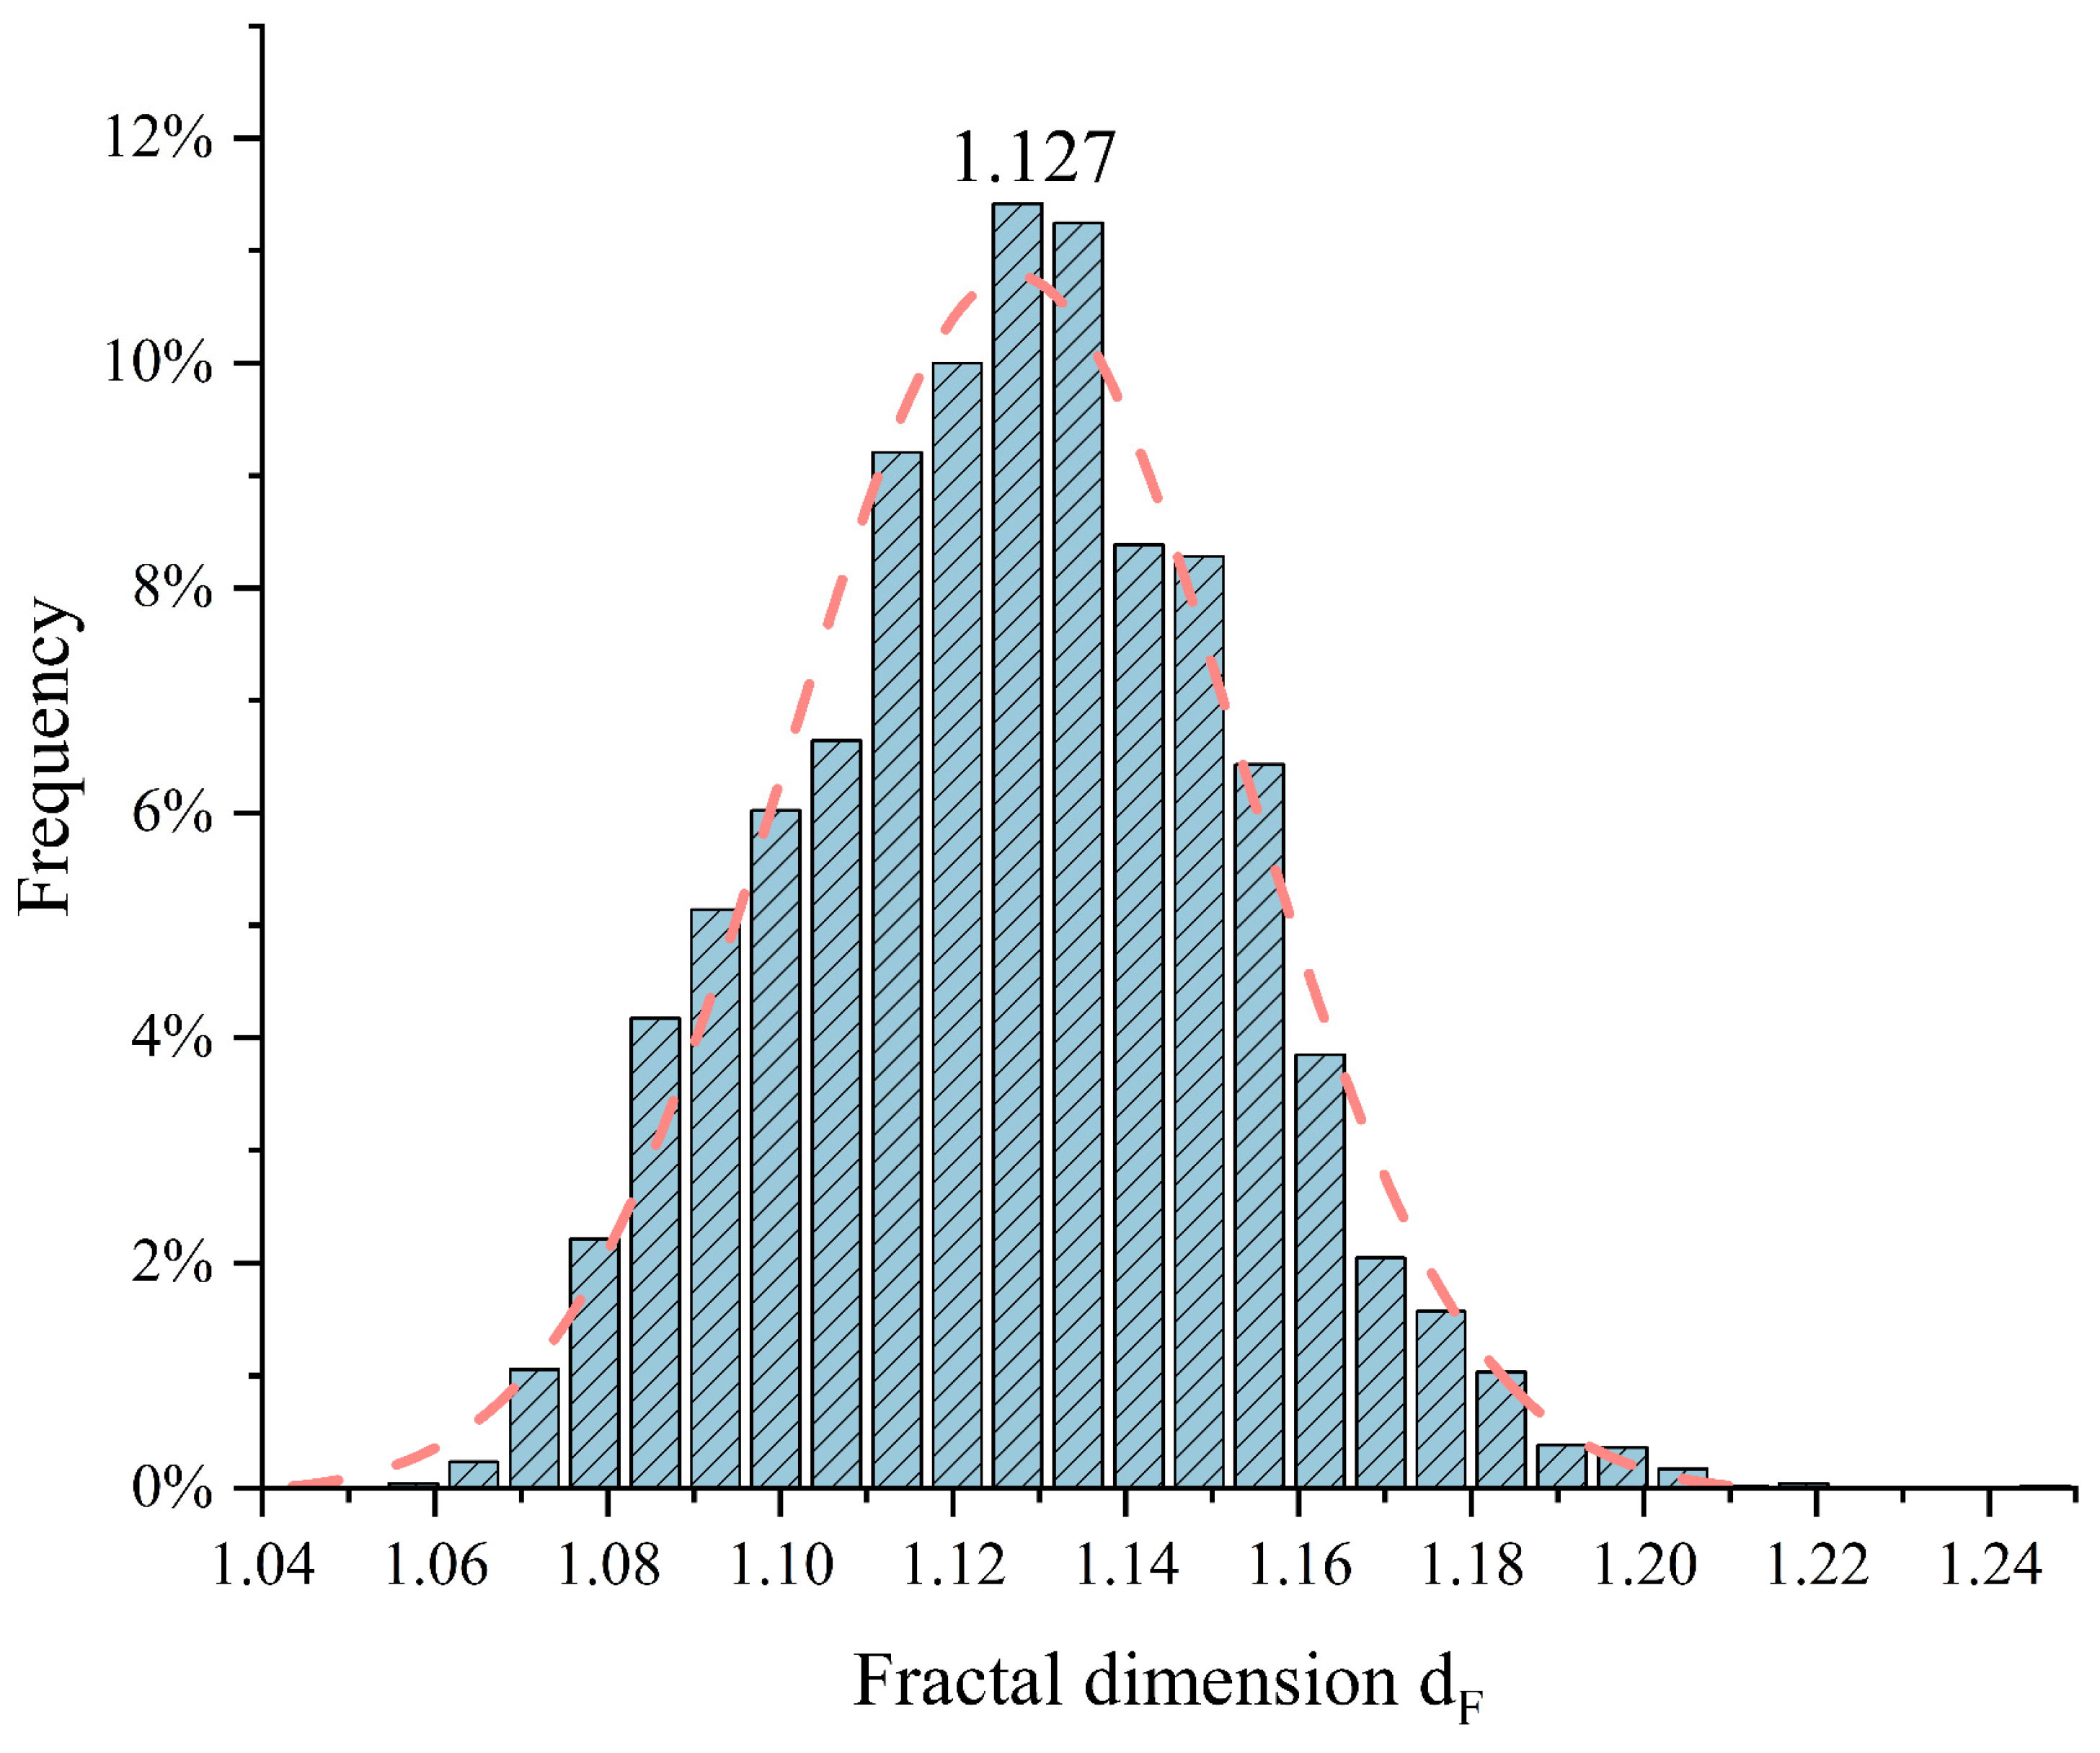
where the fractal dimension of the plane strain fracture region, dF, follows a normal distribution (dF~N(μ,σ2)) with a mean value of μ = 1.127, as shown in Figure 13, This mean value closely aligns with the threshold fractal dimension of the transition from transcrystalline cracking to intergranular fracturing. Simultaneously, taking the logarithm of Equation (13) yields
Figure 13.
Frequency statistics of fractal dimensions in plane strain fracture regions.
Since dF follows a normal distribution, Equation (14) can be derived based on the probability distribution.
It can be inferred that the fracture toughness KIC exhibits a lognormal distribution. Therefore, the relationship between fracture toughness and its dispersion may be straightforwardly evaluated using this method with a single test specimen. However, the accuracy of this method needs to be verified through experiments.
5. Conclusions
In this study, a modified method for evaluating the relationship between fracture toughness KC and energy release rate GC was developed based on three-dimensional fracture morphology analysis and fractal theory. The key findings can be summarized as follows:
- By incorporating the fractal dimension into the calculation of the true fracture surface area, termed the ubiquitiform surface area, the energy release rate GC could be derived from the external work and ubiquitiform surface area. The proposed method, accounting for distinct fractal dimensions in different fracture regions, yielded KC values closer to the experimental data compared to utilizing the nominal fracture area.
- The fractal dimensions of the plane stress and plane strain fracture regions were determined separately using the box-counting method. The plane strain region exhibited a higher fractal dimension, indicating greater roughness and tortuosity compared to the plane stress region.
- The fractal dimension in the plane strain fracture region followed a normal distribution. Consequently, the relationship between fracture toughness KC and its dispersion could be quantified through the distribution of fractal dimensions in this region.
- Further research could focus on refining these methods and exploring their applicability to a broader range of materials and loading conditions to generalize the findings.
Author Contributions
Conceptualization, H.L. and A.L.; methodology, H.L.; software, H.L.; validation, Z.H., A.L. and Y.X.; investigation, J.Y.; data curation, Z.H.; writing—original draft preparation, J.Y.; writing—review and editing, H.L.; visualization, Y.X.; supervision, D.H. and H.Y.; project administration, D.H.; funding acquisition, D.H. All authors have read and agreed to the published version of the manuscript.
Funding
This study was supported by the National Major Science and Technology Project (Grant No. J2019-IV-0007-0075) and the Fundamental Research Funds for the Central Universities (Grant No. YWF-23-L-1134).
Data Availability Statement
The original contributions presented in the study are included in the article, further inquiries can be directed to the corresponding authors.
Conflicts of Interest
The authors declare that they have no known competing financial interests or personal relationships that could have appeared to influence the work reported in this study.
Nomenclature
| a0 | Initial crack length |
| Ab | Plane strain fracture region |
| Ap | Area of the nominal region |
| At | Total area of As and Ab |
| As | Plane stress fracture region |
| Aauf | Ubiquitiform surface area |
| Atuf | Ubiquitiform surface area of the fracture |
| B | Specimen thickness |
| ΔB | Interval between each curve |
| D | Ubiquitiform complexity |
| dF | Fractal dimension |
| dFi | Fractal dimension of the ith curve |
| E | Young’s modulus |
| GC | Energy release rate |
| i | ith curve |
| KC | Fracture toughness |
| KCu | Fracture toughness by integrating the fractal dimension and fracture energy |
| KIC | Plane strain fracture toughness |
| KQ | Conditional fracture toughness |
| l | Nominal straight-line length of the two-dimensional crack growth curve |
| lF | Corresponding fractal curve length |
| luf | Ubiquitiform length |
| n | Number of divided crack propagation regions curves |
| N(δ) | Number of squares (in box-counting dimension method) |
| Pmax | Maximum load |
| Pq | Critical load |
| W | Width of the specimen |
| Wt | Work performed by an external force |
| δ | The side length δ of the squares (in box-counting dimension method) |
| δe | Elongation |
| Tensile strength | |
| σy | Yield strength |
| v | Poisson’s ratio |
References
- Suresh, S. Fatigue of Materials, 2nd ed.; Cambridge University Press: Cambridge, UK, 1998. [Google Scholar]
- Rouxel, T.; Yoshida, S. The fracture toughness of inorganic glasses. J. Am. Ceram. Soc. 2017, 100, 4374–4396. [Google Scholar] [CrossRef] [Scilit]
- Erarslan, N.; Williams, D.J. The damage mechanism of rock fatigue and its relationship to the fracture toughness of rocks. Int. J. Rock Mech. Min. Sci. 2012, 56, 15–26. [Google Scholar] [CrossRef] [Scilit]
- Li, P.; Cheng, L.; Yan, X.; Huang, D.; Qin, X.; Zhang, X. A temperature-dependent model for predicting the fracture toughness of superalloys at elevated temperature. Theor. Appl. Fract. Mech. 2018, 93, 311–318. [Google Scholar] [CrossRef] [Scilit]
- Ren, X.; Wu, S.; Xing, H.; Fang, X.; Ao, N.; Zhu, T.; Li, Q.; Kang, G. Fracture mechanics based residual life prediction of railway heavy coupler with measured load spectrum. Int. J. Fract. 2022, 234, 313–327. [Google Scholar] [CrossRef] [Scilit]
- Yu, M.; Luo, Z.; Chao, Y.J. Correlations between Charpy V-notch impact energy and fracture toughness of nuclear reactor pressure vessel (RPV) steels. Eng. Fract. Mech. 2015, 147, 187–202. [Google Scholar] [CrossRef] [Scilit]
- ASTM E399-22; Standard Test Method for Linear-Elastic Plane-Strain Fracture Toughness of Metallic Materials. ASTM International: West Conshohocken, PA, USA, 2022.
- ASTM D5045-99; Standard Test Methods for Plane-Strain Fracture Toughness and Strain Energy Release Rate of Plastic Materials. ASTM International: West Conshohocken, PA, USA, 2017.
- Anderson, T.L. Fracture mechanics: Fundamentals and Applications, 3rd ed.; CRC Press: Boca Raton, FL, USA, 2017. [Google Scholar]
- Qiao, Y.; Zhang, Z.; Zhang, S. An Experimental Study of the Relation between Mode I Fracture Toughness, K(Ic), and Critical Energy Release Rate, G(Ic). Materials 2023, 16, 1056. [Google Scholar] [CrossRef] [Scilit] [PubMed]
- Bazant, Z.P.; Planas, J. Fracture and Size Effect in Concrete and Other Quasibrittle Materials; CRC Press: Boca Raton, FL, USA, 1997. [Google Scholar]
- Dutler, N.; Nejati, M.; Valley, B.; Amann, F.; Molinari, G. On the link between fracture toughness, tensile strength, and fracture process zone in anisotropic rocks. Eng. Fract. Mech. 2018, 201, 56–79. [Google Scholar] [CrossRef] [Scilit]
- Zhang, Z.X.; Ouchterlony, F. Energy requirement for rock breakage in laboratory experiments and engineering operations: A review. Rock Mech. Rock Eng. 2022, 55, 629–667. [Google Scholar] [CrossRef] [Scilit]
- Mandelbrot, B.B.; Passoja, D.E.; Paullay, A.J. Fractal character of fracture surfaces of metals. Nature 1984, 308, 721–722. [Google Scholar] [CrossRef] [Scilit]
- Ding, C.; Xu, T.; Chen, Q.; Su, C.; Zhao, P. Study on the relationship between fractal characteristics and mechanical properties of tensile fracture of reinforced concrete structures. KSCE J. Civ. Eng. 2022, 26, 2225–2233. [Google Scholar] [CrossRef] [Scilit]
- Khezrzadeh, H.; Mofid, M. Tensile fracture behavior of heterogeneous materials based on fractal geometry. Theor. Appl. Fract. Mech. 2006, 46, 46–56. [Google Scholar] [CrossRef] [Scilit]
- Ji, G.; Li, K.; Zhang, G.; Li, S.; Zhang, L. An assessment method for shale fracability based on fractal theory and fracture toughness. Eng. Fract. Mech. 2019, 211, 282–290. [Google Scholar] [CrossRef] [Scilit]
- Heping, X. The fractal effect of irregularity of crack branching on the fracture toughness of brittle materials. Int. J. Frac. 1989, 41, 267–274. [Google Scholar] [CrossRef] [Scilit]
- Pimenta, S.; Pinho, S.T. An analytical model for the translaminar fracture toughness of fibre composites with stochastic quasi-fractal fracture surfaces. J. Mech. Phys. Solids 2014, 66, 78–102. [Google Scholar] [CrossRef] [Scilit]
- Thompson, J.Y.; Anusavice, K.J.; Balasubramaniam, B.; Mecholsky, J.J., Jr. Effect of micmcracking on the fracture toughness and fracture surface fractal dimension of lithia-based glass-ceramics. J. Am. Ceram. Soc. 1995, 78, 3045–3049. [Google Scholar] [CrossRef] [Scilit]
- Pande, C.S.; Richards, L.E.; Louat, N.; Dempsey, B.; Schwoeble, A. Fractal characterization of fractured surfaces. Acta Metall. 1987, 35, 1633–1637. [Google Scholar] [CrossRef] [Scilit]
- Richards, L.E.; Dempsey, B.D. Fractal characterization of fractured surfaces in Ti-4.5 Al-5.0 Mo-1.5 Cr (CORONA 5). Scr. Metall. 1988, 22, 687–689. [Google Scholar] [CrossRef] [Scilit]
- Strnadel, B.; Ferfecki, P.; Židlík, P. Statistical characteristics of fracture surfaces in high-strength steel drop weight tear test specimens. Eng. Fract. Mech. 2013, 112, 1–13. [Google Scholar] [CrossRef] [Scilit]
- Carpinteri, A.; Spagnoli, A.; Vantadori, S. Size effect in S–N curves: A fractal approach to finite-life fatigue strength. Int. J. Fatigue 2009, 31, 927–933. [Google Scholar] [CrossRef] [Scilit]
- Chuan, Z.; Yanhui, C.; Weixing, Y. The use of fractal dimensions in the prediction of residual fatigue life of pre-corroded aluminum alloy specimens. Int. J. Fatigue 2014, 59, 282–291. [Google Scholar] [CrossRef] [Scilit]
- Ou, Z.C.; Li, G.Y.; Duan, Z.P.; Huang, F.-L. Ubiquitiform in applied mechanics. J. Theor. Appl. Mech. 2014, 52, 37–46. [Google Scholar]
- Ou, Z.C.; Yang, M.; Li, G.Y.; Duan, Z.-P.; Huang, F.-L. Ubiquitiformal fracture energy. J. Theor. Appl. Mech. 2017, 55, 1101–1108. [Google Scholar] [CrossRef] [Scilit]
- Yang, B.; Cao, X.; Han, T.; Li, P.; Shi, J. Effect of heterogeneity on the extension of ubiquitiformal cracks in rock materials. Fractal Fract. 2022, 6, 317. [Google Scholar] [CrossRef] [Scilit]
- Shi, J.; Jiang, H.; Hu, Y.; Cao, X. Test method for fracture toughness GIC based on ubiquitiform theory. Eng. Fract. Mech. 2022, 271, 108640. [Google Scholar] [CrossRef] [Scilit]
- Mu, Z.; Lung, C. Studies on the fractal dimension and fracture toughness of steel. J. Phys. D Appl. Phys. 1988, 21, 848. [Google Scholar] [CrossRef] [Scilit]
- Osovski, S.; Srivastava, A.; Ponson, L.; Bouchaud, E.; Tvergaard, V.; Ravi-Chandar, K.; Needleman, A. The effect of loading rate on ductile fracture toughness and fracture surface roughness. J. Mech. Phys. Solids 2015, 76, 20–46. [Google Scholar] [CrossRef] [Scilit]
- Shi, J.; Zhang, N.; Cao, X.; Hu, Y. Characterization of ubiquitiform crack fracture parameters based on ubiquitiform theory. Acta Mech. 2020, 231, 2589–2601. [Google Scholar] [CrossRef] [Scilit]
- Carpinteri, A. Fractal nature of material microstructure and size effects on apparent mechanical properties. Mech. Mater. 1994, 18, 89–101. [Google Scholar] [CrossRef] [Scilit]
- Issa, M.A.; Issa, M.A.; Islam, M.S.; Chudnovsky, A. Fractal dimension—A measure of fracture roughness and toughness of concrete. Eng. Fract. Mech. 2003, 70, 125–137. [Google Scholar] [CrossRef] [Scilit]
- Brown, W.F.; Srawley, J.E. Plane Strain Crack Toughness Testing of High Strength Metallic Materials; ASTM International: West Conshohocken, PA, USA, 1966. [Google Scholar]
- Srawley, J.E.; Jones, M.H.; Brown, W. Determination of plane strain fracture toughness. Mater. Res. Stand. 1967, 7, 262–266. [Google Scholar]
- Zhuang, D.; Yin, T.; Li, Q.; Wu, Y.; Chen, Y.; Yang, Z. Fractal fracture toughness measurements of heat-treated granite using hydraulic fracturing under different injection flow rates. Theor. Appl. Fract. Mech. 2022, 119, 103340. [Google Scholar] [CrossRef] [Scilit]
- Hu, D.; Mao, J.; Wang, X.; Meng, F.; Song, J.; Wang, R. Probabilistic evaluation on fatigue crack growth behavior in nickel based GH4169 superalloy through experimental data. Eng. Fract. Mech. 2018, 196, 71–82. [Google Scholar] [CrossRef] [Scilit]
- ASTM E8/E8M-22; Standard Test Methods for Tension Testing of Metallic Materials. ASTM International: Conshohocken, PA, USA, 2022.
- Hu, X.; Zhuang, S.; Zheng, H.; Zhao, Z.; Jia, X. Non-Unified Constitutive Models for the Simulation of the Asymmetrical Cyclic Behavior of GH4169 at Elevated Temperatures. Metals 2022, 12, 1868. [Google Scholar] [CrossRef] [Scilit]

Disclaimer/Publisher’s Note: The statements, opinions and data contained in all publications are solely those of the individual author(s) and contributor(s) and not of MDPI and/or the editor(s). MDPI and/or the editor(s) disclaim responsibility for any injury to people or property resulting from any ideas, methods, instructions or products referred to in the content. |
© 2024 by the authors. Licensee MDPI, Basel, Switzerland. This article is an open access article distributed under the terms and conditions of the Creative Commons Attribution (CC BY) license (https://creativecommons.org/licenses/by/4.0/).