


Abstract
On the one hand, Ni3-xCoxB2O6 solid solutions are promising anode materials for lithium batteries, and on the other hand, they have antiferromagnetic properties. This study examines the lattice dynamics of Ni3-xCoxB2O6 solid solutions for x = 0, 1, 2, 3 by means of quantum chemistry and Raman spectroscopy. The vibrational spectra of the compound NiCo2B2O6 have been studied using the polarized Raman spectroscopy method. Good agreement was found between the theoretical and experimental results. As expected, the largest change in frequencies was observed in the modes where the vibrations of the metal ion had a large amplitude. The substitution of cobalt by nickel does not lead to the appearance of soft modes. This fact indicates that the structures of the solid solutions are stable.
1. Introduction
Oxyborates Ni3B2O6 and Co3B2O6 and solid solutions of Ni3-xCoxB2O6 were obtained in the 1990s [1,2,3,4,5]. These compounds are interesting both from the fundamental point of view and as promising anode materials for lithium-ion and sodium-ion batteries [6]. The compounds Ni3B2O6 and Co3B2O6 are antiferromagnets, but their easy axis of magnetization is different [7,8]. Mixing magnetic ions with incompatible single-ion anisotropies gives rise to what can be thought of as an atomic-level composite. This random site-dependent anisotropy in combination with the inter-species exchange interaction creates frustration in the system and may result in what is known as an oblique antiferromagnetic phase [9,10,11,12,13,14,15]. Thus, the solid solutions of Ni3-xCoxB2O6 are interesting in terms of magnetic properties, but it is not only their magnetic properties that should attract the attention of researchers. The investigation of the lattice dynamics of Ni3B2O6 shows several new phonon modes to appear at the antiferromagnetic ordering temperature [16]. In Co3B2O6, such effects are not observed [17]. To understand the mechanisms of the appearance of new modes during the antiferromagnetic phase transition, it is necessary to study the lattice dynamics of the Ni3-xCoxB2O6 solid solutions. For the practical application of new materials, in particular solid solutions, it is fundamentally important that the structures stay stable when the temperature decreases [18,19,20]. One of the implicit advantages of the density functional theory is that the modeling performs at temperatures close to zero. If unstable modes are detected as a result of the calculation, then the structure is unstable and can undergo a phase transition when the temperature decreases. In this paper, we present a theoretical study of the lattice dynamics of the Ni2CoB2O6 and Co2NiB2O6 solid solutions and an experimental study of the Raman spectra of Co2NiB2O6.
2. The Crystal Structure
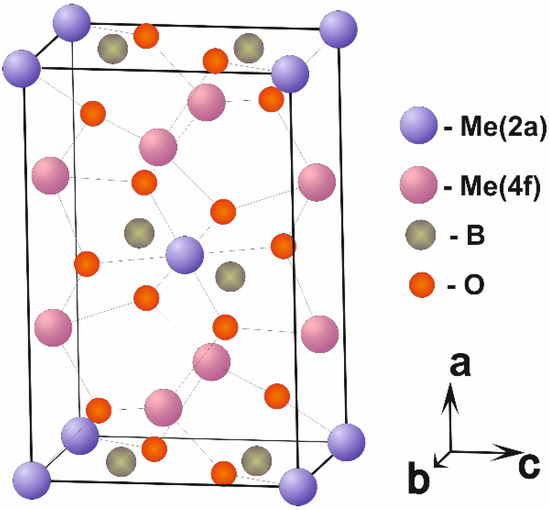
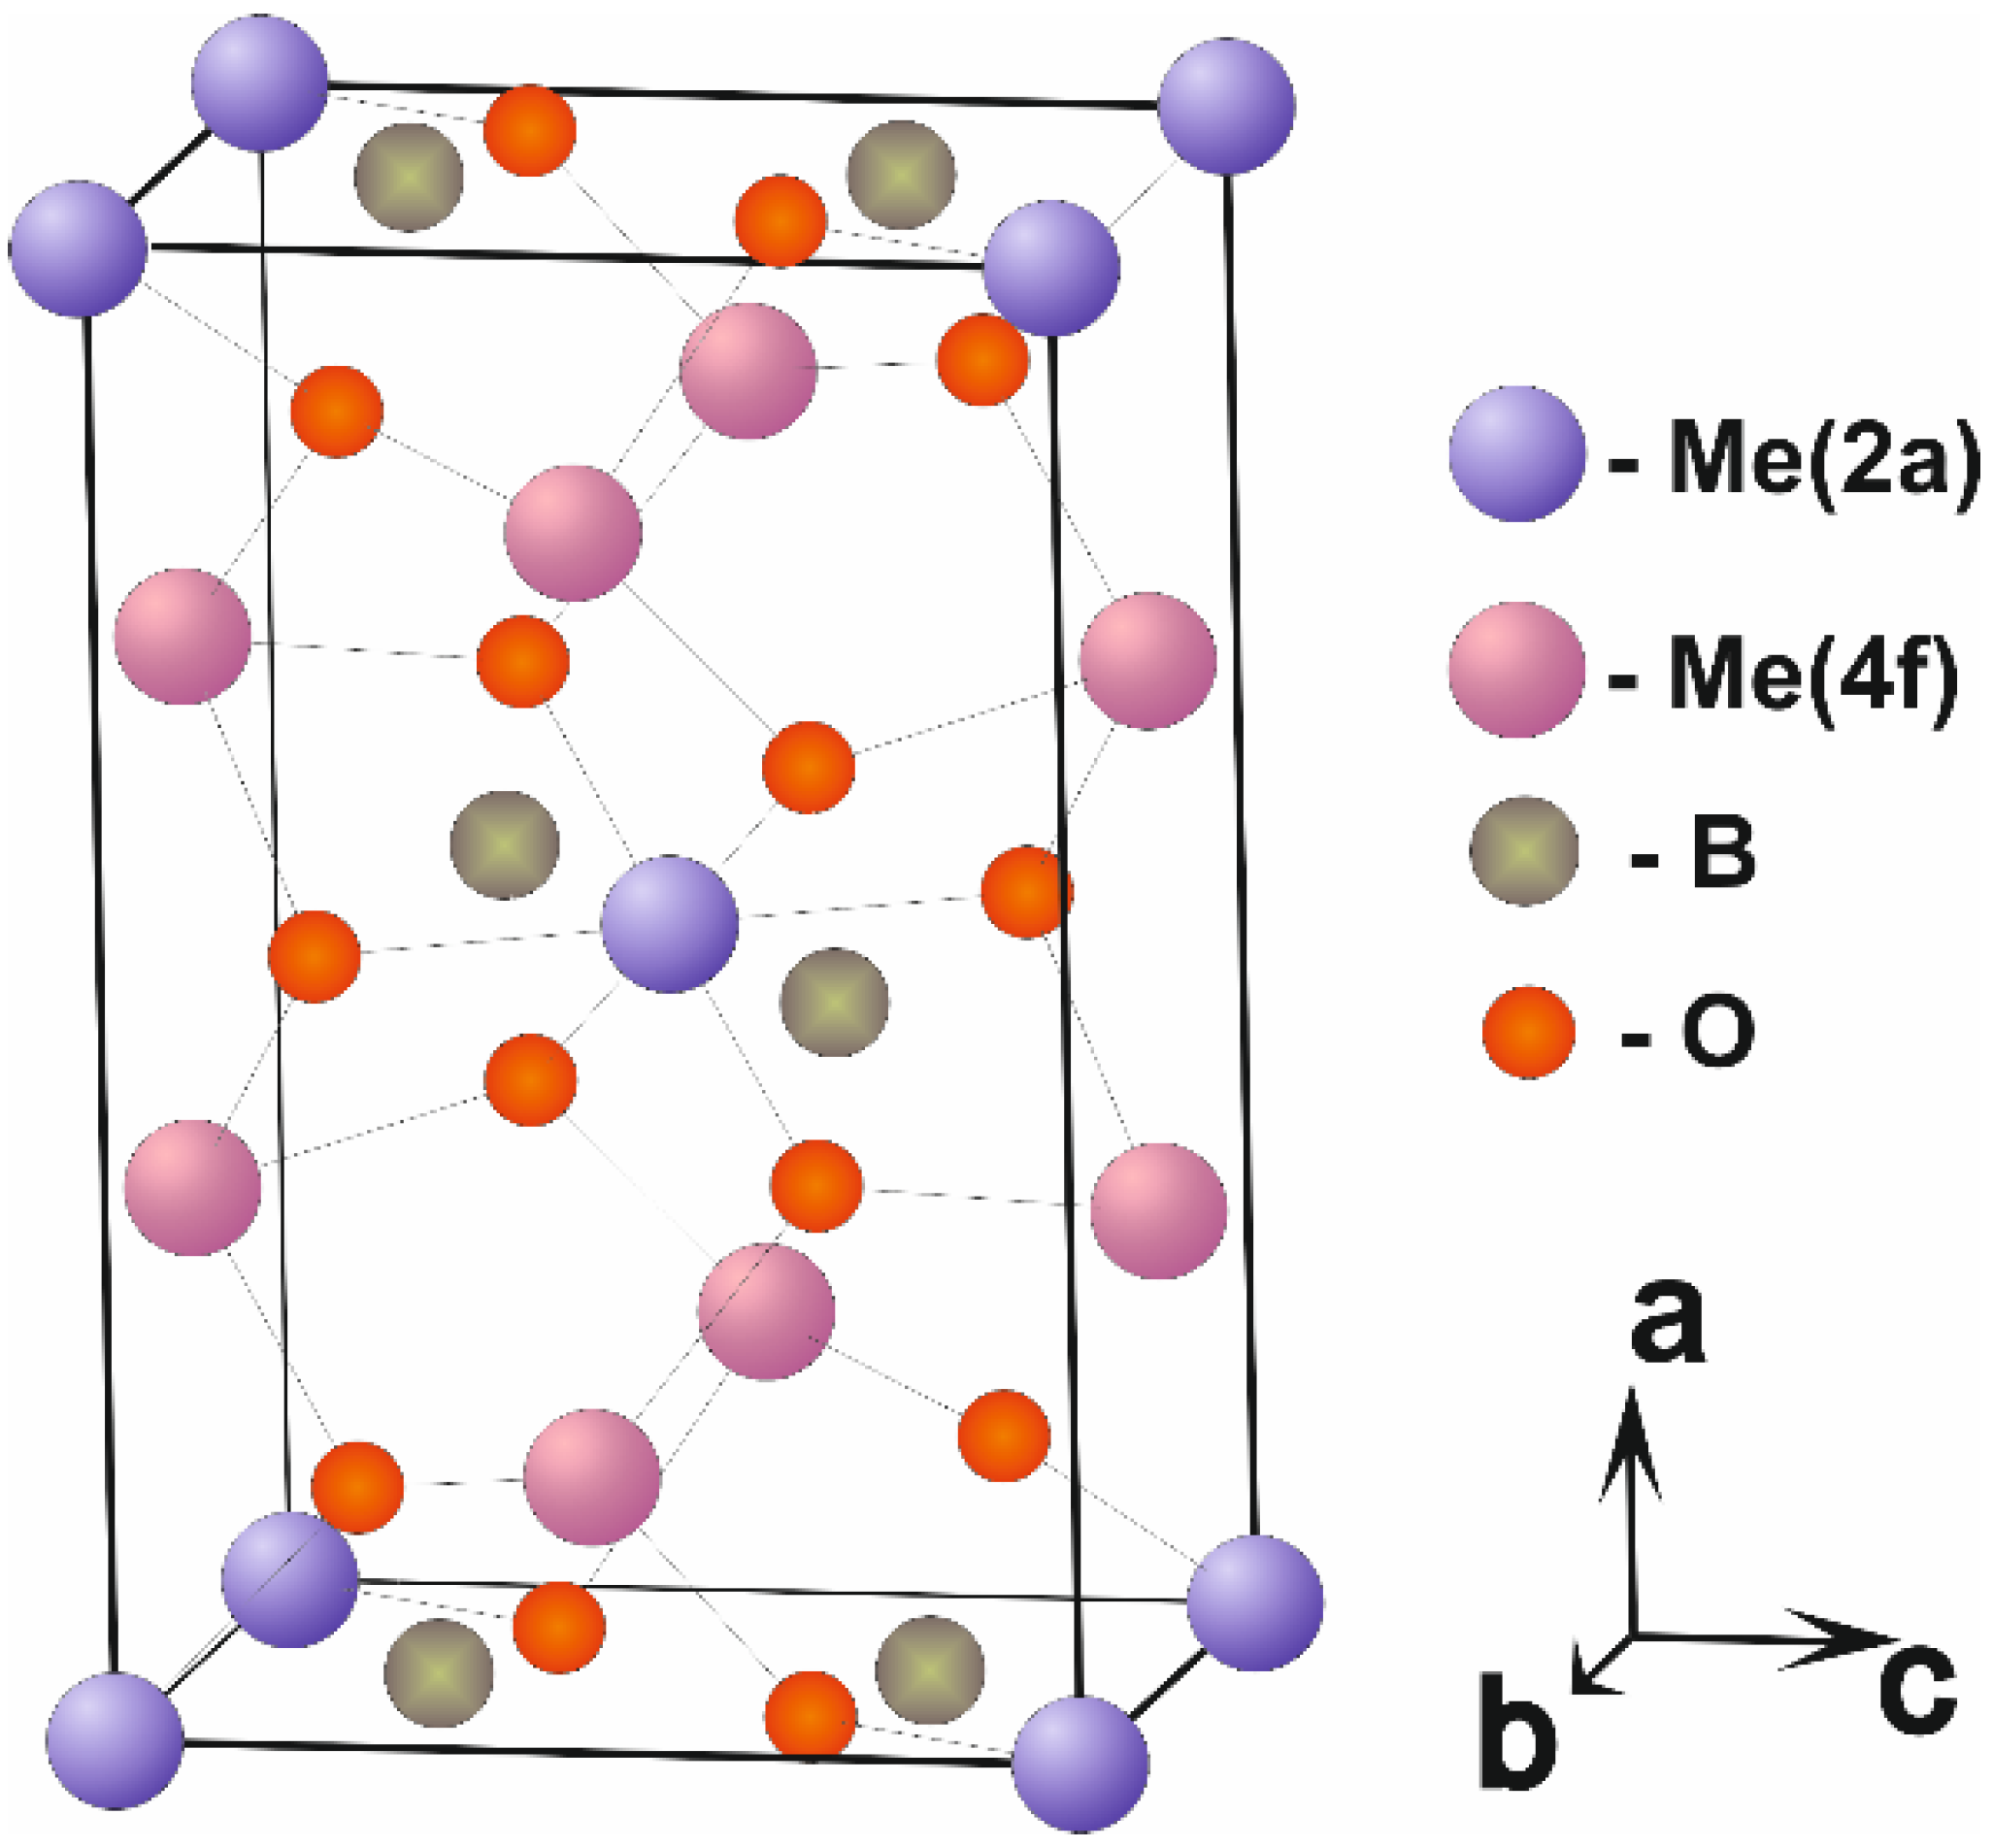
The crystal structure of Ni3-xCoxB2O6 is classified as the kotoite structure and belongs to the space symmetry group Pnnm (58) (Figure 1). The unit cell of kotoite contains six transition metal atoms occupying two crystallographic positions 2a and 4f. The transition metal atoms are located in oxygen octahedra, which are strongly distorted. Boron and oxygen ions form the BO3 group. In the solid solutions Ni2CoB2O6 and NiCo2B2O6, nickel and cobalt ions can randomly occupy both positions (2a and 4f). Lattice dynamics have been calculated for the cation ordered state. In Ni2CoB2O6, the cobalt ions occupy the 2a crystallographic position, while the nickel ions occupy the 4f position. In NiCo2B2O6, the cobalt ions occupy the 4f crystallographic position, while the nickel ions occupy the 2a position.
Figure 1.
The crystal structure of kotoite. The 2a and 4f crystallographic positions of the transition metal ions are shown by different colors.
The first-principles calculations were carried out using the projector-augmented wave (PAW) method [21] within the density functional theory (DFT), as implemented in the VASP code [22,23]. We used the generalized gradient approximation (GGA) functional with Perdew–Burke–Ernzerhof (PBE) parametrization [24]. Electronic configurations were chosen as follows: Ni, 3d94s1; Co, 3d84s1; B, 2s22p1; and O, 2s22p4. The plane-wave cutoff was set at 400 eV. The size of the k-point mesh for the Brillouin zone, based on the Monkhorst–Pack scheme [25], was 7 × 5 × 9. The GGA+U calculations within the Dudarev’s approach were performed by applying a Hubbard-like potential for d states of Fe [26].
The lattice parameters and ion coordinates were optimized until the residual forces acting on the ions became less than 0.02 eV/Å. In this case, the lattice parameters are determined with an accuracy of 10−5 and the coordinates of atoms up to 10−6. The optimized lattice parameters for Ni3-xCoxB2O6 (x = 0, 1, 2, 3) are presented in Table 1. Here, good agreement with the experimental data is observed with the difference being less than 2 percent.
Table 1.
The calculated lattice parameters in comparison with the experimental data.
3. The Lattice Dynamics Calculations
The phonons were calculated by constructing a supercell (2 × 2 × 2) and calculating the force constants using the small displacement method implemented in PHONOPY [24]. The decomposition of the complete vibrational representation into irreducible representations at the center of the Brillouin zone has the following form [16]:
Г = 8Ag + 8B1g + 7B2g + 7B3g + 7Au + 7B1u + 11B2u + 11B3u, including acoustic modes B1u + B2u + B3u.
The calculated phonon frequencies for Ni3-xCoxB2O6 (x = 0, 1, 2, 3) are presented in Table 2 and Table 3. The experimental phonon frequencies of Ni3B2O6 and Co3B2O6 from [16,17] are also given in the tables for comparison.
Table 2.
The calculated phonon frequencies (g-symmetry) for Ni3-xCoxB2O6 (x = 0, 1, 2, 3). The experimentally measured frequencies are presented for comparison.
Table 3.
The calculated phonon frequencies (u-symmetry) for Ni3-xCoxB2O6 (x = 0, 1, 2, 3). The experimentally measured frequencies are presented for comparison.
The crystal structure of the kotoite contains triangle BO3 groups. The frequencies of normal vibrations for an isolated [BO3]3− anion are 672 cm−1, 765 cm−1, 939 cm−1 and 1260 cm−1 [27]. In [15], the correlational analysis was carried out, showing that each Raman-active vibration of the free BO3 group generates a Raman combination of mode in the crystal, either (Ag + B1g) or (B2g + B3g), but each IR-active vibration transforms into either a combination mode (B2u + B3u) or a simple mode B1u in the infrared spectrum of the crystal [28]. The IR spectrum data of Co2Ni(BO3)2 and CoNi2(BO3)2 are presented in [4,5]. The comparison of the IR spectrum data [4,5] with the calculated frequencies of Co2Ni(BO3)2 and CoNi2(BO3)2 are shown in Table 4. The experimental and calculated frequencies are shown to be in good agreement.
Table 4.
The comparison of the IR spectrum data [4,5] with the calculated frequencies of Co2Ni(BO3)2 and CoNi2(BO3)2.
As one can see from Table 1 and Table 2, some frequencies are similar in all the compounds, while other frequencies differ by more than 40 cm−1. The vibration frequencies associated with the movement of metal ions undergo the greatest changes. In Table 5, a part of the eigenvector of the B2u mode is presented. As is shown in the table, the direction and amplitude of vibration are changed.
Table 5.
A part of the eigenvector of the B2u mode.
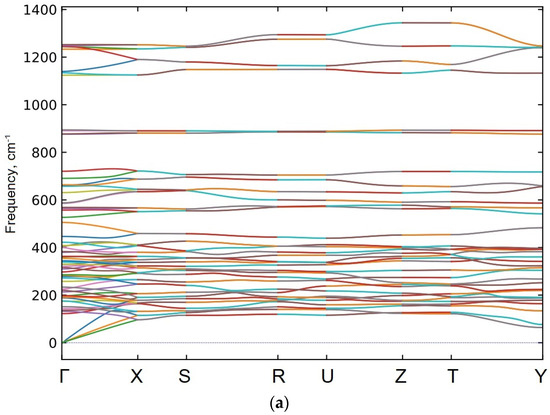
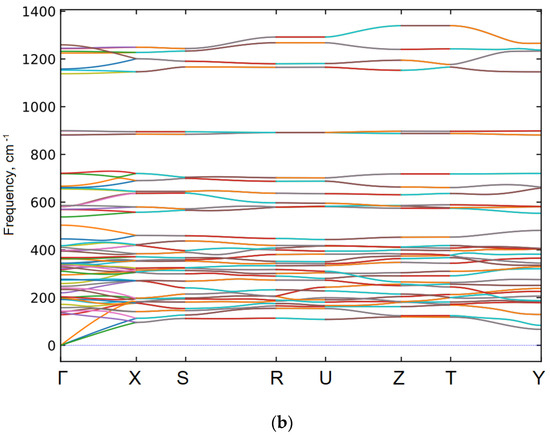
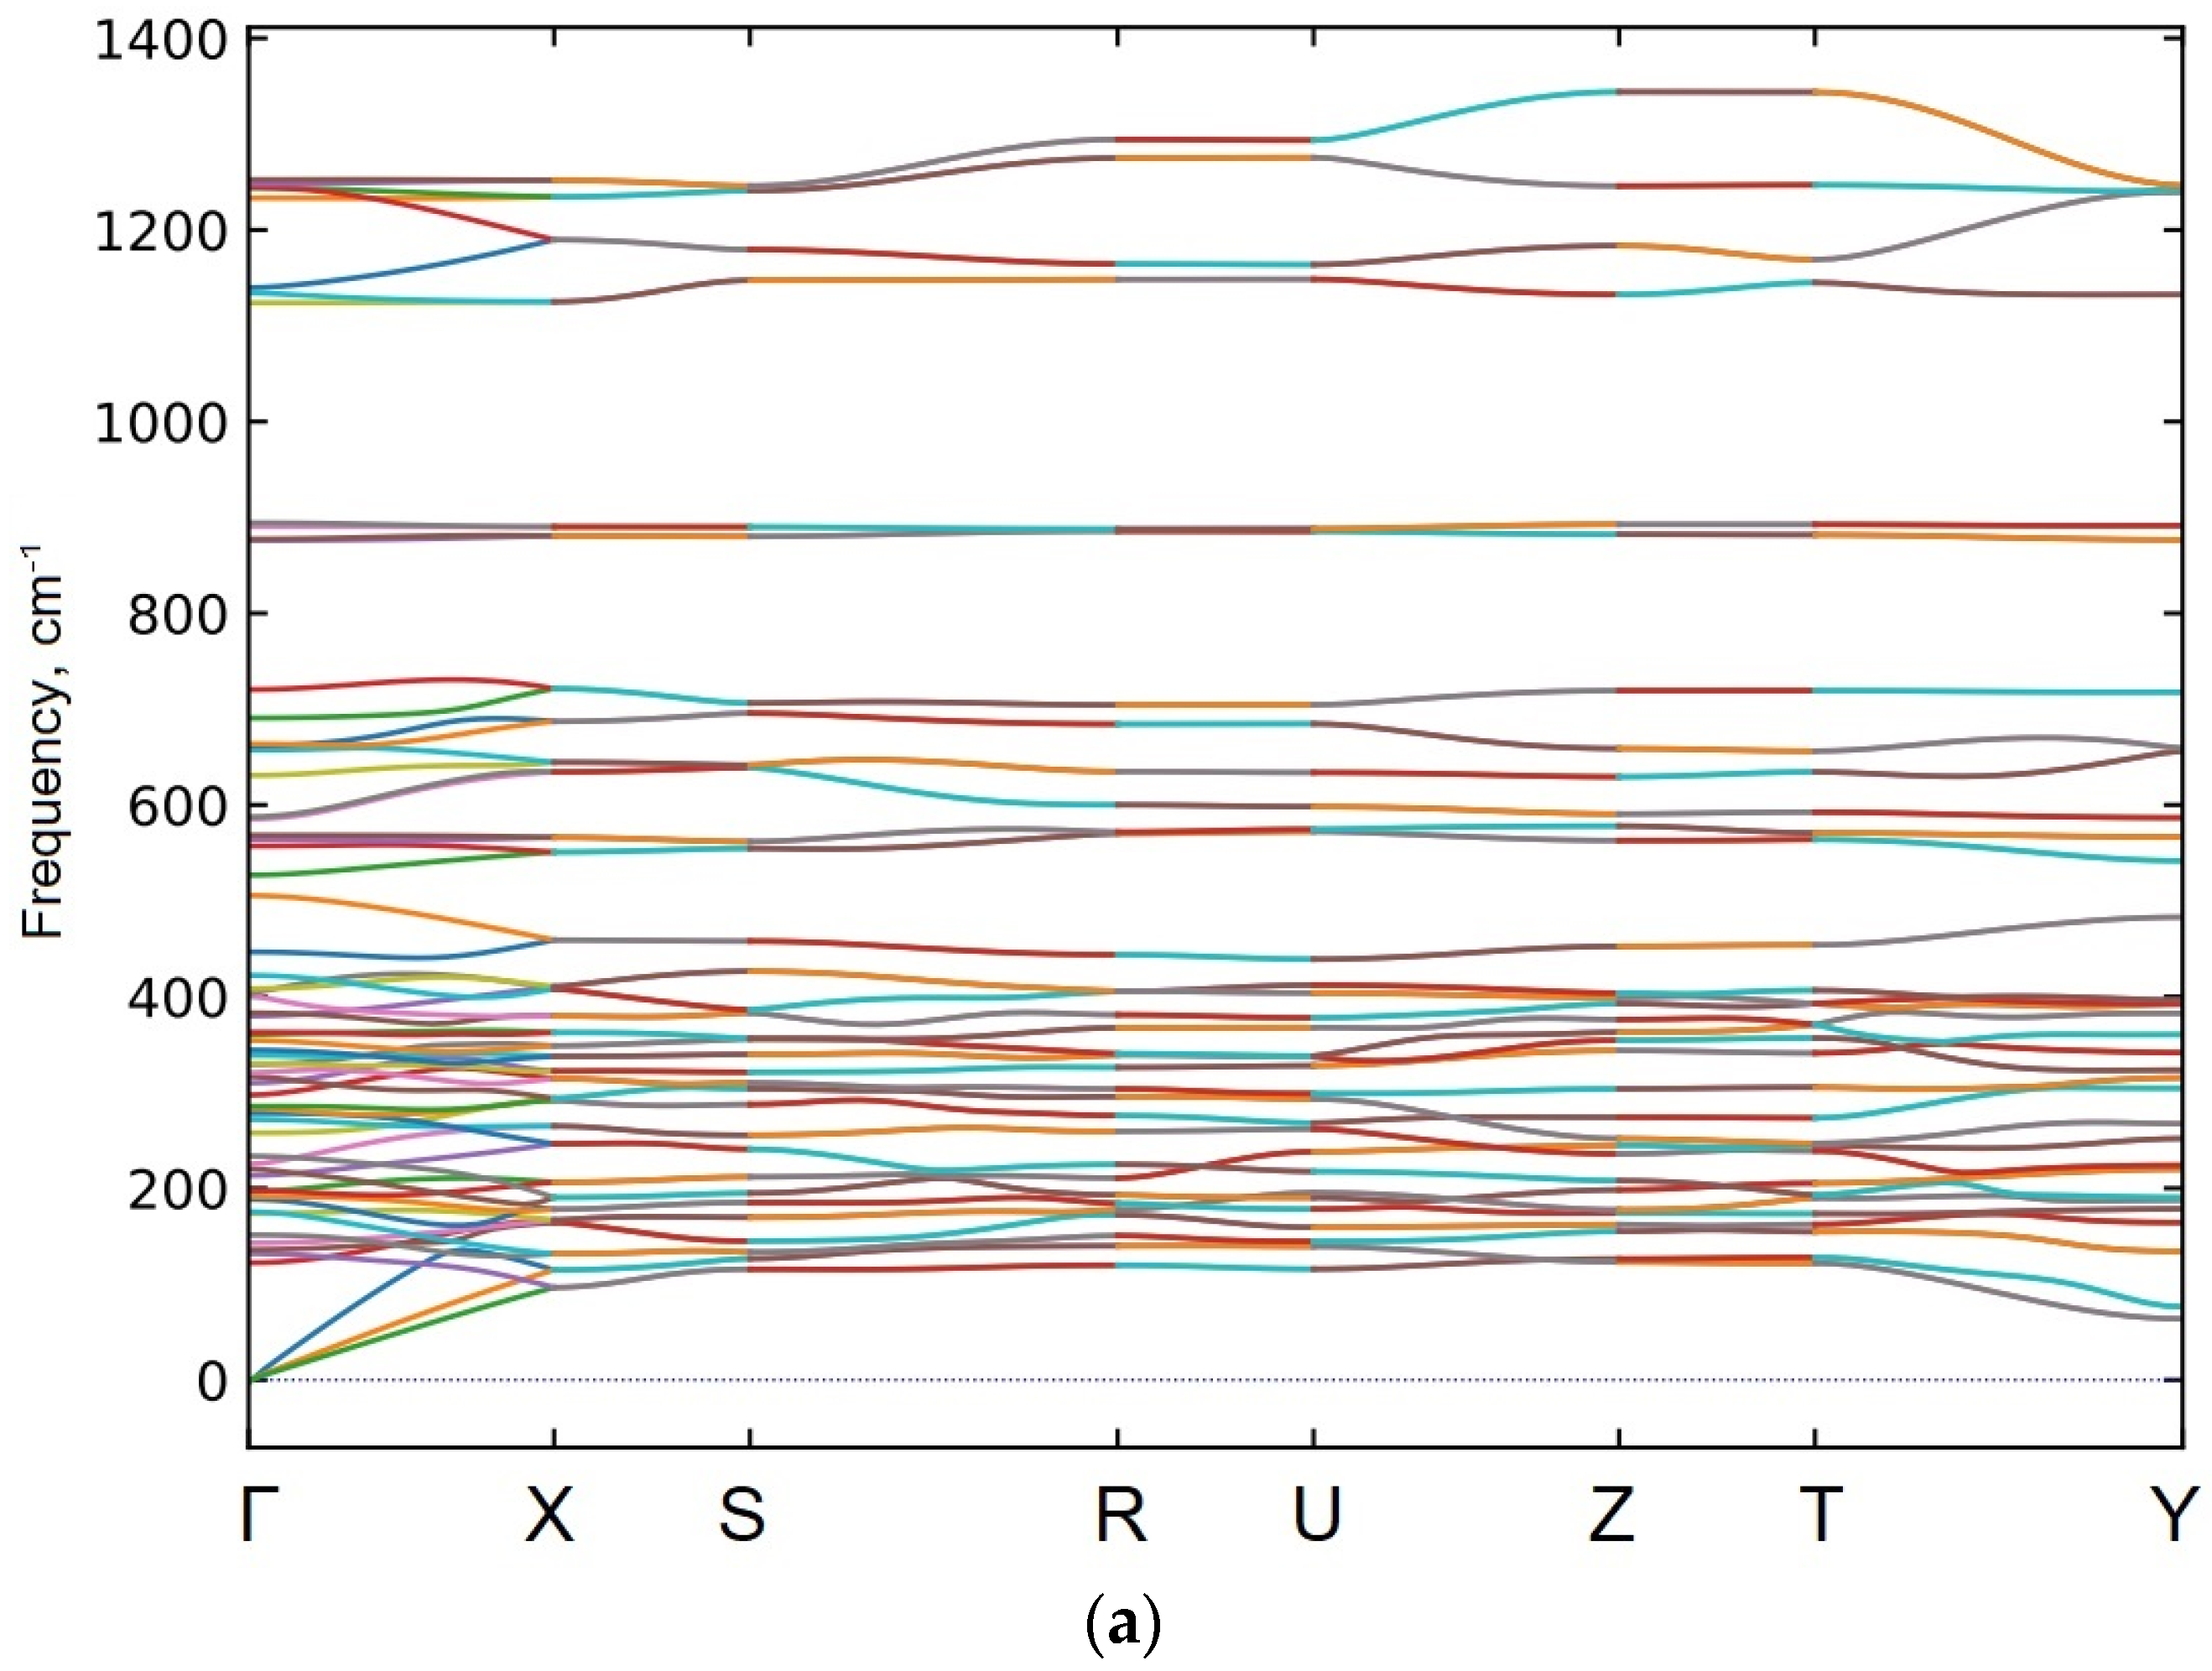
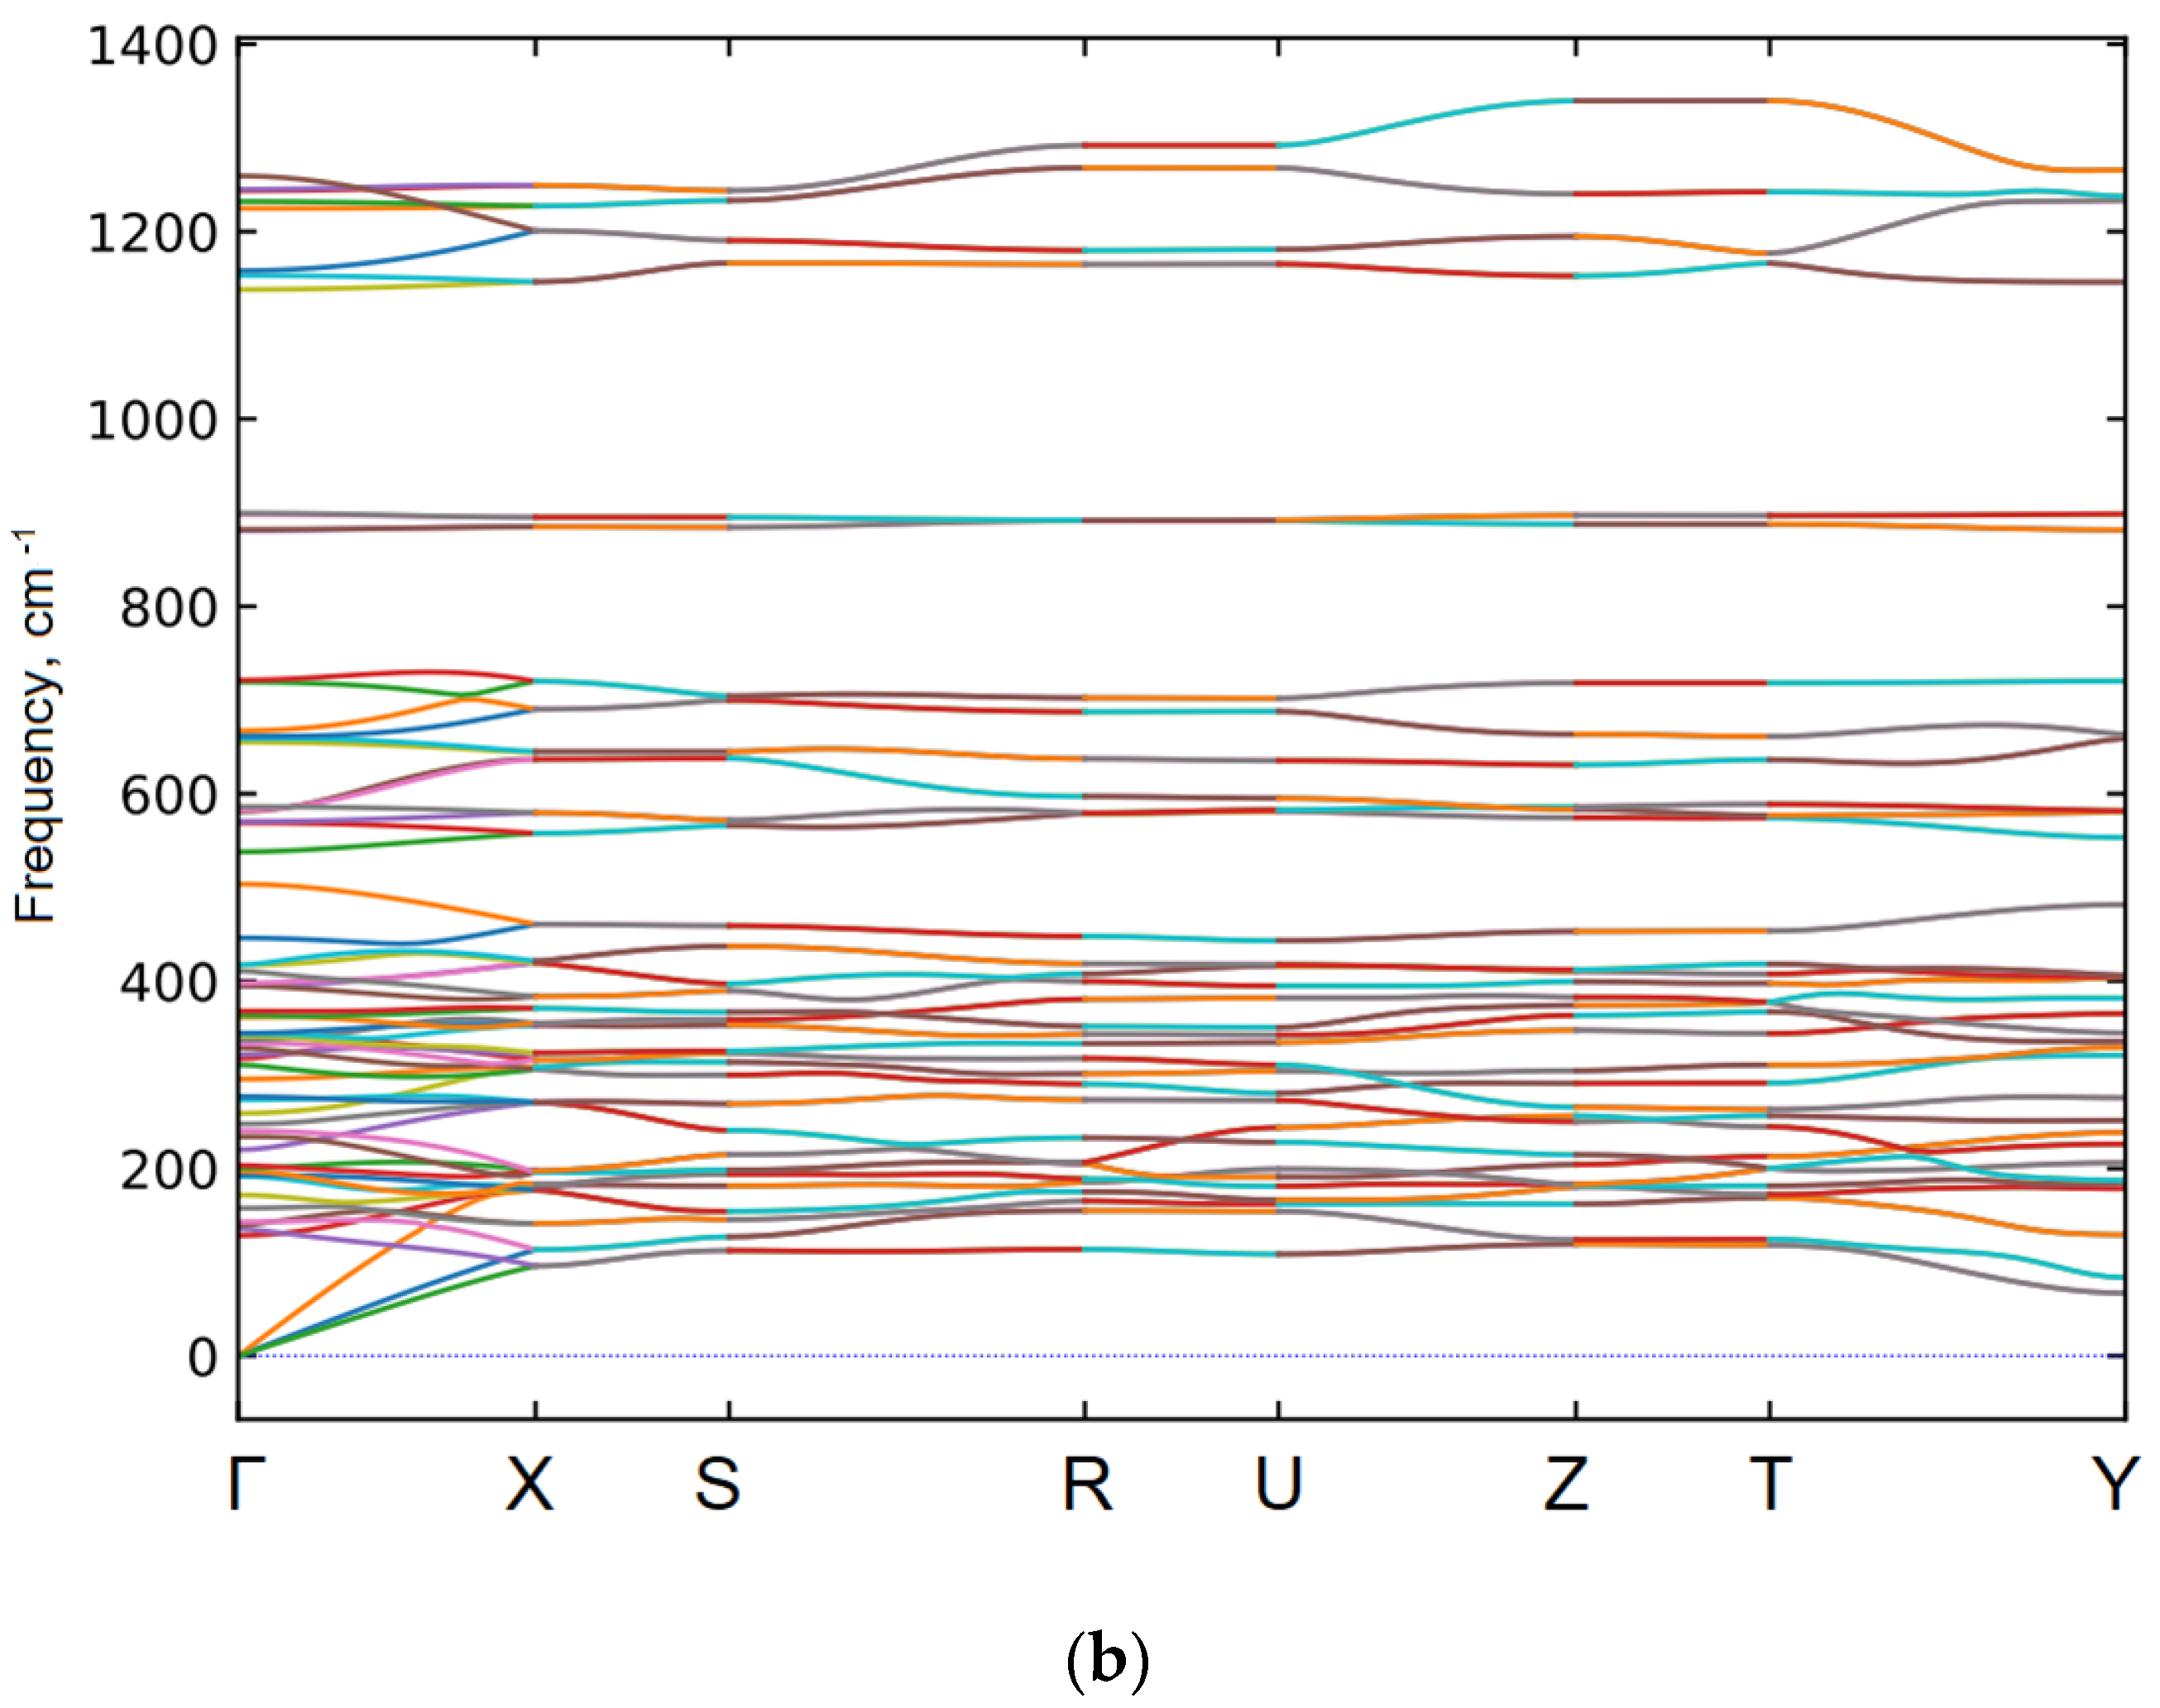
Figure 2 shows the dispersion curves of frequencies for Co2Ni(BO3)2 (a) and CoNi2(BO3)2 (b). In both compounds, there are no “soft” modes. The crystal structures of Co2Ni(BO3)2 and CoNi2(BO3)2 are stable. The cause of appearance of new modes is not a structural phase transition.
Figure 2.
The dispersion curves of frequencies for Co2Ni(BO3)2 (a) and CoNi2(BO3)2 (b).
4. Raman Spectra of Co2NiB2O6
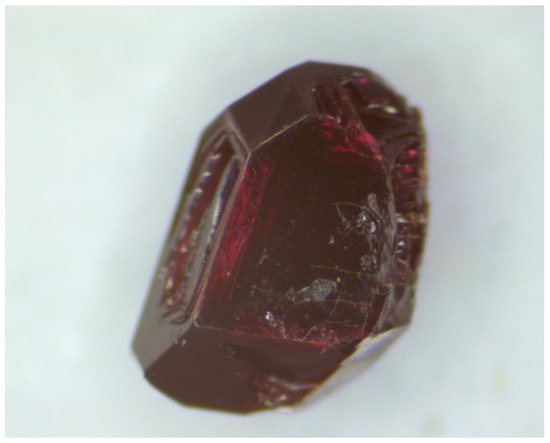
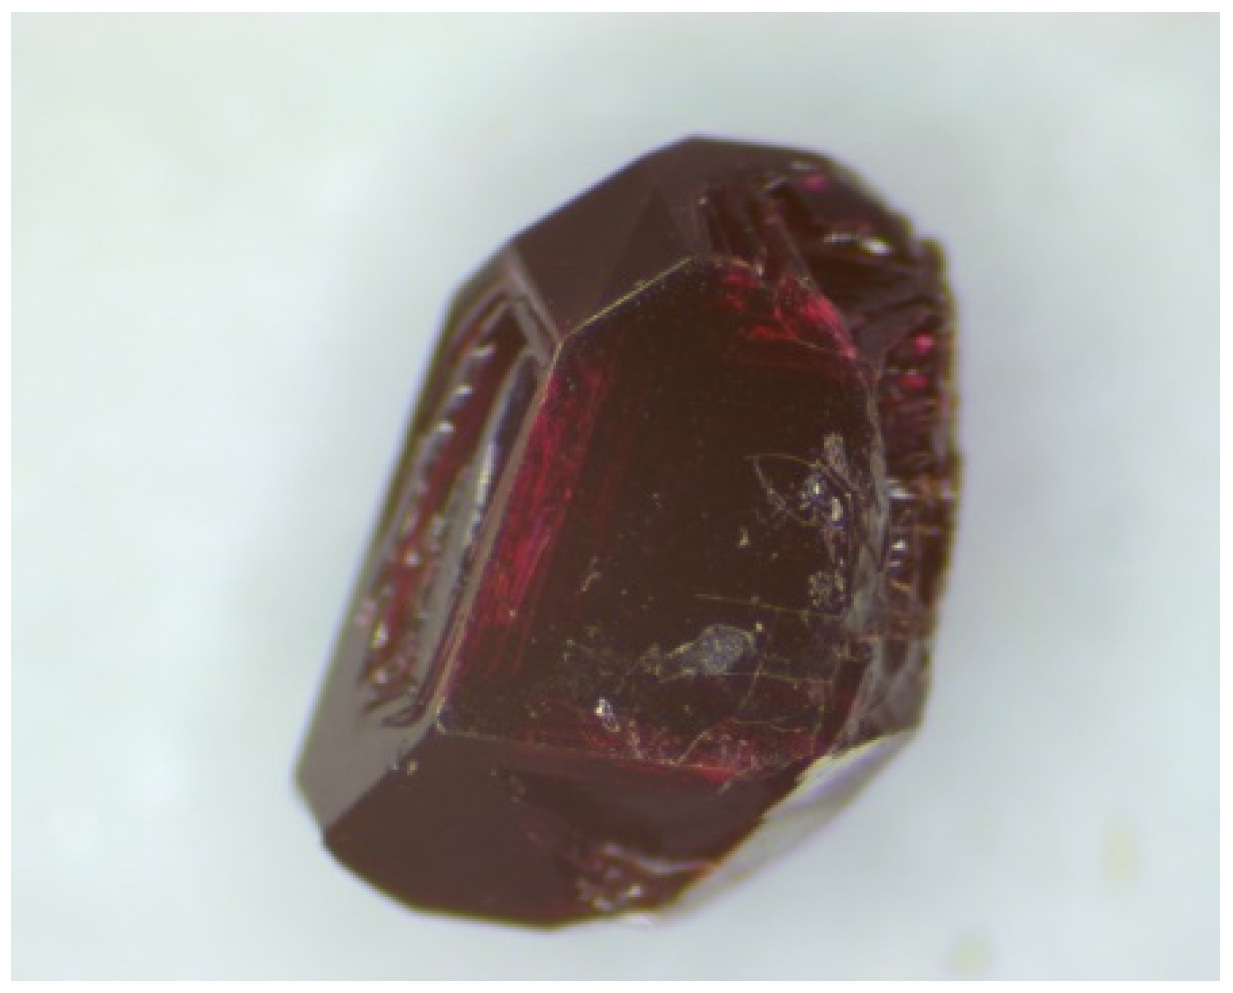
A sample for the experimental study of polarized Raman spectra was grown using the “flux” method by E. Moshkina in the L. V. Kirensky Institute of Physics SB RAS. The technique was described in [29]. A single crystal of Co2NiB2O6 is shown in Figure 3. The plane of the figure corresponds to the (110) crystallographic plane.
Figure 3.
A single crystal of Co2NiB2O6.
Polarized Raman spectra were obtained in backscattering geometry using a Horiba Jobin-Yvon T64000 triple spectrometer (Horiba, France) operating in the dispersion subtraction mode. The Spectra-Physics Excelsior-532-300-CDRH (Albany, NY, USA) 532 nm diode-pumped visible CW solid-state single-mode laser with a power of 3 mW applied to the sample was used as the excitation light source. The Raman spectra resolution using gratings with 1800 mm−1 grooves and 100 m slits was about 2 cm−1. The micro-Raman system based on an Olympus BX41 microscope with a 50× objective lens f = 1.2 mm with the numerical aperture N.A. = 0.75 provides a focal spot 4 lm in diameter on the sample. The sample under investigation was a single crystal, approximately 3 mm in size, of optical quality with natural faceting that was free from defects or visible inclusions under the microscope (Figure 3).
Two series of experiments were performed with parallel and cross-(parallel) polarization of the incident and scattered beams to study the angular dependence of the intensities of Raman spectra, using the backscattering geometry. The shift of the incidence point of exciting radiation was no more than 2 µm in a complete 2π revolution.
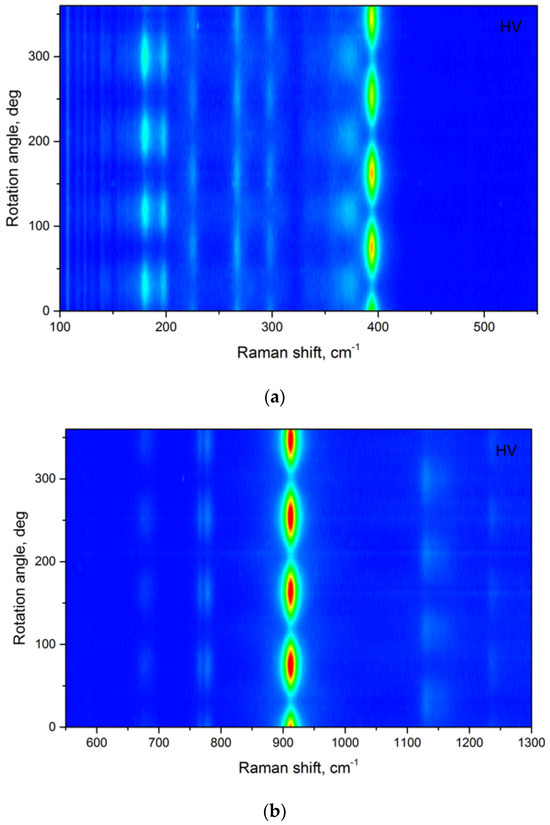
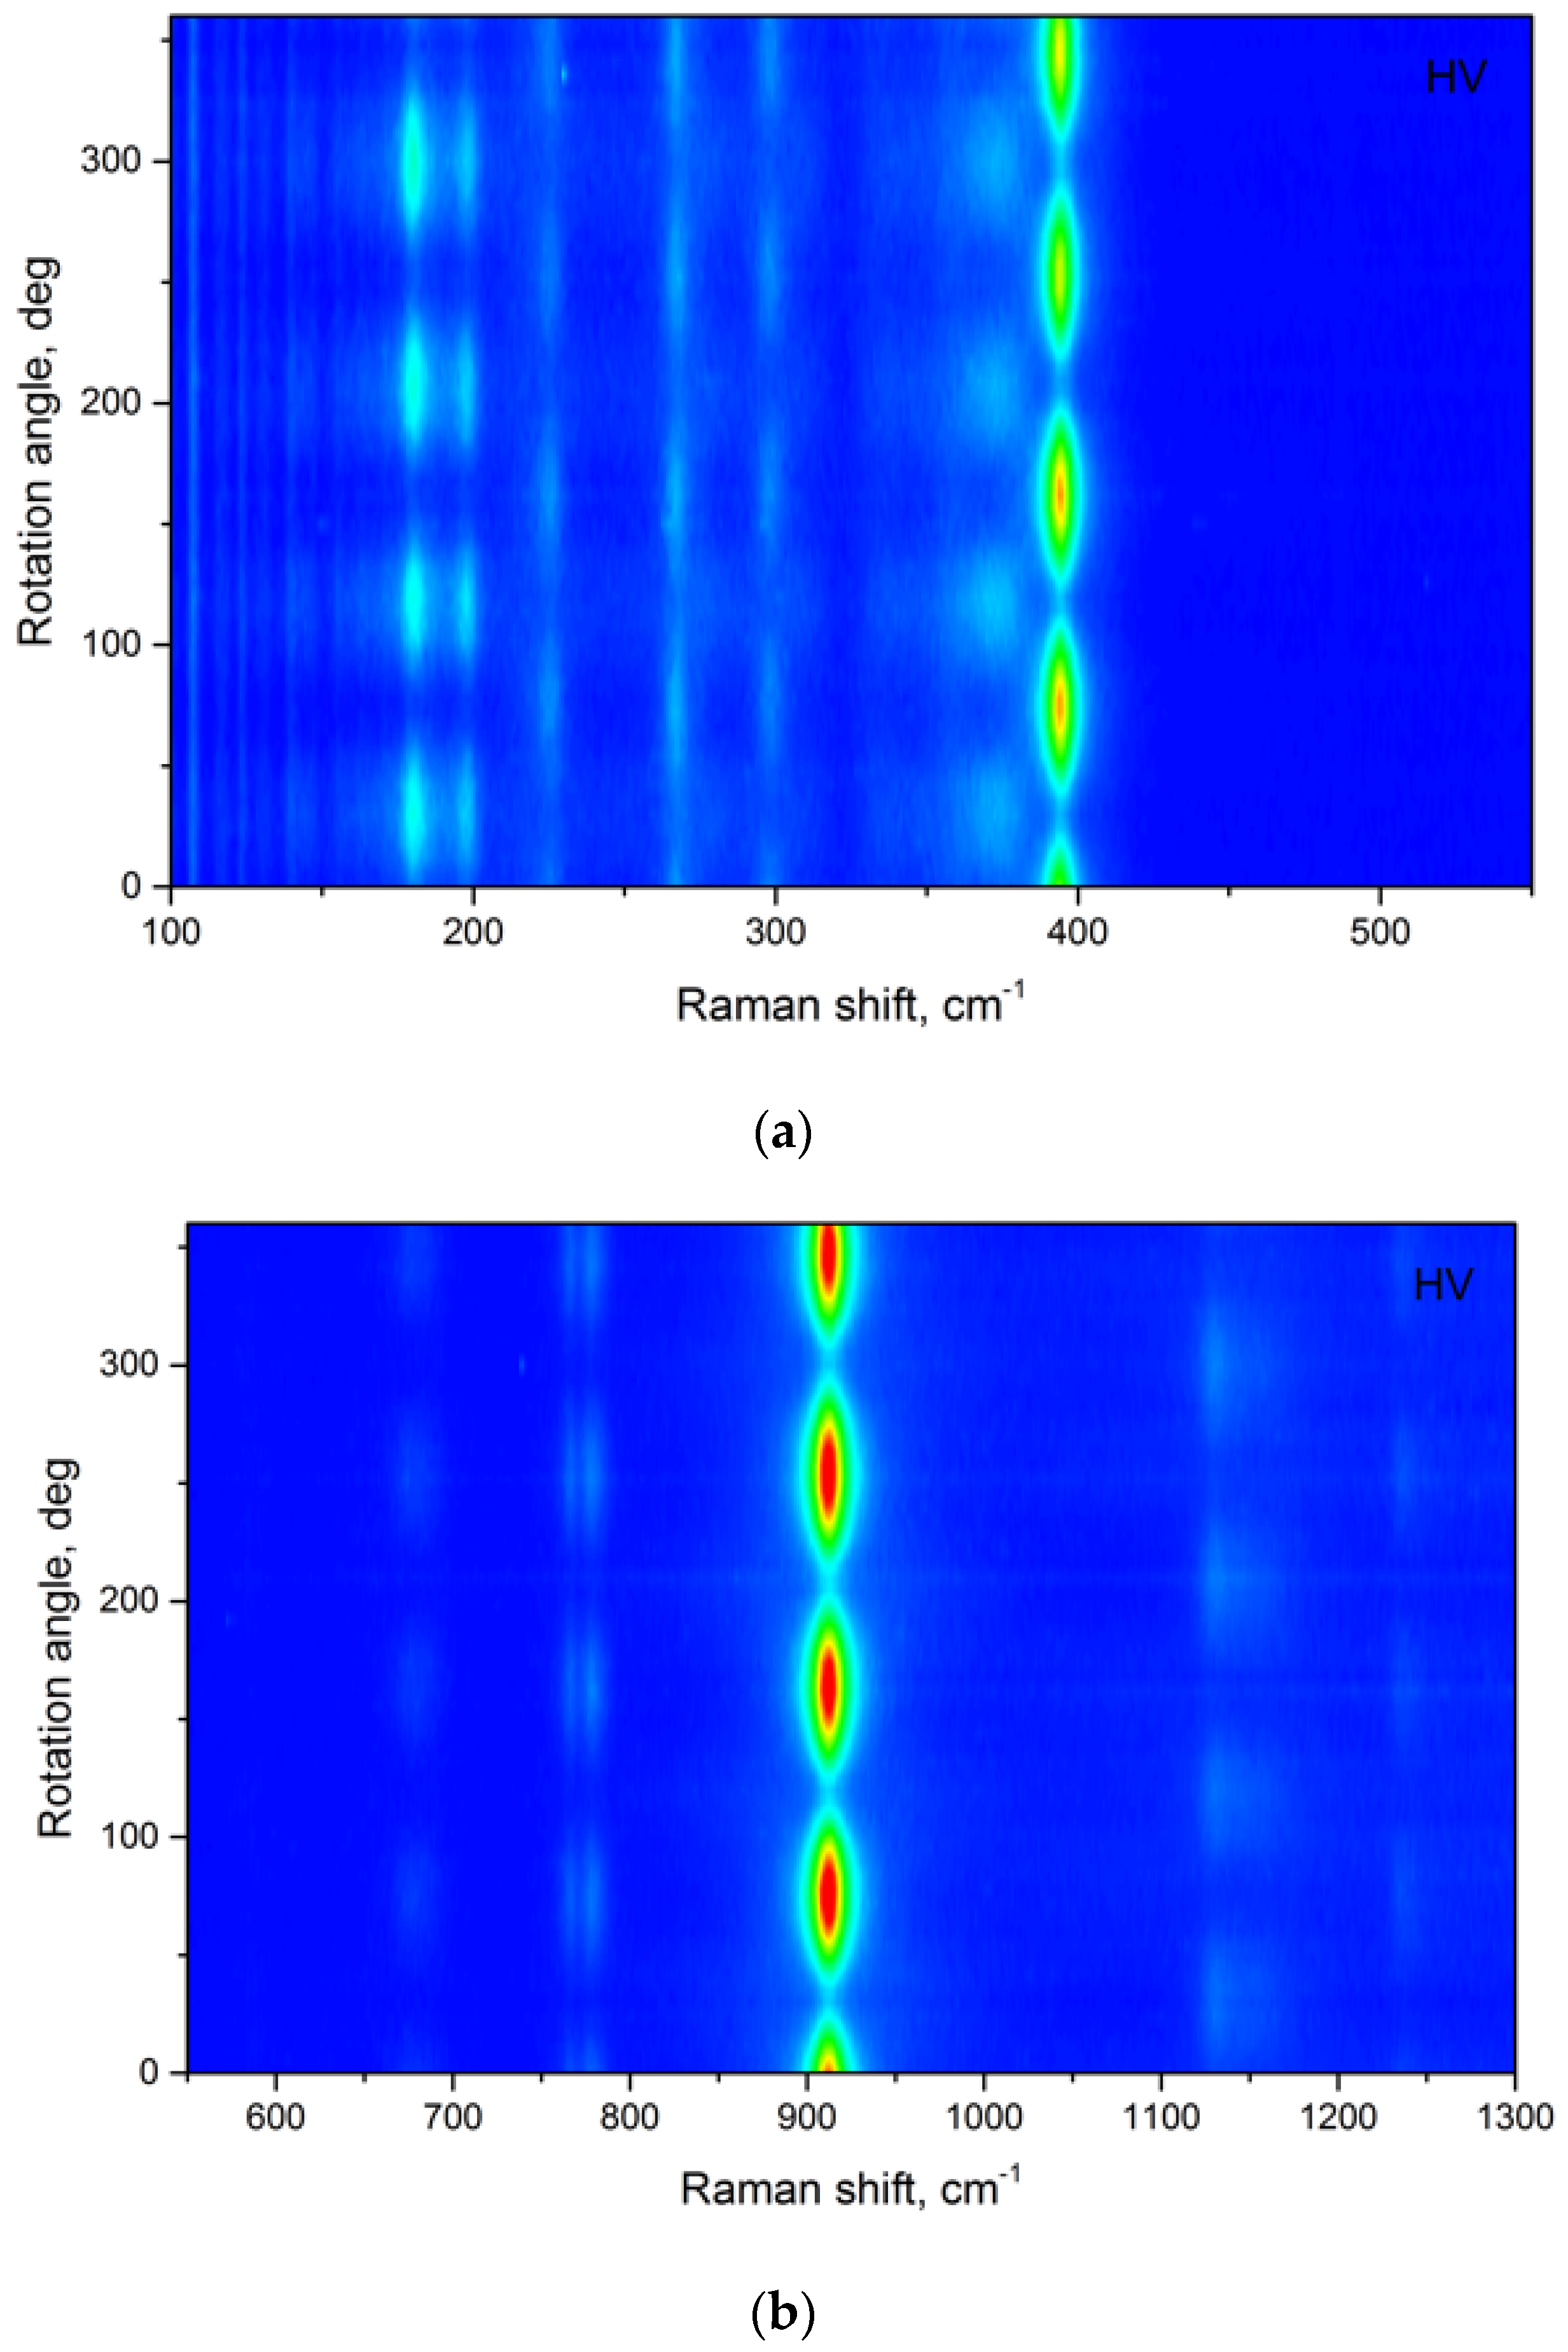
The angular dependences of the Raman spectra of the unoriented sample make it possible to assign the lines to irreducible representations of the corresponding space group. Different representations have different values of the observed maximum, and they are possible at various rotations angles of the angular dependences on the intensities of the Raman spectra (see Figure 4). A detailed description of the experimental technique is provided in [30,31,32]. The angular dependences allow observing all the lines in the spectra, including very closely located ones, especially if they have the intensity maximum at different angles. Figure 4a,b present two regions of the angular dependence of Raman spectra of Co2NiB2O6.
Figure 4.
The angular dependence of the Raman spectra of Co2NiB2O6 (a) low-wavenubers region (b) high-wavenumbers region.
The strong modes are located near 400 cm−1 and 900 cm−1 (Figure 4). According to the calculation, two modes of different symmetry (B1g, B2g) were calculated in the 400 cm−1 region (Table 2). The calculation showed that in the 900 cm−1 region, there are also two modes of different symmetry (Ag, B1g).
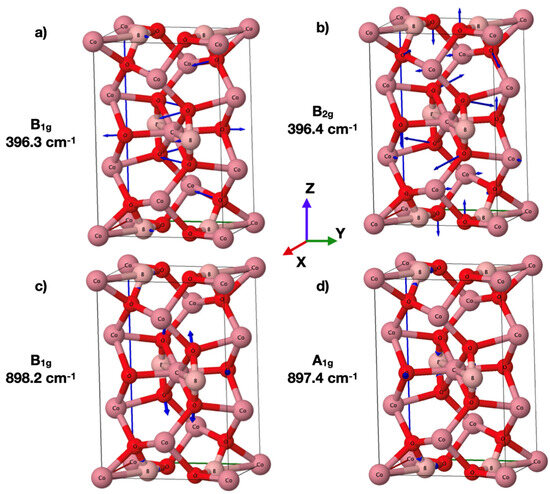
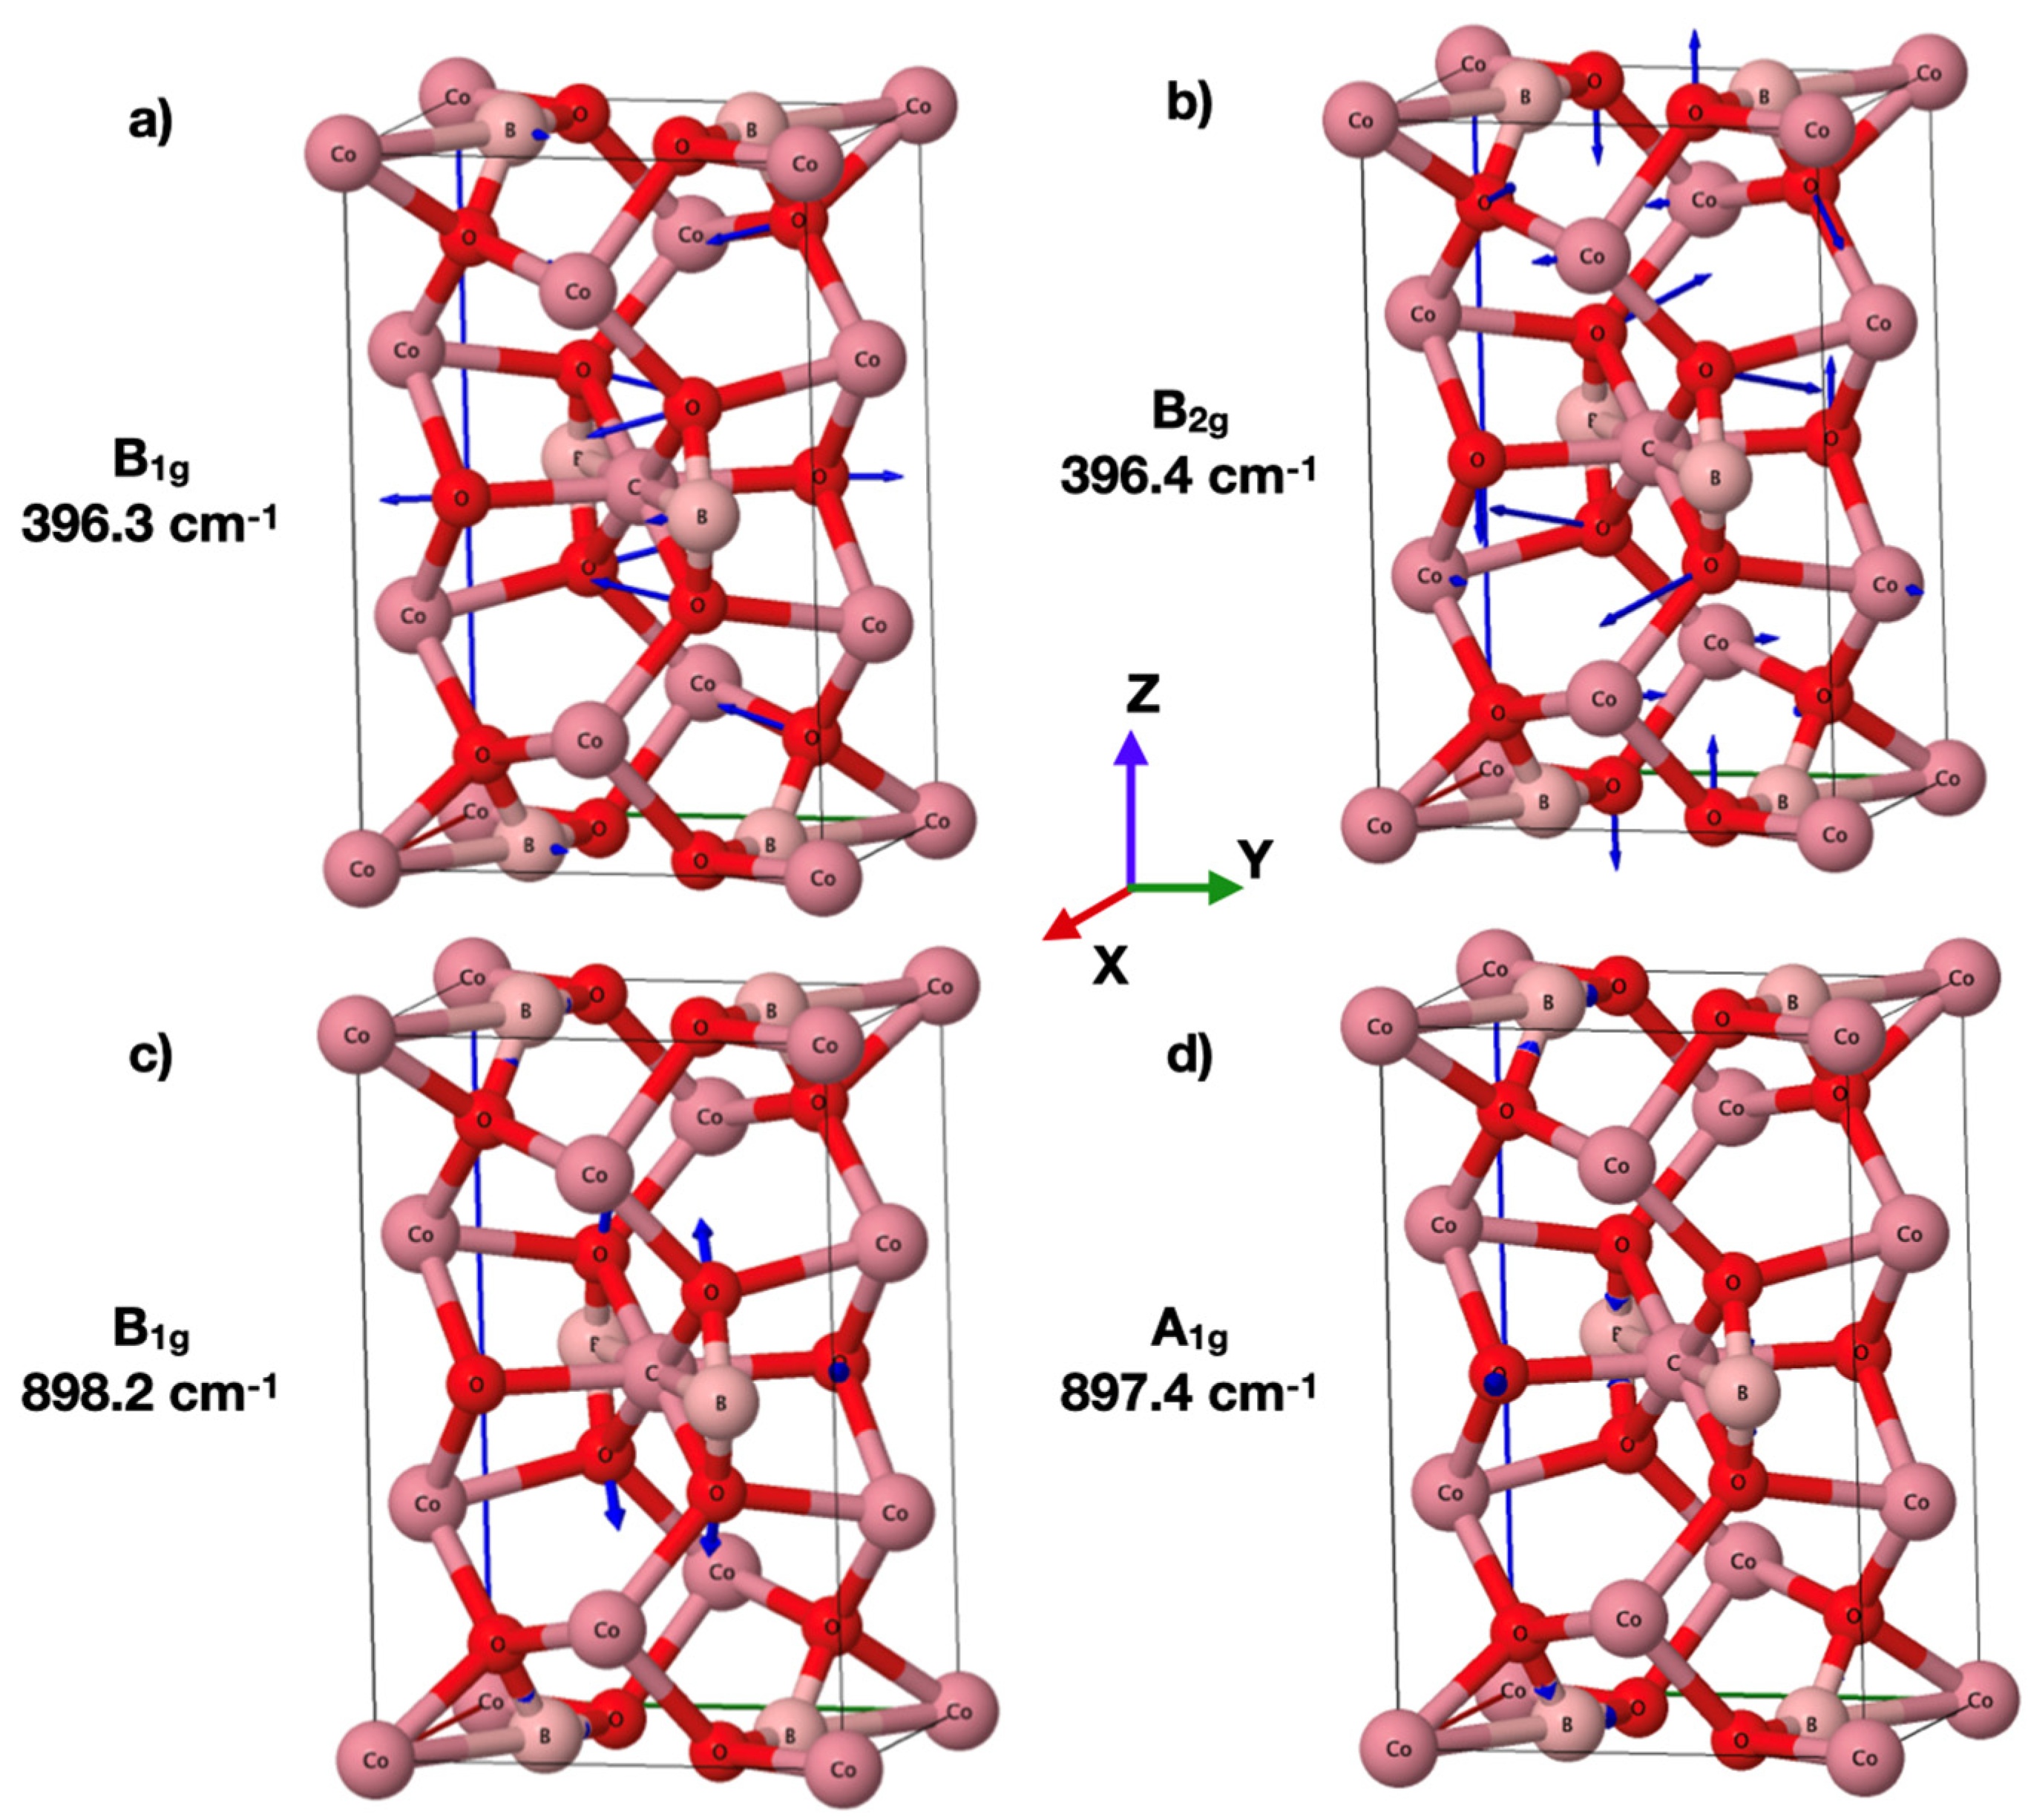
Figure 5 shows the calculated modes of the vibrational spectrum at 400 and 900 cm−1 for the Co3B2O6 crystal. Blue arrows indicate the vibrational directions. Oxygen atoms are shown in red, cobalt atoms in dark pink and boron in light pink. In the 400 cm−1 region, deformation modes were obtained in BO3 where oxygen and boron atoms vibrate (Figure 5a). In Figure 5b, vibrations of cobalt atoms are added to the BO3 deformations. This vibrational mode can change when the cobalt atoms are replaced by nickel and changes during the magnetic transition. Stretching modes are observed in BO3 around 900 cm−1. Figure 5d shows how oxygen atoms are displaced toward boron atoms.
Figure 5.
The forms of the vibrational modes of the Co3B2O6 crystal near 400 and 900 cm−1. (a) mode B1g 396.3 cm−1; (b) mode B2g 396.4 cm−1; (c) mode B1g 898.2 cm−1; (d) mode A1g 897.4 cm−1.
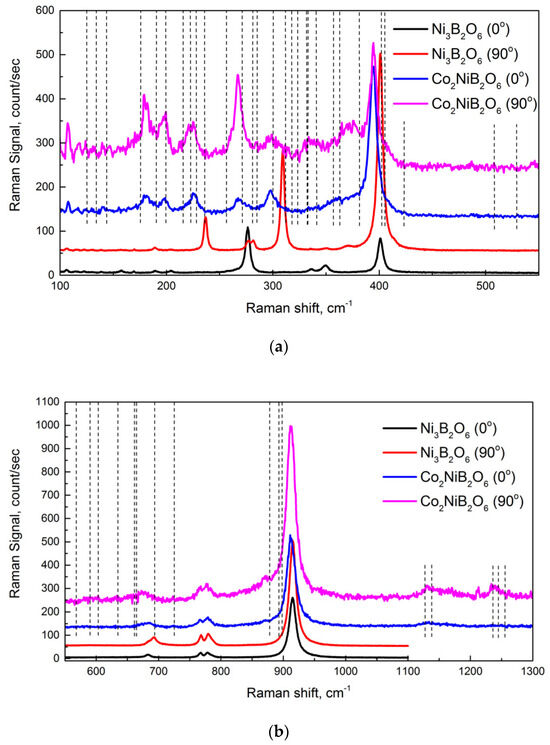
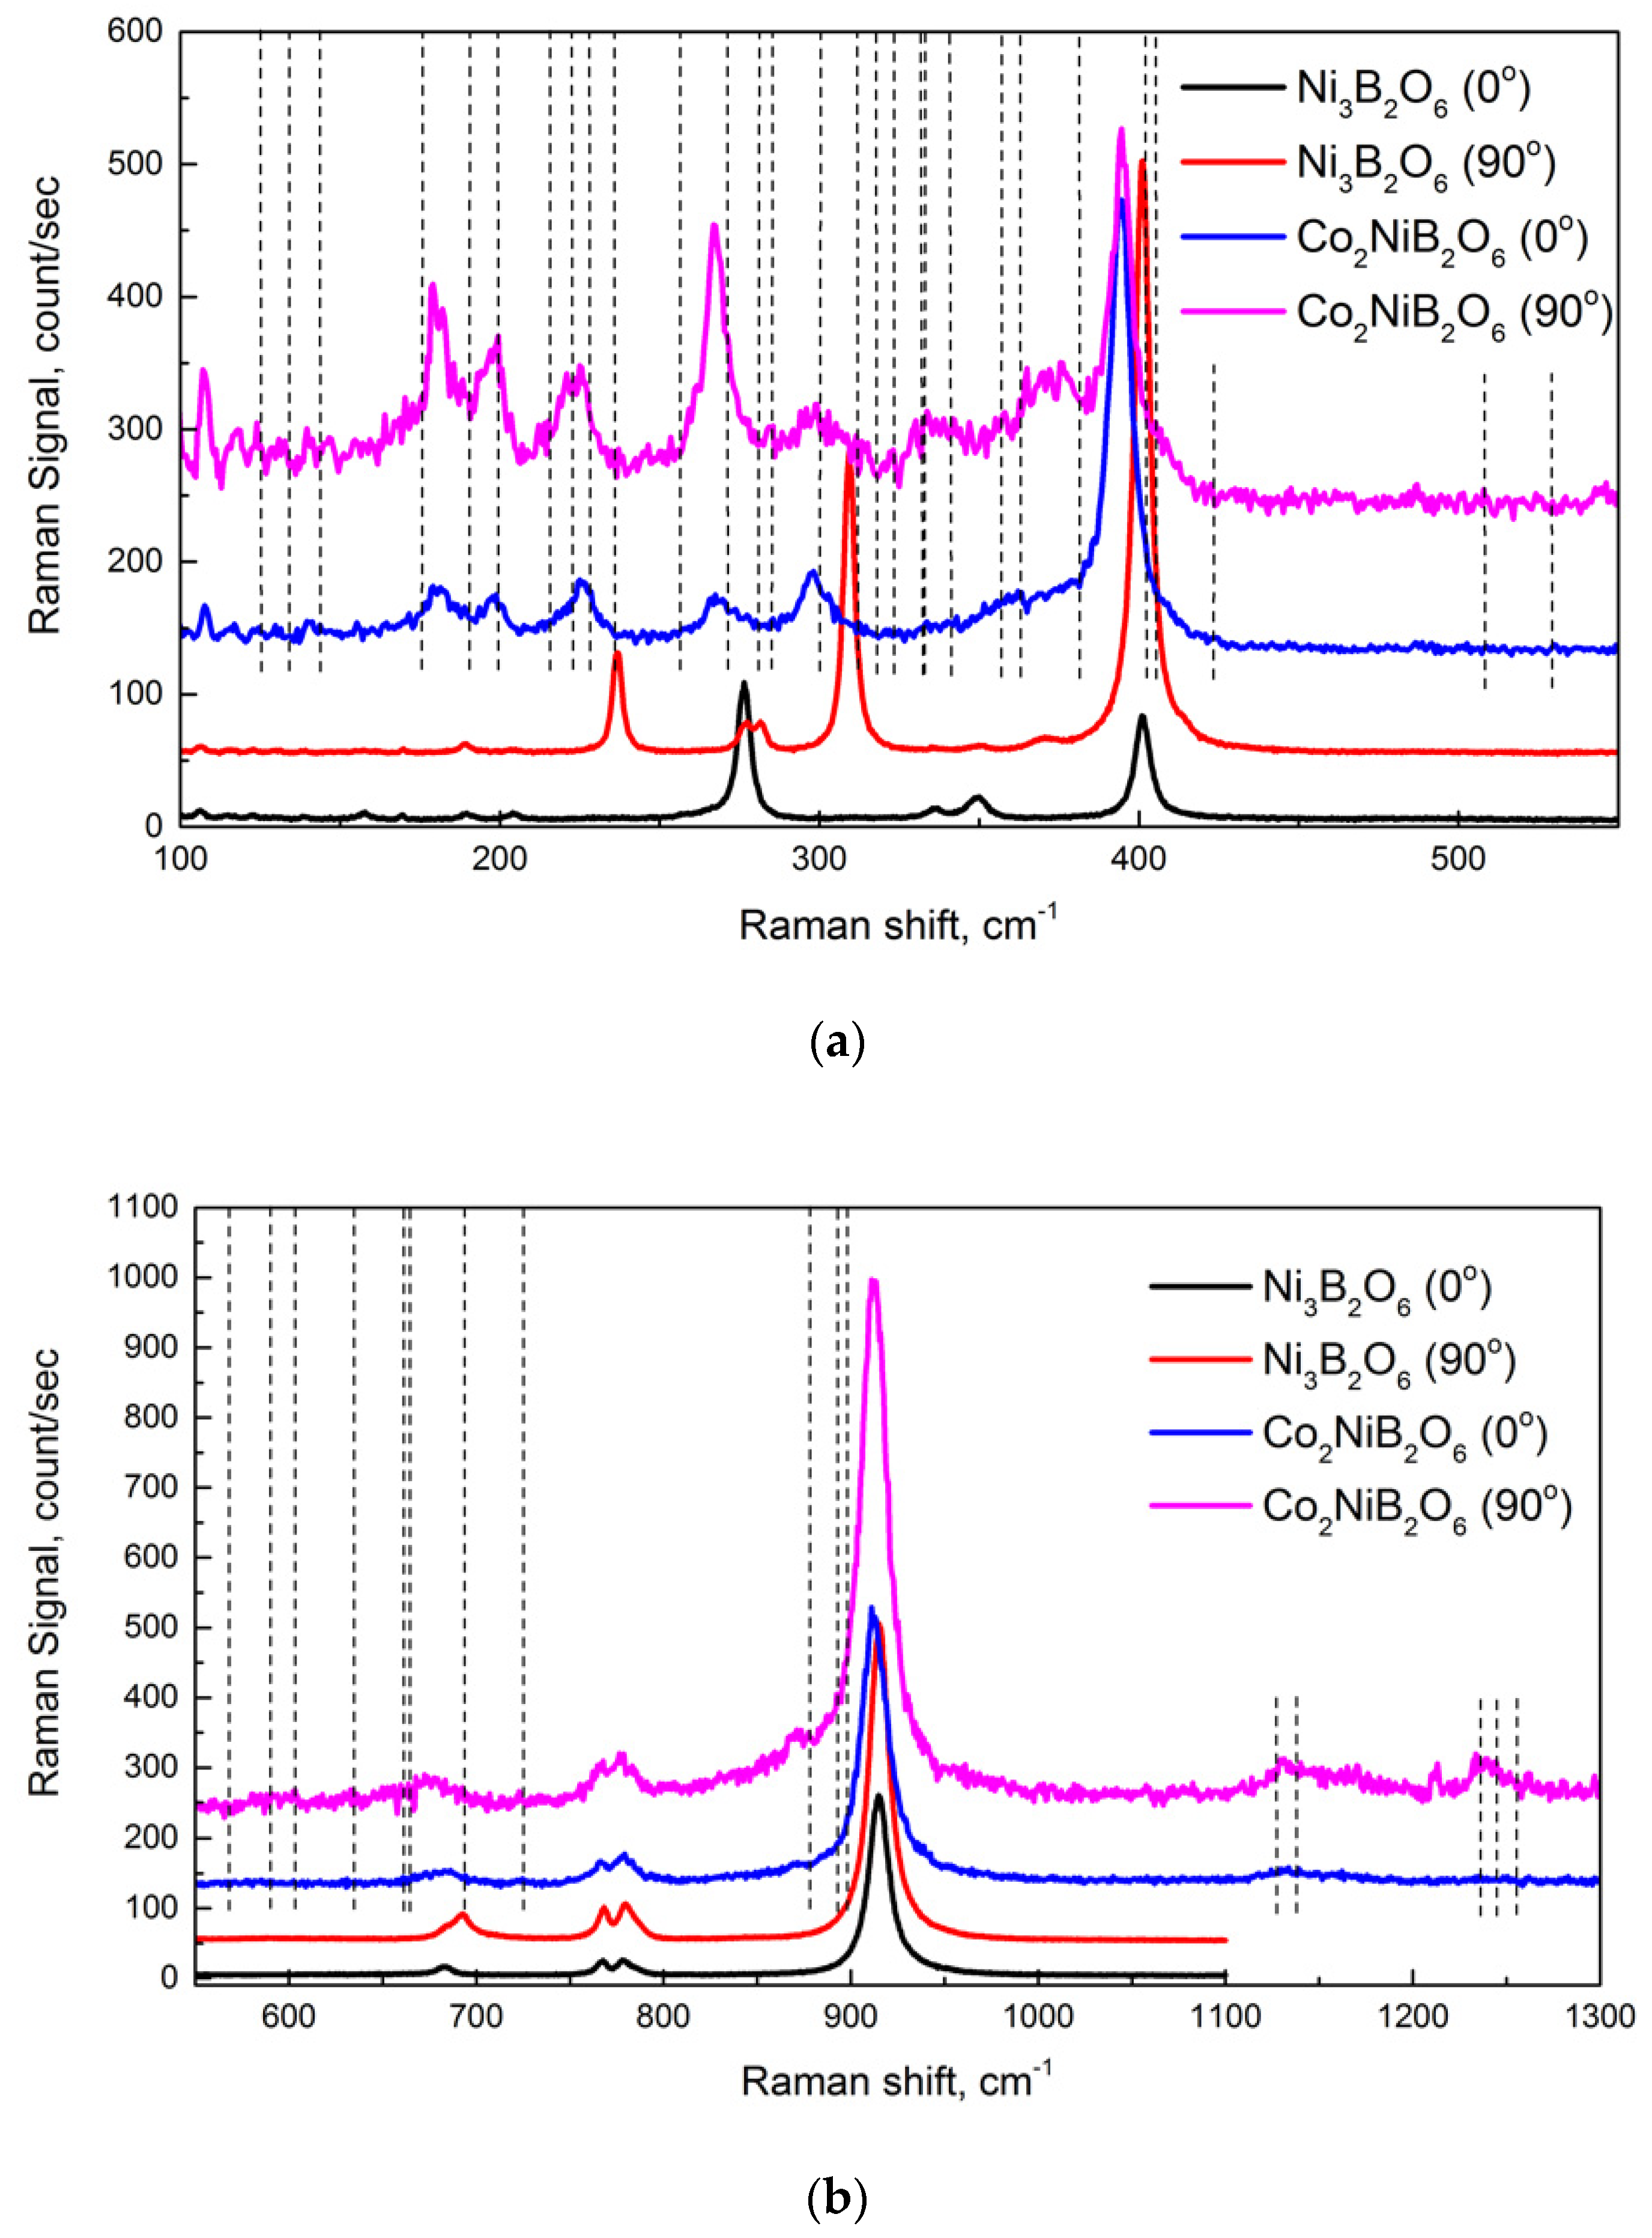
The comparison of the experimental Raman spectra of Ni3B2O6 and Co2NiB2O6 in the parallel polarizer–analyzer configuration is presented in Figure 6. Here, the angle 0° denotes the initial position of the crystal and that of 90° denotes the position where the crystal is rotated by 90° around the axis of the incident light direction.
Figure 6.
The comparison of the experimental Raman spectra of Ni3B2O6 and Co2NiB2O6 in the parallel polarizer–analyzer configuration. (a) 100–500 cm−1, (b) 500–1300 cm−1. The angle 0° denotes the initial position and 90° denotes the position of the crystal rotated by 90° to the incident light polarization.
The spectra of the compounds Ni3B2O6 and Co2NiB2O6 are very similar. The vibrations of 916 cm−1, corresponding to B-O stretching, are almost identical (Figure 6b), but the deformation of BO3 with B in the plane demonstrates a slight difference (Figure 6a). In Ni3B2O6 the lengths of the B-O bonds are 1.35, 1.39 and 1.39 Å, while in Co2NiB2O6, all the B-O bonds are almost equal: 1.38, 1.39 and 1.39 Å. In Co3B2O6, the BO3 group is more distorted. The lengths of the B-O bonds are 1.41, 1.36 and 1.36 Å. The comparison of the measured Raman spectrum data [4,5] with the calculated frequencies of Co2Ni(BO3)2 is presented in Table 6. One can observe good agreement between the theoretical and experimental data for both IR and Raman spectra.
Table 6.
The comparison of the Raman spectrum data [4,5] with the calculated frequencies of Co2Ni(BO3)2.
In the low-wavelength region, we observe significant differences in the positions of the Raman lines (Figure 6a). This is due to the metal ions being involved in these vibrations. The black dashed line in Figure 6 denotes the calculated frequencies of Co2NiB2O6. Here, good agreement between the theoretical and experimental results is observed.
5. Conclusions
The theoretical study of the lattice dynamics of the Ni3-xCoxB2O6 solid solutions for x = 0, 1, 2, 3 was carried out in the VASP code. The experimental Raman spectra at the center of the Brillouin zone for Co2NiB2O6 were obtained. The theoretical and experimental data are observed to be in good agreement. The spectra of the compounds Ni3B2O6, Co3B2O6, Ni2CoB2O6 and Co2NiB2O6 are very similar. The phonon spectra contain the modes which correspond to the BO3 vibration group with the calculated and experimental (IR and Raman) modes being in good agreement. The most significant differences in the positions of the Raman lines are observed in the low-wavelength region, where the vibrations involve transition metal ions. The simulation of the lattice dynamics of the solid solutions showed the decreasing temperature; these compounds should not experience phase transitions, because unstable modes (soft modes) were not obtained.
The study of the lattice dynamics of the four compounds helped us to establish that the solid solution structures are stable and to determine the general trends in the substitution of nickel for cobalt. However, in order to understand the processes in the antiferromagnetic transition, low-temperature studies should be carried out. Therefore, we plan to perform low temperature Raman studies of the oxyborates and evaluate the effect of nickel substitution for cobalt on the antiferromagnetic transition.
Author Contributions
Conceptualization, S.N.S. and A.S.K.; methodology, A.S.K., M.S.P. and S.N.K.; funding, S.N.S.; writing draft, S.N.S. and A.S.K.; writing, A.N.V. and S.N.K.; software S.N.K., A.N.V. and M.S.P.; formal analysis, S.N.S. and M.S.P.; investigation, A.S.K.; data curation, S.N.K. and A.N.V.; writing—review and editing, A.S.K. and S.N.K.; visualization, S.N.S., S.N.K. and A.S.K.; supervision, S.N.S.; project administration, S.N.S. All authors have read and agreed to the published version of the manuscript.
Funding
The research was supported by Russian Science Foundation and Krasnoyarsk Regional Science Foundation, project № 23-12-20012 (https://rscf.ru/en/project/23-12-20012/, accessed on 13 November 2024).
Data Availability Statement
The raw data supporting the conclusions of this article will be made available by the authors on request.
Acknowledgments
The experimental investigations were carried out in the Center for Collective Use of the Krasnoyarsk Regional Center of Research Equipment of Federal Research Center “Krasnoyarsk Science Center SB RAS”.
Conflicts of Interest
The authors declare no conflicts of interest.
References
- Götz, W. Raumgruppenbestimmung des Nickelborates Ni3(BO3)2. Naturwissenschaften 1963, 50, 567. [Google Scholar] [CrossRef] [Scilit]
- Effenberger, H.; Pertlik, F. Verfeinerung der kristallstrukturen der isotypen verbindungen M3(BO3)2 mit M= Mg, Co und Ni (strukturtyp: kotoit). Z. Krist. 1984, 166, 129. [Google Scholar] [CrossRef] [Scilit]
- Newnham, R.E.; Santoro, R.P.; Seal, P.F.; Stallings, G.R. Antiferromagnetism in Mn3B2O6, Co3B2O6, and Ni3B2O6. Phys. Status Solidi B 1966, 16, 17. [Google Scholar] [CrossRef] [Scilit]
- Tekin, B.; Güler, H. Synthesis and crystal structure of dicobalt nickel orthoborate, Co2Ni(BO3)2. Mater. Chem. Phys. 2008, 108, 88–91. [Google Scholar] [CrossRef] [Scilit]
- Güler, H.; Tekin, B. Synthesis and crystal structure CoNi2(BO3)2. Inorg. Mater. 2009, 45, 538–542. [Google Scholar] [CrossRef] [Scilit]
- Liang, P.; Du, L.; Wang, X.; Liu, Z.H. Preparation of Ni3B2O6 nanosheet-based flowerlike architecture by a precursor method and its electrochemical properties in lithium-ion battery. Solid State Sci. 2014, 37, 131–135. [Google Scholar] [CrossRef] [Scilit]
- Bezmaternykh, L.N.; Sofronova, S.N.; Volkov, N.V.; Eremin, E.V.; Bayukov, O.A.; Nazarenko, I.I.; Velikanov, D.A. Magnetic properties of Ni3B2O6 and Co3B2O6 single crystals. Phys. Status Solidi B 2012, 249, 1628. [Google Scholar] [CrossRef] [Scilit]
- Kazak, N.V.; Platunov, M.S.; Ivanova, N.B.; Knyazev, Y.V.; Bezmaternykh, L.N.; Eremin, E.V.; Vasil’ev, A.D.; Bayukov, O.A.; Ovchinnikov, S.G.; Velikanov, D.A. Crystal structure and magnetization of a Co3B2O6 single crystal. JETP 2013, 117, 94. [Google Scholar] [CrossRef] [Scilit]
- Lindgaard, P.-A. Theory of random anisotropic magnetic alloys. Phys. Rev. B 1976, 14, 4074. [Google Scholar] [CrossRef] [Scilit]
- Matsubara, F.; Inawashiro, S. Mixture of two anisotropic antiferromagnets with different easy axis. J. Phys. Soc. Jpn. 1977, 42, 1529. [Google Scholar] [CrossRef] [Scilit]
- Mano, H. Pair spin theory of a random micture with competing ising and xy anisotropies. J. Phys. Soc. Jpn. 1986, 55, 908–919. [Google Scholar] [CrossRef] [Scilit]
- Wong, P.; Horn, P.M.; Birgeneau, H.J.; Safinya, C.H.; Shirane, G. Competing order parameters in quenched random alloys: Fe1−xCoxCl2. Phys. Rev. Lett. 1980, 45, 1974–1977. [Google Scholar] [CrossRef] [Scilit]
- Katsumata, K.; Kobayashi, M.; Sato, T.; Miyako, Y. Experimental phase diagram of a random mixture of two anisotropic antiferromagnets. Phys. Rev. B 1979, 19, 2700–2703. [Google Scholar] [CrossRef] [Scilit]
- Tawaraya, T.; Katsumata, K.; Yoshizawa, H. Neutron diffraction experiment on a randomly mixed antiferromagnet with competing spin anisotropies. J. Phys. Soc. Jpn. 1980, 49, 1299–1305. [Google Scholar] [CrossRef] [Scilit]
- Perez, F.A.; Borisov, P.; Johnson, T.A.; Stanescu, T.D.; Trappen, R.; Holcomb, M.B.; Lederman, D.; Fitzsimmons, M.R.; Aczel, A.A.; Hong, T. Phase diagram of a three-dimensional antiferromagnet with random magnetic anisotropy. Phys. Rev. Lett. 2015, 114, 097201. [Google Scholar] [CrossRef] [Scilit] [PubMed]
- Pisarev, R.V.; Prosnikov, M.A.; Davydov, V.Y.; Smirnov, A.N.; Roginskii, E.M.; Boldyrev, K.N.; Molchanova, A.D.; Popova, M.N.; Smirnov, M.B.; Kazimirov, V.Y. Lattice dynamics and a magnetic-structural phase transition in the nickel orthoborate Ni3(BO3)2. Phys. Rev. B 2016, 93, 134306. [Google Scholar] [CrossRef] [Scilit]
- Molchanova, A.D.; Prosnikov, M.A.; Petrov, V.P.; Dubrovin, R.M.; Nefedov, S.G.; Chernyshov, D.; Smirnov, A.N.; Davydov, V.Y.; Boldyrev, K.N.; Chernyshev, V.A.; et al. Lattice dynamics of cobalt orthoborate Co3(BO3)2 with kotoite structure. J. Alloys Compd. 2021, 865, 158797. [Google Scholar] [CrossRef] [Scilit]
- Bartel, C.J. Review of computational approaches to predict the thermodynamic stability of inorganic solids. J. Mater. Sci. 2022, 57, 10475–10498. [Google Scholar] [CrossRef] [Scilit]
- De Fontaine, D. An analysis of clustering and ordering in multicomponent solid solutions—I. Stability criteria. J. Phys. Chem. Solids 1972, 33, 297–310. [Google Scholar] [CrossRef] [Scilit]
- Krylova, S.; Popova, E.; Kitaev, Y.; Lushnikov, S. Lattice dynamics of the BaMg1/3Ta2/3O3 complex perovskite: DFT calculation and Raman spectroscopy. Ferroelectrics 2024, 618, 1268–1279. [Google Scholar] [CrossRef] [Scilit]
- Kresse, G.; Joubert, D. From ultrasoft pseudopotentials to the projector augmented-wave method. Phys. Rev. B 1999, 59, 1758. [Google Scholar] [CrossRef] [Scilit]
- Kresse, G.; Furthmüller, J. Efficient iterative schemes for ab initio total-energy calculations using a plane-wave basis set. Phys. Rev. B 1996, 54, 11169. [Google Scholar] [CrossRef] [Scilit] [PubMed]
- Kresse, G.; Furthmüller, J. Efficiency of ab-initio total energy calculations for metals and semiconductors using a plane-wave basis set. Comput. Phys. Sci. 1996, 6, 15. [Google Scholar] [CrossRef] [Scilit]
- Perdew, J.P.; Burke, K.; Ernzerhof, M. Generalized Gradient Approximation Made Simple. Phys. Rev. Lett. 1996, 77, 3865. [Google Scholar] [CrossRef] [Scilit]
- Monkhorst, H.J.; Pack, J.D. Special points for Brillouin-zone integrations. Phys. Rev. B 1976, 13, 5188. [Google Scholar] [CrossRef] [Scilit]
- Dudarev, S.L.; Botton, G.A.; Savrasov, S.Y.; Humphreys, C.J.; Sutton, A.P. Electron-energy-loss spectra and the structural stability of nickel oxide: An LSDA+U study. Phys. Rev. B Condens. Matter Mater. Phys. 1998, 57, 1505. [Google Scholar] [CrossRef] [Scilit]
- Togo, A.; Tanaka, T. First principles phonon calculations in materials science. Scr. Mater. 2015, 108, 1. [Google Scholar] [CrossRef] [Scilit]
- Nakamoto, K. Infrared and Raman Spectra of Inorganic and Coordination Compounds, Theory and Applications in Inorganic Chemistry; John Wiley & Sons: Hoboken, NJ, USA, 2008. [Google Scholar]
- Sofronova, S.; Moshkina, E.; Chernyshev, A.; Vasiliev, A.; Maximov, N.G.; Aleksandrovsky, A.; Andryushchenko, T.; Shabanov, A. Crystal growth and cation order of Ni3-xCoxB2O6 oxyborates. CrystEngComm 2024, 26, 2536–2543. [Google Scholar] [CrossRef] [Scilit]
- Oreshonkov, A.S.; Gerasimova, J.V.; Ershov, A.A.; Krylov, A.S.; Shaykhutdinov, K.A.; Vtyurin, A.N.; Molokeev, M.S.; Terent’ev, K.Y.; Mihashenok, N.V. Raman spectra and phase composition of MnGeO3 crystals. J. Raman Spectrosc. 2016, 47, 531–536. [Google Scholar] [CrossRef] [Scilit]
- Krylov, A.; Krylova, S.; Gudim, I.; Kitaev, Y.; Golovkina, E.; Zhang, H.; Vtyurin, A. Pressure–Temperature Phase Diagram of Multiferroic TbFe2.46Ga0.54(BO3)4. Magnetochemistry 2022, 8, 59. [Google Scholar] [CrossRef] [Scilit]
- Golovkina, E.V.; Krylova, S.N.; Vtyurin, A.N.; Krylov, A.S. Analyzing the Symmetry of the Raman Spectra of Crystals According to Angular Dependences. Bull. Russ. Acad. Sci. Phys. 2024, 88, 773–778. [Google Scholar] [CrossRef] [Scilit]

Disclaimer/Publisher’s Note: The statements, opinions and data contained in all publications are solely those of the individual author(s) and contributor(s) and not of MDPI and/or the editor(s). MDPI and/or the editor(s) disclaim responsibility for any injury to people or property resulting from any ideas, methods, instructions or products referred to in the content. |
© 2024 by the authors. Licensee MDPI, Basel, Switzerland. This article is an open access article distributed under the terms and conditions of the Creative Commons Attribution (CC BY) license (https://creativecommons.org/licenses/by/4.0/).