


Abstract
To facilitate measuring crystal sizes during batch crystallization at high-solid concentrations by using an invasive imaging system, an in situ imaging measurement strategy based on edge detection and superpixel is proposed for the ambiguous boundary problem of large amounts of crystals. Firstly, an image filtering is employed to cope with image degradation caused by noise disturbance and suspension turbulence in the crystallizer. Subsequently, an image segmentation method is developed by utilizing improved edge detection and superpixel, which can be easily performed for crystal extraction. Accordingly, crystal size measurement can be developed for evaluation of the crystal size distribution. The experiment results on α-form L-glutamic acid present the effectiveness of the proposed method.
1. Introduction
Crystallization has been widely applied across the majority of solid product industries, including the pharmaceutical, food, microelectronics and materials industries [1]. For maintaining a desired quality of the crystal products, it is necessary to monitor crystal growth characterization for automation control and operation optimization [2,3,4]. The crystal size distribution (CSD) and particle shape (PS) as the key properties of crystal products have a considerable impact on final product quality as well as the downstream processes [5,6].
With the rapid progress in high-speed digital imaging sensors, there is enormous potential for using on-line imaging techniques to monitor crystal features during crystallization processes [7,8,9,10]. The on-line imaging system of crystallization can be divided into two major classes: invasive system and non-invasive system [5,11,12,13]. The invasive systems with the probe-like design can be inserted into the solution to capture high-quality images, whereas the non-invasive systems are placed outside the reactor to avoid the contamination of the camera lens. In early research, Wilkinson et al. [14] developed an on-line imaging instruction for crystallization monitoring instead of using off-line measurement instruments, which were not capable of real-time particle measurement. In the last decade, on-line, image-processing strategies have become popular for product quality with desired characteristics including CSD and PS in an in-reactor environment [11,15,16]. Researchers have attempted to develop the advanced crystal segmentation methods, which are equally important for improving the robustness of crystal measurement. Calderon De Anda et al. [15] proposed an effective multi-scale segmentation method for extracting crystal blocks from the ambiguous background of an on-line image. Cardona et al. [6] proposed an advanced image-processing framework based on filtering and edge detection to extract size and shape information from in-line images with Mettler Toledo Particle Vision and Measurement (PVM). In addition to the abovementioned edge detection, the image segmentation methods based on thresholding were also employed for crystal images [16]. Zhang et al. [17] presented a novel image-processing technique based on combining wavelet transform and fuzzy C-means clustering for crystal image segmentation, and the crystal size distribution was described by the Weibull density probability function. Gao et al. [18] utilized a deep-learning method based on Mask R-CNN to detect L-glutamic acid (LGA) crystals and to measure the sizes of crystals. However, these algorithms did not take into account high-concentration crystallization, resulting in the occurrence of overlapping particles especially in industry production. To deal with the overlap of needle-like particles, Larsen et al. [19] proposed a SHARC (segmentation for high-aspect-ratio crystals) algorithm to extract the crystals effectively for particle-size distribution information from images of high-concentration slurry. Ferreira et al. [20] developed a novel image-analysis technique that combined discriminant factorial analysis to assess the agglomeration of crystals. In our previous work [21], an image-based analysis technology was presented for segmentation of overlapping needle-like crystals. However, crystal segmentation at higher concentration can be still confronted with a number of bottlenecks [2], in particular for poor-imaging conditions and large amounts of overlapped crystals with ambiguous boundaries during crystallization. Most of the previous work focused on needle-like crystals. The proposed method can be used to segment prismatic and blocky crystals.
In this work, considering the fact that a mass of crystals are overlapping in a stirred suspension at high-solid concentrations, an image analysis methodology based on superpixel segmentation is proposed for crystal-size distribution. This systematic, image-analysis method includes primarily image filtering, image segmentation and crystal size measurement. The raw images are initially recorded with the invasive imaging instrument, which can avoid the presence of out-of-focus crystals. Furthermore, for the on-line crystal images influenced by noise disturbance and solution turbulence, image preprocessing is used with image filtering. Then, the valid crystals are extracted by using an effective, image-segmentation method based on Canny edge and superpixel for multiple touching particles. In addition, the crystal sizes can be effectively calculated after size calibration. Finally, experiments on α-form LGA demonstrate the effectiveness of the proposed image measurement method.
2. Experimental Setup
2.1. Material
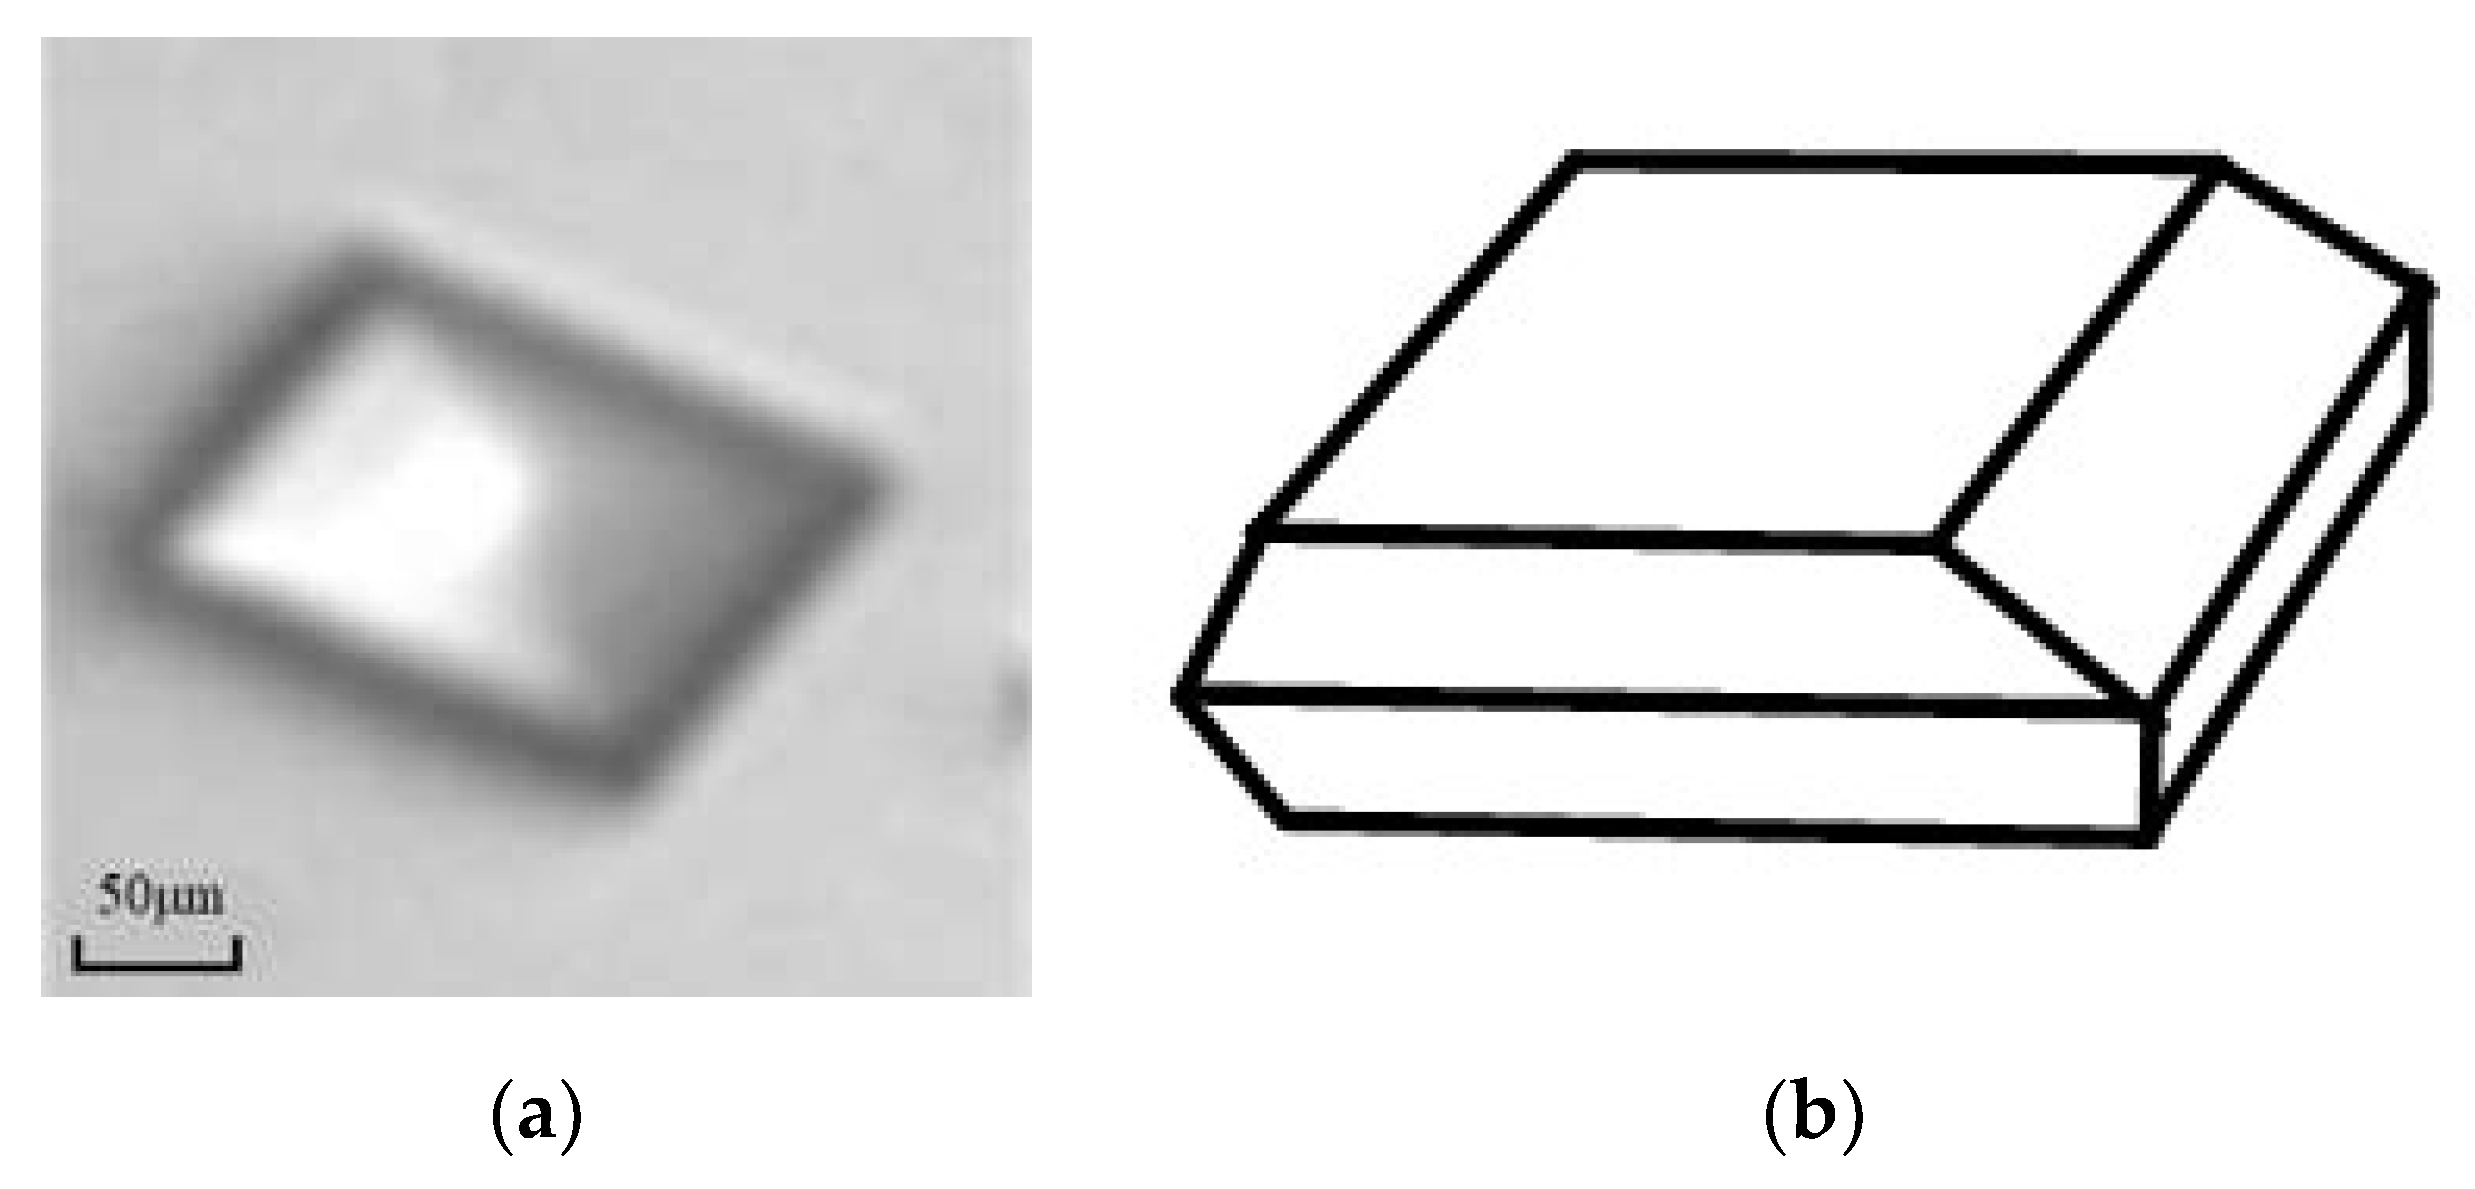
L-glutamic acid (LGA), C5H9NO4, was used for this work. The LGA crystadls are known to have two shapes [22]: the prismatic α and needle-like β forms. Due to the needle-like β-form being prone to breakage, α-form LGA crystals were considered to crystallize for demonstrating size measurement of prismatic crystals by the imaging analysis technique, as shown in Figure 1. It is seen that the α-form crystal is prismatic in the schematic representation. The LGA crystals with a purity of 99% were taken as the solute, and distilled water was used as the solvent in this experiment.
Figure 1.
The crystal morphology of α-form LGA: (a) crystal image of α-form LGA; (b) schematic representation of α-form LGA.
2.2. Experimental Setup
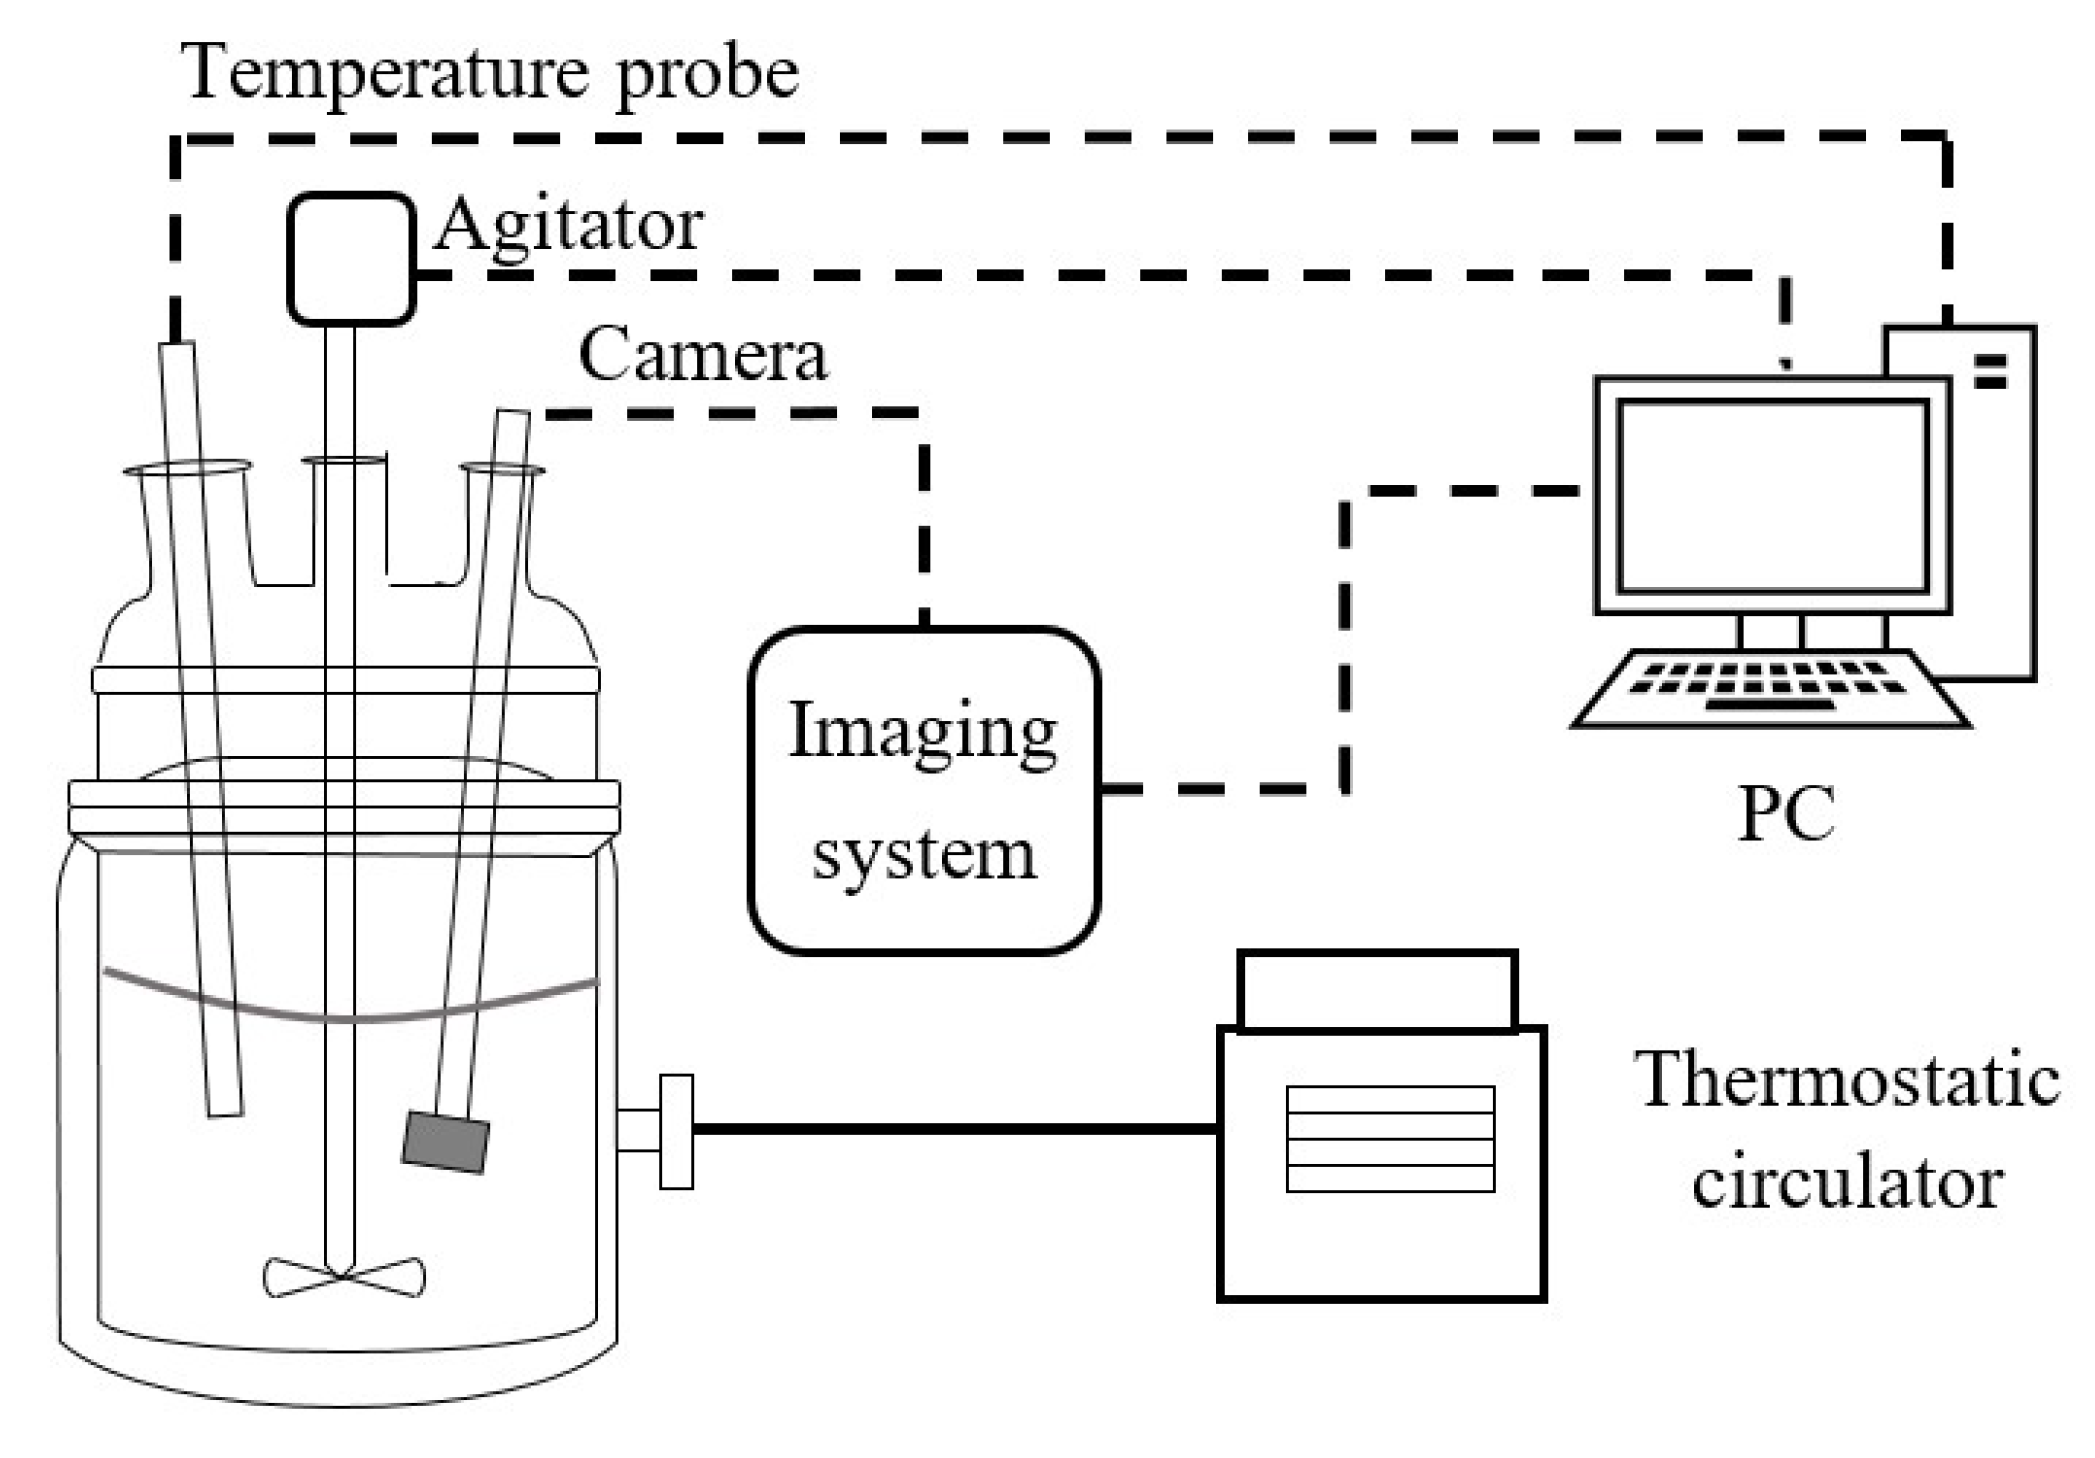
Experiments were carried out with a 2 L glass jacketed crystallizer, a PTFE four-paddle agitator and a Pt100 temperature probe. To control the temperature, a Julabo-CF41 thermostatic circulator (JULABO, Seelbach, Germany) was used, as shown in Figure 2. In this study, an invasive imaging system (2D vision probe, PharmaVision Nanosonic Technology Ltd., Qingdao, China.) was able to record 60 images per second with a pixel resolution of 1600 × 1200. The camera probe was situated into the suspension to avoid reactor-wall effects on the images and to allow the imaging regions of crystals to be fixed to reduce out-of-focus visualizations. It was set to capture two images per second. In addition, a microscope device (Leica DM 2500, Leica Microsystems, Wetzlar, Germany) with LAS software (LAS v4.4, Leica Microsystems, Wetzlar, Germany) was employed to measure the crystal sizes for effectiveness verification. In the verification experiment, a batch of crystal products was firstly measured using the off-line microscope, and subsequently, the same batch was put into the stirred reactor. The on-line images were recorded and analyzed immediately in the first fifteen seconds with the in situ method.
Figure 2.
Schematic drawing of the experimental setup.
The α-form LGA crystals (Sigma Chemicals, St Louis, MO, USA) were taken from the solution in a stirred reactor. According to the dissolution characteristics of LGA in water, the measurement range of solution concentration was set as 9.0–39.0 g/L, and the temperature range was 75–15 °C. In the experiment, 1.2 L LGA solution was injected into the 2 L reactor, and the agitator stirred at 200 rpm. Solution concentration was measured with ATR-FTIR spectrometer (Mettler Toledo Ltd., Zurich, Switzerland). The solution with a concentration of 33 g/L was heated to 75 °C to dissolve all LGA crystals. The solution was then linearly cooled down to the temperature 35 °C at a constant speed of 1 °C/min.
3. Crystal Image Processing
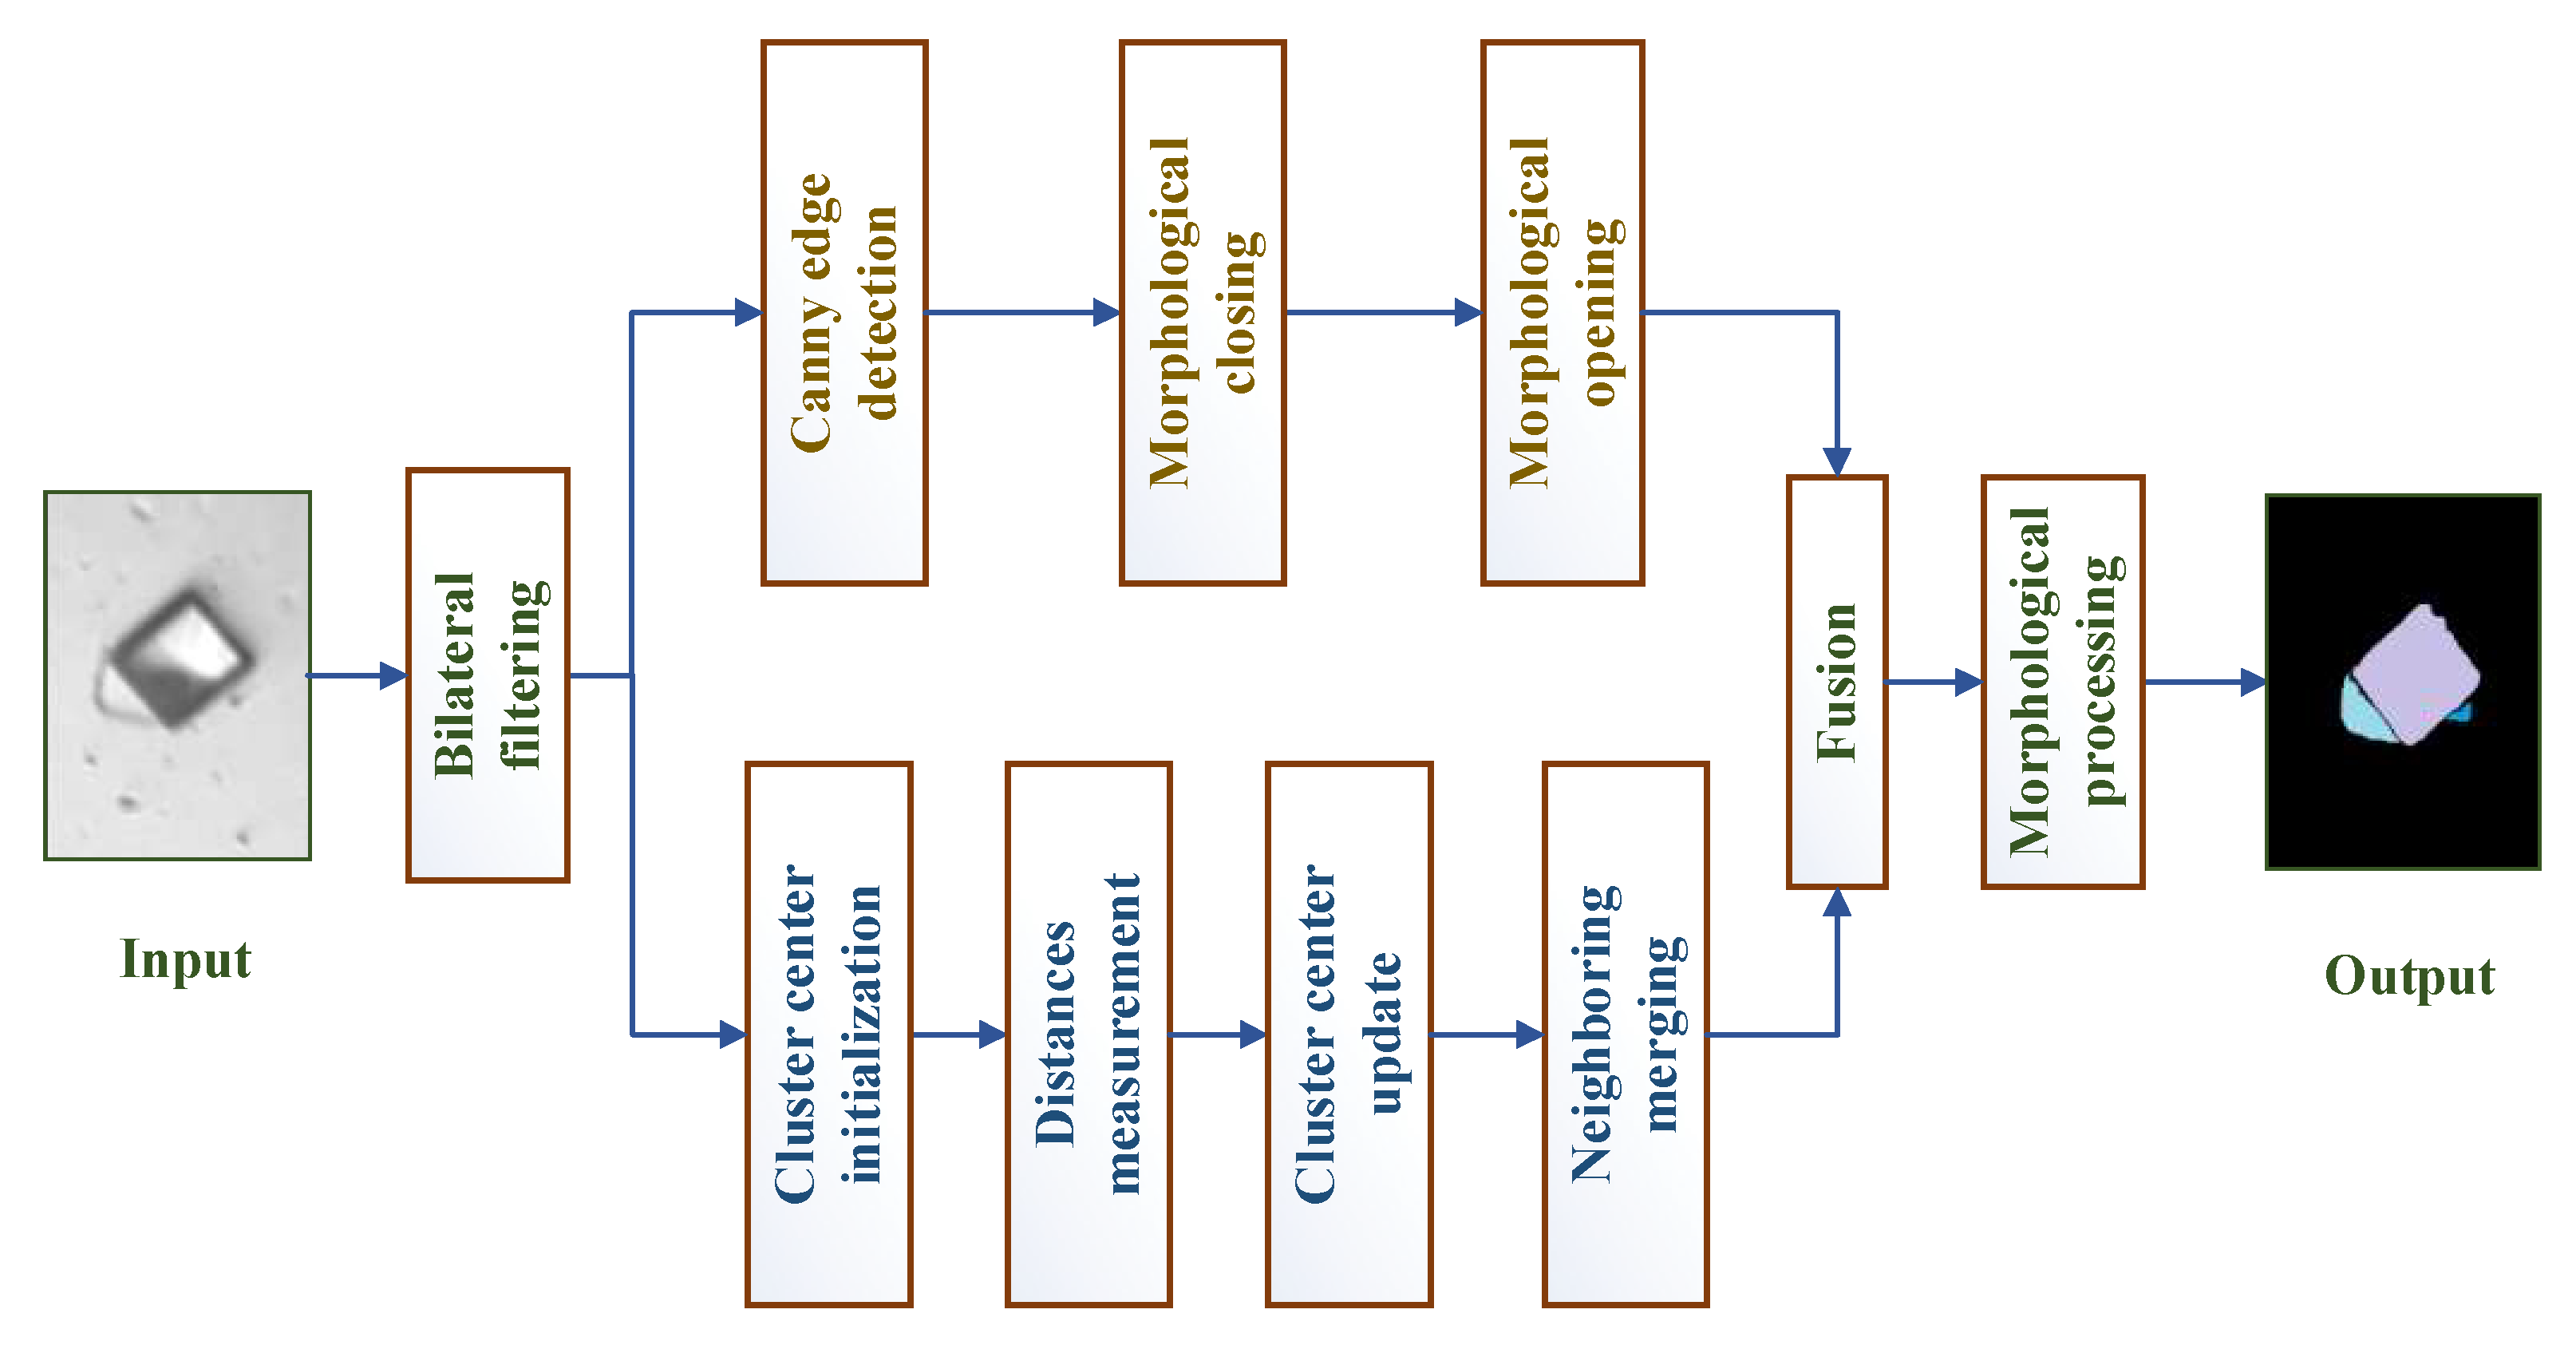
The goal of the crystal image processing methodology was to measure the crystal sizes based on the crystal images. Image segmentation is a key step in separating the crystals and the background for size measurement. The Canny edge detection method can result in an excellent performance for crystal images [15]. However, Canny edge detection method for crystal images at high-solid concentrations may face a major problem in that it is difficult to segment overlapping crystals. Therefore, considering that different crystals have different grayscale or texture, a simple linear iterative clustering (SLIC) method [23] as an efficient and simple superpixel algorithm was introduced to generate compact and nearly uniform superpixels. The steps of improved segmentation based on Canny detection and superpixel are as shown in Figure 3.
Figure 3.
The illustration of the proposed segmentation algorithm.
3.1. Image Filtering
Noise is the important interference for the analysis of crystal image. For this reason, bilateral filtering [24] is popular filtering technique used to eliminate the noise in crystal images. The filtering process is as follows:
Firstly, the noise model of image is expressed by
where is the denoising image, is the noise and is the raw image.
The bilateral filter makes use of the local weighted average method to obtain the restored image pixel value as
where represents the neighborhood (size: ) of the central point , . For each point within the neighborhood, is defined by
It is noted that denotes the neighborhood size, denotes the spatial domain factor and denotes the value domain factor. In this work, , and .
3.2. Improved Canny Segmentation
For an image , the smoothed image is obtained with an appropriate Gaussian filter as
where and is the Gaussian filter parameter.
The gradient magnitude and gradient direction at the pixel are
where and are the gradient arrays defined as
If the gradient magnitude at the pixel is less than those at its two neighbors in the same gradient direction , the pixel is marked as a candidate edge point. Otherwise, the pixel is discarded. On this basis, the final edge points are further defined by high threshold and low threshold , . The strong edge points are defined with , and the weak edge points are defined with . Then, the contour edges are obtained for crystal projection image. Note that can be calculated using Otsu threshold method [25] as
where denotes the threshold, is the number of gray values greater than the threshold , is the number of gray values less than the threshold , is the mean gray values greater than the threshold and is the mean gray values less than the threshold .
After edge detection, morphological closing is used to close the breaks of Canny edges before region filling. The rest of the edges can be easily removed by morphological opening.
3.3. Improved SLIC Superpixel Segmentation
SLIC superpixel segmentation is used to generate superpixel blocks, which will be merged with cluster algorithm to obtain extraction results of a crystal image. The main idea of SLIC superpixel segmentation is to extract the five-dimensional feature vector of CIELAB color and spatial coordinates, construct the similarity measurement standard of feature vector and then to perform local clustering of image pixels [23]. The CIELAB color space is used to measure spatial distance with color sense differences, which is convenient for color clustering. However, the crystal images are generally gray, so the grayscale is used instead of CIELAB color features. SLIC algorithm cannot segment the ideal superpixel blocks well when the target and background contain different texture information but similar color. Due to the abundant texture information in crystal images, texture feature has an important influence on the segmentation results. Therefore, texture information is considered as a SLIC segmentation information.
Suppose that the image with pixels is pre-divided into superpixels; then, the size of each superpixel is . The distance of adjacent seed points is approximately . The superpixel cluster centers with at regular grid intervals . denotes the grayscale of a pixel; and denote the row and column coordinates of a pixel, respectively; and denotes the texture value of a pixel for local image entropy [21] with the region as
where is the probability of the gray level pairs i and j in the image, is the horizontal pixel offset and is the vertical pixel offset for the gray level co-occurrence matrix [26].
The seed points are re-selected in the neighborhood of the seed points. The seed points move to the place with the smallest gradient in the neighborhood to avoid seed points falling on the contour boundary with large gradient. Each pixel is assigned a class label in the neighborhood around each seed point. The search region is limited to to accelerate the convergence of the algorithm. Next, distances are measured, including space, grayscale and texture distances. The distance between it and the seed point is calculated as follows:
where is the grayscale distance, is the space distance and is the texture distance.
The integrated distance between this pixel and the center is defined as
where is the weight value for adjusting texture distance.
The final step is to update the cluster centers iteratively until residual error meets the stop condition (). It is noted that the residual error is defined as Manhattan distance between previous centers and new cluster centers [23]. After the iterative optimization, the neighboring merging strategy is used to merge isolated small size superpixels to ensure a good tight-fitting degree of the final result.
3.4. Image Fusion
The fusion method is proposed to fuse the binary map of Canny edge detection and the edge map of superpixel regions. In this process, bilateral filtering is employed to remove noise. The agglomeration regions that are selected by convexity feature [11] in the binary map of Canny edge detection are just fused with the superpixel edges. For morphological processing, some small particles or background spots that are not likely to provide reliable size or shape information are removed by specifying a minimum number of pixels. Moreover, the fragmentary crystal blocks that are connected to the image border are also removed to suppress border interference.
4. Size Measurement Method
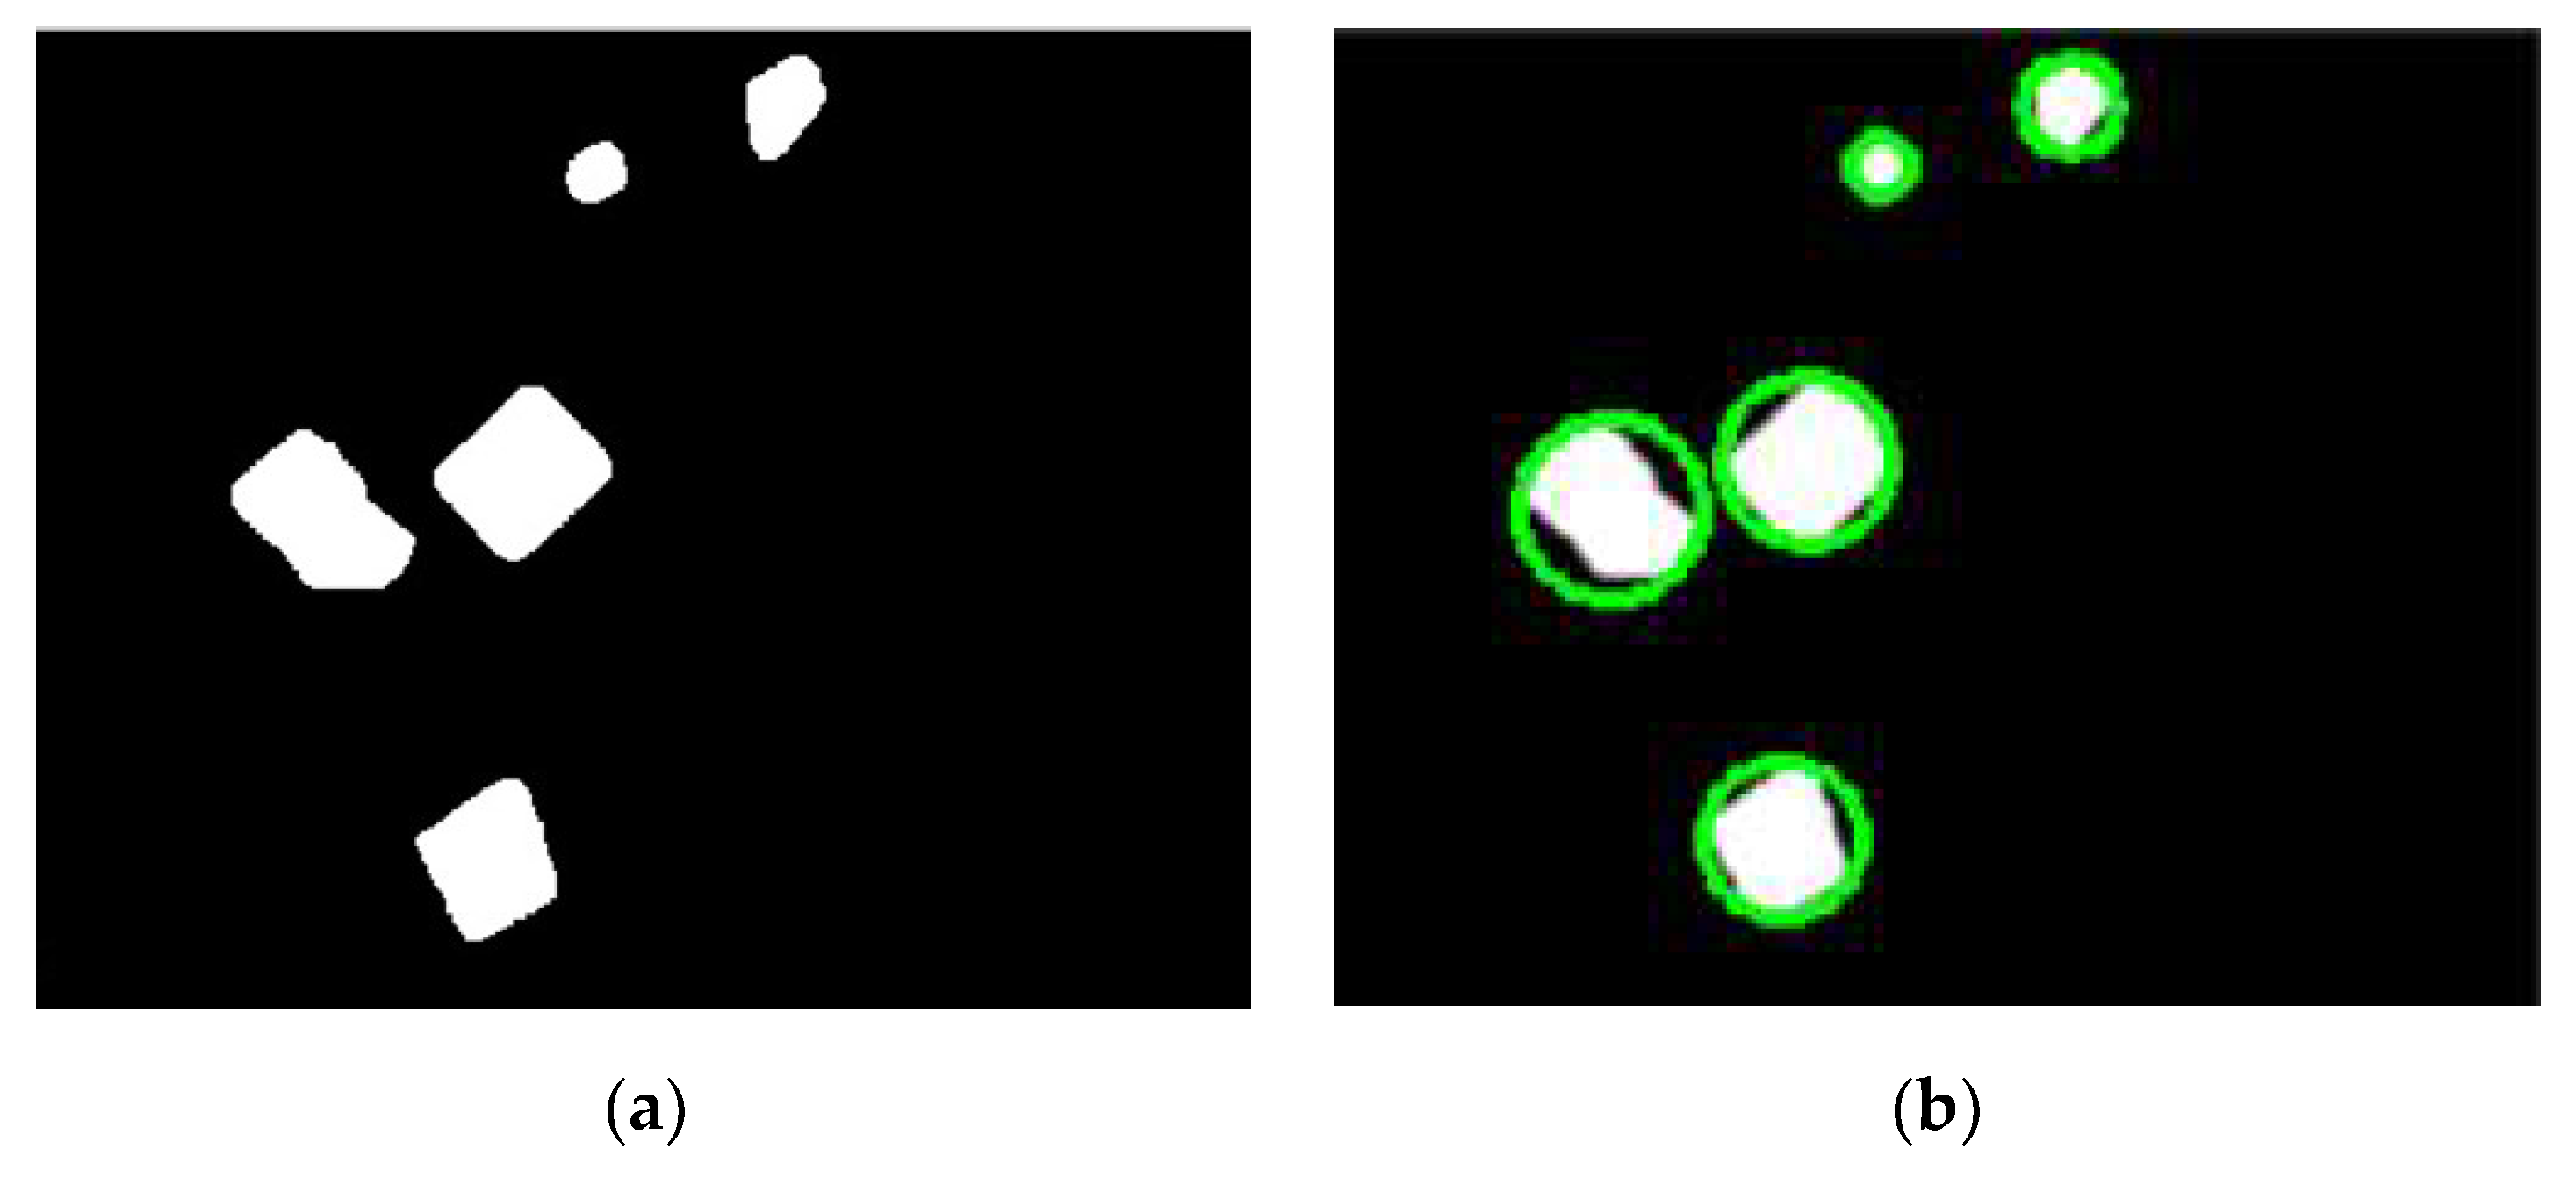
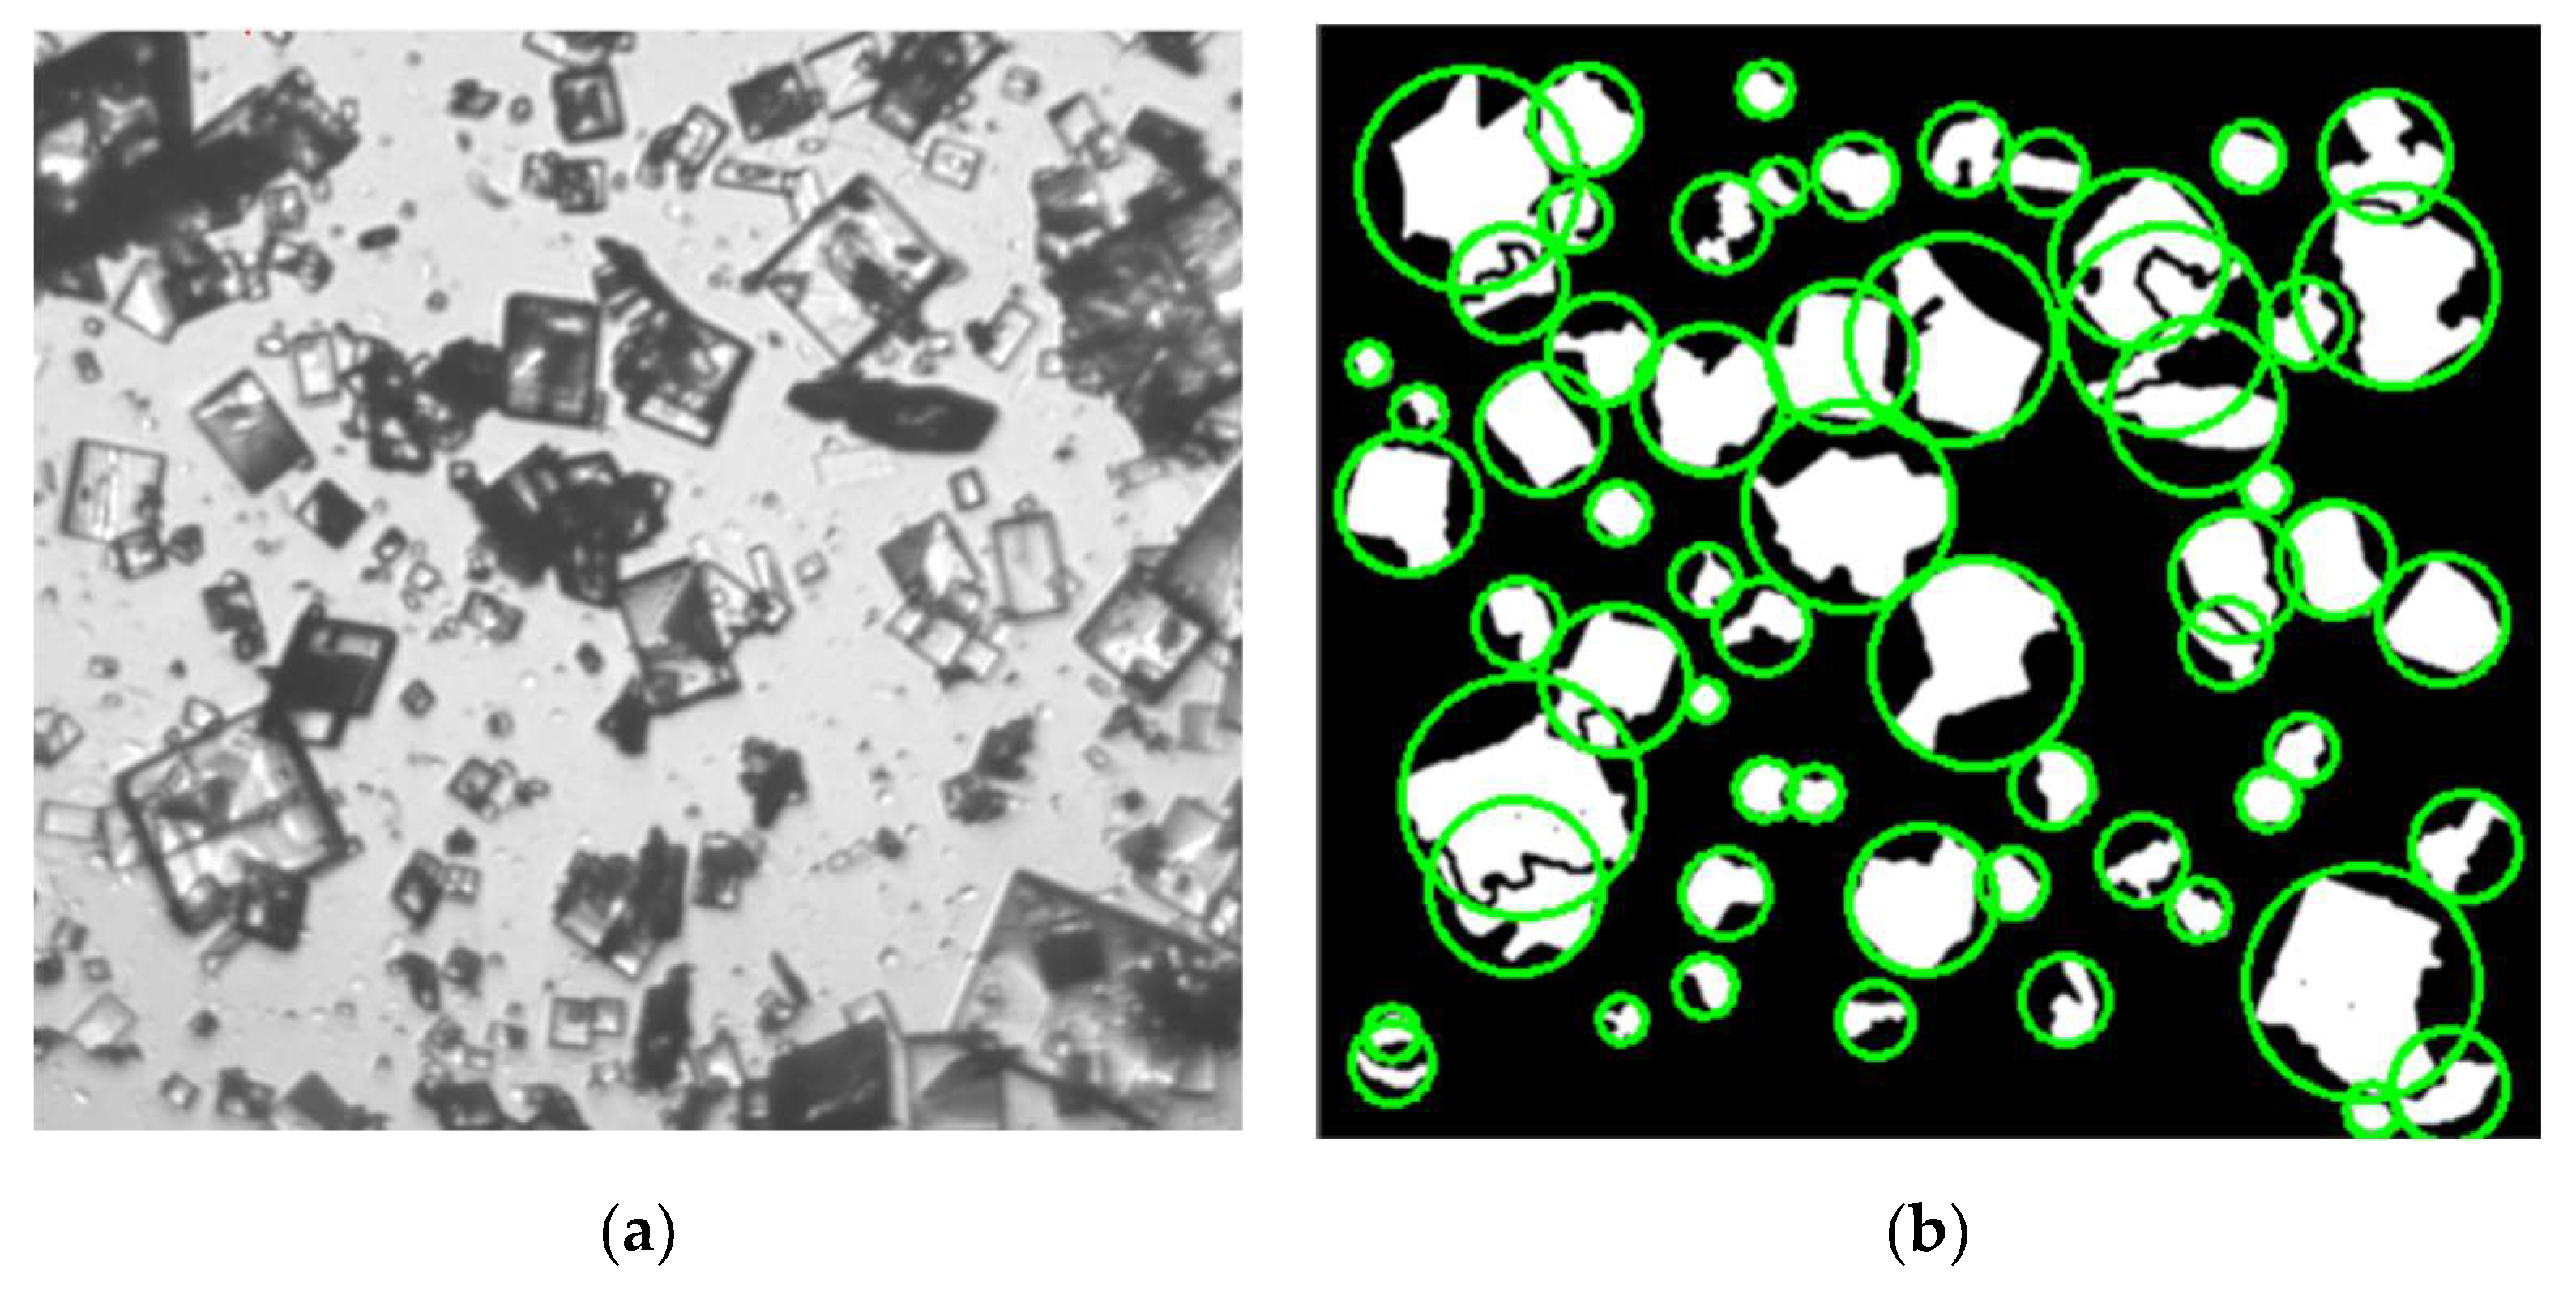
Size measurement rule of crystals is still an open issue, since the shape of different crystals is varied. In this study, the shape of α-form LGA is generally prismatic, as shown in Figure 1. Therefore, the diameter of the minimum enclosing circle for crystal imaging is typically considered as the one-dimension size of prismatic crystal. It can also tolerate the problem of the incomplete particles, which are separated from overlapped crystals. Firstly, in order to objectively reflect the relationship between actual size and image size, an effective method of physical calibration [11] is utilized with a micron circle scale to compute the pixel equivalent . This scale is located in the probe imaging location to compute the relationship between the pixel and the actual size. Based on the binary result, the pixel number of the particle size can be measured by using the minimum enclosing circle method [27], and a processing example is as shown in Figure 4. Denoted by the measured pixel number of the enclosing circle diameter, the actual one-dimension size of the crystal, i.e., the actual physical diameter of the minimum enclosing circle denoted by is given by
Figure 4.
An example with minimum enclosing circle method: (a) the binary image with multiple objects; (b) the result of minimum enclosing circle.
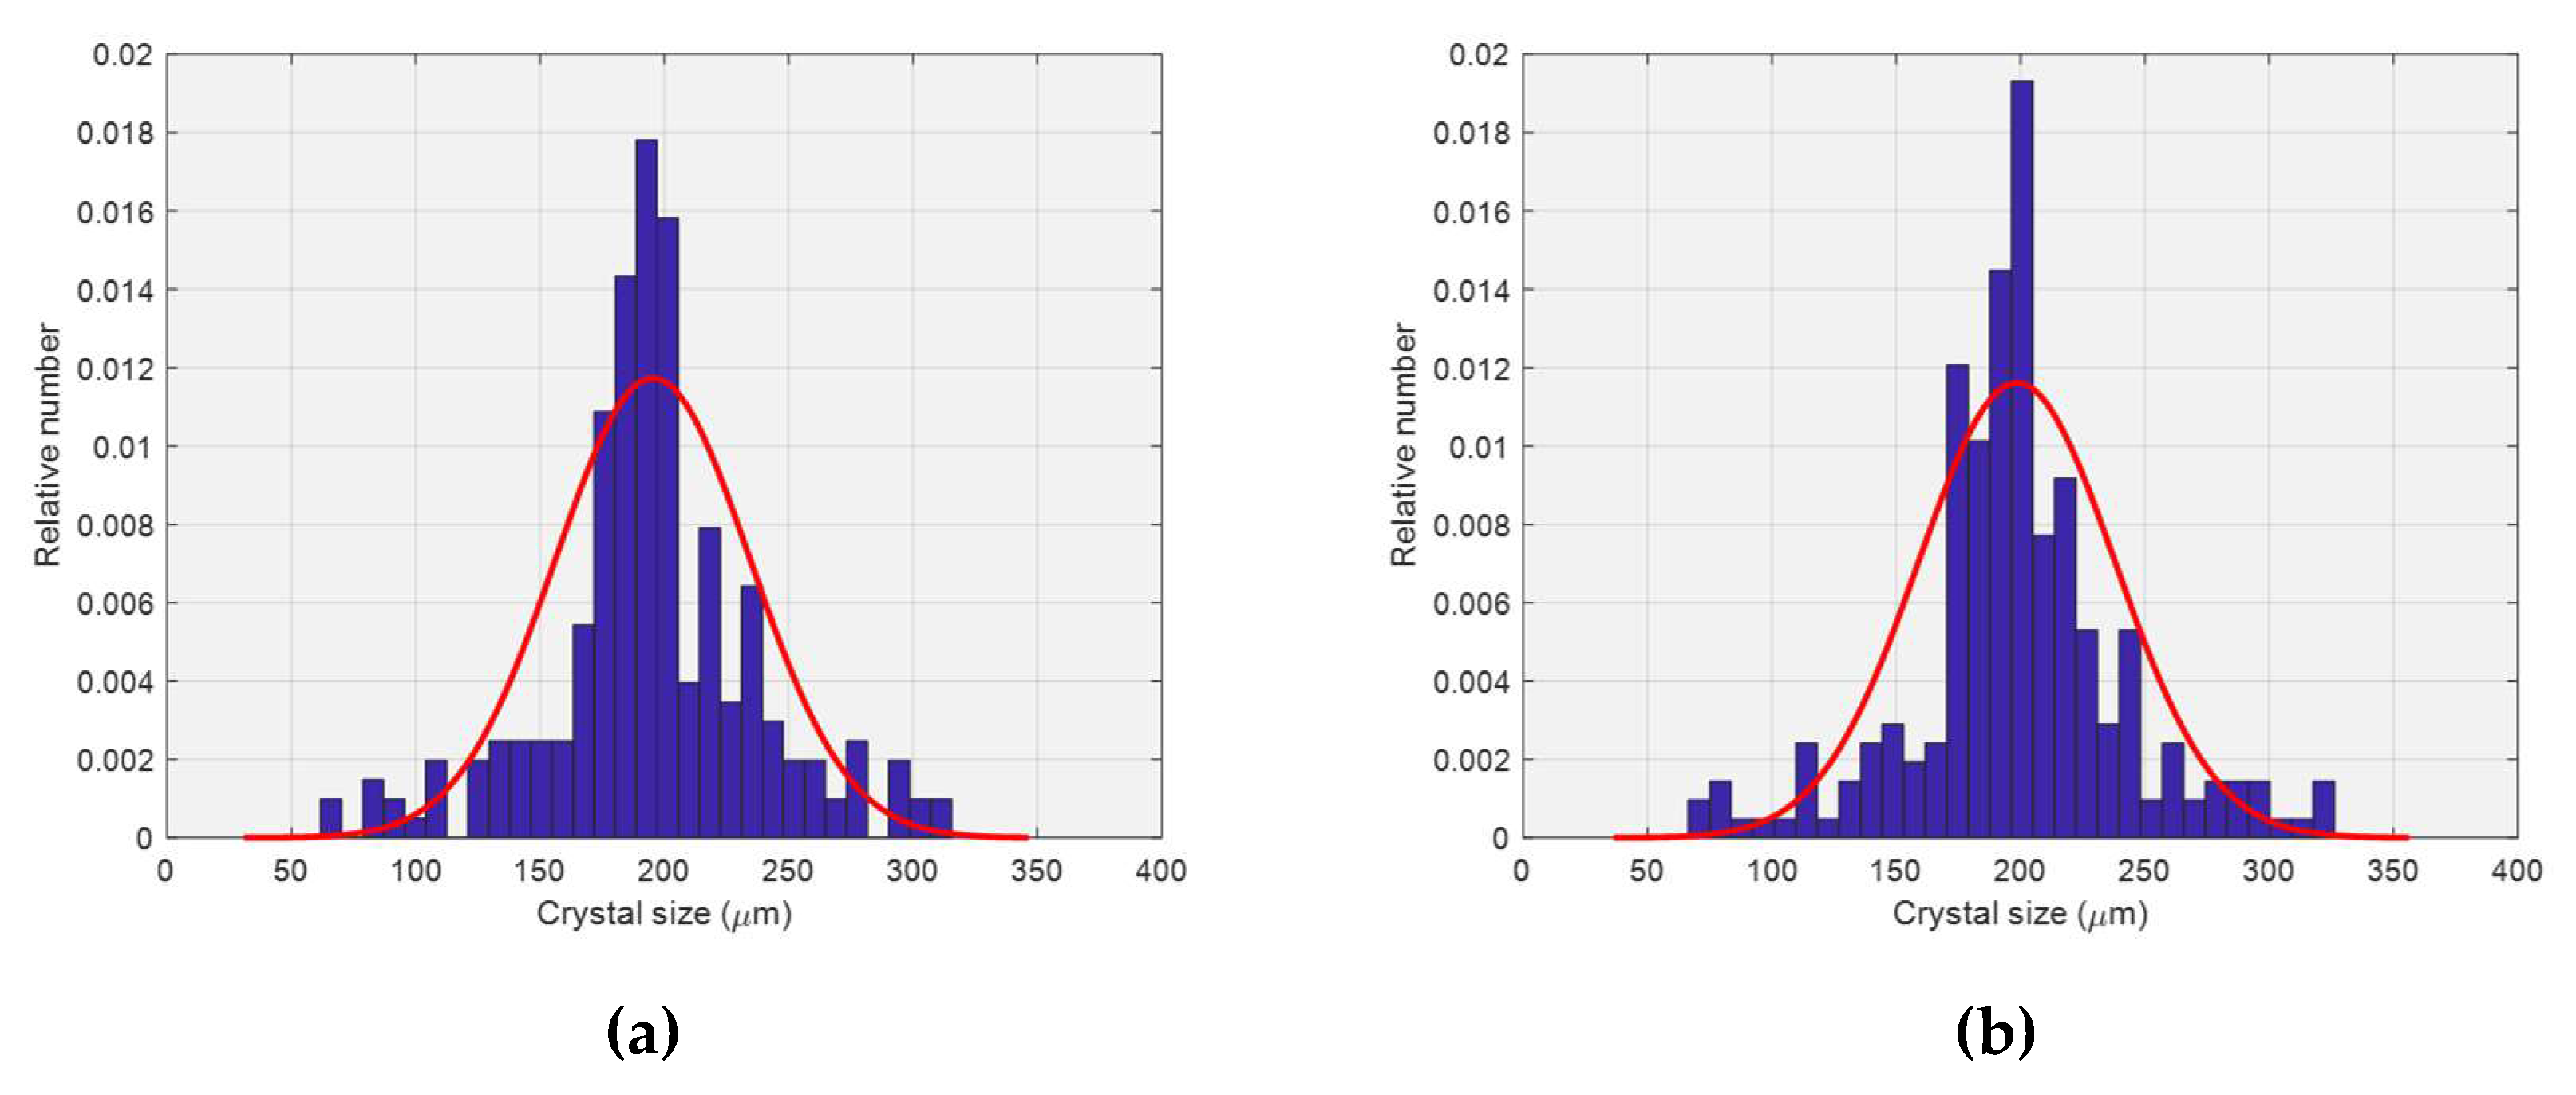
Based on the above size measurement, crystal sizes can be provided. To clarify population size information, a statistic histogram of CSD is smoothed with the probability density function of Gaussian [28], which is defined by
where is the size variable and and are the mean and standard deviation parameters of the Gaussian distribution, respectively.
Note that the minimum enclosing circle method is only applicable to segmented results with a mass of agglomerated particles. The method is suggested to measure blocky and circular shapes, and it facilitates further one-dimension CSD estimation. In order to better describe the size characteristics, different measurement methods should be employed according to different morphologies, which can be detected for shape features [11].
5. Experimental Results
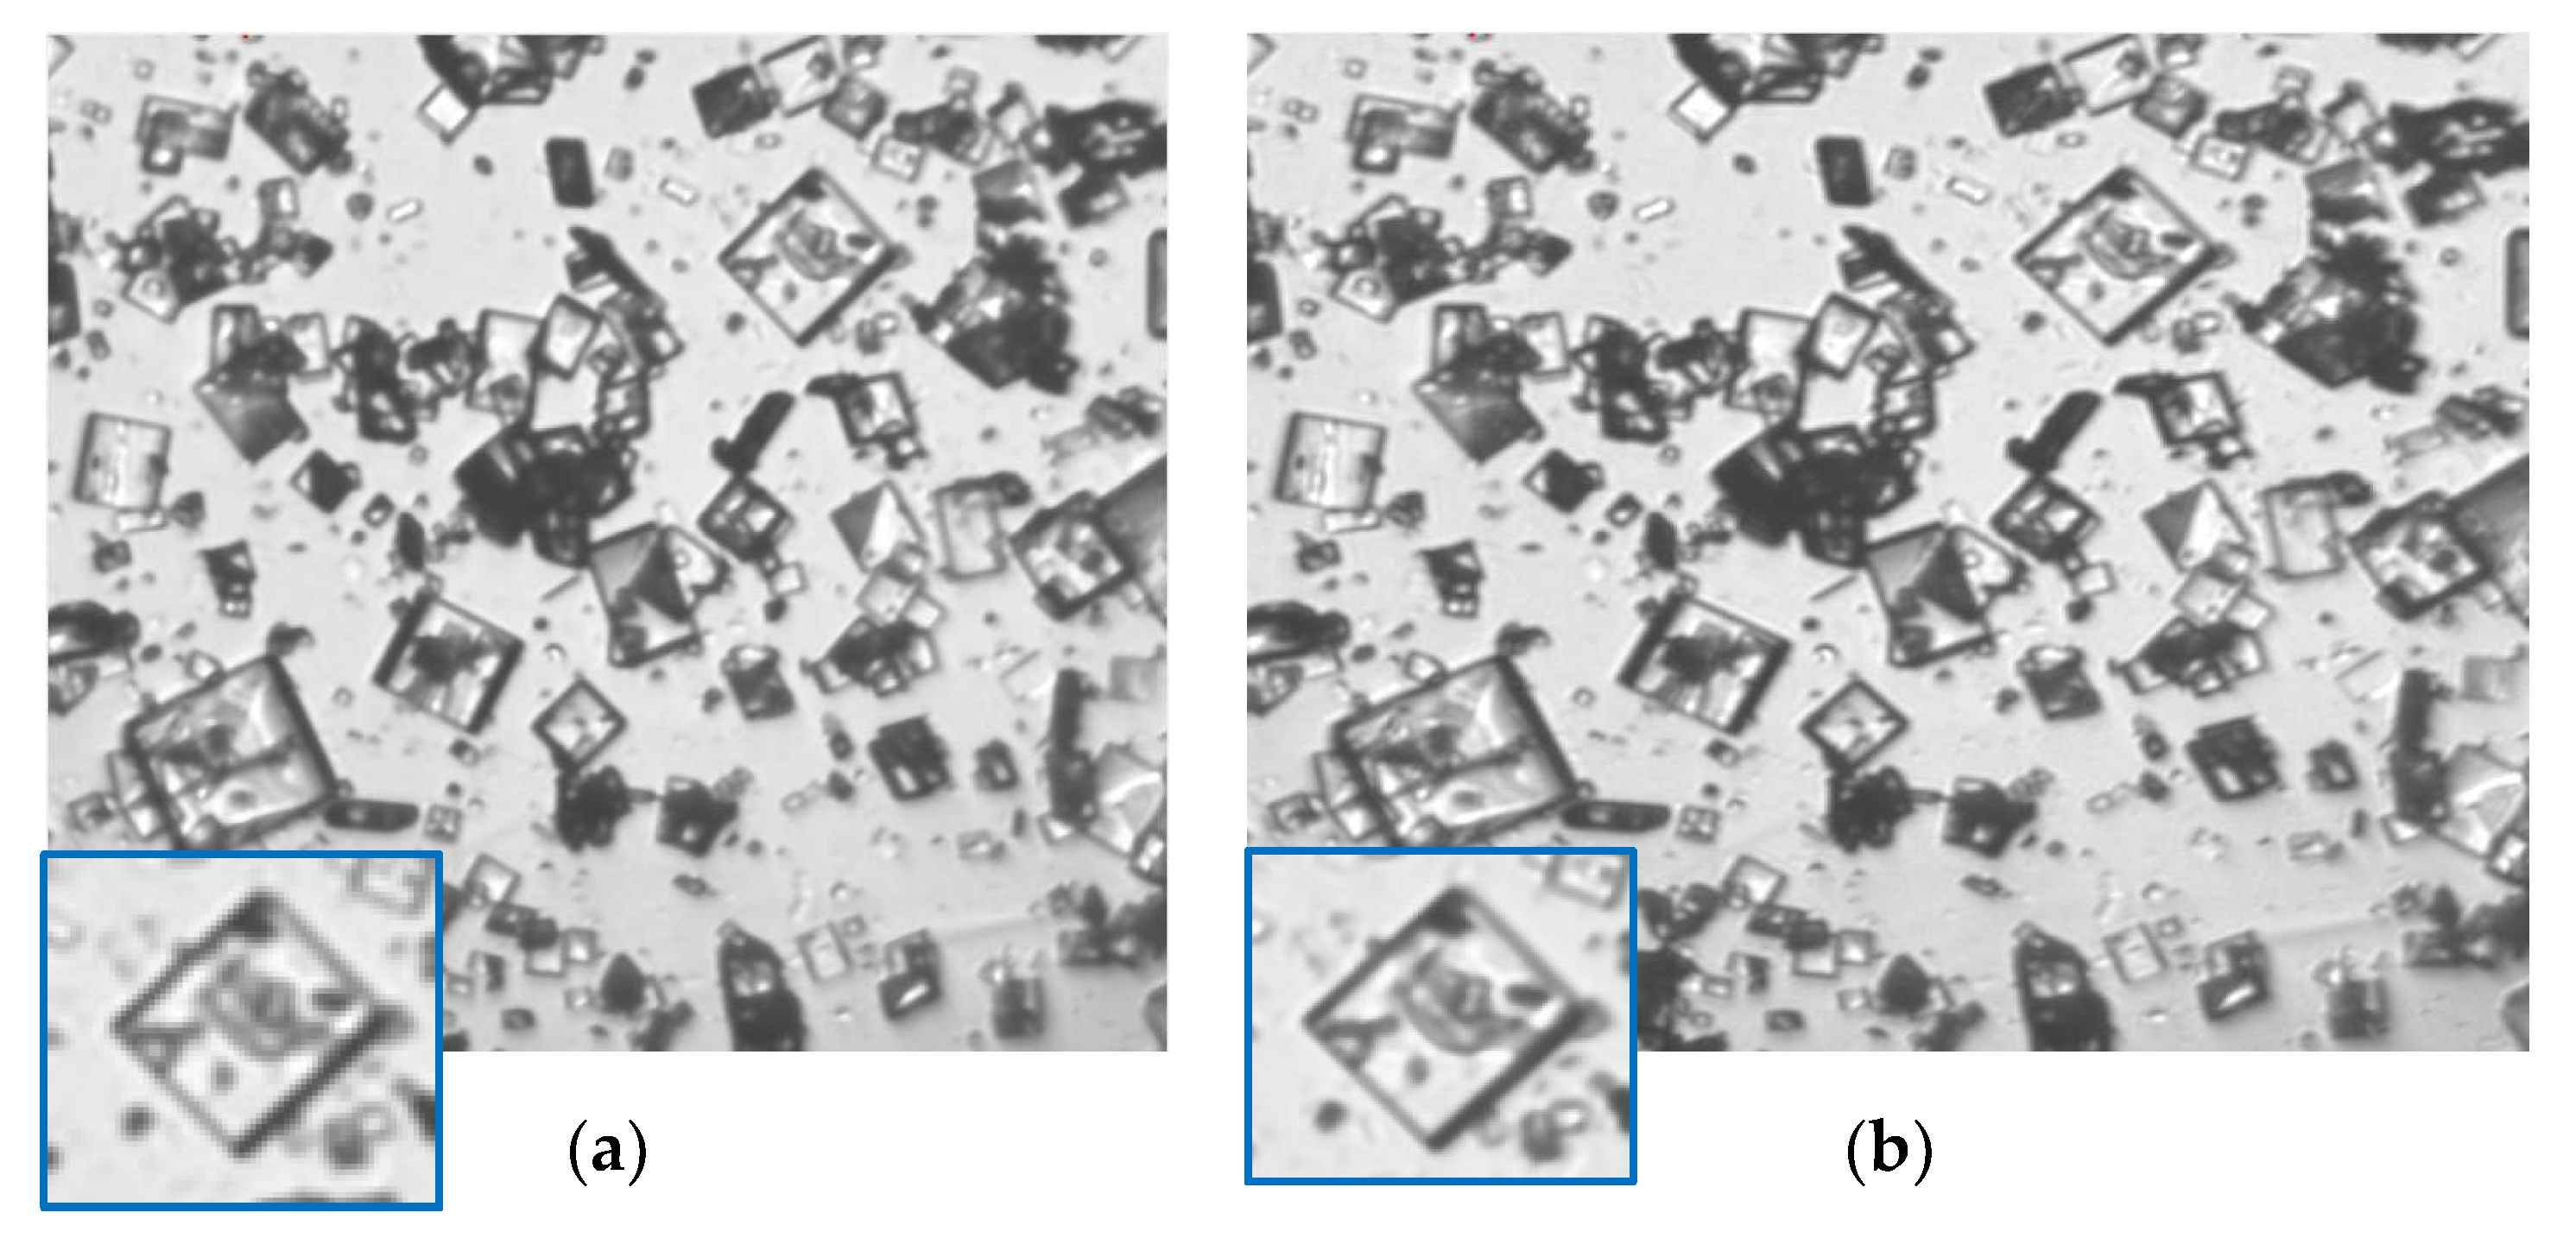
In the experiment, the on-line crystal images of α-form LGA are recorded by the invasive imaging system. They have just double colors in a JPEG format. To simplify the calculation, the raw image can be translated into the gray scale image. It is seen that the on-line images of slurries with multiple overlapped crystals suspended in a solution contain a lot of noise, as shown in Figure 5a. It is noted that the phenomenon that a mass of crystals are overlapped in a finite space can be seen as a case of high solid density. The image preprocessing result with image filtering is shown in Figure 5b. Tenengrad [29,30] as a quantitative index of image quality is used for comparison between Figure 5a,b. It can be seen that the preprocessed image is denoised and deblurred. Note that Tenengrad of Figure 5b is higher than that of Figure 5a higher quality and Tenengrad is defined for image Y as
where denotes the row, denotes the column, and and are
Figure 5.
Segmentation results of different segmentation: (a) the in situ captured image (); (b) the preprocessed result ().
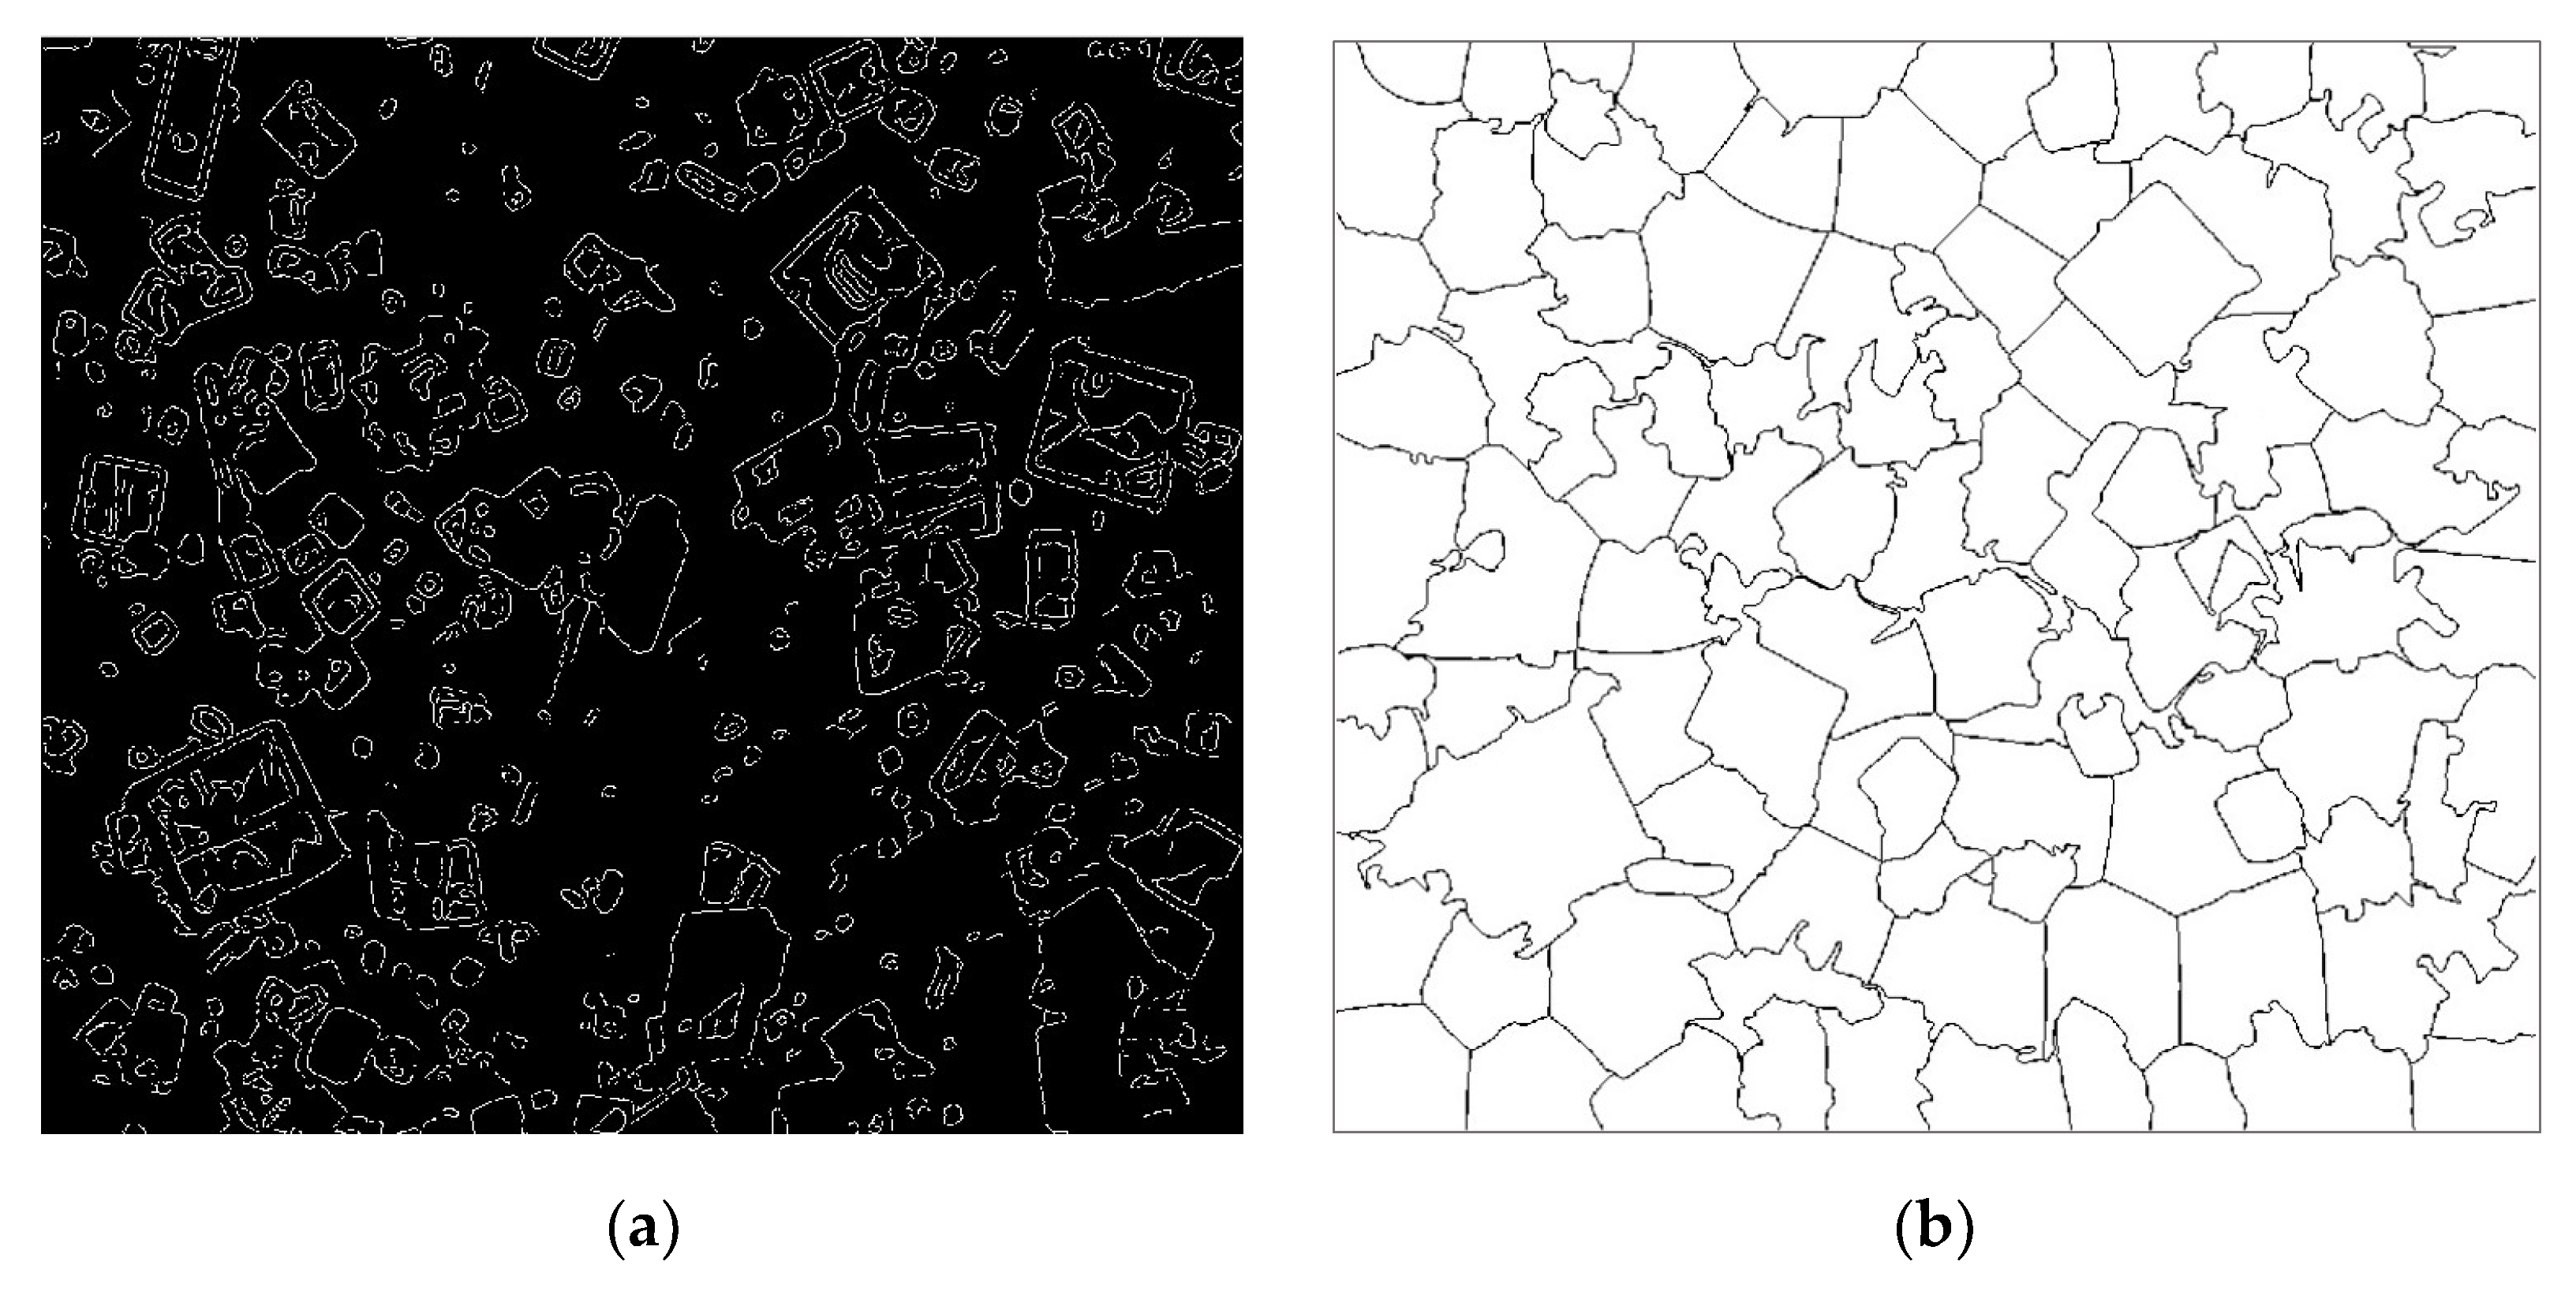
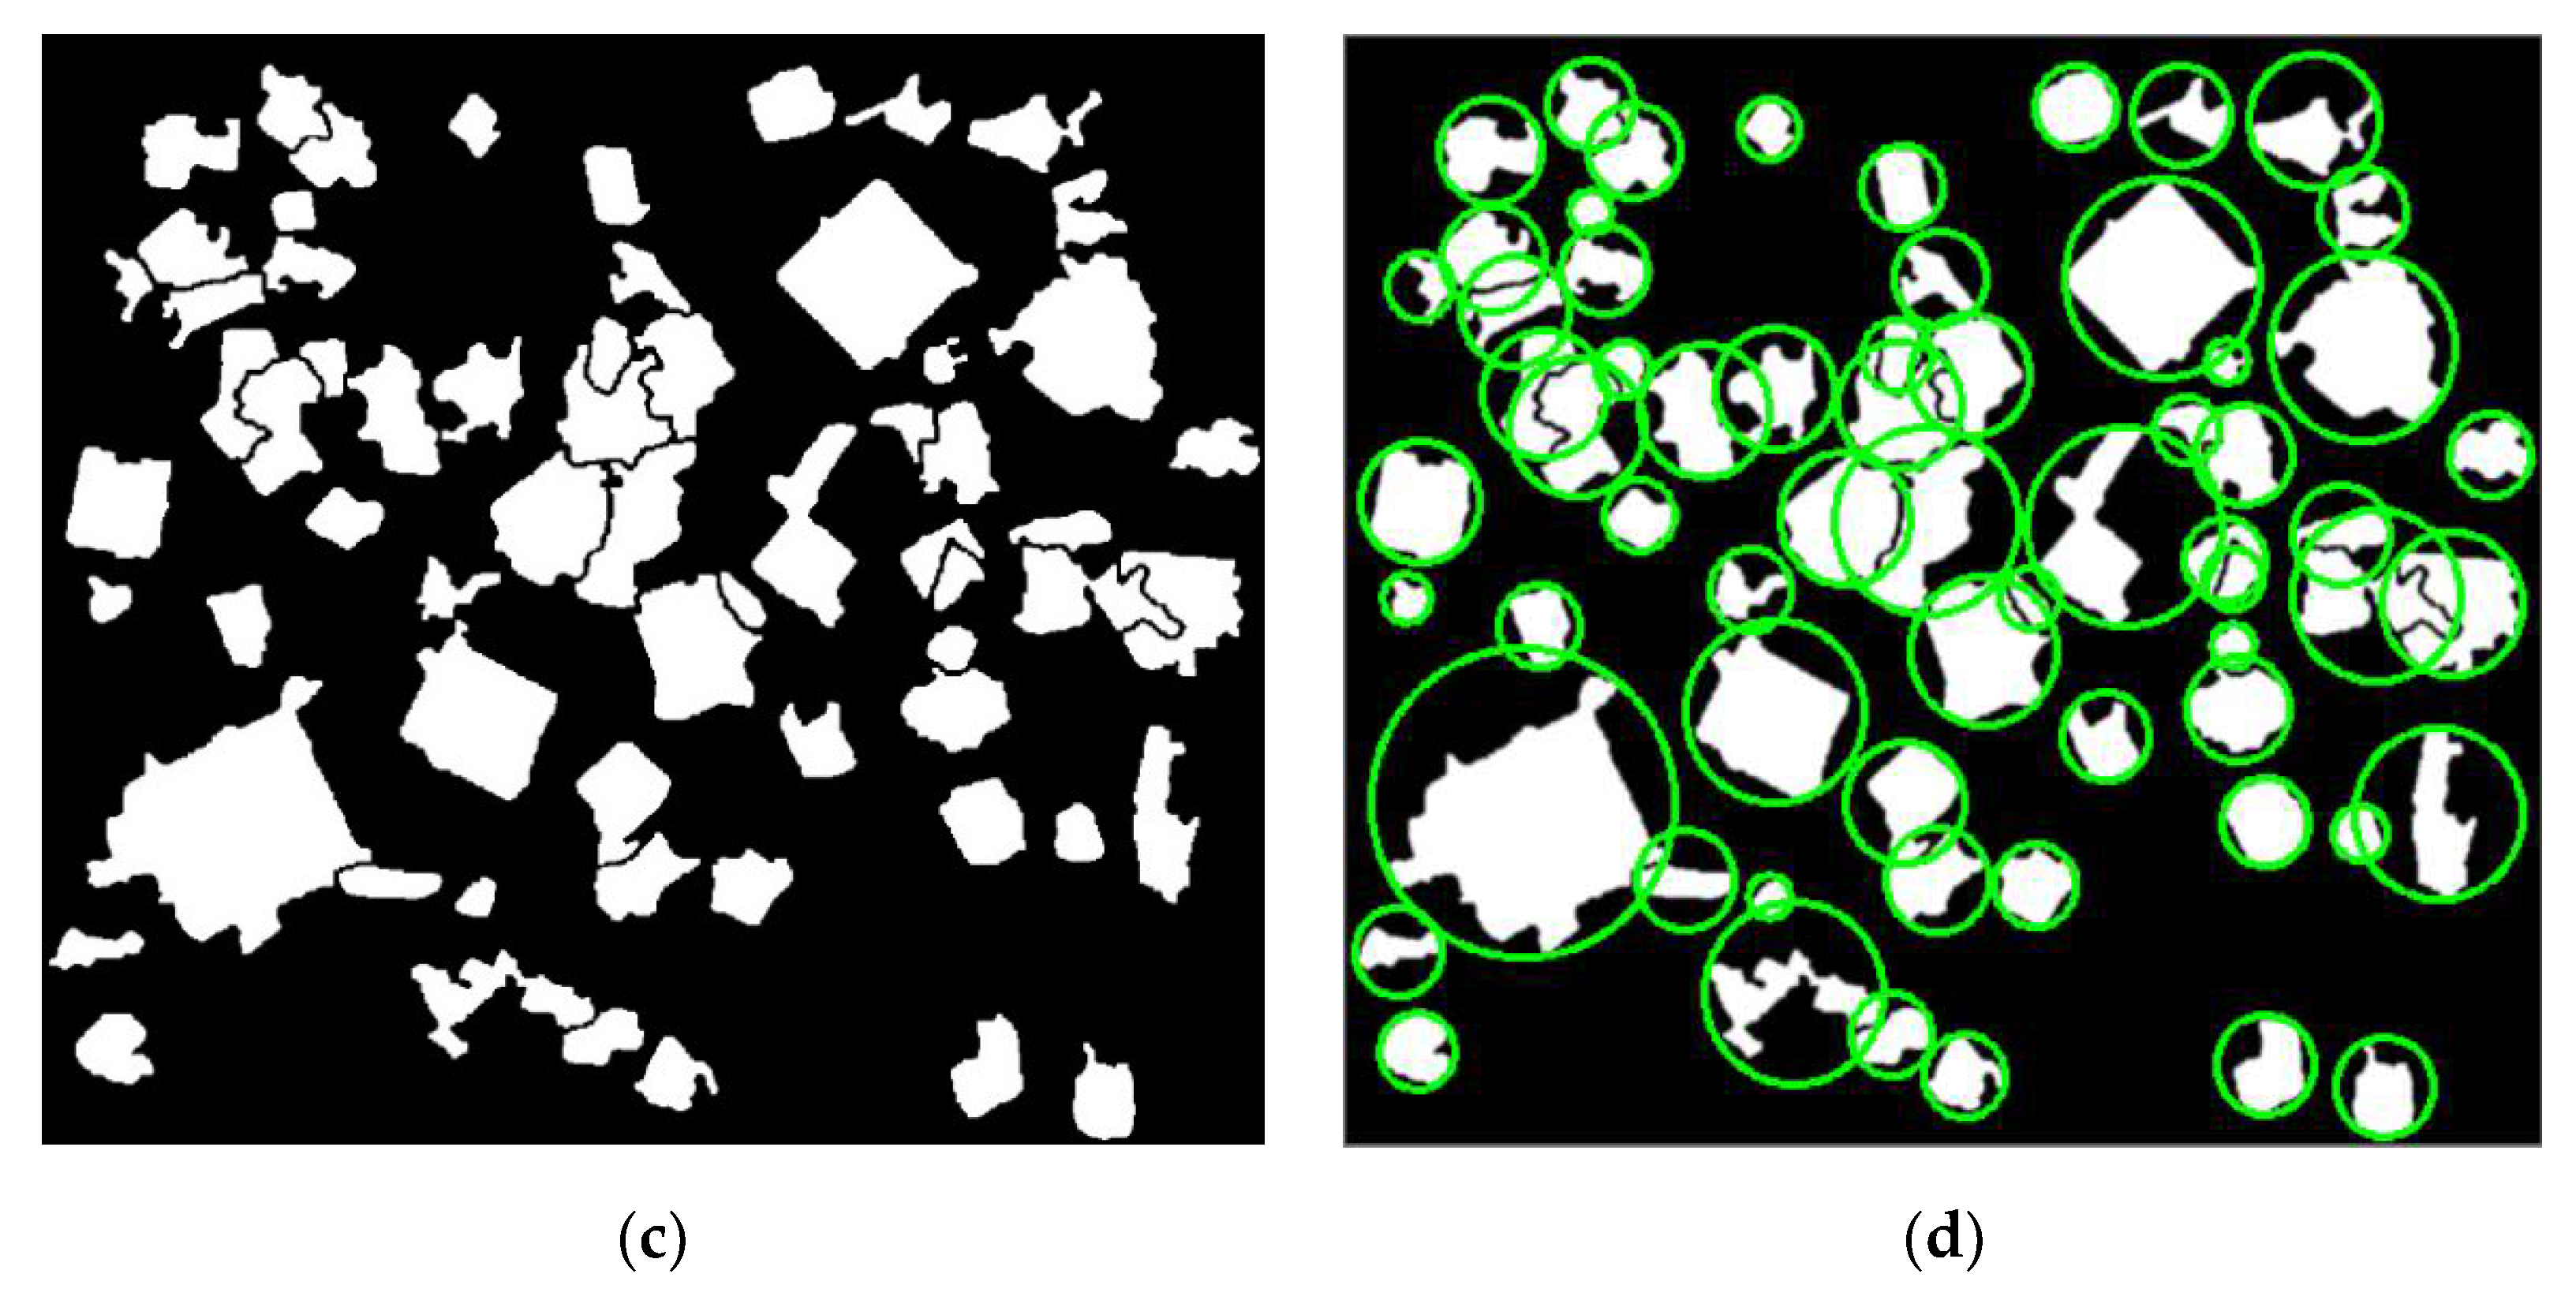
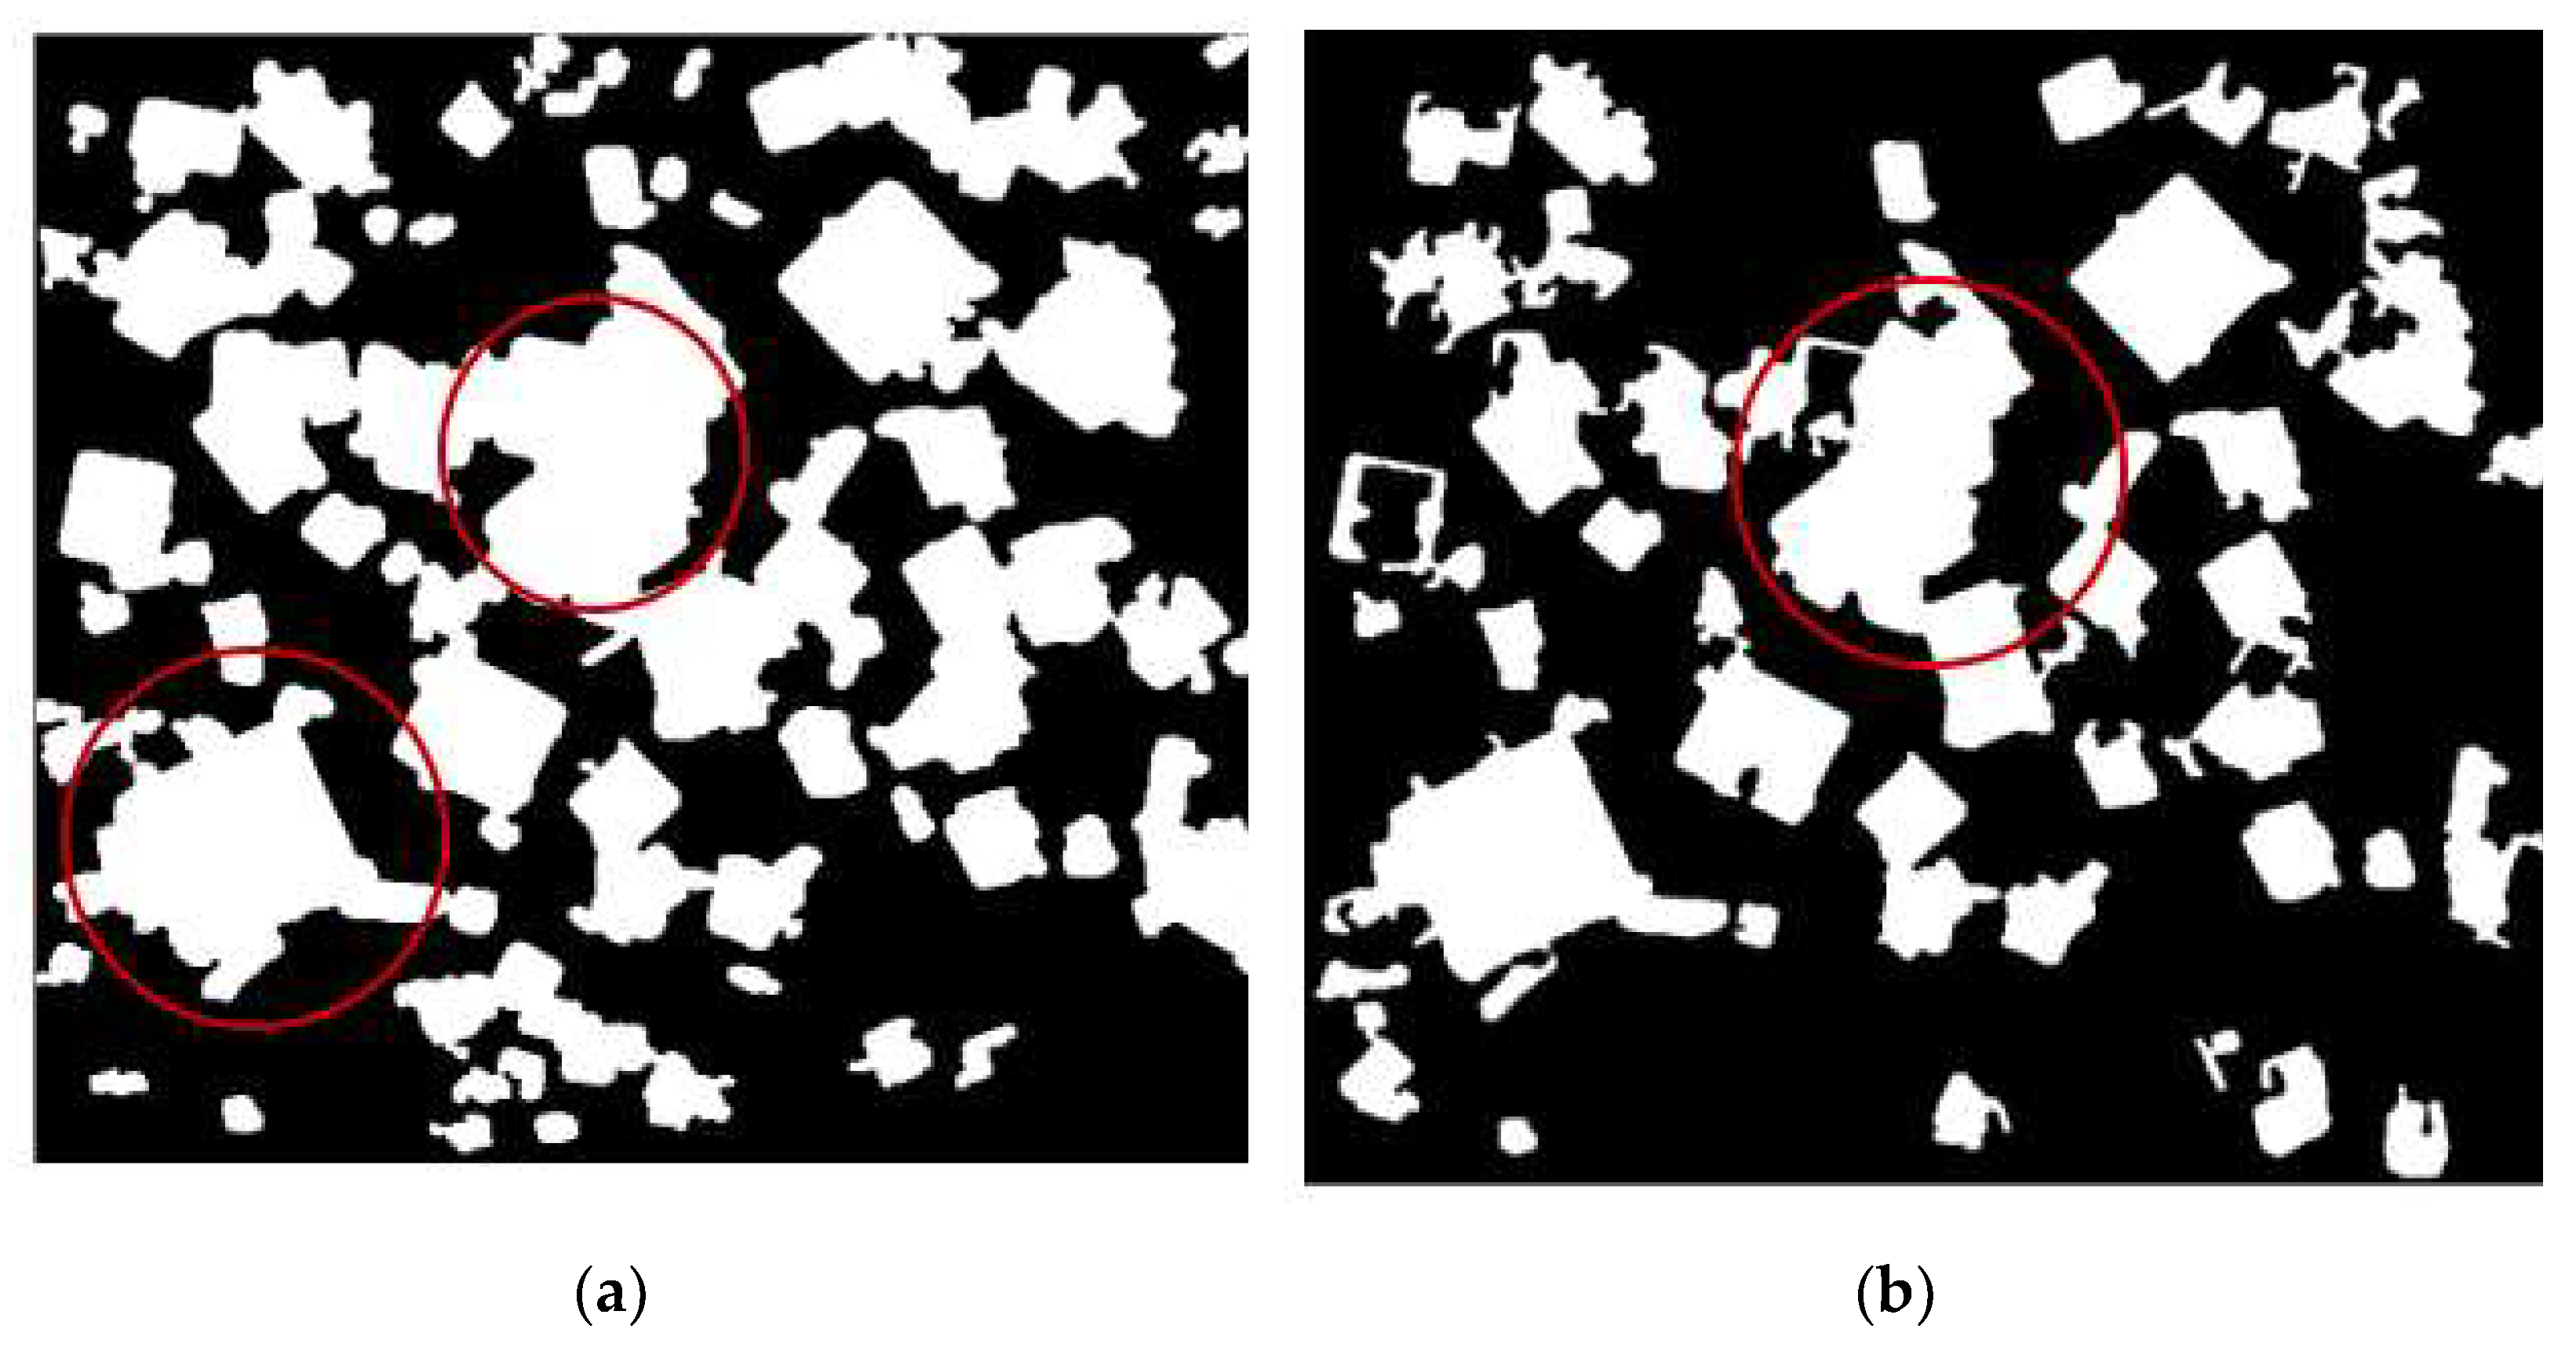
The proposed segmentation method based on superpixel and Canny detection is applied on the preprocessed image (see Figure 5b). In Figure 6a, the edge detection result is obtained by using improved the Canny edge detection method. Figure 6b shows the results of the improved SLIC superpixel segmentation method. Then Figure 6c represents the segmented results that are detected with image fusion effectively. In the segmented binary result, the crystal intensity can be 1 and the background can be 0. After image processing, the crystal sizes are measured by using the fast minimum enclosing circle method as shown in Figure 6d, and the CSD model is obtained with the probability density function of the Gaussian. To show the superiority of the proposed segmentation method, Figure 7 illustrates the segmentation results by using well-recognized multi-scale segmentation algorithm [15] and the popular threshold algorithm [11]. In Figure 7, most overlapping crystals were not able to be segmented. It can be seen that multiple overlapped particles outlined by red circles cannot be separated with the use the two well-recognized segmentation algorithms.
Figure 6.
Segmentation results: (a) Canny edge detection; (b) SLIC segmentation; (c) fusion image; (d) size measurement.
Figure 7.
Visual comparison of the crystal image with different methods: (a) multi-Canny segmentation; (b) threshold segmentation.
In addition, another highly -concentrated image captured from the experiment is analyzed as shown in Figure 8, in order to demonstrate the efficiency of the proposed method. Figure 8 shows that most of crystals can be properly separated from the background, together with a good result of size measurement.
Figure 8.
Analytic result of another image: (a) the in situ captured image; (b) size measurement.
In order to validate the proposed imaging measurement method, a complementary experiment was performed using off-line verification method. The CSDs of α-form LGA crystals were obtained using two different methods: the proposed in situ imaging method and off-line measurement by using digital microscope with measurement software, which has the ability to measure size. Figure 9 shows the CSDs are produced by using the in situ method and the off-line method, respectively. Note that about 600 crystals were extracted from 15 images captured within one minute to produce a CSD model using in situ image measurement. In the off-line measurement, the CSD was also calculated with approximately 600 crystals extracted from 50 off-line images, which were captured with the off-line microscope. The crystal sizes were obtained by using manual length measurement with LAS software. To show the similarity, the mean value and standard deviation for the Gaussian of CSD in size are used. For the quantitative comparison, the relative error of is 1.61% and the relative error of is 1.08%. The comparison results show that the results given by the proposed in situ method are very close to those of the off-line method.
Figure 9.
CSDs of LGA crystals: (a) CSD using in situ image measurement; (b) CSD using off-line measurement.
6. Conclusions
In this work, a synthetic image-measurement method to measure CSD was developed by combining superpixel segmentation and edge detection. The analysis capabilities of α-form LGA crystals at high-solid concentrations were investigated with on-line invasive imaging system. The raw images were denoised before segmentation. The segmentation algorithm successfully extracted the crystals from the on-line images with a mass of overlapping crystal blocks. Furthermore, the estimation of CSD was produced by probability density function. In the end, the experimental results on α-form LGA were performed to show that the in situ image measurement method was effective. The proposed method can measure crystal sizes during crystallization at high-solid concentrations. It can also potentially assist with the evolution modeling of crystal size distributions. Our future work will focus on studying image-based agglomeration degree and solid concentration detection for multiple morphologies.
Author Contributions
Conceptualization, Y.H. and X.L.; methodology, Y.H. and D.G.; software, D.G.; writing—original draft preparation, Y.H.; writing—review and editing, X.L.; project administration, Y.H. All authors have read and agreed to the published version of the manuscript.
Funding
This research was funded by China Postdoctoral Science Foundation, grant number, 2020M680979, Doctoral Start-up Foundation of Liaoning Province of China, grant number, 2021-BS-281.
Institutional Review Board Statement
Not applicable.
Informed Consent Statement
Not applicable.
Data Availability Statement
Not applicable.
Conflicts of Interest
The authors declare no conflict of interest. The funders had no role in the design of the study; in the collection, analyses, or interpretation of data; in the writing of the manuscript; or in the decision to publish the results.
References
- Zhang, F.; Du, K.; Guo, L.; Huo, Y.; He, K.; Shan, B. Progress, problems, and potential of technology for measuring solution concentration in crystallization processes. Measurement 2021, 187, 110328. [Google Scholar] [CrossRef] [Scilit]
- Borsos, Á.; Szilágyi, B.; Agachi, P.; Nagy, Z.K. Real-Time Image Processing Based Online Feedback Control System for Cooling Batch Crystallization. Org. Process. Res. Dev. 2017, 21, 511–519. [Google Scholar] [CrossRef] [Scilit]
- Gao, Y.; Zhang, T.; Ma, Y.; Xue, F.; Gao, Z.; Hou, B.; Gong, J. Application of PAT-Based Feedback Control Approaches in Pharmaceutical Crystallization. Crystals 2021, 11, 221. [Google Scholar] [CrossRef] [Scilit]
- Gan, C.; Wang, L.; Xiao, S.; Zhu, Y. Feedback Control of Crystal Size Distribution for Cooling Batch Crystallization Using Deep Learning-Based Image Analysis. Crystals 2022, 12, 570. [Google Scholar] [CrossRef] [Scilit]
- Wang, X.Z.; Roberts, K.J.; Ma, C. Crystal growth measurement using 2D and 3D imaging and the perspectives for shape control. Chem. Eng. Sci. 2008, 63, 1173–1184. [Google Scholar] [CrossRef] [Scilit]
- Cardona, J.; Ferreira, C.; McGinty, J.; Hamilton, A.; Agimelen, O.; Cleary, A.; Atkinson, R.; Michie, C.; Marshall, S.; Chen, Y.-C. Image analysis framework with focus evaluation for in situ characterisation of particle size and shape attributes. Chem. Eng. Sci. 2018, 191, 208–231. [Google Scholar] [CrossRef] [Scilit]
- Liao, C.-W.; Yu, J.-H.; Tarng, Y.-S. On-line full scan inspection of particle size and shape using digital image processing. Particuology 2010, 8, 286–292. [Google Scholar] [CrossRef] [Scilit]
- Huo, Y.; Zhang, F. In-Situ Detection of Micro Crystals During Cooling Crystallization Based on Deep Image Super-Resolution Reconstruction. IEEE Access 2021, 9, 31618–31626. [Google Scholar] [CrossRef] [Scilit]
- Zhou, Y.; Lakshminarayanan, S.; Srinivasan, R. Optimization of image processing parameters for large sets of in-process video microscopy images acquired from batch crystallization processes: Integration of uniform design and simplex search. Chemom. Intell. Lab. Syst. 2011, 107, 290–302. [Google Scholar] [CrossRef] [Scilit]
- Salami, H.; McDonald, M.A.; Bommarius, A.S.; Rousseau, R.W.; Grover, M.A. In Situ Imaging Combined with Deep Learning for Crystallization Process Monitoring: Application to Cephalexin Production. Org. Process Res. Dev. 2021, 25, 1670–1679. [Google Scholar] [CrossRef] [Scilit]
- Huo, Y.; Liu, T.; Liu, H.; Ma, C.Y.; Wang, X.Z. In-situ crystal morphology identification using imaging analysis with application to the L-glutamic acid crystallization. Chem. Eng. Sci. 2016, 148, 126–139. [Google Scholar] [CrossRef] [Scilit]
- Lu, Z.M.; Zhu, F.C.; Gao, X.Y.; Chen, B.C.; Gao, Z.G. In-situ particle segmentation approach based on average background modeling and graph-cut for the monitoring of l -glutamic acid crystallization. Chemom. Intell. Lab. Syst. 2018, 178, 11–23. [Google Scholar] [CrossRef] [Scilit]
- Zhang, R.; Ma, C.Y.; Liu, J.J.; Wang, X.Z. On-line measurement of the real size and shape of crystals in stirred tank crystalliser using non-invasive stereo vision imaging. Chem. Eng. Sci. 2015, 137, 9–21. [Google Scholar] [CrossRef] [Scilit]
- Wilkinson, M.J.; Jennings, K.H.; Hardy, M. Non-invasive video imaging for interrogating pharmaceutical crystallization processes. Microsc. Microanal. 2000, 6, 996–997. [Google Scholar] [CrossRef] [Scilit]
- De Anda, J.C.; Wang, X.; Roberts, K. Multi-scale segmentation image analysis for the in-process monitoring of particle shape with batch crystallisers. Chem. Eng. Sci. 2005, 60, 1053–1065. [Google Scholar] [CrossRef] [Scilit]
- Lins, J.; Heisel, S.; Wohlgemuth, K. Quantification of internal crystal defects using image analysis. Powder Technol. 2021, 377, 733–738. [Google Scholar] [CrossRef] [Scilit]
- Zhang, B.; Abbas, A.; Romagnoli, J. Multi-resolution fuzzy clustering approach for image-based particle characterization for particle systems. Chemom. Intell. Lab. Syst. 2011, 107, 155–164. [Google Scholar] [CrossRef] [Scilit]
- Gao, Z.; Wu, Y.; Bao, Y.; Gong, J.; Wang, J.; Rohani, S. Image Analysis for In-line Measurement of Multidimensional Size, Shape, and Polymorphic Transformation of l-Glutamic Acid Using Deep Learning-Based Image Segmentation and Classification. Cryst. Growth Des. 2018, 18, 4275–4281. [Google Scholar] [CrossRef] [Scilit]
- Larsen, P.; Rawlings, J.; Ferrier, N. An algorithm for analyzing noisy, in situ images of high-aspect-ratio crystals to monitor particle size distribution. Chem. Eng. Sci. 2006, 61, 5236–5248. [Google Scholar] [CrossRef] [Scilit]
- Ferreira, A.; Faria, N.; Rocha, F.; Teixeira, J. Using an Online Image Analysis Technique to Characterize Sucrose Crystal Morphology during a Crystallization Run. Ind. Eng. Chem. Res. 2011, 50, 6990–7002. [Google Scholar] [CrossRef] [Scilit]
- Zou, K.; Liu, T.; Huo, Y.; Zhang, F.; Ni, X. Image Analysis for In-Situ Detection of Agglomeration for Needle-Like Crystals. In Proceedings of the 2017 36th Chinese Control Conference, Dalian, China, 26–28 July 2017; pp. 11515–11520. [Google Scholar]
- De Anda, J.C.; Wang, X.; Lai, X.; Roberts, K. Classifying organic crystals via in-process image analysis and the use of monitoring charts to follow polymorphic and morphological changes. J. Process. Control. 2005, 15, 785–797. [Google Scholar] [CrossRef] [Scilit]
- Achanta, R.; Shaji, A.; Smith, K.; Lucchi, A.; Fua, P.; SüSstrunk, S. Slic superpixels compared to state-of-the-art superpixel methods. IEEE Trans. Pattern Anal. Mach. Intell. 2012, 34, 2274–2282. [Google Scholar] [CrossRef] [Scilit] [PubMed]
- Tomasi, C.; Manduchi, R. Bilateral filtering for gray and color images. In Proceedings of the Sixth International Conference on Computer Vision, Bombay, India, 7 January 1998; pp. 839–846. [Google Scholar]
- Gonzales, R.C.; Woods, R.E.; Eddins, S.L. Digital Image Processing Using Matlab; Pearson Prentice Hall: Upper Saddle River, NJ, USA, 2004. [Google Scholar]
- Gadelmawla, E. A vision system for surface roughness characterization using the gray level co-occurrence matrix. NDT E Int. 2004, 37, 577–588. [Google Scholar] [CrossRef] [Scilit]
- Skyum, S. A simple algorithm for computing the smallest enclosing circle. Inf. Process. Lett. 1991, 37, 121–125. [Google Scholar] [CrossRef] [Scilit]
- Huo, Y.; Guan, D. Size measurement and prediction for L-glutamic acid crystal growth during stirred crystallization based on imaging analysis. Math. Biosci. Eng. 2021, 18, 1864–1878. [Google Scholar] [CrossRef] [Scilit] [PubMed]
- Liu, T.; Huo, Y.; Ma, C.Y.; Wang, X.Z. Sparsity-based image monitoring of crystal size distribution during crystallization. J. Cryst. Growth 2017, 469, 160–167. [Google Scholar] [CrossRef] [Scilit]
- Winkler, S.; Pierre, V. Computing isotropic local contrast from oriented pyramid decompositions. In Proceedings of the International Conference on Image Processing, Kobe, Japan, 24–28 October 1999; pp. 420–424. [Google Scholar]










Publisher’s Note: MDPI stays neutral with regard to jurisdictional claims in published maps and institutional affiliations. |
© 2022 by the authors. Licensee MDPI, Basel, Switzerland. This article is an open access article distributed under the terms and conditions of the Creative Commons Attribution (CC BY) license (https://creativecommons.org/licenses/by/4.0/).