


Abstract
This study reports the synthesis and comprehensive characterization of a novel 5% cadmium-doped cerium oxide/reduced graphene oxide (5% Cd-CeO2/rGO) nanocomposite for the enhanced visible-light-driven photocatalytic degradation of methyl orange (MO). The nanocomposite was prepared using a simple co-precipitation method followed by thermal reduction, which integrates the excellent electron-transport properties of reduced graphene oxide (rGO) with the oxygen-vacancy-rich characteristics of Cd-doped CeO2, resulting in improved photocatalytic performance. The successful synthesis of the nanocomposite and the direct interaction between the rGO sheets and ultrafine CeO2 nanoparticles were verified through structural and morphological analyses using Fourier-transform infrared spectroscopy (FTIR), X-ray diffraction (XRD), X-ray photoelectron spectroscopy (XPS), Raman spectroscopy, Transmission Electron Microscopy (TEM), and Scanning Electron Microscopy (SEM). XPS results indicated an increase in the Ce3+ concentration and oxygen vacancy density after Cd doping and rGO incorporation, both of which play a crucial role in enhancing photocatalytic activity. Under visible-light irradiation, the 5% Cd-CeO2/rGO nanocomposite exhibited substantially higher photocatalytic activity and methyl orange (MO) degradation efficiency than pristine CeO2 and reduced graphene oxide (rGO). The improved photocatalytic performance demonstrates the beneficial role of combining metal-ion doping with conductive carbon supports to facilitate charge separation and electron transport in semiconductor photocatalysts. The developed nanocomposite also shows promising potential for the design of next-generation semiconductor-based materials for photocatalytic, energy conversion, and optoelectronic applications.
1. Introduction
The rapid urbanization and industrialization of the 21st century have led to unprecedented levels of water pollution, with synthetic organic dyes representing one of the most hazardous and persistent classes of aquatic contaminants. The paper, global textile, food processing and leather industries discharge approximately 700,000 tons of synthetic dyes annually into water bodies, with azo dyes constituting nearly 70% of this total [1,2,3,4]. These include methyl orange (MO) and an anionic azo dye, which is widely used as a colorant and pH indicator in a different industrial application because of N=N double bond chromophore. Meanwhile, aquatic ecosystems and human health are seriously threatened by its high chemical stability, refractory nature, and possible toxicity [5,6].
Among the various semiconductor photocatalysts, cerium oxide (CeO2) has attracted considerable attention because of its unique physicochemical properties, including its reversible Ce3+/Ce4+ redox couple, high chemical stability, excellent oxygen storage capacity, natural abundance, and low toxicity [7,8]. CeO2 crystallizes in a fluorite cubic structure with a band gap of approximately 3.2 eV, which restricts its intrinsic photocatalytic activity primarily to the ultraviolet region [9,10,11]. The photocatalytic performance of CeO2 is strongly influenced by the concentration of oxygen vacancies, as these defects promote charge carrier separation, facilitate oxygen activation, and provide active sites for the adsorption and degradation of pollutants [12].
The rapid recombination of photogenerated electron–hole pairs remains a major limitation to the photocatalytic performance and quantum efficiency of CeO2-based photocatalysts [13,14,15,16]. Among the different approaches employed to improve the photocatalytic properties of CeO2, metal-ion doping has emerged as an effective strategy for tailoring its electronic structure, optical properties, and defect chemistry. Transition metal ions, including Fe, Cu, Ag, and Cd, have been successfully incorporated into the CeO2 lattice, leading to an increased concentration of oxygen vacancies, improved charge carrier separation, and enhanced visible-light absorption [17,18,19]. Cadmium is considered a suitable dopant because the ionic radius of Cd2+ (0.95 Å) is comparable to that of Ce4+ (0.97 Å), allowing Cd2+ ions to substitute for Ce4+ with minimal lattice distortion. In addition, the substitution of Ce4+ by Cd2+ requires the formation of oxygen vacancies to maintain charge neutrality, thereby modifying the defect structure and improving the functional properties of the material [20,21,22,23]. Previous studies have further shown that Cd-doped CeO2 exhibits a red-shift in the absorption edge, higher Ce3+ concentrations, and improved photocatalytic activity for dye degradation compared with pristine CeO2 [24,25,26,27].
Combining metal-ion doping with rGO is an effective way to enhance the photocatalytic performance of semiconductor materials. In the CeO2/rGO nanocomposite, CeO2 nanoparticles are in close contact with rGO sheets, allowing efficient transfer of charge carriers. When exposed to light, electrons excited in the conduction band of CeO2 are transferred to the rGO sheets. This rapid electron transfer suppresses electron–hole recombination and enhances charge separation [28,29,30]. In addition, rGO serves as a high-surface-area support that minimizes the agglomeration of CeO2 nanoparticles, increases the availability of active sites, and enhances the adsorption of aromatic dye molecules through π–π interactions. The improved charge transfer enables CeO2/rGO nanocomposites to degrade organic dyes, including methylene blue, methyl orange, and rhodamine B, more efficiently than pristine CeO2 [31]. The photocatalytic degradation mechanism in CeO2-based systems has been extensively investigated through radical trapping and product identification studies. Under light irradiation, photogenerated holes in the valence band oxidize water molecules or hydroxide ions to generate hydroxyl radicals (•OH), whereas electrons in the conduction band reduce adsorbed molecular oxygen to form superoxide radicals (•O2−), both of which play a key role in the degradation of organic contaminants [32,33,34,35].
The present study addresses the gaps by reporting the synthesis and photocatalytic evaluation of a novel 5% Cd-doped CeO2/rGO nanocomposite and comprehensive characterization for visible-light-driven methyl orange degradation. The specific objectives are: (1) to create Cd-doped CeO2/rGO nanocomposites using a simple co-precipitation technique and use FTIR, XRD, XPS, Raman spectroscopy, TEM and SEM, to describe in detail their structural, morphological, and electrical characteristics; (2) to quantify the effects of Cd-doped CeO2 and rGO incorporation on oxygen vacancy concentration, Ce3+/Ce4+ ratio, and optical properties; (3) to investigate the degradation kinetics and elucidate the photocatalytic mechanism, including charge transfer pathways and reactive species involvement; (4) to evaluate the nanocomposite photocatalytic performance for MO degradation under visible-light irradiation and compare it with pristine CeO2. The findings of this work contribute to the understanding of multifunctional photocatalyst design and underscore the promise of Cd-doped CeO2/rGO nanocomposites as advanced materials for photocatalytic, optoelectronic, and energy conversion technologies.
2. Results
2.1. XRD Analysis
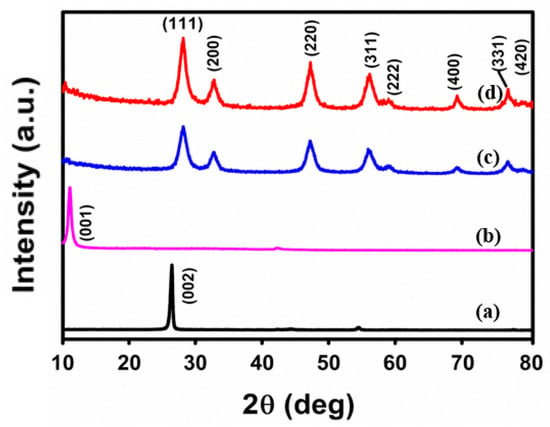
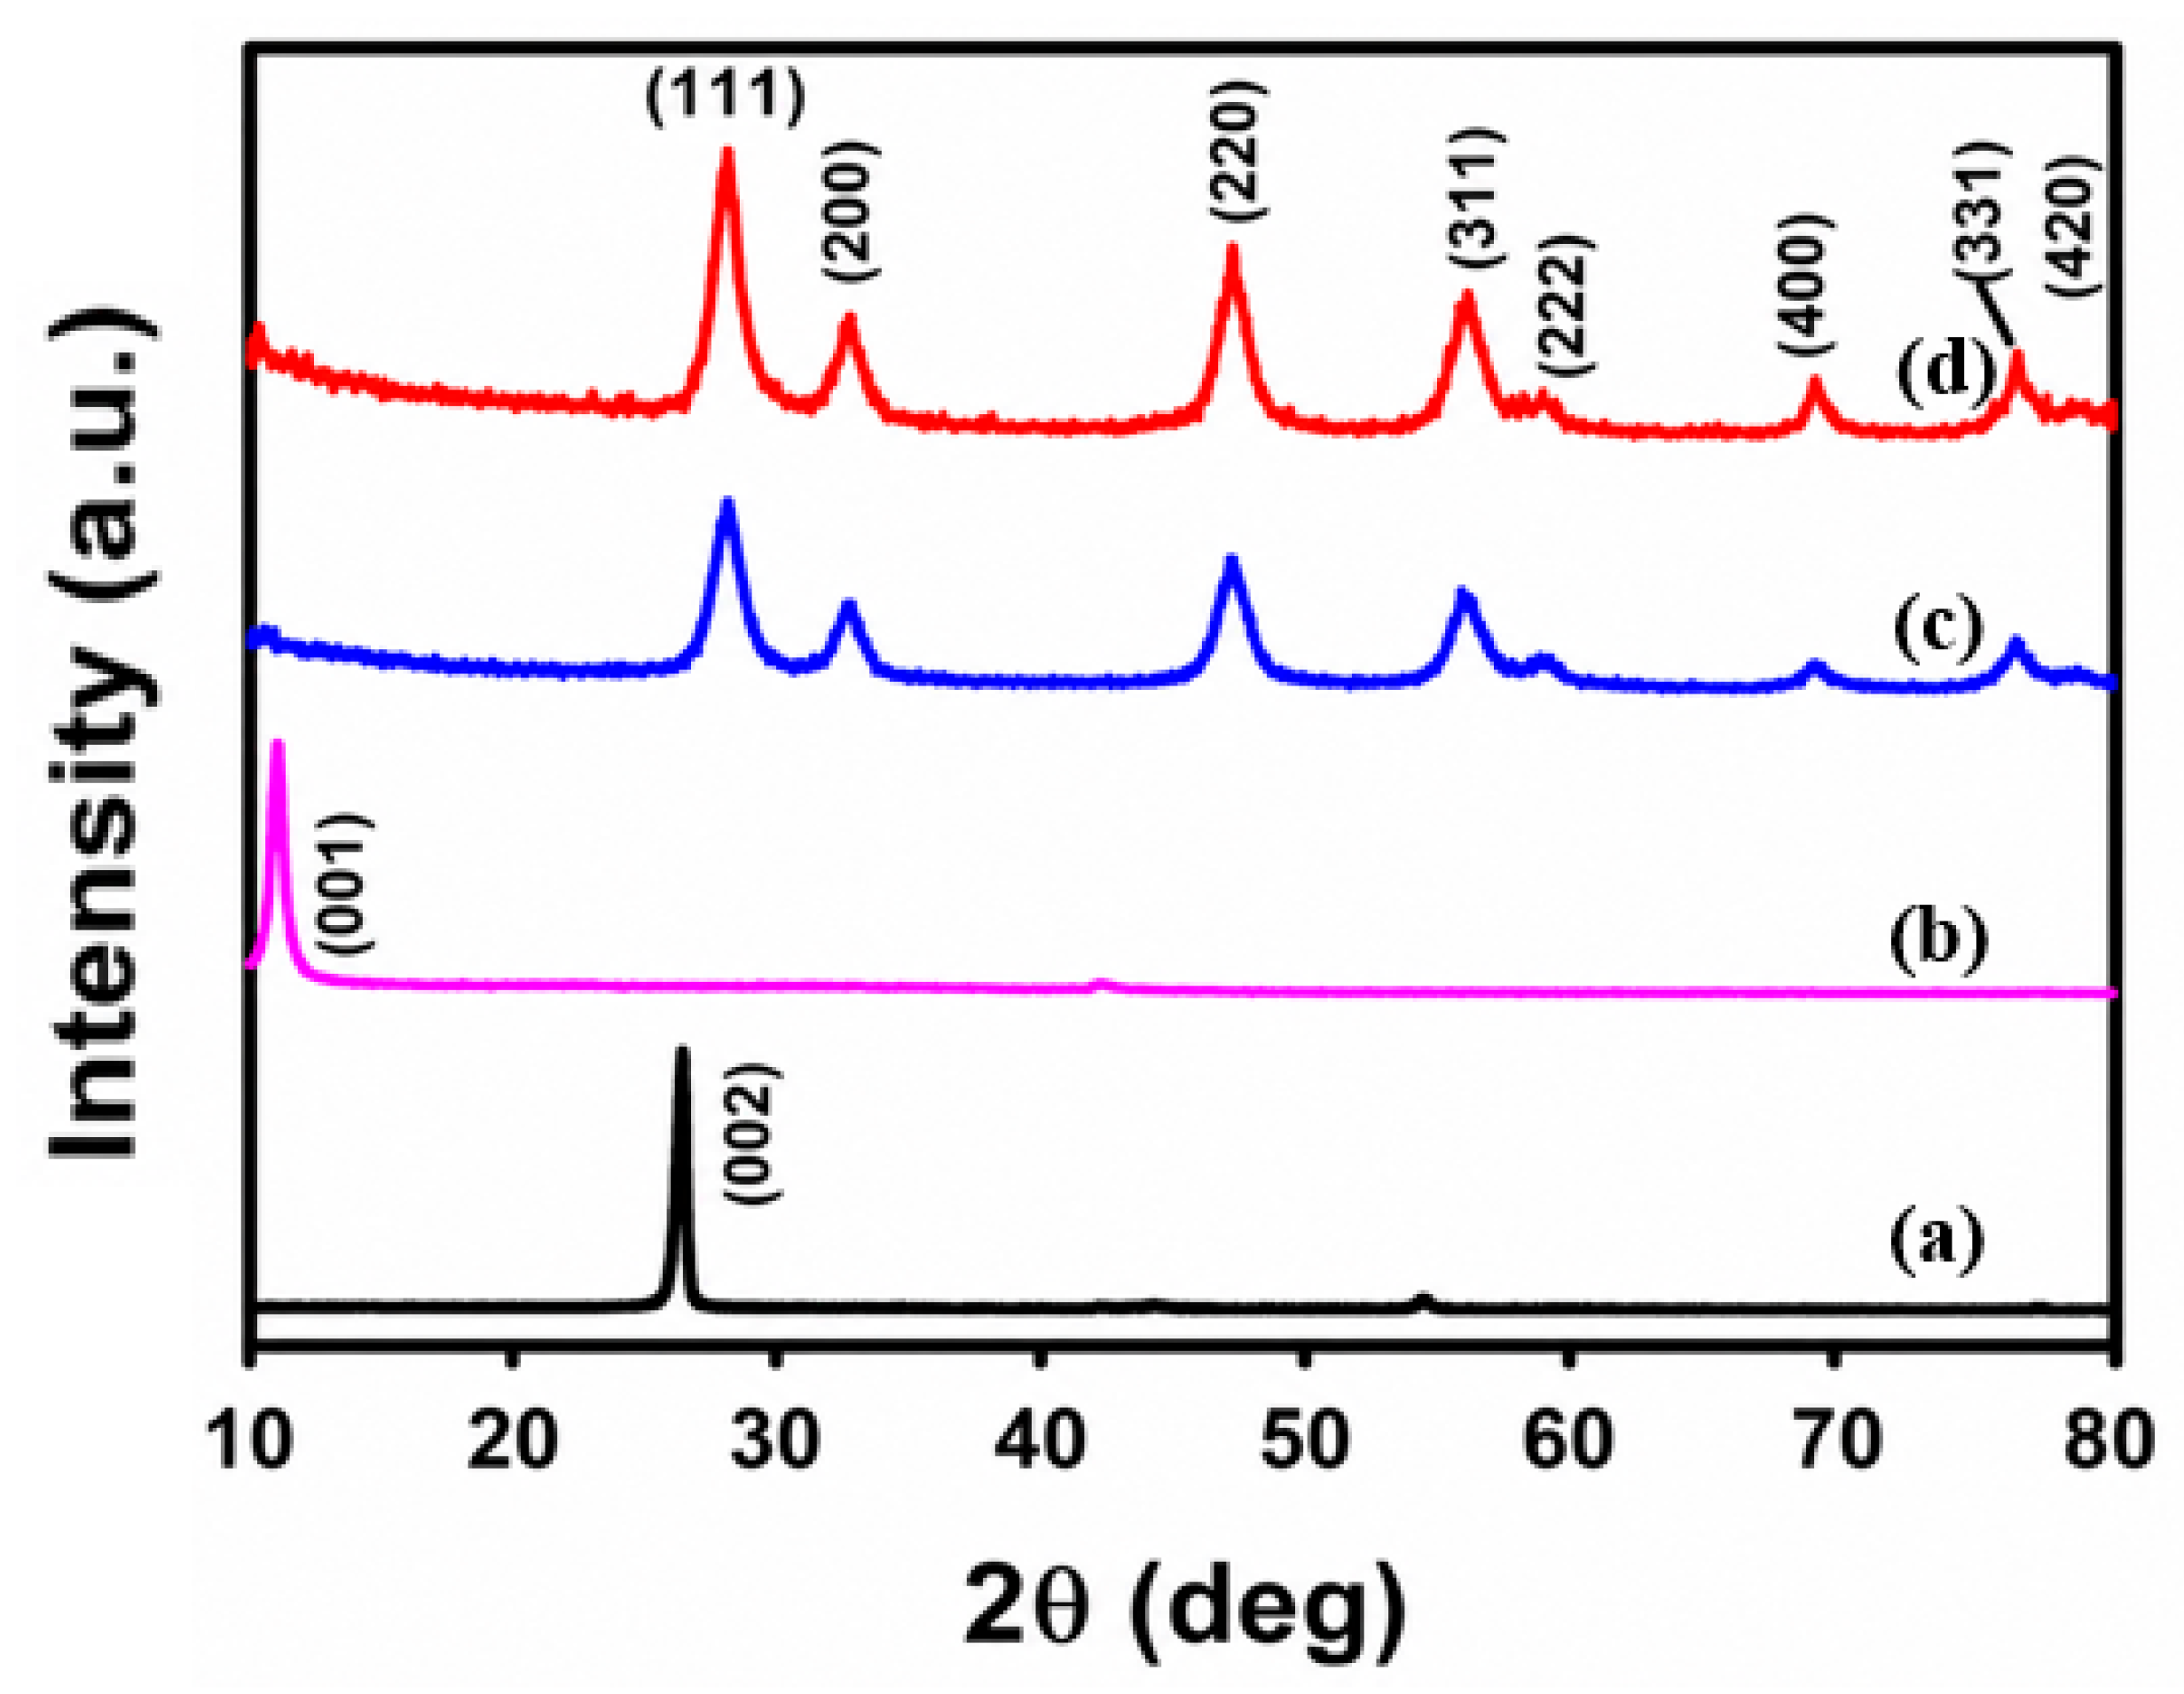
The crystalline structure, phase purity, and structural alterations brought about by Cd doping and rGO inclusion were examined using XRD analysis. The XRD patterns of (a) graphite powder, (b) graphene oxide (GO), (c) pure CeO2 nanoparticles, and (d) a 5% Cd-doped CeO2/rGO nanocomposite are shown in Figure 1. The XRD pattern of graphite powder shows a strong diffraction and prominent peak at 2θ = 26.5°, which corresponds to the (002) plane with an interlayer spacing of about 0.34 nm and is indicative of highly structured graphitic carbon (Figure 1a). Because of oxygen-containing functional groups’ intercalation between graphene layers, this peak moves to a lower angle at about 2θ = 10.8° upon oxidation to GO (Figure 1b), indicating an enlarged interlayer gap of ~0.8–0.9 nm [36].
Figure 1.
XRD patterns of (a) graphite powder, (b) GO, (c) CeO2 nanoparticles, and (d) 5% Cd-doped CeO2/rGO nanocomposite.
The pristine CeO2 nanoparticles’ XRD pattern (Figure 1c) shows distinct diffraction peaks at 2θ values of 28.5°, 33.1°, 47.5°, 56.3°, 59.1°, 69.4°, 76.7°, and 79.1°. These peaks correspond to the (111), (200), (220), (311), (222), (400), (331), and (420) crystallographic planes of CeO2 (JCPDS card No. 34-0394, space group Fm3m). The intense and sharp peaks indicate high crystallinity and good phase purity of the synthesized CeO2 nanoparticles. No additional peaks corresponding to impurity phases or cerium hydroxide are observed, confirming complete conversion to the oxide phase during calcination.
The average crystallite size calculated from the (111) diffraction peak using the Scherrer equation was approximately 12 nm. As shown in Figure 1d, the XRD pattern of the 5% Cd-doped CeO2/rGO nanocomposite retains all the characteristic diffraction peaks of cubic fluorite CeO2, indicating that the crystal structure of CeO2 remains unchanged after Cd doping and rGO incorporation. No diffraction peaks corresponding to CdO or other cadmium-containing phases were observed, suggesting that Cd2+ ions were successfully incorporated into the CeO2 lattice instead of forming separate phases. This can be attributed to the similar ionic radii of Ce4+ (0.97 Å) and Cd2+ (0.95 Å), which allow Cd2+ to substitute for Ce4+ with only minor lattice distortion. A slight shift of the diffraction peaks toward lower 2θ values indicates a small expansion of the CeO2 lattice [37]. In addition, the diffraction peaks of the nanocomposite are slightly broader than those of pristine CeO2, corresponding to a reduced crystallite size of about 9 nm. The presence of rGO likely limits particle growth and reduces agglomeration during synthesis. The characteristic GO peak at 2θ = 10.8° and the graphite peak at 2θ = 26.5° are absent, confirming the successful reduction of GO to rGO. The absence of a distinct rGO peak also suggests that the rGO sheets are highly exfoliated or poorly ordered, which is commonly observed in rGO-based nanocomposites with low carbon content. Overall, the XRD results confirm the successful synthesis of the Cd-doped CeO2/rGO nanocomposite, with Cd2+ ions incorporated into the CeO2 lattice and rGO acting as a conductive support that improves particle dispersion and controls crystallite growth.
2.2. FTIR Analysis
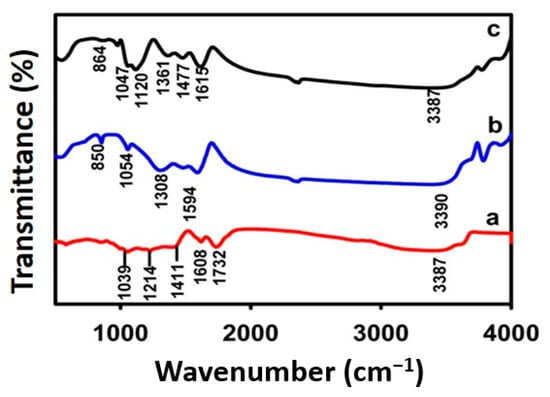
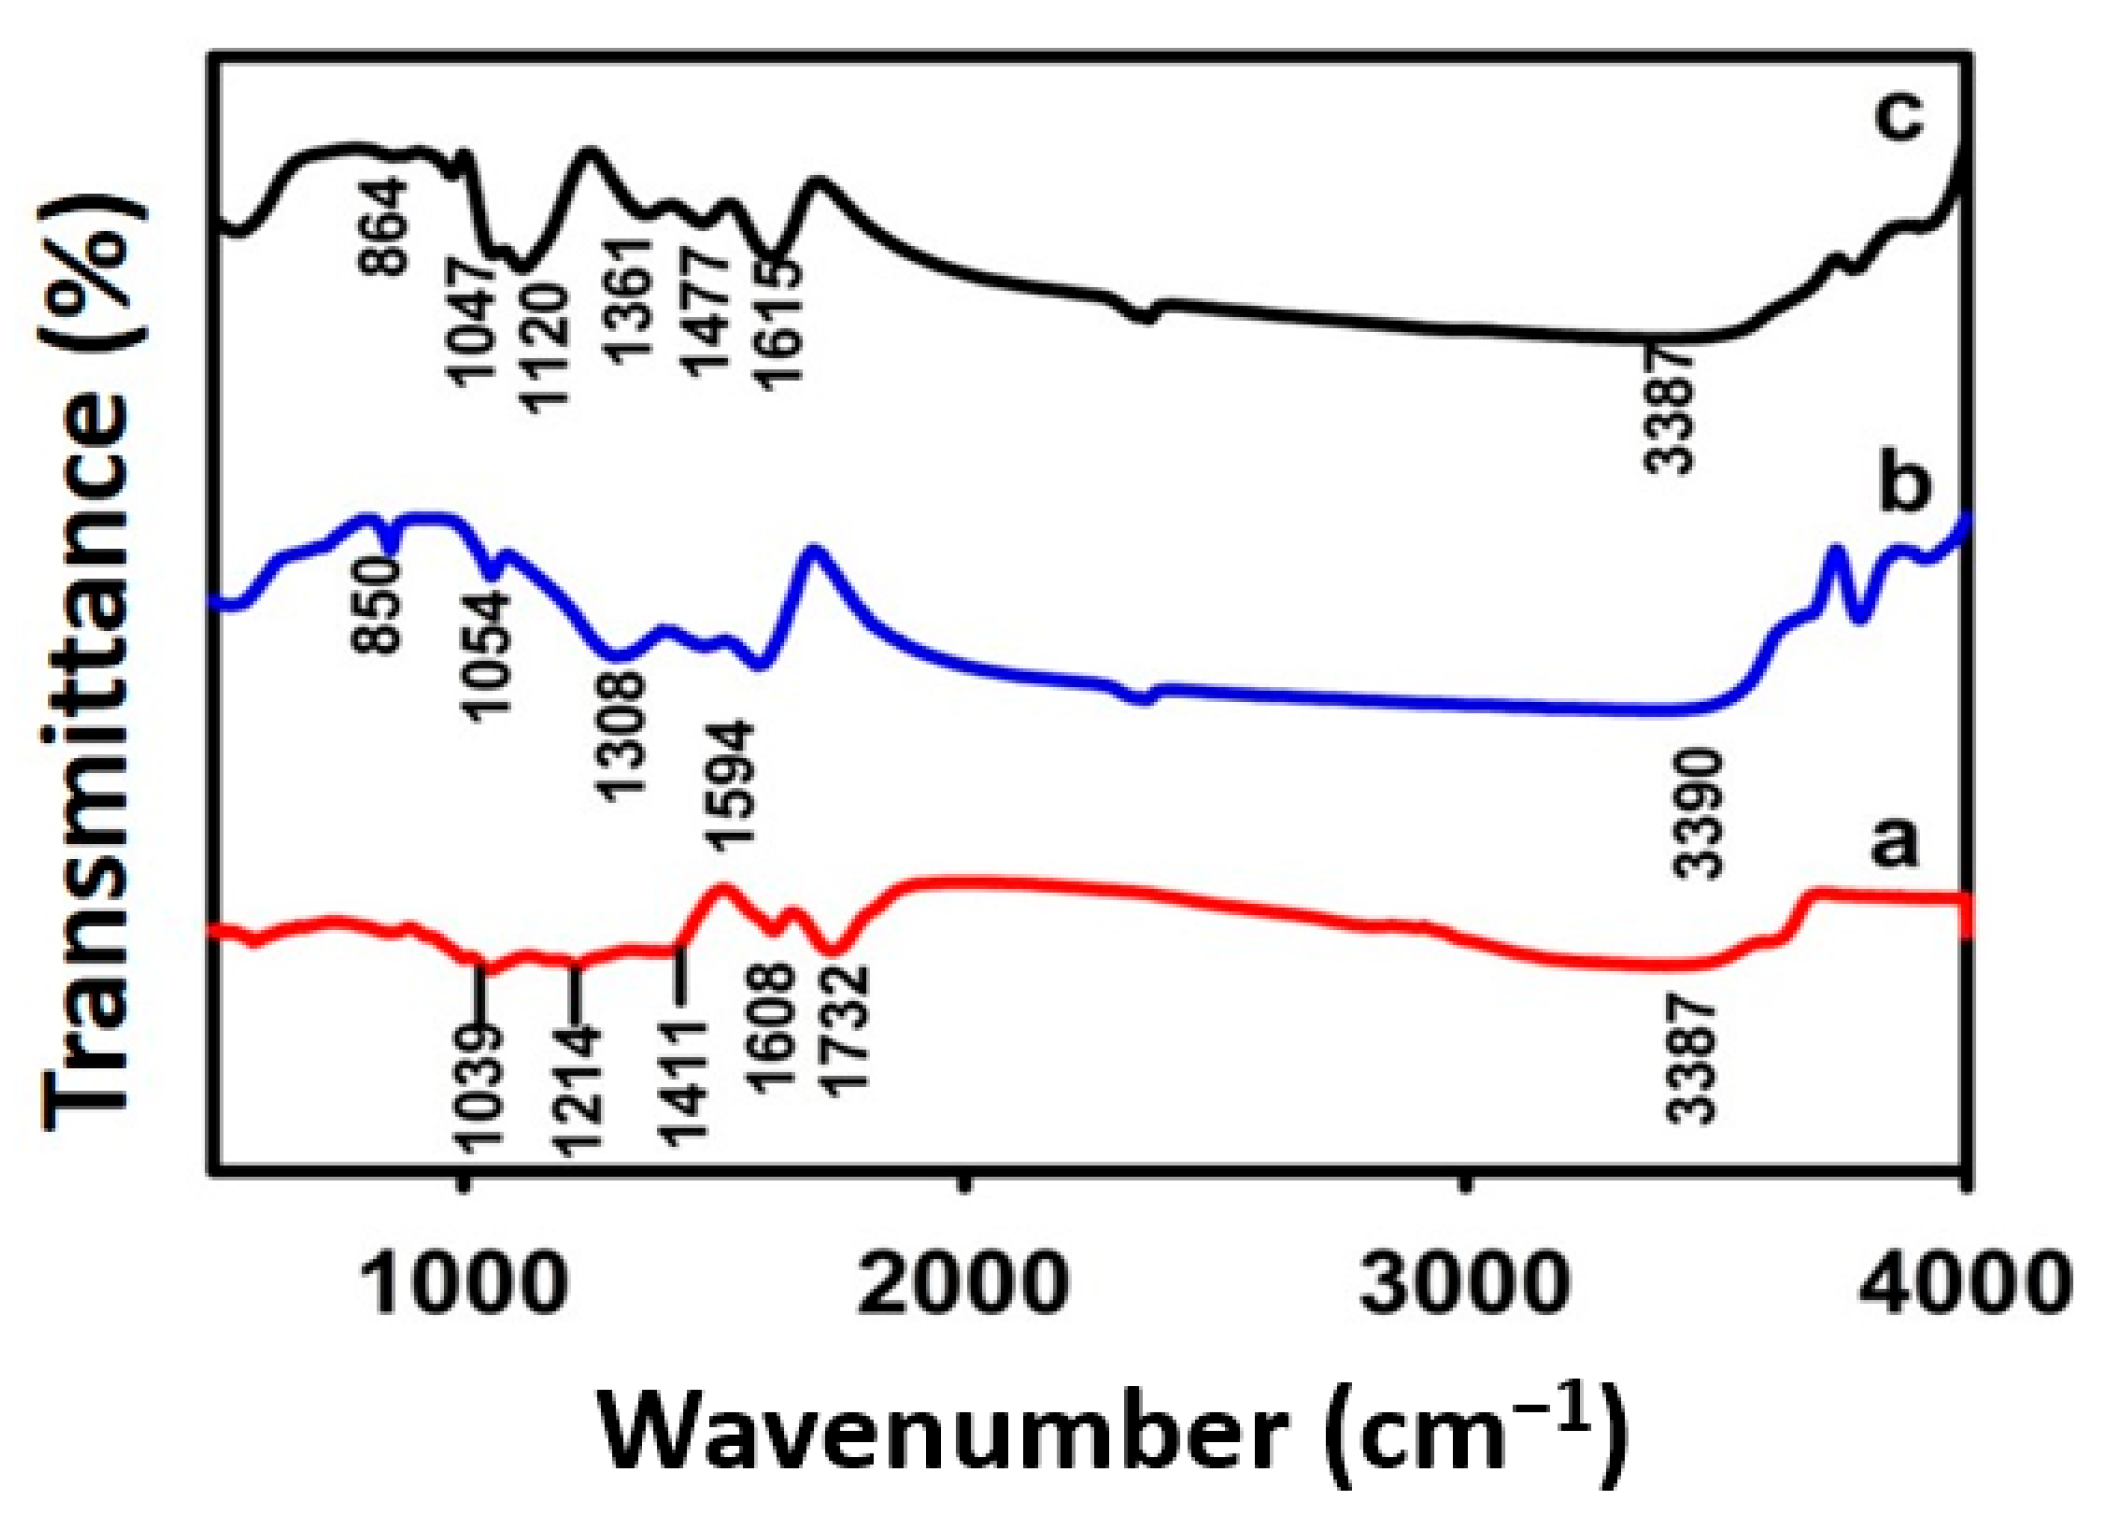
The FTIR technique is used to identify the functional groups and chemical bonding in the synthesized materials and formation of interfacial interactions and to confirm the GO reduction in the nanocomposite. Numerous different absorption bands that represent different oxygen-containing functional groups generated during the oxidation process can be seen in the GO FTIR spectrum (Figure 2a). The adsorbed water molecules and hydroxyl groups of O–H stretching vibrations are responsible for the wide absorption band that is centered at about 3400 cm−1. The carboxyl and carbonyl groups of C=O stretching vibrations at the margins and basal plane of GO sheets are represented by the peak at about 1730 cm−1. The absorption band at around 1620 cm−1 occurs due to the C=C stretching vibrations of the other sp2 hybridized carbon domains in the graphene structure. The peaks observed at approximately 1400 cm−1 and 1050 cm−1 are assigned to the C–O stretching vibration and the C–OH deformation of epoxy and alkoxy groups, respectively. The presence of these oxygen-containing functional groups confirms the successful oxidation of graphite to graphene oxide (GO) and provides active sites for interaction with metal oxide nanoparticles [38,39]. The FTIR spectrum of the 5% Cd-doped CeO2/rGO nanocomposite (Figure 2c) shows clear changes, indicating the successful reduction of GO and the formation of the nanocomposite. A broad absorption band near 3400 cm−1 and a weak peak around 1630 cm−1 are attributed to the stretching and bending vibrations of O–H and H–O–H groups from water molecules adsorbed on the CeO2 surface, which are commonly observed in high-surface-area metal oxide nanoparticles [40].
Figure 2.
FTIR spectra of (a) GO, (b) CeO2 nanoparticles, and (c) 5% Cd-doped CeO2/rGO nanocomposite.
Additionally, the nanocomposite spectrum shows a significant decrease in the intensities of GO-specific oxygen-containing functional group peaks. During the thermal reduction process, at 1730 cm−1, the C=O stretching peak is either absent or greatly diminished, indicating carbonyl and carboxyl groups’ effective removal. The C–O stretching peak at 1050 cm−1 also shows reduced intensity, suggesting alkoxy and epoxy groups’ partial removal. However, C=C stretching is still observable, corresponding to a weak residual peak around 1620 cm−1, confirming the graphene carbon framework’s presence in the composite. Since it is difficult to completely remove all oxygen functions even after thermal reduction, the persistence of a wide band at about 3400 cm−1 can be assigned to residual hydroxyl groups on rGO and adsorbed water. Crucially, some oxygen-containing groups may still be present at the rGO surface, which could promote interfacial interaction with CeO2 nanoparticles through Ce–O–C connections, based on the decrease in oxygen functional group intensities without total elimination. Thus, the FTIR data confirm that GO was effectively reduced to rGO and that a chemically integrated CeO2/rGO nanocomposite with interfacial contacting surfaces was formed, which ought to enhance charge separation and photocatalytic activity.
2.3. Raman Spectroscopy Analysis
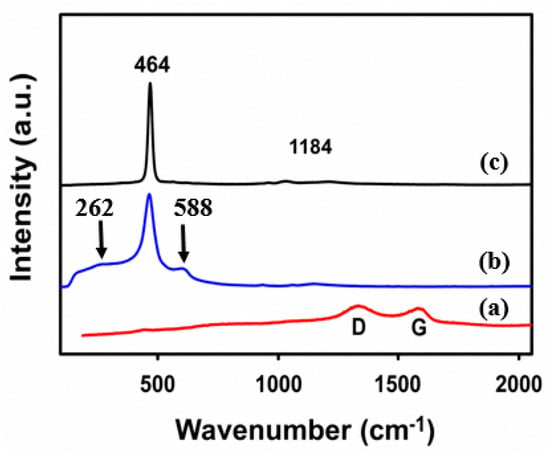
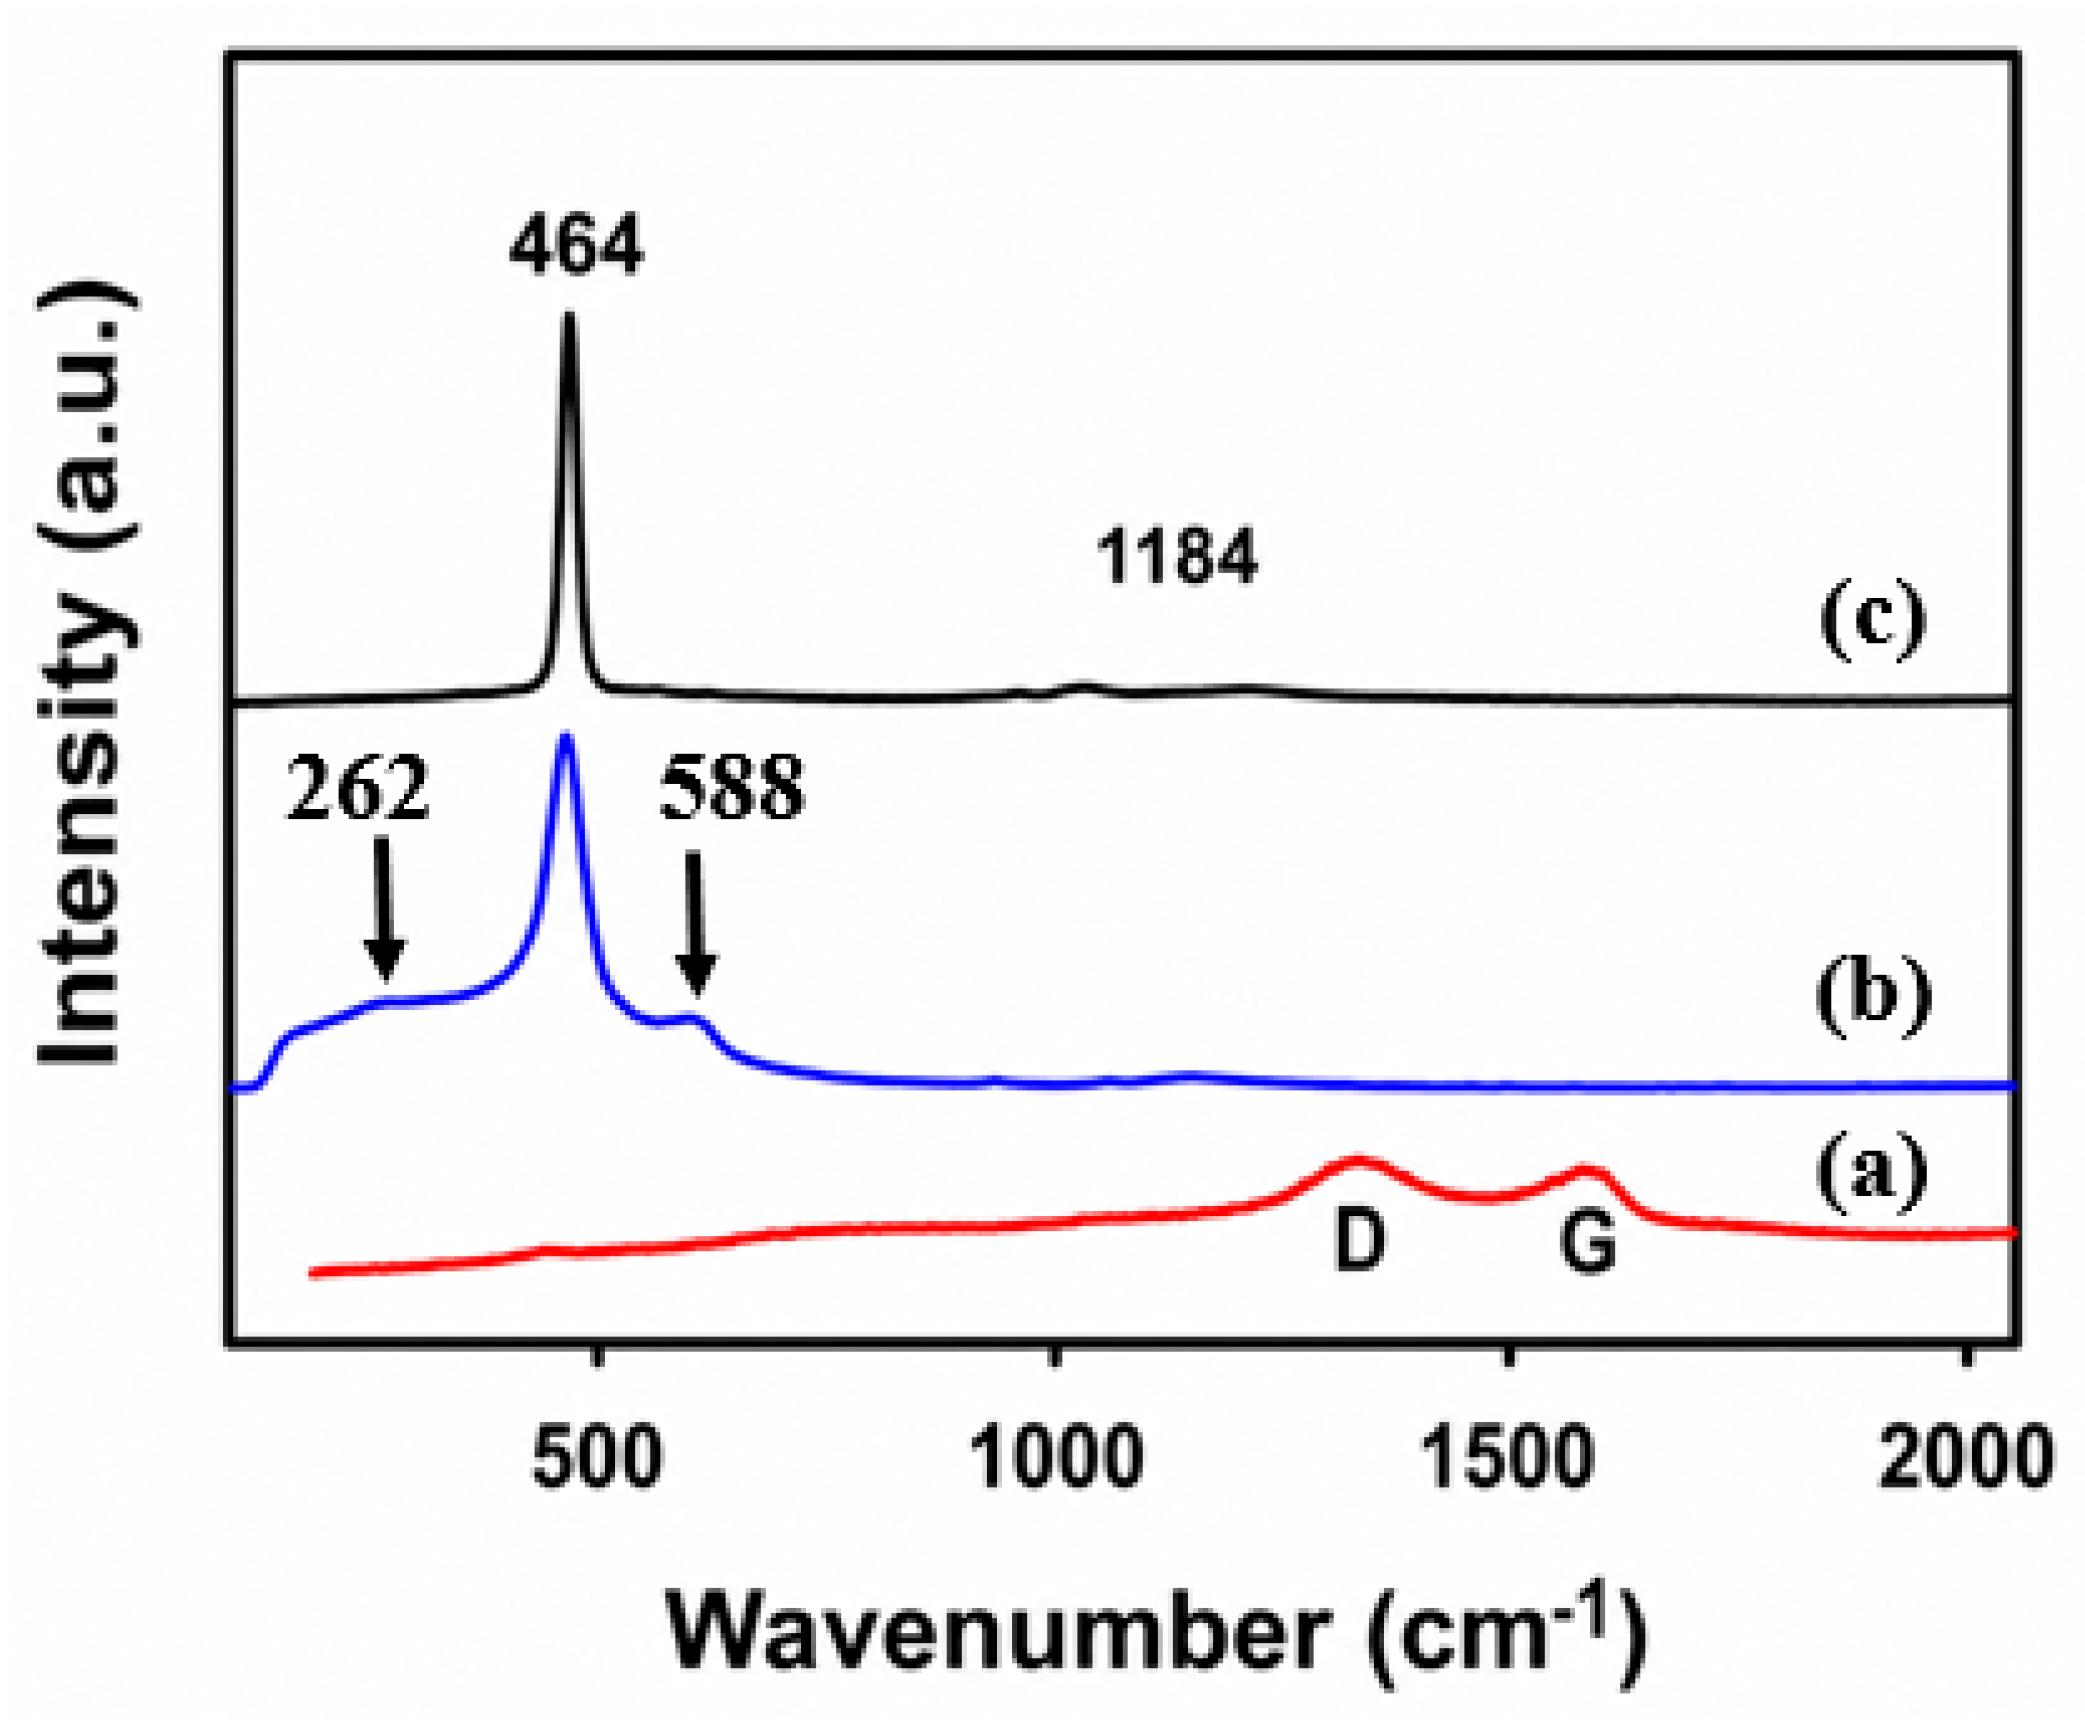
The G band (graphitic band) at about 1590 cm−1 and D band (disorder band) at around 1350 cm−1 are two significant bands that are characteristic of carbon compounds shown in the Raman spectrum of GO (Figure 3a). The strong, sharp peak in the Raman spectra of pure CeO2 nanoparticles (Figure 3b) at around 464 cm−1 occurs due to the F2g vibrational mode of the cubic fluorite CeO2 structure. Furthermore, defect-induced D modes and second-order transverse acoustic (2TA), which are linked to oxygen vacancies and structural defects in CeO2, are responsible for weak peaks or corners that may be seen at 262 cm−1 and 588 cm−1, respectively. For nanocrystalline CeO2 with high surface-to-volume ratios, several defect-related characteristics are common.
Figure 3.
Raman spectra of (a) GO, (b) CeO2 nanoparticles, and (c) 5% Cd-doped CeO2/rGO nanocomposite. The inset shows the magnified Raman spectra of the nanocomposite in the range from 1000 to 1500 cm−1.
The Raman spectrum of the 5% Cd-doped CeO2/rGO nanocomposite (Figure 3c) contains characteristic peaks of both CeO2 and rGO, confirming the successful formation of the nanocomposite. The F2g Raman peak of CeO2 appears at around 465 cm−1 but is slightly broader and less intense than that of pristine CeO2. This peak broadening can be attributed to several factors, including the increased structural disorder caused by Cd doping and the formation of oxygen vacancies, interfacial strain between CeO2 and rGO, and the smaller crystallite size resulting from the presence of rGO, which restricts particle growth. The reduced crystallite size also leads to phonon confinement, contributing to the broader Raman peak [41]. Previous studies have also reported a slight shift of the F2g peak toward lower wavenumbers after metal-ion doping. This is explained by lattice expansion and the weakening of Ce–O bonds as a result of oxygen vacancies’ development.
In the higher wavenumber region, the Raman spectrum of the nanocomposite shows the characteristic D and G bands of carbon at approximately 1350 cm−1 and 1590 cm−1, confirming the presence of rGO in the composite. The calculated ID/IG ratio of the nanocomposite is about 1.05–1.15, which is higher than that of the original GO (0.95–1.0). The increase in the ID/IG ratio indicates the formation of additional defects during the preparation of the nanocomposite. During thermal reduction, oxygen-containing functional groups are removed from GO, and the sp2 carbon network is partially restored. At the same time, new defects and smaller sp2 domains are formed, resulting in a higher defect density. The attachment of CeO2 nanoparticles to the rGO sheets and the formation of Ce–O–C interfacial bonds further increase the structural disorder by disrupting the continuous π-conjugated carbon network. Although the nanocomposite contains more defects, these defects are beneficial because they improve charge transfer between CeO2 and rGO and provide additional active sites for the adsorption of pollutant molecules, leading to enhanced photocatalytic performance.
2.4. XPS Analysis
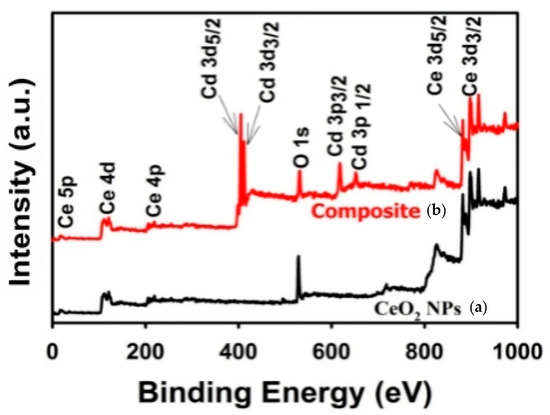
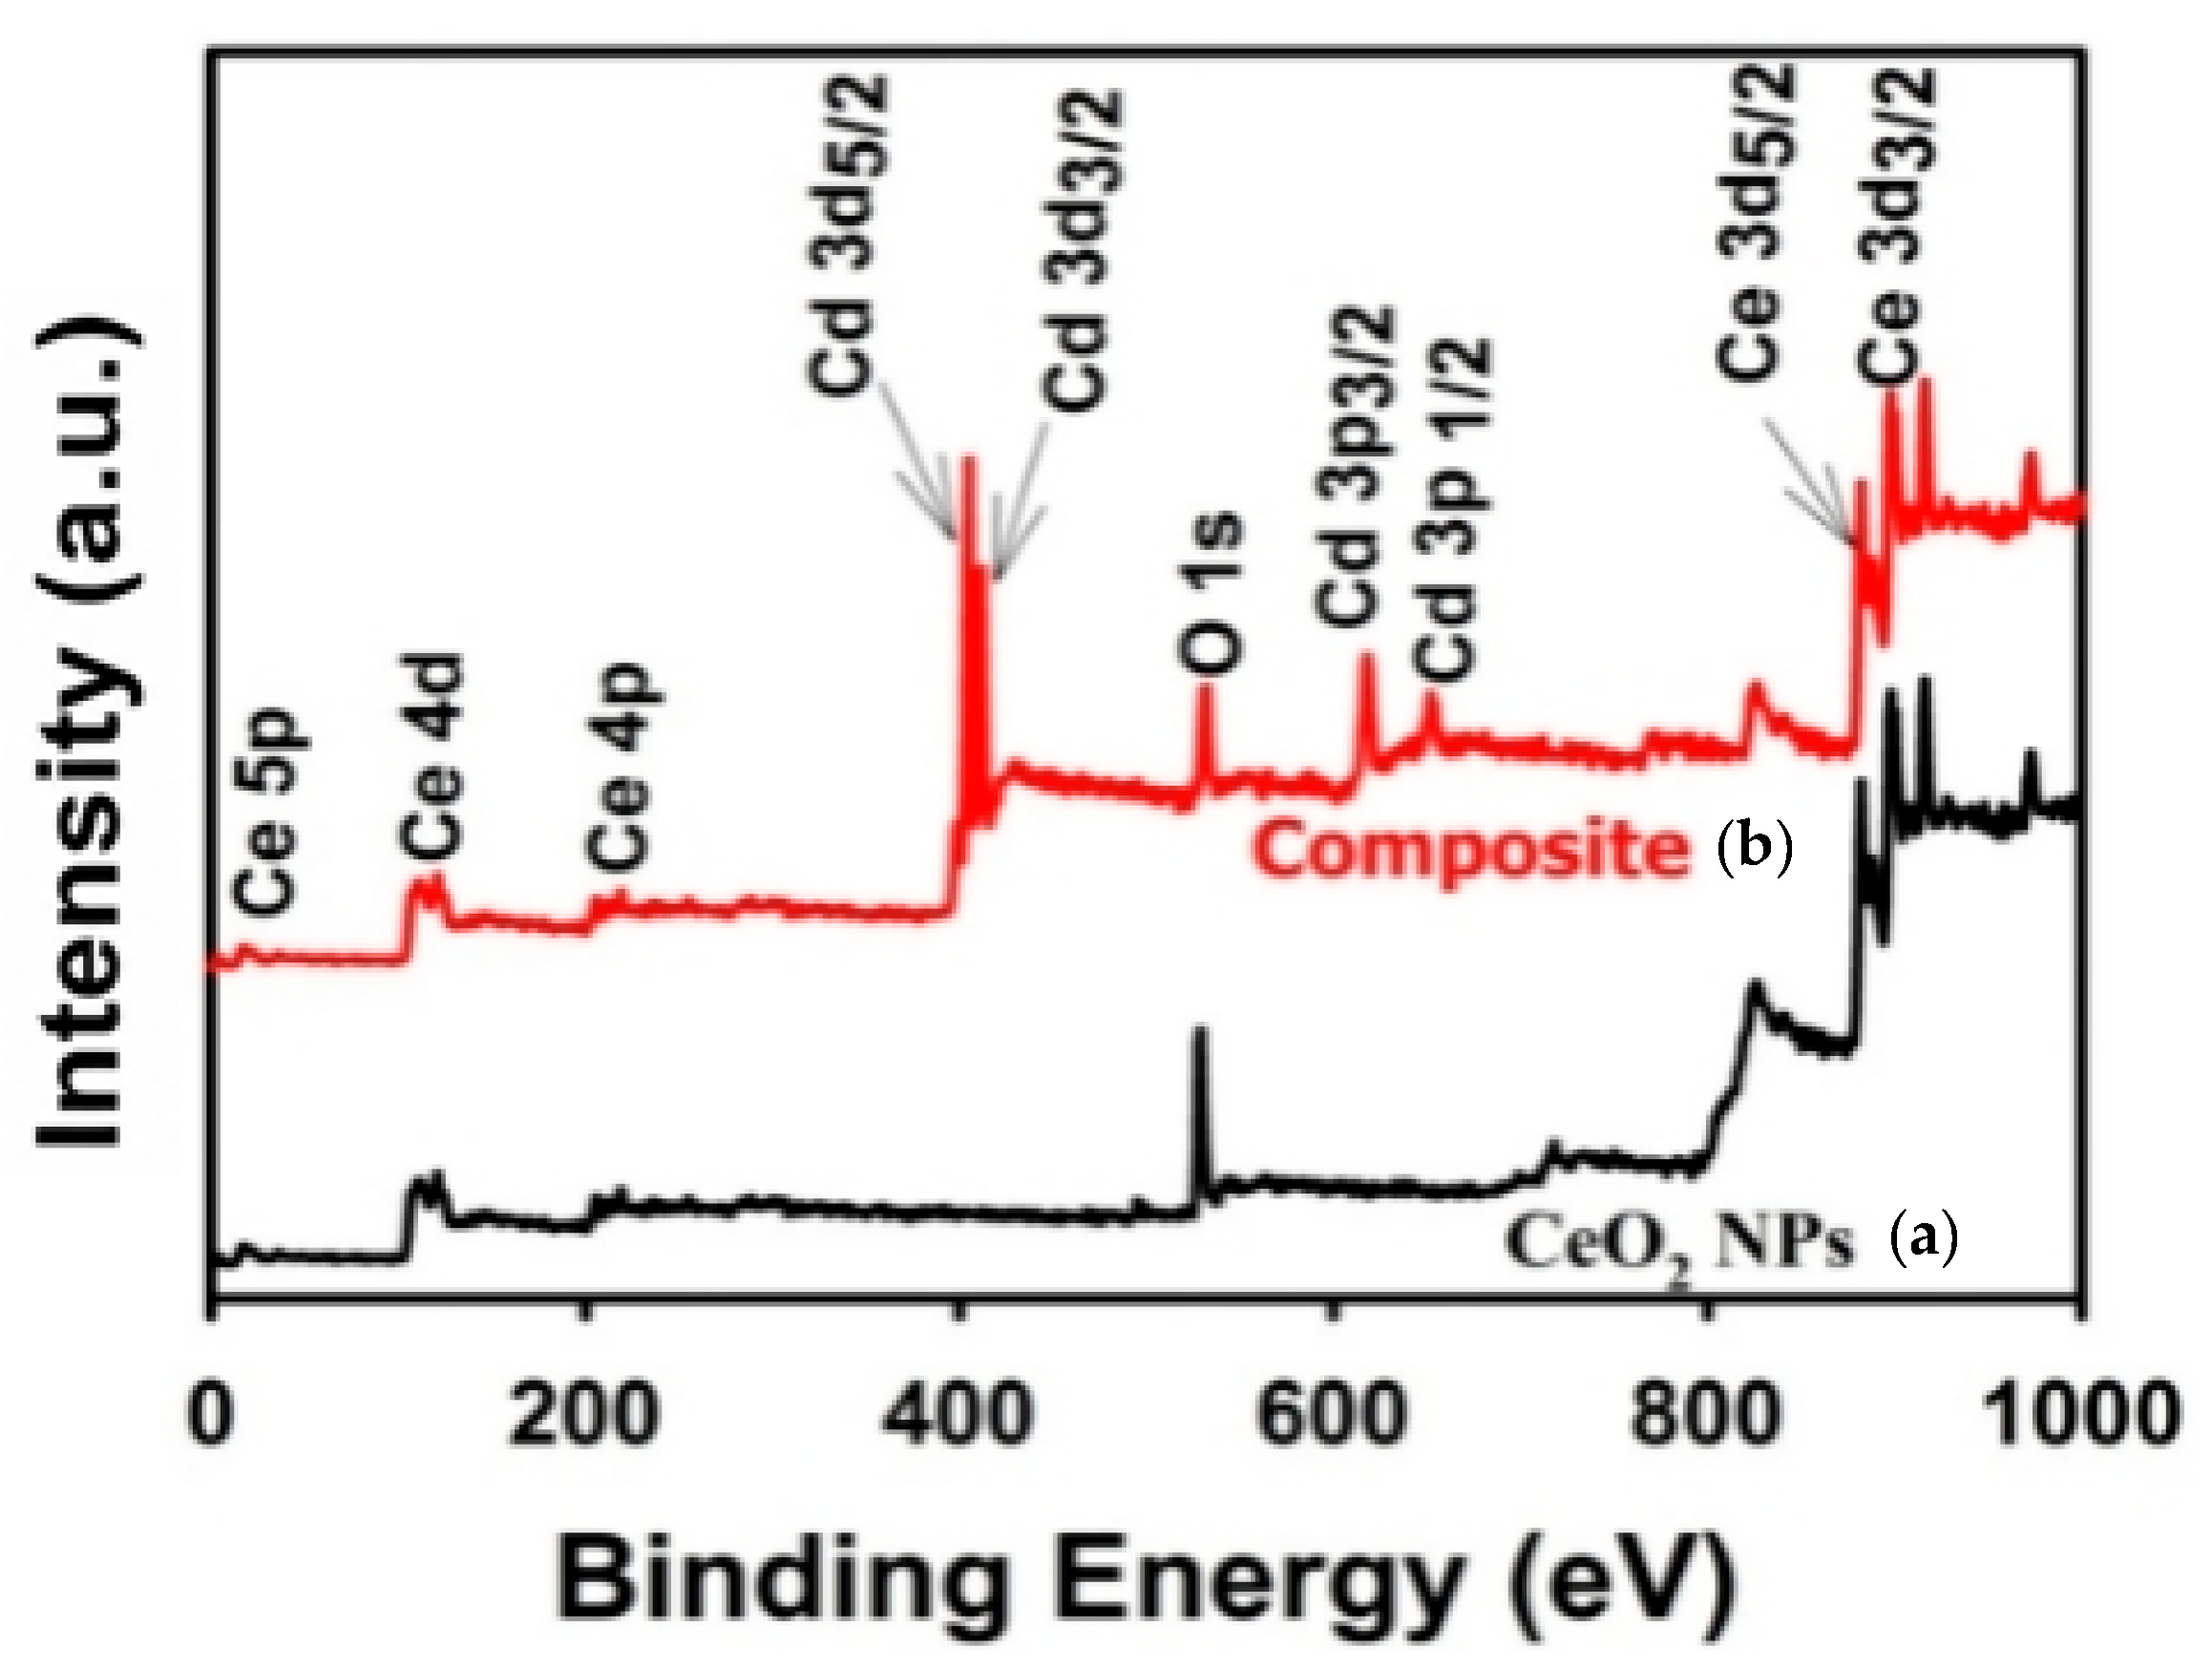
The 5% Cd-doped CeO2/rGO nanocomposite and the pure CeO2 nanoparticles’ XPS spectra are shown in Figure 4. The sample elemental composition is confirmed by the XPS survey spectrum of pristine CeO2 (Figure 4a), which shows distinctive peaks corresponding to O 1s, Ce 3d, and C 1s. The survey spectrum of the 5% Cd-doped CeO2/rGO nanocomposite (Figure 4b) exhibits additional peaks corresponding to Cd 3d, along with an enhanced C 1s signal due to the presence of rGO, confirming successful incorporation of both Cd and carbon components in the nanocomposite. The synthesized materials’ high purity is indicated by the lack of additional impurity peaks.
Figure 4.
(a) CeO2 nanoparticles and (b) 5% Cd-doped CeO2/rGO nanocomposite XPS survey spectrum.
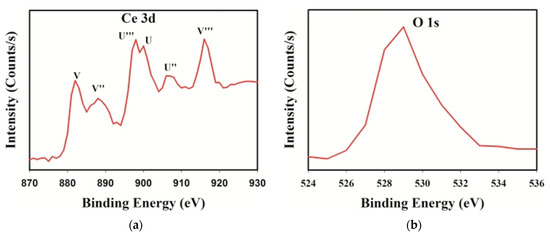
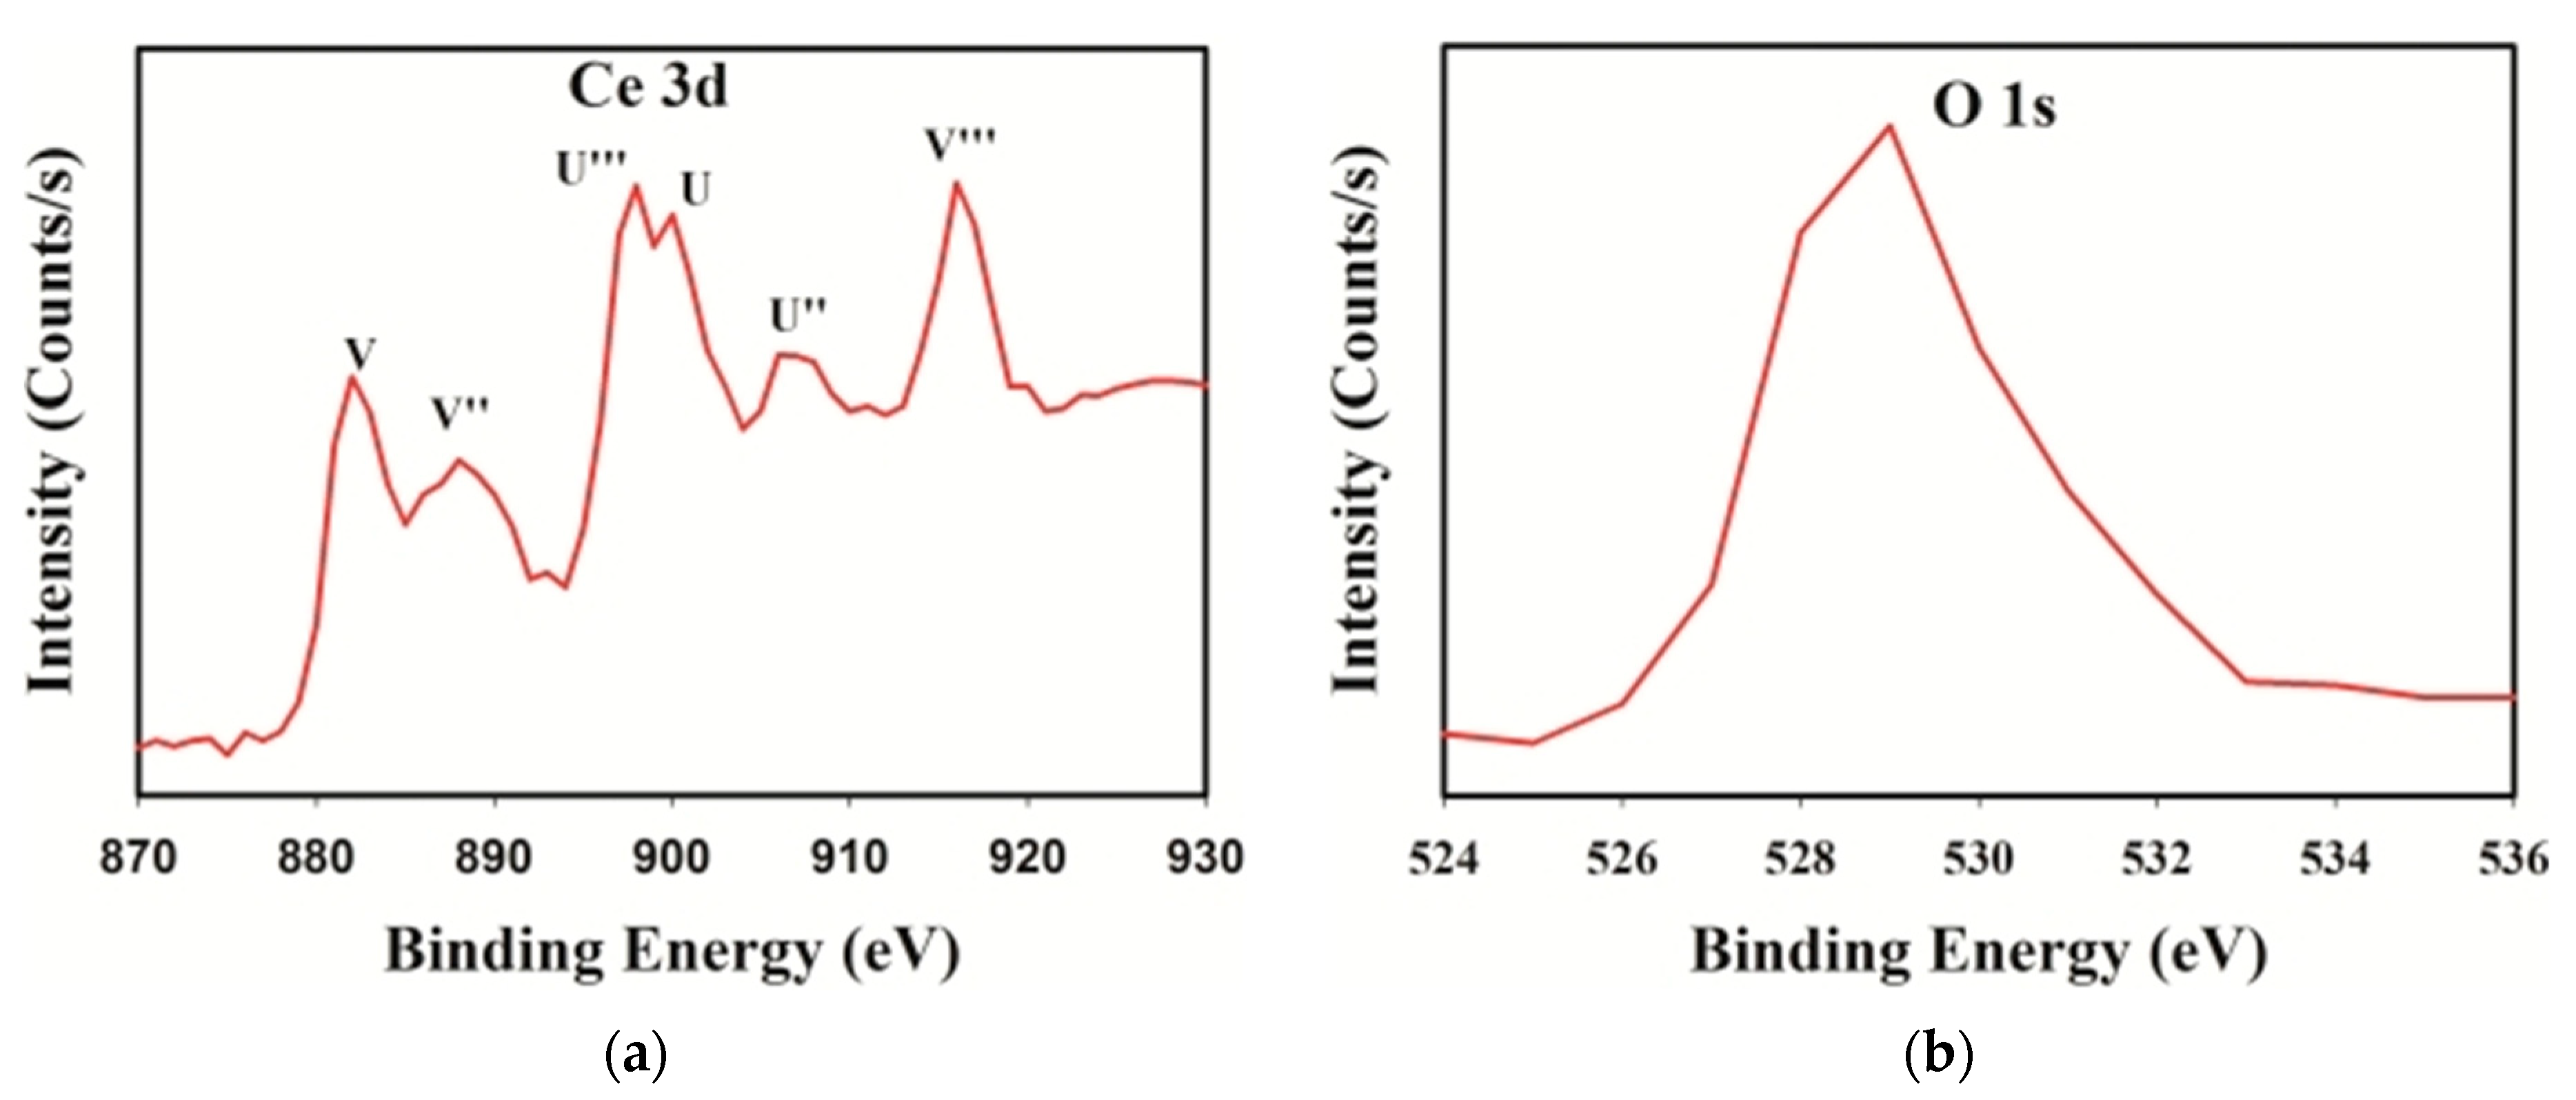
Single elements’ high-resolution XPS spectra offer extensive data regarding bonding sites and chemical changes. The (a) Ce 3d and (b) O 1s areas for pure CeO2 nanoparticles’ high-resolution XPS spectra are shown in Figure 5. The Ce 3d XPS spectrum (Figure 5a) is complex due to spin–orbit coupling and multiple final-state effects, resulting in a series of peaks that can be identified as Ce4+ and Ce3+ species [42]. The two multiplets of the Ce 3d spectrum correspond to the Ce 3d5/2 (lower binding energy, labeled as v) and Ce 3d3/2 (higher binding energy, labeled as u) spin–orbit components. For Ce3+, four characteristic peaks are observed: v0 (880.5 eV), v′ (885.0 eV) and u0 (898.8 eV), and u′ (903.5 eV). For Ce4+, six characteristic peaks are typically observed: v (882.7 eV), v″ (888.8 eV), and v‴ (898.3 eV) and u (901.0 eV), u″ (907.4 eV), and u‴ (916.7 eV). The Ce4+ and Ce3+ peaks’ presence in the spectrum confirms the mixed valence nature of CeO2, with Ce3+ species arising from oxygen vacancies and surface defects.
Figure 5.
XPS spectrum of (a) Ce 3d and (b) O 1s of CeO2 nanoparticles.
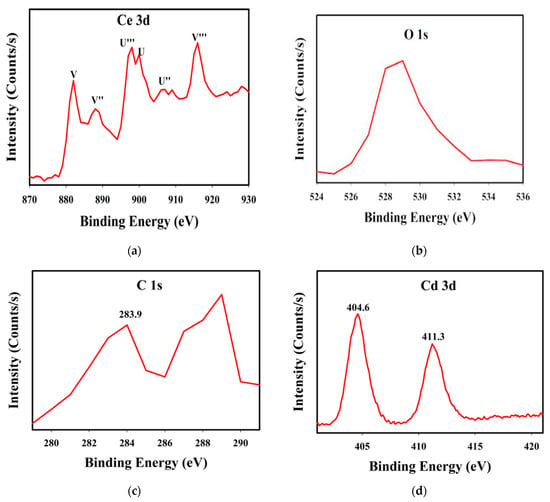
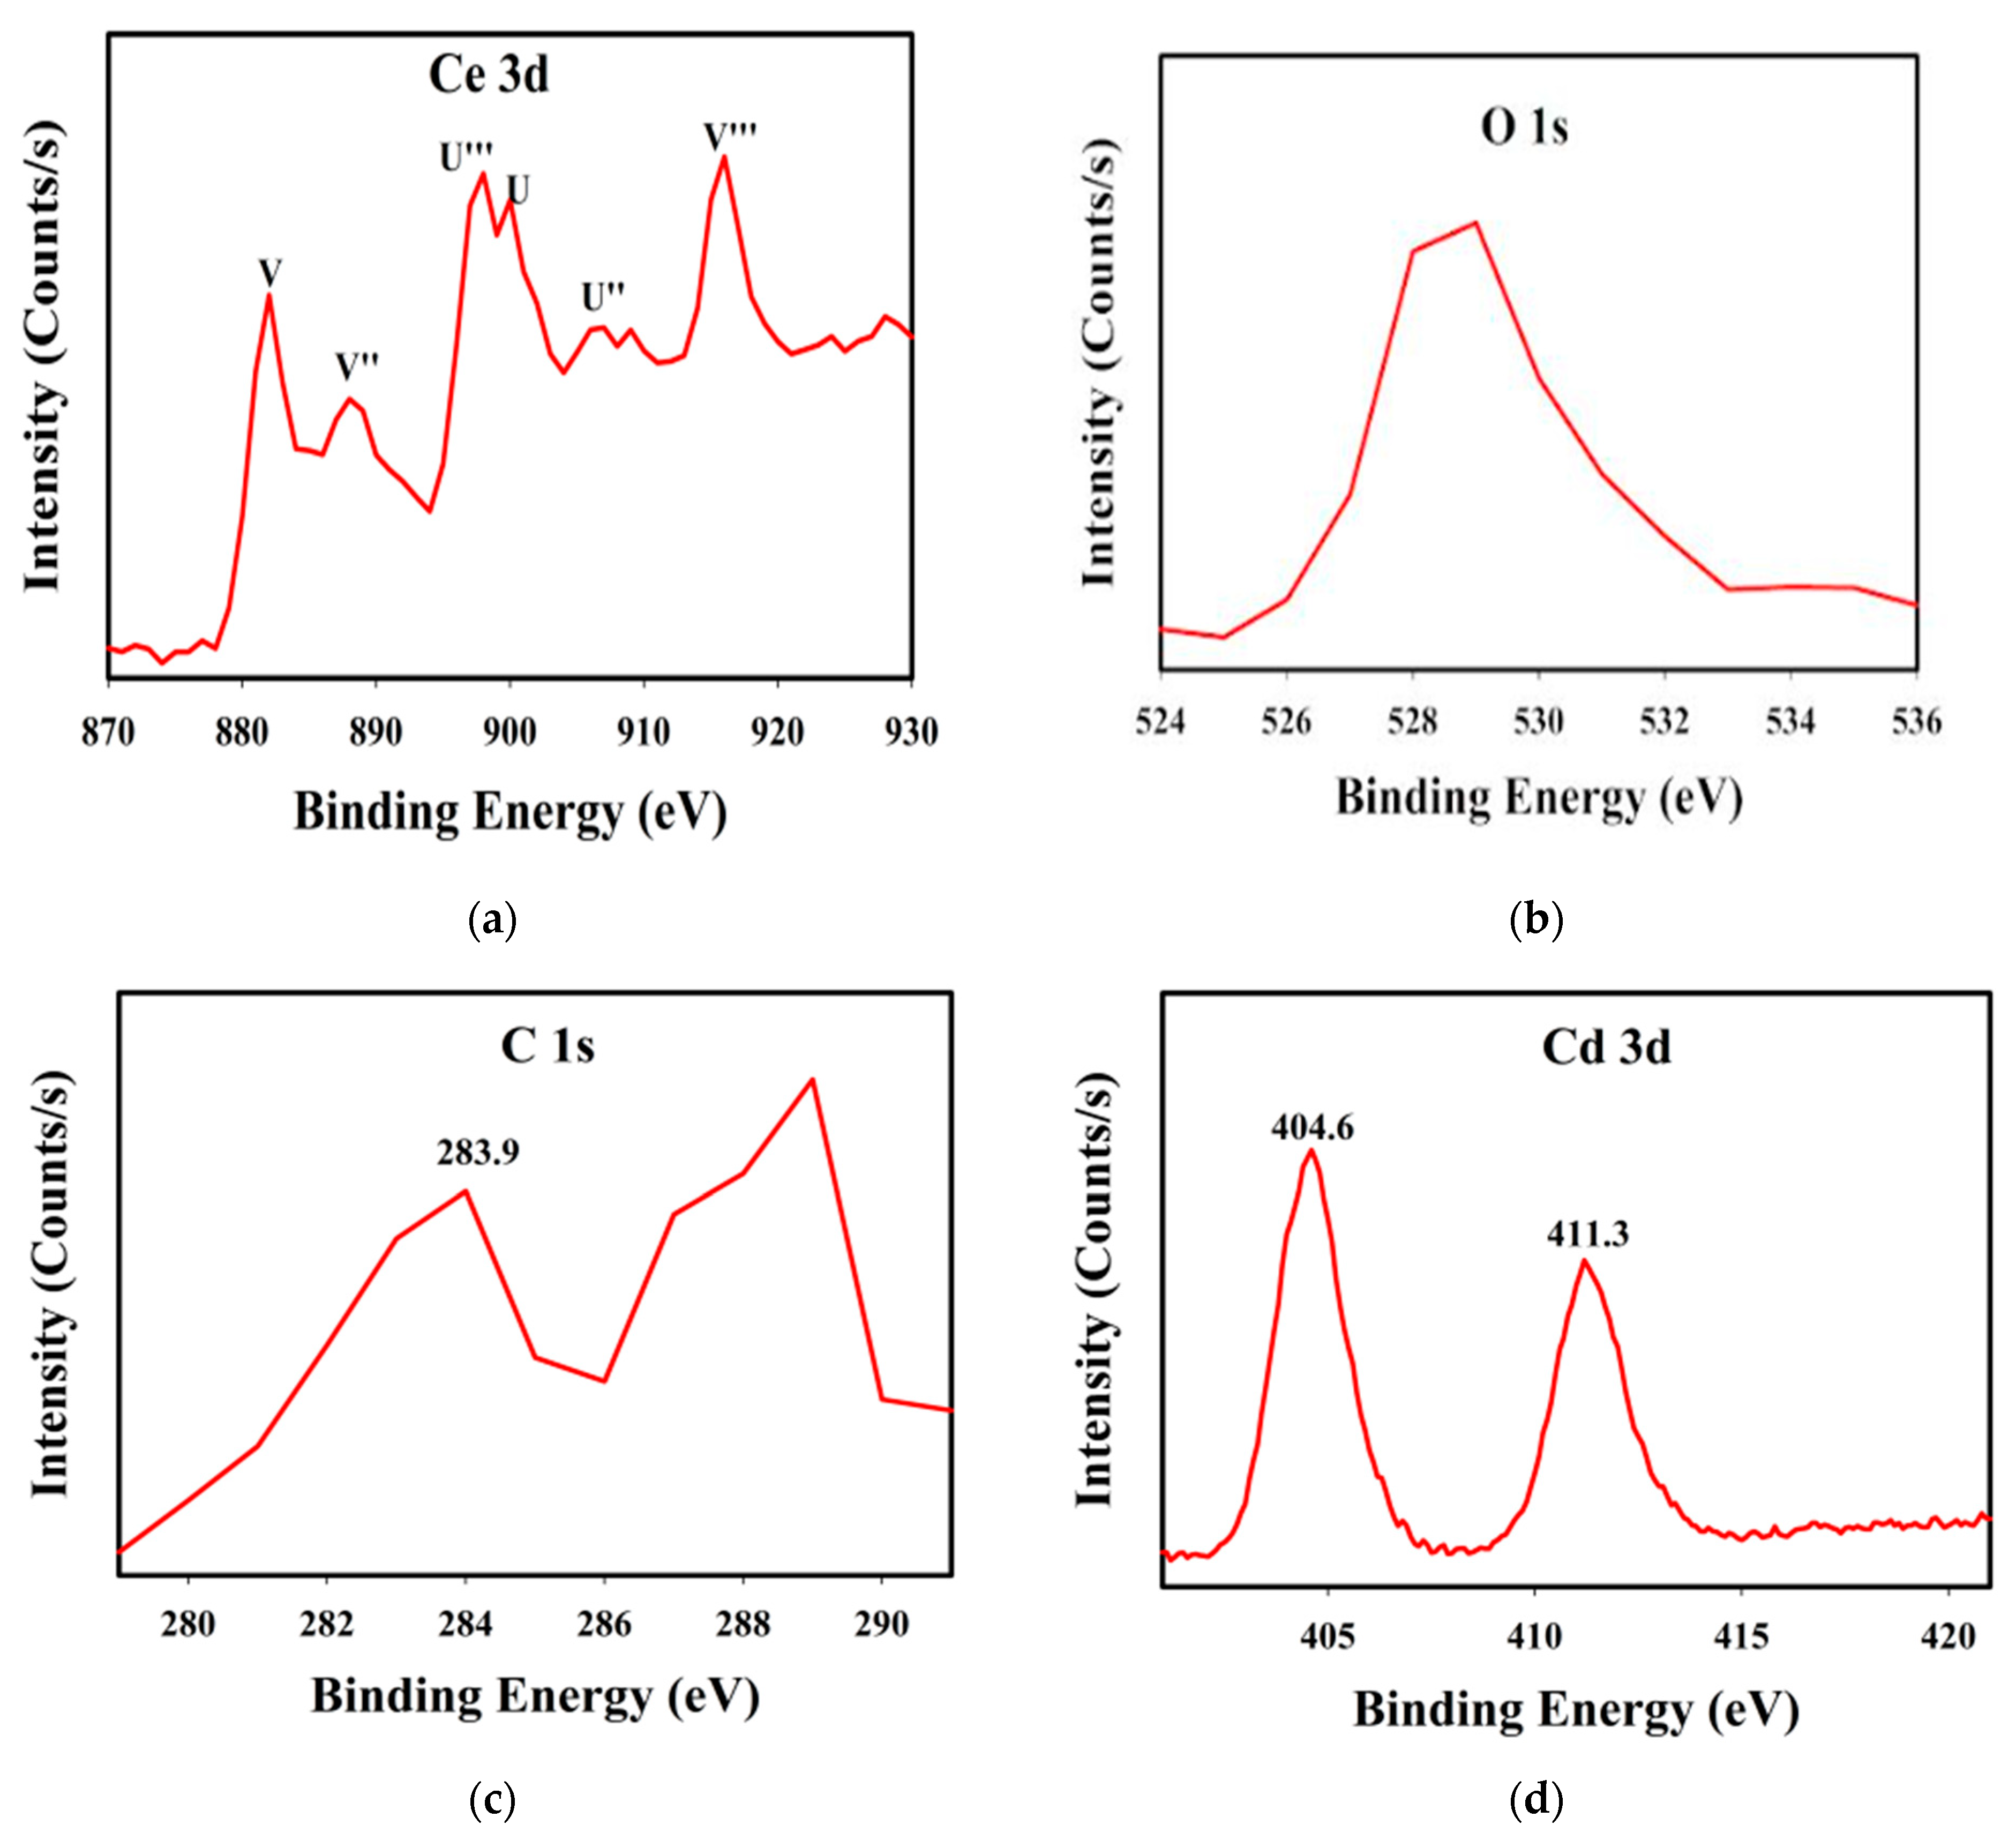
In the CeO2 fluorite structure (Figure 5b), lattice oxygen (O2−) bound to Ce+ is responsible for the primary peak at about 529.5 eV. Oxygen in oxygen-deficient areas and oxygen bound to Ce3+ close to oxygen vacancies are represented by the peak at about 531.5 eV. Figure 6 shows the (a) Ce 3d, (b) O 1s, (c) C 1s, and (d) Cd 3d regions for the 5% Cd-doped CeO2/rGO nanocomposite high-resolution XPS spectra. The presence of mixed Ce+/Ce3+ valence states is confirmed by the nanocomposite Ce 3d spectrum (Figure 6a), which displays the same distinctive peaks as pristine CeO2.
Figure 6.
XPS spectrum of (a) Ce 3d (b) O 1s, (c) C 1s, and (d) Cd 3d of 5% Cd-doped CeO2/rGO nanocomposite.
The O 1s spectrum of the nanocomposite (Figure 6b) shows similar components to pristine CeO2. The C 1s spectrum of the nanocomposite (Figure 6c) provides information about the chemical state of carbon in rGO and its interaction with CeO2. The spectrum can be deconvoluted into several components: a peak at approximately 288.5 eV corresponds to C=O bonds from carbonyl and carboxyl groups; the main peak at 284.8 eV corresponds to sp2 hybridized carbon (C=C) in the graphene structure; a peak at approximately 286.5 eV is attributed to C-O bonds from residual oxygen functionalities; and a peak at approximately 289.5 eV may be assigned to O-C=O bonds. The dominance of the sp2 carbon peak confirms successful GO to rGO reduction, while the residual oxygen-containing carbon species’ presence indicates incomplete reduction, which is typical for thermally reduced GO.
The nanocomposites’ Cd 3d spectrum (Figure 6d) shows two major peaks that correspond to the spin–orbit components with binding energies of roughly 405.5 eV and 412.3 eV, for Cd 3d5/2 and Cd 3d3/2. Cd2+ species are characterized by a spin–orbit splitting of about 6.8 eV. Cadmium is mostly present in the +2 oxidation state in the nanocomposite, according to the binding energy locations. Similarly, with the XRD data, the lack of peaks corresponding to metallic Cd or CdO phases suggests that Cd2+ ions are integrated into the CeO2 lattice instead of forming distinct phases. As XPS is surface-sensitive, the modest doping concentration (5 mol %) is reflected in the comparatively low intensity of the Cd 3d peaks. The XPS results confirm the presence of mixed Ce3+/Ce4+ states together with Cd incorporation and rGO in the nanocomposite, which is consistent with the successful formation of the composite. The presence of these defect-related features is known to enhance the electronic properties of CeO2 by promoting efficient charge carrier separation and suppressing electron–hole recombination, thereby contributing significantly to the enhanced photocatalytic performance. The higher defect density produces active sites for oxygen activation and pollutant adsorption, electron-trapping sites that inhibit recombination, and mid-gap states that prolong visible-light absorption [43,44].
2.5. SEM Analysis
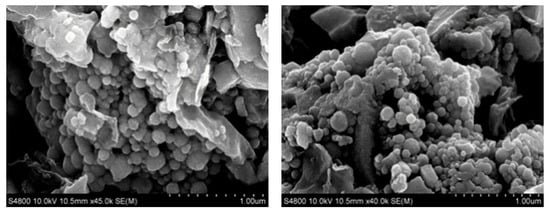
SEM images of the 5% Cd-doped CeO2/rGO nanocomposite at different magnifications are pictured in Figure 7. Chemically reduced graphene oxide is characterized by the rGO sheets’ typical folded, paper-like shape with wrinkles and folds. When oxygen functional groups are removed during reduction, the sheets collapse and fold to reduce surface energy, resulting in this wrinkled form. These wrinkles’ large surface area and porous structure are advantageous for photocatalysis because they offer plenty of locations for the adsorption of pollutants and make it easier for reactants and products to move in large quantities.
Figure 7.
SEM images of 5% Cd-doped CeO2/rGO nanocomposite.
A large number of tiny Cd-doped CeO2 nanoparticles can be seen as approximately spherical nanoparticles that are evenly dispersed over the rGO sheets surface. The rGO sheets successfully prevent particle aggregation during synthesis, as seen by the nanoparticles’ apparent uniform dispersion and lack of noticeable agglomeration [45]. The persistent CeO2 nanoparticle design of rGO sheets indicates persistent interfacial contacts between the two elements, in photocatalytic applications which are essential for effective charge transfer. In accordance with FTIR and XPS investigations, the Ce-O-C chemical bond formation at the interface enhances this interaction and establishes efficient paths for electron transfer from CeO2 to rGO.
2.6. TEM Analysis
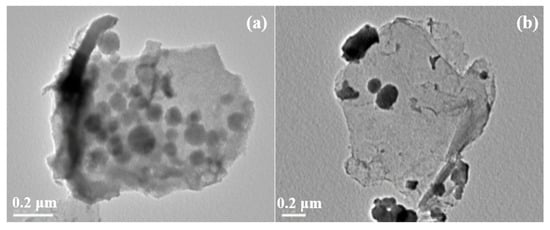
Figure 8a,b shows the TEM images of the 5% Cd-doped CeO2/rGO nanocomposite at different magnifications. The rGO sheets appear transparent to the electron beam, indicating that they consist of a few graphene layers (approximately 2–5 layers). This layered structure provides a large surface area for the uniform growth of nanoparticles while maintaining good electrical conductivity. Dark, nearly spherical Cd-doped CeO2 nanoparticles are evenly distributed over the rGO sheets. The higher electron density of CeO2 produces strong contrast against the lighter carbon background, making the nanoparticles clearly distinguishable in the TEM images.
Figure 8.
TEM images of (a) CeO2/rGO nanocomposite and (b) 5% Cd-doped CeO2/ rGO nanocomposite.
In agreement with the XRD and SEM results, empirical research on particle size from different TEM images shows a very narrow size range with a roughly 8–12 nm average diameter. The approximately 0.31 nm measured lattice spacing corresponds to the (111) plane CeO2 cubic fluorite, confirming the crystalline structure observed in XRD. The presence of clear lattice fringes indicates high crystallinity, which is important for efficient charge transport within the nanoparticles [46]. Some nanoparticles exhibit defects or slight lattice distortions, which may be due to oxygen vacancy formation and Cd doping.
2.7. Photocatalytic Degradation Performance of Methyl Orange
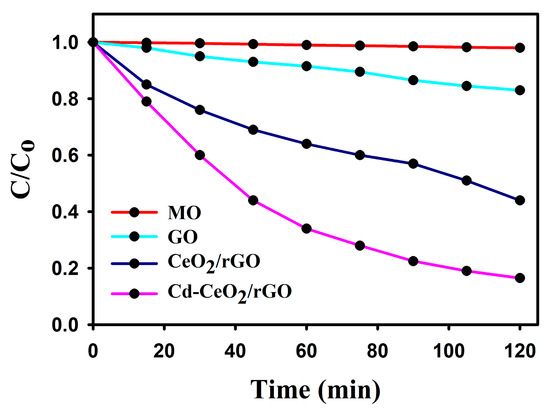
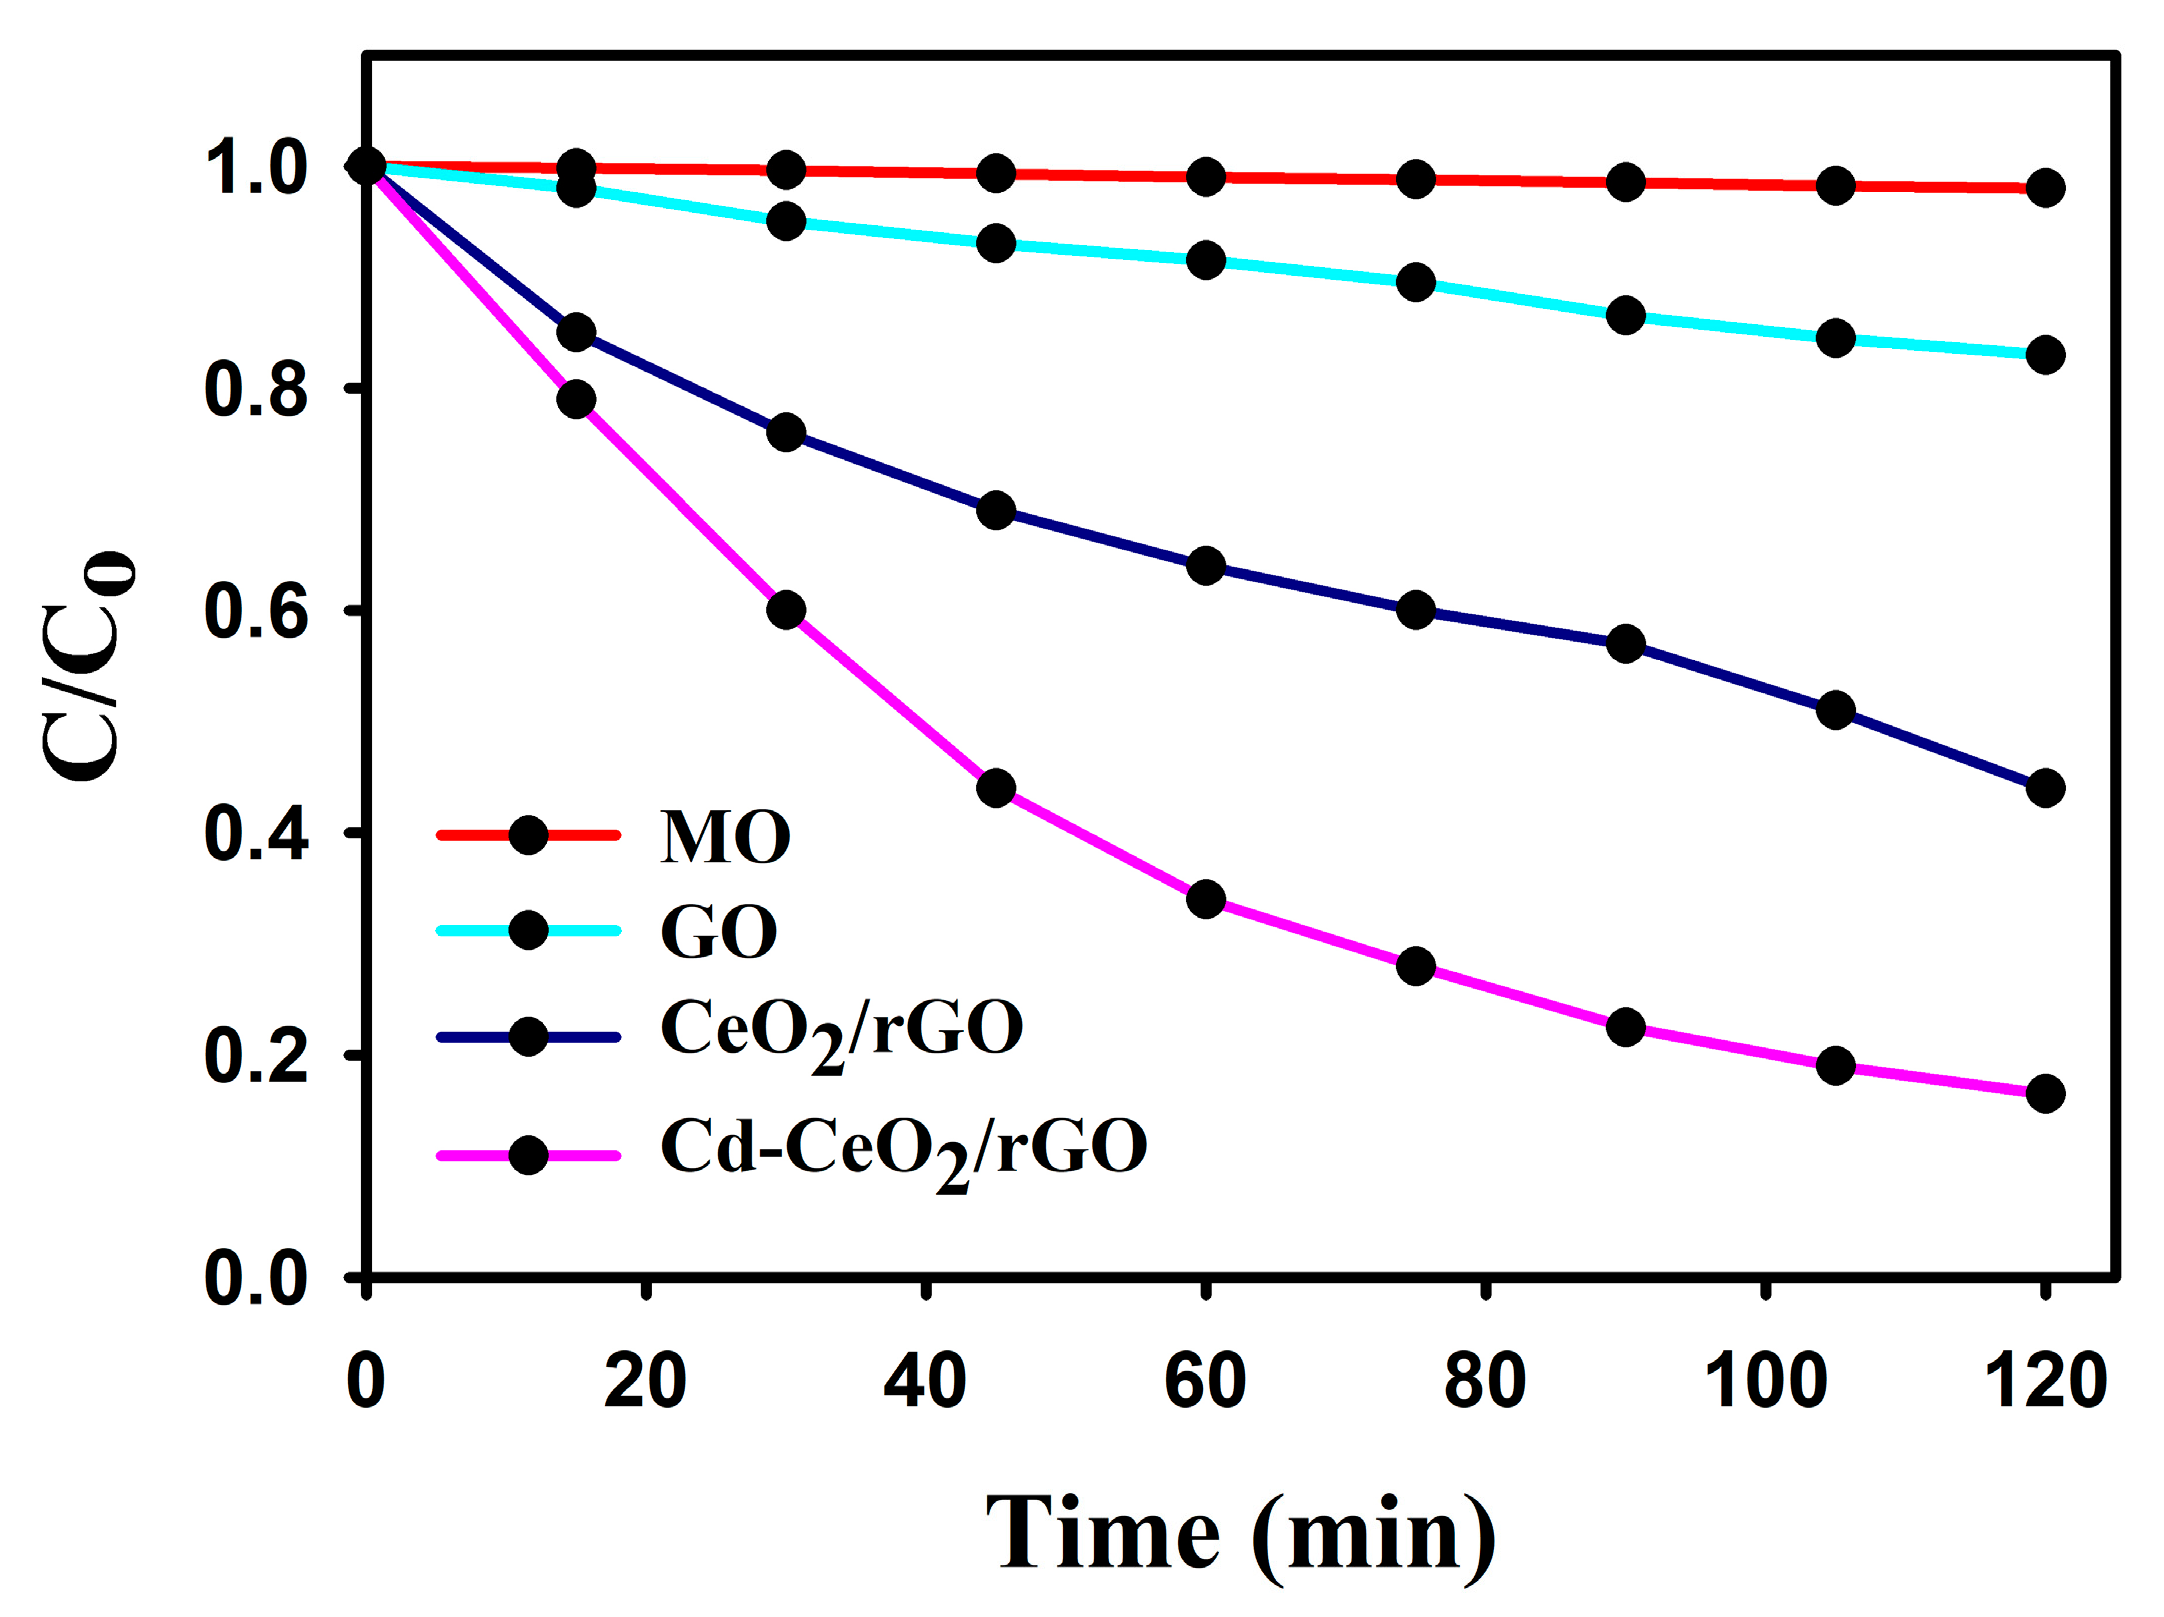
MO photo degradation data are shown in Figure 9 for the presence of MO, GO, CeO2/rGO and 5% Cd-doped CeO2/rGO composite. The photocatalytic activity of each prepared material was assessed by monitoring the methyl orange degradation (MO) after being photo-irradiated with visible light for a total duration of 120 min. At the conclusion of this experiment, the degradation efficiencies recorded were 2% for pure MO (no catalyst), 17% for graphene oxide (GO), 56% for CeO2/rGO and 83.5% for Cd-CeO2/rGO. The results concerning these data are summarized in Table 1.
Figure 9.
Photodegradation of MO, GO, CeO2 nanoparticles and 5% Cd-doped CeO2/rGO nanocomposite.
Table 1.
Degradation efficiency of the prepared materials at 120 min of visible-light irradiation.
In the absence of a catalyst, negligible degradation was found for pure MO (2%). This confirms that the amount of direct photolysis occurring upon MO under the experimental light conditions is very low, thereby indicating that the amount of degradation occurring within the systems containing catalysts is, in fact, of a photocatalytic nature. The moderate photocatalytic activity exhibited by GO (17%) could reflect the reactivity of the oxygen containing functional groups left on its surface, which could potentially yield low amounts of reactive radicals when irradiated. However, since GO does not possess a suitable semiconductor band structure, it limits its ability to effect photo-induced charge separation under the experimental conditions which would hinder its overall activity.
The addition of CeO2 to the rGO matrix created a composite that demonstrated a significant increase in degradation efficiency (56.0%). This enhancement is attributed to the capacity of CeO2 to capture incoming light and produce electron–hole pairs; rGO acts as a collector of electrons, keeps the electrical charges from recombining, and aids in transferring photogenerated electrons to dissolved O2. The further increase (83.5%) through the incorporation of Cd into the CeO2/rGO structure generated even more value for the Cd modification discussed.
The composite Cd-CeO2/rGO has the highest degradation efficiency (83.5%) compared to all of the other materials tested. This indicates that it relies on the synergistic interaction of three different components (Cd-CeO2-rGO). The semiconductor CeO2 is a well-known visible-light-active semiconductor that generates electron–hole pairs through photoexcitation. However, in its purest state (i.e., without Cd incorporation), there is rapid recombination of the photogenerated charge carriers in CeO2 leading to a limited practical photocatalytic efficiency [47].
When Cd is incorporated into the CeO2 lattice, localized energy states are introduced which promote charge separation by forming heterojunction-like structures at the interface of Cd-CeO2. The formation of these heterojunction-like structures reduces the recombination between electrons and holes, which increases the lifetime of photogenerated charge carriers and thus availability of these carriers to partake in surface-redox reactions. In addition to this, rGO serves as a two-dimensional electron-transport matrix because of its excellent electrical conductivity and significant specific surface area. Electrons that migrate from the photoexcited Cd-CeO2 component to the rGO matrix can then react with dissolved O2 to form superoxide radicals (•O2−), while the leftover holes can generate hydroxyl radicals (•OH) through reaction with surface water or hydroxide ions. The formation of both of these types of reactive oxygen species (ROS) is responsible for the increased degradation of MO as observed for the composite.
2.7.1. Error Bar Analysis
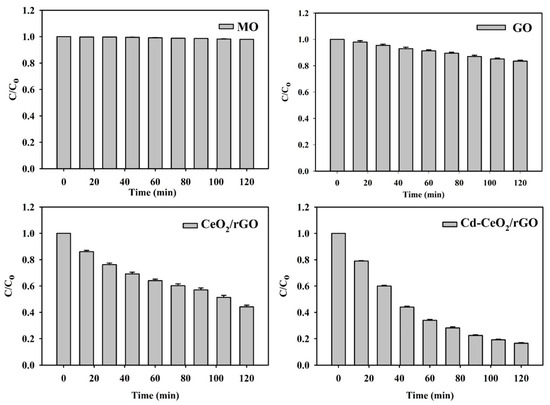
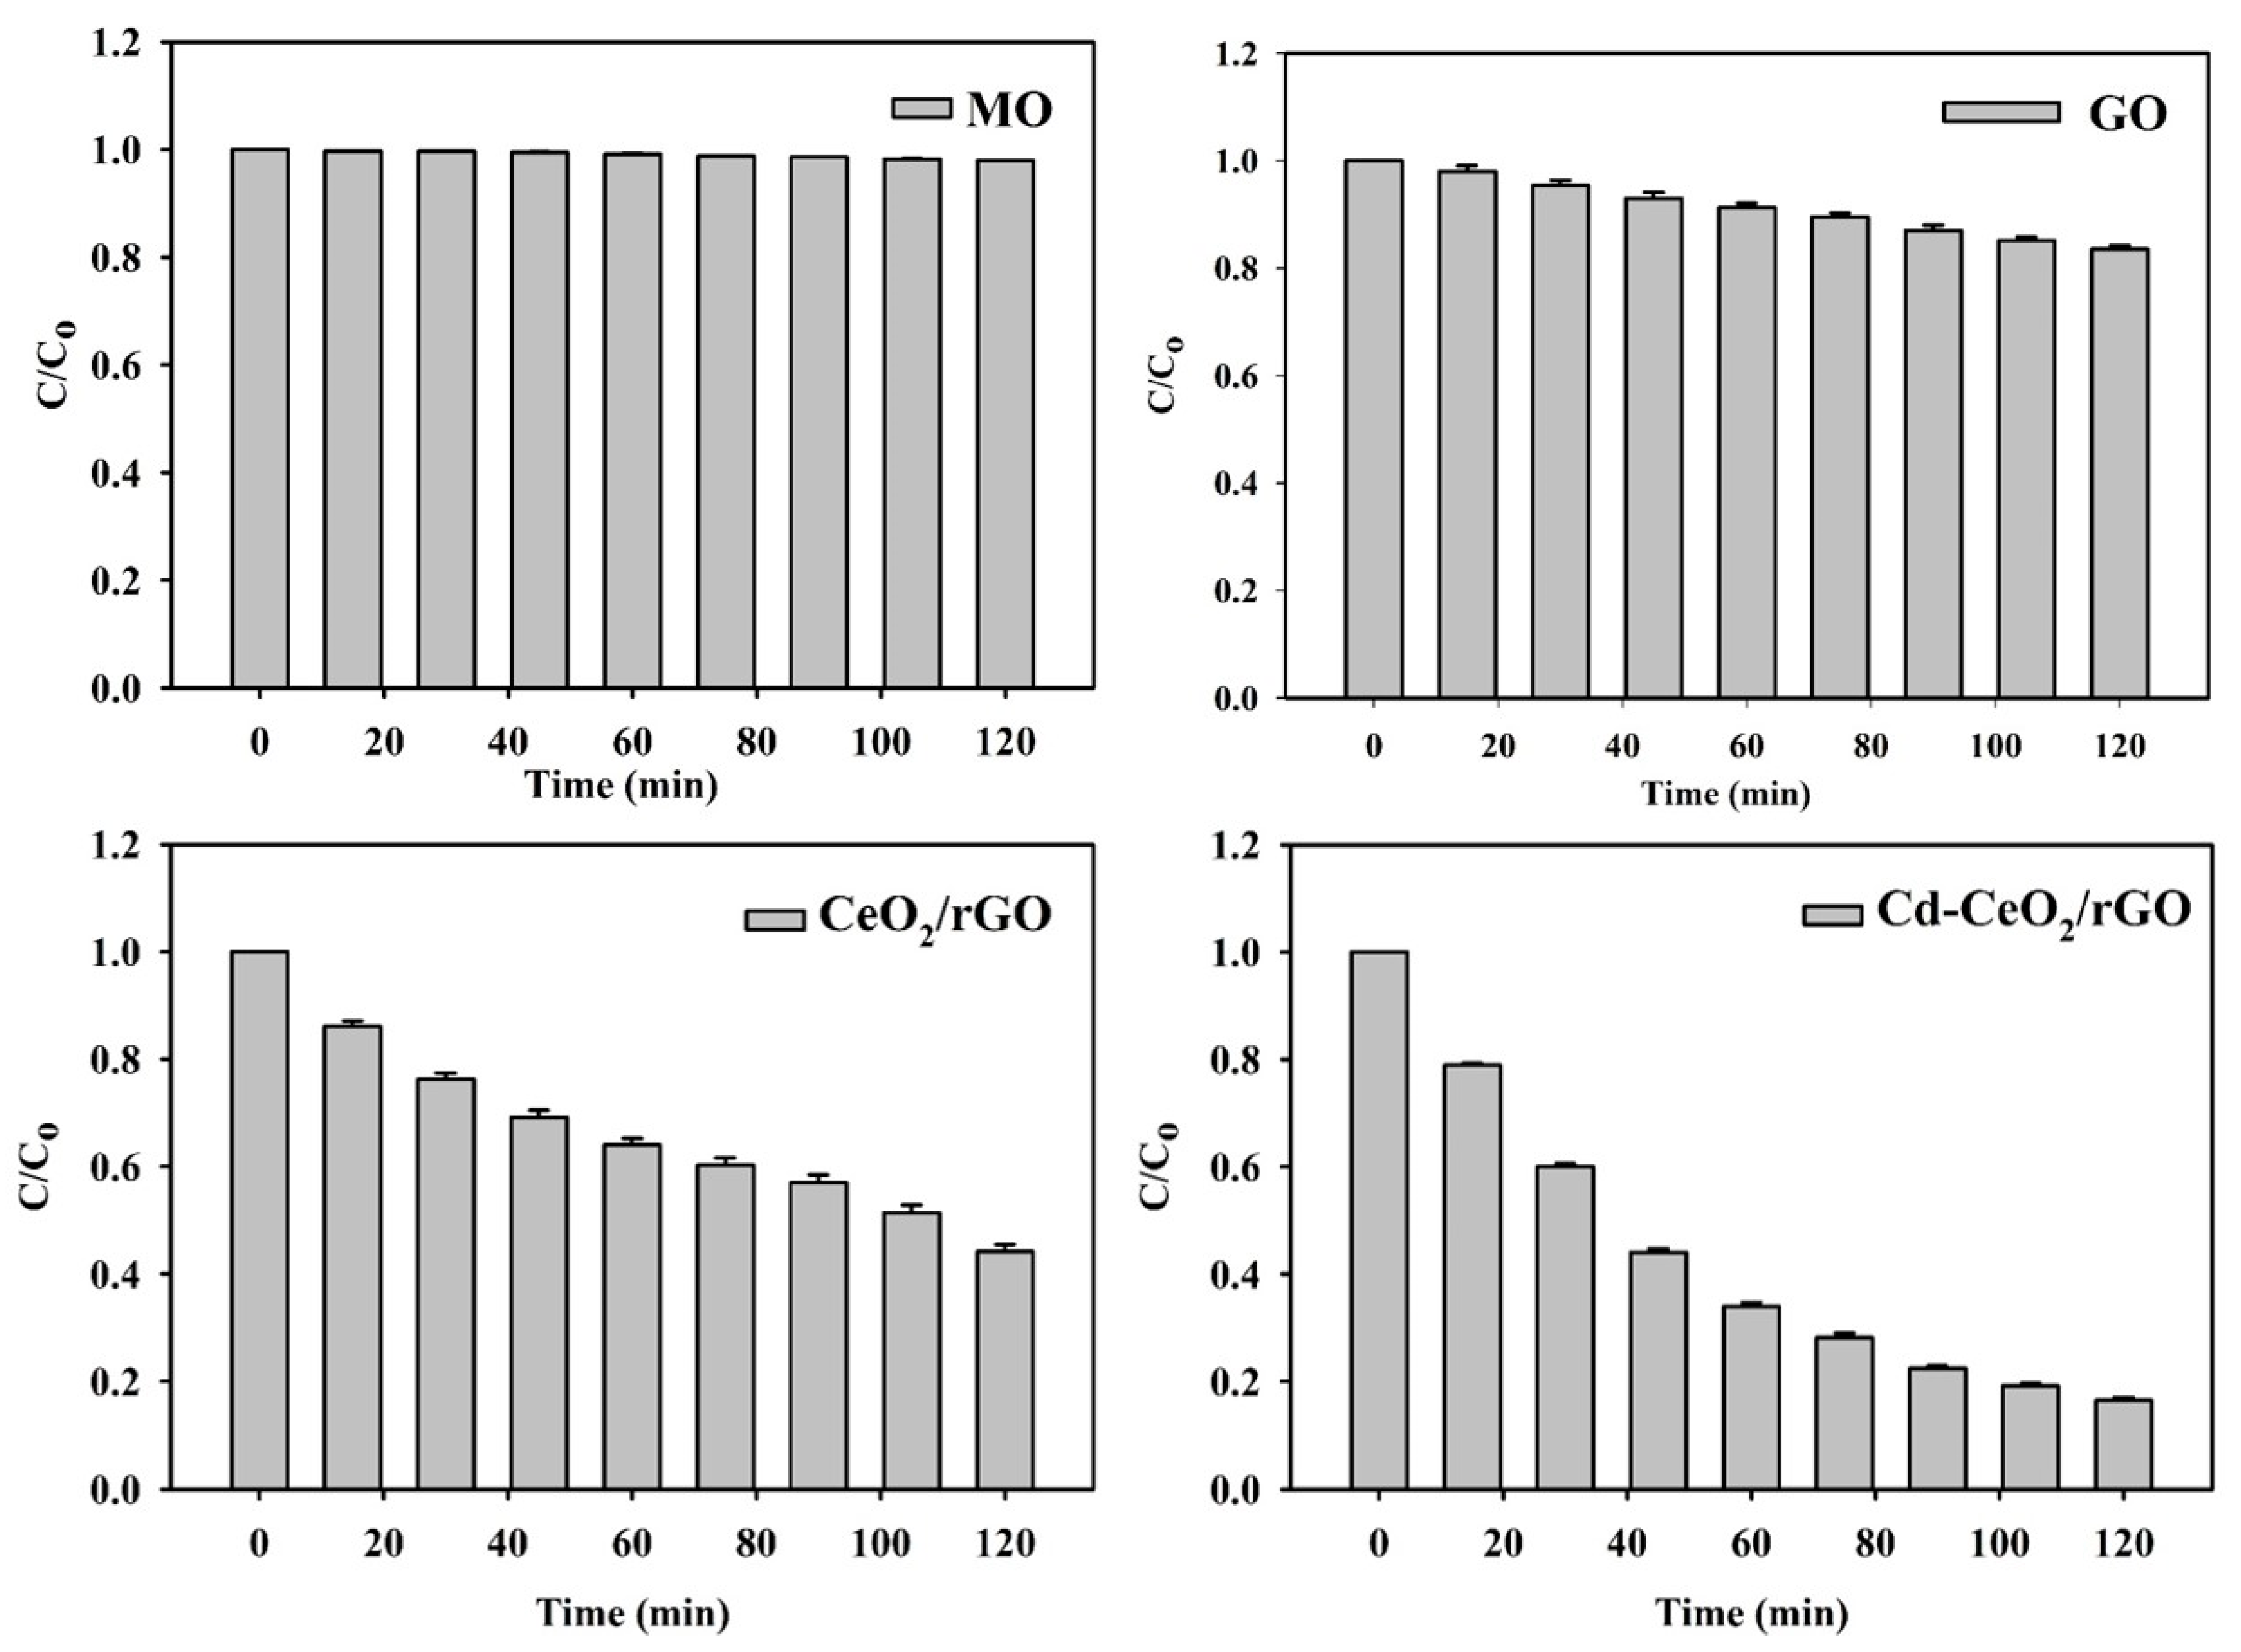
The error bars found in Figure 10 show standard deviation, which is a measure of how much variability there is between the repeated measurements made using the same experimental conditions. The error bars provide a visual representation of the reproducibility of the results from the photocatalytic experiments and an assessment of how consistently the experimental trials produced similar results.
Figure 10.
Degradation efficiency of MO, GO, CeO2/rGO, and Cd–CeO2/rGO as a function of irradiation time, with error bars representing standard deviation from replicate measurements.
All four materials had relatively small error bars compared to the size of their measured degradation values, which indicates good reproducibility of the experiments. The small standard deviations of the uncatalyzed (MO) material are consistent with the stability of the material under photolysis and show that replicate measurements produced very similar results while using this material. The greater relative size of the standard deviations of the catalyst systems (CeO2/rGO and Cd-CeO2/rGO) for longer duration irradiations is likely due to the larger number of variables affecting the performance of these catalyst materials and greater sensitivity of the measurement to minute differences in either catalyst distribution within the reactor or the intensity distribution of light within the reactor.
The relative standard deviations of all four systems meet the acceptable range for heterogeneous photocatalytic experiments and there is little overlap of error bars at the majority of time points within the datasets for the catalysts. These results further support the assertion that the differences in photocatalytic degradation results reflect real differences in performance among the four materials and arise from reproducible, non-random differences and not errors in data collection and processing. The consistency of the size of error bars across replicate experiments indicates that the sample preparation and experimental procedures were controlled enough to yield reliable and reproducible data [48].
2.7.2. Kinetic Studies
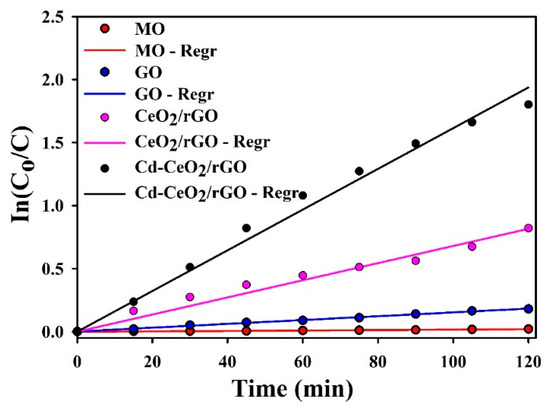
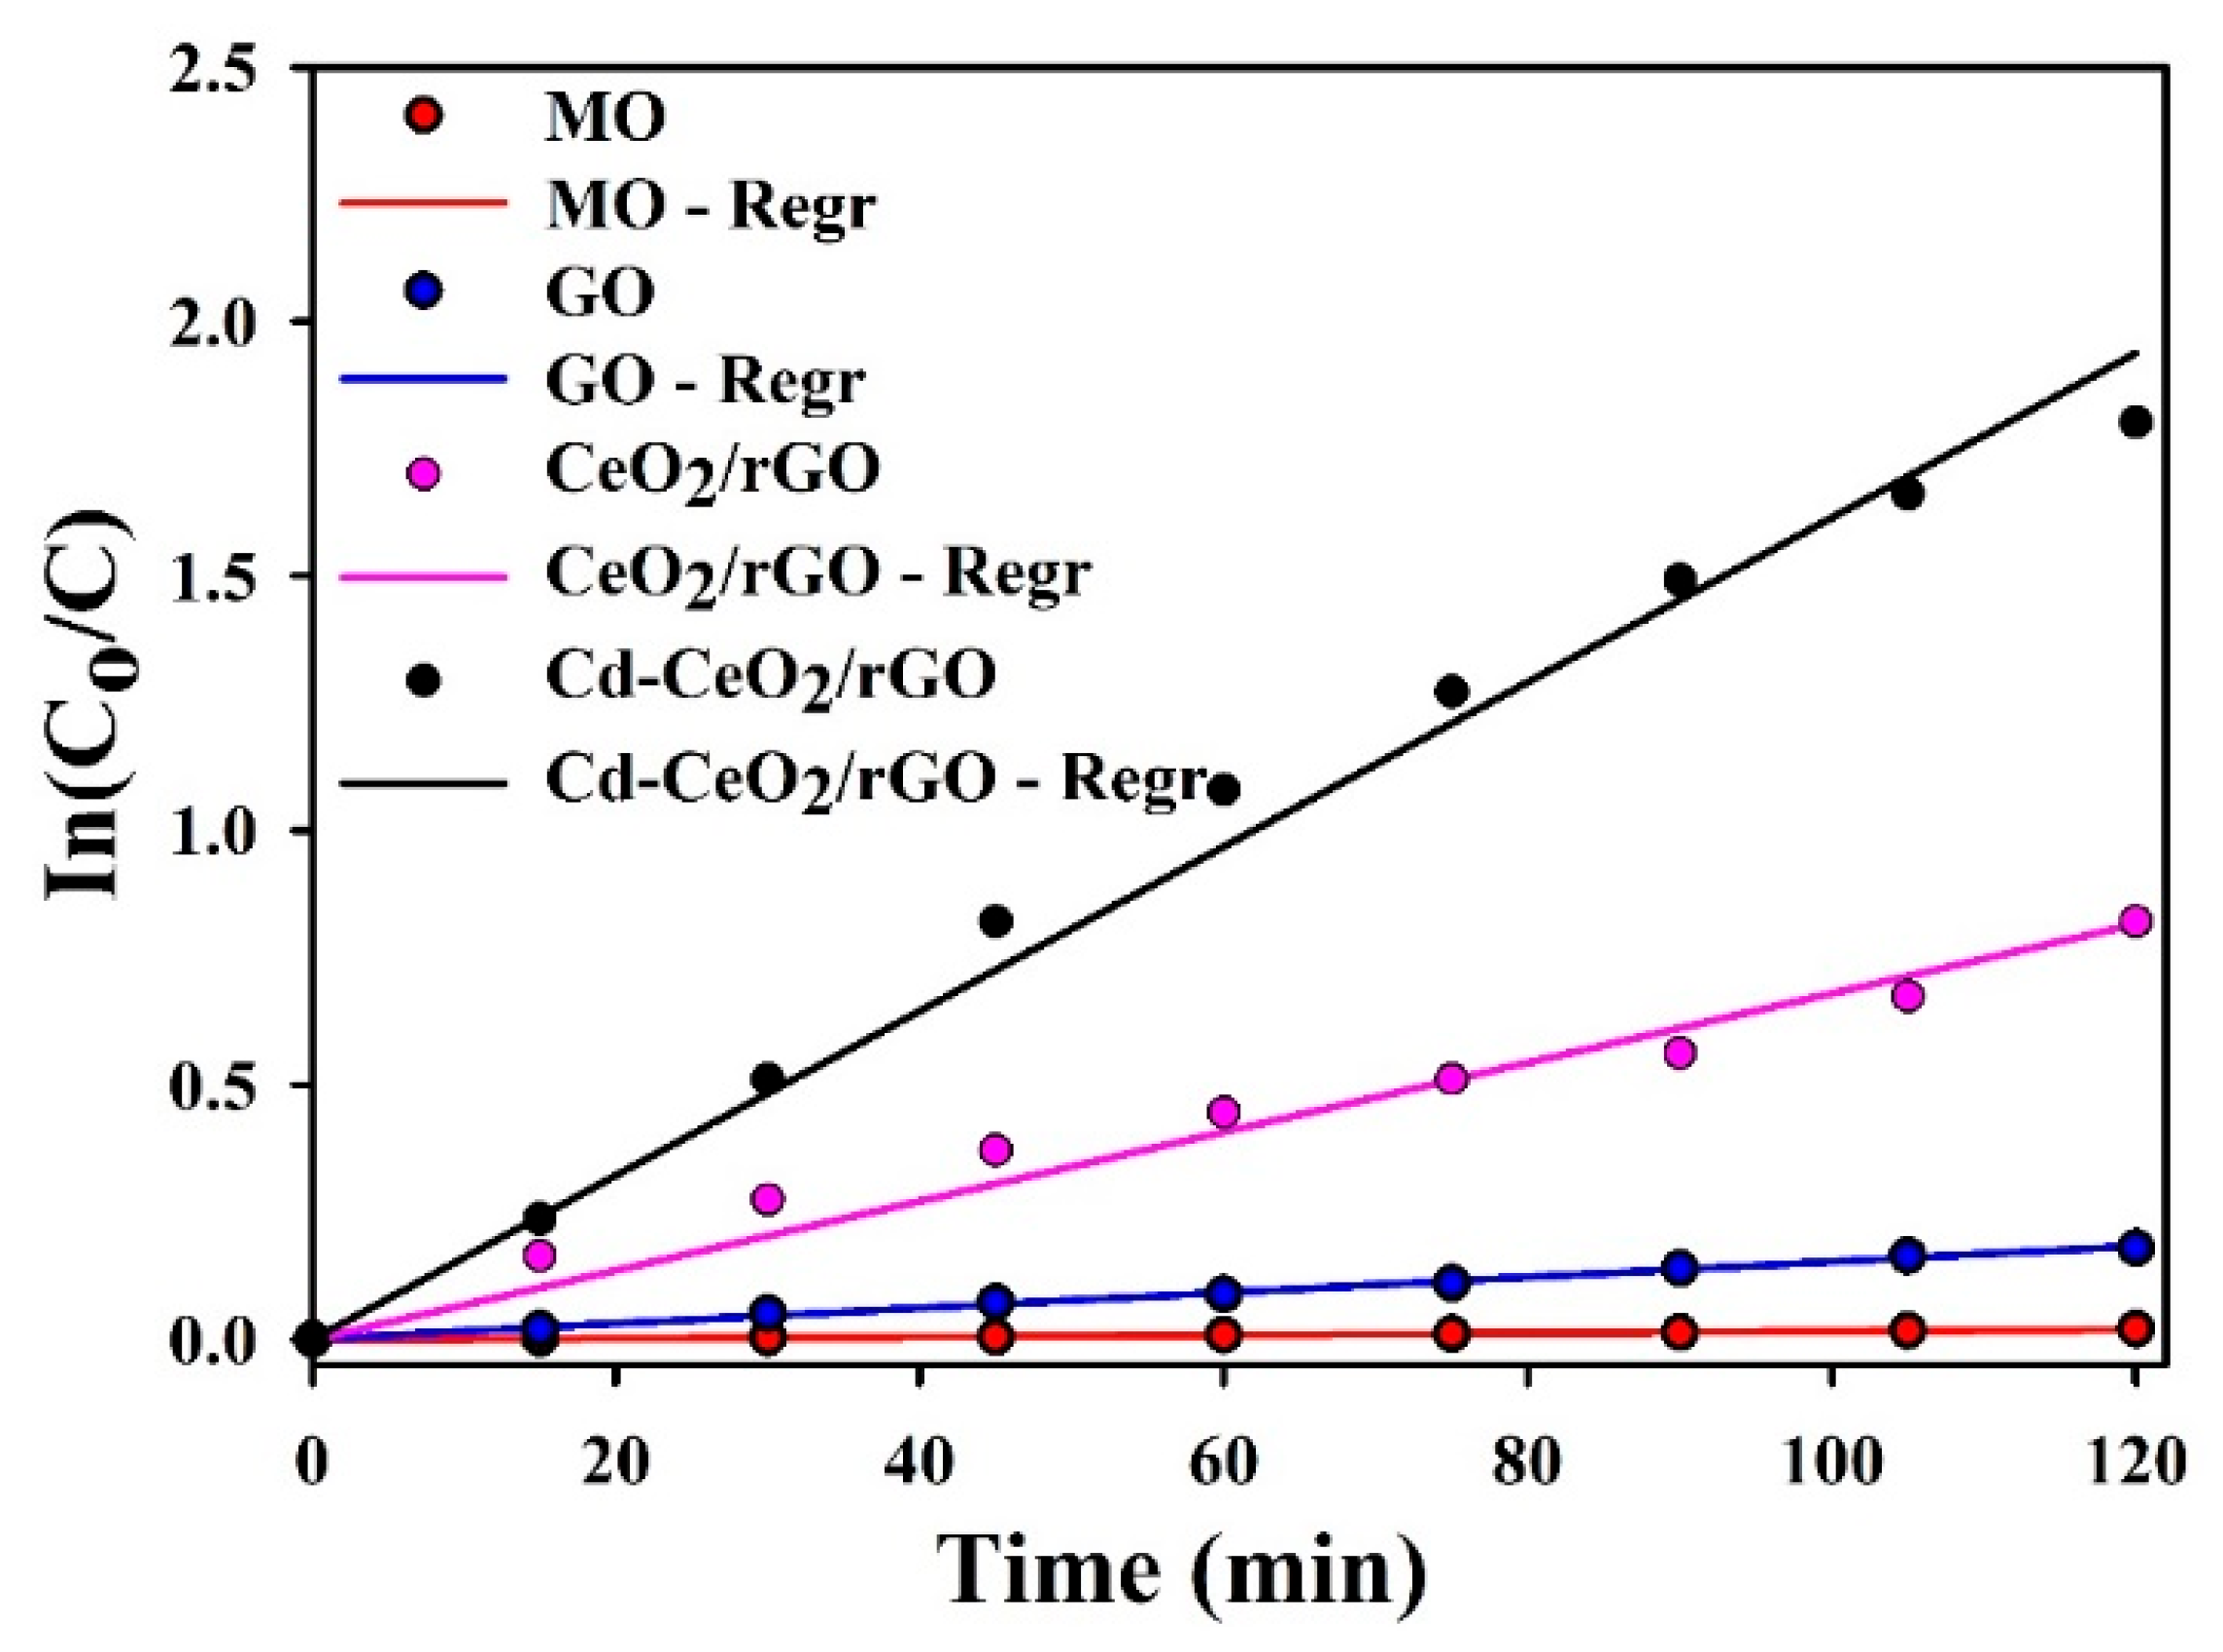
To accurately quantify the rate of photocatalytic degradation and conduct an exact comparison of the prepared materials, the concentration data collected at specified times during each photocatalytic reaction was fitted to the pseudo-first-order kinetic model. This model is suitable to evaluate reactions with a very low concentration of dye present when contrasted to the amount of catalyst used in cases of heterogeneous photocatalytic reactions, which is the assumption being made for this study. The pseudo-first-order model can be expressed in linear form as follows:
where C0 = initial concentration of dye present, Ct = concentration of dye at time t, k = apparent pseudo-first-order rate constant (min−1), and t = irradiation time (min). If first-order kinetics hold true during the entire time of irradiation, then an ln(C0/Ct) plot vs. time will be linear with a slope equal to the rate constant (k). The data set should demonstrate that the linear model provided an adequate fit to the data set when the coefficient of determination (R2) approached the same values, indicating the strong conformity of the proposed model.
ln(C0/Ct) = kt
Table 2 gives the pseudo-first-order rate constants (k) and coefficients of determination (R2) for the materials studied, while kinetics plots are included in Figure 11. The four materials used in this study demonstrated R2 values exceeding 0.98, demonstrating that the pseudo-first-order model can be used to adequately describe the sample materials’ degradation kinetics.
Table 2.
Pseudo-first-order rate constants and coefficients of determination for MO degradation.
Figure 11.
Pseudo-first-order kinetic plots [ln(C0/Ct) vs. irradiation time] for MO, GO, CeO2/rGO, and Cd–CeO2/rGO.
The pseudo-first-order reaction constant (k) for MO acting without an added catalyst was 1.78 × 10⁻⁴ min−1 (R2 = 0.9978), indicative of the negligible rate of products produced under UV irradiation, confirming MO has an inherent stability when exposed to UV irradiation without the use of a photocatalyst. In comparison to the uncatalyzed degradation of MO, adding GO into the reaction system increased the k value to 1.58 × 10⁻³ min−1 (R2 = 0.9943) which is nearly 9 times greater than the rate at which the uncatalyzed MO reacted, demonstrating the modest but measurable photocatalytic effect of GO. The k value increased to 5.75 × 10⁻³ min−1 (R2 = 0.9836) for CeO2/rGO composite material as a catalyst, indicating a 3.57-fold increase over that of GO. The highest rate found occurred with the Cd–CeO2/rGO composite as a catalyst which yielded a k value of 1.50 × 10⁻² min−1 (R2 = 0.9854), representing a 84-fold increase over that of the reaction rate without the catalyst and 2.60-times higher than that of the CeO2/rGO catalytic system, demonstrating the significant effect of the incorporation of Cd into each composite.
2.7.3. Confidence Interval Analysis
Statistical analysis of the calculated k values also determined the 95% confidence intervals (CIs) for the four catalyst systems studied. The CIs represent the range of values in which the true population k for each of the catalysts studied would be expected to fall within a 95% probability of variation in the experimental measurements of all four catalyst systems.
The CI (1.70–1.86) × 10−4/min for the MO (no catalyst) has a relative CI width of about 9 times the central estimate. Given that there is no complexity created by the presence of a catalyst in the MO (no catalyst) system, this indicates a high level of precision. On the other hand, the CI (1.46–1.70) × 10−3/min for GO exhibits a relatively wider CI than that for MO, indicating a lower level of precision that is a reflection of the greater variability found to be associated with the GO system. The CI for the composite catalyst (CeO2/rGO) was (5.00–6.49) × 10−3/min, which was larger than the other catalyst CIs in raw numbers but agrees with the higher k values present in this composite catalyst and greater degree of experimental variability expected in composite catalyst testing. The Cd-CeO2/rGO catalyst had the largest absolute CI (1.32–1.68) × 10−2/min, yet its relative CI size was comparable to those of the other catalyst systems. Pseudo-first-order rate constants with 95% confidence intervals is tabulated in Table 3.
Table 3.
Pseudo-first-order rate constants with 95% confidence intervals.
There was no overlap in CIs for the four catalyst systems studied, indicating that the differences in the k values observed across the four catalyst systems studied are caused by real differences in catalyst activity and not simply random variations in experimental results. The order of the four catalyst systems according to their observed k values also corresponds with the relative efficiency of each catalyst to degrade, providing additional confidence in the reliability of the ranking of these four catalysts.
2.7.4. Half-Life Analysis
The half-life (t1/2) of the photocatalytic degradation process indicates the time required for the initial concentration of methyl orange (MO) to decrease to half of its original value. It is an important parameter for evaluating the efficiency of the photocatalyst, with a shorter half-life indicating faster degradation. For a pseudo-first-order reaction, the half-life is related to the reaction rate constant as follows:
t1/2 = 0.693/k
Event sites corresponding to the half-lives derived from the experimentally determined rate constants can be found in Table 4; for the uncatalyzed MO system, the half-life was 3890 min (approx. 64.8 h), demonstrating that MO would be very resistant to photolysis under experimental conditions. The half-lives for the GO system dropped significantly to 439 min and again fell to 121 min for the CeO2/rGO composite system, showing that as the complexity of the composite system increased, the catalytic efficiency also increased.
Table 4.
Half-life values calculated from pseudo-first-order rate constants.
The largest drop in the half-life was seen for the Cd-CeO2/rGO system, where t1/2= 46 min, giving a molar rate constant approximately 85 times that of the uncatalyzed system and still 2.6 times the value associated with the CeO2/rGO composite. This composite demonstrates a clear advantage over all other composite materials within this series relative to the molar rate constant (kinetic activity), and the half-life data is consistent with the previously reported results for both the rate constant and for degradation efficiency, thereby providing sufficient data to support that the Cd-CeO2/rGO composite is also the most kinetically active material in this series.
3. Experimental Section
3.1. Materials
All chemicals used in this study were of analytical grade and were used as received without further purification. Cadmium nitrate tetrahydrate (Cd(NO3)2·4H2O, ≥99%), cerium(III) nitrate hexahydrate (Ce(NO3)3·6H2O, ≥99%), graphite powder (<20 μm), sodium hydroxide (NaOH, ≥98%), methyl orange (C14H14N3NaO3S, ≥85%), hydrogen peroxide (H2O2), hydrochloric acid (HCl, 37%), sulfuric acid (H2SO4, 98%), and potassium permanganate (KMnO4, ≥99%) were purchased from Sigma-Aldrich, Chennai, Tamil Nadu, India. Deionized water with a resistivity of 18.2 MΩ·cm was used throughout the study.
3.2. CeO2 Nanoparticles’ Synthesis
A co-precipitation process was used to produce cerium oxide nanoparticles. To get a transparent solution, at room temperature, 4.34 g of Ce(NO3)3.6H2O was dissolved in 100 mL of deionized water while being magnetically agitated. When a 2 M NaOH solution was steadily added to the cerium nitrate solution until the pH reached about 10–11, a pale-yellow precipitate of cerium hydroxide was formed. For two hours at 60 °C, the mixture was constantly agitated to guarantee full precipitation. After collecting the precipitate using centrifugation at 8586× g (RCF) for 10 min, it was carefully cleaned with ethanol and deionized water many times to get rid of any remaining contaminants and ions. After that, it was dried in an oven at 80 °C for the entire night. The dry powder was ultimately calcined in a muffle furnace at 500 °C for three hours at a heating rate of 5 °C/min to produce crystalline CeO2 nanoparticles.
3.3. GO and rGO Preparation
A modified Hummers method was used to create GO from graphite powder. In short, 2 g of graphite powder in an ice bath was mixed with 46 mL of concentrated H2SO4 while being constantly stirred. Then, while maintaining a temperature below 20 °C, 6 g of KMnO4 was slowly added to the mixture to prevent overheating. After complete addition, for 2 h at 35 °C the mixture was stirred, during which the solution became highly viscous and dark green. The reaction mixture was then diluted with 92 mL deionized water, causing a color change to dark brown and vigorous exothermic reaction. After additional heating, the mixture was maintained at 98 °C for 30 min. An excellent yellow solution was produced by adding 20 mL of 30% H2O2 and 280 mL of deionized water to stop the oxidation reaction. The GO product was collected by centrifugation and vacuum-dried at 60 °C after being continuously cleaned with a 5% HCl solution and deionized water until the pH was neutral. Reduced graphene oxide (rGO) was prepared by heating graphene oxide (GO) at 200 °C for 2 h under a nitrogen atmosphere. This thermal reduction process removed most of the oxygen-containing functional groups and restored the conjugated graphene structure.
3.4. Fabrication of 5% Cd-Doped CeO2/rGO Nanocomposite
The 5% Cd-doped CeO2/rGO nanocomposite was synthesized through a combined co-precipitation and in situ reduction approach. To create a uniform brown suspension, 50 mg of as-prepared GO was first ultrasonically dispersed in 100 mL of deionized water for an hour. In addition, 50 mL of deionized water was used to dissolve 4.12 g of 0.31 g of Cd(NO3)2.4H2O and Ce(NO3)3.6H2O (equivalent to 5 mol% Cd doping). After that, the GO suspension was rapidly magnetically stirred while the metal nitrate solution was added drop wise. A black precipitate was then formed by gradually adding a 2 M NaOH solution until pH 10–11 was attained. To enable the deposition of Cd-doped cerium hydroxide onto the GO sheets and the partial reduction of GO to rGO, at 80 °C, the mixture was heated and continuously agitated for three hours. The precipitate was extracted by centrifugation, carefully washed with deionized water and ethanol, and then dried at 80 °C for the entire night. The dried powder was calcined at 400 °C for 2 h under a nitrogen atmosphere to convert GO into rGO and to crystallize the Cd-doped CeO2 nanoparticles. A lower calcination temperature than that used for pristine CeO2 was selected to protect the rGO from oxidation while ensuring sufficient crystallization of the metal oxide.
3.5. Characterization Techniques
Raman spectroscopy was carried out using a Horiba LabRAM HR Evolution spectrometer (Horiba, Kyoto, Japan) connected with a 532 nm laser excitation source. With a spectral resolution of 1 cm−1, spectra were obtained in the 200–2000 cm−1 range. Cu Kα radiation (λ = 1.5406 Å) was used to analyze XRD patterns using a Bruker D8 Advance diffractometer (Bruker, Billerica, MA, USA)) running at 40 kV and 40 mA. FTIR spectroscopy was performed using the KBr pellet method on a PerkinElmer Spectrum 100 spectrometer (PerkinElmer, Waltham, MA, USA) with a resolution of 4 cm−1 in the wavenumber range of 400–4000 cm−1. Monochromatic Al Kα radiation (hυ = 1486.6 eV) was used for X-ray photoelectron spectroscopy (XPS) studies on a Thermo Scientific K-Alpha spectrometer (Thermo Fisher Scientific, Waltham, MA USA). A JEOL JEM-2100F microscope (JEOL, Tokyo, Japan) running at 200 kV was used for the TEM examination. SEM pictures were obtained using a HITACHI—S4800 field-emission scanning electron microscope (Hitachi, Tokyo, Japan) operating at an accelerating voltage of 10 kV. Samples were prepared by dispersing the powder in ethanol; the obtained suspension was sonicated for 30 min using an ultrasonic probe sonicated operated in pulse mode (5 s ON/5 s OFF) at 40% amplitude. To prevent excessive heating during sonication, the sample container was maintained in an ice-water bath, and the temperature was kept close to room temperature. The sonication treatment ensured homogeneous dispersion of the components and reduced particle agglomeration prior to further processing.
3.6. Photocatalytic Degradation Experiment
The photocatalytic activity of the synthesized materials was evaluated by degrading methyl orange (MO) under visible-light irradiation. In a typical experiment, 50 mg of the photocatalyst was dispersed in 100 mL of an aqueous MO solution (20 mg/L) in a cylindrical glass reactor. Before light irradiation, the suspension was stirred in the dark for 30 min using a magnetic stirrer to establish adsorption–desorption equilibrium between the MO molecules and the catalyst surface. This step ensured that any decrease in MO concentration during light irradiation was mainly due to photocatalytic degradation rather than dye adsorption. This procedure also promotes the uniform dispersion of catalyst particles throughout the solution, thereby improving the reliability and accuracy of photocatalytic measurements. After that, a 300 W xenon lamp with a 420 nm cutoff filter to block UV rays was placed 15 cm away from the reactor to expose it to visible light. An approximate measurement of 100 mW/cm2 was made of the light intensity at the solution surface. To provide a consistent light exposure and catalyst dispersion during irradiation, the suspension was constantly stirred. To separate the catalyst particles, 3 mL samples were taken out of the reactor and centrifuged at 10,000 rpm for five minutes at predefined intervals (0, 15, 30, 45, 60, 75, 90, 105, and 120 min).
4. Conclusions
This study reports the successful synthesis and characterization of a novel 5% cadmium-doped cerium oxide/reduced graphene oxide (5% Cd-CeO2/rGO) nanocomposite for the visible-light-driven photocatalytic degradation of methyl orange (MO). The nanocomposite was prepared using a simple co-precipitation method followed by thermal reduction. Its structure and morphology were examined using XRD, FTIR, Raman spectroscopy, XPS, SEM, and TEM. XRD results confirmed the successful incorporation of Cd2+ ions into the cubic fluorite CeO2 lattice through substitutional doping. FTIR analysis verified the reduction of GO to rGO and the formation of Ce–O–C bonds between CeO2 and rGO. Raman spectroscopy showed the characteristic peaks of both CeO2 and rGO, confirming the formation of the nanocomposite. XPS analysis confirmed the presence of all the expected elements and verified the chemical composition of the material. SEM and TEM images showed that ultrafine Cd-doped CeO2 nanoparticles (8–12 nm) were uniformly distributed on the wrinkled rGO sheets.
Photocatalytic studies demonstrated that the 5% Cd-CeO2/rGO nanocomposite exhibited significantly higher activity than pristine CeO2 and GO for the degradation of methyl orange under visible-light irradiation. The improved performance is attributed to the combined effect of Cd doping and rGO, which enhances charge separation, promotes electron transfer, and provides more active sites for the photocatalytic reaction. These findings show that combining metal-ion doping with conductive carbon materials is an effective method for improving the performance of semiconductor photocatalysts. Although the experiments were carried out under laboratory conditions using methyl orange as a model pollutant, the developed nanocomposite shows good potential for the photocatalytic removal of organic contaminants from wastewater. Further studies involving different classes of pollutants, catalyst stability, recyclability, and testing under more complex conditions will be necessary to fully evaluate its broader applicability.
Author Contributions
Conceptualization, S.J. and S.E.M.; methodology, A.M.M., N.A.S. and K.S.; software, G.P.; validation, S.J., S.S. and G.P.; formal analysis, S.J. and K.S.; investigation, S.J. and G.P.; resources, N.A.S., S.S. and G.P.; data curation, A.M.M., N.A.S. and K.K.; writing—original draft preparation, S.J., S.E.M. N.A.S. and A.M.M.; writing—review and editing, K.S., G.P. and K.K.; visualization, S.E.M. and K.S.; supervision, K.S., S.S. and K.K.; project administration, K.S. and S.S.; funding acquisition, S.S. and K.K. All authors have read and agreed to the published version of the manuscript.
Funding
Karthik Kannan extends their sincere gratitude of the National Science Technology Council (NSTC), Taiwan, for their support under the grant NSTC 115-2222-E-194-002.
Data Availability Statement
The original contributions presented in this study are included in the article. Further inquiries can be directed to the first/corresponding authors.
Acknowledgments
This work was financially/partially supported by the Advanced Institute of Manufacturing with High-tech Innovations (AIM-HI) from The Featured Areas Research Center Program within the framework of the Higher Education Sprout Project, by the Ministry of Education (MOE), Taiwan.
Conflicts of Interest
The authors declare no conflicts of interest.
References
- Xue, M.; Liu, X.; Wu, H.; Yu, B.; Meng, F. Construction of Cu2+-doped CeO2 nanocrystals hierarchical hollow structure and its enhanced photocatalytic performance. J. Mater. Sci. Mater. Electron. 2021, 32, 27576–27586. [Google Scholar] [CrossRef] [Scilit]
- Palani, G.; Arputhalatha, A.; Kannan, K.; Lakkaboyana, S.K.; Hanafiah, M.M.; Kumar, V.; Marella, R.K. Current Trends in the Application of Nanomaterials for the Removal of Pollutants from Industrial Wastewater Treatment—A Review. Molecules 2021, 26, 2799. [Google Scholar] [CrossRef] [Scilit] [PubMed]
- Matei, D.; Katsina, A.U.; Cursaru, D.-L.; Mihai, S. Mesoporous SBA-15-Supported Ceria–Cadmium Composites for Fast Degradation of Methylene Blue in Aqueous Systems. Water 2025, 17, 1834. [Google Scholar] [CrossRef] [Scilit]
- Dharmalingam, P.; Palani, G.; Apsari, R.; Kannan, K.; Lakkaboyana, S.K.; Venkateswarlu, K.; Kumar, V.; Ali, Y. Synthesis of metal oxides/sulfides-based nanocomposites and their environmental applications: A review. Mater. Today Sustain. 2022, 20, 100232. [Google Scholar] [CrossRef] [Scilit]
- Ishfaq, M.; Aadil, M.; Ejaz, S.R.; Hassan, W.; Panduro-Tenazoa, N.M.; El Sayed, M.E.; Murshed, M.N.; El-Bahy, Z.M. Synthesis of binary metal doped CeO2 via the subcritical hydrothermal method for photo-mineralizing methyl orange dye. J. Alloys Compd. 2023, 960, 170661. [Google Scholar] [CrossRef] [Scilit]
- Kannan, D.; Radhika, R.; Kasai, D.; Gnanasangeetha, D.; Palani, G.; Gurushankar, K.; Koutavarapu, R.; Lee, D.-Y.; Shim, J. Facile fabrication of novel ceria-based nanocomposite (CYO-CSO) via co-precipitation: Electrochemical, photocatalytic and antibacterial performances. J. Mol. Struct. 2022, 1256, 132519. [Google Scholar] [CrossRef] [Scilit]
- Sun, B.; Chen, W.; Zheng, W.; Zhang, H.; Liu, T.X.; Elmarakbi, A.; Fu, Y. In-situ controlled growth of ultrafine CeO2 nanoparticles on reduced graphene oxides for efficient photocatalytic degradation. J. Catal. 2023, 424, 106–120. [Google Scholar] [CrossRef] [Scilit]
- Sun, B.; Chen, W.; Zhang, H.; Feng, T.; Xing, W.; Elmarakbi, A.; Fu, Y.-Q. CeO2-decorated reduced graphene oxide for lubricative, anticorrosive and photocatalytic purposes. Mater. Chem. Phys. 2023, 308, 128255. [Google Scholar] [CrossRef] [Scilit]
- Kahlouche, K.; Derkaoui, K.; Brik, A.; Naitbouda, A.; Bencherifa, I.; Hadjersi, T. Tailoring Optical and Dielectric Properties of CeO2/rGO Nanocomposites for Enhanced Photodegradation of Rhodamine B Under Visible Light. J. Electron. Mater. 2025, 54, 11286–11302. [Google Scholar] [CrossRef] [Scilit]
- Ning, D.; Zhang, J.; Murali, A.; Lan, Y.; Chen, C.; Yang, S.; Zhang, W.; Li, J. Advancements in organic pollutant remediation: The role of nitrogen-doped rGO-CeO2 in photocatalytic efficiency enhancement. Colloids Surf. A Physicochem. Eng. Asp. 2024, 685, 133282. [Google Scholar] [CrossRef] [Scilit]
- Jayanthi, K.; Lavanya, T.; Saradha, N.A.; Satheesh, K.; Chenthamarai, S.; Jayavel, R. Superior photocatalytic performance of CeO2 nanoparticles and reduced graphene oxide nanocomposite prepared by low cost co-precipitation method. J. Nanosci. Nanotechnol. 2018, 18, 3257–3265. [Google Scholar] [CrossRef] [Scilit] [PubMed]
- Vanasundari, K.; Ponnarasi, P.; Mahalakshmi, G. A green approach to synthesis of Ag-doped CeO2 nanorods embedded reduced graphene oxide nanocomposite for excellent photocatalytic and antimicrobial activity. Inorg. Chem. Commun. 2024, 165, 112523. [Google Scholar] [CrossRef] [Scilit]
- Phor, L.; Chahal, S.; Kumar, P. Graphene and cerium oxide nanocomposites: Pioneering photocatalysts for organic dye degradation from wastewater. Processes 2025, 13, 720. [Google Scholar] [CrossRef] [Scilit]
- Fandi, N.G.; Altarawneh, M.; Al-Nu’airat, J. Photocatalytic and corrosion inhibitor performances of CeO2 nanoparticles decorated by noble metals: Au, Ag, Pt. J. Environ. Chem. Eng. 2020, 8, 104346. [Google Scholar] [CrossRef] [Scilit]
- Hao, Y.; Lan, P.T.; Ha, N.N.; Cam, L.M.; Ha, N.T.T. Theoretical analysis of superior photodegradation of methylene blue by cerium oxide/reduced graphene oxide vs. graphene. Molecules 2024, 29, 3821. [Google Scholar] [CrossRef] [Scilit] [PubMed]
- Vasu, D.; Keyan, A.K.; Sakthinathan, S.; Chiu, T.W.; Liu, M.C.; Ling, Y.C. Environmental remediation of toxic organic pollutants using visible-light-activated Cu/La/CeO2/GO nanocomposites. Materials 2021, 14, 6143. [Google Scholar] [CrossRef] [Scilit] [PubMed]
- Habib, I.Y.; Burhan, J.U.; Jaladi, F.; Lim, C.M.; Usman, A.; Kumara, N.T.R.N.; Tsang, S.C.E.; Mahadi, A.H. Effect of Cr doping in CeO2 nanostructures on photocatalysis and H2O2 assisted methylene blue dye degradation. Catal. Today 2021, 375, 506–513. [Google Scholar] [CrossRef] [Scilit]
- Krishnan, A.; Swarnalal, A.; Das, D.; Krishnan, M.; Saji, V.S.; Shibli, S.M.A. Tuning of photocatalytic performance of CeO2-Fe2O3 composite by Sn-doping for the effective degradation of methylene blue (MB) and methyl orange (MO) dyes. Surf. Interfaces 2021, 23, 100808. [Google Scholar] [CrossRef] [Scilit]
- George, M.; Nair, S.S.; John, A.; Joy, P.A.; Anantharaman, M.R. Nonlinear optical and photocatalytic dye degradation of Co doped CeO2 nanostructures synthesized through a modified combustion technique. Ceram. Int. 2020, 46, 13932–13941. [Google Scholar] [CrossRef] [Scilit]
- Çergel, M.S.; Demir, M.M.; Şahin, Ö. Developed and characterization of a novel Cd doped CeO2 nanofilm and application of pesticide removed by photodegradation. Res. Sq. 2023, preprint. [Google Scholar] [CrossRef] [Scilit] [PubMed]
- Chahal, S.; Rani, N.; Kumar, A.; Kumar, P. Electronic structure and photocatalytic activity of samarium doped cerium oxide nanoparticles for hazardous rose bengal dye degradation. Vacuum 2020, 177, 109075. [Google Scholar] [CrossRef] [Scilit]
- Murali, A.; Sarswat, P.K.; Free, M.L. Minimizing electron-hole pair recombination through band-gap engineering in novel ZnO-CeO2-rGO ternary nanocomposite for photoelectrochemical and photocatalytic applications. Environ. Sci. Pollut. Res. 2020, 27, 25042–25056. [Google Scholar] [CrossRef] [Scilit] [PubMed]
- Wang, Y.; Zhang, L.; Jiu, H.; Li, N.; Sun, Y. Rational design of Ce-doped CdS/N-rGO photocatalyst enhanced interfacial charges transfer for high effective degradation of tetracycline. J. Mater. Sci. Technol. 2023, 154, 237–248. [Google Scholar] [CrossRef] [Scilit]
- Du, J.; Lai, X.; Yang, N.; Zhai, J.; Kisailus, D.; Su, F.; Wang, D.; Jiang, L. Preparation of CeO2 nanorods-reduced graphene oxide hybrid nanostructure with highly enhanced decolorization performance. Appl. Surf. Sci. 2020, 503, 143939. [Google Scholar] [CrossRef] [Scilit]
- Xu, J.; Wang, L.; Cao, X. Facile synthesis of CeO2-graphene oxide composites with enhanced visible-light photocatalytic performance. Mater. Sci. Eng. B 2019, 245, 75–82. [Google Scholar] [CrossRef] [Scilit]
- Kumar, S.; Kumar, A.; Bahuguna, A.; Sharma, V.; Krishnan, V. Enhanced photocatalytic activity of rGO-CeO2 nanocomposites driven by sunlight. Mater. Sci. Eng. B 2017, 223, 98–108. [Google Scholar] [CrossRef] [Scilit]
- Li, Y.; Xia, Z.; Gong, Q.; Liu, X.; Yang, Y.; Chen, C.; Qian, C. rGO modified R-CeO2/g-C3N4 multi-interface contact S-scheme photocatalyst for efficient CO2 photoreduction. Appl. Surf. Sci. 2021, 563, 150042. [Google Scholar] [CrossRef] [Scilit]
- Roopa, K.R.; Nidoni, U.; Naik, M.M.; Rathod, V.; Nagaraju, Y.S.; Udayashankar, A.C. Green synthesis and characterization of nano reduced graphene oxide/cerium oxide (rGO/CeO2) for rose bengal dye degradation. J. Alloys Compd. Commun. 2024, 3, 100033. [Google Scholar] [CrossRef] [Scilit]
- Wu, Y.; Xu, G.; Wei, W.; Gao, Y.; Ma, J.; Wang, Y.; Sun, Y. Graphene oxide (GO) doped CeO2 as potential enhancer of methyl orange degradation. Fuller. Nanotub. Carbon Nanostruct. 2019, 27, 411–418. [Google Scholar] [CrossRef] [Scilit]
- Kalaycıoğlu, Z.; Gao, Y.; Yılmaz, S.; Erim, F.B.; Özçoban, M.Ş. Efficient photocatalytic degradation of methylene blue dye from aqueous solution with cerium oxide nanoparticles and graphene oxide-doped polyacrylamide. ACS Omega 2023, 8, 6721–6730. [Google Scholar] [CrossRef] [Scilit] [PubMed]
- Rodwihok, C.; Wongratanaphisan, D.; Ngo, Y.L.T.; Khandelwal, M.; Hur, S.H.; Chung, J.S. Cerium-oxide-nanoparticle-decorated zinc oxide with enhanced photocatalytic degradation of methyl orange. Appl. Sci. 2020, 10, 1697. [Google Scholar] [CrossRef] [Scilit]
- Alwan, R.M.; Kadhim, Q.A.; Sahan, K.M. Synthesis, characterization and evaluation of photo degradation efficiency of reduced graphene oxide-cadmium sulfide nanocomposite. IOP Conf. Ser. Earth Environ. Sci. 2022, 1029, 012032. [Google Scholar] [CrossRef] [Scilit]
- Jayakumar, G.; Irudayaraj, A.A.; Raj, A.D. Investigation on the synthesis and photocatalytic activity of activated carbon-cerium oxide (AC-CeO2) nanocomposite. Appl. Phys. A 2019, 125, 742. [Google Scholar] [CrossRef] [Scilit]
- Manthiri, V.K.; Sudhakar, C.; Reddy, M.V.R.; Reddy, K.V.; Reddy, P.V.; Reddy, B.P. Nanoengineered rGO decorated Y2O3-CeO2 ternary heterojunction nanocomposites for enhanced photocatalytic and antibacterial applications. Ceram. Int. 2025, 51, 8234–8247. [Google Scholar] [CrossRef] [Scilit]
- Abimannan, M.; Radhakrishnan, S.; Yoo, D.J.; Balakumar, S. Structural, optical, morphological and charge transfer properties of CeO2/MWCNTs nanocomposite and their photocatalytic activity of organic dye degradation. J. Sol-Gel Sci. Technol. 2022, 104, 813–825. [Google Scholar] [CrossRef] [Scilit]
- Shoran, S.; Sharma, V.; Jasrotia, R.; Kumari, P.; Chaudhary, S.; Kumar, R. Photocatalytic dye degradation and antibacterial activities of CeO2/gC3N4 nanomaterials for environmental applications. Environ. Sci. Pollut. Res. 2022, 29, 88675–88688. [Google Scholar] [CrossRef] [Scilit] [PubMed]
- Malekkiani, M.; Salehi, M.; Asadi, E.; Ganjali, M.R. Fabrication of graphene-based TiO2@CeO2 and CeO2@TiO2 core-shell heterostructures for enhanced photocatalytic activity and cytotoxicity. ACS Omega 2022, 7, 34338–34350. [Google Scholar] [CrossRef] [Scilit] [PubMed]
- Al-Wafi, R.; Awwad, N.S.; Alshahrani, T.; Ibrahium, H.A.; Alahmari, S.D. Superior dye degradation for wastewater treatment based on nanocomposites of cerium oxide, gadolinium oxide and graphene oxide. Ceram. Int. 2023, 49, 7582–7593. [Google Scholar] [CrossRef] [Scilit]
- Senthil, T.S.; Anandhan, N.; Vigneshwaran, P.; Arulmozhi, R. Enhanced ferromagnetic property at room temperature and photocatalytic efficiency of CdO/CeO2/PVP nanocomposite. J. Supercond. Nov. Magn. 2020, 33, 2031–2039. [Google Scholar] [CrossRef] [Scilit]
- Phadi, P.S.; Yadav, A.A.; Jadhav, L.D. Nanocomposite of CeVO4/BiVO4 loaded on reduced graphene oxide for the photocatalytic degradation of methyl orange. J. Clust. Sci. 2021, 33, 2489–2502. [Google Scholar] [CrossRef] [Scilit]
- Alshahrani, T.; Alrowaili, Z.A.; Eke, C. Efficient photocatalytic degradation of methyl orange using cost-effective CQDs/CeO2 nanocomposites synthesised via sol-gel and hydrothermal methods. Pramana 2025, 99, 27. [Google Scholar] [CrossRef] [Scilit]
- Jiang, Y.; Li, X.; Wang, X.; Zhang, L.; Chen, J. A novel nano-cerium oxide functionalized biochar composite for degradation of organic dye: Insight of the photocatalysis mechanism. SSRN Electron. J. 2023. [Google Scholar] [CrossRef] [Scilit]
- Onwudiwe, D.C.; Nthwane, Y.B.; Ebenso, E.E. Ce2O3/BiVO4 embedded in rGO as photocatalyst for the degradation of methyl orange under visible light irradiation. J 2021, 4, 165–180. [Google Scholar] [CrossRef] [Scilit]
- Fauzia, V.; Yusnidar, Y.; Lalasari, L.H.; Subhan, A.; Umar, A.A. Antibacterial and sunlight-driven photocatalytic activity of graphene oxide conjugated CeO2 nanoparticles. Sci. Rep. 2024, 14, 4905. [Google Scholar] [CrossRef] [Scilit] [PubMed]
- Latif, S.; Nawaz, R.; Aziz, M.H.; Asif, M.; Noor, F.; Aligayev, A.; Ali, S.M.; Alam, M.; Papanikolaou, S.; Huang, Q. Evaluation of tetracycline photocatalytic degradation using NiFe2O4/CeO2/GO nanocomposite for environmental remediation: In silico molecular docking, antibacterial performance, degradation pathways, and DFT calculations. Sep. Purif. Technol. 2024, 350, 128074. [Google Scholar] [CrossRef] [Scilit]
- Kadian, S.; Arya, A.; Manik, G.; Chauhan, R.P.; Devi, S. Synergistically enhanced photocatalytic properties of Co3O4-G/GO nanocomposites: Unravelling their interactions and charge-transfer dynamics using XAS. Dalton Trans. 2024, 53, 11791–11806. [Google Scholar] [CrossRef] [Scilit] [PubMed]
- Hao, Y.; Pham, T.T.; Tran, T.K.N.; Pham, T.D. Synthesis of CeO2 coupling rGO material oriented to rhodamine B degradation under optical irradiation. VNU J. Sci. Nat. Sci. Technol. 2024, 40, 1–10. [Google Scholar] [CrossRef] [Scilit]
- Aguilar-Maruri, A.N.; Dávalos-Olivares, F.; Jiménez-Miramontes, J.A.; Hernández-Hernández, A.A.; Rodríguez-González, C.A.; Navarro-Badilla, A.; Gutiérrez-Becerra, A. Photodegradation of methylene blue using carbonized bagasse doped with cerium oxide nanoparticles. Environ. Res. 2025, 267, 122977. [Google Scholar] [CrossRef] [Scilit] [PubMed]

Disclaimer/Publisher’s Note: The statements, opinions and data contained in all publications are solely those of the individual author(s) and contributor(s) and not of MDPI and/or the editor(s). MDPI and/or the editor(s) disclaim responsibility for any injury to people or property resulting from any ideas, methods, instructions or products referred to in the content. |
© 2026 by the authors. Licensee MDPI, Basel, Switzerland. This article is an open access article distributed under the terms and conditions of the Creative Commons Attribution (CC BY) license.