


Abstract
The photocatalytic degradation of the 2,5-diphenyl-1,3-oxazole (PPO) and 2-(4-biphenyl)-5-phenyl-1,3,4-oxadiazole (PBD), which are laser dyes and scintillator compounds, was investigated under ultraviolet (UV) light irradiation using pure and rare-earth (Sm3+, Eu3+, and Gd3+)-modified zinc oxide (ZnO) hierarchical flower-like microstructures. The synthesized photocatalysts (powder) were characterized by scanning electron microscopy (SEM), energy-dispersive X-ray spectroscopy (EDS), and X-ray diffraction (XRD), confirming the formation of flower-like ZnO structures and successful modification by the oxides Sm2O3, Eu2O3, and Gd2O3. Residual concentrations of Zn2+, Gd3+, Sm3+, and Eu3+ in the treated aqueous solutions were determined by ICP-MS to evaluate catalyst stability, while chemical oxygen demand (COD) analysis was used to assess mineralization efficiency. For both PPO and PBD, the photocatalytic activity followed the order ZnO < ZnO/Gd2O3 < ZnO/Sm2O3 < ZnO/Eu2O3, which can be attributed to the enhanced charge separation and reduced electron–hole recombination caused by rare-earth ions, with Eu3+ providing the most effective electron trapping. PPO showed faster degradation than PBD, mainly due to the structure of the PBD molecule, which is more rigid and conjugated, owing to its higher resistance to oxidative degradation.
1. Introduction
The increasing release of persistent organic contaminants into aquatic environments has become a major environmental concern. Among the hazardous organic pollutants, aromatic heterocyclic compounds used as laser dyes and scintillation materials attract growing attention because of their high chemical stability and resistance to conventional wastewater treatment processes [1,2,3,4,5,6]. Various laser dyes and scintillators may have been in use for a long time or have expired; however, for various reasons, they may not have been subjected to appropriate degradation or disposal. Considering the potential harmful effects of such chemicals, their efficient removal from aqueous environments is required.
Scintillation compounds such as 2,5-diphenyl-1,3-oxazole (PPO) and 2-(4-biphenyl)-5-phenyl-1,3,4-oxadiazole (PBD) are widely applied in various fields, particularly in radiation detection systems, nuclear security, medical diagnostics, photodynamic therapy, sensors, non-linear optical convertors and other optical devices [7,8,9,10]. Their highly conjugated aromatic structures contribute to increased persistence in aquatic systems and may pose environmental risks. However, studies concerning their removal from water are still limited.
PPO and PBD are some of the most used fluorophores [11,12]. These well-known commercially available fluors, belonging to the class of p-oligophenylenes, are highly efficient laser dyes emitting in the range of 330–420 nm, i.e., in the wavelength region from the very near ultraviolet (UV) to the violet region of the visible spectrum. As powerful laser emitters, they demonstrate high efficiency, large Stokes shifts, and good photochemical stability (over 104 J/L). That is why these chemical compounds are used as efficient UV laser dyes in liquid solutions and in solid-state matrices, as well as for light wavelength shifters, exhibiting a high resistance to oxygen-induced fluorescence quenching. As scintillators, PPO and PBD are commonly used as primary fluors in very efficient detectors (in both liquid and plastic media) for alpha-, beta- and gamma-rays, as well as for neutrons and neutrinos [13,14,15,16,17,18]. However, the organic dye-scintillators of expired necessity may pose problems. This issue can be efficiently solved by their photocatalytic degradation. Significantly, such a removal method by chemical decomposition has not yet been reported for PPO and PBD.
Heterogeneous photocatalysis is considered one of the most effective advanced oxidation processes for the degradation of recalcitrant organic pollutants and hazardous organic compounds [19,20,21,22,23]. Semiconductor photocatalysts generate reactive oxygen species under light irradiation, resulting in the oxidation and mineralization of organic contaminants. Among the investigated photocatalytic materials, zinc oxide (ZnO) has attracted significant interest due to its low cost, non-toxicity, strong UV absorption, and high electron mobility [6,24,25,26]. Nevertheless, pristine ZnO suffers from rapid electron–hole recombination and photocorrosion, which limit its photocatalytic efficiency [27]. The photocatalytic activity of ZnO strongly depends on its morphology and structural properties. Hierarchical flower-like ZnO structures provide a high specific surface area, abundant active sites, and improved light harvesting, resulting in enhanced photocatalytic performance [28,29]. To further improve charge separation and suppress electron–hole recombination, various ZnO modification strategies have been explored, including rare-earth oxide modification [30,31,32]. Due to their unique 4f electronic configuration, lanthanide ions (Ln3+) may act as electron traps and influence defect structures and charge-transfer processes, thereby enhancing photocatalytic activity [33,34,35]. In recent years, heterogeneous photocatalysis has expanded beyond conventional pollutant degradation toward the development of multifunctional photocatalytic systems for environmental remediation and sustainable energy applications. Recent studies have high-lighted the design of advanced photocatalysts with improved charge separation, enhanced stability, and broader applicability in water purification and solar energy conversion [36,37].
Rare-earth-modified ZnO systems containing Eu3+, Sm3+, and Gd3+ are particularly promising because these ions can influence charge carrier separation, defect structures, and luminescence properties [34,38]. Previous studies have demonstrated enhanced degradation of dyes and pharmaceutical pollutants using lanthanide (Ln)-modified ZnO photocatalysts [39]. However, investigations focused on the photocatalytic degradation of scintillation compounds using such ZnO-based structures remain scarce.
Very recently, a nanostructured catalytic material based on ZnO modified with neodymium oxide (Nd2O3) was successfully synthesized as flower-like microparticles with a large specific surface area [40]. This material demonstrated enhanced tribocatalytic activity compared with pristine ZnO, highlighting the potential of rare-earth-modified ZnO flower-like structures [40]. In the present work, we propose the synthesis of other hierarchical flower-like ZnO structures modified with oxides of rare-earth elements, namely Samarium (Sm), Europium (Eu), and Gadolinium (Gd), for efficient photocatalytic applications. The photocatalytic activity of these materials toward the degradation of the organic dyes PPO and PBD in aqueous media under UV irradiation was investigated. Particular attention was paid to elucidating the influence of rare-earth oxide modification on charge separation and photocatalytic efficiency. A comparative study of the two dyes, PPO and PBD, was conducted to examine how differences in the degree of conjugation, and heterocyclic functional groups affect the photocatalytic degradation behavior. The use of pure and rare-earth-modified ZnO catalysts enabled assessment of the effect of rare-earth incorporation on charge separation efficiency, reactive oxygen species generation, and overall photocatalytic performance during the UV-induced degradation process.
2. Results and Discussion
2.1. Microstructural, Morphological and Elemental Characterization
Figure 1 presents XRD patterns of the synthesized pristine ZnO and the modified ZnO/Gd2O3, ZnO/Sm2O3, and ZnO/Eu2O3 powders, recorded over the 2θ range of 25–75°. Samples of these four catalyst powders exhibit defined diffraction peaks characteristic of the hexagonal wurtzite structure of ZnO, confirming the formation of a highly crystalline phase. The main reflections located at approximately 31.8°, 34.4°, 36.3°, 47.5°, 56.6°, 62.8°, 66.4°, and 68.0° can be assigned to the (100), (002), (101), (102), (110), (103), (200), and (112) crystallographic planes, respectively, in agreement with the standard JCPDS card No. 36–1451 for ZnO [25]. The most intense diffraction peak in XRD pattern (Figure 1), centered at approximately 36.3°, corresponds to the (101) plane, typical of polycrystalline ZnO with preferential orientation along the c-axis.
Figure 1.
XRD scans for the synthesized pure ZnO and rare-earth-modified ZnO powders.
After modification with rare-earth oxides, no significant shifts in the positions of the main ZnO diffraction peaks are observed, indicating that the crystal structure of ZnO remains stable upon incorporation of Gd2O3, Sm2O3, and Eu2O3. Nevertheless, additional weak reflections attributable to the corresponding rare-earth oxide phases are detected. For the ZnO/Gd2O3 sample, diffraction peaks appearing around 28–29° and 33° are characteristic of the cubic C-type structure of Gd2O3 [41,42]. Similarly, weak reflections associated with Sm2O3 are observed in the ZnO/Sm2O3 sample, whereas the ZnO/Eu2O3 composite exhibits characteristic peaks corresponding to Eu2O3, confirming the successful formation of the composite materials.
The absence of pronounced peak shifts in ZnO suggests that the rare-earth ions do not substantially substitute Zn2+ within the ZnO lattice. Furthermore, the high intensity and relatively narrow width of the diffraction peaks indicate good crystallinity of the synthesized materials. The presence of rare-earth oxides on the ZnO surface may contribute to the formation of interfacial regions and defect-related sites, which can influence charge-carrier separation and migration processes. Similar effects have been reported for rare-earth-modified ZnO photocatalysts, where the presence of Ln species or the formation of ZnO/Ln2O3 interfaces was associated with reduced electron–hole recombination and improved photocatalytic performance [43,44].
Based on the XRD data, the crystallite size of the synthesized materials was estimated using the Scherrer equation. The crystallite size values were calculated as the arithmetic mean obtained from the three most intense diffraction peaks of each sample. The calculated crystallite sizes reveal a gradual decrease from 58 nm for pristine ZnO to 55 nm for ZnO/Gd2O3 and ZnO/Eu2O3, and further to 50 nm for ZnO/Sm2O3 (Table 1). This reduction in crystallite size after rare-earth oxide modification suggests that the presence of Ln species during synthesis may influence crystal growth and promote the formation of smaller ZnO crystallites. In general, smaller crystallite dimensions may provide a higher density of surface-active sites, which can be beneficial for catalytic processes. The reduced crystallite size may also contribute to shorter diffusion pathways for photogenerated charge carriers and facilitate charge-transfer processes, thereby decreasing the probability of electron–hole recombination. Furthermore, nanoscale crystallites may contain a higher concentration of structural defects and oxygen vacancies, which can act as charge-trapping sites and influence the separation efficiency of photogenerated carriers.
Table 1.
Crystallite size, optical band gap, roughness exponent, and texture autocorrelation length calculated for ZnO and rare-earth-modified ZnO nanoflower photocatalysts.
The surface morphology of pristine ZnO and rare-earth-modified ZnO powders (ZnO/Gd2O3, ZnO/Sm2O3, and ZnO/Eu2O3) was inspected by scanning electron microscopy (SEM). Representative SEM images of the synthesized powder catalysts are presented in Figure 2. The SEM micrographs of all samples display well-defined single particles with oval shape and most of them were nearly spherical. Their sizes were mostly between 1 and 3 μm. The microparticles exhibit pronounced surface roughness and porosity—fine internal texture that defines a large specific surface area. The particles are apparently nanostructured and their surface morphology consists of randomly distributed and non-ordered nano-objects. They most likely consist of these nanostructures are densely located thin nanosheets and interconnected nanograins, which may contribute to an increased accessible surface area.
Figure 2.
SEM images (along with real image scale) for the studied hierarchical flower-like microstructures of pristine and rare-earth-modified ZnO photocatalysts: (a) ZnO; (b) ZnO/Gd2O3; (c) ZnO/Sm2O3, and (d) ZnO/Eu2O3.
The observed three-dimensional (3D) flower-like complex architectures consist of non-radially oriented nanosheets forming highly corrugated surfaces with interconnected pores between adjacent nanosheets. These hierarchical structures resemble chrysanthemum-like morphologies, where multiple nanosheets with thicknesses of approximately 50–70 nm assemble into complex 3D nanostructures. Such hierarchical organization can provide abundant surface-active regions and facilitate mass transport during photocatalytic reactions [45]. The observed hierarchical flower-like architectures are characteristic of self-organized ZnO structures and have been reported for ZnO materials, including those modified with lanthanide oxides [40]. Such flower-like micro/nanostructures are considered advantageous for catalytic applications because their hierarchical organization may provide an increased accessible surface area and numerous exposed active sites. The assembly of nanosheets creates interconnected channels and exposed crystal edges, resulting in a highly textured and porous morphology.
SEM images reveal that the synthesized catalyst powders exhibit a non-uniform particle size distribution (Figure 3). The pristine ZnO sample contains a higher fraction of smaller particles (Figure 3a), while their relative fraction appears to decrease after modification with rare-earth oxides (Sm2O3, Eu2O3, and Gd2O3). However, no significant differences in the overall particle size range are observed among the rare-earth oxide-modified ZnO samples (Figure 3b–d). The mean size (d) of the particles was about 2 μm. Since the particle distribution for isotropic powders, such as those investigated here (as well as for granular and colloidal systems), is usually interpreted as log-normal, Figure 3 reports the log-normal fits to the corresponding particle size distribution.
Figure 3.
Histograms showing the size distribution for the particles of the synthesized ZnO (a); ZnO/Gd2O3 (b); ZnO/Sm2O3 (c); ZnO/Eu2O3 (d) (relevant for the SEM micrographs in Figure 2). The values of the mean size (d) and standard deviation (sd) of the particle size distribution calculated for the studied catalyst powders are shown in the graphs. The red lines are the log-normal fits to the size distribution; the parameters of the log-normal distribution function: xc (location parameter, expected value; mean of the associated normal distribution) and σ (standard deviation of the associated normal distribution; scale parameter, shape) are also given in the graphs.
The qualitative/semi-quantitative elemental composition of the synthesized ZnO-based materials was examined by energy-dispersive X-ray spectroscopy (EDS), and the corresponding spectra are presented in Figure 4. The EDS spectra show the presence of Zn and O as the principal constituent elements in all analyzed samples, confirming the formation of ZnO. In addition, characteristic signals of Gd, Sm, and Eu were detected in the corresponding ZnO/Gd2O3, ZnO/Sm2O3, and ZnO/Eu2O3 samples, respectively, indicating the presence of the introduced rare-earth elements within the analyzed surface regions. It should be noted that EDS is a localized surface analytical technique and therefore provides qualitative information on the elemental composition of the analyzed areas rather than definitive evidence of homogeneous elemental distribution or overall chemical purity of the materials. No additional impurity-related peaks were detected within the detection capability of the EDS measurements in the analyzed regions. These results are consistent with the successful modification of the corresponding rare-earth elements into the synthesized ZnO-based photocatalysts.
Figure 4.
EDS spectra of pure ZnO (a) and ZnO modified with Gd2O3 (b); Sm2O3 (c); Eu2O3 (d).
2.2. Fourier Analysis and Micro/Nano Structural Statistics
To further characterize the morphology of the studied hierarchical micro/nanostructured powder photocatalysts, in addition to real-space image analysis, a two-dimensional fast Fourier transform (2D FFT) analysis of the recorded SEM images was performed. Fourier-space analysis is a useful approach for evaluating spatial periodicities, textural features, and characteristic structural arrangements present in SEM micrographs of hierarchical materials. In the present case, the FFT patterns provide additional information about the nanosheet organization and characteristic length scales associated with the internal architecture of the flower-like microparticles. However, due to the complex hierarchical morphology of the ZnO-based photocatalysts, careful interpretation of the FFT results is required, since the observed spatial features may reflect both the primary nanoscale building units and the overall organization of the assembled microstructures. Therefore, the FFT analysis was considered complementary to the direct SEM observations and particle size distribution analysis.
2.2.1. Size Distribution Function P(d)
For more statistically representative FFT analysis, we analyzed SEM micrographs containing a larger number of synthesized flower-like microparticles (Figure S1). The corresponding 2D FFT patterns are presented in Figure S2. The observed FFT images feature a bright center and diffuse concentric rings due to isotropic radial periodicities, which are characteristic of ensembles of nearly spherical objects present in the SEM micrographs. The concentric rings of alternating maximum and minimum intensities contain information on the characteristic particle dimensions and size distribution. The intense central region together with the surrounding diffuse halo reflects the predominant particle size and the degree of size dispersion within the analyzed samples.
The radial intensity profiles of the FFT patterns for the four photocatalyst powders (Figure 5) suggest that the minimum, maximum, and average particle sizes are very similar, and most likely their microscale size distribution is comparable. However, the FFT pattern of ZnO/Eu2O3 (Figure S2d) displays a slightly broader diffuse ring (Figure 5), i.e., these particles are characterized with a broader distribution for the statistically polydisperse submicron-scaled morphology objects in the SEM images, and most probably the smallest of these objects have a smaller size compared to the submicron-scaled morphology objects of the studied ZnO, ZnO/Gd2O3, and ZnO/Sm2O3 nanoflowers.
Figure 5.
Cross-sectional intensity profiles of the radial FFT patterns from Figure S2 for the studied powder samples.
To some extent, the particle size distribution in the SEM images from Figure S1 can be characterized through FFT analysis. Figure S3 presents the corresponding size distribution functions (probability density, P(d)) derived from the radial characteristics of 2D FFT patterns. FFT-inferred P(d) should be regarded as a statistically averaged description of the hierarchical morphology rather than a direct measurement of individual microflower diameters. The results for P(d) confirm the polydisperse nature of the particle populations in the four photocatalyst samples, however, P(d) and the corresponding mean particle sizes differ considerably from those obtained using direct counting of the particles (Figure S4). In the latter case, within the statistical error, the mean particle size (d) in the pure and rare-earth-modified ZnO was similar, about 2.1 μm, which is in a good agreement with d estimated in Section 2.1 (recall Figure 3), and there is no clear evidence of its change after the modification of ZnO nanoflowers with rare-earth oxides. It should be noted that for such hierarchical structures, the real-space analysis can provide a more reliable estimate of the particle-size distribution, whereas the Fourier transform reflects dominant spatial frequencies rather than individual particle boundaries, and the FFT derived distribution is only an indirect representation of the structural length scales (see the additional explanations in Supplementary Materials, Section S2).
Nevertheless, the FFT analysis provides physically meaningful complementary information. In particular, the histograms in Figure S3 suggest the presence of smaller characteristic dimensions associated with submicron scaled structural features, since they are dominated by high-spatial-frequency components the FFT derived P(d). These characteristic dimensions are consistent with the diffuse ring observed in the FFT patterns. Thus, the FFT based analysis is capable of resolving submicron characteristic length scales (~ 0.3 μm), as the Fourier transform of the SEM morphology is highly sensitive to the intrinsic surface texture, nanoscale roughness, and local high-frequency intensity variations. Accordingly, in this case the FFT analysis predominantly reflects the characteristic wavelength of the needle-like surface texture, the local nanoscale roughness and hierarchical nanostructure rather than the outer diameters and geometric envelopes of the individual microflowers. In our case, the contour-based real-space analysis provides the most reliable estimate of the particle-size distribution, whereas the FFT-derived distributions complement this information by characterizing the dominant structural length scales and the hierarchical organization of the synthesized photocatalysts.
2.2.2. Power Spectral Density (PSD) Analysis
FFT analysis alone is not sufficient for direct particle-size determination or particle counting (e.g., via contour-based segmentation), but can provide valuable information about the surface texture and morphology, in particular, for the nanoflowers under study. The analysis of dense and hierarchical SEM structures (such as the powder photocatalysts investigated here, characterized by strong internal non-radial nanomorphology, non-ideally spherical, complexly textured particles, particle contact, large polydispersity, and pronounced high-spatial-frequency components in the Fourier spectrum) can be effectively performed using radial FFT power spectral density (PSD) statistics [46,47].
FFT/PSD radial analysis reveals the dominant spatial frequencies, which correspond to the characteristic structural length scales, characteristic spacing, and possible evidence of multiscale organization. By analyzing the spatial-frequency distribution, the 2D PSD approach enables quantitative characterization of the surface texture, roughness, and hierarchical organization of the studied nanotextured microflowers over multiple spatial scales represented in the Fourier spectrum. Thus, the characteristic structural length scales identified by the FFT provide statistically averaged descriptors of the hierarchical morphology. The SEM images of the studied nanoflowers are indeed suitable for this type of morphology-oriented 2D Fourier analysis, as they simultaneously exhibit well-defined mesoscale organization, multi-scale hierarchical texture, and repeating nanoscale structural features in the form of needle-like nanostructural subunits.
For the SEM images shown in Figure S1, the 2D power spectral density, PSD(q) = |F(q)|2, where F(q) is the complex amplitude of the 2D Fourier transform, was obtained, and radial averaging was subsequently performed. Figure 6a presents the resulting PSD curves as a function of the spatial frequency, q, as derived by calibrated radial PSD for the structures observed in these images. The radial PSD spectra show a broad low-frequency hump in the range of q ≈ 0.1–1 μm−1 with a maximum located around 0.5 μm−1 corresponding to a characteristic structural length scale of approximately 2 μm in real space (d = 1/q). In the high-frequency (HF) range, the PSD(q) spectra in Figure 6a follow an approximately power-law decay, indicating the presence of structural features over multiple length scales.
Generally, the broad PSD hump is associated with structures exhibiting a characteristic length scale, whereas the presence of power-law dependence in the PSD spectrum is characteristic of hierarchical or self-affine structures [47,48]. In the present case, the SEM images represent an intermediate morphology with multi-scale organization: a well-defined characteristic structural length scale is observed (which is reflected in the PSD maximum), together with a secondary level of needle-like nanostructural organization, which gives rise to the observed power-law functional dependence. The almost linear behavior of PSD(q) in the log-log representation (Figure 6a) in the HF range indicates that no single characteristic size dominates within the corresponding spatial-frequency range and that the structure exhibits a certain degree of scale invariance.
In our case, at q > 1 μm−1 the PSD is predominantly governed by the needle-like surface texture, whereas at q < 1 μm−1 the overall morphology of the hierarchical micro/nanoflowers becomes dominant. The HF-q texture regime begins at qtexture ≈ 1.5–2 μm−1 (corresponding to characteristic structural length scales of d = 1/q ≈ 0.7– 0.5 μm) and is primarily associated with the needle-like nanostructural subunits and the local surface roughness related to them. No clearly defined characteristic spacing was detected in the HF-q range, as well as no second structural level. The PSD(q) spectra show only a roughness scaling.
As seen from Figure 6a, the four powder photocatalysts investigated in this work exhibit similar PSD(q) spectra. This similarity reflects the comparable hierarchical morphology of the synthesized materials, which is expected considering that they were prepared using the same synthesis procedure. In particular, similar values of the exponential factor β were obtained from fitting the PSD curves according to the relationship PSD(q) ~ q−β in their HF range. As known, β is widely used as a quantitative descriptor of surface roughness and hierarchical organization [47,48].
In the intermediate HF range 2 μm−1 < q < 10 μm−1 (where the PSD is strongly dominated by the needle-like texture and local roughness, not by the diameter of the microspheres), the obtained values of β were between 3.2 and 3.75 (Table 1), which correspond to highly correlated hierarchical structures and are usually associated with multi-scale organization. The very similar slopes of the radial PSD(q) spectra (Figure 6a) mean that no significant differences in the morphometric characteristics of the investigated photocatalysts can be found and indicate that the four powders possess very similar characteristic microflower dimensions, comparable surface roughness statistics, and nearly identical needle-like hierarchical substructures. It is worth noting that the β values for lanthanide-modified ZnO nanoflowers were higher than the one for pure ZnO. If the differences in the values of β for the four analyzed samples are below ~5–10%, they are probably on the limit of statistical significance. It should also be noted that, within the statistical tolerance, the ZnO/Eu2O3 sample was characterized with highest value of β among the nanoflowers studied here (Table 1), suggesting a possible specificity in its hierarchical surface organization.
A possible difference between the roughness statistics could be more clearly resolved by means of angular PSD analysis. We extended the statistical investigation by performing high-frequency (HF) annular FFT/PSD, which is particularly sensitive to nanostructural features rather than microstructural ones. By analyzing the angular distribution of spatial frequencies, the HF annular PSD enables separation of the contributions arising from the overall microflower morphology, the surface nanotexture, and the local roughness over different spatial scales represented in the Fourier spectrum. That is why, we tried to analyze the nanostructural morphology by HF FFT/PSD fitting.
In our case, the fine-texture frequency band corresponds to approximately q ≈ 1.5–5 μm−1 (d = 1/q = 700–200 nm), whereas the superfine-texture regime extends to q > 5 μm−1 (d < 200 nm). The exponent βHF, obtained by fit of the log-log HF PSD corresponding to the 1 μm−1 < q < 10 μm−1 annulus can be a quantitative descriptor of the surface nanotexture. Unlike the total exponential factor β in the radial PSD (discussed above), the texture roughness exponent βHF in this case should be a quantitative morphology descriptor that characterizes only the high-frequency regime and therefore specifically reflects the surface nanotexture. Within the range 1 μm−1 < q < 10 μm−1, the annular HF PSD spectra of all four samples were approximately linear in the log-log representation.
However, the values we obtained for βHF differ by less than 3% and are at the limit of statistical significance, i.e., there is no physically reasonable real difference between the texture roughness of the samples. For a PSD roughness fitting, this is a relatively small scatter. So, the strict HF annular PSD does not distinguish convincingly the four studied photocatalytic materials even, when SEM images of the nanoflowers recorded at higher SEM magnification were analyzed. Therefore, this statistics does not allow clear conclusions regarding the surface nanotexture, as well as on the hierarchical organization of the investigated nanoflowers. One can accept that the particles of the samples of the four studied powder photocatalysts have a comparable surface roughness and nanomorphology. In any case, HF PSD analysis confirmed the formation of hierarchical flower-like morphologies of the synthesized photocatalysts.
2.2.3. Autocorrelation Function (ACF) Statistics
The possible textural differences in the produced nanoflowers are probably too local to be characterized by the roughness exponent βHF. In this case, βHF provides a useful global descriptor of the surface texture, but its sensitivity to subtle local variations in this specific type of needle-like hierarchical nanoscale organization is limited. Therefore, the PSD analysis of the four SEM images presented in Figure S1 indicates similar roughness scaling behavior among the investigated photocatalysts. To further evaluate the nanoscale organization of the surface features, the morphology of the flower-like microparticles was additionally analyzed using 2D autocorrelation function (ACF) statistics.
ACF analysis, calculated through Fourier transformation, provides complementary information regarding spatial correlations and characteristic structural dimensions. Thus, PSD analysis describing spectral scaling behavior was combined with ACF analysis to evaluate characteristic spatial lengths of the hierarchical surface organization. To minimize the influence of the overall microparticle geometry on the ACF results, the analysis was performed on the images of individual flower-like microparticles selected from the SEM images shown in Figure S5. The values of the corresponding autocorrelation length (Lc) are summarized in Table 1. They were calculated using the same threshold criterion for all samples. Lc is a sensitive real-space parameter for describing the spatial organization of nanoscale surface features of needle-type textures and provides information about local structural correlations. The nanomorphology differences between the investigated materials are mainly related to variations in nanoscale organization, which may not be fully resolved by PSD analysis alone. The calculated Lc values (Table 1) show a clear and convincing difference of 20–30% for the studied photocatalyst nanoflowers, which is already a real morphological difference beyond statistical error and is a physically interpretable result. These variations indicate differences in the local spatial organization of the nanoscale surface features within the hierarchical flower-like structures.
Like the roughness exponent β, the Lc value calculated for the ZnO/Eu2O3 nanoflower was higher than Lc for the nanoflowers of the other three samples, while pristine ZnO exhibited the shortest Lc (Table 1). Higher Lc values are associated with more organized texture, while a more chaotic texture is supposed to show a shorter Lc. For needle texture, Lc means the size of the local texture domain (texture cluster) where the locations of the needles is still interrelated in a certain arrangement. Since the needle texture dominates in the considered nanoflowers in the SEM images in Figure S5, Lc is correlated to the characteristic spacing between the needles, as well as to the size of a local domain (needle bundle). Also, in our SEM images, Lc could be interpreted as an indirect measure of needle density, or under certain conditions and assumptions—even in the sense of roughness or fluffiness. In these interpretations of Lc, the obtained results for Lc imply that the ZnO/Eu2O3 sample exhibits a more organized, less chaotic nanotexture, a more spatially interrelated nanostructure that has larger textural clusters (needle bundles). This could be a random result of the synthesis, but it could also be accepted that such a surface-related property may still contribute to an enhanced photocatalytic activity.
In our case, Lc provides a quantitative descriptor of the nanoscale texture, which allows us to extract a statistical difference between different nano-morphologies and is significantly more useful than the roughness exponent βHF, which turned out to be very close for the morphologies of our different samples. Namely the spatial organization of the hierarchical surface features is the information which PSD often misses, but ACF provides. In this context, it is interesting to know whether PSD statistics may detect a difference in the needle-network morphology, local nano-roughness, and nanotexture hierarchy of the same individual nanoflowers selected in Figure S5 (discussed in the following Section 2.2.4).
2.2.4. Hierarchical Morphology of the Nanoflowers Nanotexture
Figure 6b illustrates the average radial PSD(q) spectra obtained for the individual SEM images of the single nanoflowers shown in Figure S5. As can be seen, the four selected nanoflowers exhibit a similar nanomorphology with a morphology peak and dominant characteristic scale at q ≈ 2–3 μm−1 (d ≈ 500–300 nm), and, most likely, secondary shoulders in the range q ≈ 5–20 μm−1. Furthermore, distinct humps at q ≈ 20 μm−1 and q ≈ 200 μm−1 take place in the HF range up to the noised HF region (at q > 400 μm−1) of the strongly reduced Signal-to-Noise ratio (SNR) (Figure 6b). These broad humps are related to a clearly defined characteristic needle spacing (d ≈ 50 nm and d ≈ 5 nm, respectively) and are associated with the fine and ultrafine surface texture and nanoscale substructures of the studied hierarchical nanoflowers. While the broad main hump at q ≈ 2–3 μm−1 can be attributed to the characteristic length of the needle-like formations of the nanoflowers (Figure 6b), the needle-spacing signature at q ≈ 20 μm−1 can be related to the spacing between the needles, as well as to their characteristic width/thickness. The second needle-spacing signature (at q ≈ 200 μm−1) can be ascribed to a scale, where the internal nanostructure of the needles themselves most probably dominates. The texture bandwidth at the two HF humps is relatively large, which corresponds to a real multi-level hierarchical texture.
In fact, two different PSD regions are observed at both HF texture shoulders (Figure 6b), as well as a change in the slope of the PSD curves. Significantly, the slopes of the log-log PSD(q) curves are similar for the analyzed nanoflowers of the four studied photocatalysts, but at the shoulders the slopes become steeper, signifying another distinct nanotexture scale. All these features are indicators of the presence of a second hierarchical structural level. Hence, for these nanoflowers there is a clear hierarchy signature with two distinct structural levels. The hierarchical-level detection is often more informative about the nanotexture than the roughness statistics and the exponent β itself. Moreover, for clear SEM images with a high contrast and high magnification, the PSD statistics may be sensitive to the roughness organization, needle packing, and hierarchical clustering.
2.3. Optical Spectroscopy
Figure 7a presents the UV–Vis diffuse reflectance spectra (DRS) measured for the studied powder photocatalysts to determine their optical band gap (Eg). The DRS show very strong optical absorption of all the four photocatalysts in the spectral range below 375 nm (Figure 7a). Practically, in this range there was no reflection (diffuse), no detectable scattering, nor backward diffraction of light on the powder samples. Importantly, the emission spectrum of the UV lamp (Figure 7d) we employed in the photocatalysis experiments is within this spectral region and matches well the region associated with the absorbance of these samples (Figure 7b). Their absorption spectra (Figure 7b) were derived by conversion of the measured DRS, according to the Kubelka-Munk model with the K-M function defined as: F(R) = K/S = (1 − R)2/2R, where R is the measured total diffuse reflectance data (DRS), and K and S are the K-M absorption and scattering coefficients, respectively [49]. When the light scattering can be considered isotropic and constant, the scattering contribution can be assumed approximately constant (S ~ const), then K can be related to the absorption coefficient of the sample (α), and the Kubelka–Munk function F(R) can be considered proportional to α, allowing further determination of the optical band gap using the Tauc method.
Figure 7.
UV–Vis diffuse reflectance (a) and absorption spectra (b) of pure and rare-earth-modified ZnO photocatalyst powders (ZnO/Gd2O3, ZnO/Sm2O3, and ZnO/Eu2O3); (c) Tauc plots for determination of the optical bandgap energy (Eg); (d) the emission spectrum of the UV lamp employed in the photocatalytic experiments.
The absorption edge in the 375–400 nm spectral region in DRS (Figure 7a) is characteristic of ZnO and corresponds to the electronic transition from the valence band to the conduction band of this semiconductor. The changes observed in the DRS after modification with rare-earth oxides indicate variations in the optical response of the ZnO materials, which may originate from changes in their electronic structure and/or their surface-related properties. Compared with pristine ZnO, the rare-earth oxide-modified samples exhibit lower diffuse reflectance intensity. This applies also to the wavelength region above 375 nm (the threshold) and close to 400 nm (the inflection of the decrease in the optical absorption), which coincides with the long-wavelength wing of the emission spectrum of the UV lamp that we used in photocatalysis experiments (Figure 7d). After Kubelka–Munk transformation, the highest absorption response was observed for ZnO/Eu2O3 (Figure 7b), suggesting enhanced interaction with the incident UV radiation. This increased light absorption, together with the improved charge separation expected from rare-earth modification, may contribute to the higher photocatalytic activity of the Eu2O3-modified ZnO photocatalyst.
Figure 7c shows the Tauc plots for the photocatalysts under study. The calculated Eg values (Table 1) indicate that the optical bandgap energies of the rare-earth-modified ZnO samples are comparable to that of pure ZnO, with the observed variations being within the experimental uncertainty. Similarity can also be expected for the electronic bandgap values of these semiconductor materials, which are typically higher by ~0.1–0.2 eV than the optical bandgap values.
2.4. Photocatalytic Degradation of 2-(4-Biphenyl)-5-phenyl-1,3,4-oxadiazole (PBD) and 2,5-Diphenyl-1,3-oxazole (PPO)
PPO (2,5-diphenyloxazole) and PBD (2-(4-biphenylyl)-5-phenyl-1,3,4-oxadiazole) are widely employed as organic scintillators, wavelength shifters, and fluorescent materials owing to their high fluorescence quantum yield, excellent photophysical properties, and remarkable chemical stability [50,51]. Their highly conjugated aromatic structures provide efficient light emission but simultaneously increase their resistance toward chemical oxidation and conventional degradation processes [52]. Therefore, the degradation of these compounds remains challenging, making advanced oxidation processes, particularly semiconductor photocatalysis, promising approaches for their treatment in aqueous media [53].
The photocatalytic degradation of PBD and PPO was investigated in aqueous solution under UV irradiation within the emission range 350–400 nm of the applied UV lamp (Figure 7d) using pristine ZnO and rare-earth oxide-modified ZnO photocatalysts containing Gd2O3, Sm2O3, and Eu2O3. Figure 8 and Figure 9 present the evolution of the UV–Vis absorption spectra of PBD and PPO, respectively, during photocatalytic treatment. The progressive decrease in the characteristic absorption bands of both compounds with increasing irradiation time indicates a reduction in their concentration during photocatalytic processing.
Figure 8.
UV–Vis absorption spectra during the photocatalytic degradation of 2-(4-biphenyl)-5-phenyl-1,3,4-oxadiazole (PBD) under UV irradiation using pure (a) and rare earth-modified ZnO photocatalysts ((b) Gd2O3, (c) Sm2O3, and (d) Eu2O3).
Figure 9.
UV–Vis absorption spectra of PPO during photocatalytic degradation under UV irradiation in the presence of pure and rare-earth-modified ZnO nanoflowers: (a) ZnO, (b) ZnO/Gd2O3, (c) ZnO/Sm2O3, and (d) ZnO/Eu2O3.
The observed spectral evolution depends on the chemical composition, defect structure, and electronic properties of the investigated ZnO photocatalysts. These factors influence charge carrier separation, the availability of surface-active sites, and the generation of reactive oxygen species involved in photocatalytic oxidation processes [54]. Among the investigated materials, pristine ZnO exhibited the slowest decrease in absorbance intensity for both PBD (Figure 8) and PPO (Figure 9), indicating the lowest photocatalytic activity. This behavior is likely related to the higher probability of electron–hole recombination in pristine ZnO, which limits the availability of photogenerated charge carriers for interfacial redox reactions [55]. Compared with pristine ZnO, all investigated rare-earth oxide-modified ZnO flower-like photocatalysts exhibited enhanced photocatalytic activity toward both PBD and PPO degradation (Table 2). The enhanced photocatalytic performance may be associated with the proposed role of rare-earth modification in facilitating charge separation through the introduction of defect sites, oxygen vacancies, and localized 4f electronic states, which may act as charge-carrier trapping centers and reduce electron–hole recombination [56].
Table 2.
The values of experimentally obtained efficiency (D, %) and the calculated quantum efficiency (η) after 10 min of UV irradiation, as well as the kinetic constant (k) for the photocatalytic degradation of PPO and PBD with pure ZnO and ZnO modified with ZnO/Gd2O3, ZnO/Eu2O3 and ZnO/Sm2O3, performed under the same experimental conditions.
Among the ZnO-based photocatalysts studied here, ZnO/Eu2O3 nanoflowers demonstrated the highest photocatalytic efficiency (D%) for degradation of both PPO and PBD, reaching 84.2% for PBD and 99.5% for PPO after 10 min of UV irradiation. The enhanced activity of ZnO/Eu2O3 is likely associated with the modified electronic structure resulting from rare-earth modification, which has been reported to facilitate charge separation and suppress electron–hole recombination [56]. ZnO/Sm2O3 and ZnO/Gd2O3 photocatalysts also exhibited pronounced enhancement of degradation efficiency (D%) compared with pristine ZnO, although their performance remained slightly lower than that of ZnO/Eu2O3. The improved photocatalytic activity of the rare-earth oxide-modified ZnO materials may be associated with changes in their optical response (as evidenced by DRS, Section 2.3) and corresponding the charge-carrier dynamics resulting from lanthanide oxide modification. The faster decrease in the characteristic PBD and PPO absorption bands when using ZnO/Eu2O3 is consistent with the superior kinetic performance and the higher apparent rate constants for this photocatalytic material as obtained from the kinetic analysis.
The kinetic plots reveal that the degradation of the two dyes/scintillators, PPO and PBD, follows pseudo-first-order reaction kinetics for the four photocatalysts investigated, as evidenced by the linear dependence of ln(C/C0) on the irradiation time (Figure 10). Significant differences in the values of the apparent rate constants (k) are observed depending on the catalyst composition. Pristine ZnO exhibited the lowest kinetic constant (k), indicating lower photocatalytic efficiency, which may be related to the limited separation of photogenerated charge carriers. In contrast, the rare-earth oxide-modified ZnO flower-like photocatalysts showed enhanced degradation kinetics, suggesting a beneficial role of lanthanide modification in improving photocatalytic performance.
Figure 10.
Concentration ratio (C/C0) of PBD (a,b) and PPO (c,d) as a function of UV irradiation time in the presence of pristine and rare-earth-modified ZnO photocatalysts; (b,d) Pseudo-first-order kinetic plots represented as –ln(C0/C) versus irradiation time for the photocatalytic degradation of PBD (b) and PPO (d).
Among the investigated materials, ZnO/Eu2O3 exhibited the highest apparent rate constant and the fastest degradation of both PBD and PPO (Table 2), resulting in the highest photocatalytic efficiency. The ZnO/Eu2O3 photocatalyst achieved almost complete PPO degradation within the applied UV irradiation time based on UV–Vis absorption measurements. The superior kinetic behavior of the Eu-modified photocatalyst may be associated with the presence of Eu3+/Eu2+ redox centers, which have been reported to improve charge separation and facilitate the formation of reactive oxygen species in rare-earth-modified ZnO photocatalysts [32,56].
2.5. Additional Inspection
To estimate possible contributions from non-photocatalytic effects during the degradation experiments of PPO and PBD, three control tests were performed under conditions identical to the photocatalytic experiments. First, in the absence of both photocatalyst and UV irradiation, no significant change in the absorption spectra of PPO and PBD was observed, confirming their high stability in aqueous solution. The second control experiment was performed under UV irradiation in the absence of photocatalyst to evaluate the contribution of direct photolysis. No measurable degradation of the dyes PPO and PBD was detected, which is consistent with the high photochemical stability of these laser dyes/scintillator compounds under UV exposure [57]. The third test was carried out in the presence of photocatalyst but without UV irradiation to evaluate adsorption effects. Limited removal of PPO and PBD was observed: ZnO (3% PPO and 2% PBD), ZnO/Gd2O3 (4% PPO and 3% PBD), ZnO/Sm2O3 (5% PPO and 4% PBD), and ZnO/Eu2O3 (4% PPO and 3% PBD). These results indicate minor adsorption of dye molecules on the catalyst surface and confirm that UV irradiation is required for efficient photocatalytic degradation. The results from the control experiments were considered in the calculation of the corrected degradation efficiencies presented in Figure 8 and Figure 9 and Table 2.
2.6. Radical Scavenging Experiments
To gain deeper insight into the photocatalytic degradation pathway of PBD and PPO, radical scavenging experiments were subsequently performed, and the results are presented in Figure 11. These experiments provide information about the contribution of different reactive species to the photocatalytic process of pristine and rare-earth oxide-modified ZnO photocatalysts. The effects of ascorbic acid (AA), isopropyl alcohol (IPA), and ethylenediaminetetraacetic acid disodium salt (EDTA-2Na), used as scavengers for superoxide radicals (•O2−), hydroxyl radicals (•OH), and photogenerated holes (h+), respectively, were investigated. The addition of the scavengers resulted in decreased degradation efficiencies for all photocatalysts, indicating the involvement of ROS and photogenerated charge carriers in the degradation process. For both PPO and PBD, the strongest inhibition was observed in the presence of AA (Figure 11), suggesting an important contribution of superoxide radicals (•O2−) to the degradation pathway. The addition of IPA and EDTA-2Na also reduced the photocatalytic activity, indicating the participation of hydroxyl radicals (•OH) and photogenerated holes (h+) in the oxidation process.
Figure 11.
Effect of radical scavengers: ascorbic acid (AA), isopropyl alcohol (IPA), and ethylenediaminetetraacetic acid disodium salt (EDTA-2Na) on the photocatalytic degradation of PBD (a) and PPO (b) under UV irradiation in the presence of pure and rare-earth-modified ZnO nanoflowers (ZnO/Gd2O3, ZnO/Sm2O3, and ZnO/Eu2O3).
Similar to the kinetic results (Figure 10), the rare-earth oxide-modified ZnO flower-like photocatalysts retained higher degradation efficiencies than pristine ZnO in the presence of scavengers, with ZnO/Eu2O3 showing the highest activity. These results suggest that rare-earth modification may promote more efficient generation and utilization of re-active species, contributing to the enhanced photocatalytic degradation of PPO and PBD under UV irradiation.
As discussed in Section 2.3 and Section 2.4, the modification of ZnO with rare-earth oxides enhanced the photocatalytic performance of the investigated materials. Among the studied photocatalysts, ZnO/Eu2O3 exhibited the highest degradation efficiency, followed by ZnO/Sm2O3 and ZnO/Gd2O3. This enhanced activity can be associated with improved charge-carrier separation, modified electronic properties, and more efficient utilization of reactive oxygen species generated during the photocatalytic process. The results of the radical scavenging experiments further indicate that ROS play an important role in the degradation pathway of PPO and PBD. The reduced activity observed in the presence of specific scavengers suggests that the enhanced photocatalytic performance of the rare-earth oxide-modified ZnO materials is related to more effective generation and participation of reactive species during UV irradiation.
2.7. Photocatalytic Degradation Pathway and Photocatalytic Efficiency
In general, the photocatalytic activity of the rare-earth-modified ZnO samples is influenced by their modified electronic structure and suppressed electron–hole recombination. Upon UV irradiation with photon energy (hν) equal to or higher than the ZnO bandgap energy, electrons are excited from the valence band (VB) to the conduction band (CB), generating electron–hole pairs:
ZnO + hυ → e−CB + h+VB
In pure ZnO, rapid recombination of photogenerated charge carriers limits the quantum efficiency. Modification with rare-earth oxides introduces defect states, oxygen vacancies, and localized 4f levels acting as trapping sites that prolong carrier lifetime.
The trapped conduction band electrons react with dissolved molecular oxygen to produce reactive oxygen species:
e−CB + O2 → •O2
Subsequent protonation and reduction reactions lead to the formation of hydroperoxyl radicals and hydrogen peroxide:
•O2 + H+ → •HO2
•HO2 → H2O2 + O2
Hydrogen peroxide may further generate highly oxidative hydroxyl radicals:
H2O2 + e− → •OH + OH−
Simultaneously, photogenerated holes oxidize surface hydroxyl groups and adsorbed water molecules:
h+ + H2O → •OH + H+
The generated hydroxyl (•OH) and superoxide (•O2−) radicals attack the aromatic structures of PPO and PBD, leading to oxidative degradation and eventual mineralization into CO2 and H2O.
The enhanced activity of rare-earth-modified ZnO photocatalysts compared with pristine ZnO can be attributed to the role of the lanthanide ions due to their electronic configurations. Rare-earth cations possess partially filled 4f orbitals capable of acting as tem-porary electron reservoirs, thereby facilitating charge carrier separation. Furthermore, the modification of Gd3+, Sm3+, and Eu3+ may induce oxygen vacancy formation within the ZnO lattice.
Among the investigated materials, ZnO/Eu2O3 exhibits the highest photocatalytic activity and the largest apparent kinetic constant, k. This superior performance may be primarily associated with the unique electronic properties of europium ions. The reversible redox couple Eu3+/Eu2+ provides efficient electron trapping capability,
reducing the recombination probability of photogenerated charge carriers.
Eu3+ + e− → Eu2+
The lower activity of pristine ZnO is attributed to its limited defect density and rapid electron-hole recombination. The contribution of crystallite size should also be considered. Although ZnO/Sm2O3 exhibits the smallest crystallite size (50 nm), it was not the most efficient photocatalyst, indicating that crystallite size alone cannot explain the observed activity. Although ZnO/Sm2O3 exhibits the smallest crystallite size (50 nm) (Section 2.1), this parameter alone does not determine the photocatalytic performance, indicating that other factors, such as electronic properties, charge-carrier behavior, and reactive species generation, also contribute to the overall activity. The higher degradation efficiency of PPO compared with PBD can be related to differences in their degree of π-conjugation. PPO possesses a less extended and less rigid aromatic structure than PBD, which may facilitate its oxidation by reactive species generated during photocatalysis. In contrast, PBD contains a more conjugated biphenyl–oxadiazole framework, resulting in enhanced molecular stability and greater resistance toward photocatalytic oxidation.
2.8. Quantum Efficiency
The external quantum efficiency (EQE) is an important parameter for evaluating photocatalytic performance because it relates the number of degraded molecules to the number of incident photons [58]. The EQE values (η) of the photocatalytic reactions were calculated from the experimentally determined degradation efficiencies (D %), the incident photon flux, and the initial amount of substrate under the experimental conditions described in Section 3.7 and Section 3.10. In our case, as can be seen from Figure 7d, the radiation of the UV lamp we employed is in the range 350–400 nm with a spectral maximum at 367 nm. Such UV light is practically not absorbed by PPO (compare Figure 7d and Figure 9). Thus, the energy loss channel due to possible fluorescence activation is minimized during the photocatalytic process that we performed. In the case of PBD, a small portion of the incident UV light is still absorbed (compare Figure 7d and Figure 8), which may result in lower values of η. The calculated EQE values are summarized in Table 2. The highest quantum efficiency was obtained for ZnO/Eu2O3, followed by ZnO/Sm2O3 and ZnO/Gd2O3, while pristine ZnO exhibited the lowest value. The observed trend is consistent with the enhanced charge separation and ROS generation discussed in the previous sections.
2.9. Determination of Catalyst Stability Using Inductively Coupled Plasma Mass Spectrometry (ICP-MS)
Quantitative elemental analysis for residual concentrations of Zn2+, Gd3+, Sm3+, and Eu3+ ions in the treated aqueous solutions were quantified by ICP-MS analysis in order to assess the stability of the catalyst under the investigated reaction conditions. The obtained data are presented in Figure 12 for the analyzed PBD and PPO nanoflowers. For better visualization of the data, the figures are presented in logarithmic form due to the large difference in the concentrations of zinc compared to the concentration of rare earth elements. The measurement was performed in triplicate. The LOD/LOQ values were as follows: Zn—0.06/0.18 ng mL−1, Sm—0.012/0.032 ng mL−1, Eu—0.03/0.10 ng mL−1, and Gd—0.013/0.040 ng mL−1. All ICP-MS results were evaluated with respect to these analytical limits in order to distinguish quantitatively reliable signals from trace-level responses close to the detection or quantification threshold value. Therefore, concentrations below the LOQ were considered detectable but not reliably quantifiable, whereas values below the LOD were treated as not detected. The standard deviation of the analyzed elements was below 5% for rare earth elements and 7% for zinc.
Figure 12.
Concentrations of Zn2+, Gd3+, Sm3+ and Eu3+ ions in the treated aqueous solutions of PBD (a) and PPO (b) with pure and rare-earth element modified ZnO photocatalysts.
The ICP-MS analysis showed that Zn2+ was present at higher concentrations in the treated solutions than the corresponding rare-earth ions (Sm3+, Eu3+, and Gd3+) under the investigated photocatalytic conditions. This difference should be interpreted with caution because the rare-earth oxides were introduced at a much lower concentration (2 at.% rela-tive to Zn) in the ZnO matrix. Therefore, the lower concentrations of the rare-earth ions in solution cannot, by themselves, be considered evidence that rare-earth modification sup-presses ion leaching. Instead, the ICP-MS results indicate only limited release of Sm3+, Eu3+, and Gd3+ during the photocatalytic experiments. Together with the relatively low concen-trations of all detected elements after the reaction, these findings are consistent with the good stability of the investigated photocatalysts under the applied experimental condi-tions. The ICP-MS analysis therefore confirms that no significant dissolution of the ra-re-earth components was observed during the photocatalytic tests, while the measured elemental concentrations remain compatible with stable catalyst performance throughout the reaction.
2.10. Mineralization Efficiency Evaluated by Chemical Oxygen Demand (COD)
The mineralization efficiency of the photocatalytic process was further evaluated by monitoring changes in chemical oxygen demand (COD), and the results are summarized in Table 3. The initial COD values for PPO and PBD solutions were approximately 42.0 and 41.5 mg O2 L−1, respectively, corresponding to the initial concentration of 15 mg L−1. After photocatalytic treatment, a substantial decrease in COD was observed for all investigated photocatalysts, confirming the effective oxidation of the organic compounds.
Table 3.
Chemical oxygen demand (COD) removal during the photocatalytic degradation of PPO and PBD.
For PPO, the residual COD decreased from 42.0 mg O2 L−1 to 11.8, 6.7, 4.2, and 2.1 mg O2 L−1 in the presence of ZnO, ZnO/Gd2O3, ZnO/Sm2O3, and ZnO/Eu2O3, respectively. A similar trend was observed for PBD, with final COD values of 13.3, 8.3, 5.4, and 2.9 mg O2 L−1 for the corresponding photocatalysts. The progressive decrease in COD indicates that degradation was accompanied by extensive oxidation of the parent molecules rather than simple structural transformation.
The highest mineralization efficiency was achieved with the ZnO/Eu2O3 photocatalyst, followed by ZnO/Sm2O3 and ZnO/Gd2O3, whereas pristine ZnO exhibited the lowest COD removal. The enhanced performance of the rare-earth-modified photocatalysts can be attributed to superior charge separation efficiency and increased generation of reactive oxygen species, which promote the oxidation of intermediate products formed during photocatalytic degradation. Consequently, incorporating rare-earth oxides not only accelerates the disappearance of PPO and PBD molecules but also enhances their conversion into low-molecular-weight oxidation products and ultimately into carbon dioxide and water.
2.11. Recycling Performance of the Photocatalysts
Figure 13 illustrates the recyclability of pure and rare-earth-modified ZnO photocatalysts during three consecutive photocatalytic degradation cycles of (a) PBD and (b) PPO. All investigated samples exhibited good operational stability, maintaining high photocatalytic activity upon repeated use. After three consecutive cycles, the degradation efficiency decreased by only approximately 2–3% for all photocatalysts, demonstrating their excellent reusability and structural stability under the applied experimental conditions. The comparable performance of the rare-earth-modified samples further indicates that the modification of Gd2O3, Sm2O3, and Eu2O3 does not adversely affect the long-term stability of the ZnO photocatalysts.
Figure 13.
Recyclability of pure and rare-earth-modified ZnO photocatalysts during three consecutive photocatalytic degradation cycles of (a) PBD and (b) PPO.
The morphological stability of the ZnO-based photocatalysts after photocatalytic recycling experiments was inspected by SEM. The SEM images of the reused catalysts after photocatalytic testing are presented in Figure S6. Comparison of the fresh and recycled samples shows that no obvious morphological alterations or severe particle aggregation occurred after the photocatalytic process, confirming the structural stability of pristine and rare-earth oxide-modified ZnO photocatalysts after three consecutive recycling cycles.
3. Materials and Methods
3.1. Chemical and Reagents
Zinc nitrate hexahydrate (Zn(NO3)2x6H2O, ≥98%), sodium hydroxide (NaOH, ≥98%), gadolinium(III) oxide (Gd2O3, ≥99.9%), samarium(III) oxide (Sm2O3, ≥99.9%), and europium(III) oxide (Eu2O3, ≥99.9%) were obtained from Sigma-Aldrich (Merck, Burlington, MA, USA) and employed as received without additional purification. Deionized water was utilized throughout all synthesis procedures. Stock solutions of PPO and PBD were prepared by dissolving each compound in a mixed solvent consisting of 3 mL ethanol and 3 mL distilled water. The solutions were then diluted with deionized water to achieve a final concentration of 15 mg L−1 (15 ppm).
3.2. Selection of Model Pollutants
The photocatalytic experiments were carried out with the commercial laser dyes 2-(4-biphenyl)-5-phenyl-1,3,4-oxadiazole (PBD) and 2,5-diphenyl-1,3-oxazole (PPO) as model organic contaminants. These scintillation-grade dyes have been purchased respectively: PPO—from E. Merck (Darmstadt, Germany) and PBD—from Koch-Light Laboratories Ltd. (Haverhill, UK). Both fluorescent aromatic compounds are widely applied in scintillation detectors, laser-related technologies, and optoelectronic devices (e.g., OLEDs), which raises concerns regarding their potential release into aquatic environments during industrial production and disposal processes. Due to their highly conjugated aromatic structures and chemical stability, PBD and PPO exhibit resistance toward conventional degradation processes and represent suitable model compounds for evaluating advanced oxidation approaches. Therefore, they were selected as representative pollutants for investigating the photocatalytic performance of pristine and rare-earth oxide-modified ZnO flower-like photocatalysts under UV irradiation.
3.3. Synthesis of Pristine ZnO Nanoflowers
ZnO nanoflowers were synthesized using a sol–gel-assisted precipitation approach. Initially, zinc nitrate hexahydrate (3.0 g, 10.1 mmol) was dissolved in 80 mL of deionized water under continuous magnetic stirring. In a separate vessel, sodium hydroxide (1.6 g, 40 mmol) was dissolved in 80 mL of deionized water. Subsequently, the NaOH solution was slowly introduced dropwise into the zinc precursor solution under vigorous stirring. The obtained reaction mixture was transferred into a round-bottom flask and maintained at 80 °C for 6 h to promote the formation of the ZnO precursor.
The resulting white precipitate was isolated by vacuum filtration, repeatedly rinsed with deionized water to eliminate residual ionic species, and dried at 100 °C for 6 h. The dried material was then calcined in air at 350 °C for 3 h, yielding ZnO nanoflowers.
3.4. Synthesis of Rare-Earth-Modified ZnO Nanoflowers
Rare-earth-modified ZnO nanoflowers (ZnO/Gd2O3, ZnO/Sm2O3, and ZnO/Eu2O3) were synthesized following an analogous procedure. Prior to the addition of the NaOH solution, the corresponding rare-earth oxide was introduced into the zinc nitrate solution at concentrations of 2 mol% relative to Zn2+ ions. The suspension was ultrasonically treated for 30 min to ensure uniform dispersion of the oxide particles within the precursor solution. After sonication, the NaOH solution was added dropwise under continuous stirring, and the resulting mixtures were subjected to the same precipitation, filtration, washing, drying, and calcination procedures as applied for pristine ZnO nanoflowers. The ZnO/Sm2O3 and ZnO/Eu2O3 nanoflowers were obtained using the same method and conditions.
3.5. Structural and Morphological Characterization
The morphology and surface microstructure of the synthesized nanomaterials were inspected using scanning electron microscopy (SEM, JSM-5510, JEOL, Krefeld, Germany). Elemental composition and chemical analysis were performed by energy-dispersive X-ray spectroscopy (EDS) employing a Quantax 200 detector (Bruker, Berlin, Germany), with an energy resolution of 126 eV. In addition, elemental mapping analysis was conducted to verify the homogeneous distribution of Zn, O, Gd, Sm, and Eu within the synthesized structures.
The crystalline structure of the obtained catalysts were characterized by X-ray diffraction (XRD) using a Siemens D500 diffractometer equipped with Cu Kα radiation source (λ = 1.5406 Å) (Siemens AG Niederlassung Karlsruhe, Germany). Powder XRD patterns were collected over the Bragg’s reflection angle 2θ range of 25–75°, with a constant step of 0.05° 2θ. The average crystallite size of the samples was estimated according to the Scherrer equation. UV–Vis diffuse reflectance spectra and absorption behavior were obtained at room temperature by use of UV–Vis spectrophotometer (Evolution 300, Thermo Scientific, Madison, WI, USA) equipped with a Praying Mantis diffuse reflectance accessory (Harrick Scientific Products, Mount Kisco, NY, USA). The reference reflectance material used for these measurements was a MgO white standard as the ultimate 100% baseline.
3.6. Optical Spectral Characterization and Bandgap Determination
The optical bandgap energies (Eg) were determined from Tauc plots using the Tauc equation for a direct allowed electronic transition [59], which is appropriate for ZnO as a direct bandgap semiconductor. Accordingly, plots of (αhν)2 versus photon energy (hν) were constructed, and Eg value was determined from the intersection of the extrapolation of the linear fit to the linear region of the Tauc plot (αhν)2 and the linear fit applied to the slope below the fundamental absorption. By that, the recommendations of Ref. [60] were followed because of the presence of considerable absorption of sub-bandgap energy photons, especially considering the observation of extra absorption in the Eu- and Sm-doped samples in our case.
The residual dye concentrations were determined using UV–Vis spectrophotometry (Evolution 300, Thermo Scientific, Madison, WI, USA) by monitoring their absorption peaks at the wavelengths of 300 nm and 304 nm, respectively. In all cases, the spectra were recorded with a spectral resolution of 1 nm.
3.7. Photocatalytic Degradation Experiments
The photocatalytic performance of the synthesized photocatalysts was evaluated through the degradation of PBD and PPO in aqueous solution under UV irradiation. All photocatalytic experiments were performed under identical experimental conditions. Stock solutions were prepared by dissolving 0.5 g of the respective laser dye in 0.5 L of distilled water, and the working concentration used in the photocatalytic experiments was adjusted to 15 mg L−1 (15 ppm). UV irradiation was provided by a 36 W UV lamp (Philips BLB-T8/36W) operating in the wavelength range of 350–400 nm (Figure 7d). The UV lamp was positioned 4 cm above the surface of the mixture in the photocatalytic reactor. The irradiation intensity at that liquid surface was 0.56 mW cm−2, as measured using a Thorlabs PM100 optical power meter equipped with an S120VC silicon photodiode power sensor.
For each experiment, 1 g L−1 of photocatalyst was dispersed in 50 mL of dye solution in a 100 mL glass reactor under magnetic stirring (500 rpm). The initial pH of the aqueous dye solution was 6.8. After the addition of the photocatalyst (pristine or rare-earth oxide-modified ZnO), the suspension pH increased to 7.5. No pH adjustment or buffer solution was used during the photocatalytic experiments. All measurements were carried out at ambient temperature (23 ± 2 °C). Prior to UV irradiation, the suspension was stirred in the dark for 10 min to establish adsorption–desorption equilibrium between the photocatalyst surface and the dye molecules. During irradiation, 2 mL aliquots were withdrawn at predetermined time intervals for analysis. Before UV–Vis measurements, the samples were transferred into 10 × 10 mm quartz cuvettes Hellma QS (Hellma Analytics, Müllheim, Germany) with an optical path length of 10 mm. All photocatalytic degradation experiments were performed in triplicate under identical experimental conditions. The results presented in Figure 10 correspond to the mean values of three independent measurements, and the error bars represent the standard deviation.
3.8. FFT Processing
Fast Fourier transform (FFT) processing of SEM images and particle size analysis were performed using Gwyddion software (v. 2.71) (Czech Metrology Institute (CMI), Brno, Czechia) and ImageJ software (v. 1.54) (National Institutes of Health (NIH) and the Laboratory for Optical and Computational Instrumentation (LOCI), University of Wisconsin–Madison, WI, USA). Quantitative Fourier analysis and micro/nanostructural characterization were performed using Python-based (v3.11) routines and scientific libraries, including NumPy, SciPy, scikit-image, and Matplotlib. The main processing steps included Gaussian smoothing, morphological filtering, watershed segmentation, extraction of equivalent-circle diameters, and histogram estimation of the size distribution function (the probability density) P(d). FFT spectral density (PSD) and autocorrelation function (ACF) statistics, as well as the extraction of the corresponding angularly averaged profiles, were performed using the functions of Gwyddion software mentioned above. The autocorrelation length (Lc) of textures was determined from the radially averaged C(r) curves obtained from the 2D ACF maps obtained for the analyzed SM images of the four investigated photocatalysts under identical computational conditions.
3.9. Reactive Species Identification, COD and ICP-MS Analyses
The contribution of reactive oxygen species involved in the photocatalytic degradation of PBD and PPO was evaluated through radical scavenging experiments. Ethylenediaminetetraacetic acid disodium salt (EDTA-2Na), isopropyl alcohol (IPA), and ascorbic acid (AA) were used as scavengers for photogenerated holes (h+), hydroxyl radicals (•OH), and superoxide radicals (•O2−), respectively. To evaluate the role of individual reactive species in the photocatalytic degradation process, 6 mg of each scavenger was separately added to 50 mL of the laser dye solution under identical experimental conditions. After the photocatalytic experiments, the chemical oxygen demand (COD) of the treated solutions was measured using a DR1900 VIS spectrophotometer and an LT200 thermostat (Hach, Berlin, Germany) with commercially available Hach COD digestion vials, following the standard dichromate method.
The accuracy of the ICP-MS measurements was evaluated by analysis of certified reference materials for water, including NIST 1640a, Trace Elements in Natural Water, National Institute of Standards and Technology, Gaithersburg, Maryland, USA; SPS-SW2, Reference Material for Measurement of Elements in Surface Waters, Spectrapure Standards, Norway; and NWTM-23.5, Environmental Matrix Reference Material, Environment and Climate Change Canada, Gatineau, QC, Canada. The comparison between the experimentally obtained values and the certified or published values showed good agreement. Method precision was assessed using three independent replicates, each consisting of six measurements. To assess and correct for instrumental drift, recalibration was performed after every tenth sample. To minimize memory effects, a 60 s rinsing step with 3% HNO3 was applied, followed by measurement of a blank sample.
3.10. External Quantum Efficiency Calculation
The photocatalytic experiments were performed using 25 mL of the reaction suspension in a cylindrical glass reactor with an inner diameter of 38 mm. The initial concentrations of PPO and PBD were 6.78 × 10⁻⁵ mol L−1 and 5.03 × 10⁻⁵ mol L−1, respectively, that correspond to 1.021 × 10¹⁸ and 0.758 × 10¹⁸ molecules of PPO and PBD, respectively. The measured incident UV irradiance intensity was Iin = 5.6 mW cm−2. Based on the emission spectrum of the UV source (Figure 7d), the photon energy can be calculated: Eϕ = hν = hc/λ = 54.161 × 10⁻²⁰ J, where λ = 367 nm. For an irradiation area S = 11.345 cm2 and an irradiation duration Δt = 600 s, the total incident photon energy was calculated to be Ein = IinSΔt = 3.81 J, which means that the total number of the incident photons was Nphotons = Ein/Eϕ = 7.038 × 10¹⁸. These parameters were used for the calculation of the EQE as the ratio of the number of degraded substrate molecules to Nphotons under the conditions of our experiments.
4. Conclusions
This work reports, for the first time, the photocatalytic degradation of the laser dyes/scintillators 2,5-diphenyl-1,3-oxazole (PPO) and 2-(4-biphenyl)-5-phenyl-1,3,4-oxadiazole (PBD) using hierarchical rare-earth-modified ZnO nanoflowers under UV irradiation. A comparative evaluation of Sm2O3, Eu2O3, and Gd2O3 modified ZnO demonstrates the influence of rare-earth-induced modifications of the electronic structure on the resulting photocatalytic performance. Among the investigated materials, ZnO/Eu2O3 exhibited the highest activity, achieving nearly complete degradation of PPO and 84% degradation of PBD within 10 min, together with the highest degradation rate and photodegradation quantum efficiency.
The enhanced photocatalytic performance originates from the synergistic effects of improved light absorption, efficient charge-carrier separation, suppression of electron–hole recombination, and increased generation of reactive oxygen species induced by rare-earth modification. Radical scavenging experiments identified superoxide radicals (•O2−) as the predominant oxidative species governing the degradation process, providing experimental support for the proposed photocatalytic degradation pathway.
Beyond the photocatalytic investigation, this work reveals the role of hierarchical morphology and nanoscale spatial organization in determining the photocatalytic performance of rare-earth-modified ZnO nanoflowers through the combined application of SEM, FFT, PSD, and ACF analyses. While the overall hierarchical nanoflower morphology remained similar for all samples, ACF analysis revealed differences in nanoscale spatial organization that correlated with photocatalytic performance, identifying the texture autocorrelation length as a more sensitive morphology descriptor than conventional roughness parameters. When considered together with the structural analysis and photocatalytic performance results, these findings provide new insight into the relationship between the structural features and photocatalytic activity of rare-earth-engineered ZnO photocatalysts and highlight Eu2O3-modified ZnO nanoflowers as promising materials for the rapid removal of persistent aromatic scintillator contaminants from aqueous media.
Supplementary Materials
The following supporting information can be downloaded at: https://www.mdpi.com/article/10.3390/catal16070661/s1, Figure S1. SEM images (1024 × 692 px) taken under identical experimental conditions for the studied nanoflowers of: ZnO (a); ZnO/Gd2O3 (b); ZnO/Sm2O3 (c); ZnO/Eu2O3 (d). Figure S2. FFT (1024 × 692 px images) of the corresponding SEM images from Figure S1. The scales are in [μm−1]. Figure S3. FFT-inferred size distribution function P(d) for the particles of the samples of: (a) ZnO; (b) ZnO/Gd2O3; (c) ZnO/Sm2O3; (d) ZnO/Eu2O3, as calculated for the SEM images in Figure S1 under identical image-processing conditions. Figure S4. Particle size distribution histograms and the curves of normal-log distribution (red lines), the calculated mean size (d) with standard deviation (sd), and the parameters of the log-normal distribution function: xc and σ for the synthesized ZnO (a); ZnO/Gd2O3 (b); ZnO/Sm2O3 (c); ZnO/Eu2O3 (d) (corresponding SEM images are in Figure S1). Figure S5. SEM images for the studied nanoflowers: (a) ZnO; (b) ZnO/Gd2O3; (c) ZnO/Sm2O3; (d) ZnO/Eu2O3. The circles indicate the individual nanoflowers analyzed by ACF statistics. Figure S6. SEM images of pristine and rare-earth oxide-modified ZnO photocatalysts before (left) and after (right) photocatalytic reaction: ZnO (a); ZnO/Gd2O3 (b); ZnO/Sm2O3 (c); ZnO/Eu2O3 (d).
Author Contributions
Conceptualization, N.K. and G.B.H.; methodology, N.K., D.I. and G.B.H.; software, N.K., T.T., V.M., N.S. and G.B.H.; investigation, N.K., V.M., N.S. and G.B.H.; data curation, N.K., V.M. and G.B.H.; writing—original draft preparation, N.K. and G.B.H.; writing—review and editing, N.K. and G.B.H. All authors have read and agreed to the published version of the manuscript.
Funding
This research was funded by projects 80-10-26|01.04.2026, BG16RFPR002-1.014-0006 and BG16RFPR002-1.014-0015.
Data Availability Statement
The original contributions presented in this study are included in the article. Further inquiries can be directed to the corresponding author.
Acknowledgments
The authors are grateful for the financial support by project 80-10-26|01.04.2026. G.B.H. acknowledges the financial support from the European Regional Development Fund under the “Research Innovation and Digitization for Smart Transformation” program 2021–2027 under the project BG16RFPR002-1.014-0006 “National Centre of Excellence—Mechatronics and Clean Technologies”. V.M. acknowledges the financial support of the grant project No. BG16RFPR002-1.014-0015: “Clean Technologies for Sustainable Environment—Water, Waste, Energy for Circular Economy”, funded by the European Regional Development Fund through the Bulgarian Programme “Research, Innovation and Digitalization for Smart Transformation”.
Conflicts of Interest
The authors declare no conflicts of interest.
References
- Matei, E.; Șăulean, A.A.; Râpă, M.; Constandache, A.; Predescu, A.M.; Coman, G.; Berbecaru, A.C.; Predescu, C. ZnO nanostructured matrix as nexus catalysts for the removal of emerging pollutants. Environ. Sci. Pollut. Res. 2023, 30, 114779–114821. [Google Scholar] [CrossRef] [Scilit]
- Sanakousar, F.; Vidyasagar, C.; Jiménez-Pérez, V.; Prakash, K. Recent progress on visible-light-driven metal and non-metal doped ZnO nanostructures for photocatalytic degradation of organic pollutants. Mater. Sci. Semicond. Process. 2022, 140, 106390. [Google Scholar] [CrossRef] [Scilit]
- Zhang, S.; Li, B.; Wang, X.; Zhao, G.; Hu, B.; Lu, Z.; Wen, T.; Chen, J.; Wang, X. Recent developments of two-dimensional graphene-based composites in visible-light photocatalysis for eliminating persistent organic pollutants from wastewater. Chem. Eng. J. 2020, 390, 124642. [Google Scholar] [CrossRef] [Scilit]
- Nguyen, V.; Smith, S.; Wantala, K.; Kajitvichyanukul, P. Photocatalytic remediation of persistent organic pollutants (POPs): A review. Arab. J. Chem. 2020, 13, 8309–8337. [Google Scholar] [CrossRef] [Scilit]
- Paul, R.; Ahmaruzzaman, M. Advanced photocatalytic degradation of POPs and other contaminants: A comprehensive review on nanocomposites and heterojunctions. RSC Adv. 2025, 15, 31313. [Google Scholar] [CrossRef] [Scilit] [PubMed]
- Navidpour, A.; Dashti, A.; Dil, E.; Asadi, P.; Zhou, J.; Moshfegh, A.; Altaee, A. Zinc oxide photocatalysis for pollutant degradation: A review of elemental doping, morphology, and microstructure, integrated with machine learning-based performance modelling. Adv. Compos. Hybrid Mater. 2026, 9, 159. [Google Scholar] [CrossRef] [Scilit]
- Silva, D.; Boni, L.; Correa, D.; Costa, S.; Hidalgo, A.; Zilio, S.; Canuto, S.; Mendonca, C. Two-photon absorption in oxazole derivatives: An experimental and quantum chemical study. Opt. Mater. 2012, 34, 1013–1018. [Google Scholar] [CrossRef] [Scilit]
- Park, H.W.; Choi, J.W.; Joo, K.K.; Kim, N.R.; Shin, C.D. Estimating Fluor Emission Spectra Using Digital Image Analysis Compared to Spectrophotometer Measurements. Sensors 2023, 23, 4291. [Google Scholar] [CrossRef] [Scilit] [PubMed]
- Carturan, S.; Moretto, S.; Quaranta, A. Polysiloxane-based scintillators as radiation sensors: State of the art and future perspectives. Front. Sens. 2025, 6, 1607356. [Google Scholar] [CrossRef] [Scilit]
- Lee, J.; Goldblum, B.; Laplace, T.; Brown, J.; Johnson, T.; Bleuel, D.; Venkatraman, A.; Li, T.; Sebastian, J.; Tausik, N.; et al. Characterization of 6Li-loaded pulse-shape-discriminating plastic scintillators. Nucl. Instrum. Methods Phys. Res. A 2026, 1084, 171212. [Google Scholar] [CrossRef] [Scilit]
- Hu, Y.; Ma, J.; Liu, T.; Zhang, Y.; Yu, Y.; Sun, Z.; Fang, F.; Dong, T.; Zhao, Y.; Zhou, G. Preparation and characterization of plastic scintillators with different proportions. J. Radioanal. Nucl. Chem. 2023, 332, 1047–1054. [Google Scholar] [CrossRef] [Scilit]
- Shevelev, V.; Ishchenko, A. Optical and scintillation properties of new polyurethane plastic scintillator with PPO and POPOP. Opt. Mater. 2026, 169, 117202. [Google Scholar] [CrossRef] [Scilit]
- Zhu, J.; Deng, C.; Jiang, H.; Zheng, Z.; Gong, R.; Bi, Y.; Zhang, L.; Lin, R. The impact of fluorescent dyes on the performances of polystyrene-based plastic scintillators. Nucl. Instrum. Methods Phys. Res. Sect. A 2016, 833, 136–141. [Google Scholar] [CrossRef] [Scilit]
- Kim, N.; Joo, K.; Lee, H. Investigating the Potential of Perovskite Nanocrystal-Doped Liquid Scintillator: A Feasibility Study. Sensors 2023, 23, 9490. [Google Scholar] [CrossRef] [Scilit] [PubMed]
- Schoppmann, S. Review of Novel Approaches to Organic Liquid Scintillators in Neutrino Physics. Symmetry 2023, 15, 11. [Google Scholar]
- Alt, J.; Bezshyyko, O.; Böhles, M.; Brignoli, A.; Conaboy, A.; Deucher, P.; Eckardt, C.; Ernst, A.; Fischer, H.; Hollnagel, A.; et al. Performance of a first full-size WOM-based liquid scintillator detector cell as prototype for the SHiP Surrounding Background Tagger. J. Instrum. 2024, 19, P05024. [Google Scholar] [CrossRef] [Scilit]
- Wang, Y.; Liu, B.; Liu, Y.; Chen, X.; Chen, X.; Wen, Q.; Wang, E.; Du, B.; Zheng, H.; Zhong, G.; et al. High-Performance and Stable b-PBD/Perovskite Liquid Scintillators for X-ray Imaging. ACS Appl. Mater. Interfaces 2025, 17, 62775–62786. [Google Scholar] [CrossRef] [Scilit] [PubMed]
- Zaitseva, N.; Glenn, A.; Carman, L.; Ford, M.; Shipp, K.; Frizzell, C.; Gomez, M.; Hurlbut, C.; Falana, O. Comparative analysis of new crystal and plastic scintillators for fast and thermal neutron detection. Nucl. Instrum. Methods Phys. Res. A 2026, 1082, 171077. [Google Scholar] [CrossRef] [Scilit]
- Renita, A.; Sathish, S.; Kumar, P.; Prabu, D.; Manikandan, N.; Iqbal, A.; Rajesh, G.; Rangasamy, G. Emerging aspects of metal ions-doped zinc oxide photocatalysts in degradation of organic dyes and pharmaceutical pollutants—A review. J. Environ. Manag. 2023, 344, 118614. [Google Scholar] [CrossRef] [Scilit]
- Fujishima, A.; Honda, K. Electrochemical photolysis of water at a semiconductor electrode. Nature 1972, 238, 37–38. [Google Scholar] [CrossRef] [Scilit] [PubMed]
- Herrmann, J.M. Heterogeneous photocatalysis: Fundamentals and applications to the removal of various types of aqueous pollutants. Catal. Today 1999, 53, 115–129. [Google Scholar] [CrossRef] [Scilit]
- Chong, M.N.; Jin, B.; Chow, C.W.K.; Saint, C. Recent developments in photocatalytic water treatment technology: A review. Water 2010, 44, 2997–3027. [Google Scholar] [CrossRef] [Scilit]
- Swaminaathan, P.; Saravanan, A.; Yaashikaa, P.; Vickram, A. Recent advances in photocatalytic degradation of per-sistent organic pollutants: Mechanisms, challenges, and modification strategies. Sustain. Chem. Environ. 2024, 8, 100171. [Google Scholar] [CrossRef] [Scilit]
- Hasanah, A.U.; Gareso, P.L.; Rauf, N.; Tahir, D. Photocatalytic performance of zinc oxide and metal-doped zinc oxide for various organic pollutants. ChemBioEng Rev. 2023, 10, 698–710. [Google Scholar] [CrossRef] [Scilit]
- Özgür, Ü.; Alivov, Y.I.; Liu, C.; Teke, A.; Reshchikov, M.A.; Doğan, S.; Avrutin, V.; Cho, S.J.; Morkoç, H. A comprehensive review of ZnO materials and devices. J. Appl. Phys. 2005, 98, 041301. [Google Scholar] [CrossRef] [Scilit]
- Singh, P.; Singh, R.K.; Kumar, R. Journey of ZnO quantum dots from undoped to rare-earth and transition metal-doped and their applications. RSC Adv. 2021, 11, 2512–2545. [Google Scholar] [CrossRef] [Scilit] [PubMed]
- Ahmad, I.; Shukrullah, S.; Naz, M.; Bhatti, H.; Ahmad, M.; Ahmed, E.; Ullah, S.; Hussien, M. Recent progress in rare earth oxides and carbonaceous materials modified ZnO heterogeneous photocatalysts for environmental and energy applications. J. Environ. Chem. Eng. 2022, 10, 107762. [Google Scholar] [CrossRef] [Scilit]
- Wang, Z.L. Zinc oxide nanostructures: Growth, properties and applications. J. Phys. Condens. Matter 2004, 16, R829–R858. [Google Scholar] [CrossRef] [Scilit]
- Kołodziejczak-Radzimska, A.; Jesionowski, T. Zinc oxide—From synthesis to application: A review. Materials 2014, 7, 2833–2881. [Google Scholar] [CrossRef] [Scilit] [PubMed]
- Baruah, S.; Dutta, J. Hydrothermal growth of ZnO nanostructures. Sci. Technol. Adv. Mater. 2009, 10, 013001. [Google Scholar] [CrossRef] [Scilit] [PubMed]
- Janotti, A.; Van de Walle, C.G. Fundamentals of zinc oxide as a semiconductor. Rep. Prog. Phys. 2009, 72, 126501. [Google Scholar] [CrossRef] [Scilit]
- Kumar, S.; Kavitha, R. Lanthanide ions doped ZnO based photocatalysts. Sep. Purif. Technol. 2021, 274, 118853. [Google Scholar] [CrossRef] [Scilit]
- Dhull, P.; Sudhaik, A.; Raizada, P.; Thakur, S.; Nguyen, V.-H.; Le, Q.V.; Kumar, N.; Khan, A.A.P.; Marwani, H.M.; Selvasembian, R.; et al. An overview on ZnO-based sonophotocatalytic mitigation of aqueous phase pollutants. Chemosphere 2023, 333, 138873. [Google Scholar] [CrossRef] [Scilit] [PubMed]
- Binnemans, K. Interpretation of europium(III) spectra. Coord. Chem. 2015, 295, 1–45. [Google Scholar] [CrossRef] [Scilit]
- Hasanah, A.U.; Ikbal, M.S.; Tahir, D. Advances in rare earth-doped ZnO photocatalysts: Enhancing photogenerated electron-hole pairs for radical atom generation. ChemBioEng Rev. 2024, 11, 595–612. [Google Scholar] [CrossRef] [Scilit]
- Li, S.; Zhao, Y.; Zhang, X.; Liu, Y.; Liu, T.; Li, W.; Hou, Y.; Jiang, W.; Zhang, B. Floatable S-scheme Bi4O5Br2/C3N4/Carbon Fiber Cloth with Robust Internal Electric Field for Efficient Photocatalytic Antibiotic Decontamination. Adv. Fiber Mater. 2025, 7, 2032–2047. [Google Scholar] [CrossRef] [Scilit]
- Wen, R.; Wang, Y.; Liu, Y.; Tan, X.; Wang, X.; Huang, Y.; Li, S.; Hou, Y. Ni/Co bimetallic doping in ZnWO4 enabled efficient photocatalytic CO2 reduction: Roles of spin polarization, enhanced built-in electric field and active sites. Appl. Catal. B Environ. Energy 2026, 398, 127016. [Google Scholar] [CrossRef] [Scilit]
- Kumar, R.; Dosanjh, H. A mini-review on rare earth metal doped ZnO nanomaterials for photocatalytic degradation of waste water. J. Phys. Conf. Ser. 2022, 2267, 012139. [Google Scholar] [CrossRef] [Scilit]
- Jasmine, A.; Baskaran, P.; Karunakaran, M.; Chandrasekar, L.B.; Thirumalai, J.; Balakrishnan, T.; Sundaram, P.S.; Leonora, J.M.; Mohandoss, S.; Palanisamy, S. Study of the Photocatalytic Degradation and the Enhanced Antibacterial Activity Against Septicemia of Sm-Doped ZnO Nanoparticles. Bull. Lebedev Phys. Inst. 2025, 52, 383–394. [Google Scholar] [CrossRef] [Scilit]
- Ivanova, D.; Kolev, H.; Mladenova, R.; Karakirova, Y.; Kaneva, N. Utilizing Friction Energy on Nanoflowers (Zinc Oxide and Zinc Oxide/Neodymium Oxide) for Tribocatalysis of Doxycycline. Molecules 2025, 30, 4653. [Google Scholar] [CrossRef] [Scilit] [PubMed]
- Xiao, H.; Li, P.; Jia, F.; Zhang, L. General Nonaqueous Sol–Gel Synthesis of Nanostructured Sm2O3, Gd2O3, Dy2O3, and Gd2O3:Eu3+ Phosphor. J. Phys. Chem. C 2009, 113, 21034–21041. [Google Scholar] [CrossRef] [Scilit]
- Richard, D.; Errico, L.A.; Rentería, M. Structural, electronic and hyperfine properties on Sm2O3, Eu2O3 and Gd2O3 phases. Comput. Condens. Matter 2018, 16, e00327. [Google Scholar] [CrossRef] [Scilit]
- Alam, U.; Khan, A.; Ali, D.; Bahnemann, D.; Muneer, M. Comparative photocatalytic activity of sol–gel derived rare earth metal (La, Nd, Sm and Dy)-doped ZnO photocatalysts for degradation of dyes. RSC Adv. 2018, 8, 17582–17594. [Google Scholar] [CrossRef] [Scilit] [PubMed]
- Cerrato, E.; Gionco, C.; Berruti, I.; Sordello, F.; Calza, P.; Paganini, M. Rare earth ions doped ZnO: Synthesis, characterization and preliminary photoactivity assessment. J. Solid State Chem. 2018, 264, 42–47. [Google Scholar] [CrossRef] [Scilit]
- Zhuang, C.; Zhang, C.; Zhang, D.; Zhang, Y.; Liu, Z.; Shan, P.; Zhang, W.; Xu, P.; Li, S. Role of transmission electron microscopy in heterogeneous structural nanomaterials for photocatalytic applications. J. Mater. Sci. Technol. 2025, 239, 195–233. [Google Scholar] [CrossRef] [Scilit]
- Bracewell, R. The Fourier Transform and Its Applications; McGraw-Hill: Columbus, OH, USA, 1965. [Google Scholar]
- Gonzalez, R.; Woods, R. Digital Image Processing; Prentice Hall: Englewood Cliffs, NJ, USA, 1977. [Google Scholar]
- Barabási, A.; Stanley, H. Fractal Concepts in Surface Growth; Cambridge University Press: Cambridge, UK, 1995. [Google Scholar]
- Kubelka, P.; Munk, F. A Contribution to the Optics of Pigments. Z. Technol. Phys. 1931, 12, 593–599. [Google Scholar]
- Birks, J.B. The Theory and Practice of Scintillation Counting; Pergamon Press: Oxford, UK, 1964. [Google Scholar]
- Melhuish, W.H. Quantum efficiencies of fluorescence of organic substances: Effect of solvent and concentration of the fluorescent solute. J. Phys. Chem. 1961, 65, 229–235. [Google Scholar] [CrossRef] [Scilit]
- Lakowicz, J.R. Principles of Fluorescence Spectroscopy, 3rd ed.; Springer: New York, NY, USA, 2006. [Google Scholar]
- Fujishima, A.; Zhang, X.; Tryk, D.A. TiO2 photocatalysis and related surface phenomena. Surf. Sci. Rep. 2008, 63, 515–582. [Google Scholar] [CrossRef] [Scilit]
- Kumar, S.G.; Rao, K.S.R.K. Zinc oxide based photocatalysis: Tailoring surface–bulk structure and related interfacial charge carrier dynamics for better environmental applications. RSC Adv. 2015, 5, 3306–3351. [Google Scholar] [CrossRef] [Scilit]
- Ong, C.B.; Ng, L.Y.; Mohammad, A.W. A review of ZnO nanoparticles as solar photocatalysts: Synthesis, mechanisms and applications. Renew. Sustain. Energy Rev. 2018, 81, 536–551. [Google Scholar] [CrossRef] [Scilit]
- An, J.; Qu, Y.; Wang, G. The multiple roles of rare earth elements in the field of photocatalysis. Inorg. Chem. Front. 2024, 11, 11–28. [Google Scholar]
- Ackerman, M.; Daub, G.; Hayes, F.; Mackay, H. The photo-oxidation of 2,5-diphenyloxazole (PPO). In Organic Scintillators and Scintillation Counting; Horrocks, D.L., Peng, C.-T., Eds.; Academic Press: Cambridge, MA, USA, 1971; pp. 315–325. [Google Scholar]
- Kisch, H.; Bahnemann, D. Best Practice in Photocatalysis: Comparing Rates or Apparent Quantum Yields? J. Phys. Chem. Lett. 2015, 6, 1907–1910. [Google Scholar] [CrossRef] [Scilit] [PubMed]
- Tauc, J. Amorphous and Liquid Semiconductors; Plenum Press: New York, NY, USA, 1974. [Google Scholar]
- Makula, P.; Pacia, M.; Macyk, W. How To Correctly Determine the Band Gap Energy of Modified Semiconductor Photocatalysts Based on UV−Vis Spectra. J. Phys. Chem. Lett. 2018, 9, 6814–6817. [Google Scholar] [CrossRef] [Scilit] [PubMed]
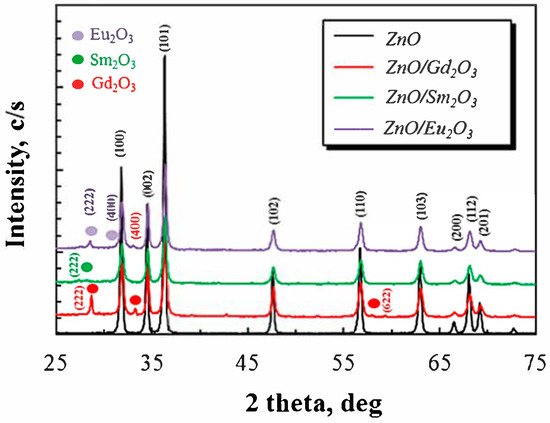
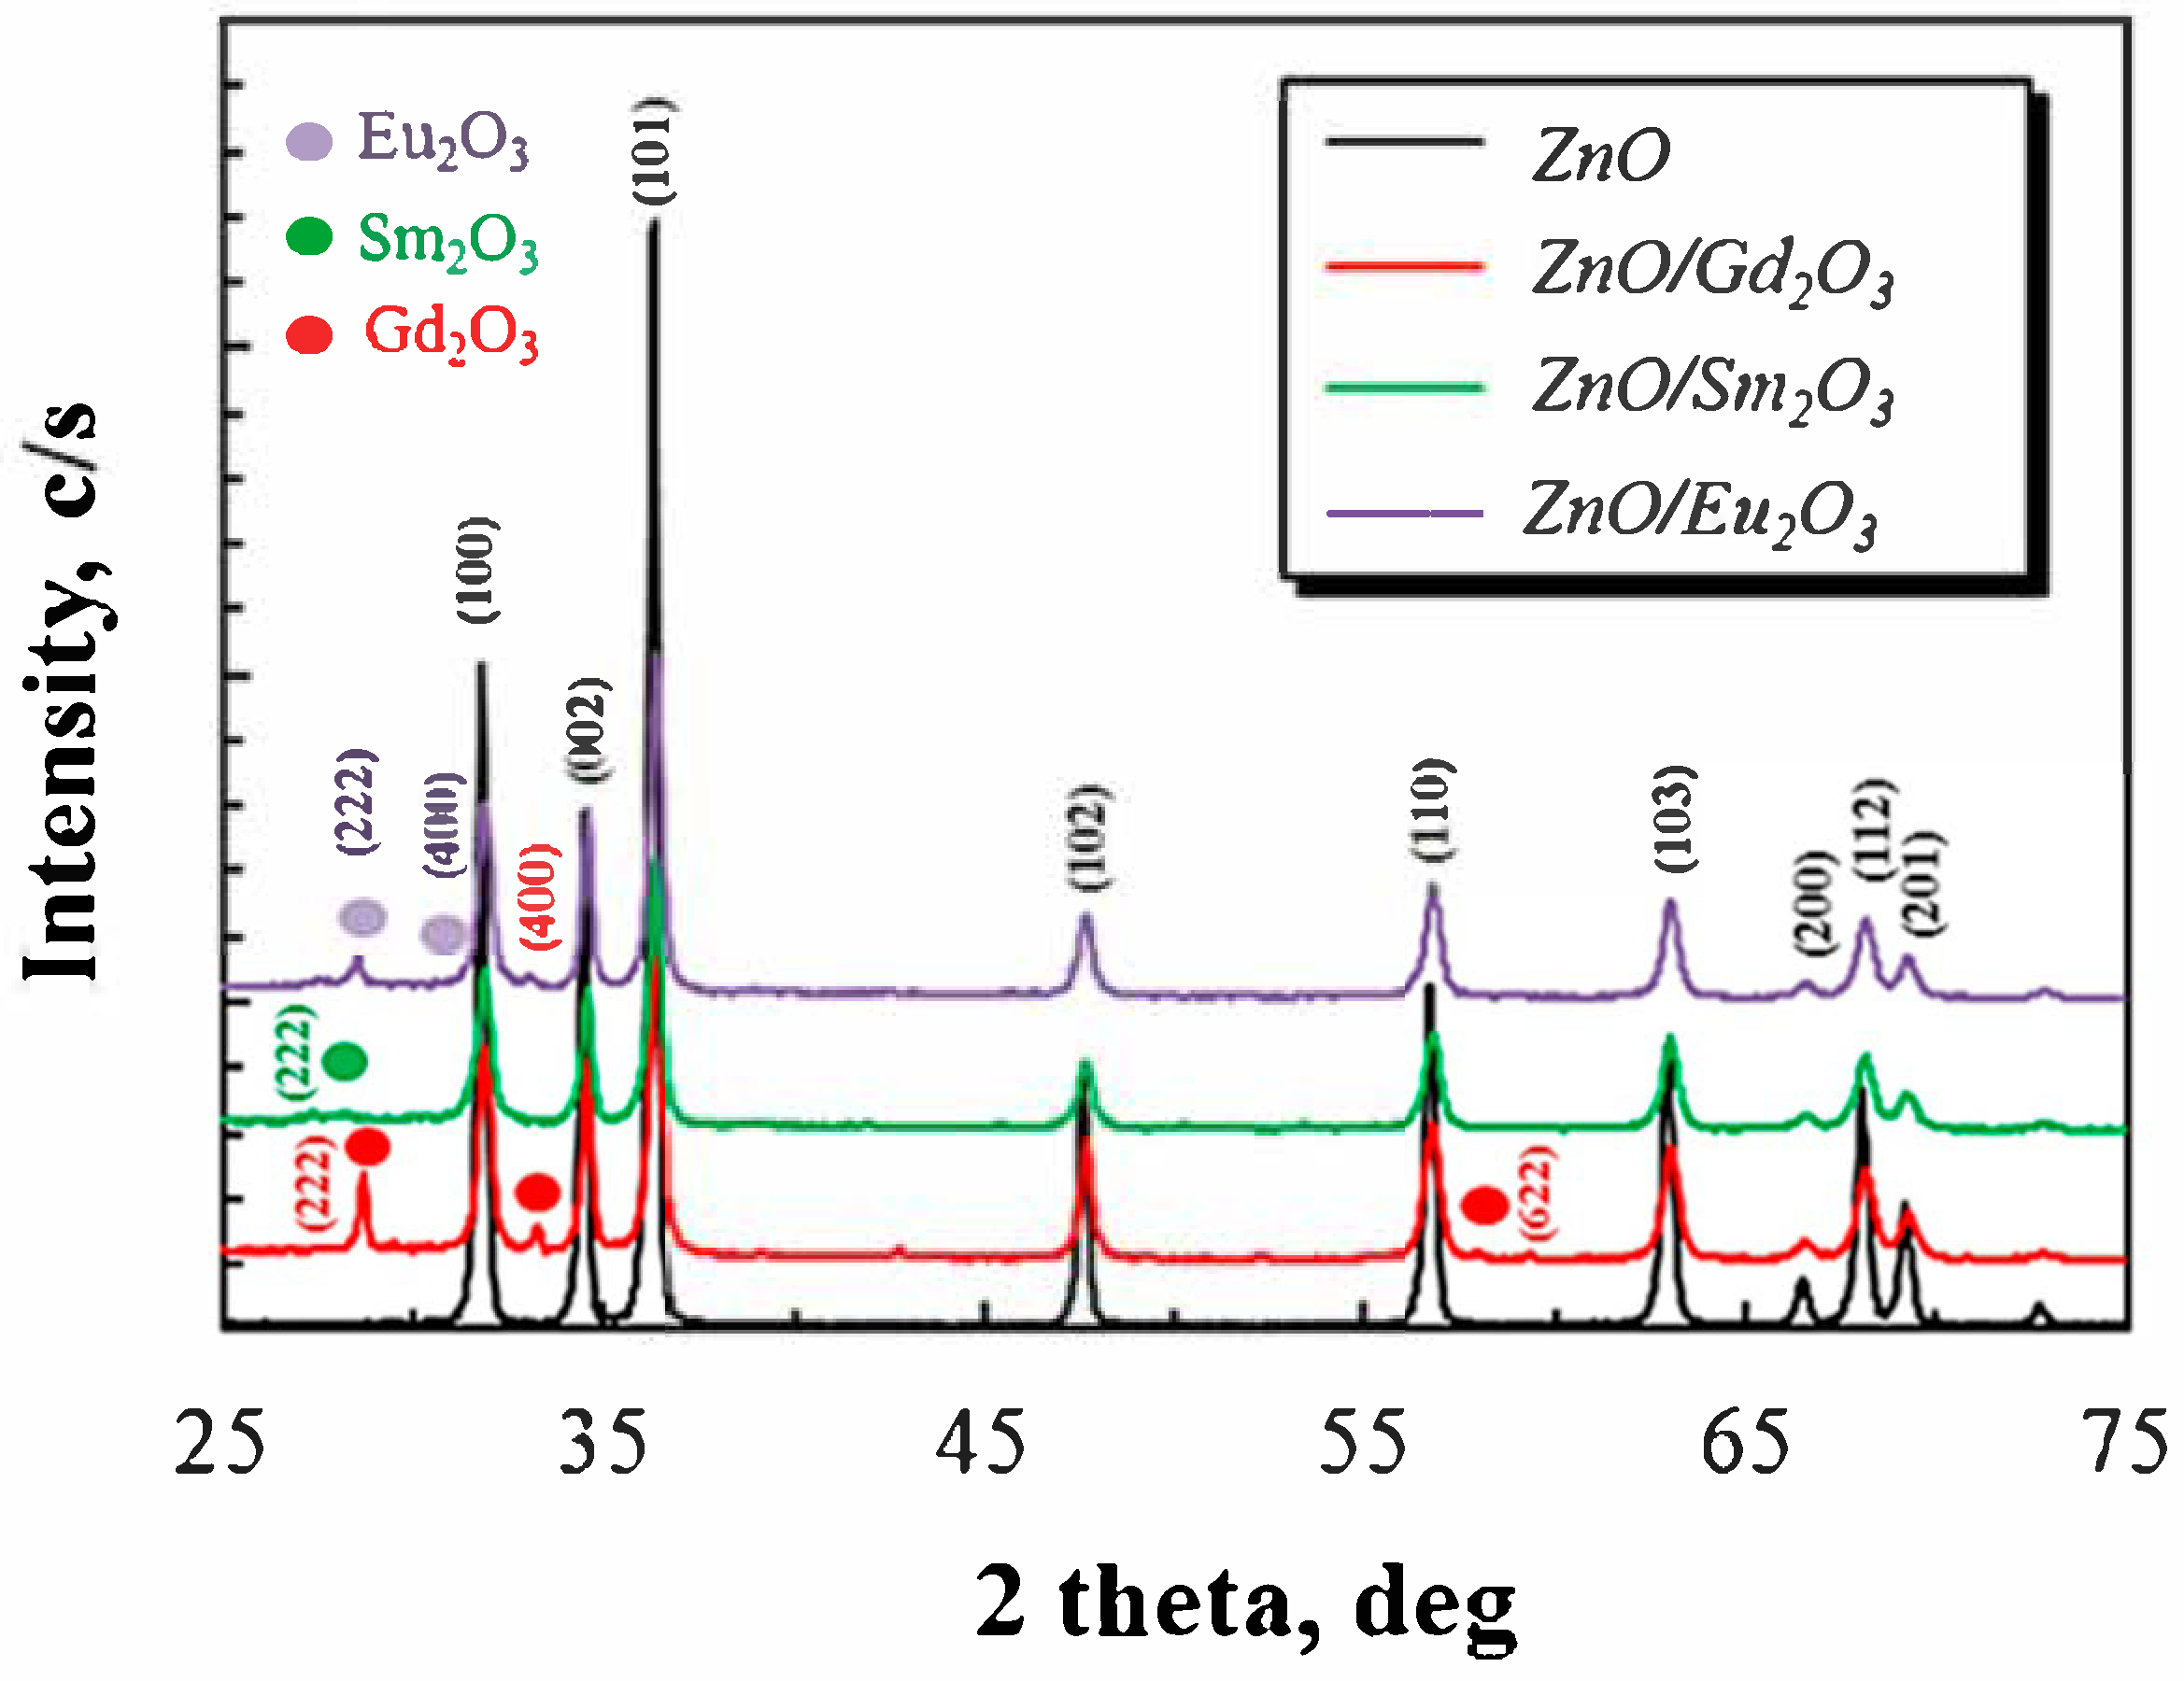
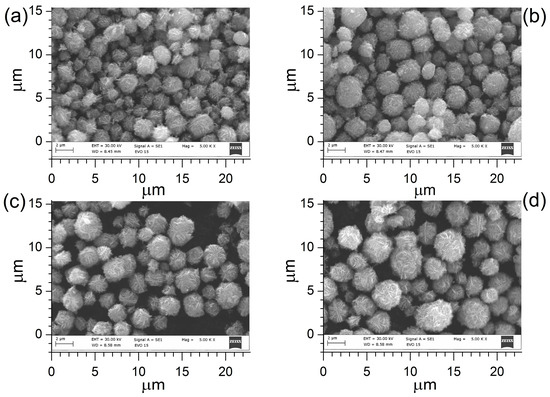
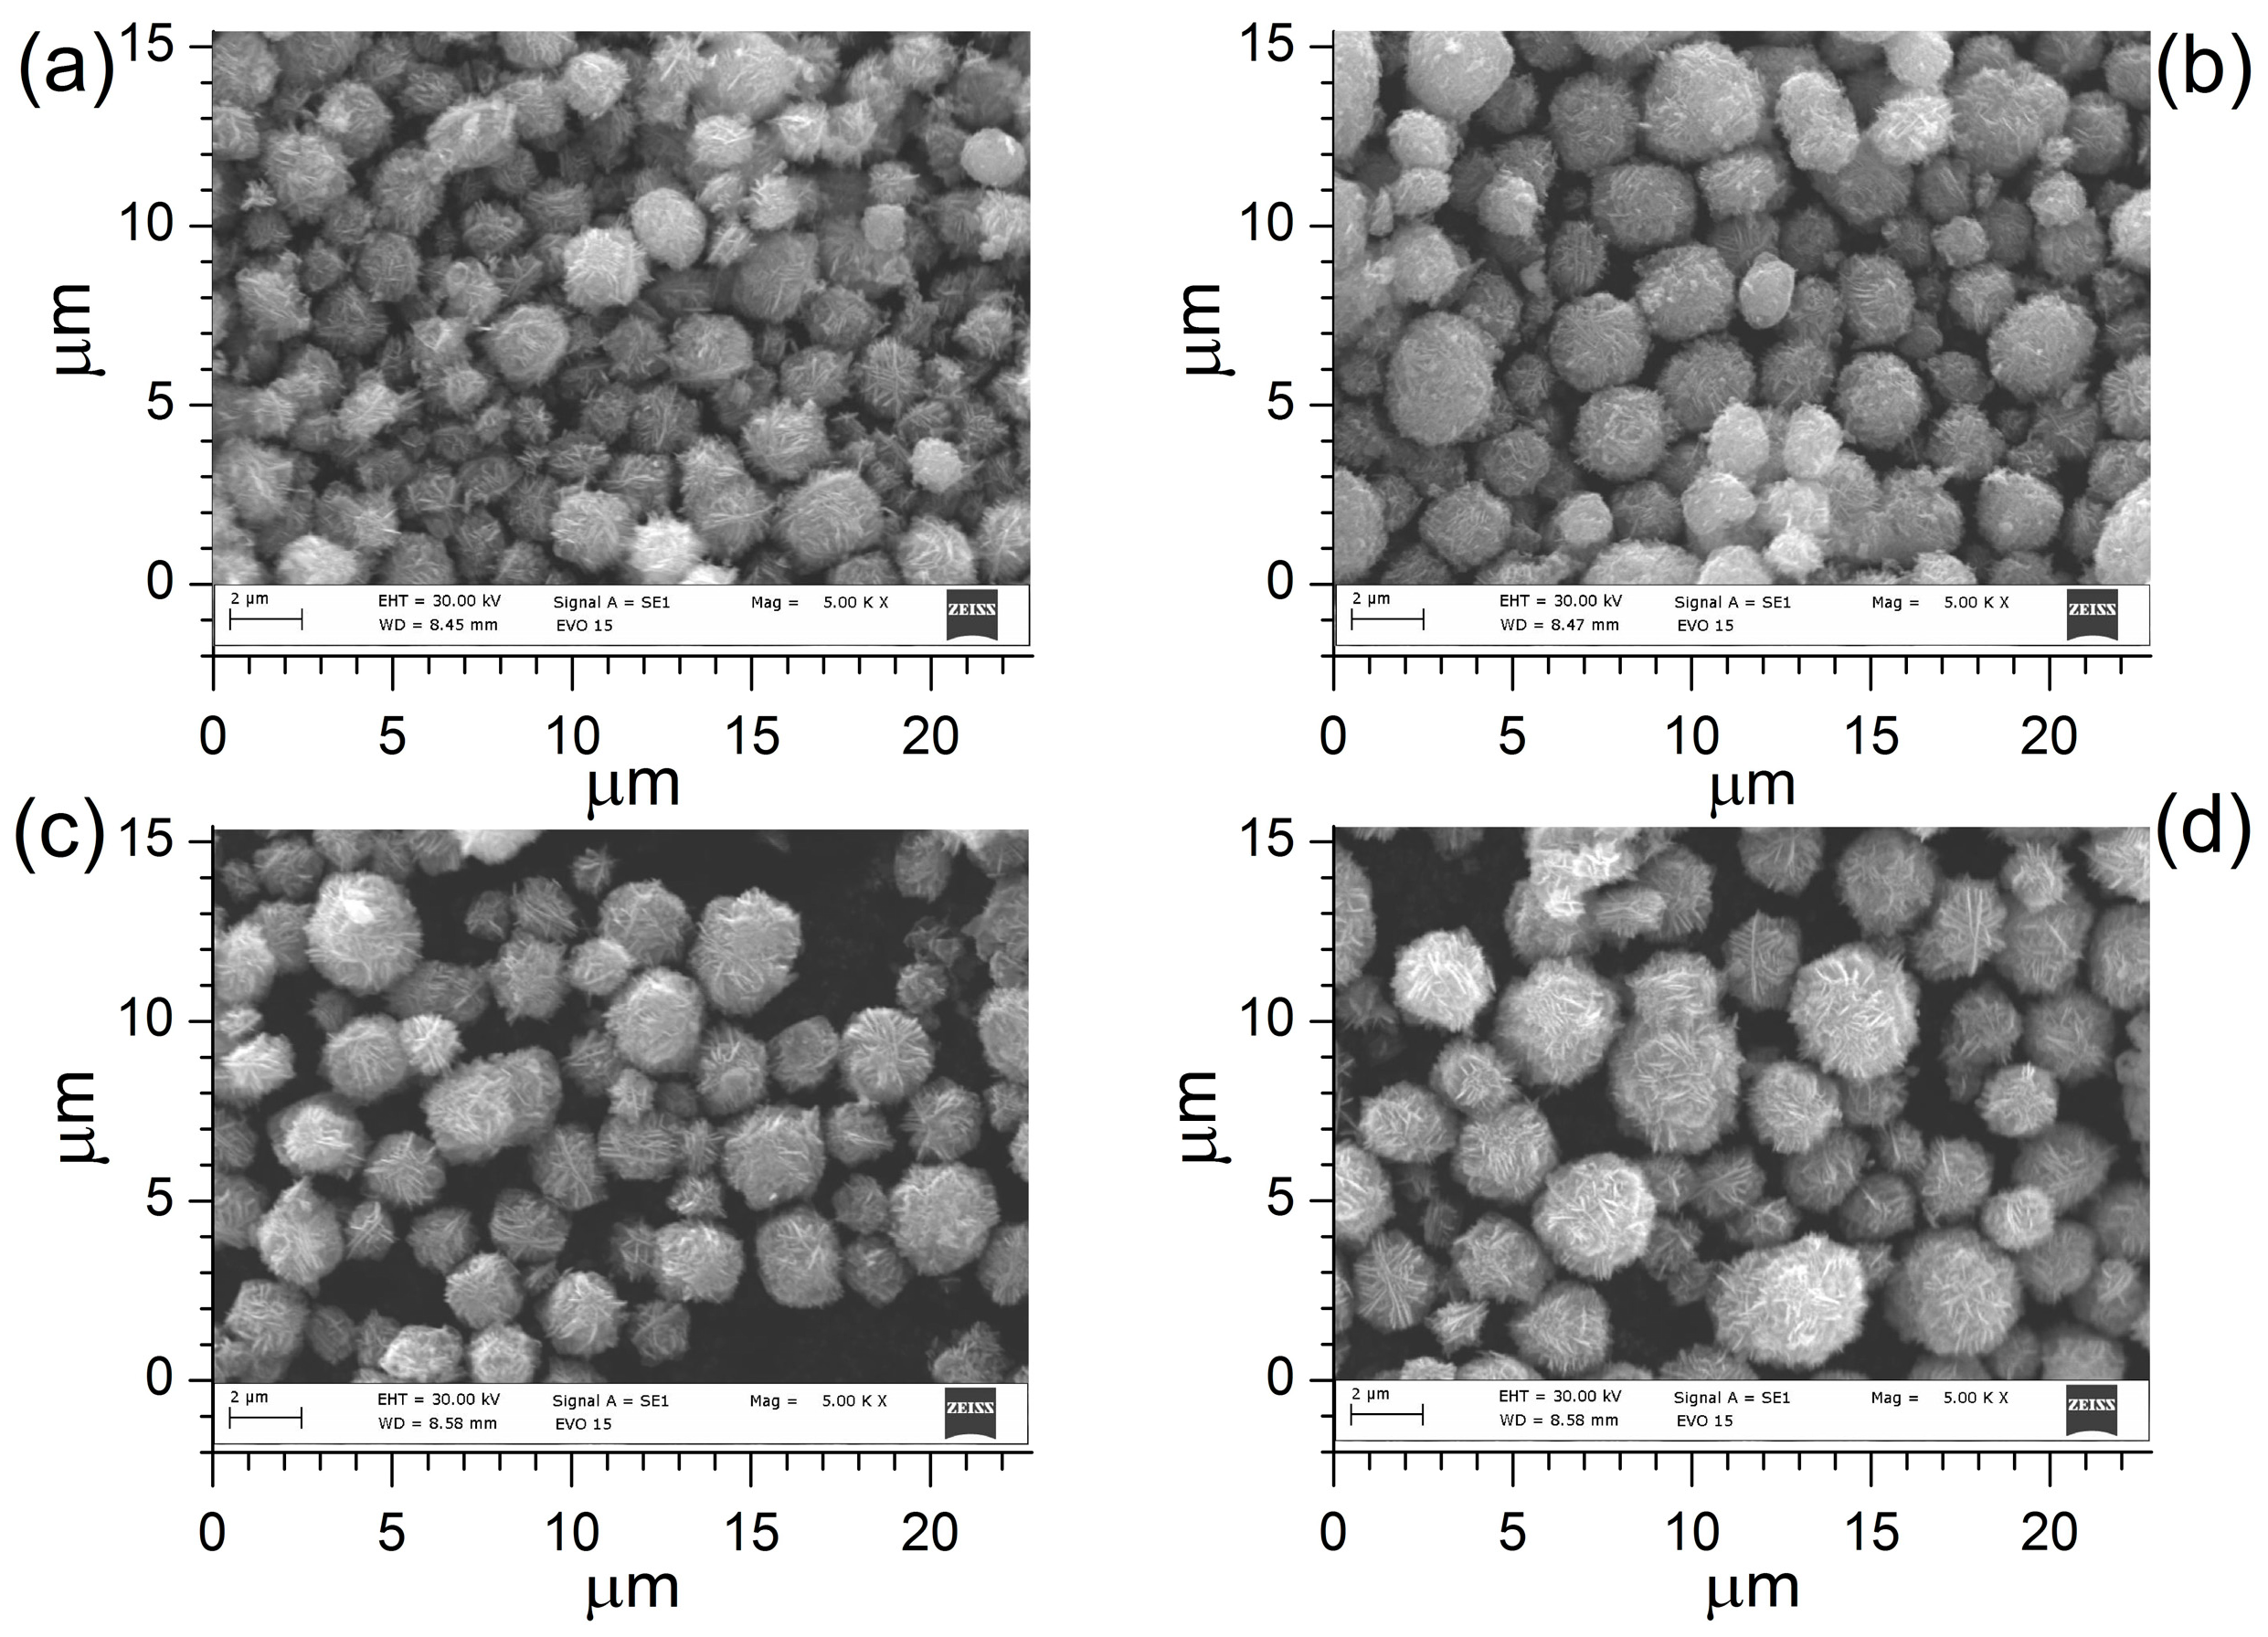
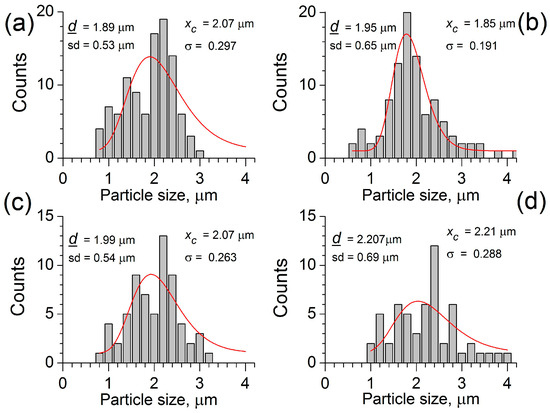
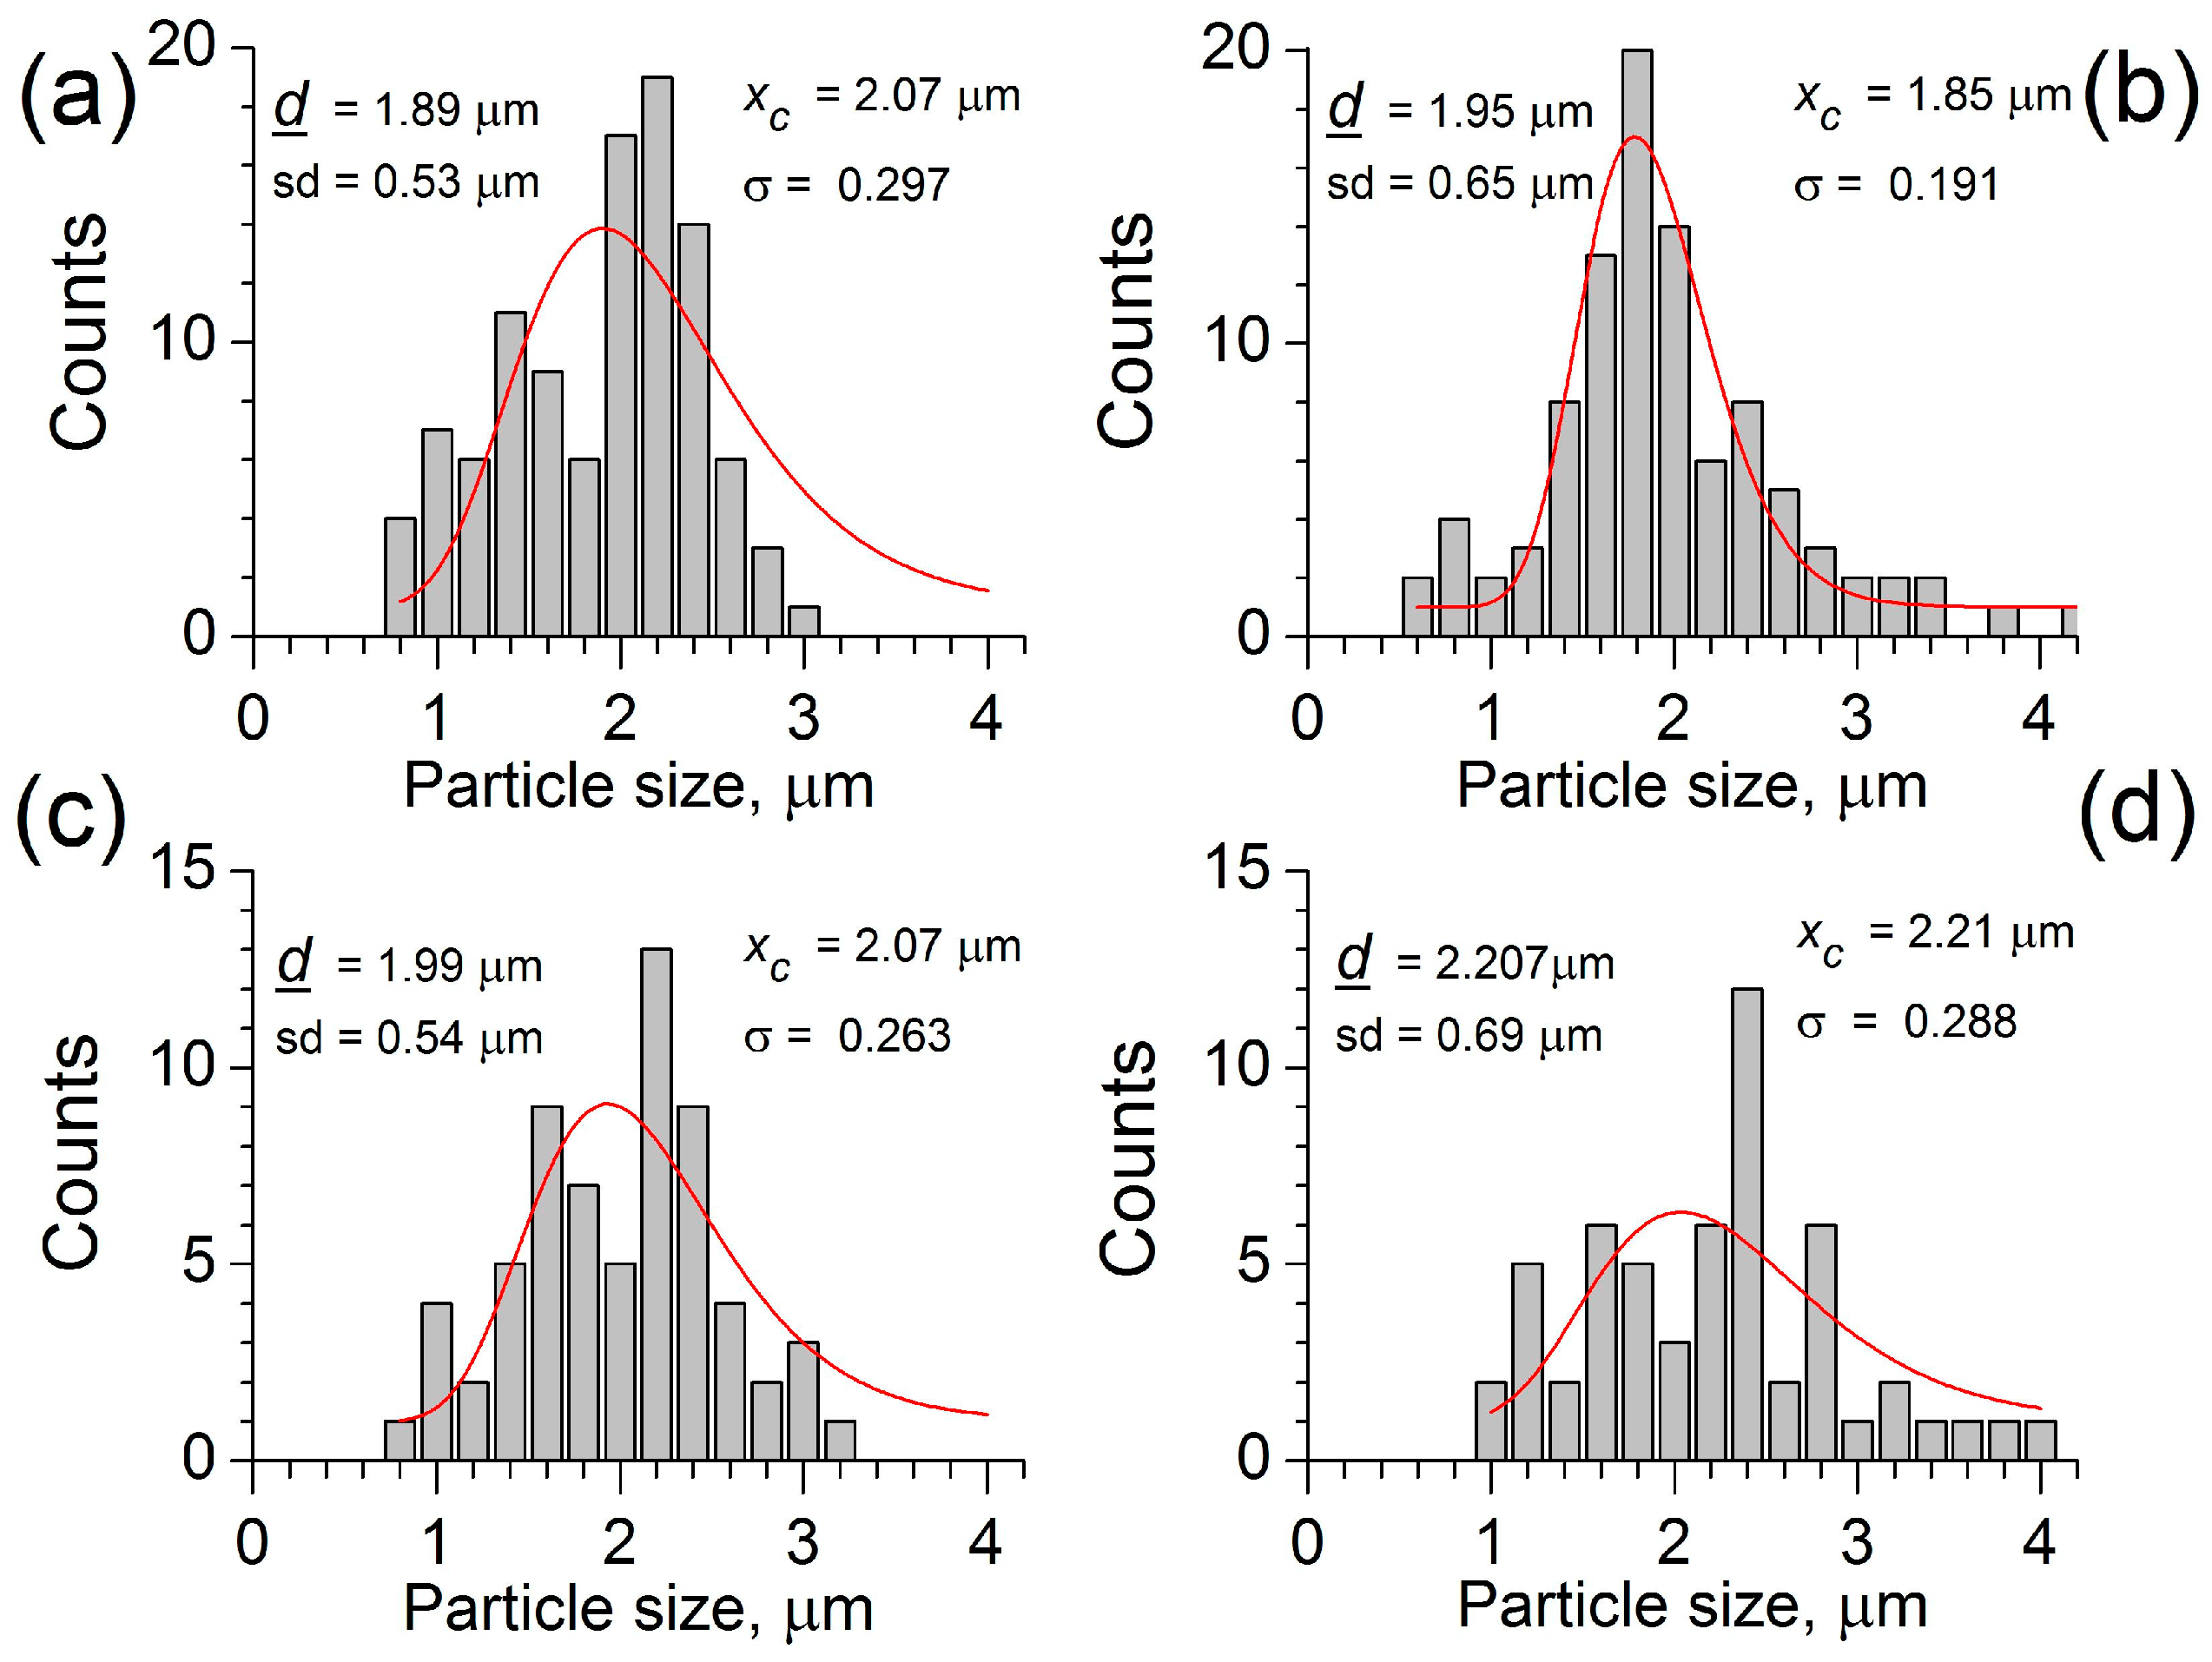
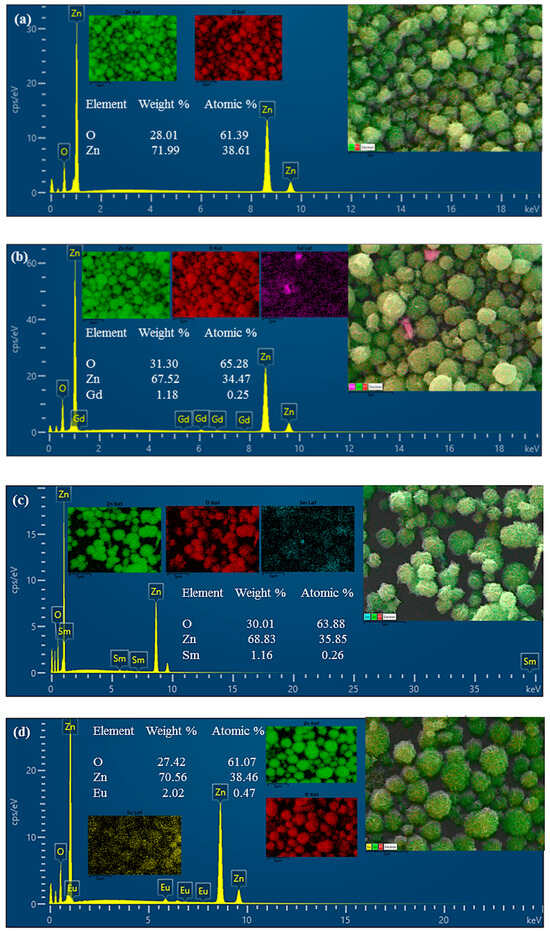
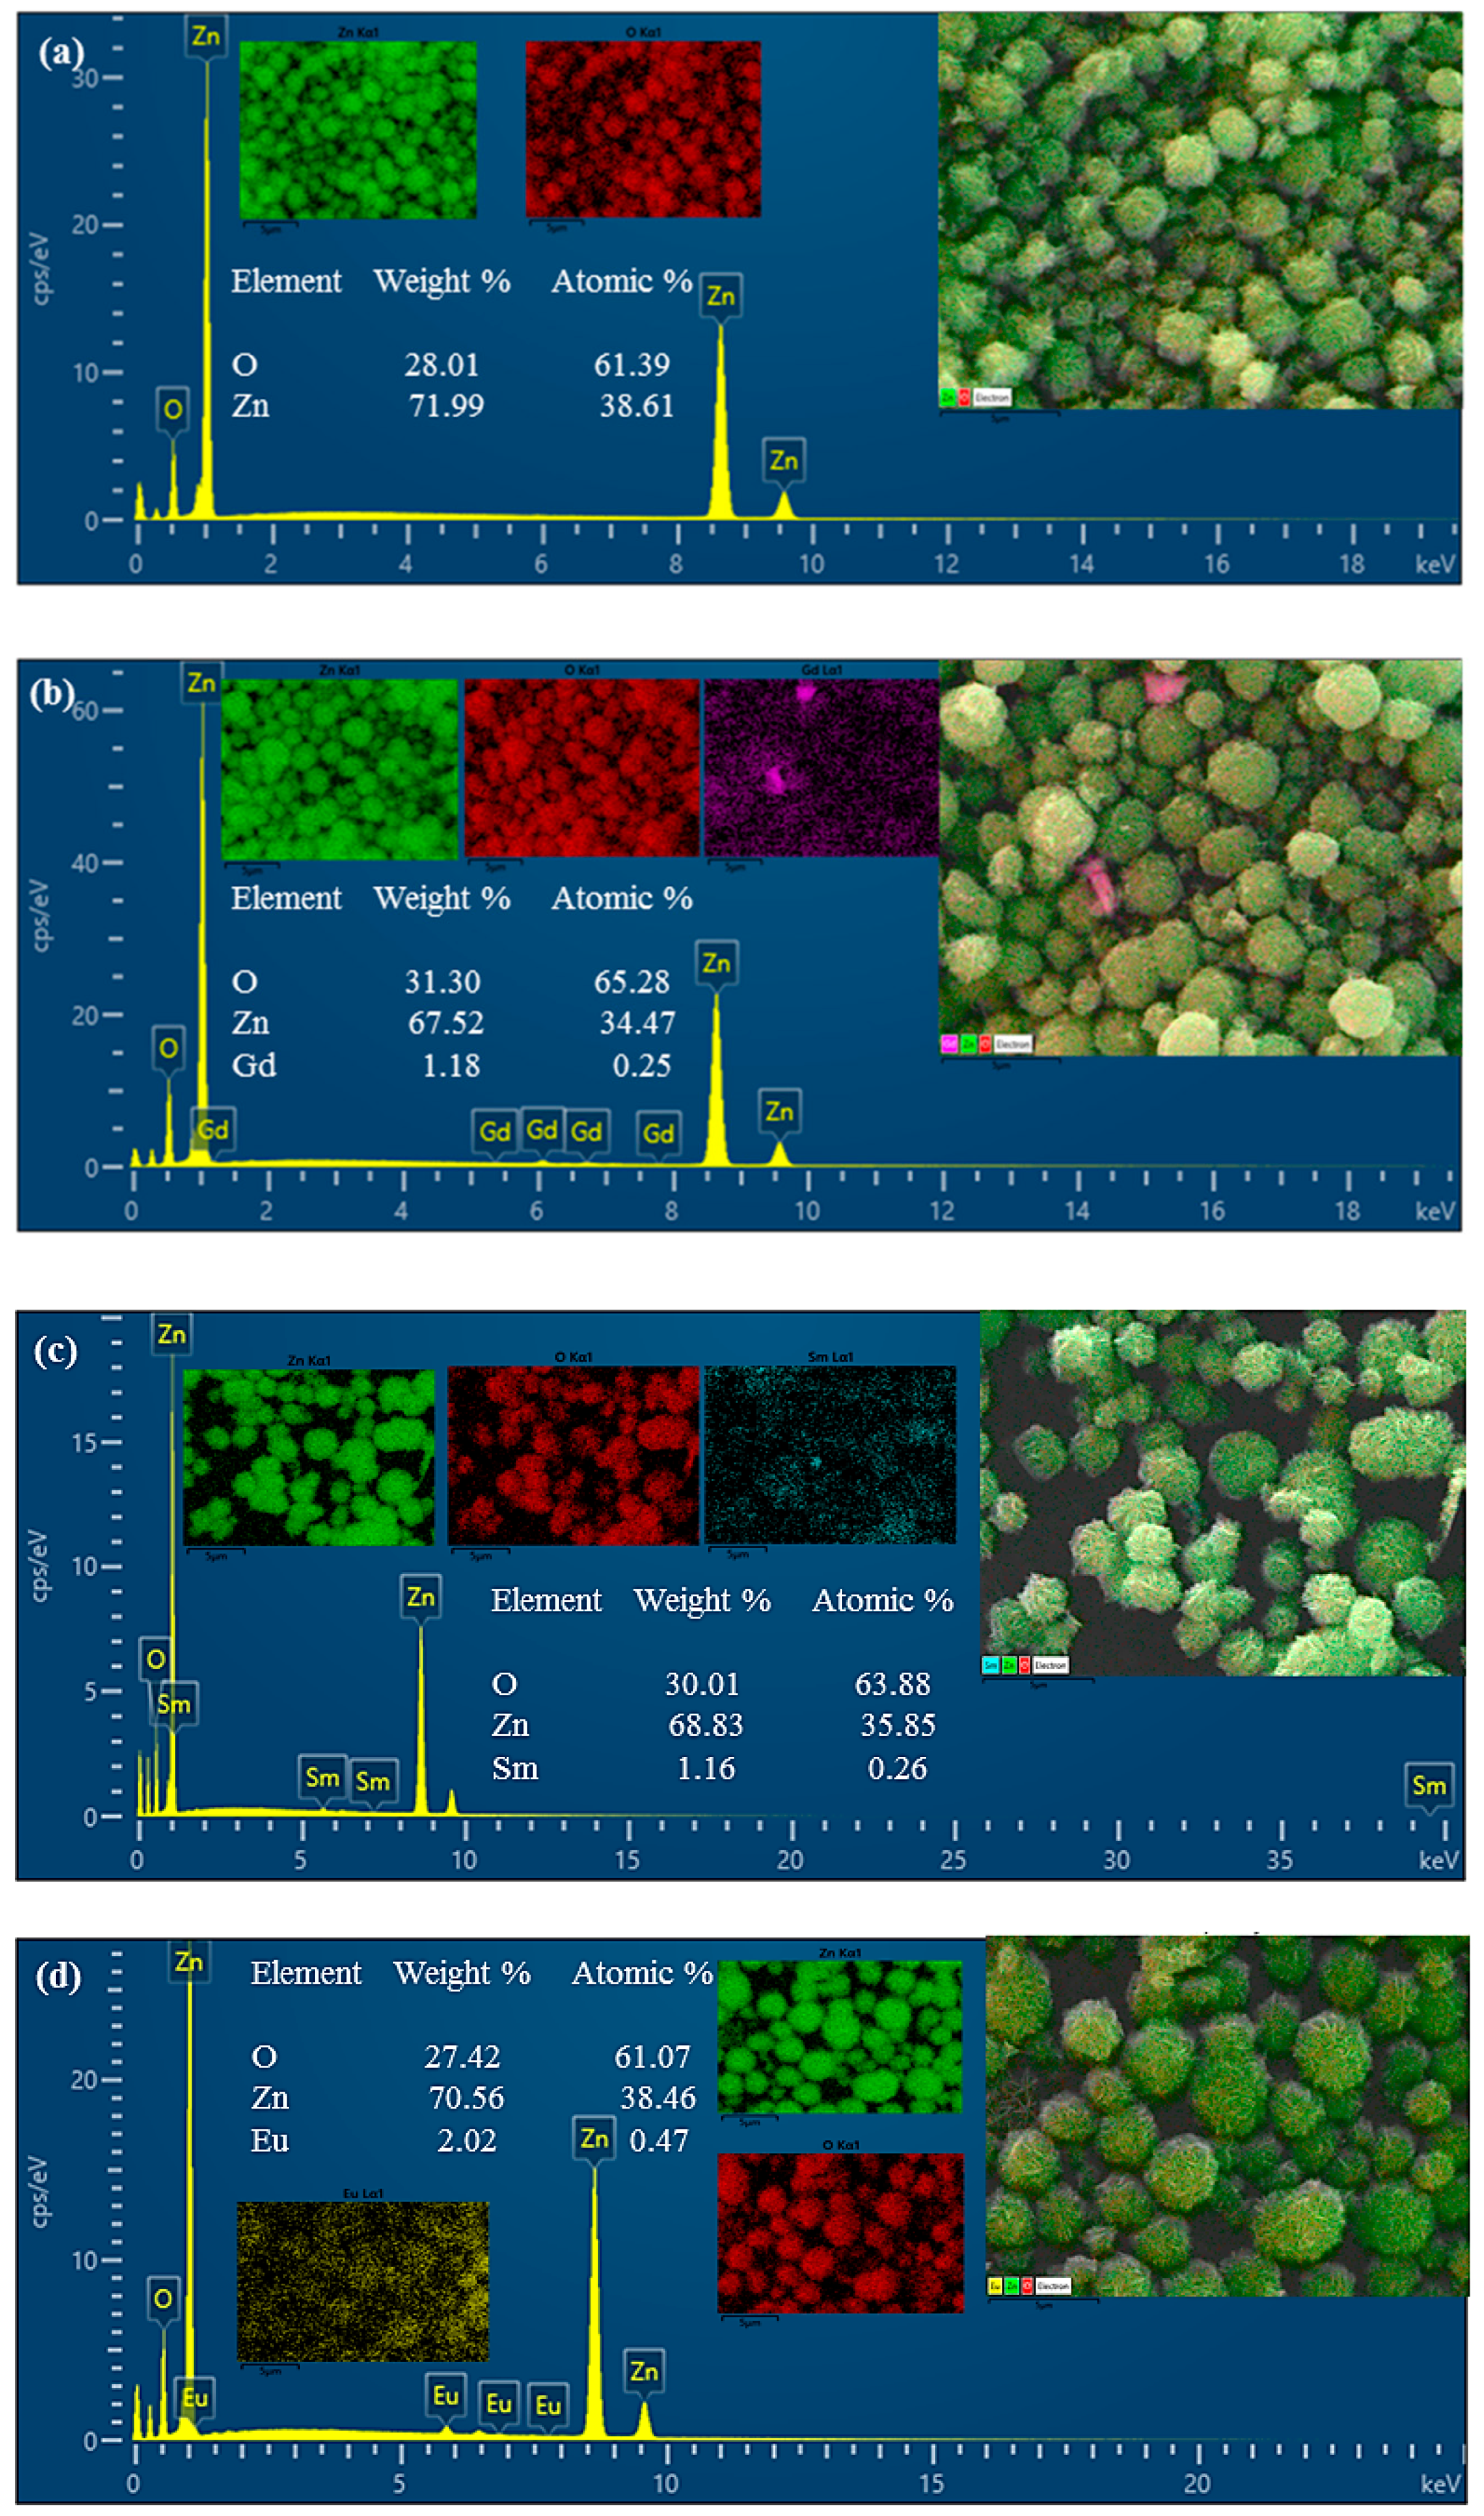
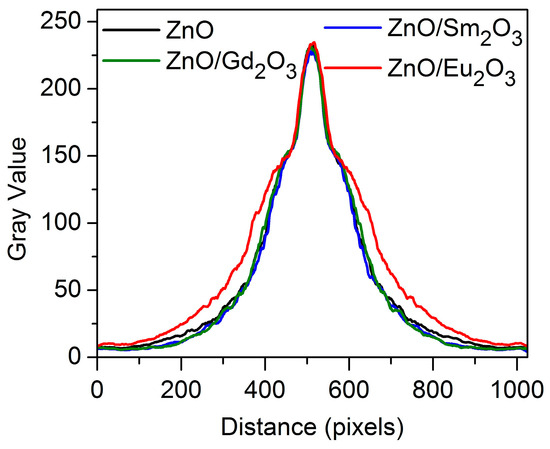
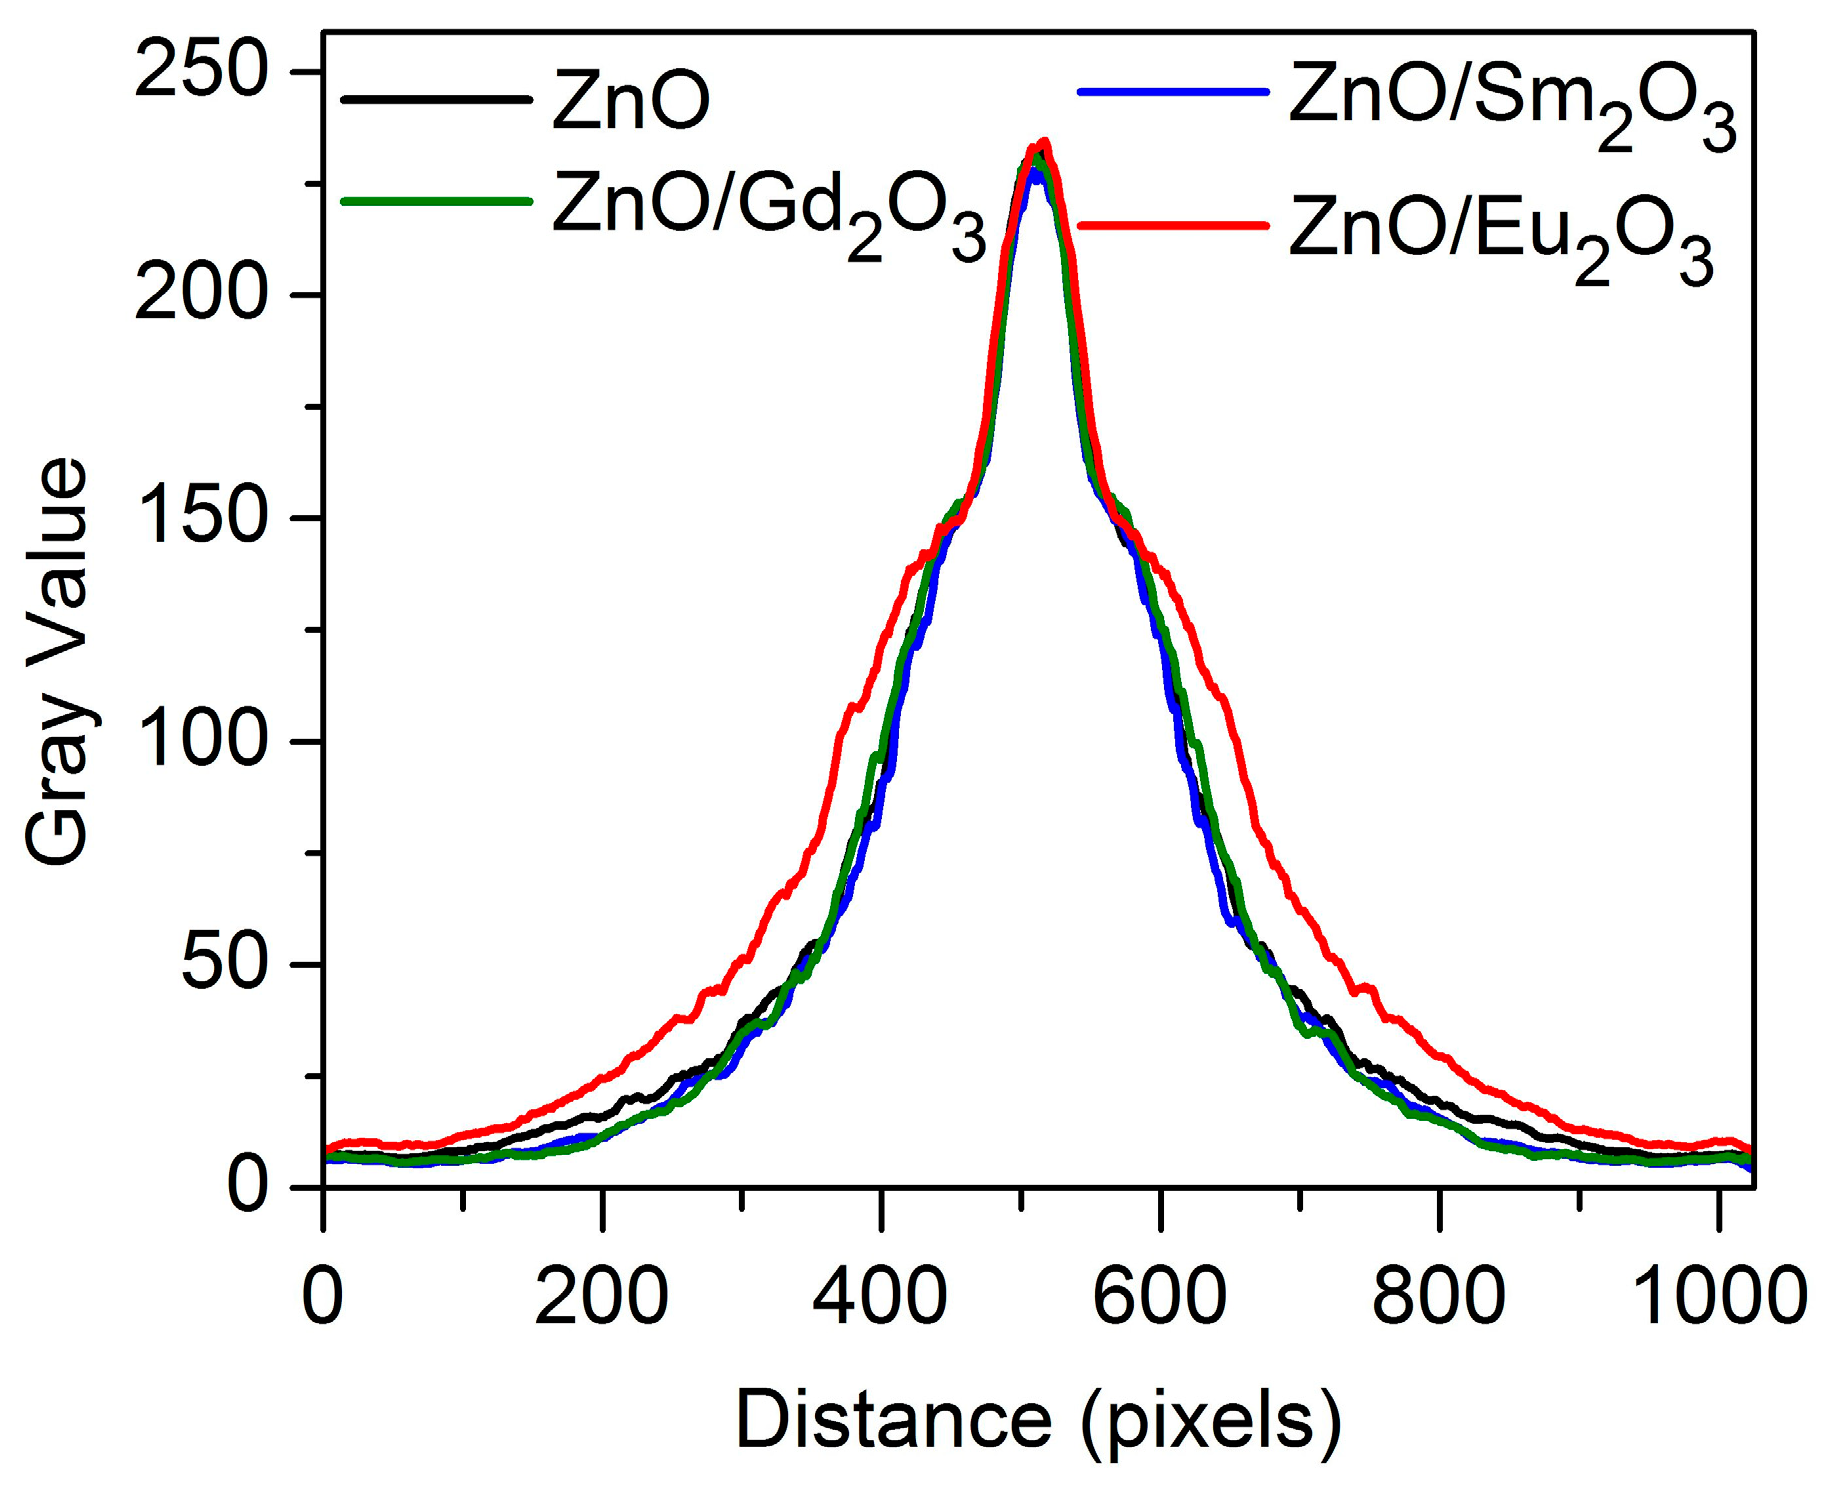
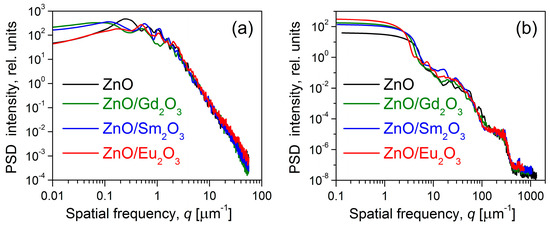
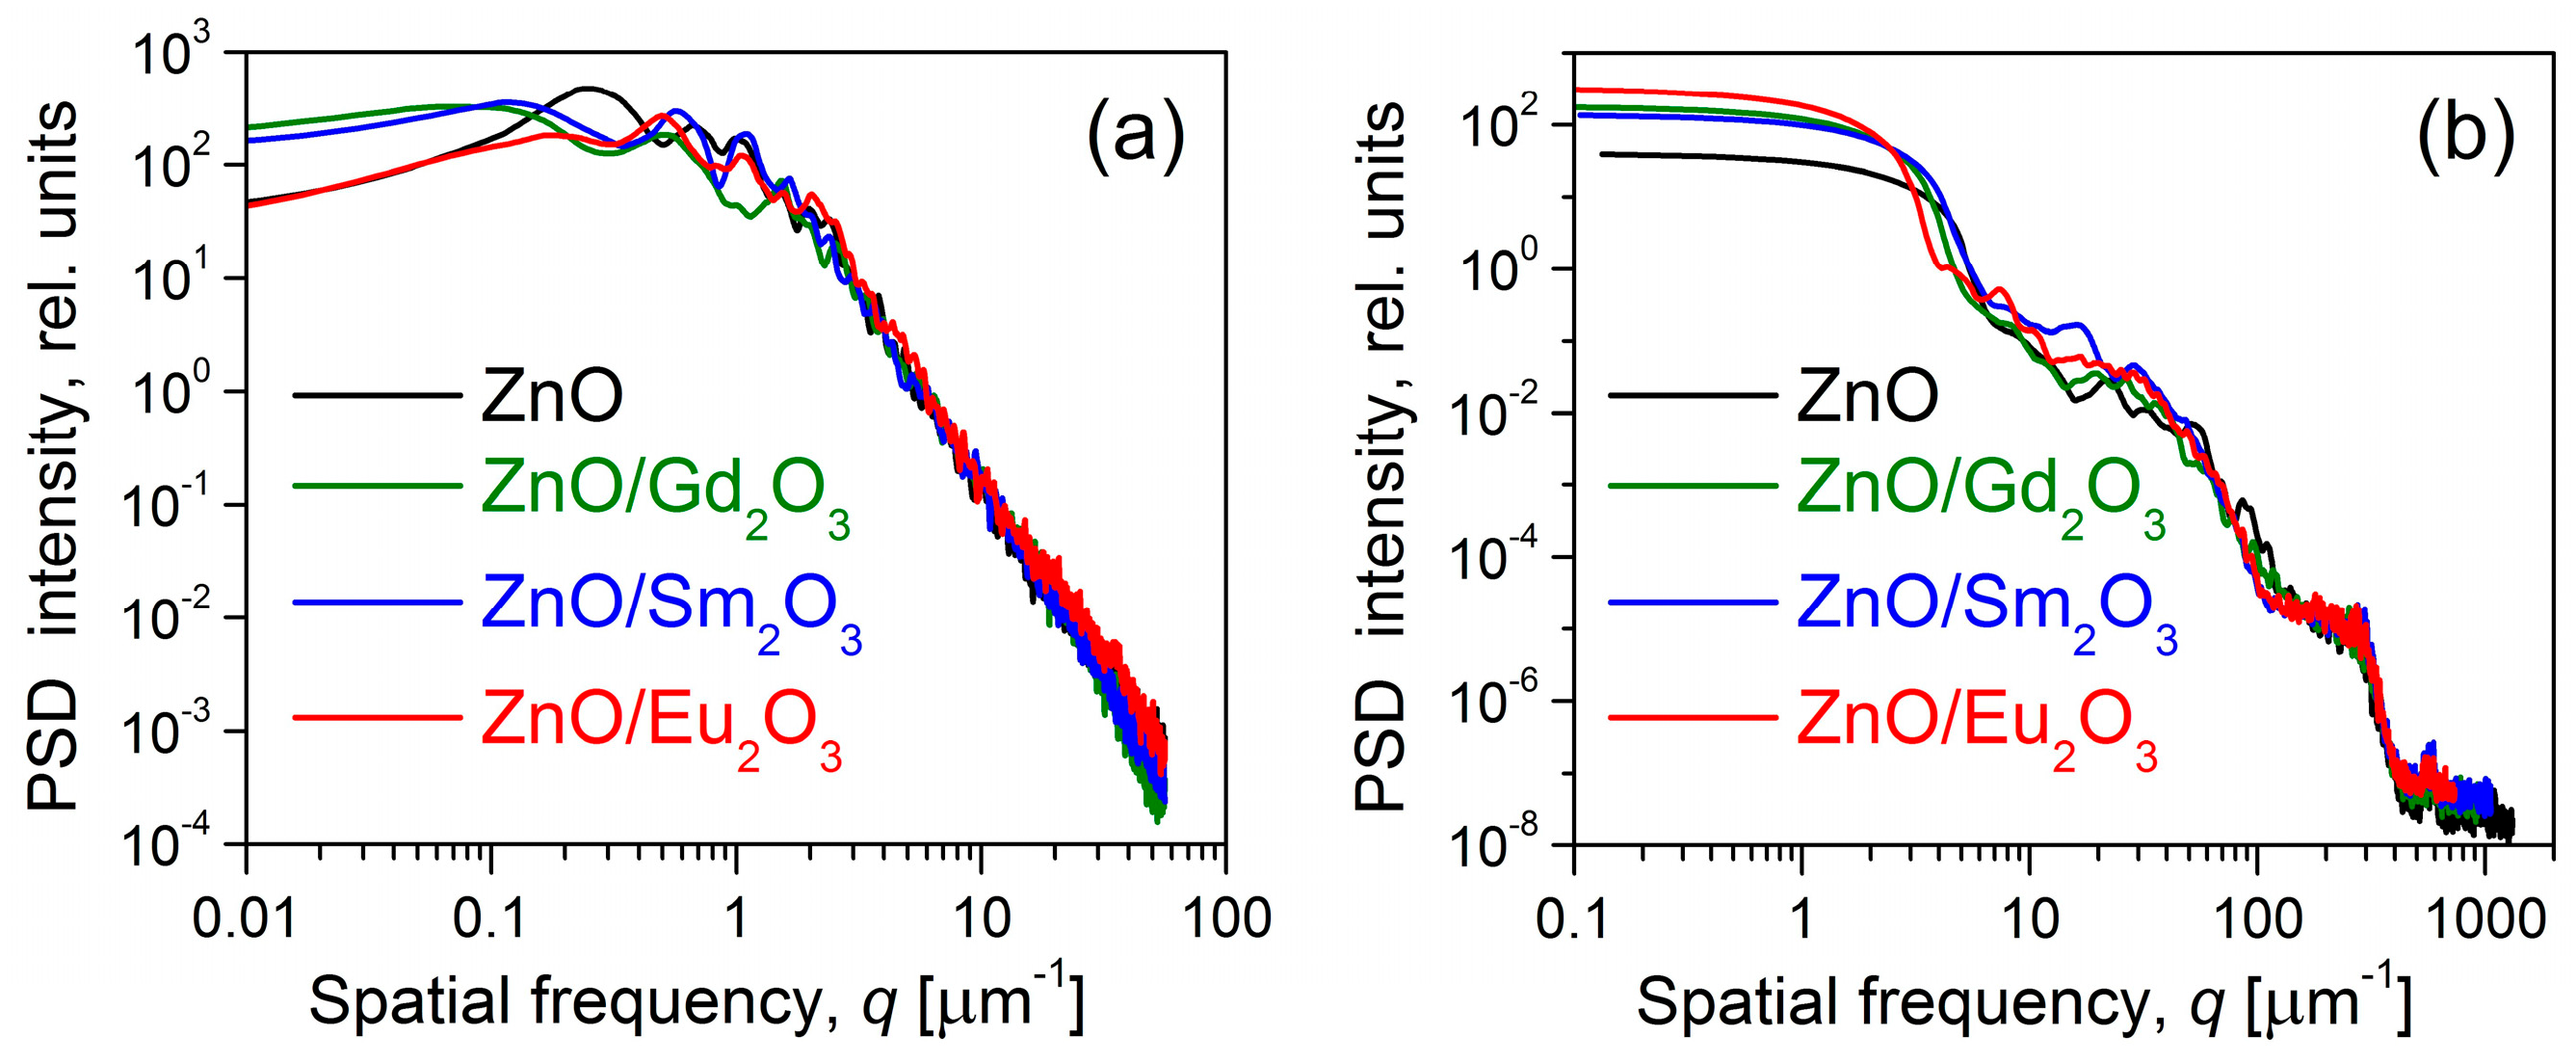
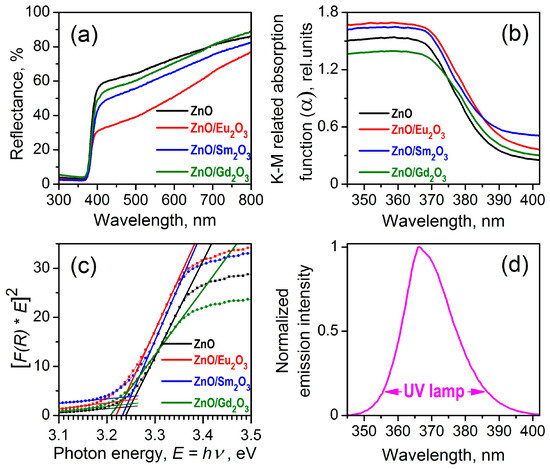
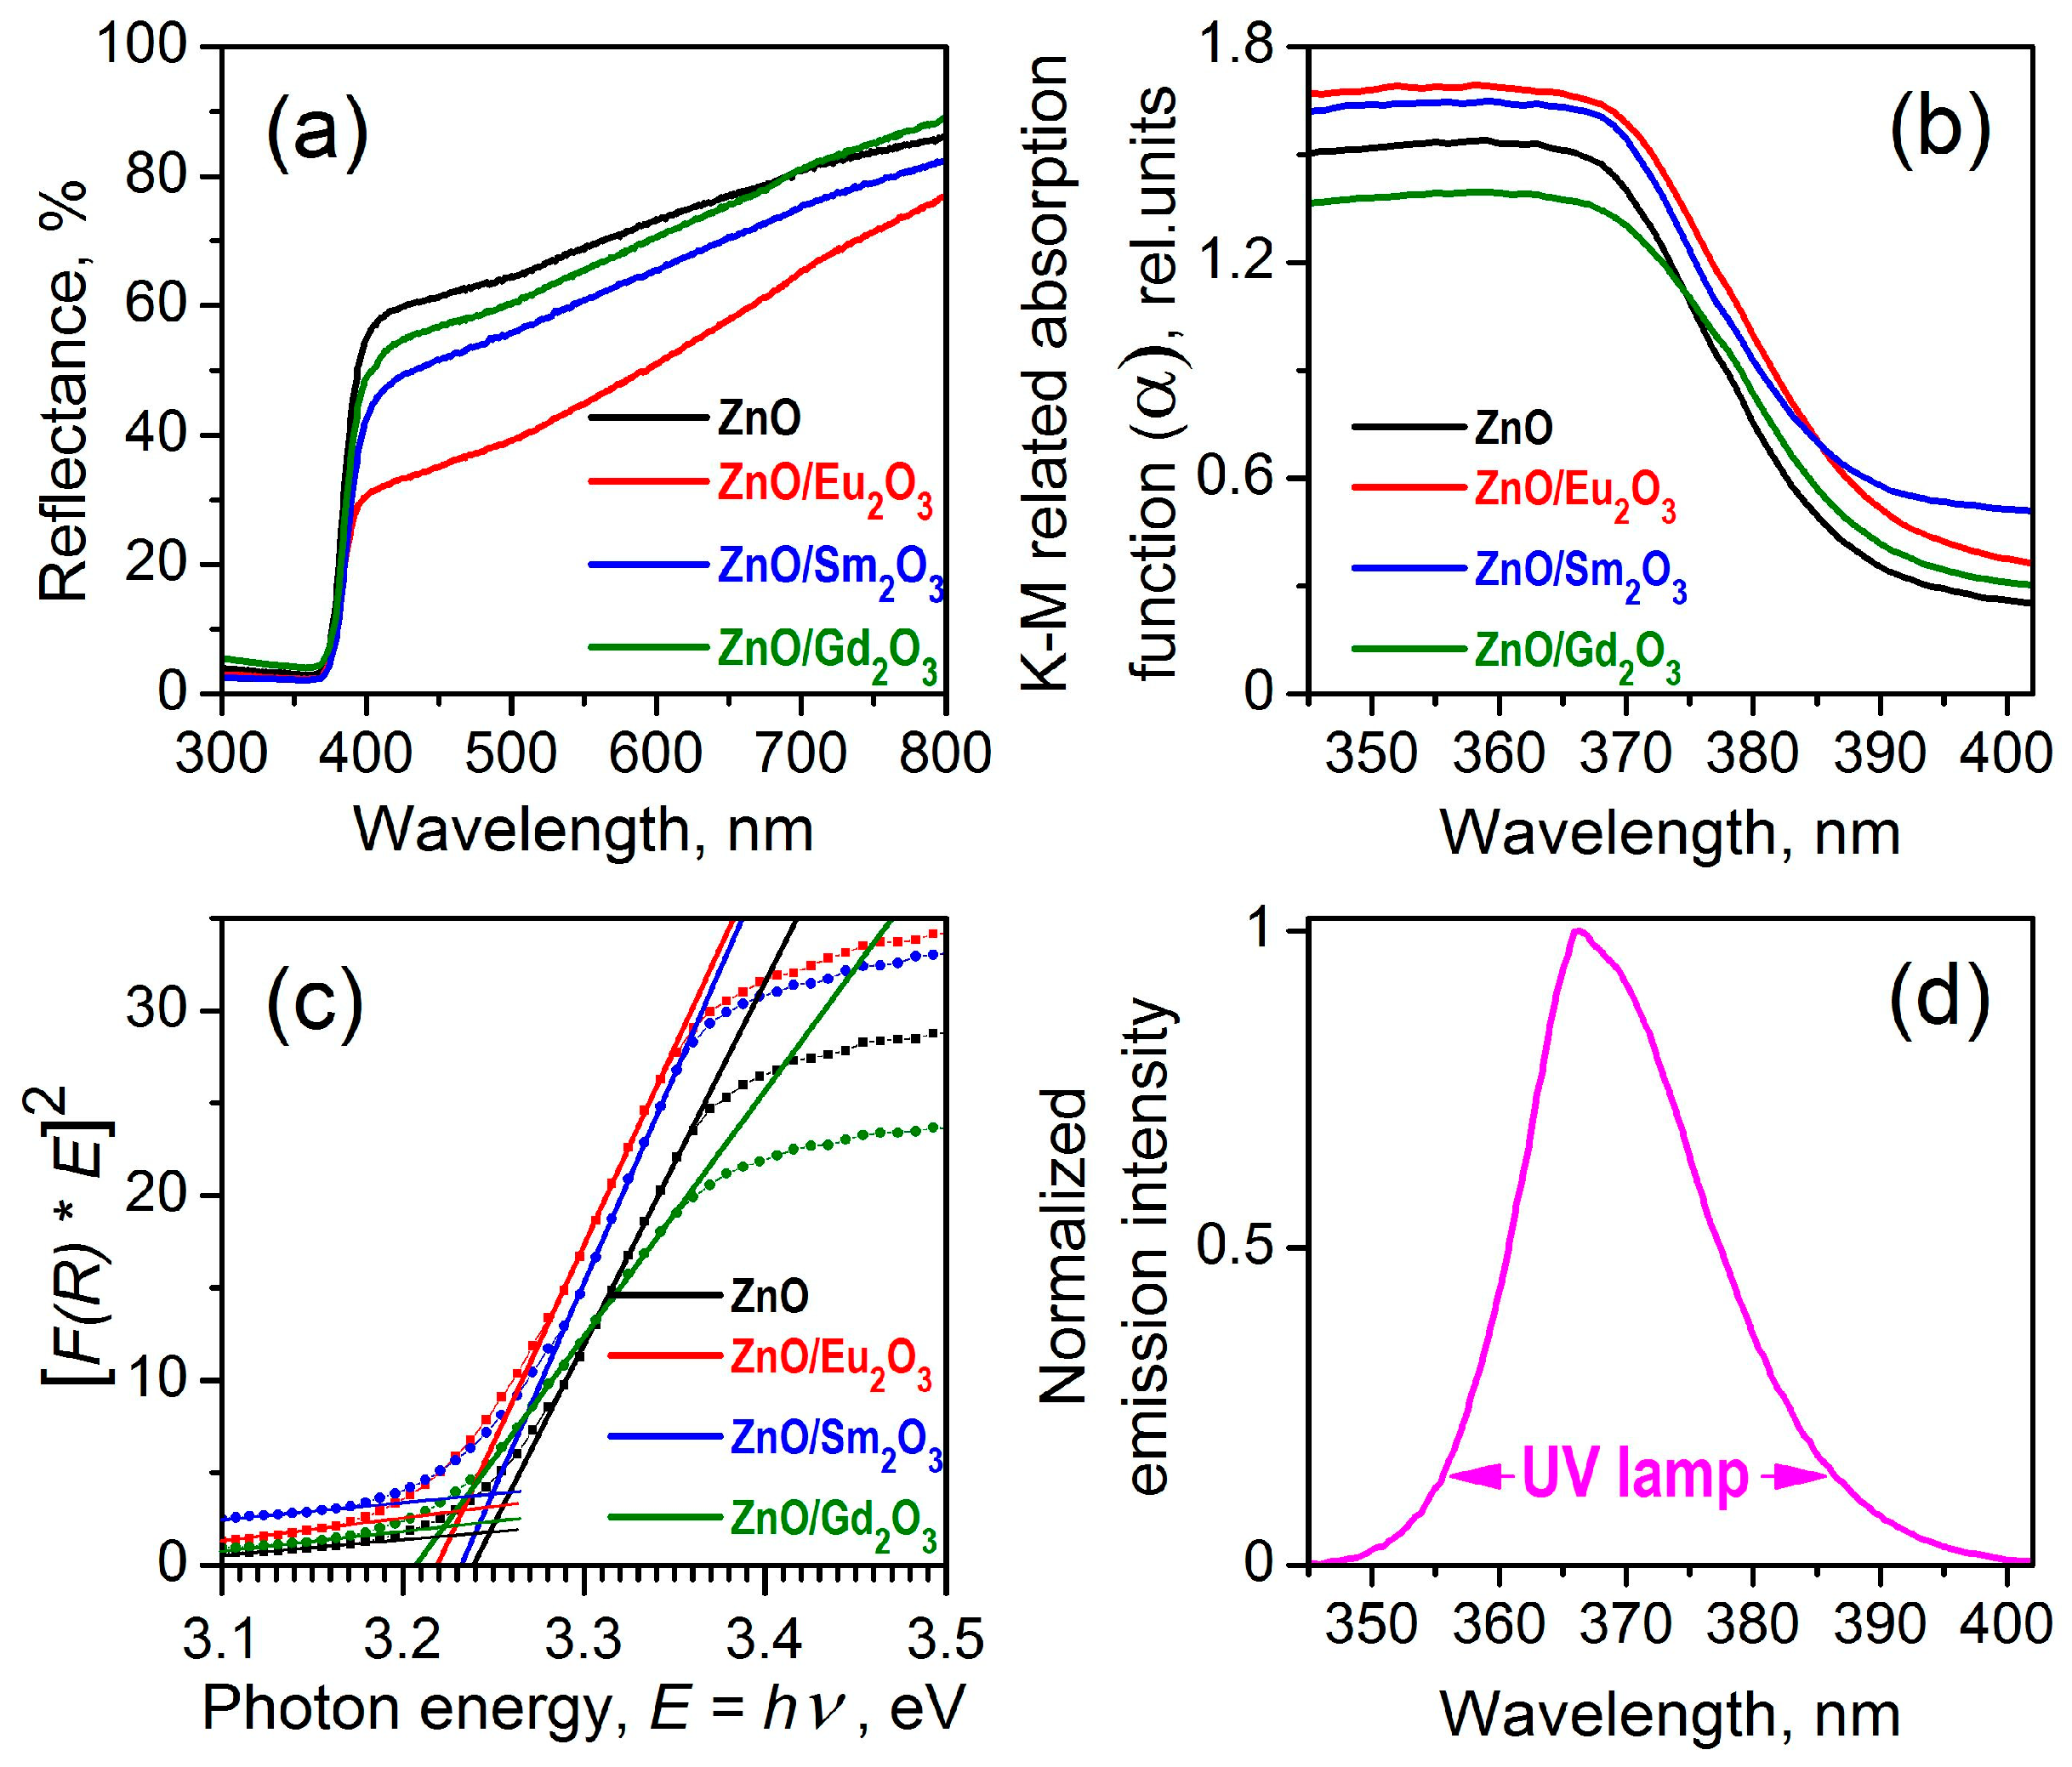
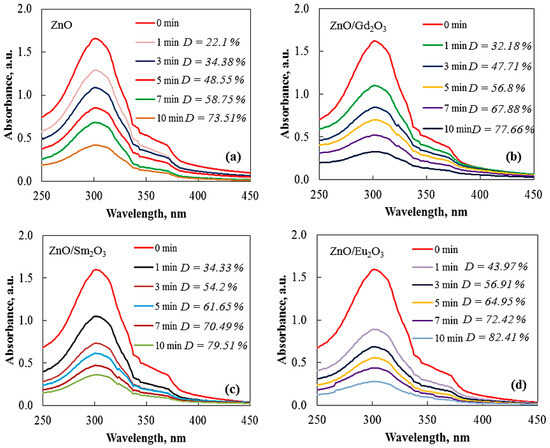
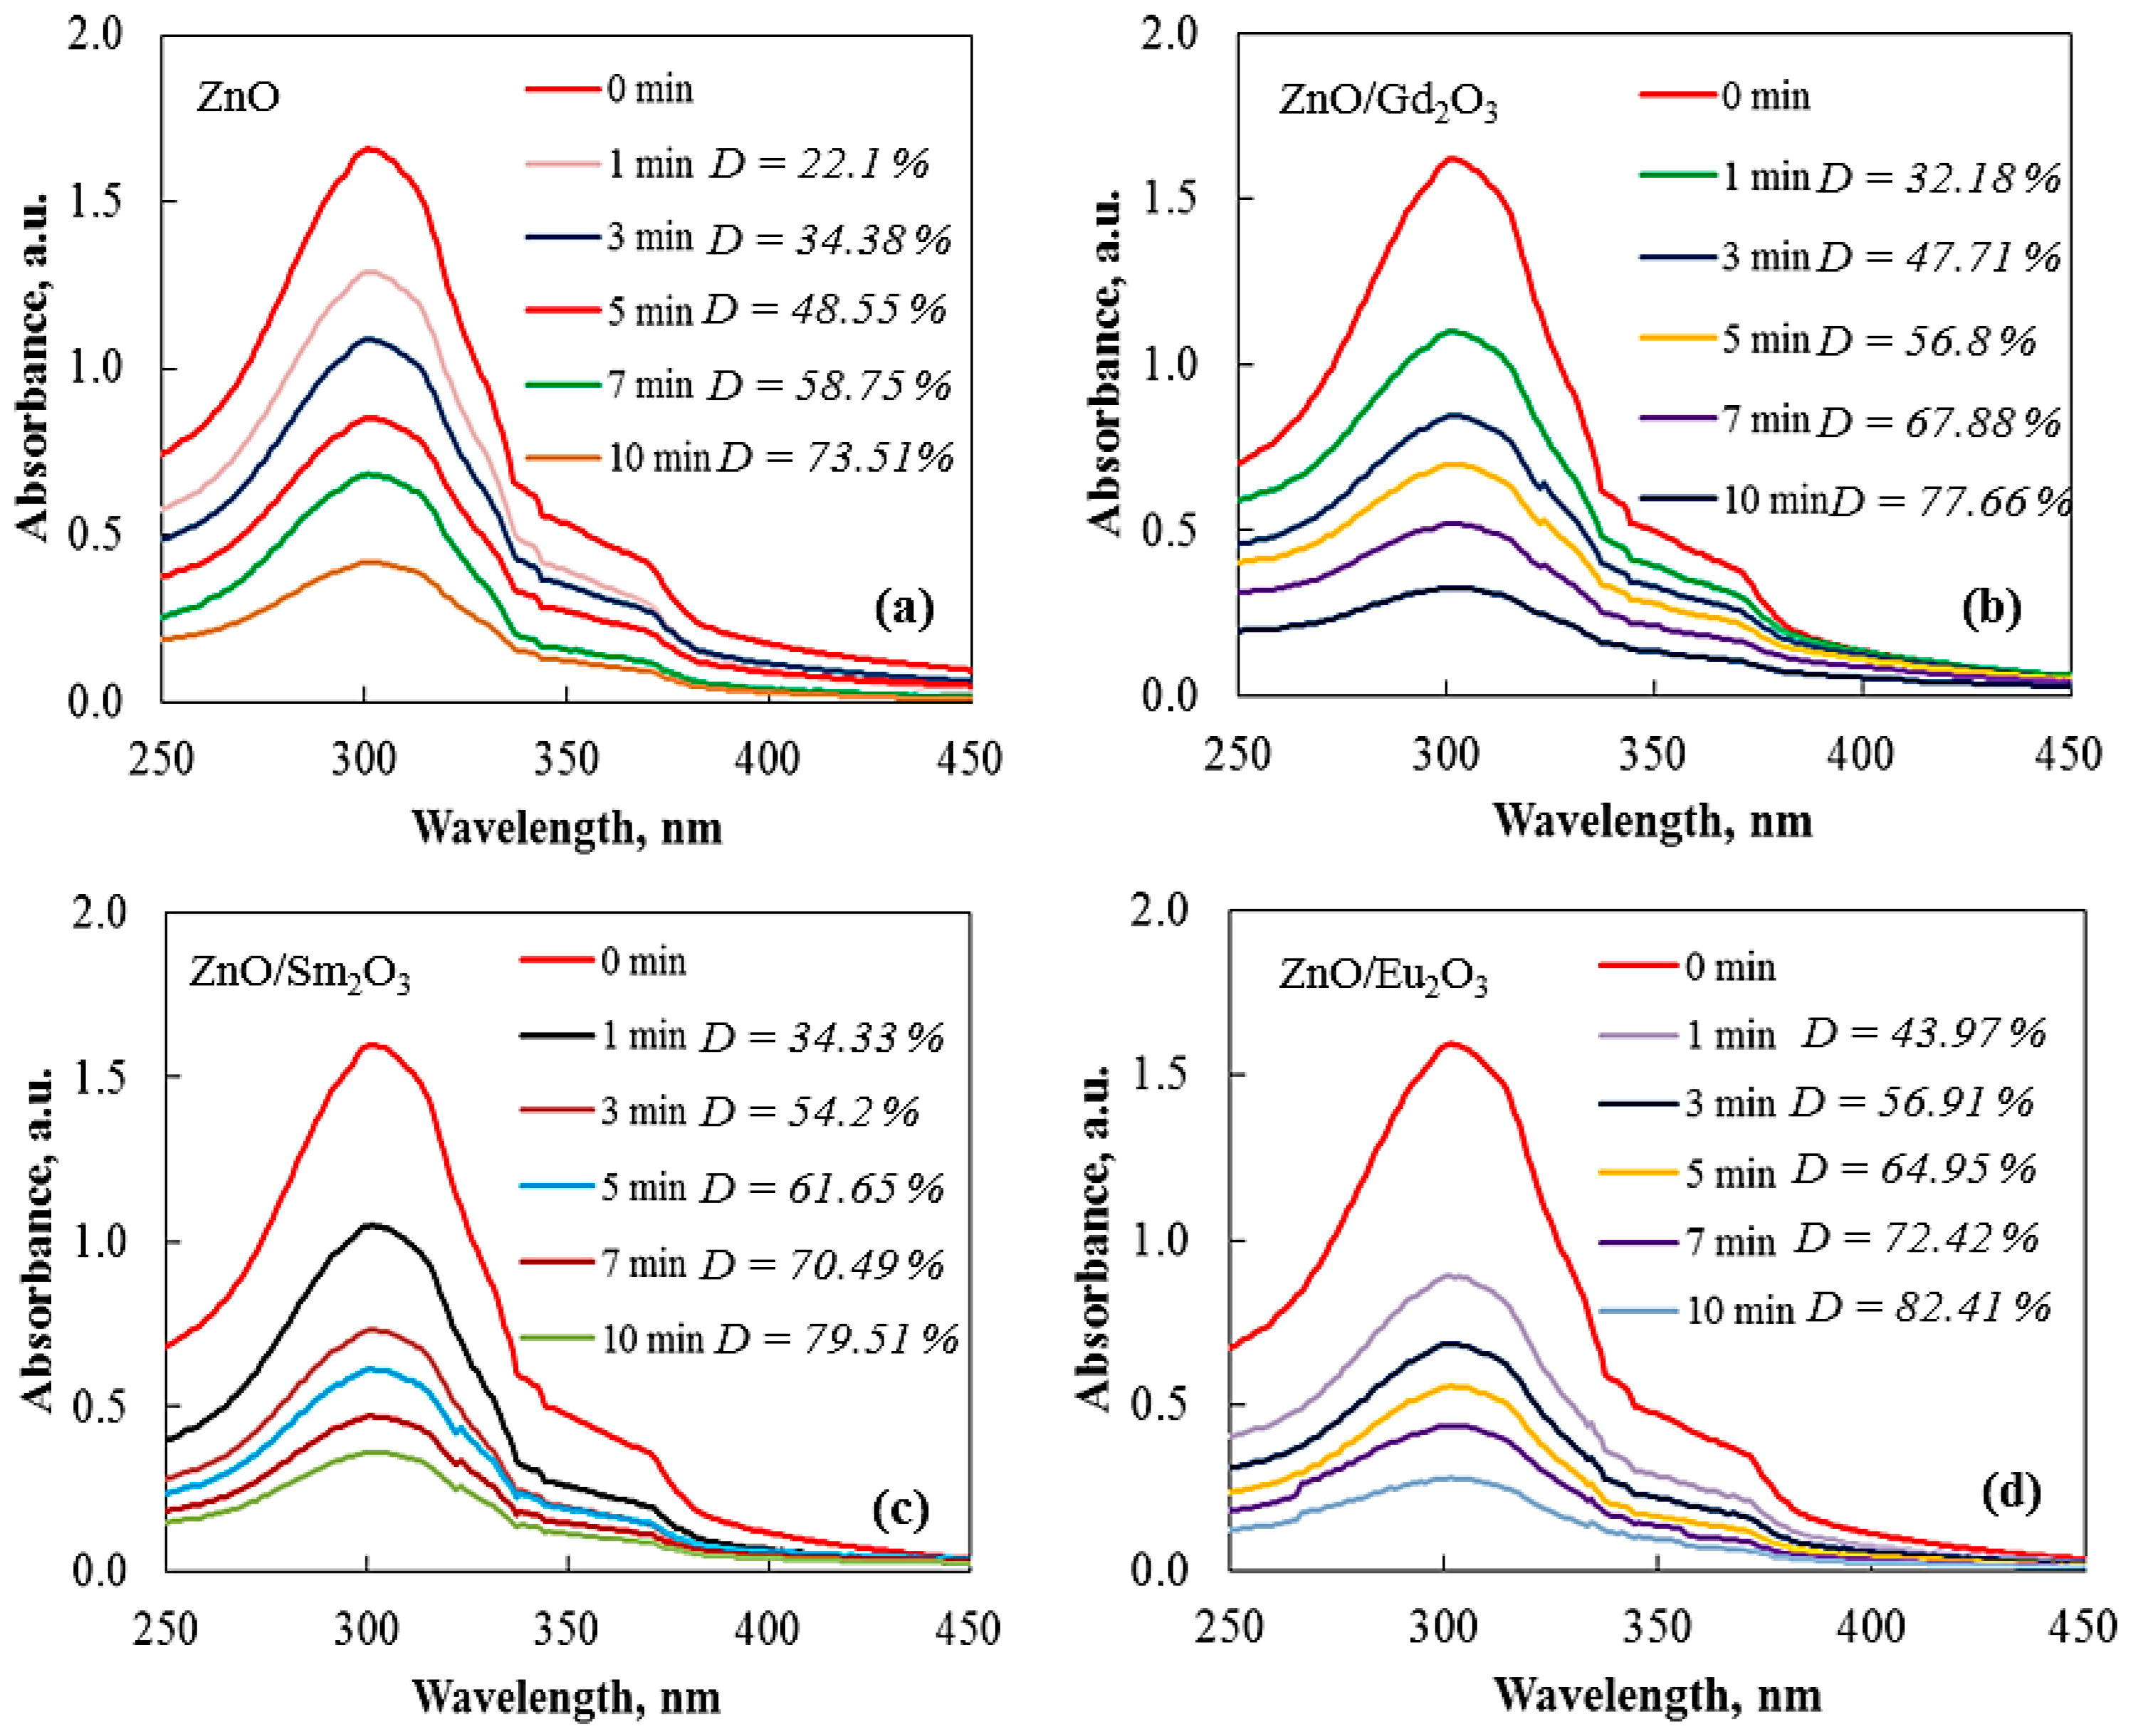
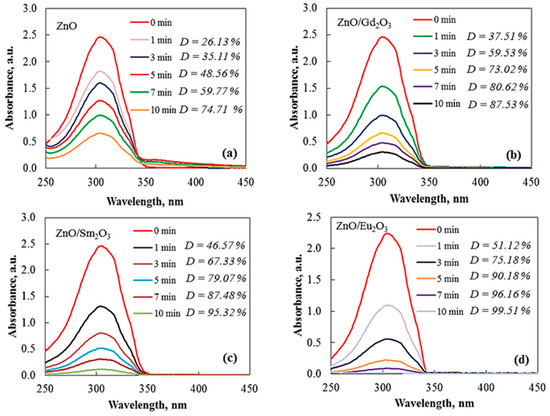
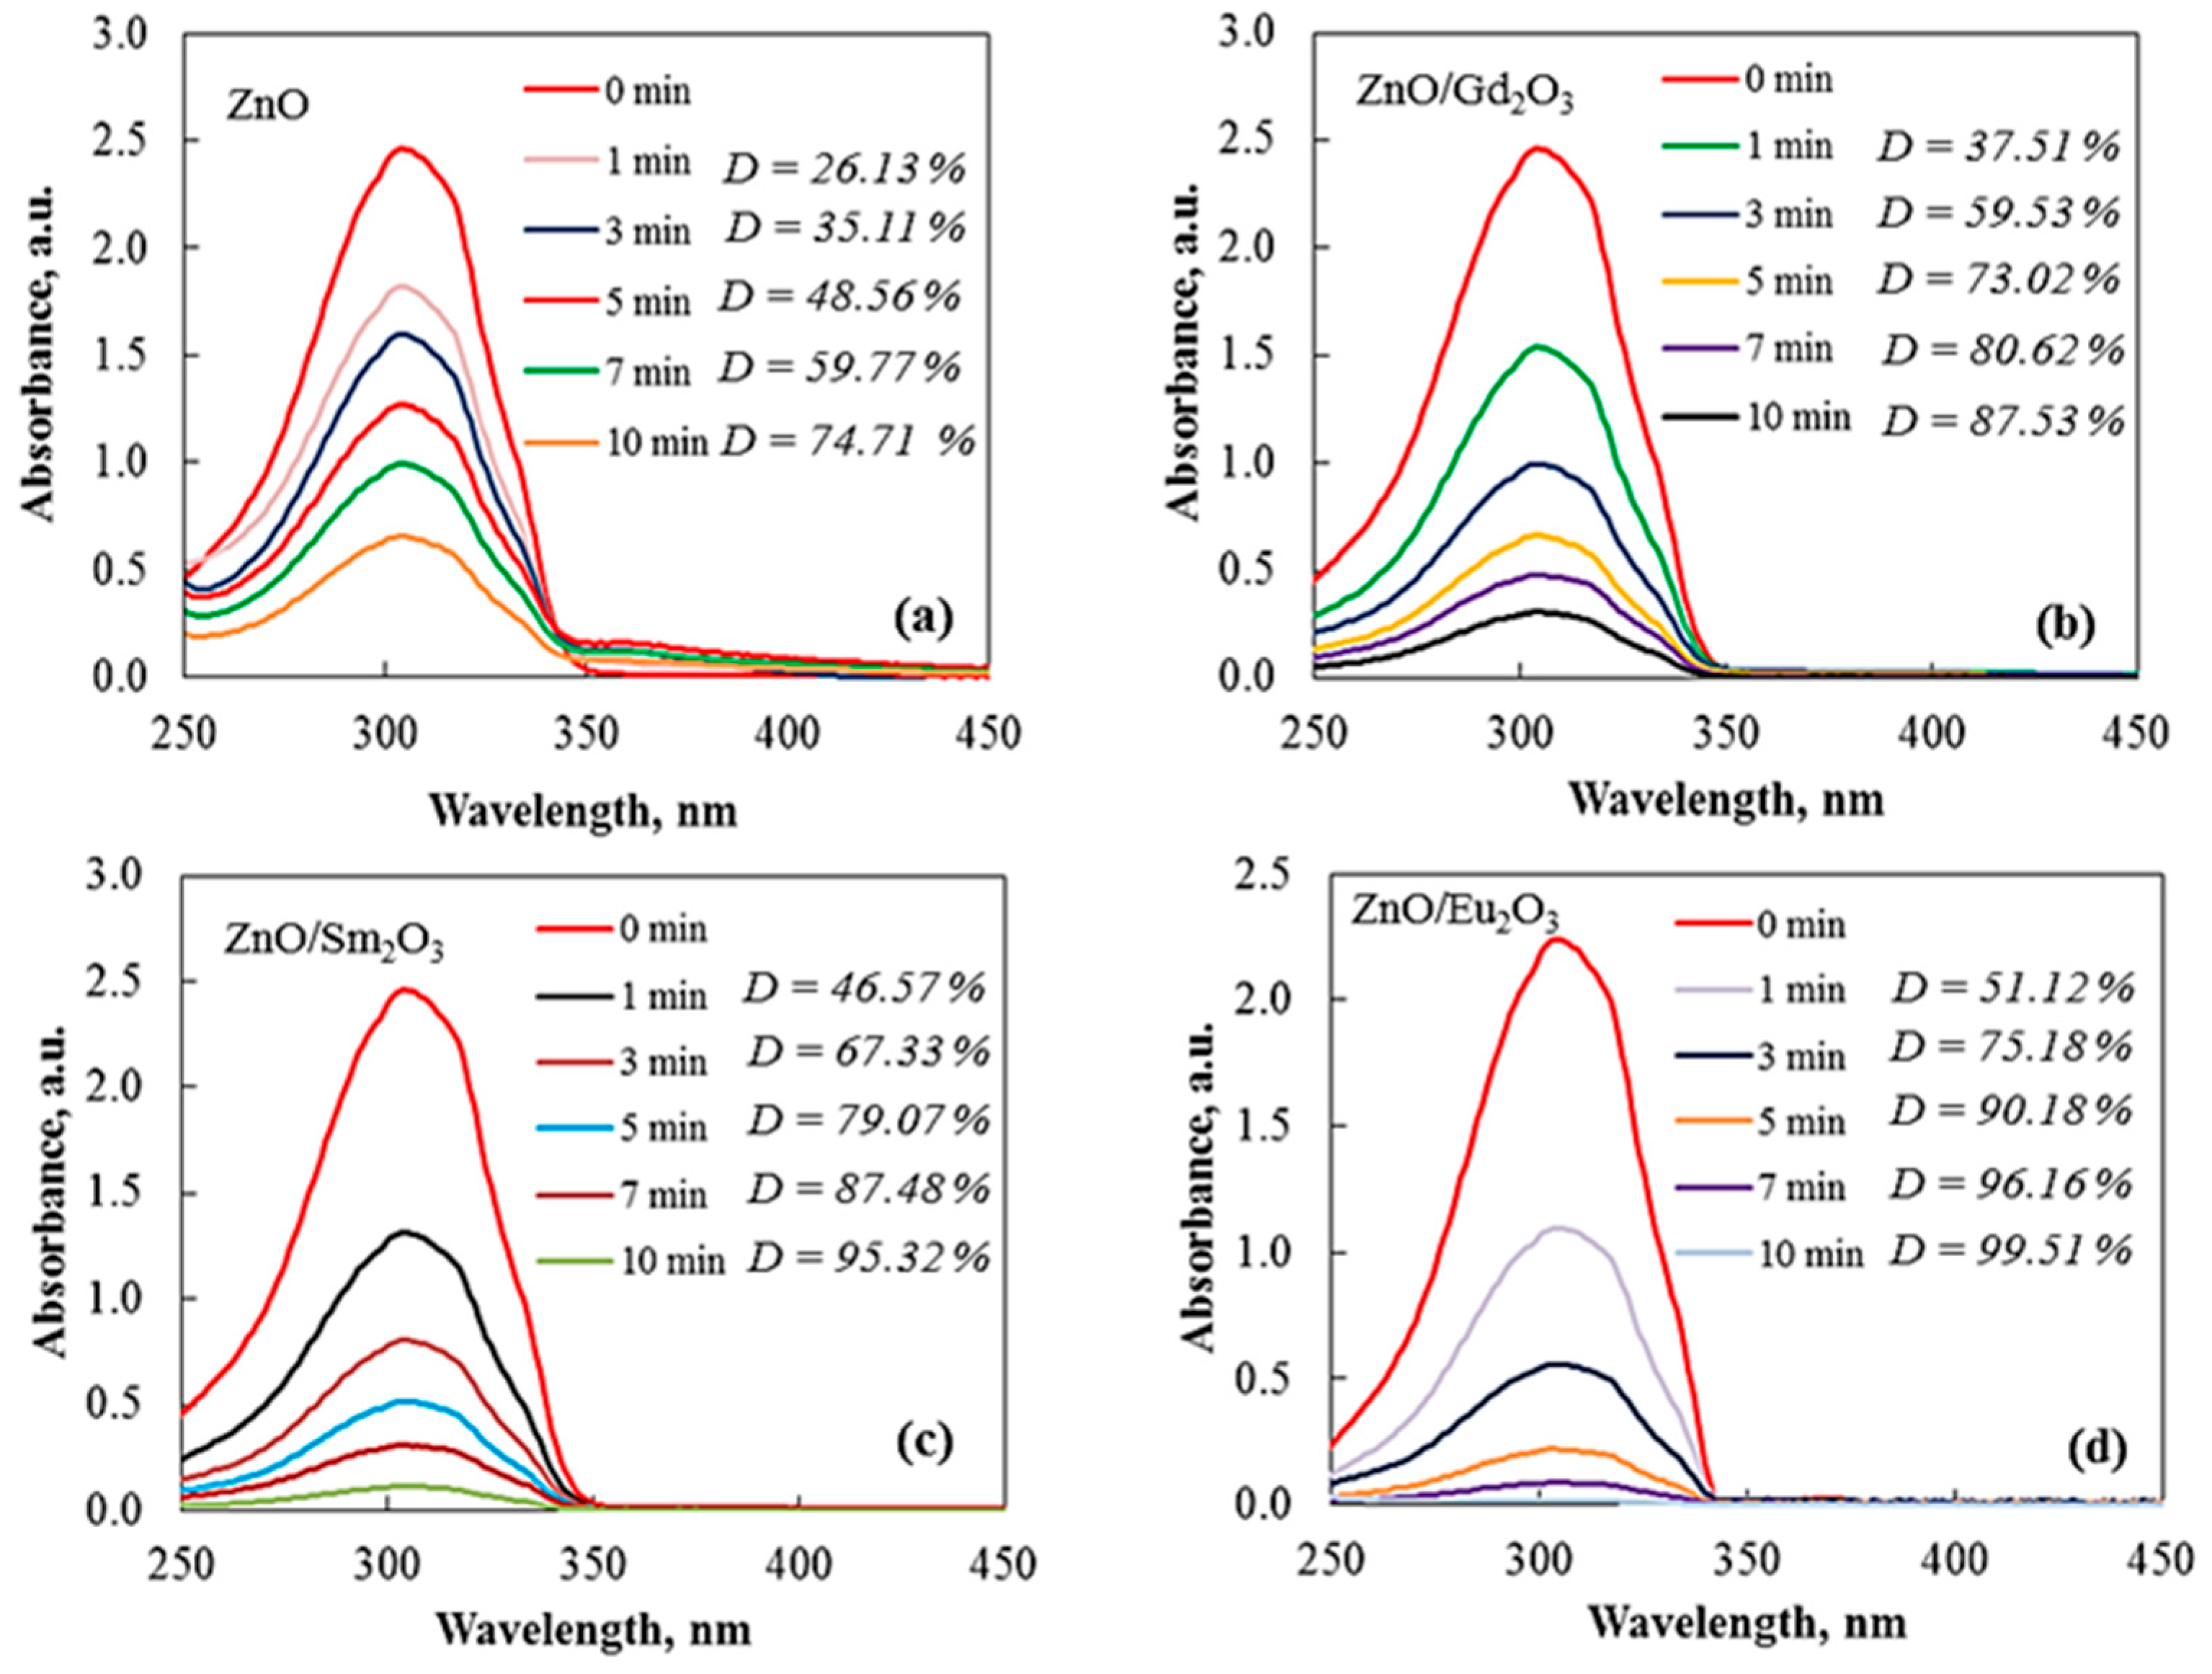
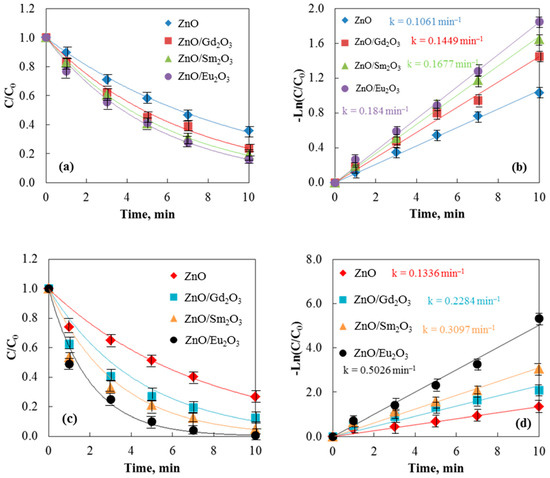
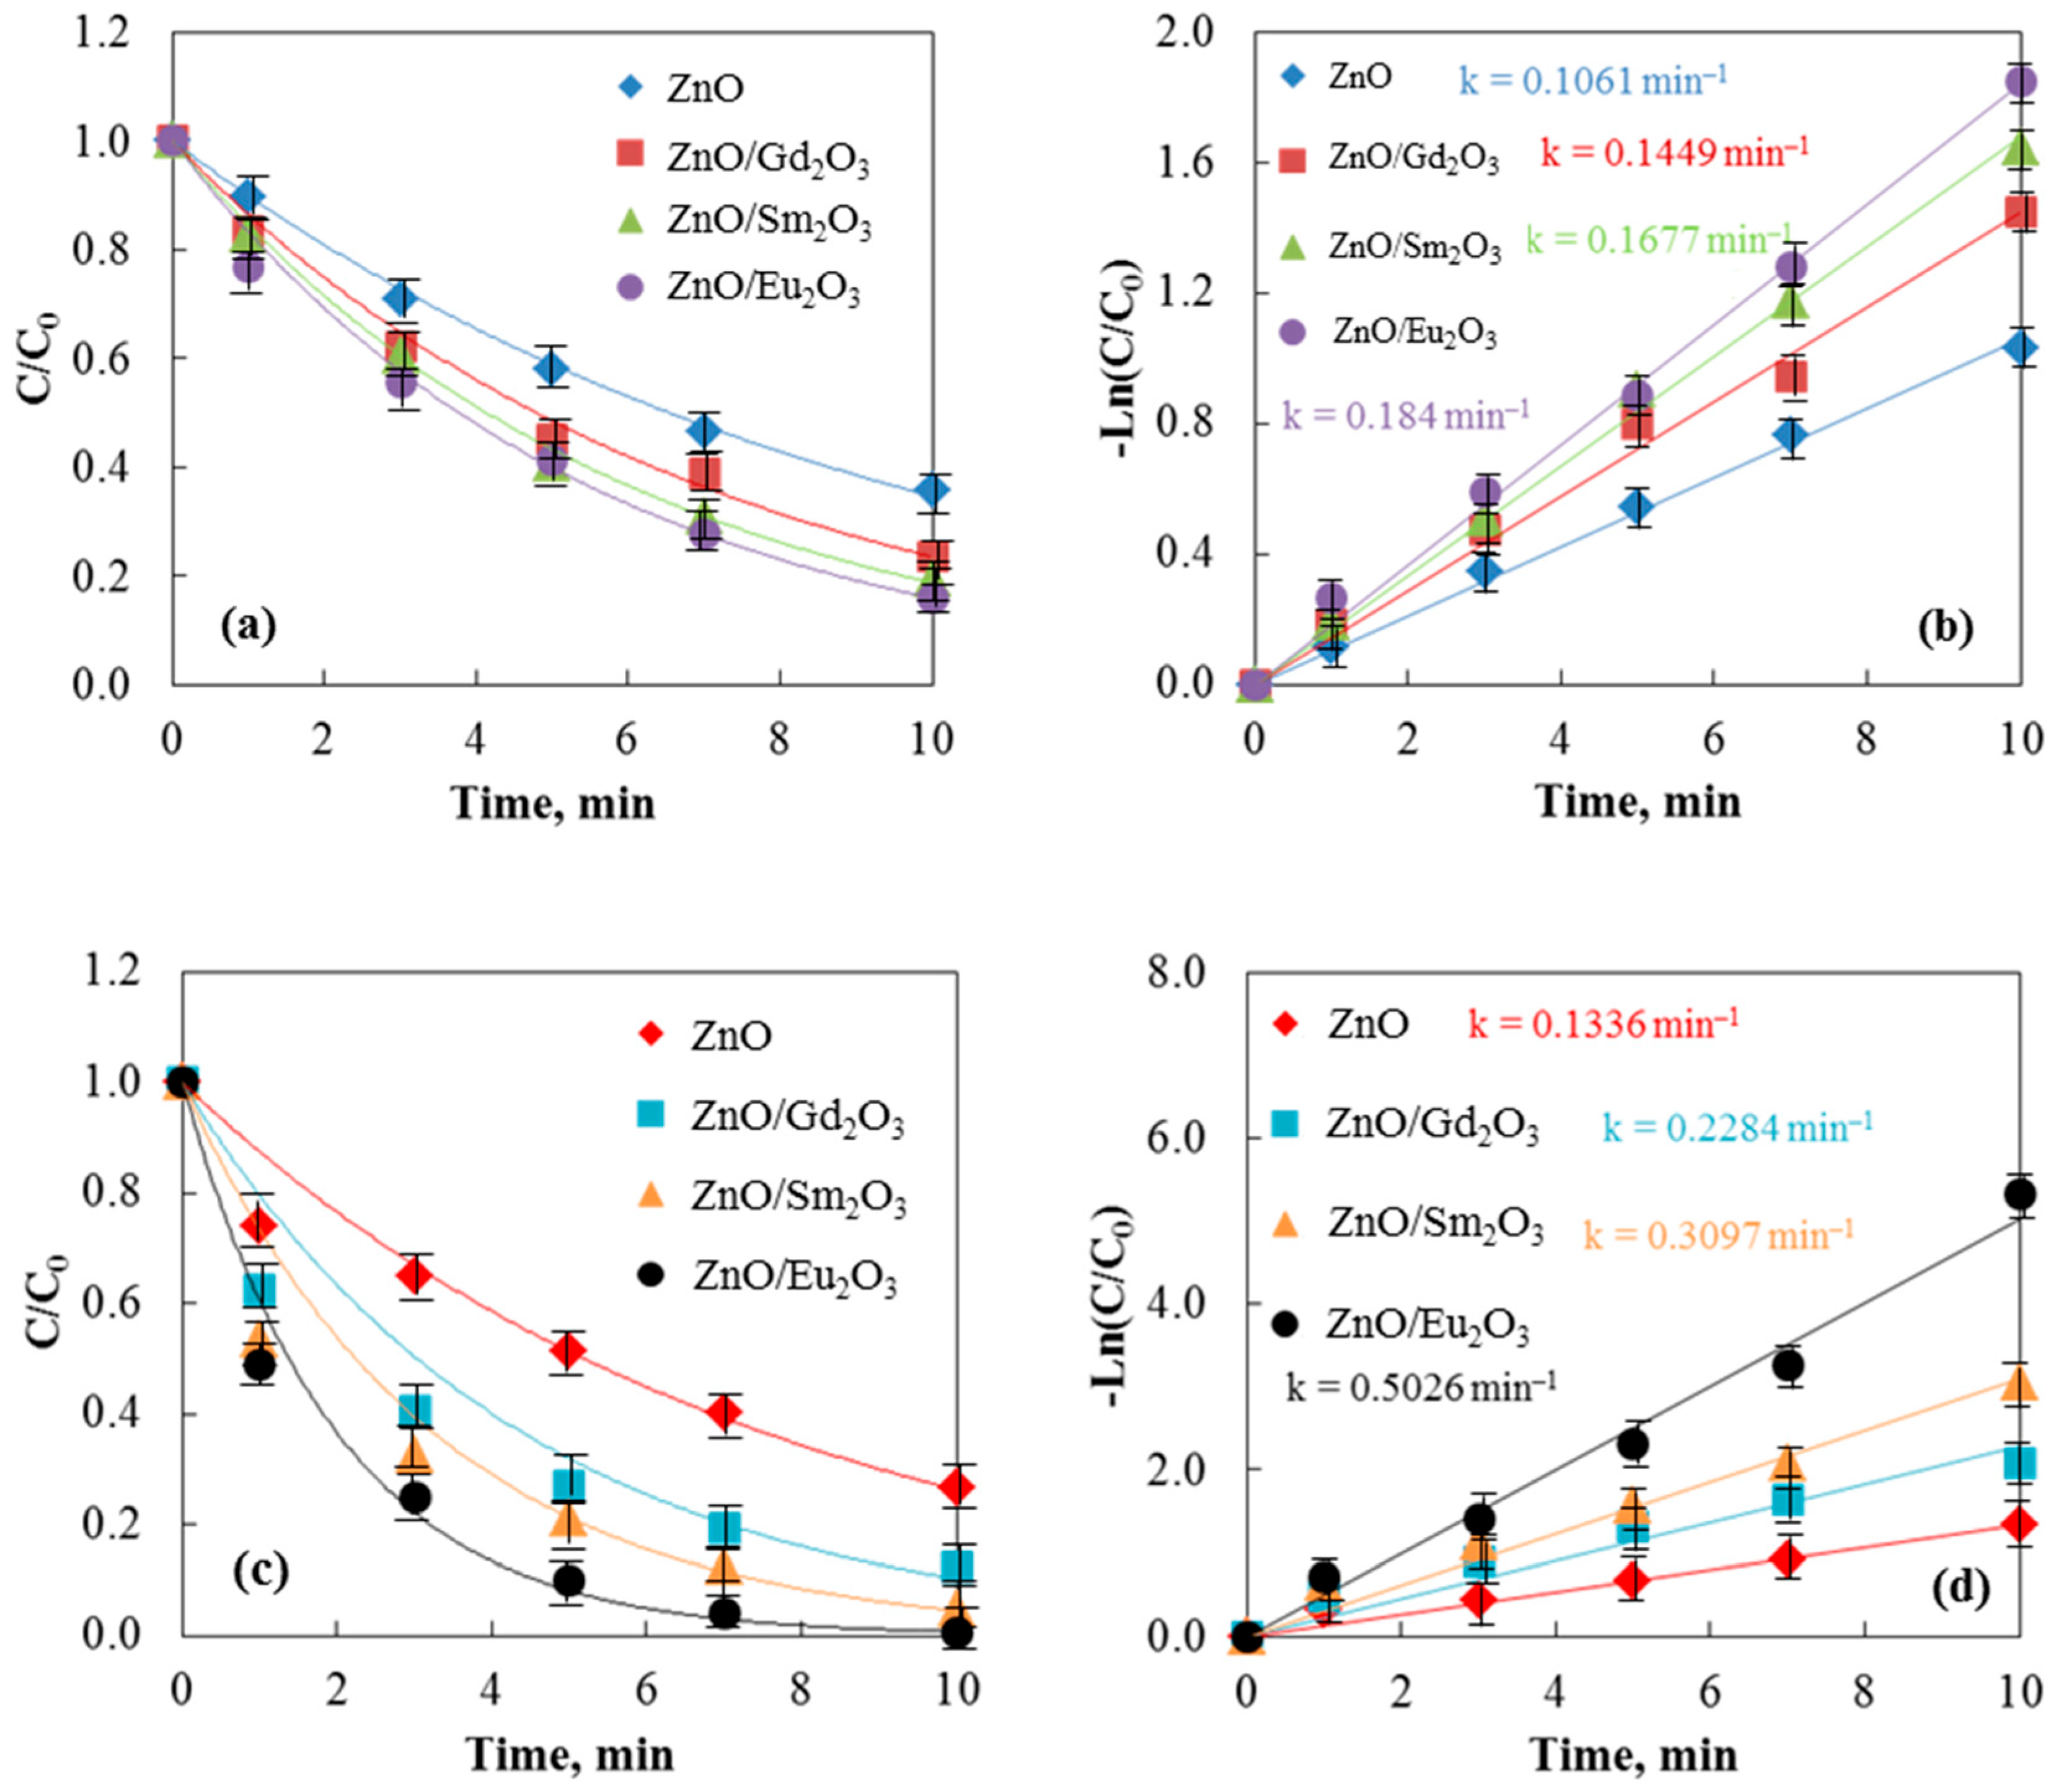
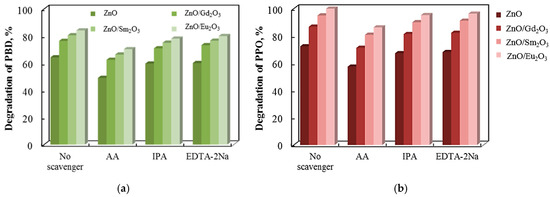
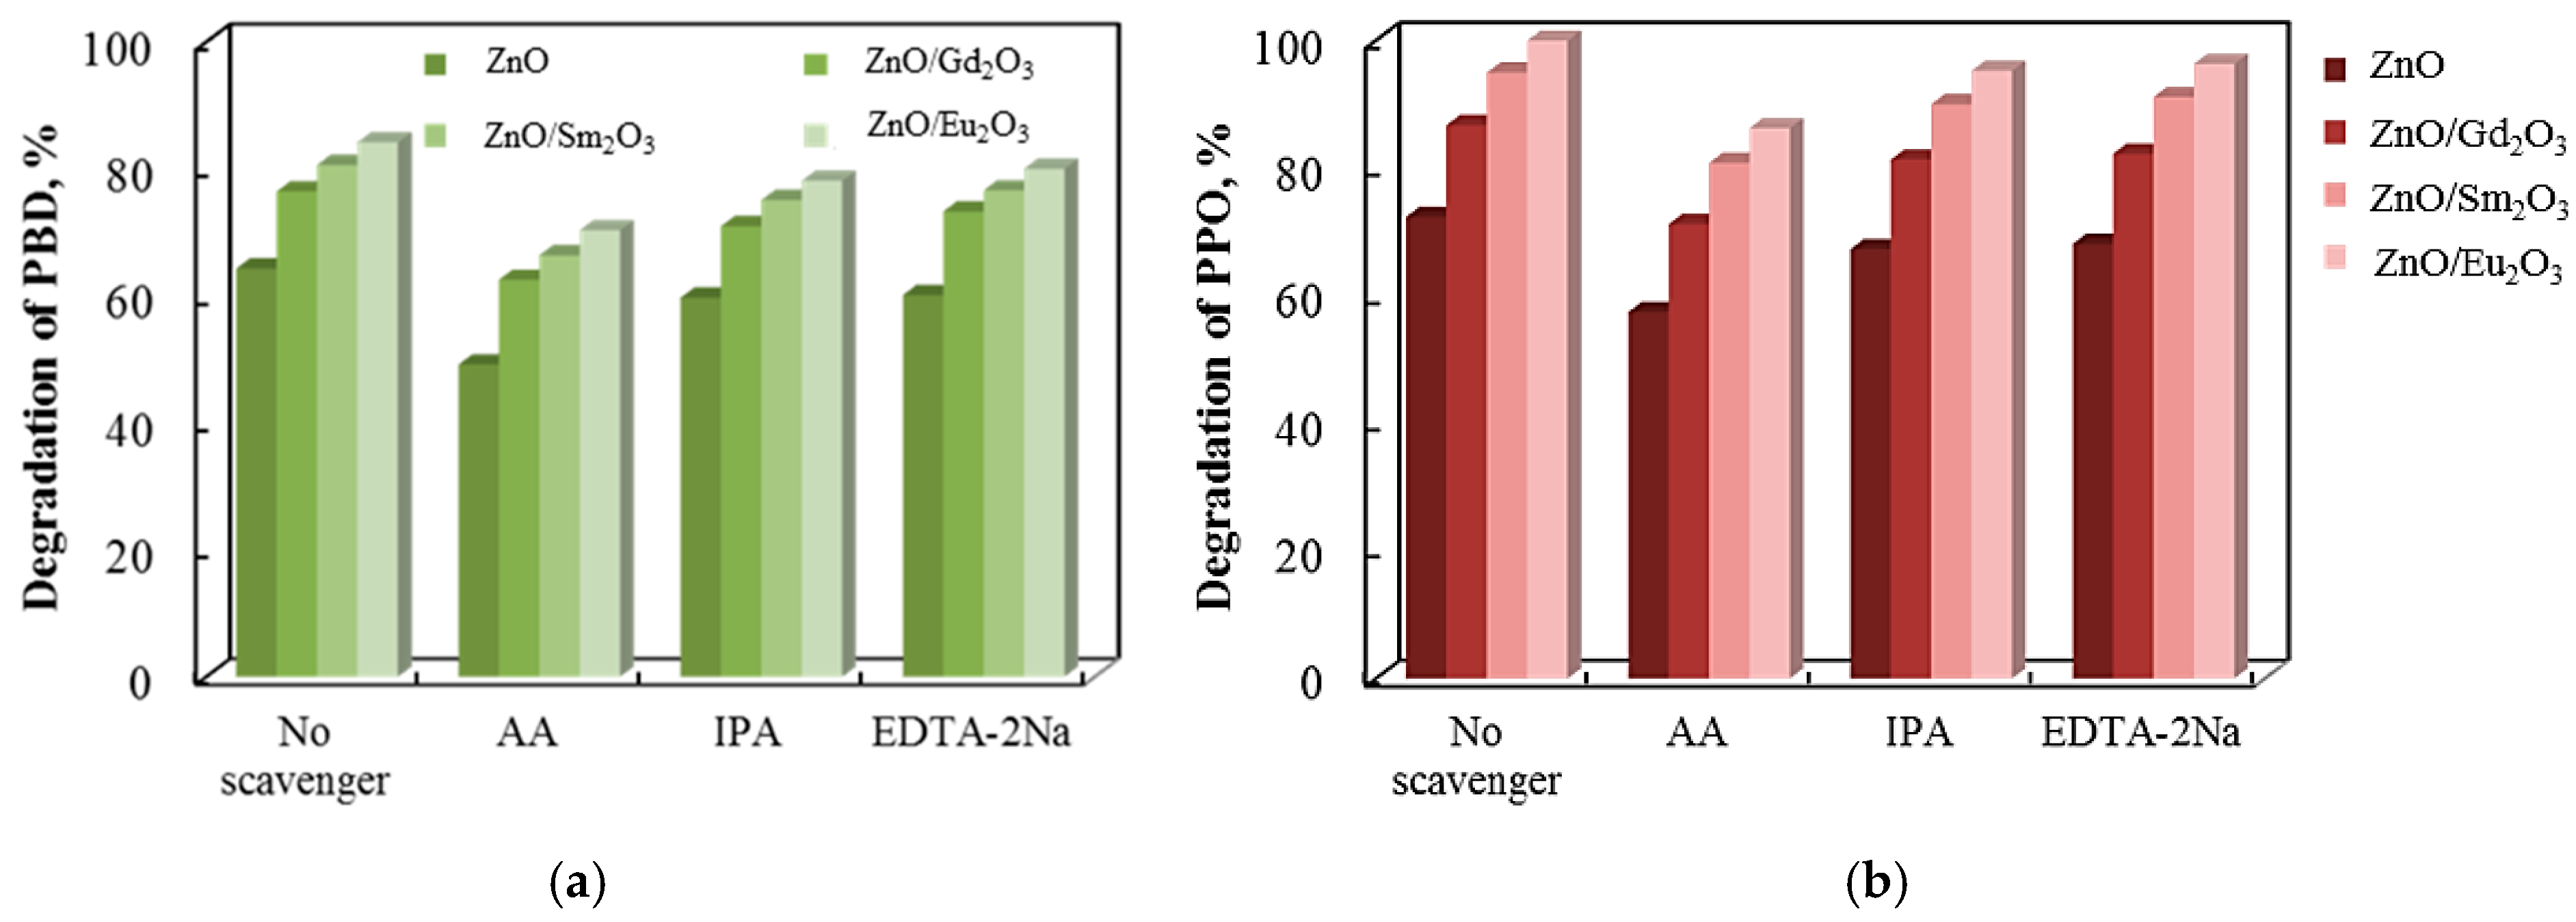
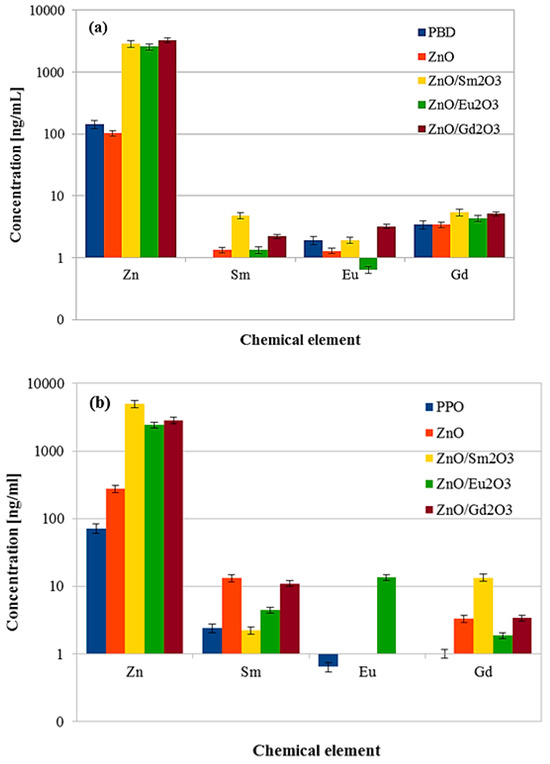
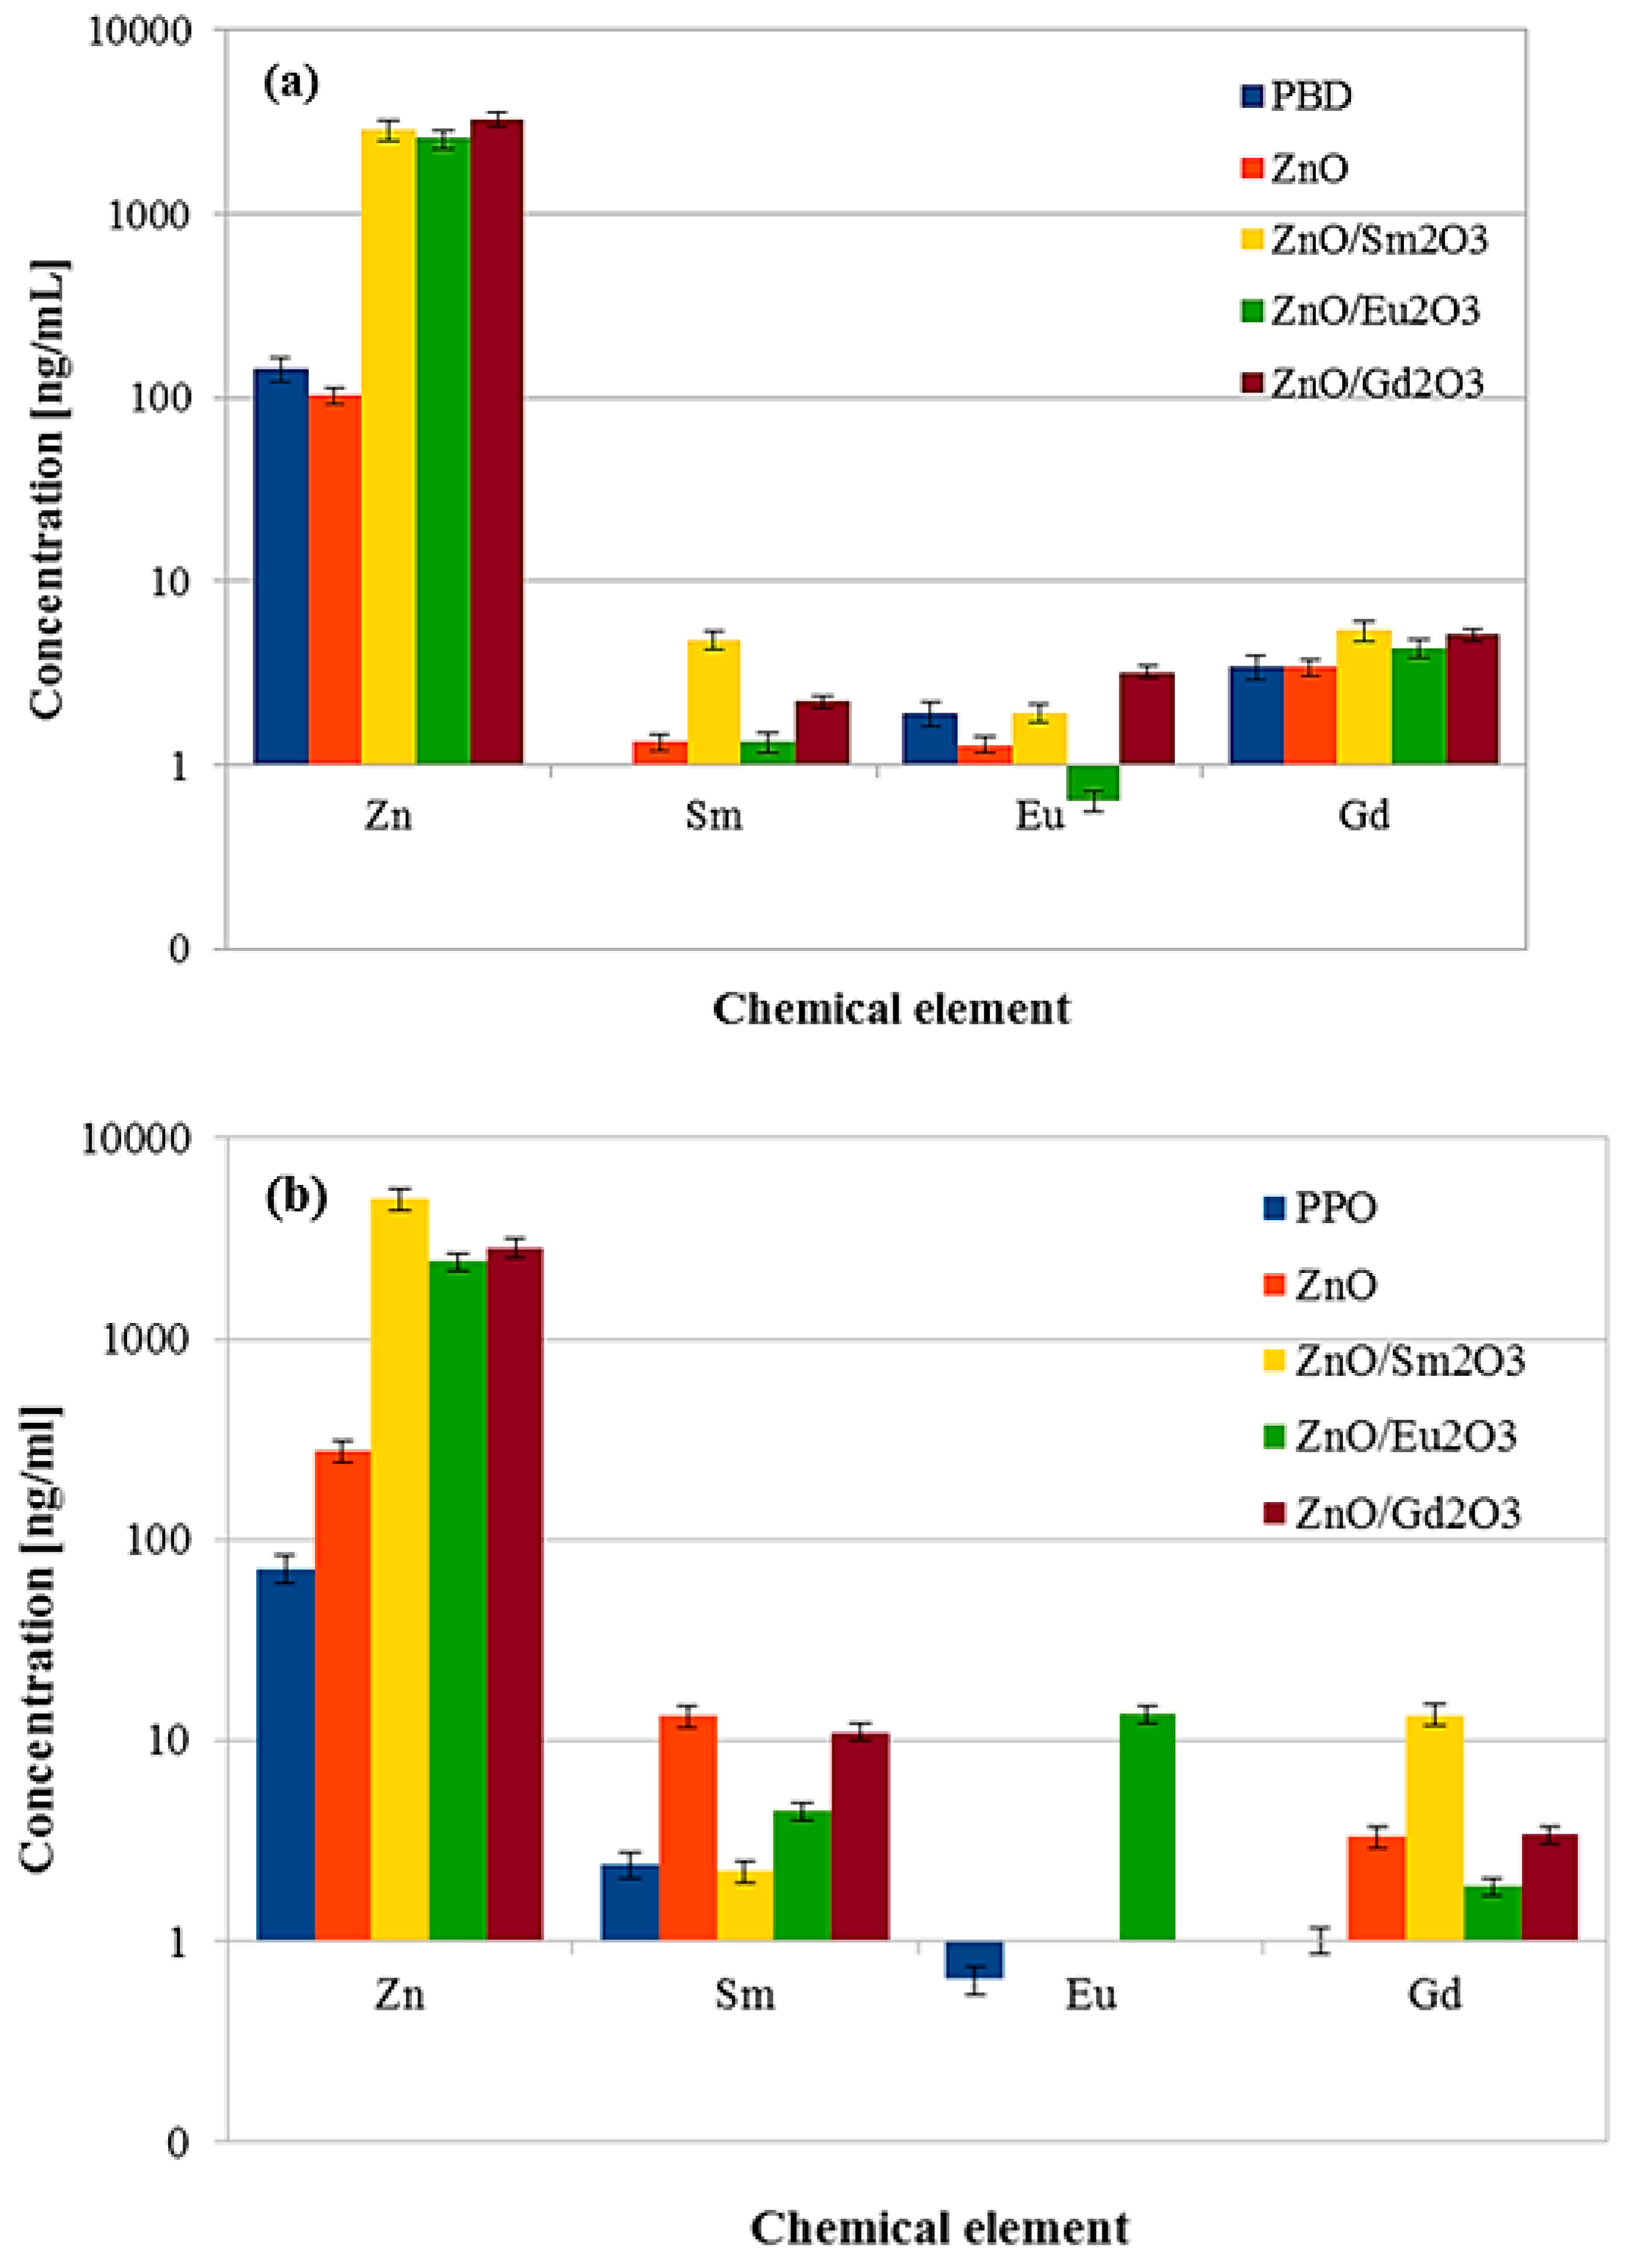
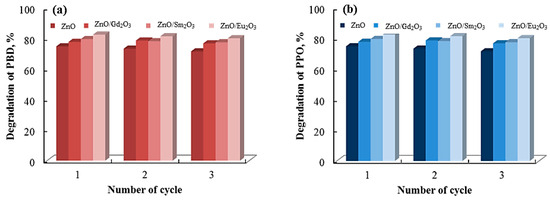
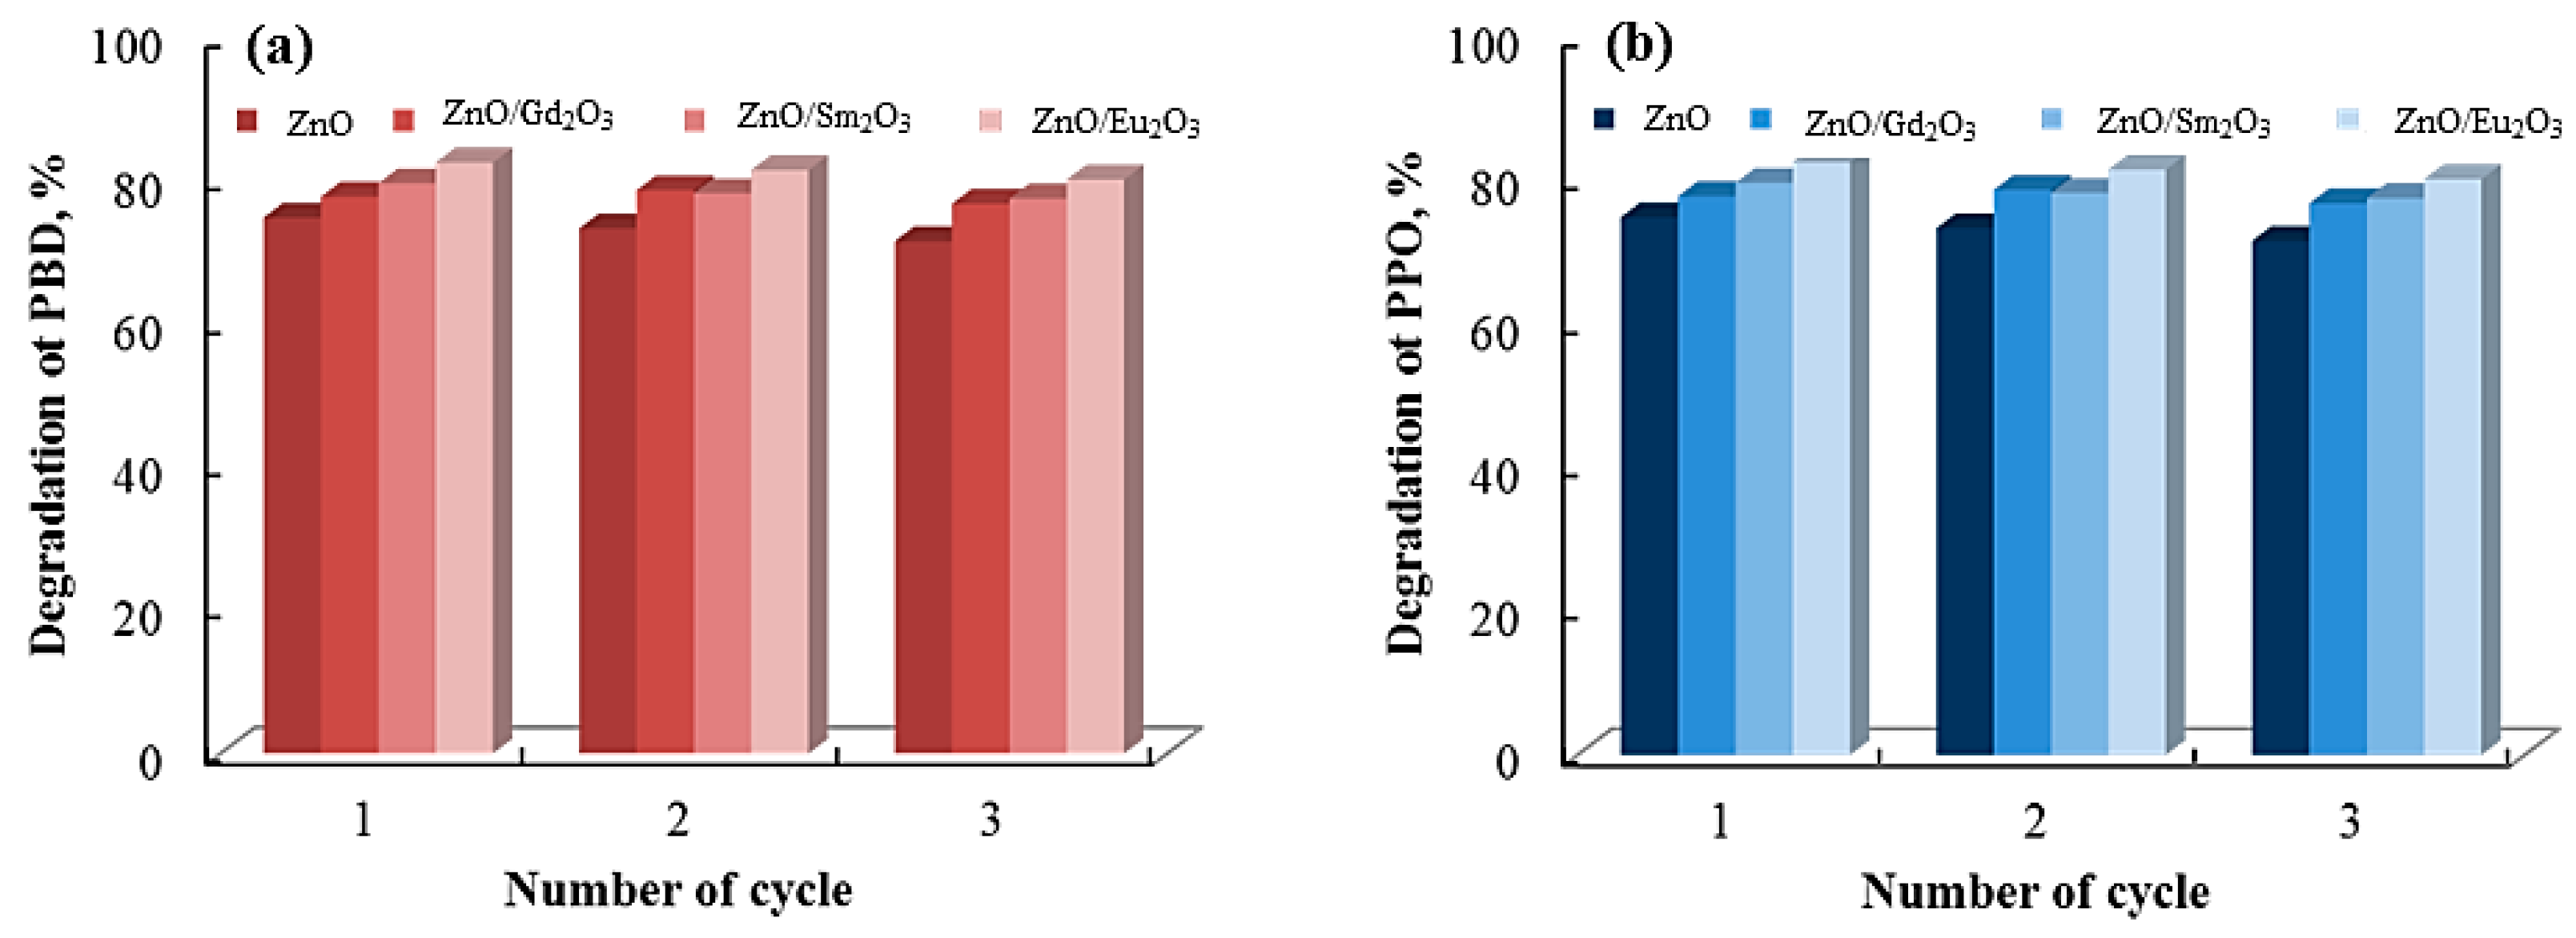

Disclaimer/Publisher’s Note: The statements, opinions and data contained in all publications are solely those of the individual author(s) and contributor(s) and not of MDPI and/or the editor(s). MDPI and/or the editor(s) disclaim responsibility for any injury to people or property resulting from any ideas, methods, instructions or products referred to in the content. |
© 2026 by the authors. Licensee MDPI, Basel, Switzerland. This article is an open access article distributed under the terms and conditions of the Creative Commons Attribution (CC BY) license.