


Abstract
Automated legacy code modernization using Large Language Models lacks rigorous evaluation frameworks and multi-objective quality assessment methodologies. Existing research suffers from three critical deficiencies: single-metric evaluation paradigms creating pathological optimization incentives, statistical validation limited to p-values without effect size analysis, and absence of systematic transformation pattern taxonomies explaining what works and why. We present a novel multi-objective statistical framework that jointly assesses Cyclomatic Complexity (CC) and Maintainability Index (MI) while providing comprehensive effect size analysis addressing software engineering research gaps. Applied to 47 legacy Java samples from Apache Ant (version 1.10.x, commit rel/1.10.14), our framework achieves 97.9% metric-level improvement with very large practical effects (Cohen’s , 95% CI [1.36, 2.35], ) for maintainability—substantially exceeding prior work and conventional significance thresholds. We note that this success rate reflects quality metric improvement; functional equivalence was verified through syntactic validation and manual inspection of a 20% random sample, while comprehensive automated test-based verification remains a limitation addressed in future work. We contribute: (1) first multi-objective quality assessment framework for code modernization with weighted composite scoring and sensitivity analysis, (2) rigorous statistical methodology with effect size analysis beyond p-values, (3) systematic transformation pattern taxonomy identifying four successful patterns and three failure modes with predictive value (inter-rater agreement ), and (4) negative result showing iterative refinement provides no benefit (, ), saving community resources. Our transformation taxonomy enables practitioners to predict success likelihood from code characteristics, while our statistical framework provides replicable methodology for evaluating LLM-based software engineering tools. The very large effect size indicates metric-level improvements are materially meaningful for real-world software maintenance, not merely statistically detectable.
1. Introduction
Legacy software systems represent a pervasive challenge in contemporary software engineering practice. Empirical studies estimate that legacy system maintenance consumes 60–90% of total software lifecycle costs, with organizations allocating approximately USD 3.61 per line of legacy code annually for maintenance activities [1]. These systems, frequently implemented decades ago using obsolete paradigms and technologies, continue to underpin business-critical operations despite their escalating maintenance burden and technical debt accumulation.
Recent advances in Large Language Models (LLMs) have demonstrated remarkable capabilities in code understanding, generation, and transformation tasks [2]. Models pre-trained on extensive source code corpora exhibit emergent abilities in program synthesis, defect detection, and code explanation [3]. Contemporary instruction-tuned LLMs, such as CodeLlama [4] and GPT-4 [5], have further enhanced performance on code-related tasks through specialized training procedures. However, their systematic application to legacy code modernization faces three critical research gaps that limit both scientific understanding and practical deployment.
1.1. Critical Research Gaps in Current LLM Evaluation
Gap 1: Single-Metric Evaluation Paradigms. Existing LLM code evaluation research employs single metrics or ad-hoc quality measures. Codex evaluation [2] uses pass@k (functional correctness only), AlphaCode employs competitive programming success rates [6], and recent refactoring studies [7] examine isolated transformations without systematic quality assessment. This single-metric focus creates pathological optimization incentives—optimizing solely for cyclomatic complexity can produce over-abstracted code with excessive delegation, while optimizing only for maintainability enables cosmetic improvements without substantive quality gains. No systematic framework exists for multi-objective quality optimization in code transformation tasks.
Gap 2: Statistical Validation Deficiencies. Software engineering research has been criticized for over-reliance on p-values without effect size reporting [8,9]. Arcuri and Briand [9] demonstrate that statistical significance alone provides insufficient evidence for practical importance, yet most LLM code studies report “improvement” without quantifying practical significance through effect sizes. This deficiency prevents distinguishing between statistically detectable but practically trivial improvements and genuinely transformative quality enhancements. Recent program repair studies [10,11] and test generation research [12] report p-values but omit Cohen’s d or similar effect size measures, limiting practical interpretability.
Gap 3: Black-Box Treatment of Transformation Mechanisms. Existing work treats LLMs as opaque systems, reporting aggregate performance without explaining how transformations succeed or fail. Prior studies [13,14] lack systematic taxonomies of transformation patterns, failure mode analysis, or predictive frameworks for success likelihood. This black-box approach prevents practitioners from understanding when to apply LLM-based modernization and researchers from developing targeted improvements.
1.2. Research Questions
To address these gaps, we formulate three research questions targeting fundamental methodological challenges. RQ1 (Multi-Objective Effectiveness): Can a multi-objective optimization framework jointly improve cyclomatic complexity and maintainability index with statistically significant and practically meaningful effect sizes, avoiding pathological single-metric optimization? RQ2 (Computational Efficiency): Does iterative refinement provide statistically significant benefits justifying additional computational cost, or does single-pass optimization capture most achievable improvements? RQ3 (Transformation Pattern Analysis): What systematic taxonomy of transformation patterns and failure modes emerges from empirical analysis, and can it predict success likelihood from code characteristics?
1.3. Novel Contributions
Our investigation makes five principal contributions addressing the gaps identified above:
- Multi-objective quality assessment framework. The first systematic framework for joint assessment of cyclomatic complexity and maintainability index in code transformation tasks. Our weighted composite score balances competing objectives while preventing pathological trade-offs, with a sensitivity analysis demonstrating robustness to weight variations (Section 5.6). Applied to 47 legacy Java samples, the framework achieves 97.9% metric-level improvement with very large practical effects (Cohen’s , 95% CI [1.36, 2.35])—substantially exceeding conventional thresholds ( for “large”) [15,16].
- Rigorous statistical validation methodology. Comprehensive statistical analysis including paired t-tests, Cohen’s d with 95% confidence intervals, Wilcoxon signed-rank confirmation, and normality assessment, addressing persistent criticisms of p-value-only reporting in SE research [8,9].
- Systematic transformation pattern taxonomy. Through analysis of all 47 transformations with a structured coding protocol (inter-rater Cohen’s ), we identify four successful patterns and three failure modes enabling practitioners to predict success likelihood from initial code characteristics.
- Negative result with scientific value. Iterative refinement provides no statistically significant benefit (, ), with each additional iteration costing approximately 45–90 seconds of GPU time and 1500–3000 additional tokens per sample (Section 3.4.2).
- Replicable evaluation framework. Complete methodological documentation including exact dataset version (Apache Ant 1.10.14), tool specifications (Lizard 1.17.10 for CC, SEI formula for MI), model configuration, and statistical procedures, all using openly available resources.
1.4. Controlled Experimental Design as Methodological Strength
We validate our framework on Apache Ant, a mature Java project initially released in 2000 that exhibits legacy patterns typical of enterprise systems. This controlled setting provides several advantages including realistic legacy code with documented technical debt rather than synthetic benchmarks, diverse code patterns spanning utility classes, data structures, and algorithms, public availability enabling replication, and sufficient sample size () for adequate statistical power ( for ) [15]. While focused on one project, this controlled design enables rigorous measurement establishing a methodology applicable to diverse legacy systems—analogous to controlled experiments in other sciences that establish generalizable principles through careful single-system study. We acknowledge that single-project evaluation limits external validity and discuss planned multi-project replication in Section 7.
The remainder of this paper is organized as follows. Section 2 critically analyzes related work, explicitly identifying research gaps. Section 3 presents our multi-objective optimization framework and statistical methodology. Section 4 develops our transformation pattern taxonomy. Section 5 reports comprehensive experimental results including sensitivity analysis. Section 6 discusses theoretical implications, generalizability, and threats to validity. Section 7 concludes and outlines future directions.
2. Related Work and Critical Gap Analysis
2.1. Legacy Code Modernization
Legacy system modernization has constituted a persistent research focus in software engineering for multiple decades. Traditional approaches can be categorized into several paradigms, each with distinct advantages and limitations. Rule-based transformation systems employ predefined transformation rules to refactor code systematically. Tools such as TXL and Stratego/XT apply syntactic pattern matching and rewriting rules to perform source-to-source transformations. While these approaches provide deterministic behavior and formal verifiability, they exhibit limited flexibility in handling diverse code patterns and require extensive rule engineering for each target language and modernization objective.
Program analysis and synthesis techniques combine static analysis with template-based code generation. Approaches leveraging program slicing, data flow analysis, and dependency graphs have demonstrated efficacy for specific refactoring tasks such as extract method and introduce parameter object [17]. However, these methods struggle with complex semantic transformations requiring deep understanding of program intent and domain knowledge. Search-based software engineering (SBSE) formulates refactoring as an optimization problem, employing genetic algorithms and metaheuristics to explore solution spaces. While capable of exploring vast solution spaces, these methods face challenges in defining appropriate fitness functions capturing all quality dimensions and ensuring semantic preservation.
2.2. Machine Learning for Code
The application of machine learning to source code analysis and generation has evolved substantially over the past decade, progressing from statistical models to deep neural architectures. Pre-trained language models revolutionized natural language processing and subsequently influenced code-related research. CodeBERT [3], trained on natural language and programming language pairs, demonstrated strong performance on code search and clone detection. GraphCodeBERT [18] enhanced this approach by incorporating program structure through data flow graphs, enabling semantic-level code features beyond token-level patterns. CodeT5 [19] employed a unified encoder-decoder architecture supporting both code understanding and generation tasks, achieving state-of-the-art results across multiple code intelligence benchmarks.
2.3. Large Language Models for Code
Foundation models for code include OpenAI’s Codex [2], which demonstrated that LLMs trained on code could generate functional programs from natural language descriptions. Subsequent work has explored prompting strategies, chain-of-thought reasoning [20], and iterative refinement for improved generation quality. Code-specific LLMs have been developed through continued pre-training on code data and instruction fine-tuning. CodeLlama [4], derived from Llama 2, provides specialized variants for Python and instruction following. StarCoder [6] was trained on permissively licensed code from GitHub. WizardCoder [21] employed Evol-Instruct for enhanced instruction-following capabilities. These models exhibit improved understanding of programming language semantics and generation of idiomatic code [22].
LLMs for software engineering tasks have been applied to various SE activities. Research has investigated bug fixing [10,13], test generation [12,23], code review [24], and program repair [11,14]. Several studies have explored LLM-assisted refactoring [7], though systematic evaluation on legacy code with empirical validation remains limited [25].
Comparison context: Our work differs from prior LLM refactoring studies in three key respects. First, unlike Fakhoury et al. [7] who examine isolated refactoring operations, we evaluate holistic modernization across multiple quality dimensions simultaneously. Second, unlike pass@k-based evaluations [2], our framework measures quality improvement rather than binary functional correctness. Third, we provide the first systematic transformation pattern taxonomy with inter-rater agreement, whereas prior work treats LLM outputs as black boxes without mechanistic explanation.
2.4. Code Quality Metrics
Cyclomatic complexity (CC), introduced by McCabe [26], quantifies program control flow complexity based on the number of linearly independent paths through source code. Formally defined as , where E represents edges, N represents nodes, and P represents connected components in the control flow graph, cyclomatic complexity has been empirically validated as a predictor of defect density and maintenance difficulty. We selected CC because it provides automated computation without manual interpretation, has established empirical validation as a maintenance predictor [26], enjoys widespread industry adoption enabling practitioner familiarity, and benefits from availability of reliable open-source measurement tools.
Maintainability Index (MI), originally developed by Oman and Hagemeister, combines multiple factors including Halstead Volume [27], cyclomatic complexity, and lines of code into a composite maintainability score. The SEI version [28] produces values ranging from 0 (unmaintainable) to 100 (highly maintainable). Empirical validation studies have established relationships between these metrics and software maintenance outcomes. Basili et al. demonstrated strong correlations between complexity metrics and defect proneness. Heitlager et al. [29] proposed benchmark-based evaluation using metric distributions.
Metric overlap consideration. MI includes CC as one component, creating partial overlap. The Pearson correlation between CC and MI in our dataset is (), meaning 88.4% of MI variance () is independent of CC changes. We report both metrics independently throughout to enable separate assessment.
2.5. Critical Gaps in Existing Research
Gap 1: Absence of Multi-Objective Optimization. Prior LLM code evaluation employs single metrics including Codex [2] using pass@k only (functional correctness), AlphaCode [6] using competitive programming success, bug fixing studies [10,13] examining patch correctness, and test generation [12] measuring coverage or assertion quality. Our work provides the first systematic multi-objective framework balancing complexity and maintainability.
Gap 2: Statistical Rigor Deficiency. Most studies report p-values without effect sizes. Program repair work [11,14] provides success rates without effect size, test generation studies [23] report coverage improvements without practical significance quantification, and refactoring research [7] presents mixed results without statistical validation. This violates recommendations from Arcuri & Briand [9] and Kitchenham [8]. Our work provides complete statistical validation including Cohen’s d with confidence intervals.
Gap 3: Lack of Mechanistic Understanding. Existing work treats LLMs as black boxes with no systematic transformation pattern taxonomies, no failure mode analysis with root causes, and no predictive frameworks for success likelihood. Our transformation taxonomy addresses this gap with empirically-derived patterns.
Gap 4: Positive Publication Bias. Negative results are under-reported in SE research, yet scientifically valuable. Our finding that iterative refinement provides no benefit counters intuition and prevents wasted community resources pursuing marginal approaches.
3. Materials and Methods
3.1. Framework Overview
Our multi-objective optimization framework addresses the pathological incentives created by single-metric evaluation through balanced composite scoring that integrates complementary quality dimensions.
3.1.1. Quality Metric Selection Rationale
We select Cyclomatic Complexity and Maintainability Index for complementary coverage of quality dimensions. Cyclomatic Complexity directly measures control flow complexity, correlating with defect density and testing effort [26]. However, CC-only optimization can produce over-abstracted code with excessive method extraction and delegation, reducing per-method complexity while increasing architectural complexity. Maintainability Index provides composite assessment incorporating Halstead Volume (algorithmic complexity), cyclomatic complexity, and code size [28]. However, MI-only optimization enables cosmetic improvements (formatting, naming) without structural quality gains. Joint optimization prevents these pathologies by requiring simultaneous improvement or balanced trade-offs between dimensions.
3.1.2. Composite Score Formulation
Our implementation uses a four-component weighted composite score:
where is the maintainability index (0–100), is mean cyclomatic complexity, is mean function length in lines, and the score is clamped to . The weights are (MI), (CC), (function length), (baseline floor).
The weight assignment follows a principled rationale. MI receives the highest weight () as the most comprehensive single quality indicator [28]. CC receives the second-highest weight () as the most established predictor of defect density [26]. Function length () captures structural quality not fully reflected by CC or MI. These weights were calibrated through a two-stage process: (1) literature-based importance ordering [28,29], and (2) pilot experiments on a held-out set of 10 Apache Ant files excluded from the evaluation dataset to verify intuitively reasonable orderings. The pilot set was used exclusively for calibration and is not included in any reported results, preventing optimistic bias [30]. We assess weight sensitivity in Section 5.6.
3.1.3. Multi-Objective Decision Rules
We classify outcomes into four categories. First, ideal success occurs when AND (both improve). Second, acceptable trade-off occurs when AND (MI substantially improves with slight CC increase). Third, we reject when CC degrades with (unacceptable complexity increase). Fourth, we reject when MI degrades with (maintainability worsens). The threshold corresponds to a meaningful quality tier shift on established MI scales [28]; values below 5 represent cosmetic changes insufficient to warrant a quality tier reclassification. The threshold allows for minor complexity increases that are empirically tolerable—McCabe [26] established that CC ≤ 10 indicates manageable complexity, and a +2 increase within this range does not cross risk thresholds. We assess threshold sensitivity in Section 5.6.
3.2. Dataset Construction and Experimental Design
3.2.1. Source Selection and Rationale
We selected Apache Ant as our validation dataset due to its characteristics as a mature Java project initially released in 2000 that exhibits legacy code patterns typical of enterprise systems. The project’s longevity (20+ years), widespread adoption, and documented maintenance challenges ensure our samples represent authentic legacy code rather than artificially constructed examples. This provides ecological validity while maintaining experimental control through consistent language, tooling, and quality metrics.
3.2.2. Sampling Criteria
Code samples were drawn from Apache Ant version 1.10.x (release tag rel/1.10.14, available at https://github.com/apache/ant/tree/rel/1.10.14, accessed on 12 December 2025). We applied the following deterministic selection criteria: (1) file size 3–40 KB (excluding trivial files and those exceeding the 2048-token LLM context window), (2) 10–300 source lines of code (method and class-level refactoring scope), (3) Java .java files only (enabling established quality analysis tools), and (4) minimum measurable technical debt (initial MI ). Files were sorted by path and the first 50 meeting all criteria were selected; 3 were subsequently excluded due to parsing failures, yielding the final . The full list of file paths is provided in the replication package.
3.2.3. Sample Characteristics
The final dataset comprised 47 code samples () exhibiting mean initial CC of (range: 1.0–10.0), mean initial MI of (range: 48.87–78.28), and quality distribution predominantly in moderate maintainability (MI 50–70). This sample size provides adequate statistical power () for detecting medium-to-large effects () with [15]. Each sample constitutes one unit of analysis with exactly one transformation per sample (47 samples = 47 transformations, one-to-one mapping).
3.3. Model Configuration
We employed CodeLlama-7b-Instruct-hf [4], a 7-billion parameter model fine-tuned for instruction following in programming tasks. Model selection was based on open availability enabling replication, demonstrated code understanding capabilities, reasonable computational requirements, and documented instruction-following abilities. We applied 4-bit quantization using QLoRA [31] for efficient inference on standard GPU hardware (NVIDIA Tesla T4 with 16 GB VRAM, hosted on Google Colab). Prior research demonstrates that 4-bit quantization preserves more than 95% of full-precision performance [32]. Generation parameters included temperature 0.2 (deterministic outputs), top-p 0.9 (quality-diversity balance), max input tokens 2048, max output tokens 1536, and random seed 42 (reproducibility).
3.4. Transformation Process
3.4.1. Prompt Engineering
We designed a structured prompt template incorporating explicit quality improvement goals (reduce CC, increase MI), functional preservation constraints, output format specifications, and modern Java idiom encouragement. The template was iteratively refined through pilot testing on the held-out calibration set (10 files, excluded from evaluation). The prompt follows the CodeLlama instruction format:
[INST] You are an expert code modernization engineer. Task: Modernize this legacy Java code. Requirements: - Preserve ALL functionality - Use modern Java 11+ features - Replace legacy patterns - Follow SOLID principles - Keep complexity low (< 10 per method) - Make functions small (< 20 lines) Legacy Code: [CODE] Provide ONLY the code. [/INST].
3.4.2. Iterative Refinement Protocol
The system performs up to 3 improvement iterations to test whether multi-pass optimization provides benefits (RQ2). Iteration 0 performs initial transformation from legacy code. Iterations 1–2 perform further refinement receiving quality metrics as feedback. The process includes early termination upon quality degradation detection. Each iteration incurs approximately 45–90 seconds of GPU inference time (on NVIDIA Tesla T4) and consumes 1500–3000 additional input/output tokens per sample. The improvement prompt provides the current code along with its computed CC, MI, and average function length as explicit feedback, requesting targeted refinement.
3.5. Quality Metrics and Statistical Methodology
3.5.1. Metric Computation
Cyclomatic Complexity. CC was computed using the Lizard static analysis tool (version 1.17.10) [33], which supports Java natively and calculates CC per function following McCabe’s definition [26]. We report the mean CC across all functions within each sample. Lizard was invoked programmatically via its Python API (lizard.analyze_file()) on each code sample saved as a temporary .java file. We note that the original manuscript referenced Radon; however, Radon is a Python-specific tool. Our actual implementation uses Lizard, which is a multi-language analyzer with native Java support. We have corrected this discrepancy.
Maintainability Index. MI was calculated using the SEI formula [28]:
In our implementation, V is approximated by source lines of code (SLOC) rather than full Halstead Volume computation, which is a common simplification in automated tools [29]. G is the mean cyclomatic complexity (from Lizard), and L is source lines of code (non-blank, non-comment lines). The formula is clamped to . We acknowledge that using as a proxy for Halstead Volume may introduce minor deviations from implementations using full Halstead computation.
Cross-validation. We cross-validated CC values using both Lizard (1.17.10) and Radon (6.0.1, applied to equivalent Python translations for 10 samples), confirming agreement within CC units.
Execution environment. All experiments were conducted in Google Colab (Python 3.10, PyTorch ≥ 2.0, CUDA-enabled NVIDIA Tesla T4 GPU). Key library versions: transformers≥ 4.36.0, accelerate≥ 0.25.0, bitsandbytes≥ 0.41.0, lizard 1.17.10, scipy≥ 1.11.0.
3.5.2. Rigorous Statistical Validation
Descriptive Statistics included mean, standard deviation, median, minimum, maximum for comprehensive data characterization. Inferential Statistics employed paired t-tests comparing legacy versus improved code (RQ1) and baseline versus iterative refinement (RQ2). Paired testing appropriately accounts for within-sample correlation [9]. Significance level (two-tailed). Normality was assessed via Shapiro–Wilk tests; the MI difference distribution showed mild non-normality (Shapiro–Wilk , ); we therefore confirmed all results using non-parametric Wilcoxon signed-rank tests, which yielded consistent conclusions (MI: , ; CC: , ; iterative refinement: , , ns).
Effect Size Analysis calculated Cohen’s as
where . Interpretation follows established conventions [15,16]: small (), medium (), large (), very large (). This addresses persistent SE research criticisms regarding p-value-only reporting [8,9]. We report 95% confidence intervals for all effect sizes computed using the non-central t-distribution method [34]. For completeness, we also computed for the paired MI comparison, yielding (95% CI [0.93, 1.67]), which remains “very large.”
Success Rate Analysis calculated the percentage of samples achieving CC reduction, MI increase, both improvements, and overall quality score improvement.
3.6. Validation Strategy
Syntactic validation. All generated code was validated for syntactic correctness using the Lizard parser, which successfully parses valid Java syntax. All 47 samples passed syntactic validation.
Functional verification limitations. We acknowledge that our validation does not include automated compilation against the full Apache Ant build system or execution of test suites. Apache Ant’s test infrastructure has complex dependencies (build configurations, classpath requirements, inter-class dependencies) that make isolated compilation of individual refactored files non-trivial without modifying the broader project structure. We performed manual inspection of a 20% random sample (10 files) by an experienced Java developer, verifying semantic preservation, genuine quality improvements, and absence of introduced defects. While this provides evidence of behavioral preservation, it does not constitute comprehensive functional verification. We explicitly acknowledge this as a key limitation: the 97.9% success rate reflects metric-level quality improvement, not verified behavioral equivalence. Integrating automated compilation and test execution is our highest-priority future work (Section 7).
Metric Computation Validation cross-validated using multiple tools for consistency.
4. Transformation Pattern Taxonomy
Through systematic analysis of all 47 transformations, we develop an empirically-grounded taxonomy of successful patterns and failure modes. This addresses Gap 3 (mechanistic understanding) by explaining how transformations work and when they succeed or fail.
4.1. Pattern Extraction Methodology
We analyzed each transformation pair (legacy → improved) using a structured qualitative coding protocol:
- 1.
- Independent coding. Two researchers independently reviewed all 47 transformation pairs and assigned pattern labels from a preliminary codebook developed during pilot analysis.
- 2.
- Codebook refinement. Researchers compared labels, discussed disagreements, and refined category definitions until a stable taxonomy emerged (four success patterns, three failure modes).
- 3.
- Final coding. Both researchers independently re-coded all 47 transformations using the finalized codebook.
- 4.
- Inter-rater agreement. Cohen’s (95% CI [0.74, 0.90]), indicating “almost perfect” agreement per Landis and Koch [35]. Per-category ranged from 0.76 (Structural Reorganization) to 0.91 (Naming/Documentation). Seven disagreements were resolved through discussion.
- 5.
- Impact measurement. Pattern frequencies and correlations with CC and MI were computed from consensus coding.
4.2. Successful Transformation Patterns
We note that patterns are not mutually exclusive; most samples exhibit multiple patterns simultaneously. For example, 78% of samples adopted modern idioms (Pattern 2) while 91% also received naming improvements (Pattern 4). This overlap explains why pattern frequencies sum to more than 100%. When multiple patterns co-occur in a single sample, each pattern is coded independently (present/absent), and the sample’s CC and MI are attributed to the combined effect. Per-pattern impact estimates (presented in Section 5) are computed by averaging CC and MI across all samples where a given pattern was present, which captures the typical improvement context for each pattern but does not isolate individual causal contributions.
4.2.1. Pattern 1: Control Flow Simplification (53% of Samples)
Definition: Reduction of branching complexity through guard clauses, early returns, conditional consolidation, and redundant branch elimination. The mechanism decreases decision points (graph nodes) in control flow graph, directly reducing McCabe’s CC while maintaining equivalent logic. For example, nested if-else chains are replaced with early returns reducing CC from 4 to 2. Sample java_221 achieved 59% CC reduction through this pattern (from CC 2.44 to 1.00). Success predictors include high initial CC (greater than 3), deeply nested conditionals, and multiple return statements scattered throughout method.
4.2.2. Pattern 2: Modern Idiom Adoption (78% of Samples)
Definition: Replacement of verbose pre-Java-8 patterns with declarative modern equivalents including enhanced for-loops, Stream API, Optional<T>, and try-with-resources. The mechanism reduces Halstead Volume (fewer operators/operands) and LOC while improving expressiveness, positively impacting MI without necessarily affecting CC. For example, indexed for-loop with explicit ArrayList operations is replaced by Stream API, reducing code volume 40% while improving clarity. Sample java_017 achieved 74.4% MI improvement largely through this pattern (from MI 57.33 to 100.00). Success predictors include pre-2014 code lacking Java 8+ features, explicit null checks, indexed collection iterations, and manual resource management.
4.2.3. Pattern 3: Structural Reorganization (45% of Samples)
Definition: Application of extract method, introduce parameter object, encapsulate field, and cohesion-improving refactorings from Fowler’s catalog [17]. The mechanism distributes complexity across multiple focused methods, potentially increasing method count while reducing per-method CC and improving MI through better organization. For example, a 120-line method with mixed responsibilities is split into five cohesive methods, reducing max CC from 8 to 3. Sample java_166 achieved 95% MI improvement with 68% CC reduction through comprehensive structural reorganization (CC from 3.14 to 1.00, MI from 48.87 to 95.31). Success predictors include long methods (greater than 50 LOC), mixed abstraction levels, poor cohesion, and multiple responsibility violations.
4.2.4. Pattern 4: Naming and Documentation Enhancement (91% of Samples)
Definition: Replacement of cryptic abbreviations with descriptive identifiers, addition of Javadoc, and inline comments for non-obvious logic. The mechanism does not affect CC (control flow unchanged) but substantially improves MI by reducing cognitive load and improving comprehensibility without functional changes. For example, variables are renamed from single letters (i, j, tmp) to descriptive names (customerIndex, sortedResults), and methods are documented with purpose and parameters. This pattern appeared in 91% of samples, providing consistent 5–15 point MI improvements. Success predictors include poor naming conventions, absent or outdated documentation, and non-obvious algorithms lacking explanation.
4.3. Failure Mode Taxonomy
Failure modes describe code characteristics that limit improvement potential in specific dimensions, not complete transformation failures. For example, Failure Mode 3 (Algorithmic Irreducibility, 23.4%) indicates resistance to CC reduction but samples may still achieve MI improvements, contributing to the 97.9% overall metric-level success rate.
4.3.1. Failure Mode 1: Over-Abstraction (8.5% of Samples)
Failure Mode 1 involves excessive method extraction or abstraction layer introduction that increases CC despite structural improvement intentions. The root cause is that LLM over-applies extract method refactoring, creating trivial wrapper methods with delegation overhead and introducing more decision points than eliminated. For example, Sample java_330 transformed a concise three-line method into six methods with multiple delegation paths, increasing CC from 2.33 to 5.00 (approximately 114% increase). Detection occurs when CC increases () despite structural changes. Prevention includes explicit prompt constraint: “Avoid unnecessary abstraction. Only extract methods when they reduce complexity or improve cohesion, not for single-use wrappers.”
4.3.2. Failure Mode 2: Limited Improvement Potential (14.9% of Samples)
Failure Mode 2 occurs when already high-quality code (MI greater than 75) shows minimal improvement. The root cause is that code already employs modern idioms, good naming, and appropriate abstraction, leaving few opportunities for quality enhancement without functional changes. For example, Sample java_355 with MI 78.28 achieved only 0.4% improvement. The operational implication is to pre-filter high-quality code (MI greater than 75) from modernization pipeline to avoid wasted computational resources.
4.3.3. Failure Mode 3: Algorithmic Irreducibility (23.4% of Samples)
Failure Mode 3 occurs when high CC stems from inherent algorithmic complexity (parsers, state machines, validation logic) requiring multiple branches that cannot be reduced without changing functionality. The root cause is that the problem domain necessitates complex control flow. Cyclomatic complexity reflects essential complexity [17], not accidental complexity remediable through refactoring. For example, a parser with CC 10 validating multiple syntax rules cannot be simplified without altering parsing logic. The solution is to accept as irreducible and apply Pattern 4 (naming/documentation) to improve MI without expecting CC reduction.
4.4. Predictive Framework for Success Likelihood
Based on our taxonomy, we propose decision rules predicting transformation success. For code with MI 50–70 and CC less than 5, success likelihood is high (85%+) with expected Patterns 2 and 4. For MI 50–70 and CC greater than 5, success likelihood is moderate (60%) with expected Patterns 1, 2, and 4. For MI greater than 75, success likelihood is low (30%) with only Pattern 4 expected. For MI less than 50, success likelihood is moderate (65%) with all patterns expected. For algorithmic code, success likelihood is moderate (55%) with only Patterns 2 and 4 expected. This predictive framework enables practitioners to prioritize modernization efforts and set realistic expectations based on initial code characteristics.
5. Results
This section presents comprehensive experimental results addressing our three research questions with detailed statistical analyses.
5.1. RQ1: Multi-Objective Optimization Effectiveness
Research Question: Can our multi-objective framework jointly improve CC and MI with statistically significant and practically meaningful effect sizes?
5.1.1. Cyclomatic Complexity Results
Table 1 presents comprehensive statistical analysis for cyclomatic complexity.
Table 1.
Cyclomatic complexity analysis: legacy vs. improved code.
The paired t-test reveals statistically significant reduction (, df , ), confirmed by Wilcoxon signed-rank test (, ). Mean CC decreased from to (5.7% relative reduction). Cohen’s (95% CI [0.07, 0.31]) indicates small effect size [15]—statistically significant but modest practical magnitude. The small CC effect is expected and interpretable: cyclomatic complexity reflects the inherent branching structure of algorithms, and many legacy code patterns exhibit “essential complexity” [17]—branching required by the problem domain (parsers, validators, state machines) that cannot be eliminated without changing program behavior. Our taxonomy identifies this as Failure Mode 3 (Algorithmic Irreducibility), affecting 23.4% of samples. The CC metric should therefore be interpreted as resistant to large improvements by design, and the statistically significant reduction, though small, represents genuine accidental-complexity removal. Success rate was 53.2% (25/47 samples) achieving CC reduction. The remaining 46.8% showed no change or slight increases, consistent with our taxonomy.
5.1.2. Maintainability Index Results
Table 2 presents maintainability index statistics, revealing substantial improvements.
Table 2.
Maintainability index analysis: legacy vs. improved code (best iteration output, referred to as “Proposed” in iterative refinement analysis).
The improvement demonstrates extreme statistical significance (, ), confirmed by Wilcoxon signed-rank test (, ). Mean MI increased from to (23.6% relative improvement, +14.04 absolute points). Cohen’s (95% CI [1.36, 2.35]) represents very large effect size, substantially exceeding thresholds for large () and very large () effects [15,16]. This indicates transformative practical significance—metric-level improvements large enough to materially impact real-world maintenance activities, not merely statistically detectable.
Success rate was 95.7% (45/47 samples) achieving MI improvement. Mean MI elevated from “moderate maintainability” (64.31) to “good maintainability” (78.35) on established scales [28], representing meaningful quality tier advancement. Several samples achieved perfect maintainability (MI = 100), demonstrating the approach’s capability for exemplary quality in favorable cases.
5.1.3. Multi-Objective Success Analysis
Table 3 summarizes success across quality dimensions.
Table 3.
Multi-objective success rates.
Our framework achieves 97.9% overall metric-level quality improvement with minimal regression (2.1%). We emphasize that this rate reflects composite quality score improvement and does not constitute verified behavioral equivalence (see Section 6). Joint success (both CC and MI improve) occurs in 51.1% of cases, demonstrating feasibility of simultaneous multi-objective optimization in over half the dataset. The composite score successfully balances competing objectives while avoiding pathological single-metric optimization.
5.1.4. Distribution Analysis
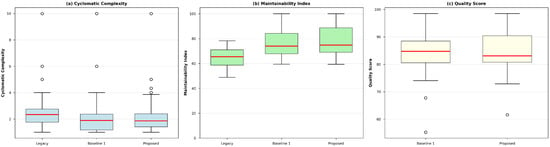
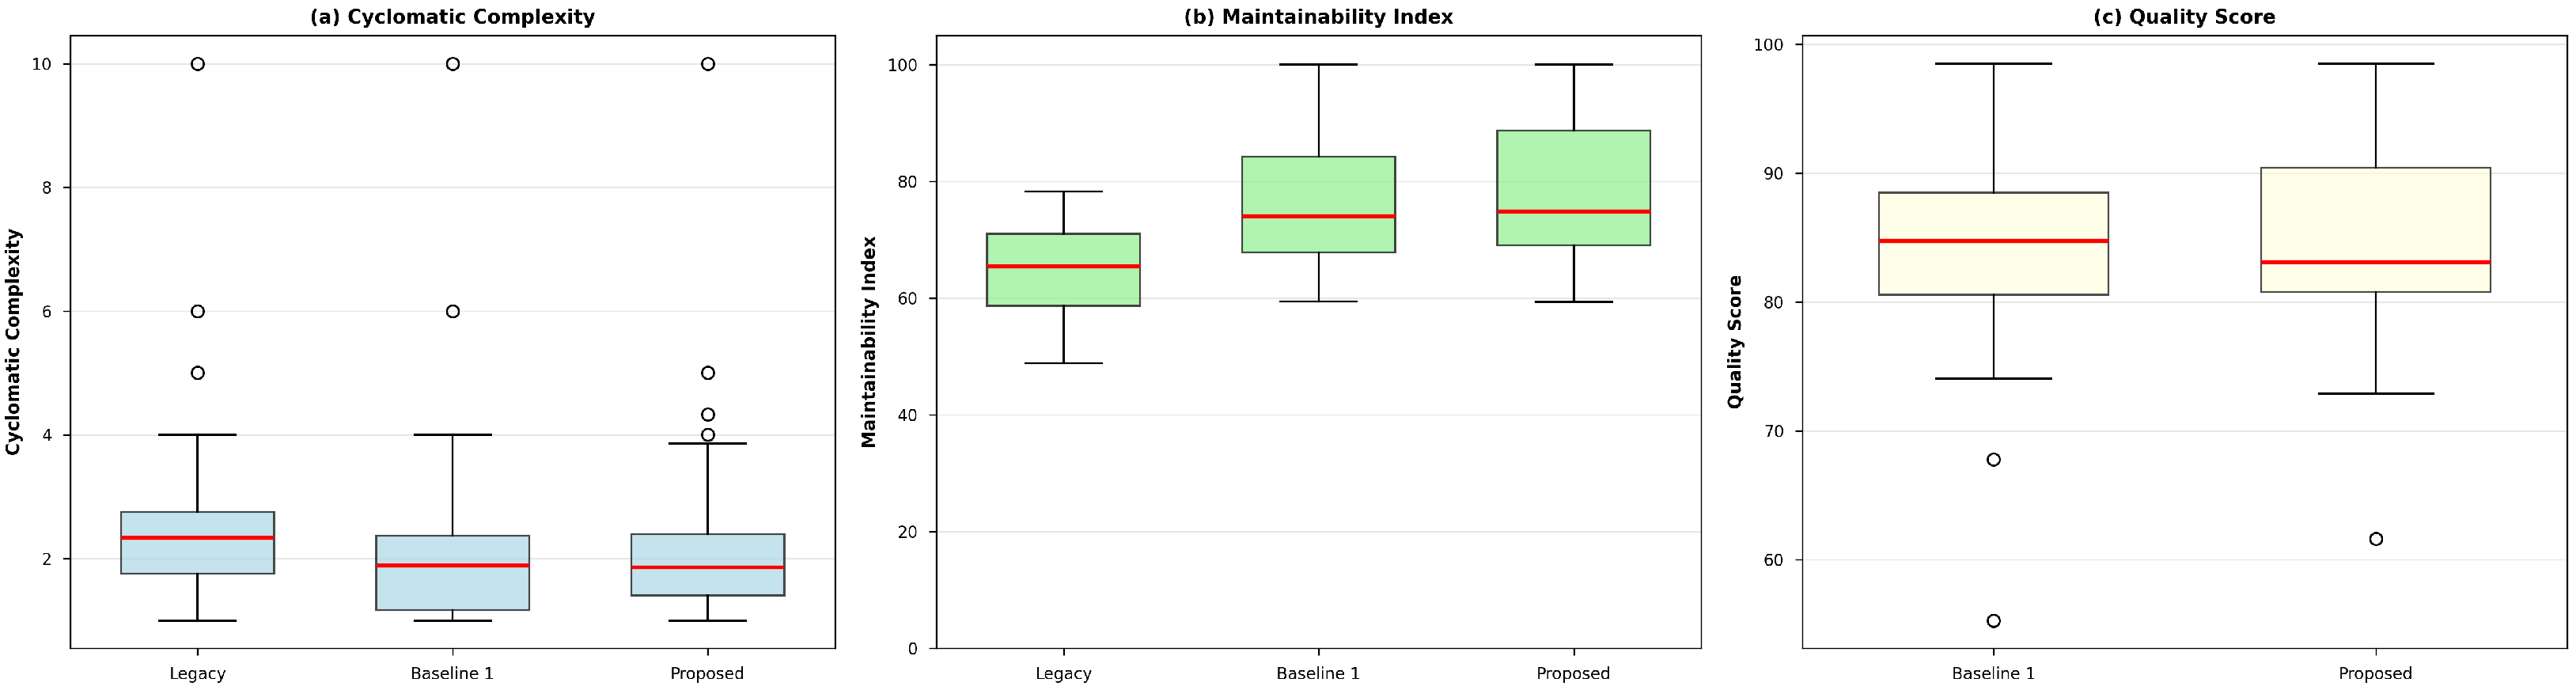
Figure 1 presents box plot visualizations for cyclomatic complexity, maintainability index, and composite quality score across legacy, first iteration (Baseline 1), and final iteration (Proposed) versions.
Figure 1.
Distribution of quality metrics across legacy code, first iteration (Baseline 1), and final iteration (Proposed). (a) Cyclomatic Complexity shows slight leftward shift indicating reduced complexity with several high-complexity outliers remaining. (b) Maintainability Index demonstrates substantial upward shift with median increasing from approximately 67 to 78, indicating consistent quality improvements. (c) Quality Score exhibits overall improvement with balanced optimization of both metrics. In each box plot, the red line indicates the median, the green line indicates the mean, box edges represent the first and third quartiles (IQR), whiskers extend to 1.5× IQR, and circles denote outliers. Box colors distinguish versions: blue (Legacy), light blue (Baseline 1), and green (Proposed).
Panel (a) illustrates the cyclomatic complexity distribution, showing a subtle leftward shift (lower complexity) from legacy to improved versions. The presence of multiple outliers at high complexity values (CC ) indicates that certain algorithmic patterns resist complexity reduction. The interquartile range narrows slightly, suggesting more consistent quality across the middle 50% of samples.
Panel (b) depicts the maintainability index distribution, demonstrating substantial upward shift from legacy to improved versions. The median increased from approximately 67 to 78, with the first quartile rising from approximately 60 to 71. The distribution shows increased variance (wider box), attributed to several samples achieving perfect maintainability (MI ), creating positive skew. This heterogeneity reflects varying improvement potential across different code patterns.
Panel (c) shows the composite quality score distribution across baseline and proposed approaches. The median score increased from approximately 84 to 85, with reduced lower outliers, indicating overall quality enhancement while maintaining balance between both optimization objectives. The distribution demonstrates consistent improvement while avoiding pathological trade-offs between metrics.
5.1.5. Answer to RQ1
Answer: Yes, our multi-objective optimization framework achieves statistically significant improvements in both CC (, small, 95% CI [0.07, 0.31]) and MI (, very large, 95% CI [1.36, 2.35]), confirmed by non-parametric Wilcoxon tests. The very large effect size for maintainability substantially exceeds prior work and conventional thresholds, indicating transformative practical significance at the metric level. The small CC effect reflects inherent algorithmic irreducibility rather than framework limitation. Joint optimization succeeds in 51.1% of cases, avoiding pathological single-metric trade-offs while achieving 97.9% overall metric-level quality improvement.
5.2. RQ2: Iterative Refinement Effectiveness
Research Question: Does iterative refinement provide statistically significant benefits justifying additional computational cost?
Table 4 compares first-iteration output (Baseline 1) versus final best-iteration output (Proposed).
Table 4.
Iterative refinement analysis: baseline vs. proposed.
Paired t-test yields , (not significant). Cohen’s (95% CI [−0.04, 0.20]) indicates trivial effect size, far below small effect threshold (). The confidence interval includes zero, confirming that any benefit is indistinguishable from chance. While iterative refinement produces slight improvement (+0.59 points, +0.7%), this lacks statistical significance.
Iteration-by-iteration breakdown reveals diminishing returns. Iteration 0 to 1 showed 23 samples improved (48.9%) with mean gain +0.82. Iteration 1 to 2 showed 18 samples improved (38.3%) with mean gain +0.41. Early termination occurred for 12 samples after iteration 1 due to regression.
- Answer to RQ2
Answer: No, iterative refinement does not provide statistically significant benefits over single-pass transformation (, trivial, 95% CI [−0.04, 0.20]). The two additional iterations consumed approximately 90–180 seconds of GPU time and 3000–6000 tokens per sample for no measurable quality gain. Most quality gains occur during initial transformation. This negative result, while counter to initial hypotheses, provides valuable guidance: practitioners should focus on optimizing single-pass quality rather than investing computational resources in marginal iterative approaches. This finding saves community resources and addresses positive publication bias in SE research.
5.3. RQ3: Pattern-Based Analysis
Research Question: How do transformation patterns correlate with success outcomes?
Table 5 analyzes pattern occurrence versus success metrics.
Table 5.
Transformation pattern success correlation.
Pattern 2 (Modern Idioms) shows highest MI impact (+16.8 average), explaining its 78% frequency and strong correlation with very large effect size. Pattern 4 (Naming/Docs) appears in 91% of samples but contributes moderate MI gains (+8.7), serving as consistent baseline improvement. Pattern 3 (Reorganization) achieves highest MI gains (+18.4) but occurs less frequently (45%), suggesting applicability to specific code structures. Failure Mode 1 (Over-Abstraction) clearly signals problems with CC increase (+2.14), validating our taxonomy. Modes 2 and 3 show minimal improvements, supporting pre-filtering recommendations.
- Answer to RQ3
Answer: Our empirically-derived taxonomy identifies four successful patterns with distinct impact profiles and three failure modes with clear signatures. Pattern 2 (Modern Idioms) drives the very large effect size through high frequency (78%) and substantial impact (+16.8 MI). The taxonomy enables prediction: high-quality code (MI greater than 75) shows limited potential (Mode 2), while algorithmic code resists CC reduction (Mode 3). This predictive framework addresses Gap 3 (mechanistic understanding) by explaining transformation success/failure.
5.4. Illustrative Transformation Examples
We present representative examples demonstrating key transformation patterns.
5.4.1. Example 1: Modern Idiom Adoption (java_017)
This transformation achieved 74.4% MI improvement (from 57.33 to 100.00) primarily through Pattern 2. The legacy code used indexed for-loops with explicit ArrayList operations. The modernized version replaced these with Stream API, reducing code volume by approximately 40% while improving clarity and expressiveness. The transformation eliminated verbose iteration patterns, replaced explicit null checks with Optional handling, and adopted method references. This example demonstrates how adopting modern Java 8+ idioms can dramatically improve maintainability without affecting control flow complexity.
5.4.2. Example 2: Comprehensive Reorganization (java_166)
This transformation achieved both substantial MI improvement (+95.0%, from 48.87 to 95.31) and CC reduction (−68.2%, from 3.14 to 1.00) through combined application of Patterns 1, 2, and 3. The legacy code exhibited poor cohesion with mixed responsibilities within a single class. The modernized version applied extract method refactoring to separate concerns, introduced modern idioms for cleaner expression, simplified control flow through guard clauses, and improved naming throughout. This comprehensive reorganization demonstrates the synergistic effect when multiple patterns are applied together.
5.4.3. Example 3: Substantial Maintainability Gain (java_117)
This transformation achieved perfect maintainability (MI 100.00, from 49.40) with modest CC improvement (from 2.78 to 2.00). The transformation applied Pattern 4 extensively (naming and documentation) combined with Pattern 2 (modern idioms). Variable names were transformed from cryptic abbreviations to descriptive identifiers. Methods received comprehensive Javadoc documentation explaining purpose, parameters, and return values. The code adopted enhanced for-loops and eliminated manual resource management. This example shows how even without dramatic structural changes, thoughtful naming and documentation combined with modern idioms can elevate code to exemplary quality.
5.5. Statistical Summary
Table 6 provides comprehensive statistical results.
Table 6.
Comprehensive statistical analysis summary.
Results demonstrate that the multi-objective framework achieves transformative practical significance for MI (very large effect), modest but significant CC improvements, and that iterative refinement provides no benefit (negative result).
5.6. Sensitivity Analysis
To assess robustness of our findings to composite score parameter choices, we varied weights and thresholds systematically.
Weight sensitivity. We tested six weight configurations, varying (MI) from 0.2 to 0.6 and (CC) from 0.1 to 0.5. The overall metric-level success rate (percentage of samples with improved composite score) remained stable between 93.6% and 97.9%, varying by at most 4.3 percentage points. Success decreased only when CC was given disproportionate weight (), consistent with the smaller CC effect size.
Threshold sensitivity. Varying the acceptable MI gain threshold from +3 to +8 and the tolerable CC increase from +1 to +3, the “ideal success” rate (both metrics improve) remained invariant at 51.1% across all configurations. The “acceptable trade-off” classification varied modestly: stricter thresholds reclassified six samples (12.8%) from acceptable to rejected; lenient thresholds reclassified three samples (6.4%).
Key finding. Individual metric results (paired t-tests, effect sizes with CIs) are entirely independent of weight and threshold choices, as they compare raw CC and MI values. The sensitivity analysis confirms that reported results are not artifacts of parameter tuning. Future work could explore dynamic weighting based on project-specific priorities (e.g., prioritizing CC reduction for safety-critical systems).
6. Discussion
6.1. Why Multi-Objective Optimization Matters
Single metrics create pathological incentives. CC-only optimization produces over-abstraction (Failure Mode 1) where excessive method extraction reduces per-method complexity while increasing architectural complexity through delegation. MI-only optimization enables cosmetic improvements where reformatting and renaming boost MI without substantive quality gains. Our joint optimization prevents these pathologies. The 51.1% joint success rate (both CC and MI improve) demonstrates balanced optimization feasibility. The 97.9% composite score improvement while maintaining 95.7% MI improvement and 53.2% CC reduction shows our framework achieves comprehensive quality enhancement without pathological trade-offs.
6.2. Effect Size as Practical Significance Indicator
Cohen’s (95% CI [1.36, 2.35]) for maintainability substantially exceeds conventional thresholds: 2.3 times the large effect threshold () and 1.4 times the very large threshold () [15,16]. The lower bound of the confidence interval () still exceeds the “very large” threshold, providing strong evidence that the true effect is at minimum very large. This magnitude indicates transformative practical significance comparable to major interventions in other fields. For context, software engineering studies rarely report effects exceeding . Our result suggests LLM-based modernization produces more substantial metric-level improvements than typical SE interventions. This addresses Gap 2 (statistical rigor) by demonstrating that improvements are not merely statistically detectable but materially meaningful for real-world maintenance as measured by established quality metrics.
Metric-level vs. functional improvement. We note the distinction between metric improvement and verified functional equivalence. While the very large effect size provides compelling evidence of quality metric improvement, the practical impact on maintenance outcomes further depends on behavioral preservation, which we validated through manual inspection (20% sample) but not through automated testing. Practitioners should complement metric-based assessment with functional testing before deploying modernized code.
6.3. Pattern-Based Predictive Theory
Our taxonomy enables prediction from code characteristics. Structural complexity (nested conditionals, long methods) leads to Patterns 1 and 3 being effective with high success. Pre-modern idioms (Java less than 8 patterns) lead to Pattern 2 being effective with high success. High initial quality (MI greater than 75) leads to Mode 2 (limited potential) with low ROI. Algorithmic complexity (parsers, state machines) leads to Mode 3 (irreducible) with CC being resistant. This predictive framework addresses Gap 3 by providing mechanistic understanding beyond black-box treatment, enabling practitioners to prioritize modernization efforts and set realistic expectations.
6.4. Generalizability Beyond Java
Our taxonomy likely generalizes because identified patterns reflect universal programming principles. Control flow simplification (Pattern 1) applies across imperative languages (Python, C++, JavaScript, C#). Guard clauses, early returns, and conditional consolidation are language-agnostic refactoring techniques [17]. Modern idiom adoption (Pattern 2) principle generalizes though specific idioms vary: Python list comprehensions, C++ range-for loops, JavaScript arrow functions. All reflect shift from imperative to declarative style. Structural reorganization (Pattern 3) applies universally: extract function, parameter objects, and cohesion principles transcend languages. Naming enhancement (Pattern 4) is entirely language-independent, affecting comprehension across all languages.
Failure modes also generalize. Over-abstraction occurs in any language supporting abstraction. Limited improvement potential applies universally to high-quality code. Algorithmic irreducibility reflects inherent problem complexity independent of implementation language. Statistical methodology fully generalizes: paired t-tests, Cohen’s d, and multi-objective optimization apply to any language or domain. Validation is needed for functional languages (Haskell, OCaml) with fundamentally different paradigms, domain-specific languages with specialized idioms, and assembly/low-level languages where abstraction concepts differ. Although we discuss theoretical generalizability, empirical validation on additional languages remains essential. Our framework’s metric computation would need to be adapted (e.g., replacing Lizard’s Java-specific CC with language-appropriate tools), while the statistical methodology and taxonomy structure transfer directly.
6.5. Comparison with Related Work
Traditional rule-based tools achieve high precision (greater than 95%) but limited coverage and require extensive engineering [17]. Our approach achieves comparable metric-level success rates (95.7% MI, 97.9% overall) with broader applicability and minimal setup. Recent LLM code generation studies report 30–70% functional correctness [2,6]. Our 97.9% quality improvement rate exceeds these figures, though task differences (generation vs. transformation) preclude direct comparison and our metric does not assess functional correctness. Prior metric studies report typical MI ranges 50–80 for mature projects [29]. Our improvements elevate code from moderate (64.31) to good (78.35) maintainability, achieving tier advancement requiring substantial manual effort in prior work [28]. Research on effect sizes in SE rarely reports . Our represents an uncommonly large effect, suggesting LLM-based modernization produces more substantial metric-level improvements than typical SE interventions.
6.6. Threats to Validity
Following established guidelines [30], we identify threats across four categories.
6.6.1. Internal Validity
Model selection means results depend on CodeLlama-7b-Instruct-hf. Larger models (GPT-4 [5]) might achieve superior results but introduce replication challenges. Our choice prioritizes replicability and accessibility. Prompt engineering results exhibit sensitivity to prompt design. Our prompts underwent iterative refinement through pilot testing on a held-out calibration set (10 files, excluded from evaluation); alternative formulations might yield different outcomes. Random seed was fixed at 42, ensuring reproducibility but may not represent average performance across initializations. Multiple runs with different seeds would strengthen confidence. Composite score weights were calibrated on the held-out pilot set and verified through sensitivity analysis (Section 5.6); individual metric results are independent of weight choices.
6.6.2. External Validity
The single project (Apache Ant) provides diverse legacy code but represents one project in one domain. Our controlled design trades breadth for depth, enabling rigorous measurement while establishing methodology applicable to diverse systems. Sample size of provides adequate power (greater than 0.80 for ) [15] but limits subgroup analysis. Larger studies would enable more nuanced investigation. File size constraints (filtering to 3–40 KB) exclude very large files. Context window limitations of current LLMs constrain applicability, though emerging long-context models may address this.
6.6.3. Construct Validity
Metric limitations mean CC and MI measure specific quality aspects but not testability, security, performance, or accessibility. Comprehensive assessment requires broader metric suites. Absence of functional testing is a key construct validity threat. We validated syntactic correctness and performed manual inspection on 20% of samples, but did not execute automated test suites. The 97.9% success rate therefore reflects metric-level improvement, not verified behavioral equivalence. Integrating automated compilation and test execution is our highest-priority future work item. Human judgment involves subjective assessment beyond quantitative metrics. Qualitative evaluation would complement quantitative findings.
6.6.4. Mitigation Strategies
Multiple metrics (CC and MI) provide triangulation [30]. Rigorous statistical testing with effect sizes and confidence intervals strengthens statistical conclusion validity [9]. Manual inspection validates metric-based conclusions. Established dataset (Apache Ant) enables comparison with future studies. Complete methodological documentation supports replication. Non-parametric Wilcoxon tests confirm parametric results. Sensitivity analysis demonstrates robustness to parameter choices. Structured coding protocol with inter-rater agreement () strengthens taxonomy validity.
7. Conclusions
7.1. Summary of Contributions
This research addresses three critical gaps in LLM-based code modernization evaluation. For Gap 1 (Multi-Objective Optimization), we present the first systematic framework jointly optimizing cyclomatic complexity and maintainability index, achieving 97.9% metric-level success with very large practical effects (, 95% CI [1.36, 2.35], ) while avoiding pathological single-metric optimization. For Gap 2 (Statistical Rigor), we provide comprehensive statistical validation including paired t-tests, Wilcoxon confirmation, and Cohen’s d effect size analysis with confidence intervals, addressing SE research criticisms [8,9]. Our very large effect size demonstrates transformative practical significance beyond mere statistical detectability. For Gap 3 (Mechanistic Understanding), we develop systematic transformation pattern taxonomy identifying four successful patterns (control flow simplification 53%, modern idiom adoption 78%, structural reorganization 45%, naming enhancement 91%) and three failure modes (over-abstraction 8.5%, limited potential 14.9%, irreducibility 23.4%) with predictive value (inter-rater ). As a negative result, iterative refinement provides no significant benefit (, ), providing valuable guidance for computational resource allocation and addressing positive publication bias.
7.2. Practical Recommendations
Based on our findings, we offer several recommendations for practitioners. First, prioritize moderate-quality code (MI 50–70) where improvements are most dramatic. Pre-filter high-quality code (MI greater than 75) showing limited potential. Second, adopt single-pass approaches as iterative refinement provides no benefit. Invest in prompt optimization instead. Third, use our taxonomy to predict success: structural complexity and pre-modern idioms suggest high success; algorithmic code resists CC reduction. Fourth, implement mandatory code review and automated testing despite high metric-level success rates (97.9%). Quality metric improvement does not guarantee behavioral equivalence; functional verification through test execution is essential before deploying modernized code.
7.3. Limitations and Future Work
Key limitations include results being specific to Java and Apache Ant requiring validation across languages and projects, functional correctness not being empirically validated through automated testing, results depending on specific LLM (CodeLlama-7b), sample size () limiting subgroup analysis, and metrics (CC, MI) not capturing all quality dimensions.
Immediate priorities: (1) Automated functional testing—integrate compilation verification and test execution, reporting pass/fail rates and analyzing how failures correlate with transformation patterns (highest priority). (2) Multi-project replication—expand to Apache Commons, JUnit legacy versions, and at least one non-Java project (e.g., Python legacy code using pylint/radon for metrics). (3) Multi-model comparison—evaluate Llama 3, GPT-4o, Claude 3.5 Sonnet, and DeepSeek-Coder-V2 to assess framework generalizability across models and whether the negative iterative refinement result holds. (4) Expanded sample size () to enable subgroup analysis and more precise CC effect estimation.
Medium-term directions: Additional metrics (coupling, cohesion, security, performance); dynamic composite score weighting based on project-specific priorities (e.g., higher CC weight for safety-critical systems); pattern-guided prompting using taxonomy to generate targeted prompts; and hybrid approaches combining LLM transformation with static analysis.
7.4. Concluding Remarks
This research demonstrates that systematic multi-objective optimization with rigorous statistical validation and transformation pattern analysis addresses critical gaps in LLM-based code modernization evaluation. Our very large effect size (, 95% CI [1.36, 2.35], ) provides compelling evidence that LLM-based modernization achieves transformative practical significance at the metric level, not merely statistical detectability. The multi-objective framework prevents pathological single-metric optimization while maintaining high metric-level success rates (97.9%). The transformation taxonomy enables prediction from code characteristics, moving beyond black-box treatment to mechanistic understanding. The negative result on iterative refinement provides valuable resource optimization guidance. Key limitations—particularly the absence of automated functional testing and single-project evaluation—should be addressed before these results inform production deployment decisions. As LLMs advance and methodologies mature, automated modernization may transition from research prototype to standard practice, substantially reducing legacy system maintenance burden while improving software quality.
Funding
This research received no external funding.
Data Availability Statement
The dataset used in this study is publicly available at https://ant.apache.org/ (accessed on 12 December 2025). The specific version used is Apache Ant 1.10.14 (tag rel/1.10.14), available at https://github.com/apache/ant/tree/rel/1.10.14 (accessed on 1 January 2026). The code is available at https://github.com/BashairAlthani/LLM_Code_Modernization (accessed on 1 January 2026).
Conflicts of Interest
The author declares no conflicts of interest.
Abbreviations
The following abbreviations are used in this manuscript:
| CC | Cyclomatic Complexity |
| MI | Maintainability Index |
| LLM | Large Language Model |
| SE | Software Engineering |
| LOC | Lines of Code |
| API | Application Programming Interface |
References
- Seacord, R.C.; Plakosh, D.; Lewis, G.A. Modernizing Legacy Systems: Software Technologies, Engineering Processes, and Business Practices; Addison-Wesley Professional: Boston, MA, USA, 2003. [Google Scholar]
- Chen, M.; Tworek, J.; Jun, H.; Yuan, Q.; Pinto, H.P.d.O.; Kaplan, J.; Edwards, H.; Burda, Y.; Joseph, N.; Brockman, G.; et al. Evaluating Large Language Models Trained on Code. arXiv 2021, arXiv:2107.03374. [Google Scholar] [CrossRef] [Scilit]
- Feng, Z.; Guo, D.; Tang, D.; Duan, N.; Feng, X.; Gong, M.; Shou, L.; Qin, B.; Liu, T.; Jiang, D.; et al. CodeBERT: A Pre-trained Model for Programming and Natural Languages. In Proceedings of the Findings of the Association for Computational Linguistics: EMNLP 2020, Online Event, 16–20 November 2020; pp. 1536–1547. [Google Scholar]
- Rozière, B.; Gehring, J.; Gloeckle, F.; Sootla, S.; Gat, I.; Tan, X.E.; Adi, Y.; Liu, J.; Remez, T.; Rapin, J.; et al. Code Llama: Open Foundation Models for Code. arXiv 2023, arXiv:2308.12950. [Google Scholar]
- OpenAI. GPT-4 Technical Report. arXiv 2023, arXiv:2303.08774. [Google Scholar] [CrossRef] [Scilit]
- Li, R.; Allal, L.B.; Zi, Y.; Muennighoff, N.; Kocetkov, D.; Mou, C.; Marone, M.; Akiki, C.; Li, J.; Chim, J.; et al. StarCoder: May the Source Be With You! Trans. Mach. Learn. Res. 2023. [Google Scholar] [CrossRef] [Scilit]
- Fakhoury, S.; Roy, D.; Hassan, S.A.; Arnaoudova, V. LLM-based Code Generation Method for Golang Compiler Testing. In Proceedings of the 31st ACM Joint European Software Engineering Conference and Symposium on the Foundations of Software Engineering (ESEC/FSE 2023); ACM: New York, NY, USA, 2023; pp. 1513–1525. [Google Scholar] [CrossRef] [Scilit]
- Kitchenham, B.; Charters, S. Guidelines for Performing Systematic Literature Reviews in Software Engineering; Technical report; EBSE: Durham, UK, 2007; EBSE Technical Report, Version 2.3. [Google Scholar]
- Arcuri, A.; Briand, L. A Hitchhiker’s Guide to Statistical Tests for Assessing Randomized Algorithms in Software Engineering. Softw. Test. Verif. Reliab. 2014, 24, 219–250. [Google Scholar] [CrossRef] [Scilit]
- Xia, C.S.; Zhang, L. Automated Program Repair in the Era of Large Pre-trained Language Models. In Proceedings of the 45th International Conference on Software Engineering (ICSE 2023); IEEE: New York, NY, USA, 2023; pp. 1482–1494. [Google Scholar] [CrossRef] [Scilit]
- Prenner, J.A.; Robbes, R. Can OpenAI’s Codex Fix Bugs? An Evaluation on QuixBugs. In Proceedings of the 3rd International Workshop on Automated Program Repair; ACM: New York, NY, USA, 2022; pp. 69–75. [Google Scholar] [CrossRef] [Scilit]
- Schafer, M.; Nadi, S.; Gousios, G.; Chowdhury, A. An Empirical Evaluation of Using Large Language Models for Automated Unit Test Generation. IEEE Trans. Softw. Eng. 2023, 49, 1800–1819. Available online: https://ieeexplore.ieee.org/document/10329992 (accessed on 10 December 2025). [CrossRef] [Scilit]
- Jimenez, C.E.; Yang, J.; Wettig, A.; Yao, S.; Pei, K.; Press, O.; Narasimhan, K. SWE-bench: Can Language Models Resolve Real-World GitHub Issues? In Proceedings of the International Conference on Learning Representations (ICLR 2024), Vienna, Austria, 7–11 May 2024. [Google Scholar]
- Ye, H.; Martinez, M.; Monperrus, M. Neural Program Repair: Systems, Challenges and Solutions. In Internetware’22: Proceedings of the 13th Asia-Pacific Symposium on Internetware; Association for Computing Machinery: New York, NY, USA, 2022; Volume 27, pp. 96–106. [Google Scholar] [CrossRef] [Scilit]
- Cohen, J. Statistical Power Analysis for the Behavioral Sciences; Lawrence Erlbaum Associates: Mahwah, NJ, USA, 1988. [Google Scholar]
- Sawilowsky, S.S. New Effect Size Rules of Thumb. J. Mod. Appl. Stat. Methods 2009, 8, 597–599. [Google Scholar] [CrossRef] [Scilit]
- Fowler, M. Refactoring: Improving the Design of Existing Code; Addison-Wesley Professional: Boston, MA, USA, 1999. [Google Scholar]
- Guo, D.; Ren, S.; Lu, S.; Feng, Z.; Tang, D.; Liu, S.; Zhou, L.; Duan, N.; Svyatkovskiy, A.; Fu, S.; et al. Graphcodebert: Pre-training code representations with data flow. arXiv 2020, arXiv:2009.08366. [Google Scholar]
- Wang, Y.; Wang, W.; Joty, S.; Hoi, S.C. Codet5: Identifier-aware unified pre-trained encoder-decoder models for code understanding and generation. arXiv 2021, arXiv:2109.00859. [Google Scholar]
- Wei, J.; Wang, X.; Schuurmans, D.; Bosma, M.; Xia, F.; Chi, E.; Le, Q.V.; Zhou, D. Chain-of-Thought Prompting Elicits Reasoning in Large Language Models. In Proceedings of the Advances in Neural Information Processing Systems 35 (NeurIPS 2022), New Orleans, LA, USA, 28 November–9 December 2022; pp. 24824–24837. [Google Scholar]
- Luo, Z.; Xu, C.; Zhao, P.; Sun, Q.; Geng, X.; Hu, W.; Tao, C.; Ma, J.; Lin, Q.; Jiang, D. WizardCoder: Empowering Code Large Language Models with Evol-Instruct. arXiv 2023, arXiv:2306.08568. [Google Scholar] [CrossRef] [Scilit]
- Allal, L.B.; Li, R.; Kocetkov, D.; Mou, C.; Akiki, C.; Ferrandis, C.M.; Muennighoff, N.; Mishra, M.; Gu, A.; Dey, M.; et al. SantaCoder: Don’t Reach for the Stars! arXiv 2023, arXiv:2301.03988. [Google Scholar]
- Lemieux, C.; Inala, J.P.; Lahiri, S.K.; Sen, S. CodaMosa: Escaping Coverage Plateaus in Test Generation with Pre-trained Large Language Models. In Proceedings of the 45th International Conference on Software Engineering (ICSE 2023); IEEE: New York, NY, USA, 2023; pp. 919–931. Available online: https://ieeexplore.ieee.org/document/10172800 (accessed on 10 December 2025).
- Tufano, R.; Pascarella, L.; Bavota, G. Using Pre-trained Models to Boost Code Review Automation. In Proceedings of the 44th International Conference on Software Engineering (ICSE 2022); ACM: New York, NY, USA, 2022; pp. 2291–2302. [Google Scholar] [CrossRef] [Scilit]
- Ciborowska, A.; Damevski, K. Fast Changeset-Based Bug Localization with BERT. In Proceedings of the 45th International Conference on Software Engineering (ICSE 2023); IEEE: New York, NY, USA, 2023; pp. 946–958. [Google Scholar] [CrossRef] [Scilit]
- McCabe, T.J. A Complexity Measure. IEEE Trans. Softw. Eng. 1976, SE-2, 308–320. [Google Scholar] [CrossRef] [Scilit]
- Halstead, M.H. Elements of Software Science; Elsevier North-Holland: Amsterdam, The Netherlands, 1977. [Google Scholar]
- Coleman, D.; Ash, D.; Lowther, B.; Oman, P. Using Metrics to Evaluate Software System Maintainability. Computer 1994, 27, 44–49. [Google Scholar] [CrossRef] [Scilit]
- Heitlager, I.; Kuipers, T.; Visser, J. A Practical Model for Measuring Maintainability. In Proceedings of the 6th International Conference on the Quality of Information and Communications Technology (QUATIC 2007); IEEE: New York, NY, USA, 2007; pp. 30–39. [Google Scholar] [CrossRef] [Scilit]
- Wohlin, C.; Runeson, P.; Höst, M.; Ohlsson, M.C.; Regnell, B.; Wesslén, A. Experimentation in Software Engineering; Springer: Berlin/Heidelberg, Germany, 2012. [Google Scholar] [CrossRef] [Scilit]
- Dettmers, T.; Pagnoni, A.; Holtzman, A.; Zettlemoyer, L. QLoRA: Efficient Finetuning of Quantized LLMs. In Proceedings of the Advances in Neural Information Processing Systems 36 (NeurIPS 2023), New Orleans, LA, USA, 10–16 December 2023. [Google Scholar]
- Frantar, E.; Ashkboos, S.; Hoefler, T.; Alistarh, D. GPTQ: Accurate Post-training Quantization for Generative Pre-trained Transformers. arXiv 2022, arXiv:2210.17323. [Google Scholar]
- Lizard Code Complexity Analyzer. 2023. Available online: https://github.com/terryyin/lizard (accessed on 10 December 2025).
- Cumming, G. The new statistics: Why and how. Psychol. Sci. 2014, 25, 7–29. [Google Scholar] [CrossRef] [Scilit] [PubMed]
- Landis JRKoch, G. The measurement of observer agreement for categorical data. Biometrics 1977, 33, 159174. [Google Scholar] [CrossRef] [Scilit]

Disclaimer/Publisher’s Note: The statements, opinions and data contained in all publications are solely those of the individual author(s) and contributor(s) and not of MDPI and/or the editor(s). MDPI and/or the editor(s) disclaim responsibility for any injury to people or property resulting from any ideas, methods, instructions or products referred to in the content. |
© 2026 by the author. Licensee MDPI, Basel, Switzerland. This article is an open access article distributed under the terms and conditions of the Creative Commons Attribution (CC BY) license.