


Abstract
In this pilot study, we investigate the psychological and attentional impact of biophilic urban interventions using an immersive virtual reality (VR) framework integrated with real-time eye-tracking. Specifically, it examines whether bio-esthetic enhancements can mitigate perceptual inequalities across neighborhoods of varying socioeconomic status (SES). Sixteen participants viewed original and digitally enhanced fixed-viewpoint 360° videos of Low-, Medium-, and High-SES environments while a comprehensive suite of oculomotor dynamics and psychometric responses were recorded. Results confirmed a significant Condition × SES interaction across both subjective preference (Liking) and esthetic evaluation (η2p = 0.41), suggesting a role for biophilic design as a “socio-perceptual equalizer”: while baseline ratings consistently favored High-SES areas, interventions in Low-SES contexts yielded the highest marginal gains, effectively bridging the gap with privileged environments. Eye-tracking metrics revealed that this convergence was associated with active visual engagement, with Enhanced Low-SES scenes eliciting the highest fixation counts and visual coverage. However, a critical dissociation emerged between immediate affective improvement and self-reported stress reduction. Elevated saccadic velocities in Enhanced Low-SES scenes are consistent with a state of “hard fascination” or novelty-induced arousal. This pattern implies that while biophilia elements boost positive affect, physiological restoration may be a dose-dependent process, requiring sufficient exposure duration to transition from curiosity-driven scanning to the “soft fascination” linked to stress recovery. These findings provide preliminary evidence for integrated XR analytics as a tool for evidence-based urban design and are discussed in the context of the equigenesis hypothesis.
1. Introduction
Urban environments significantly influence human psychological well-being, not only through infrastructure and services but also through the perceptual and sensory qualities of everyday public spaces. With increasing urban density and reduced access to natural landscapes, the integration of nature into the built environment, commonly referred to as biophilic design, has become a promising strategy to promote mental restoration, reduce stress, and enhance emotional regulation [1,2]. Biophilic interventions such as vegetation, natural textures, and organic forms have been associated with increased positive affect and attention restoration, particularly in overstimulating or visually degraded urban settings [3]. This aligns with Attention Restoration Theory (ART), which posits that natural environments possess inherent qualities that foster recovery from mental fatigue [4]. Recent experimental studies have shown that even modest architectural enhancements inspired by biophilic principles can positively modulate users’ emotional states and perceived comfort, especially when introduced into otherwise neutral or artificial environments [5].
In recent years, immersive technologies such as virtual reality (VR), augmented reality (AR), and extended reality (XR) have emerged as powerful tools for simulating and evaluating human experience in urban contexts. These technologies allow researchers to create ecologically valid environments while maintaining experimental control, enabling both manipulation of design variables and collection of multimodal data. Studies show that virtual exposure to nature can improve mood, reduce physiological stress responses, and foster a greater sense of well-being, especially among individuals with limited access to real green spaces [6,7,8].
Beyond self-report and physiological data, VR environments increasingly incorporate eye-tracking technology to monitor real-time gaze behavior, attention distribution, and visual engagement. Eye-tracking has become a critical method for assessing cognitive and perceptual processing during immersive experiences, offering objective insights into how users interact with visual content and spatial configurations. When combined with psychometric instruments, it enables a more comprehensive analysis of user experience, bridging subjective impressions with quantifiable attention and exploration metrics—an approach especially valuable in health-related and user-centered design research [9,10].
However, a critical gap remains in understanding how contextual differences, particularly the socioeconomic status (SES) of the urban environment, moderate the psychological outcomes of bio-esthetic interventions. Lower-income neighborhoods are often disproportionately exposed to environmental stressors and lack restorative infrastructure, potentially making them more sensitive to improvements in their surroundings. Yet, most VR-based studies have relied on idealized or abstract digital environments [6,11], neglecting how the SES characteristics of a real-world place shape the human–environment interaction and the perceptual and affective responses of the viewer [7,12].
To address these gaps, this study adopted an exploratory, pilot approach aimed at validating a novel methodology and identifying initial response patterns to inform future confirmatory research. Our primary objectives were to (1) assess the feasibility of an integrated VR and eye-tracking framework for capturing socio-perceptual responses, and (2) explore how psychological and attentional reactions to biophilic enhancements vary across SES contexts. Guided by the theoretical framework of the equigenesis hypothesis, we were particularly interested in examining whether any observed patterns were consistent with a potential equalizing effect. To this end, we created baseline and enhanced versions of real urban neighborhoods (with distinct SES profiles) from digitally edited 360° video. Participants viewed these scenes in VR while their gaze behavior was measured with real-time eye-tracking, followed by an assessment of their emotional responses via the PANAS and an ad hoc questionnaire.
2. Materials and Methods
2.1. Participants
Sixteen university students participated in this pilot study (Mean Age = 22.4 years, SD = 3.2; 10 female, 6 male). They were recruited from the University of Almería via public advertisement on the university’s online portal. This sample size is consistent with the primary goals of an exploratory pilot study in immersive environments and HCI research, which are to validate experimental protocols, assess the feasibility of novel methodologies, and detect large effect sizes that warrant future investigation. Inclusion criteria required participants to have normal or corrected-to-normal vision and no self-reported history of severe motion sickness, color blindness, neurological impairments, or other medical conditions that could affect VR use or assessment performance.
This study was conducted in accordance with the Declaration of Helsinki and was approved by the Human Research Bioethics Committee of the University of Almería (UALBIO2021/010; Date: 17 February 2022). All participants provided written informed consent prior to participation.
Given the exploratory pilot nature of this study, a sample size of N = 16 was deemed sufficient for the primary objectives of this phase: to validate the feasibility of the 3 × 2 experimental design, to test the usability of the VR platform (Meta Quest Pro and SightLab) and the data collection protocol, and to identify preliminary trends in affective and attentional responses to inform future, larger-scale research.
2.2. Experimental Design
This pilot study employed a 3 × 2 within-subjects factorial design to evaluate the effectiveness of the integrated immersive framework. The design involved the manipulation of two independent variables (IVs): (1) Neighborhood Typology (NBHT) and (2) Design Condition.
The first independent variable, NBHT, represented three distinct urban areas in Almería (Spain), selected based on their socioeconomic status (SES). Using 2022 data from the National Statistics Institute (INE), the neighborhoods were classified into terciles: Low SES (Los Ángeles-Barrio Alto), Medium SES (La Cañada), and High SES (Ciudad Jardín).
The second independent variable, Design Condition, consisted of two levels: Original and Enhanced. The ‘Original’ Condition utilized the baseline, unedited 360° video footage of the neighborhood to provide a realistic benchmark of the urban environment. The ‘Enhanced’ condition used the same footage, digitally modified to feature significant biophilic and esthetic improvements through high-fidelity immersive simulations. These interventions included the addition of vegetation (e.g., trees, shrubs, planters), the integration of nature-themed murals, digitally cleaned facades, and the removal of visual detractors such as graffiti and obtrusive overhead wiring. As a within-subjects design, all participants were exposed to all six experimental conditions within the VR environment. The presentation order of the conditions was counterbalanced across participants to mitigate potential order effects and ensure the reliability of the technological assessment.
This multi-session approach was chosen primarily to minimize fatigue and prevent carry-over effects between the distinct, immersive neighborhood environments, which could overwhelm participants if presented in a single session. To mitigate the potential for context- and state-dependent confounds introduced by testing on separate days, we implemented the aforementioned rigorous counterbalancing of neighborhood order across participants and randomization of condition order within sessions.
Figure 1 illustrates representative frames captured during the virtual tours, comparing the original and enhanced versions across the selected NBHT levels.
Figure 1.
Examples of video frames from NBHT levels: Original Low SES (a), Enhanced Low SES (b), Original Medium SES (c), Enhanced Medium SES (d), Original High SES (e), and Enhanced High SES (f).
2.3. Stimuli and Apparatus
2.3.1. Apparatus and Software
The immersive environments were presented using Meta Quest Pro head-mounted displays (HMDs). This system was selected for its integrated, real-time eye-tracking capabilities and high-resolution display, which are essential for the simultaneous collection of gaze behavior and exposure to stimuli. The eye-tracking was configured, and data was collected using the SightLab VR platform (WorldViz), operating on the OpenXR protocol to ensure standardized rendering. Visual stimuli were edited and post-produced using standard digital editing software (Adobe Premiere Pro 2025, After Effects 2025, and Photoshop 2021/2025), and the final immersive tours were compiled and presented in SightLab VR.
2.3.2. Visual Stimuli Production
Urban footage was captured using an Insta360 X4 camera in 8K resolution under uniform morning lighting conditions to ensure visual consistency. Within each of the three selected neighborhoods, a representative block was chosen. A total of 10 fixed-viewpoint recordings were captured per block. Each recording lasted approximately one minute, resulting in a total exposure time of 10 min for subsequent affective assessment. The tripod was digitally removed from all video versions during post-production to enhance realism and immersion.
As described in the experimental design (Section 2.2), both the Original and Enhanced versions of each neighborhood were produced from the same footage. To ensure consistency across neighborhoods, digital enhancements were applied with the goal of achieving a comparable visual impact in each context. Relative to the original baseline, the ‘Enhanced’ condition introduced an average increase of approximately 25% in green pixel density (simulating vegetation coverage) and 15% in esthetically treated surface area (encompassing murals and cleaned facades). These proportions were maintained consistently across the three SES neighborhood types.
2.3.3. Environmental Characterization and Validation
To ensure the ecological validity of the virtual simulations, the ambient environmental conditions of the real-world locations were recorded on-site during footage capture. Ambient lighting was measured in kilolux (klux) using a Urceri MT-912 light meter, and ambient sound was measured in A-weighted decibels (LAeq) using the NIOSH Sound Level Meter app (iPhone 13), both previously validated for field use [13,14].
Average values were obtained for each neighborhood: Ciudad Jardín (High SES: 37.29 klux, 56.5 dB LAeq), La Cañada (Medium SES: 13.92 klux, 56.01 dB LAeq), and Los Ángeles/Barrio Alto (Low SES: 5.84 klux, 58.4 dB LAeq). These environmental factors were not manipulated and remained identical in both the ‘Original’ and ‘Enhanced’ video conditions, reflecting typical outdoor urban conditions [15,16]. Importantly, these measurements document intrinsic environmental characteristics that are constitutive of the neighborhood typologies under study. As such, they were not treated as confounds to be controlled for, but as embedded features of the SES contexts whose perceptual impact is explored through the biophilic intervention. No participants reported discomfort attributable to these baseline environmental conditions during debriefing.
2.4. Measures
To assess the psychological impact of the interventions, we collected both subjective self-report data and objective behavioral (ET) data.
2.4.1. Subjective Measures
Positive and Negative Affect Schedule (PANAS): Immediately following each VR exposure, participants completed the validated Spanish adaptation of the PANAS scale [17]. This 20-item instrument measures two orthogonal dimensions: Positive Affect (10 items) and Negative Affect (10 items). Participants rated the extent to which they felt each emotion “right now” on a 5-point Likert scale.
Participants also responded to four additional questions evaluating their momentary perception of the visual stimuli. These included ratings of Liking, Relaxation, Perceived Stress, and Esthetic Evaluation, each measured on a 5-point Likert scale ranging from 1 (“not at all”) to 5 (“very much”). These single-item scales were developed to capture immediate, condition-specific perceptions. While not formally validated, they offer direct, pragmatic measures for an exploratory context.
2.4.2. Objective Measures (Eye-Tracking)
Real-time gaze data was recorded at 60 Hz using the Meta Quest Pro’s integrated eye-tracking system, configured and collected via the SightLab VR platform. The Meta Quest Pro employs an integrated eye-tracking model. To maintain ecological validity and reduce participant fatigue in this pilot study, we utilized the headset’s stored calibration profile combined with the device’s automatic slippage correction algorithms (continuous fit adjustment), rather than enforcing a forced recalibration routine for every participant/session. While this may introduce minor spatial offsets compared to a fresh 9-point calibration [18], the use of large Areas of Interest (AOIs)—such as entire building facades or vegetation blocks—minimizes the impact of potential fine-grained inaccuracy.
To ensure the reliability of gaze measurements within this framework, strict experimental controls were applied regarding participant positioning. Given that the stimuli consisted of 360° video footage with a fixed camera viewpoint, participants were instructed to stand at a fixed location. While 360° physical rotation of the head and body was fully unrestricted to allow natural exploration of the environment, translational movement (walking) was restricted to prevent vestibular mismatch and viewpoint misalignment. Experimenters provided verbal guidance only if a participant physically stepped away from the central anchor point. All visual stimuli were presented from a consistent, fixed viewpoint within a spherical projection, and all Areas of Interest (AOIs) were manually defined a priori within the static 360° scenes. These AOIs corresponded to key environmental elements: “Vegetation” (trees, planters, murals), “Cleaned Facades,” and “Sky.” Because gaze mapping in 360° environments is fundamentally angular and the center of projection remained constant across participants, spatial correspondence between gaze coordinates and environmental elements was preserved.
For data processing, raw gaze coordinate streams were filtered and segmented into fixation and saccade events using a velocity-threshold identification (I-VT) algorithm, consistent with standard eye-tracking practice. Fixations were defined as periods in which gaze velocity remained below 30° per second for a minimum duration of 100 milliseconds. Saccades were identified as ballistic eye movements with peak velocities exceeding this 30°/s threshold.
From the raw gaze data, we derived a set of standard eye-tracking metrics. Basic attentional metrics included Fixation Count (the total number of fixations within a defined AOI); Dwell Time (the total time spent fixating within an AOI, in milliseconds); Time to First Fixation (the latency from stimulus onset until the participant’s first fixation landed on any of the predefined AOIs, in milliseconds); and Average Fixation Duration (the mean duration of individual fixations, in milliseconds). Metrics of visual exploration included Saccadic Amplitude (the average angular distance of eye movements between consecutive fixations, in degrees); Average Saccadic Velocity (the mean speed of saccades, in degrees per second); and Total Fixation Count (the sum of all fixations during stimulus presentation, regardless of AOI). To measure the distribution of attention across defined scene elements, we calculated AOI Coverage (the percentage of the total predefined AOIs that received at least one fixation during the trial).
In the field of Human–Computer Interaction (HCI), these metrics serve as proxies for cognitive and perceptual processes. For example, a higher Fixation Count or longer Dwell Time on an element typically indicates greater attentional engagement or interest. A shorter time to first fixation suggests quicker initial orientation towards the relevant scene content. Longer Average Fixation Durations can be associated with deeper cognitive processing. Similarly, larger saccadic amplitudes and higher velocities often reflect broader, more active scanning of a scene, while smaller amplitudes may indicate focal inspection. Finally, AOI Coverage provides an index of how comprehensively a viewer samples the different elements of a scene. These general interpretations informed our investigation of how biophilic interventions modulate visual behavior in specific urban contexts.
2.5. Procedure
The experiment was conducted over three separate sessions to minimize participant fatigue and prevent potential carry-over effects between the distinct neighborhood typologies. Participants scheduled their three sessions on different days, with each session dedicated to one of the three SES-level neighborhoods (Low, Medium, or High), with the order of neighborhoods counterbalanced across participants. Within each session, participants were exposed to both video conditions (‘Original’ and ‘Enhanced’) for that specific neighborhood. The presentation order of these two conditions was randomized per session. A 5 min washout period involving a neutral distraction task was implemented between conditions.
Each immersive tour was experienced via the HMD while real-time gaze behavior data was simultaneously recorded using the eye-tracking system. Participants were seated and could manually advance through the fixed-viewpoint 360° video scenes using the controller. Immediately following each of the two tours (Original and Enhanced), they removed the HMD to complete the post-exposure assessments (PANAS and ad hoc questionnaire).
2.6. Statistical Analysis
All statistical analyses will be conducted using JASP 28 version 0.95.3. The significance level (alpha) was set at α = 0.05 for all primary analyses.
2.6.1. Primary Analysis: Repeated Measures ANOVA
To test the hypotheses related to our 3 (Neighborhood SES: Low, Medium, High) × 2 (Condition: Original, Enhanced) within-subjects factorial design, we conducted a series of repeated measures analyses of variance (RM-ANOVA) [19]. A separate RM-ANOVA was performed for each of the primary dependent variables (Affective Measures, Questionnaire Scores, and Key Eye-Tracking Metrics) to preserve the specific interpretability of distinct physiological and psychological constructs.
For each ANOVA, we examined the main effect of Condition (to assess the overall impact of the biophilic/esthetic intervention), the main effect of Neighborhood SES, and, critically, the Condition × Neighborhood SES interaction. This interaction term is the primary test of our hypothesis that the intervention’s impact is moderated by the neighborhood’s socioeconomic context.
Mauchly’s test for sphericity was used to check the assumption of sphericity. If this assumption was violated (p < 0.05), the Greenhouse–Geisser correction was applied to the degrees of freedom. The normality of the model residuals was assessed through visual inspection of Q-Q plots. Potential univariate outliers were screened using a standardized residual threshold of ±3 standard deviations. Significant main effects or interactions were followed by post hoc pairwise comparisons using the Holm correction [20].
2.6.2. Exploratory Analysis: Low-Power Considerations and Correlations
Given the pilot nature of this study (N = 16) and the consequently limited statistical power, we reported effect sizes (Partial Eta-Squared, ηp2) for all main effects and interactions to interpret the magnitude of observed effects, regardless of statistical significance. This approach allows for the identification of the magnitude of potential effects that may warrant investigation in a future study. A sensitivity analysis (G*Power 3.1) indicated that our design had 80% power to detect medium-to-large interaction effects (f ≥ 0.27, α = 0.05), consistent with its exploratory aims.
Furthermore, we conducted exploratory bivariate correlational analyses to examine potential relationships between changes in visual attention and changes in affective state. For this, “delta” (Δ) scores (Δ = Enhanced − Original) were used to examine relationships between changes in visual attention and affective state. Pearson or Spearman correlation coefficients (based on data distribution) were calculated, with the Holm correction applied to the resulting p-values within each theoretical block of correlations.
3. Results
3.1. Analysis of Affective States and Oculomotor Metrics
3.1.1. Positive Affect (PANAS)
Preliminary checks confirmed that data residuals were normally distributed (via inspection of Q-Q plots) and free of significant outliers. Analysis revealed a significant main effect of Condition, F(1, 15) = 10.07, p = 0.006, η2ₚ = 0.40. Specifically, participants reported higher positive affect in the Bio-enhanced scenes (Low-SES: M = 29.19, SD = 7.129; Medium-SES: M = 27.56, SD = 7.797; High-SES: M = 27.81, SD = 9.246) compared to the original scenes (Low-SES: M = 23.25, SD = 6.904; Medium-SES: M = 22.63, SD = 7.736; High-SES: M = 22.13, SD = 8.578). The descriptive results across all six experimental conditions are displayed in Figure 2.
Figure 2.
Positive Affect—PANAS Score (Mean ± SD) from Condition × Neighborhood SES interaction.
Regarding the effect of neighborhood SES, a Greenhouse–Geisser correction was applied due to a violation of sphericity. Results showed no significant main effect for SES, F(1.35, 20.30) = 0.34, p = 0.632, nor a significant Condition × SES interaction, F(1.76, 26.40) = 0.20, p = 0.791.
3.1.2. Negative Affect (PANAS)
As expected in a non-clinical sample, scores on the Negative Affect subscale exhibited a marked floor effect, with scores skewed towards minimum values and consequent deviations from normality. Screening of standardized residuals (|Z| > 3) identified three univariate outliers (one in each Original Condition: Low, Medium, and High SES). However, given the robustness of ANOVA and the clear lack of statistical significance, parametric results are reported for consistency. No significant main effects or interactions were observed for Condition (F(1,15) = 1.65, p = 0.218), SES (F(1.69, ~25.3) = 1.46, p = 0.250), or the Condition × SES interaction (F(1.85, ~27.7) = 0.79, p = 0.456).
3.1.3. Liking
Assumption checks indicated that residuals were approximately normally distributed, and screening of standardized residuals identified no univariate outliers. Analysis of liking scores revealed a significant main effect of Condition, F(1, 15) = 25.56, p < 0.001, η2ₚ = 0.63, and a significant main effect of Neighborhood SES, F(1.42, 21.30) = 7.45, p = 0.007, η2ₚ = 0.33. More importantly, a significant Condition × Neighborhood SES interaction was observed, F(1.66, 25.00) = 10.50, p < 0.001, η2ₚ = 0.41.
To decompose this interaction, the effect of Neighborhood SES was analyzed for each condition separately. In the Original Condition, the type of neighborhood significantly influenced liking, F(1.83, 27.00) = 11.67, p < 0.001, η2ₚ = 0.44. Specifically, participants rated the High-SES neighborhood scenes the highest (M = 2.875, SD = 0.957), followed by the Medium-SES (M = 2.188, SD = 0.911) and Low-SES (M = 1.688, SD = 0.973) scenes. Holm-corrected post hoc comparisons confirmed significant differences between the High-SES scenes and both the Low-SES (p < 0.001) and Medium-SES (p = 0.032) scenes. In contrast, in the Bio-enhanced condition, liking scores were uniformly higher and stable across the Low-SES (M = 3.813, SD = 0.911), Medium-SES (M = 3.313, SD = 1.195), and High-SES (M = 3.750, SD = 0.856) scenes. The descriptive results across all the Conditions x Neighborhood Scenes are illustrated in Figure 3.
Figure 3.
Liking Score (Mean ± SD) from Condition × Neighborhood SES interaction.
Although the omnibus test for SES remained statistically significant, F(1.79, 27.00) = 3.98, p = 0.035, η2ₚ = 0.21, conservative post hoc comparisons revealed no significant differences between any of the SES levels, suggesting that the bio-enhancement intervention effectively mitigated the liking disparities observed in the original designs.
3.1.4. Relaxation
Assumption checks indicated that residuals were approximately normally distributed, and screening of standardized residuals identified no univariate outliers. Analysis of relaxation ratings revealed a significant main effect of Condition, F(1, 15) = 11.60, p = 0.004, η2ₚ = 0.44. Specifically, Bio-enhanced scenes were associated with significantly higher relaxation ratings (Low-SES: M = 3.813, SD = 0.834; Medium-SES: M = 3.625, SD = 1.204; High-SES: M = 4.063, SD = 0.998) compared to the original scenes (Low-SES: M = 2.375, SD = 1.147; Medium-SES: M = 3.188, SD = 1.223; High-SES: M = 3.250, SD = 1.000).
Regarding Neighborhood SES, Mauchly’s test indicated no violation of sphericity (p > 0.05). A significant main effect was observed, F(2, 30) = 3.53, p < 0.05, η2p = 0.19. Holm-corrected post hoc comparisons were examined to clarify specific patterns. These revealed that High-SES scenes were rated as significantly more relaxing than Low-SES scenes (p = 0.006), while comparisons involving Medium-SES scenes were not statistically significant. Finally, no significant Condition × Neighborhood SES interaction was detected, F(1.84, 27.68) = 2.63, p = 0.093. The descriptive results across all six experimental conditions are displayed in Figure 4.
Figure 4.
Relaxation Score (Mean ± SD) from Condition × Neighborhood SES interaction.
3.1.5. Esthetic
Assumption checks indicated that residuals were approximately normally distributed, and screening of standardized residuals identified no univariate outliers. Analysis of esthetic ratings revealed a significant main effect of Condition, F(1, 15) = 48.44, p < 0.001, η2ₚ = 0.76. Specifically, participants rated the Bio-enhanced environments as substantially more esthetically pleasing (Low-SES: M = 3.750, SD = 1.125; Medium-SES: M = 3.563, SD = 1.031; High-SES: M = 3.813, SD = 0.750) than the Original ones (Low-SES: M = 1.313, SD = 0.602; Medium-SES: M = 2.000, SD = 0.966; High-SES: M = 2.938, SD = 1.289).
A significant main effect of Neighborhood SES was also found, F(1.78, 26.70) = 8.73, p = 0.002, η2ₚ = 0.37. However, this main effect was qualified by a significant Condition × Neighborhood SES interaction, F(1.57, 23.60) = 10.37, p = 0.001, η2ₚ = 0.41. This interaction indicates that the impact of neighborhood SES on esthetic perception differed between design conditions.
To decompose this interaction, the effect of SES was analyzed separately for each condition. In the Original Condition, results showed a significant effect of SES, F(1.61, 24.07) = 14.49, p < 0.001, η2ₚ = 0.49. Holm-corrected post hoc comparisons confirmed a clear gradient in esthetic preference: High-SES scenes were rated significantly higher than Medium-SES scenes (p < 0.05), and Medium-SES scenes were rated significantly higher than Low-SES scenes (p < 0.05). Naturally, the difference between High- and Low-SES was also significant (p < 0.001). In contrast, in the Bio-enhanced condition, the effect of SES was not significant, F(1.92, 28.78) = 0.64, p = 0.531, η2ₚ = 0.04. Participants reported uniformly high esthetic ratings across scenes, with no significant differences observed in post hoc comparisons (p > 0.999). This pattern suggests that the bio-enhancement intervention effectively leveled the esthetic disparities observed in the original environments, as illustrated in Figure 5.
Figure 5.
Esthetic Score (Mean ± SD) from Condition × Neighborhood SES interaction.
3.1.6. Stress
Assumption checks revealed a positive skew in the distribution of residuals, consistent with the nature of stress ratings in a non-clinical sample. Screening of standardized residuals (|Z| > 3) identified one univariate outlier in the Original Medium-SES condition. This outlier was retained, as it represented genuine variability in stress reactivity and did not alter the pattern or significance of the results.
Analysis of perceived stress ratings revealed no significant main effect of Condition, F(1, 15) = 0.68, p = 0.422, η2ₚ = 0.04. However, a significant main effect of Neighborhood SES was observed, F(1.78, 26.75) = 4.71, p = 0.021, η2ₚ = 0.24 (Greenhouse–Geisser-corrected). Holm-corrected post hoc comparisons were conducted to clarify this main effect. Although the omnibus test was significant, pairwise comparisons revealed only marginal differences, with Low-SES scenes eliciting higher stress ratings compared to Medium-SES (p = 0.063) and High-SES (p = 0.077) scenes. This suggests that while neighborhood SES globally impacts perceived stress, the effect is driven by the overall pattern of Low-SES environments being more stressful, rather than by a strictly significant pairwise contrast in this sample size. Finally, no significant Condition × Neighborhood SES interaction was detected, F(1.95, 29.27) = 0.11, p = 0.890. As shown in Figure 6, the descriptive pattern suggests that Low-SES scenes consistently elicited higher stress ratings regardless of the presence of Bio-enhanced elements.
Figure 6.
Stress Score (Mean ± SD) from Condition × Neighborhood SES interaction.
3.1.7. Average Saccadic Amplitude
Assumption checks indicated that residuals were approximately normally distributed, and screening of standardized residuals identified no univariate outliers.
Analysis of Average Saccadic Amplitude yielded no significant main effects for Condition, F(1, 15) = 2.28, p = 0.152, η2ₚ = 0.13, or Neighborhood SES, F(1.77, 26.60) = 1.80, p = 0.187, η2ₚ = 0.11. Similarly, the Condition × Neighborhood SES interaction was not significant, F(1.845, 27.68) = 1.18, p = 0.320. These results indicate that participants’ visual exploration patterns, in terms of saccade amplitude, remained stable across experimental conditions.
3.1.8. AOI Coverage
Assumption checks indicated that residuals were approximately normally distributed, and screening of standardized residuals identified no univariate outliers.
Analysis of Area of Interest (AOI) coverage revealed a significant main effect of Condition, F(1, 15) = 80.35, p < 0.001, η2ₚ = 0.84. Specifically, AOI coverage was significantly higher in the Bio-enhanced Condition (Low-SES: M = 48.78, SD = 9.239; Medium-SES: M = 41.95, SD = 12.990; High-SES: M = 41.99, SD = 11.122) compared to the Original design (Low-SES: M = 17.50, SD = 11.832; Medium-SES: M = 26.25, SD = 15.676; High-SES: M = 24.60, SD = 10.141). Regarding Neighborhood SES, no significant main effect was observed (F(1.785, 26.77) = 0.072, p = 0.913). However, a significant Condition × Neighborhood SES interaction was found, F(1.72, 25.80) = 11.74, p < 0.001, η2ₚ = 0.44 (Greenhouse–Geisser-corrected).
To decompose this interaction (see Figure 7), the effect of neighborhood SES was examined within each condition separately. In the Original Condition, AOI coverage did not differ significantly across SES levels (all Holm-corrected p > 0.05). In contrast, within the Bio-enhanced condition, AOI coverage varied significantly across neighborhood contexts. Holm-corrected post hoc comparisons indicated that Low-SES scenes registered the highest AOI coverage (M = 48.78, SD = 9.239), which was significantly greater than both Medium-SES (M = 41.95, SD = 12.990; p = 0.037) and High-SES scenes (M = 41.99, SD = 11.122; p = 0.006). No significant difference was observed between Medium- and High-SES scenes (p = 0.986).
Figure 7.
AOI Coverage (Mean ± SD) from Condition × Neighborhood SES interaction.
3.1.9. AOI Fixation Count
Assumption checks indicated that residuals were approximately normally distributed based on visual inspection of Q-Q plots. Screening of standardized residuals (|Z| > 3) identified two univariate outliers, both in the Bio-enhanced Low-SES condition (with fixation counts substantially above the group mean). These outliers were retained, as they represented genuine individual differences in attentional engagement with the novel biophilic elements and did not alter the significance or pattern of the reported effects.
Analysis of the number of fixations on Areas of Interest (AOIs) revealed significant main effects of Condition, F(1, 15) = 113.64, p < 0.001, η2ₚ = 0.88, and Neighborhood SES, F(1.90, 28.50) = 7.28, p = 0.003, η2ₚ = 0.33.
A significant Condition × Neighborhood SES interaction was also observed, F(1.69, 25.40) = 18.04, p < 0.001, η2ₚ = 0.55 (Greenhouse–Geisser corrections applied for consistency). The descriptive data for this interaction are displayed in Figure 8.
Figure 8.
AOI Fixation Count results (Mean ± SD) from Condition × Neighborhood SES interaction.
To examine the source of this interaction, the effect of SES was analyzed for each condition separately using Holm-corrected post hoc comparisons.
In the Original Condition, a significant effect of SES was found, F(1.17, 17.60) = 26.83, p < 0.001, η2ₚ = 0.64. Holm-corrected comparisons indicated that High-SES scenes registered significantly higher fixation counts (M = 102.94, SD = 65.25) compared to both Medium-SES (M = 24.13, SD = 23.94; p < 0.001) and Low-SES scenes (M = 11.75, SD = 11.82; p < 0.001). Furthermore, Medium-SES scenes also showed significantly higher fixation counts than Low-SES scenes (p = 0.040).
In the Bio-enhanced condition, the distribution of fixations followed a different pattern, F(1.74, 26.20) = 10.13, p < 0.001, η2ₚ = 0.40. Holm-corrected comparisons revealed that fixation counts were significantly higher in Low-SES scenes (M = 462.6, SD = 215.7) compared to both Medium-SES (M = 267.2, SD = 123.7; p = 0.004) and High-SES scenes (M = 333.8, SD = 122.5; p = 0.029). The comparison between Medium- and High-SES scenes did not reach statistical significance (p = 0.076).
In summary, while fixation counts in the Original Condition were highest in High-SES scenes and lowest in Low-SES scenes (with Medium-SES in between), the Bio-enhanced Condition showed a markedly different pattern: Low-SES scenes elicited the highest fixation counts, significantly exceeding both Medium- and High-SES scenes, which did not differ from each other.
3.1.10. Total Fixation Count
Assumption checks indicated that residuals were approximately normally distributed, and screening of standardized residuals identified no univariate outliers.
Analysis of the total number of fixations across the entire scene revealed no significant main effect of Condition, F(1, 15) = 2.307, p = 0.150, η2ₚ =0.133.
However, a significant main effect of Neighborhood SES was observed, F(1.56, 23.30) = 12.69, p < 0.001, η2ₚ = 0.46 (Greenhouse–Geisser-corrected). Holm-corrected post hoc comparisons were conducted to clarify this main effect. These indicated that Medium-SES scenes elicited significantly fewer total fixations (M = 1069, SD = 379.1 in the Original Condition; M = 1205, SD = 295.0 in the Biophilic Condition) compared to both Low-SES (p = 0.013) and High-SES scenes (p < 0.001). No significant difference was found between Low- and High-SES scenes (p = 0.376).
Finally, no significant Condition × Neighborhood SES interaction was detected, F(1.69, 25.43) = 2.67, p = 0.096. As shown in Figure 9, the descriptive pattern indicates that the overall frequency of fixations was lowest in the Medium-SES environments, regardless of the experimental condition.
Figure 9.
Total Fixation Count results (Mean ± SD) from Condition × Neighborhood SES interaction.
3.1.11. Total Fixation Duration
Assumption checks indicated that residuals were approximately normally distributed, and screening of standardized residuals identified no univariate outliers.
Analysis of the total fixation duration revealed no significant main effect of Condition, F(1, 15) = 0.18, p = 0.679, η2ₚ = 0.01. In contrast, a significant main effect of Neighborhood SES was found, F(2, 30) = 8.97, p < 0.001, η2ₚ = 0.37. The Condition × Neighborhood SES interaction was not statistically significant, F(2, 30) = 2.12, p = 0.138, η2ₚ = 0.12.
Holm-corrected post hoc comparisons were conducted to clarify the main effect of SES. These revealed that Medium-SES scenes elicited significantly lower total fixation duration (M = 231.2, SD = 85.36 in the Original Condition; M = 255.3, SD = 70.05 in the Biophilic Condition) compared to High-SES scenes (M = 295.90, SD = 71.94 in the Original Condition; M = 304.9, SD = 76.03 in the Biophilic Condition) (p = 0.001). The duration for Low-SES scenes (M = 290.50, SD = 80.64 in the Original Condition; M = 274.0, SD = 86.92 in the Biophilic Condition) did not differ significantly from either Medium-SES (p = 0.072) or High-SES scenes (p = 0.129).
As shown in Figure 10, this pattern indicates that participants spent less total time fixating on visual elements within the Medium-SES environments compared to the other contexts, regardless of the experimental condition.
Figure 10.
Total Fixation Duration (s) (Mean ± SD) from Condition × Neighborhood SES interaction.
3.1.12. Time to First Fixation
Assumption checks revealed that the residuals for Time to First Fixation exhibited a positive skew, with deviations from normality observed in the Q-Q plot (points deviating above the diagonal in the upper tail). Screening of standardized residuals (|Z| > 3) identified three univariate outliers: one in the Bio-enhanced Medium-SES condition, one in the Original High-SES condition, and one in the Original Low-SES condition. These outliers were retained, as they represented genuine variability in initial orienting responses and, given the absence of significant effects, did not influence the overall conclusions.
Analysis of the time elapsed before the first fixation on Areas of Interest (Time to First Fixation) yielded no significant main effects for Condition, F(1, 15) = 0.80, p = 0.386, η2ₚ = 0.05, or Neighborhood SES, F(1.64, 24.60) = 0.61, p = 0.522, η2ₚ = 0.04. Similarly, the Condition × Neighborhood SES interaction was not significant, F(1.73, 25.90) = 1.03, p = 0.361, η2ₚ = 0.06. These results indicate that the speed at which participants first oriented their attention towards the specific features of the environment did not differ systematically across experimental conditions or socioeconomic contexts.
3.1.13. Average Fixation Duration
Assumption checks revealed that the residuals for Average Fixation Duration exhibited deviations from normality, with a characteristic “S-shape” in the Q-Q plot indicative of heavier tails. Screening of standardized residuals (|Z| > 3) identified one univariate outlier in the Original High-SES condition (a fixation duration substantially above the group mean). This outlier was retained, as it represented genuine variability in individual processing styles and, given the absence of significant effects, did not influence the overall conclusions.
Analysis of Average Fixation Duration revealed no significant main effects for Condition, F(1, 15) = 3.86, p = 0.068, η2ₚ = 0.20, or Neighborhood SES, F(1.84, 27.50) = 2.20, p = 0.133, η2ₚ = 0.13. Similarly, the Condition × Neighborhood SES interaction was not significant, F(1.94, 29.00) = 1.54, p = 0.231, η2ₚ = 0.09. These findings suggest that the average duration of individual fixations remained relatively stable regardless of the environmental condition or socioeconomic context.
3.1.14. Average Saccadic Velocity
Assumption checks indicated that residuals were approximately normally distributed based on visual inspection of Q-Q plots, and screening of standardized residuals identified no univariate outliers.
Analysis of Average Saccadic Velocity revealed no significant main effect of Condition, F(1, 15) = 0.01, p = 0.924, η2ₚ = 0.001. However, a significant main effect of Neighborhood SES was observed, F(1.95, 29.20) = 4.84, p = 0.016, η2ₚ = 0.24 (Greenhouse–Geisser-corrected).
Holm-corrected post hoc comparisons indicated that Low-SES scenes elicited significantly higher saccadic velocity (M = 84.90, SD = 12.57 in the Original Condition, and M = 83.40, SD = 14.40 in the Biophilic Condition) compared to both Medium-SES (p = 0.047) and High-SES scenes (p = 0.047). Comparisons between Medium- and High-SES scenes were not statistically significant (p = 0.720).
Finally, no significant Condition × Neighborhood SES interaction was detected, F(1.76, 26.40) = 0.74, p = 0.472, η2ₚ = 0.05.
3.1.15. Average Dwell Time
Assumption checks indicated that residuals were approximately normally distributed. Visual inspection of Q-Q plots revealed a minor deviation in the extreme right tail, reflecting the natural positive skew inherent to Dwell Time metrics. Screening of standardized residuals identified one univariate outlier in the Original Low-SES condition, with a value substantially above the group means. However, as this value did not exceed the stricter threshold for severe outliers (|z| < 3.29) and represented genuine individual variation in sustained attention, it was retained in the analysis.
Analysis of Average Dwell Time revealed no significant main effect of Condition, F(1, 15) = 1.44, p = 0.249, η2ₚ = 0.09. However, a significant main effect of Neighborhood SES was observed, F(1.82, 27.24) = 5.21, p = 0.014, η2ₚ = 0.26 (Greenhouse–Geisser-corrected).
Holm-corrected post hoc comparisons indicated that Low-SES scenes elicited significantly longer Dwell Times (M = 1.086, SD = 0.584 in the Original Condition; M = 1.246, SD = 0.226 in the Biophilic Condition) compared to both Medium-SES (M = 0.956, SD = 0.357 in the Original Condition; M = 0.990, SD = 0.194 in the Biophilic Condition; p = 0.043) and High-SES scenes (M = 0.953, SD = 0.187 in the Original Condition; M = 1.038, SD = 0.155 in the Biophilic Condition; p = 0.043). No significant difference was found between Medium- and High-SES scenes (p = 0.710).
Finally, no significant Condition × Neighborhood SES interaction was detected, F(1.24, 18.57) = 0.39, p = 0.585, η2ₚ = 0.03. As illustrated in Figure 11, descriptive patterns suggest that Low-SES scenes consistently registered the longest Dwell Times regardless of the experimental condition.
Figure 11.
AVG Dwell Time (s) (Mean ± SD) from Condition × Neighborhood SES interaction.
3.2. Correlation Analyses Between Changes in Eye-Tracking Metrics and Affective States
To explore the relationships between modifications in visual attention patterns and changes in subjective affective states following the biophilic intervention, a series of planned bivariate correlational analyses were conducted on difference scores (Δ = Enhanced − Original). The analyses were structured around four theoretical constructs: Immersion, Restoration, Stress/Relaxation, and Esthetic Preference. Within blocks containing multiple comparisons, the Holm–Bonferroni sequential correction procedure was applied to control the family-wise error rate.
Immersion. The hypothesis that a greater increase in visual exploration of biophilic elements (Δ AOI Coverage) would correlate with a greater improvement in positive mood (Δ PANAS Positive Affect) was tested. Data met the assumption of normality (Shapiro–Wilk = 0.972, p = 0.276). A significant positive correlation was observed, Pearson’s r(14) = 0.265, p = 0.034, 95% CI [0.013, 1.000].
Restoration. Two hypotheses concerning the attentional mechanism of restoration were tested. As the Δ Dwell Time data violated normality (Shapiro–Wilk = 0.914, p < 0.001), Spearman’s rank-order correlations were used. No significant correlation was found between Δ Dwell Time and Δ PANAS Positive Affect, ρ(14) = 0.184, p = 0.105, 95% CI [−0.059, 1.000]. Similarly, the correlation with Δ Relaxation was not significant, ρ(14) = 0.101, p = 0.248, 95% CI [−0.143, 1.000]. Applying the Holm–Bonferroni correction for these two tests did not alter the non-significant conclusions (p > 0.05).
Stress and Relaxation. Two hypotheses concerning oculomotor patterns related to stress and calm were tested. Due to violations of normality (Shapiro–Wilk p < 0.05), Spearman’s correlations were computed. The predicted positive correlation between an increase in Average Saccadic Velocity (Δ Avg. Saccadic Velocity) and increased stress (Δ Perceived Stress) was not supported, ρ(14) = 0.142, p = 0.167, 95% CI [−0.101, 1.000]. Conversely, the hypothesized negative correlation with increased relaxation (Δ Relaxation) was significant, ρ(14) = -.308, p = 0.017, 95% CI [−1.000, −0.073]. After applying the Holm–Bonferroni correction for two tests, the correlation with Δ Relaxation remained statistically significant (corrected p < 0.025).
Esthetic Preference. Two hypotheses linking deeper cognitive processing to explicit preference judgments were tested. Data for both Δ Liking and Δ Esthetic Evaluation met normality assumptions (Shapiro–Wilk p > 0.875). A positive correlation was found between an increase in Average Fixation Duration (Δ Avg. Fixation Duration) and improved liking (Δ Liking), r(14) = 0.252, p = 0.042, 95% CI [0.013, 1.000]. A stronger positive correlation was observed with improved esthetic evaluation (Δ Esthetic Evaluation), r(14) = 0.266, p = 0.034, 95% CI [0.027, 1.000]. However, following the Holm–Bonferroni correction for the two comparisons within this block, neither correlation retained statistical significance (smallest original p = 0.034 > corrected threshold of 0.025).
4. Discussion
This pilot study utilized immersive VR and eye-tracking to explore how biophilic and esthetic enhancements influence psychological well-being and visual attention across urban neighborhoods of varying socioeconomic strata. The findings offer preliminary evidence for the potential of bio-esthetic to modulate subjective and attentional responses, while also revealing a complex interplay between environmental context, visual exploration, and emotional experience. Furthermore, these results validate the efficacy of integrated XR systems as a high-fidelity methodological framework for capturing nuanced human–environment interactions, supporting the potential of immersive technology in evidence-based urban design.
4.1. Socio-Perceptual Equity: Biophilic Enhancements as Urban Equalizers
The primary contribution of this study is that biophilic design may act not only as a general enhancer of mood but also as a mechanism for perceptual and esthetic equalization across socioeconomic contexts. First, our results confirmed a significant main effect of Condition on Positive Affect, indicating that the bio-esthetic interventions successfully triggered a generalized emotional uplift across all participants, independent of the neighborhood context. However, beyond this universal affective boost, the RM-ANOVA results for Liking and Esthetic Evaluation revealed a more specific Condition × Neighborhood SES interaction, suggesting that the impact of the intervention varied depending on the socioeconomic context of the neighborhood.
In the baseline scenario, the data replicated the well-documented urban gradient, where High-SES environments were rated significantly more favorably than Low- and Medium-SES areas for both Liking and Esthetic Evaluation, with the latter showing a complete gradient (High > Medium > Low). However, the bio-esthetic intervention appeared to mitigate this disparity. In the enhanced condition, esthetic and liking scores were uniformly higher and stable across all SES levels. This pattern suggests that the intervention was associated with a perceptual leveling, whereby the subjective appraisal of the most deprived neighborhood increased to a level comparable to that of the privileged one. This pattern of perceptual leveling is consistent with the equigenesis hypothesis in the domain of urban design perception. This hypothesis posits that the health and well-being benefits of natural elements are proportionally greater for populations living in the most deprived environments, thereby acting as a potential equalizer of health inequalities [21,22]. Our findings suggest that this logic may extend to the domain of perceptual and esthetic equity: the marginal gain in subjective preference and esthetic valuation following the introduction of biophilic elements appeared to be greatest in neighborhoods with the lowest baseline quality. This pattern indicates that visually degraded, low-SES urban contexts are not just needy, but are particularly sensitive and responsive to bio-esthetic interventions.
This perceptual convergence was accompanied by systematic changes in visual attention, as reflected in the objective eye-tracking metrics. Both AOI Fixation Count and AOI Coverage showed significant interaction effects, albeit with different patterns. For AOI Fixation Count, the Original Condition exhibited a clear gradient: High-SES scenes attracted the most fixations, followed by Medium- and then Low-SES scenes. However, following the bio-esthetic intervention, this pattern reversed: Low-SES scenes elicited the highest number of fixations, significantly exceeding both Medium- and High-SES scenes, while the latter two did not differ from each other. For AOI Coverage, a different pattern emerged: in the Original Condition, no significant differences were observed between SES levels, whereas in the enhanced condition, Low-SES scenes showed greater coverage than both Medium- and High-SES scenes.
This shift in attentional allocation is consistent with the idea that the visual salience of biophilic elements may be context-dependent [23]. In a visually degraded Low-SES environment, the high contrast generated by introducing vegetation appears to create a stronger “bottom-up” attentional capture, a perceptual mechanism that underlies the greater marginal benefit of the intervention where the need is highest—a concept central to the equigenesis hypothesis in environmental health [24]. In contrast, in High-SES areas where greenery is more baseline-congruent, the same elements may be processed with less attentional effort [23]. However, it is important to note that these oculomotor measures are correlational and do not establish causality; the observed patterns could also reflect novelty, surprise, or heightened arousal, rather than solely restorative engagement.
Interestingly, the correlational analyses offer additional nuance regarding the mechanisms underlying these perceptual changes. While increases in visual coverage were positively correlated with improvements in positive affect, suggesting that broader exploration of the environment may be linked to emotional benefits, the correlations between changes in Average Fixation Duration and improvements in Liking and Esthetic Evaluation did not retain statistical significance after correction for multiple comparisons. This pattern suggests that bio-esthetic equalization may be driven by an extensive exploration of the environment—sampling a wider range of biophilic elements—rather than the intensive scrutiny of individual elements [25,26]. In other words, the overall presence of nature, rather than the detailed processing of its specific components, appears to be associated with the improved perception of deprived areas.
This interpretation is further supported by examining a related metric: Average Dwell Time. Participants exhibited significantly longer Average Dwell Times in Low-SES scenes compared to both Medium- and High-SES scenes, with no significant difference between the latter two. This pattern held regardless of experimental condition, suggesting that Low-SES environments, irrespective of biophilic enhancement, tend to elicit more sustained visual engagement. Within established eye-tracking frameworks, prolonged fixation periods are often associated with deeper cognitive processing rather than superficial scanning [27]. However, despite this sustained engagement with Low-SES environments, the change in Dwell Time (Δ Dwell Time) did not correlate significantly with changes in positive affect (Δ PANAS Positive Affect). This null finding reinforces the idea that not all forms of visual engagement are equally beneficial for emotional outcomes. While Dwell Time may reflect cognitive load or stimulus salience, it appears to be a less sensitive indicator of affective benefit than the diversity of elements explored (AOI Coverage). This distinction aligns with previous work suggesting that the restorative potential of nature depends on the breadth, rather than merely the depth, of attentional engagement.
Crucially, the significant positive association between the increase in visual coverage of Bio-enhanced elements (Δ AOI Coverage) and the improvement in positive mood (Δ PANAS Positive Affect) is consistent with the “Nature Gaze” hypothesis [28], which proposes that the psychological benefits of biophilic interventions may be mediated by active visual engagement with natural elements. In the context of the present study, this pattern suggests that the equalizing effect observed in subjective ratings may be linked to the degree to which participants actively explored the introduced biophilic features, particularly in Low-SES environments where such elements were most novel. However, given the correlational nature of this analysis and the modest effect size, this interpretation remains preliminary and does not imply causality. The association could also reflect third variables, such as individual differences in attention or preference for nature, which were not measured in this pilot study.
4.2. Dissociating Affect from Stress: Oculomotor Correlates and Contextual Effects
The analysis of restorative metrics reveals an interesting dissociation between immediate affective improvement and stress-related responses. While bio-esthetic enhancements were associated with increased calm across all contexts (main effect of Condition on Relaxation), Perceived Stress remained significantly tied to the neighborhood’s SES. Low-SES environments consistently elicited higher stress ratings than Medium- and High-SES areas, although these pairwise differences were marginal and the Condition × SES interaction was not significant. This divergence suggests brief visual interventions may enhance positive affect and perceived calm without immediately altering more deeply rooted perceptions of stress associated with disadvantaged neighborhoods [11]. Furthermore, the finding that Positive Affect increased significantly while Negative Affect remained unchanged is consistent with evidence that nature-based stimuli can modulate dimensions of arousal independently, often elevating interest-driven engagement before alleviating deeper stress [5]. In this context, the bio-enhancement appeared to function as an additive emotional stimulant—adding novelty and pleasure—rather than providing subtractive relief from pre-existing environmental burdens associated with low-SES neighborhoods. However, given the marginal nature of the stress-related pairwise comparisons and the absence of a significant interaction, this interpretation remains tentative and requires replication in larger samples.
This pattern of dissociation between affective and stress-related responses was accompanied by distinctive gaze dynamics. Analysis of oculomotor metrics revealed that Low-SES scenes elicited higher saccadic velocities and longer Dwell Times compared to both Medium- and High-SES scenes, with no significant differences between the latter two. These effects were independent of experimental condition, indicating that Low-SES environments tended to evoke more active visual exploration and sustained attention regardless of biophilic enhancement. In immersive environments, higher saccadic velocity is often associated with active visual search and heightened arousal [9]. This interpretation is supported by the stability of Time to First Fixation and Saccadic Amplitude across conditions, suggesting that neither initial attentional orienting nor the spatial breadth of exploration was fundamentally altered. The combination of elevated saccadic velocity and stable orienting metrics is consistent with an intensification of the scanning process, which may reflect a state of heightened physiological arousal or ‘visual urgency’ [29] in response to Low SES contexts. However, as these are main effects of SES rather than interactions, they may also reflect baseline differences in the visual complexity or salience of the neighborhoods themselves, rather than a specific response to the biophilic intervention.
Examination of overall visual activity, as measured by Total Fixation Count and Duration, revealed a distinct pattern: Medium-SES environments elicited lower overall engagement compared to both Low- and High-SES areas. For Total Fixation Count, Medium-SES scenes received significantly fewer fixations than both Low- and High-SES scenes, with no difference between the latter two. For Total Fixation Duration, Medium-SES scenes showed significantly shorter Dwell Times than High-SES scenes, while the comparison with Low-SES scenes was marginal. These effects were independent of experimental condition (main effects of SES, with no significant interactions), suggesting that Medium-SES contexts may inherently evoke less sustained visual attention, regardless of biophilic enhancement. This pattern could be related to differences in the baseline visual complexity and interest cues of the neighborhoods [30,31]. Low-SES areas, characterized by visual degradation, may present a stark contrast when enhanced with biophilic elements, potentially capturing attention more readily. High-SES areas, already rich in greenery and esthetic features, may sustain attention through their inherent visual interest. Medium-SES environments, lacking both the stark contrast of degraded areas and the inherent richness of privileged ones, may fall into a “middle ground” that facilitates a more passive viewing behavior [16], failing to capture or hold attention as effectively—a pattern that could reflect the need for interventions to reach a certain “saliency threshold” to engage viewers [32]. While this interpretation is consistent with experimental tests of Attention Restoration Theory [31,33], it remains speculative given that baseline visual complexity was not systematically quantified in this study. Future research should directly measure or manipulate visual salience to test this hypothesis.
4.3. From Novelty to Restoration: Cognitive Load and the Temporal Dynamics of the Nature Gaze
A notable pattern in our findings is the divergence between affective improvement and perceived stress. While bio-esthetic enhancements were associated with significant increases in Positive Affect and Relaxation, Perceived Stress did not show a corresponding decline. This disconnect suggests that immediate esthetic appreciation may not directly translate into psychological recovery, at least within the brief exposure period used in this study. As noted in environmental psychology, an environment can be perceived as pleasant or esthetically appealing without necessarily possessing the qualities required to trigger a full restorative response in the short term [33,34]. The present findings are consistent with this view, indicating that positive affective shifts and stress reduction may operate on different timescales or involve distinct underlying mechanisms.
The eye-tracking data offers additional insights into this dissociation. Notably, participants exhibited higher saccadic velocities in Low-SES scenes compared to Medium- and High-SES scenes—a pattern that held across both original and enhanced conditions. In the eye-tracking literature, high saccadic velocity has been associated with active visual search [35] and heightened arousal [36].This oculomotor pattern is consistent with the possibility that the high visual contrast of Low-SES environments—particularly when enhanced with biophilic elements—may elicit a state of “hard fascination” or novelty-induced arousal [4], requiring greater cognitive resources to process the conflicting or salient environmental cues [37,38].
The significant negative correlation between changes in saccadic velocity and relaxation further supports this interpretation, suggesting that increased visual arousal was associated with reduced perceived calm [39]. This pattern suggests that the cognitive load required to process the novel, complex biophilic stimuli may have maintained physiological arousal, preventing an immediate drop in perceived stress within the short exposure time, even while the emotional valence was positive. This interpretation is consistent with the view that restoration is a time-dependent process; the viewer may need to move beyond the initial curiosity-driven phase—potentially prolonged by the novelty effect of the VR medium itself—to reach the state of “soft fascination” necessary for complete psychological recovery [40,41]. Consequently, in high-arousal urban contexts, the transition from immediate esthetic appreciation to meaningful stress reduction appears to be dose-dependent, requiring exposures of sufficient duration to cross identifiable efficiency thresholds [42].
However, as Kaplan [41] emphasizes, fascination alone—even “soft fascination”—is a necessary but not sufficient condition for restoration. A truly restorative experience also requires a sense of being away (a conceptual shift from routine thoughts), extent (the environment must be coherent and rich enough to constitute “a whole other world”), and compatibility (alignment between the environment and one’s purposes). In the present study, while the biophilic enhancements may have provided fascinating elements, the brief, static 360° exposures may have lacked the necessary extent or sense of being away to fully engage participants in a restorative experience. This further reinforces why stress reduction was not observed and highlights the need for future research to design interventions that incorporate these additional restorative components. On the other hand, the brief exposure duration in this study may have been insufficient for participants to transition from this initial curiosity-driven engagement to the more effortless state required for stress recovery. Future research with longer or repeated exposures could help clarify whether the observed arousal patterns are transient or whether they eventually give way to restorative effects.
4.4. Limitations and Future Directions
The interpretation of the findings in this study must be considered within the context of several methodological limitations inherent to its exploratory pilot phase, which provide significant opportunities for refinement in subsequent larger-scale investigations. A primary constraint is the relatively small sample size (N = 16), which, while sufficient for detecting large within-subject interaction effects regarding esthetic preference and visual attention, limits the statistical power to identify more subtle effects and constrains the generalizability of the findings. For instance, this limited power may explain why we could not identify a significant decline in perceived stress or negative affect across all conditions. Furthermore, while the use of university students offered a controlled baseline for this pilot trial, the study did not fully account for the diversity of the participants’ own socioeconomic status (SES), age, or gender as potential moderators.
Some measures included in this study relied on single-item, non-validated scales for specific constructs (Liking, Relaxation, Perceived Stress, Esthetic Evaluation). While pragmatic for this pilot, future confirmatory research should employ validated multi-item instruments to enhance the reliability of these measures.
An important consideration stems from our commitment to ecological validity: intrinsic neighborhood characteristics, such as ambient luminance and sound levels, were preserved as embedded features across experimental conditions. While this approach strengthens the real-world relevance of our findings by testing interventions within authentic contexts, it also means that the specific contribution of these sensory factors to the observed responses cannot be disentangled from the overall SES typology. Future research could employ controlled simulations to isolate the effects of specific sensory attributes from broader socioeconomic perceptions.
Furthermore, while the use of university students offered a controlled baseline for this pilot trial, the study did not fully account for the diversity of the participants’ own socioeconomic status (SES), age, or gender as potential moderators. Future research should move beyond uniform student cohorts to include participants from a wider range of sociodemographic backgrounds, explicitly examining how these individual demographic factors shape emotional and attentional responses to urban interventions. The technological and experimental design also introduced specific constraints, notably the use of fixed-viewpoint (3-DoF) 360° video footage. While this approach ensured high visual quality and experimental control, it precluded physical navigation or wayfinding, which may influence the user’s sense of presence compared to walkable, ambulatory virtual environments.
Furthermore, while the multi-session design was necessary to manage participant fatigue, and the within-session comparison of conditions controls for momentary changes in state, the design may have introduced additional day-to-day variance in participant state (e.g., baseline mood or arousal) across the different SES contexts. Future studies could include repeated baseline measures within each session to better account for such day-to-day variability or employ mixed-effects models to statistically control for these fluctuations.
Additionally, the relatively short duration of exposure in this study may have been influenced by a bias associated with the initial use of the immersive medium. In such simulations, technology-induced arousal can contribute to a higher total cognitive load, potentially interfering with the participant’s ability to transition into the state of effortless attention restoration necessary for full psychological recovery. This state of curiosity-driven engagement often maintains physiological tension in the short term, potentially masking the restorative process during brief exposures even when the emotional valence is positive. Furthermore, as discussed above, restorative experiences require not only fascination but also a sense of being away, extent, and compatibility. The static 360° exposures used here may have lacked these qualities, limiting their restorative potential regardless of exposure duration. Future interventions should therefore be designed to incorporate these additional components of restorative environments.
A related consideration is that several oculomotor effects (e.g., higher saccadic velocities and longer Dwell Times in Low-SES scenes) were main effects of SES rather than interactions with the biophilic intervention. This raises the possibility that these patterns reflect baseline differences in the visual complexity or salience of the neighborhoods themselves, rather than specific responses to the bio-esthetic enhancements. Future research could employ yoked designs or statistically control for baseline visual features to disentangle these possibilities.
To address these limitations, future studies should focus on the integration of multimodal data and the exploration of temporal dynamics. While eye-tracking provides deep insights into arousal and visual engagement, it serves as an indirect measure of internal states. Incorporating synchronized physiological biomarkers, such as Heart Rate Variability (HRV), Electrodermal Activity (EDA), and Electroencephalography (EEG), would allow researchers to objectively corroborate the levels of cognitive load and relaxation suggested by the oculomotor data.
Finally, moving from immediate post-exposure assessments toward longitudinal designs with repeated exposures would be valuable to assess how the “Nature Gaze” evolves from a curiosity-driven exploration into a sustained restorative mechanism over time.
5. Conclusions
This study utilized an immersive virtual reality (VR) environment integrated with real-time eye-tracking to assess the psychological and visual impacts of biophilic and esthetic enhancements in urban neighborhoods of varying socioeconomic status (SES). The findings offer preliminary evidence suggesting a potential role for bio-esthetic interventions in promoting urban well-being, while also revealing the complex interplay between environmental context, visual attention, and emotional response.
Three main conclusions emerge from our results. First, biophilic design may act as a perceptual equalizer across socioeconomic strata. While original urban scenes replicated the well-documented esthetic gradient favoring High-SES areas, the enhanced versions elicited uniformly high ratings of liking and esthetic evaluation, effectively reducing the gap between Low- and High-SES neighborhoods. This pattern is consistent with the equigenesis hypothesis, which suggests that the marginal benefit of green interventions may be greatest in the most deprived contexts. However, given the small sample size, this interpretation remains preliminary.
Second, the emotional benefits of these interventions were associated with active visual engagement. Eye-tracking metrics revealed that enhanced scenes, particularly in low-SES contexts, attracted more fixations and greater visual coverage. Moreover, increased visual exploration of biophilic elements was positively correlated with improvements in positive affect. This pattern suggests that the restorative potential of bio-esthetic interventions may be related to the degree to which individuals attend to natural elements, although the correlational nature of this finding precludes causal inference.
Third, the restoration process appears to be multifaceted and time-sensitive. Although the enhancements were associated with increases in positive affect and perceived relaxation, they did not significantly reduce self-reported stress in low-SES contexts. Eye-tracking data suggested that the pronounced visual transformation in these areas was accompanied by heightened visual arousal—reflected in higher Saccadic Velocity and longer Dwell Times—consistent with curiosity-driven engagement. This suggests that while esthetic preference and positive emotion can improve rapidly, the transition to a state of effortless attention restoration and meaningful stress reduction may require longer or repeated exposures to allow for cognitive adaptation.
For urban planning and policy, these findings offer preliminary insights into the potential value of prioritizing biophilic interventions in socioeconomically disadvantaged neighborhoods, where they may yield the greatest perceptual and emotional returns. The integrated use of VR and eye-tracking, complemented by subjective psychometric questionnaires, demonstrates feasibility as a methodology for simulating and evaluating design proposals before implementation, enabling planners to optimize interventions for visual engagement and psychological impact.
However, these conclusions are context-bound and exploratory. The study’s limitations—including the small sample size, reliance on single-item measures, brief exposure duration, unmeasured confounds (e.g., novelty effects), and the marginal nature of some statistical effects—necessitate replication in larger, more diverse samples with more rigorous experimental controls. Future research should employ longitudinal designs, multimodal physiological measurements, and systematic manipulation of sensory features to disentangle the mechanisms underlying biophilic effects and to establish their generalizability across populations and contexts.
In summary, this pilot study demonstrates the feasibility of integrated VR/eye-tracking frameworks for investigating human–environment interactions and provides preliminary evidence that targeted biophilic enhancements may contribute to perceptual equity in urban settings. These findings lay the groundwork for future confirmatory research and highlight the need for a nuanced, temporally sensitive model of restorative experience in immersive environments.
Author Contributions
C.F.: conceptualization, methodology, software, validation, formal analysis, investigation, data curation, writing—original draft preparation, writing—review and editing, visualization, supervision, and project administration; M.G.-J.: software, investigation, data curation, and writing—original draft preparation; P.L.: validation, investigation, data curation, writing—original draft preparation, writing—review and editing; A.M.-M.: investigation, data curation, writing—original draft preparation, and visualization; S.C.-C.: methodology, formal analysis, and writing—review and editing; F.N.-E.: conceptualization, methodology, formal analysis, resources, writing—original draft preparation, writing—review and editing, supervision, project administration, and funding acquisition. All authors have read and agreed to the published version of the manuscript.
Funding
This research was supported by the University of Almería through the Proyectos de Fortalecimiento de Centros de Investigación (Grant number P_FORT_CENTROS_2023/04). This grant is part of the Research and Transfer Plan of the University of Almeria, funded by “Consejería de Universidad, Investigación e Innovación de la Junta de Andalucía” within the program 54A “Scientific Research and Innovation” and by the ERDF Andalusia 2021–2027 Program, within the Specific Objective RSO1.1 “Developing and improving research and innovation capabilities and assimilating advanced technologies.”.
Institutional Review Board Statement
The study was conducted in accordance with the Declaration of Helsinki and approved by the Ethics Committee of the University of Almería (protocol code UALBIO2021/010 and date of approval 17 February 2022) for studies involving humans.
Informed Consent Statement
Informed consent was obtained from all subjects involved in the study.
Data Availability Statement
The data presented in this study are deposited in the University of Almería (riUAL) repository (accession number: http://hdl.handle.net/10835/20458). The data are under an embargo period and will be publicly accessible from 1 January 2028 to allow for the completion of ongoing related studies. Until then, access may be granted upon reasonable request to the corresponding author.
Acknowledgments
The authors would like to thank the University of Almería and the Federal Institute of Education, Science, and Technology of Rio Grande do Sul (IFRS) for the institutional support provided during this research. During the preparation of this work, the authors used Gemini (Google) in order to refine the grammatical accuracy and readability of the manuscript. After using this tool, the authors reviewed and edited the content as needed and take full responsibility for the content of the publication.
Conflicts of Interest
The authors declare no conflicts of interest.
References
- Kellert, S. Nature by Design: The Practice of Biophilic Design; Yale University Press: New Haven, CT, USA, 2018; p. 214. ISBN 978-0-300-23543-2. [Google Scholar]
- Ryan, C.; Browning, W.; Clancy, J.; Andrews, S.; Kallianpurkar, N. Biophilic Design Patterns: Emerging Nature-Based Parameters for Health and Well-Being in the Built Environment. Archnet-IJAR 2014, 8, 62–76. [Google Scholar] [CrossRef] [Scilit]
- Higuera-Trujillo, J.L.; Llinares, C.; Macagno, E. The Cognitive-Emotional Design and Study of Architectural Space: A Scoping Review of Neuroarchitecture and Its Precursor Approaches. Sensors 2021, 21, 2193. [Google Scholar] [CrossRef] [Scilit]
- Kaplan, R.; Kaplan, S. The Experience of Nature: A Psychological Perspective; The Experience of Nature: A Psychological Perspective; Cambridge University Press: New York, NY, USA, 1989; pp. xii, 340. ISBN 978-0-521-34139-4. [Google Scholar]
- Kim, S.; Park, H.; Choo, S. Effects of Changes to Architectural Elements on Human Relaxation-Arousal Responses: Based on VR and EEG. Int. J. Environ. Res. Public Health 2021, 18, 4305. [Google Scholar] [CrossRef] [Scilit] [PubMed]
- Finkler, W.; Vlietstra, L.; Waters, D.L.; Zhu, L.; Gallagher, S.; Walker, R.; Forlong, R.; van Heezik, Y. Virtual Nature and Well-Being: Exploring the Potential of 360° VR. Appl. Psychol. Health Well-Being 2025, 17, e70008. [Google Scholar] [CrossRef] [Scilit] [PubMed]
- Frost, S.; Kannis-Dymand, L.; Schaffer, V.; Millear, P.; Allen, A.; Stallman, H.; Mason, J.; Wood, A.; Atkinson-Nolte, J. Virtual Immersion in Nature and Psychological Well-Being: A Systematic Literature Review. J. Environ. Psychol. 2022, 80, 101765. [Google Scholar] [CrossRef] [Scilit]
- Ferreira, C.P.; Latorre, P.; Nieto-Escamez, F.A. Impact of Nature and Architectural Design in Virtual Residential Spaces and Urban Settings on Human Mental Health and Well-Being: A Systematic Review. J. Environ. Psychol. 2025, 108, 102821. [Google Scholar] [CrossRef] [Scilit]
- Jin, X.; Chai, S.; Tang, J.; Zhou, X.; Wang, K. Eye-Tracking in AR/VR: A Technological Review and Future Directions. IEEE Open J. Immersive Disp. 2024, 1, 146–154. [Google Scholar] [CrossRef]
- Jeong, D.; Jeong, M.; Yang, U.; Han, K. Eyes on Me: Investigating the Role and Influence of Eye-Tracking Data on User Modeling in Virtual Reality. PLoS ONE 2022, 17, e0278970. [Google Scholar] [CrossRef] [Scilit]
- Pimentel, D.; Foxman, M.; Davis, D.Z.; Markowitz, D.M. Virtually Real, But Not Quite There: Social and Economic Barriers to Meeting Virtual Reality’s True Potential for Mental Health. Front. Virtual Real. 2021, 2, 627059. [Google Scholar] [CrossRef] [Scilit]
- Siette, J.; Adam, P.J.; Harris, C.B. Acceptability of Virtual Reality to Screen for Dementia in Older Adults. BMC Geriatr. 2024, 24, 493. [Google Scholar] [CrossRef] [Scilit]
- Erickson, A.; Kim, K.; Bruder, G.; Welch, G.F. Exploring the Limitations of Environment Lighting on Optical See-Through Head-Mounted Displays. In Proceedings of the 2020 ACM Symposium on Spatial User Interaction; Association for Computing Machinery: New York, NY, USA, 2020; pp. 1–8. [Google Scholar]
- Huyan, J.; Ramkissoon, C.; Laka, M.; Gaskin, S. Assessing the Usefulness of Mobile Apps for Noise Management in Occupational Health and Safety: Quantitative Measurement and Expert Elicitation Study. JMIR MHealth UHealth 2023, 11, e46846. [Google Scholar] [CrossRef] [Scilit]
- King, G.; Roland-Mieszkowski, M.; Jason, T.; Rainham, D.G. Noise Levels Associated with Urban Land Use. J. Urban Health 2012, 89, 1017–1030. [Google Scholar] [CrossRef] [Scilit]
- Pan, W.; Du, J. Effects of Neighbourhood Morphological Characteristics on Outdoor Daylight and Insights for Sustainable Urban Design. J. Asian Archit. Build. Eng. 2022, 21, 342–367. [Google Scholar] [CrossRef] [Scilit]
- Sandín, B.; Chorot, P.; Lostao, L.; Joiner, T.E.; Santed, M.A.; Valiente, R.M. Escalas PANAS de Afecto Positivo y Negativo: Validación Factorial y Convergencia Transcultural. Psicothema 1999, 11, 37–51. [Google Scholar]
- Wei, S.; Bloemers, D.; Rovira, A. A Preliminary Study of the Eye Tracker in the Meta Quest Pro. In Proceedings of the 2023 ACM International Conference on Interactive Media Experiences (IMX ’23); Association for Computing Machinery: New York, NY, USA, 2023; p. 221. [Google Scholar]
- Blanca, M.J.; Alarcón, R.; Arnau, J.; Bono, R.; Bendayan, R. Non-Normal Data: Is ANOVA Still a Valid Option? Psicothema 2017, 29, 552–557. [Google Scholar] [CrossRef] [Scilit] [PubMed]
- Holm, S. A Simple Sequentially Rejective Multiple Test Procedure. Scand. J. Stat. 1979, 6, 65–70. [Google Scholar]
- Galera, C.; Navarro, M.C.; Galesne, C.; Retuerto, N.; Bentivegna, F.; Flouri, E. Neighborhood Green Space and Psychological Distress: A Longitudinal Study of Socioeconomic Disparities in Mental Health Outcomes. Environ. Int. 2025, 204, 109799. [Google Scholar] [CrossRef] [Scilit]
- Xian, Z.; Nakaya, T.; Liu, K.; Zhao, B.; Zhang, J.; Zhang, J.; Lin, Y.; Zhang, J. The Effects of Neighbourhood Green Spaces on Mental Health of Disadvantaged Groups: A Systematic Review. Humanit. Soc. Sci. Commun. 2024, 11, 488. [Google Scholar] [CrossRef] [Scilit]
- Menzel, C.; Reese, G. Seeing Nature from Low to High Levels: Mechanisms Underlying the Restorative Effects of Viewing Nature Images. J. Environ. Psychol. 2022, 81, 101804. [Google Scholar] [CrossRef] [Scilit]
- Mitchell, R.; Popham, F. Effect of Exposure to Natural Environment on Health Inequalities: An Observational Population Study. Lancet Lond. Engl. 2008, 372, 1655–1660. [Google Scholar] [CrossRef] [Scilit]
- Clarke, A.D.F.; Mahon, A.; Irvine, A.; Hunt, A.R. People Are Unable to Recognize or Report on Their Own Eye Movements. Q. J. Exp. Psychol. 2017, 70, 2251–2270. [Google Scholar] [CrossRef] [Scilit] [PubMed]
- Hollander, J.B.; Purdy, A.; Wiley, A.; Foster, V.; Jacob, R.J.K.; Taylor, H.A.; Brunyé, T.T. Seeing the City: Using Eye-Tracking Technology to Explore Cognitive Responses to the Built Environment. J. Urban. Int. Res. Placemaking Urban Sustain. 2019, 12, 156–171. [Google Scholar] [CrossRef] [Scilit]
- Orquin, J.L.; Holmqvist, K. Threats to the Validity of Eye-Movement Research in Psychology. Behav. Res. Methods 2018, 50, 1645–1656. [Google Scholar] [CrossRef] [Scilit] [PubMed]
- Fleming, W.; Rizowy, B.; Shwartz, A. The Nature Gaze: Eye-tracking Experiment Reveals Well-being Benefits Derived from Directing Visual Attention towards Elements of Nature. People Nat. 2024, 6, 1469–1485. [Google Scholar] [CrossRef] [Scilit]
- Unema, P.J.A.; Pannasch, S.; Joos, M.; Velichkovsky, B.M. Time Course of Information Processing during Scene Perception: The Relationship between Saccade Amplitude and Fixation Duration. Vis. Cogn. 2005, 12, 473–494. [Google Scholar] [CrossRef] [Scilit]
- Greene, H.H.; Diwadkar, V.A.; Brown, J.M. Regularities in Vertical Saccadic Metrics: New Insights, and Future Perspectives. Front. Psychol. 2023, 14, 1157686. [Google Scholar] [CrossRef] [Scilit]
- Mostajeran, F.; Friedrich, M.; Steinicke, F.; Kühn, S.; Stuerzlinger, W. The Effects of Biophilic Design on Steering Performance in Virtual Reality. Sci. Rep. 2025, 15, 32485. [Google Scholar] [CrossRef] [Scilit]
- Weng, Y.; Chen, Q.; Lin, X.; Chi, Y.; Li, K. Restorative Effects of Small Urban Parks: A Multi-Method Study Using Eye-Tracking and Psychophysiological Measures in Fuzhou, China. Front. Public Health 2025, 13, 1667502. [Google Scholar] [CrossRef] [Scilit]
- Berto, R. Exposure to Restorative Environments Helps Restore Attentional Capacity. J. Environ. Psychol. 2005, 25, 249–259. [Google Scholar] [CrossRef] [Scilit]
- Chen, W.; Ruan, R.; Deng, W.; Gao, J. The Effect of Visual Attention Process and Thinking Styles on Environmental Aesthetic Preference: An Eye-Tracking Study. Front. Psychol. 2023, 13, 1027742. [Google Scholar] [CrossRef] [Scilit] [PubMed]
- Montagnini, A.; Chelazzi, L. The Urgency to Look: Prompt Saccades to the Benefit of Perception. Vision Res 2005, 45, 3391–3401. [Google Scholar] [CrossRef] [Scilit]
- Di Stasi, L.L.; Catena, A.; Cañas, J.J.; Macknik, S.L.; Martinez-Conde, S. Saccadic Velocity as an Arousal Index in Naturalistic Tasks. Neuroscience & Biobehavioral Reviews 2013, 37, 968–975. [Google Scholar] [CrossRef] [Scilit]
- Valtchanov, D.; Ellard, C.G. Cognitive and Affective Responses to Natural Scenes: Effects of Low Level Visual Properties on Preference, Cognitive Load and Eye-Movements. J. Environ. Psychol. 2015, 43, 184–195. [Google Scholar] [CrossRef] [Scilit]
- Miguel-Alonso, I.; Checa, D.; Guillen-Sanz, H.; Bustillo, A. Evaluation of the Novelty Effect in Immersive Virtual Reality Learning Experiences. Virtual Real. 2024, 28, 27. [Google Scholar] [CrossRef] [Scilit]
- Walter, K.; Bex, P. Cognitive Load Influences Oculomotor Behavior in Natural Scenes. Sci. Rep. 2021, 11, 12405. [Google Scholar] [CrossRef] [Scilit]
- Ohly, H.; White, M.P.; Wheeler, B.W.; Bethel, A.; Ukoumunne, O.C.; Nikolaou, V.; Garside, R. Attention Restoration Theory: A Systematic Review of the Attention Restoration Potential of Exposure to Natural Environments. J. Toxicol. Environ. Health B Crit. Rev. 2016, 19, 305–343. [Google Scholar] [CrossRef] [Scilit]
- Kaplan, S. The Restorative Benefits of Nature: Toward an Integrative Framework. J. Environ. Psychol. 1995, 15, 169–182. [Google Scholar] [CrossRef] [Scilit]
- Yao, X.; Yu, Z.; Ma, W.; Xiong, J.; Yang, G. Quantifying Threshold Effects of Physiological Health Benefits in Greenspace Exposure. Landsc. Urban Plan. 2024, 241, 104917. [Google Scholar] [CrossRef] [Scilit]
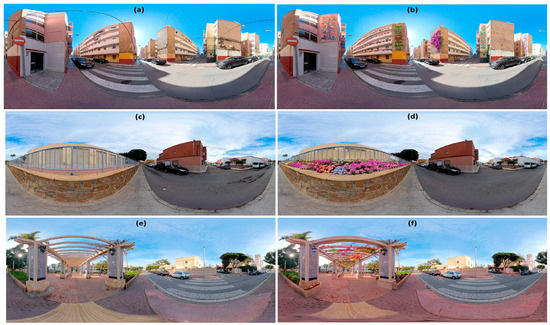
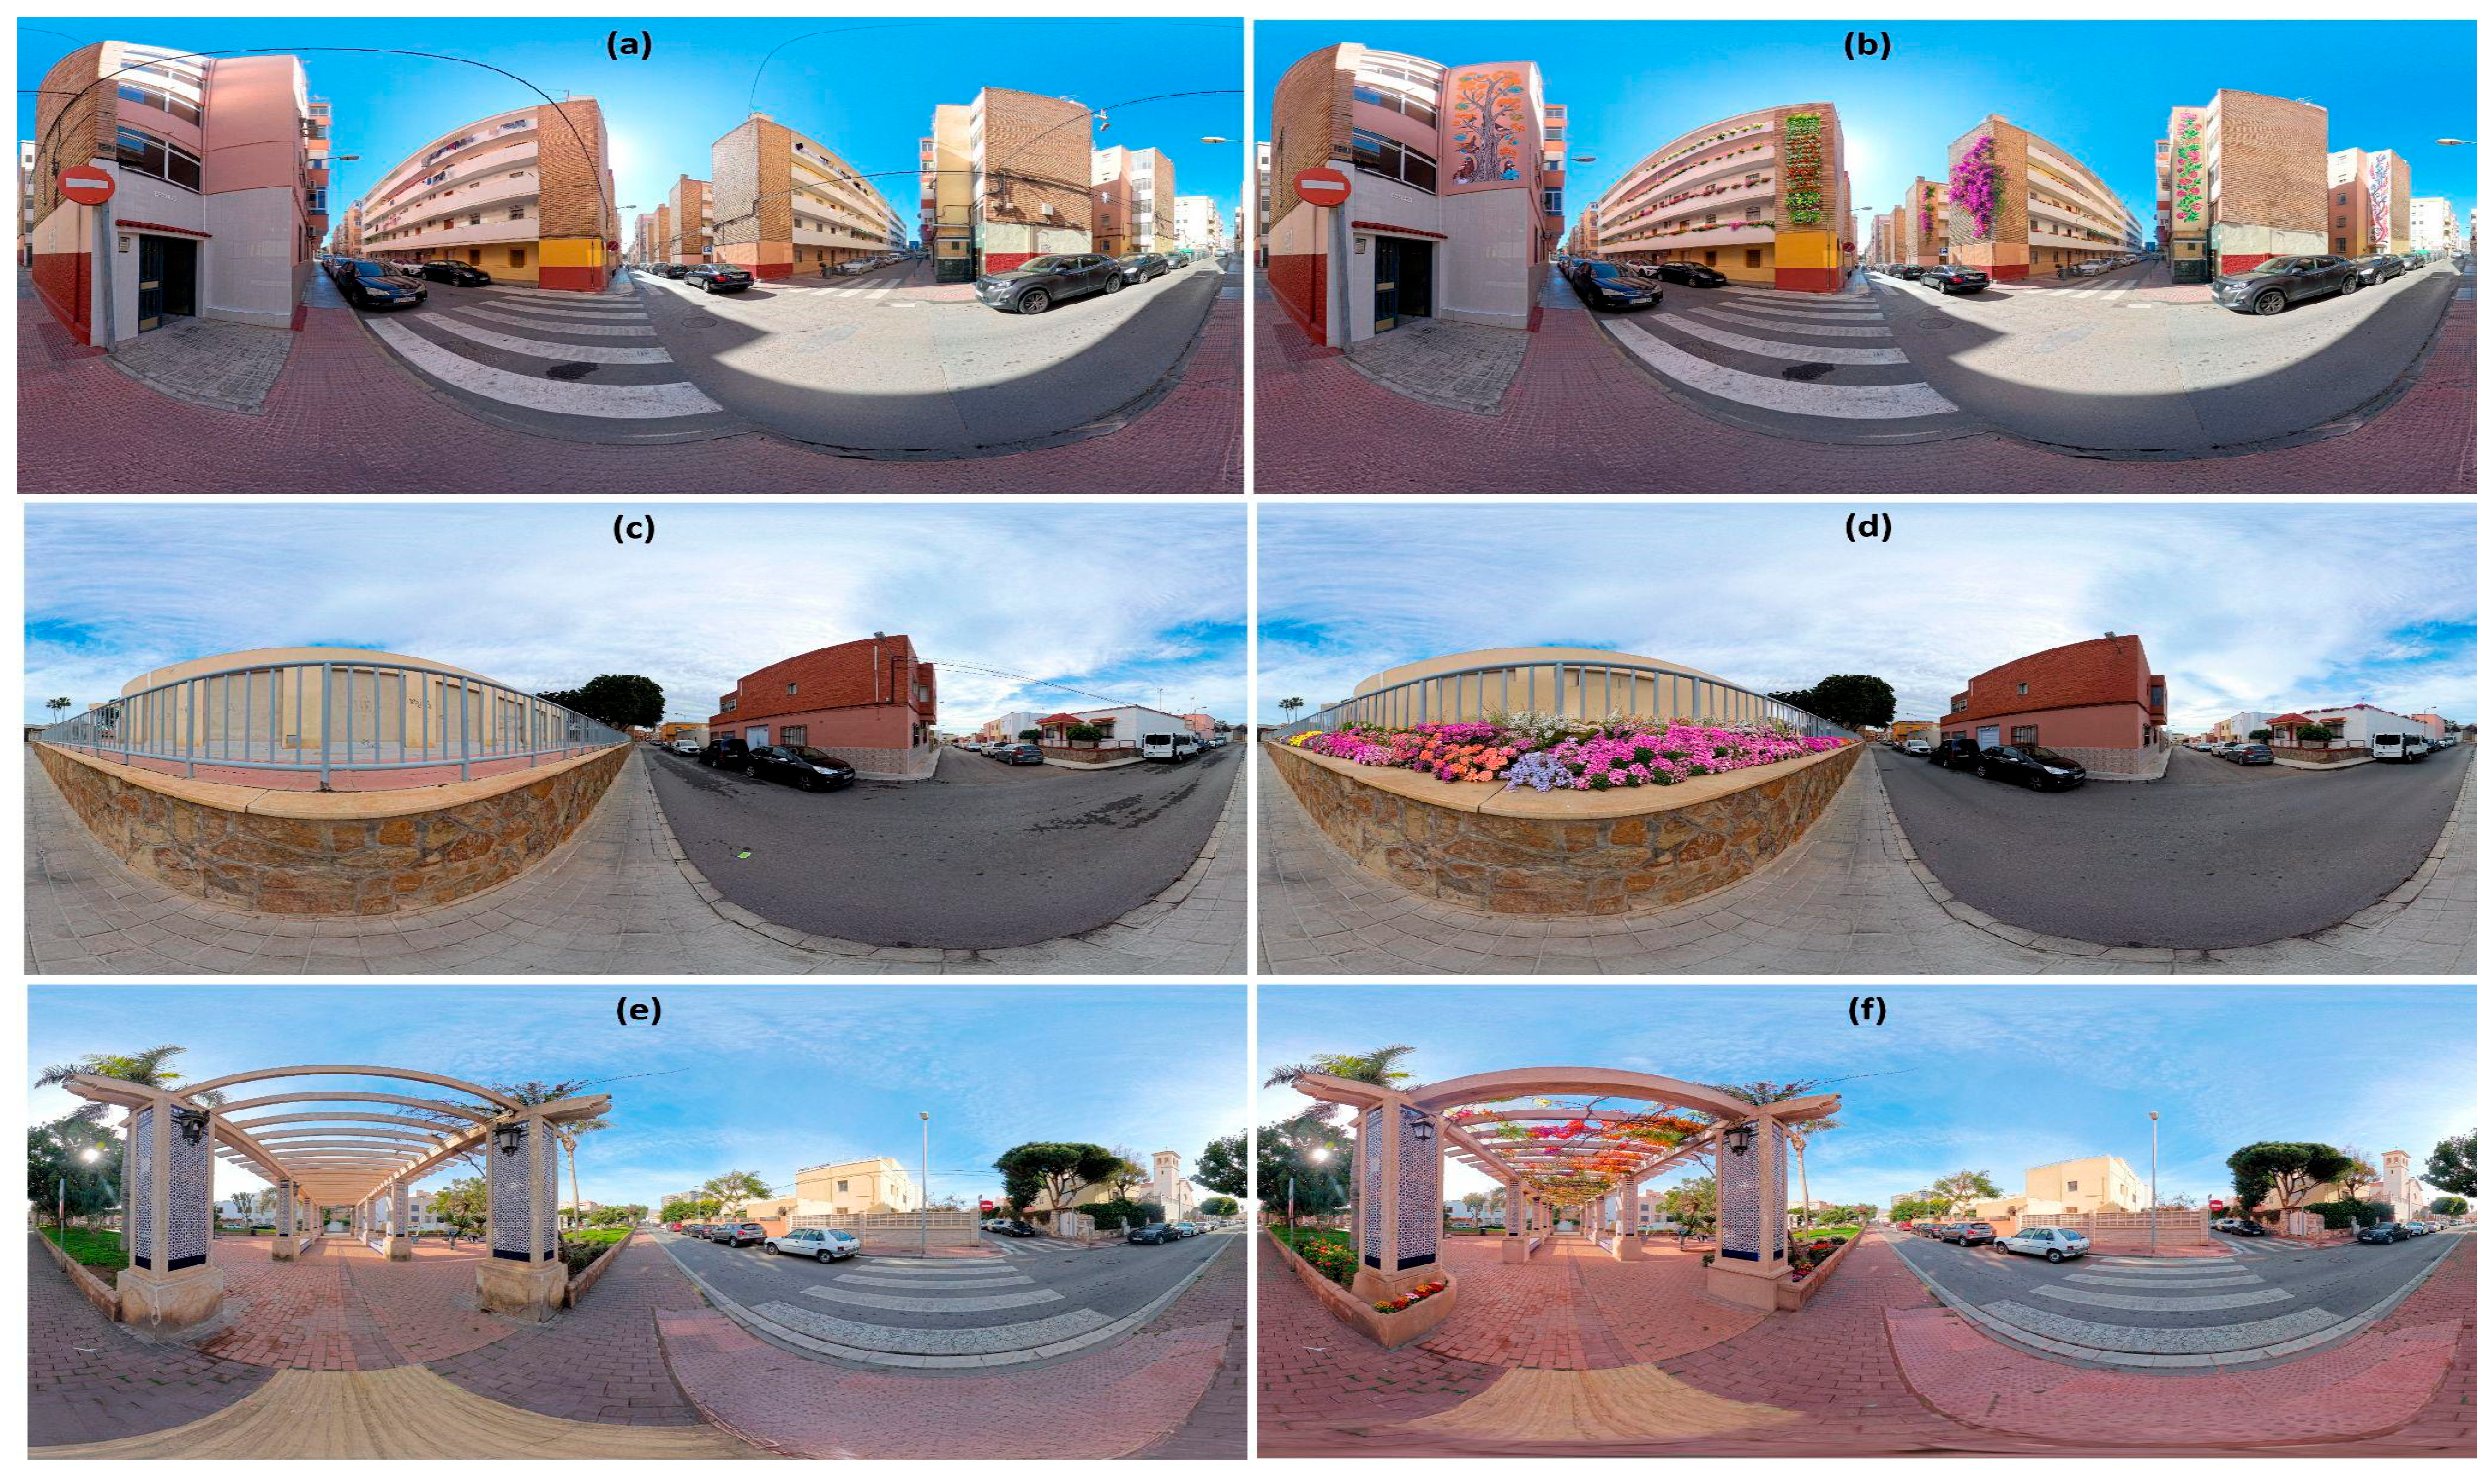
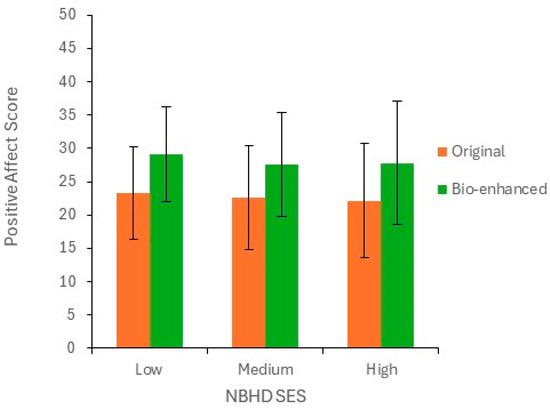
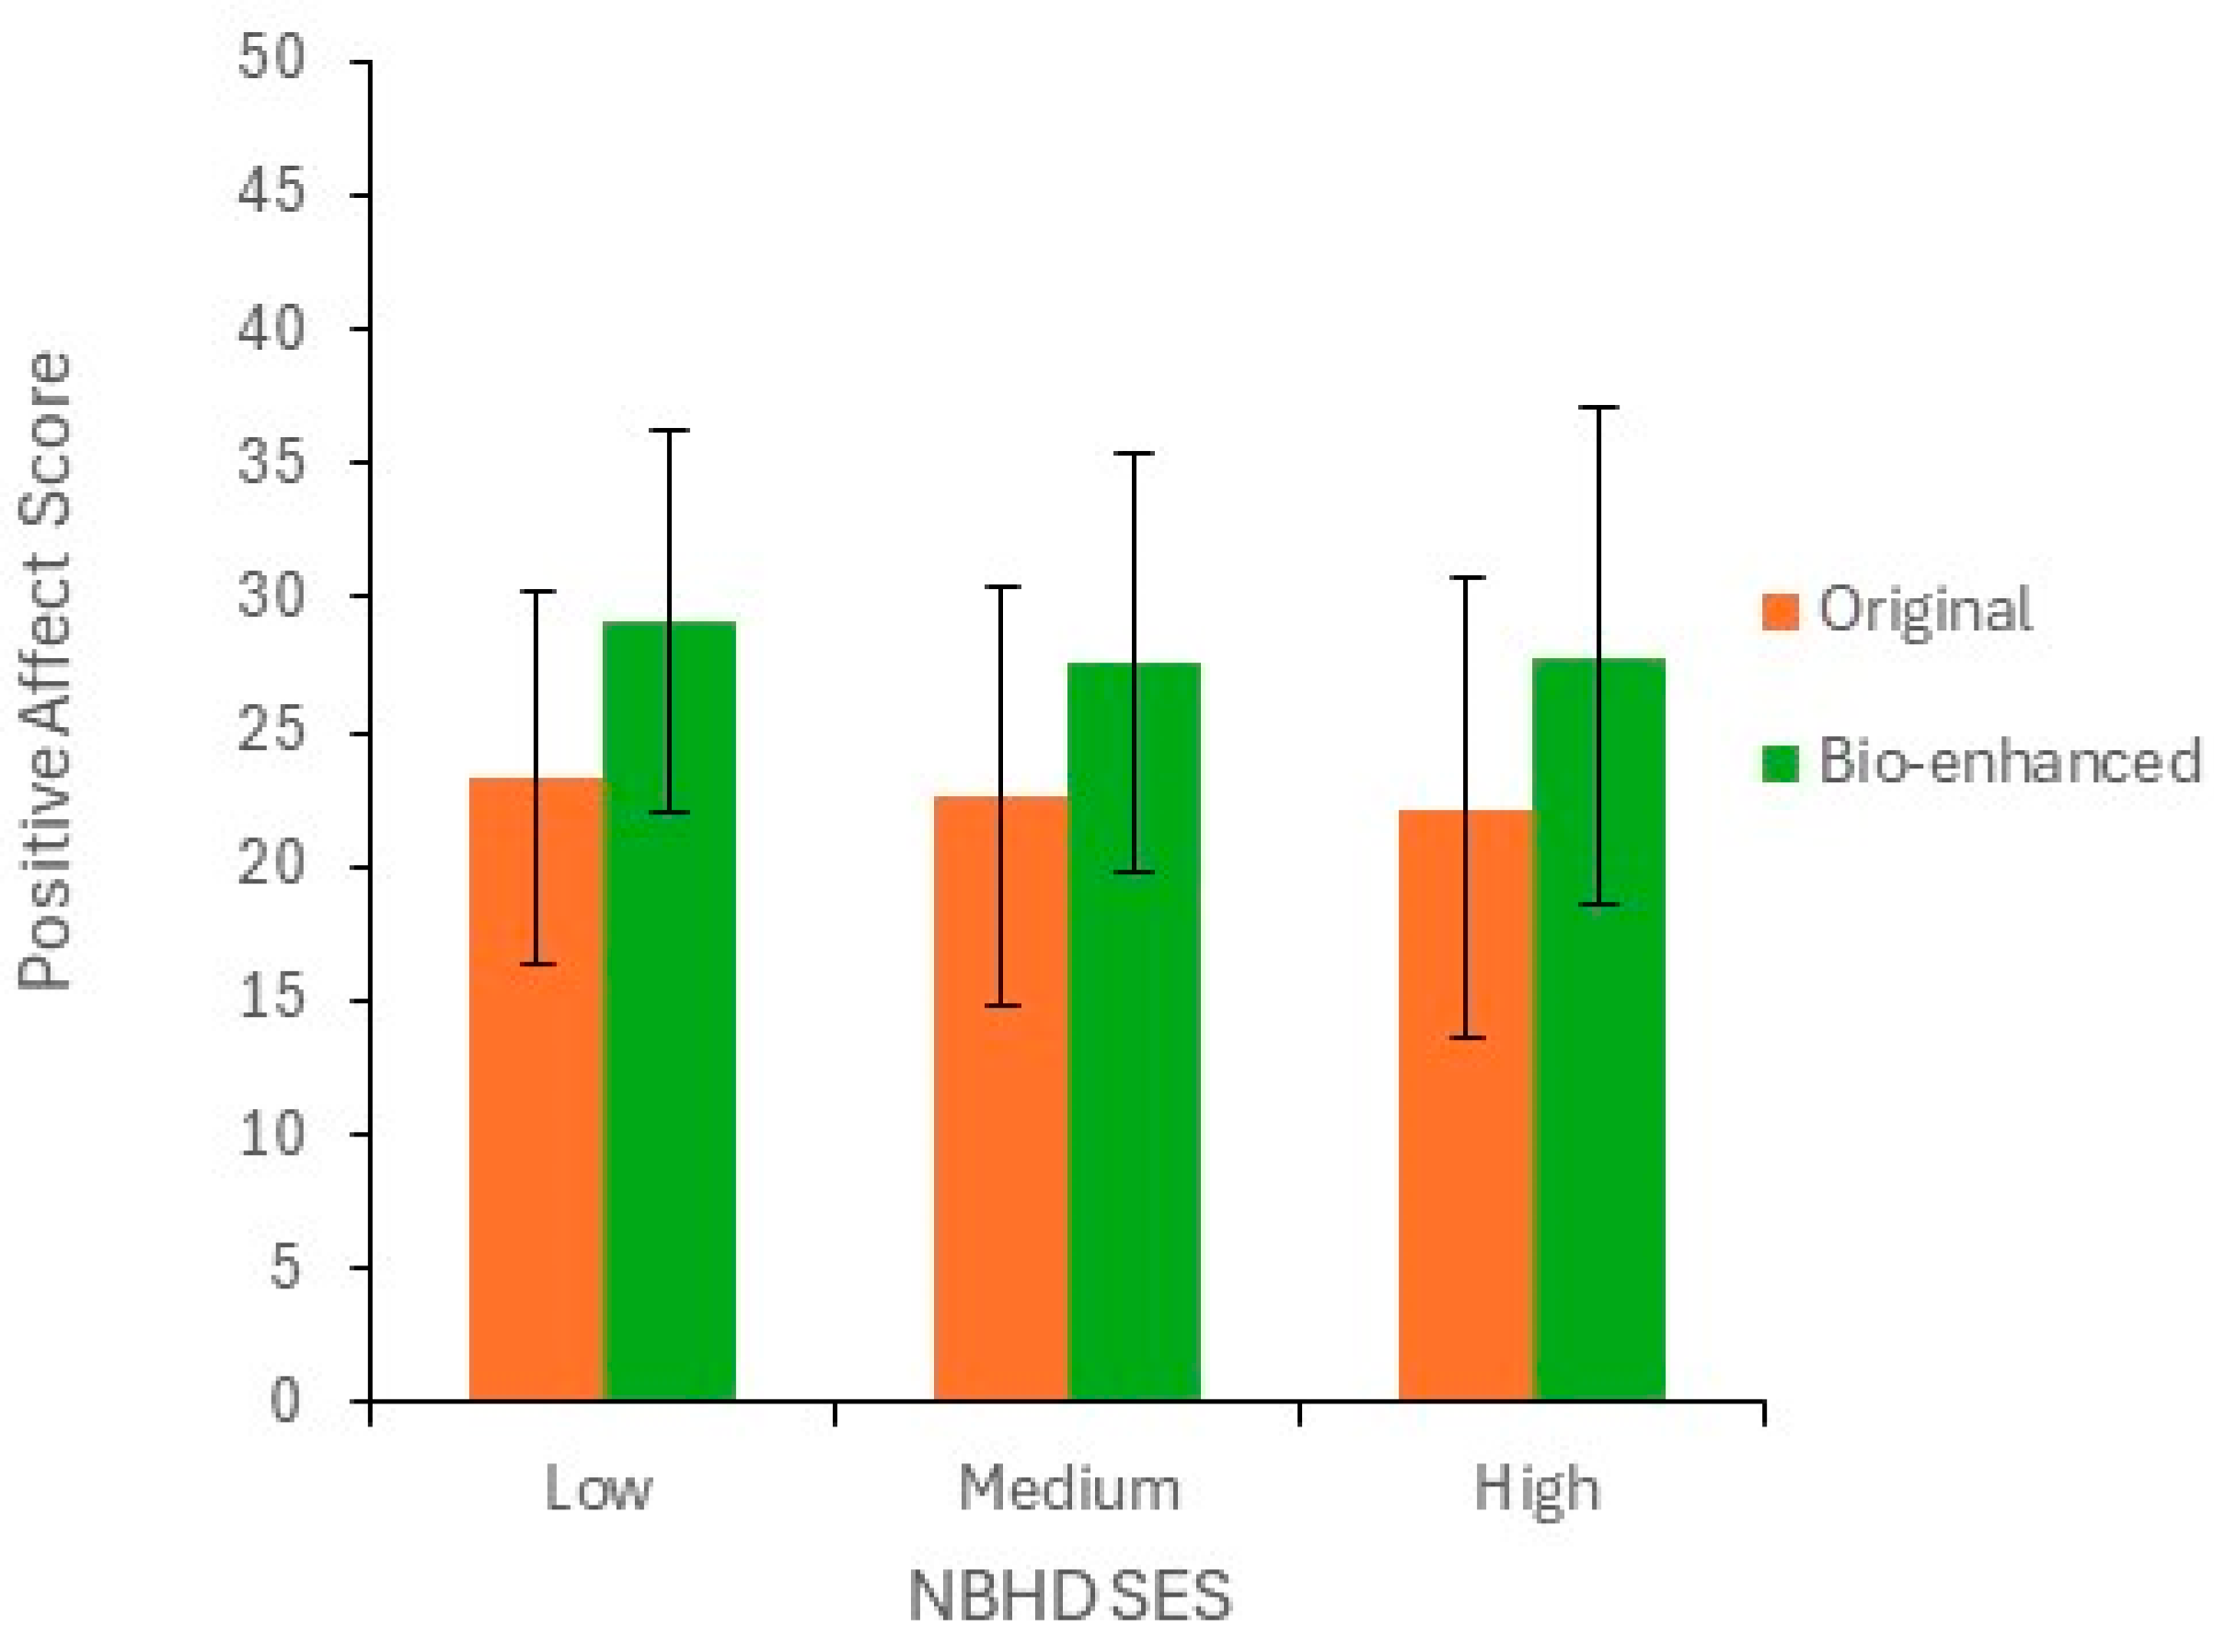
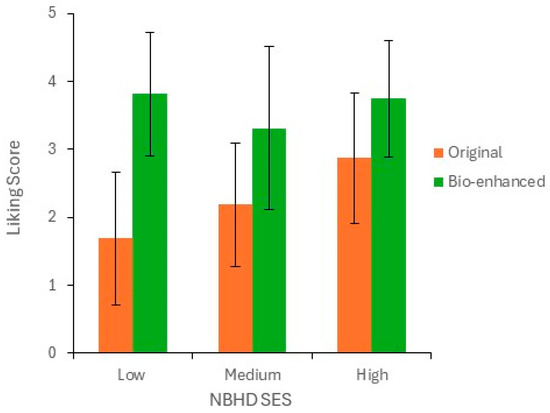
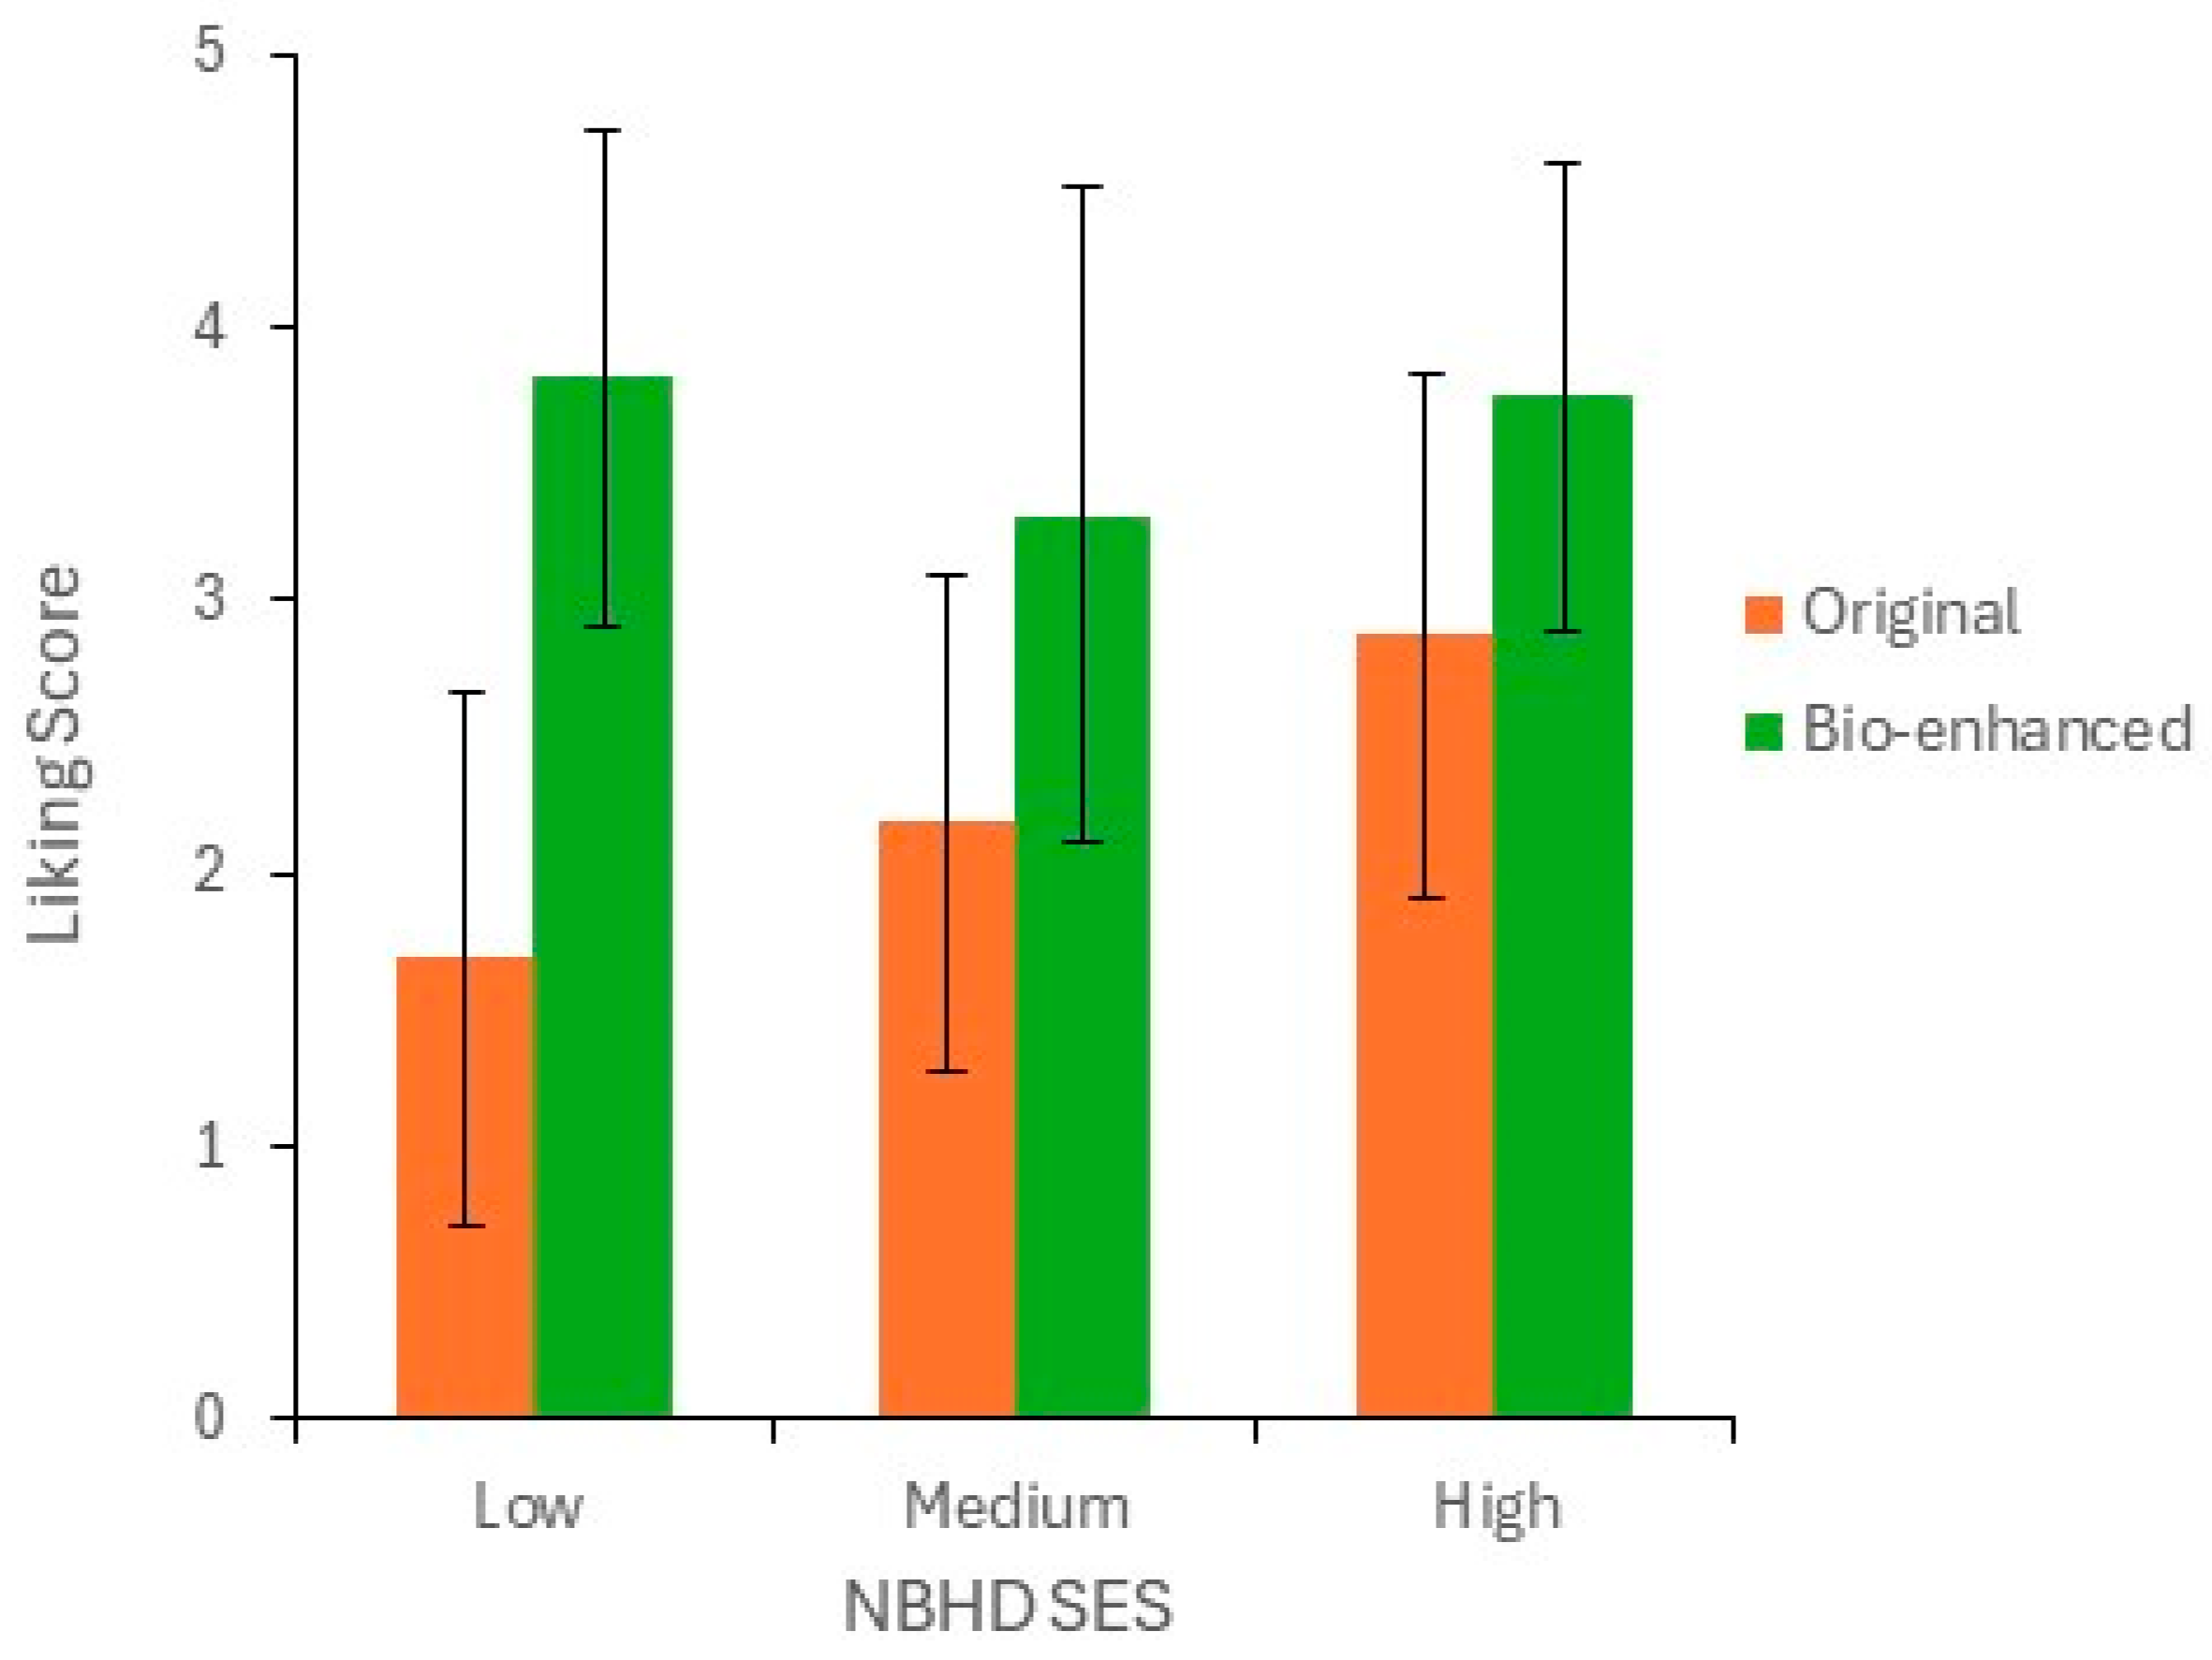
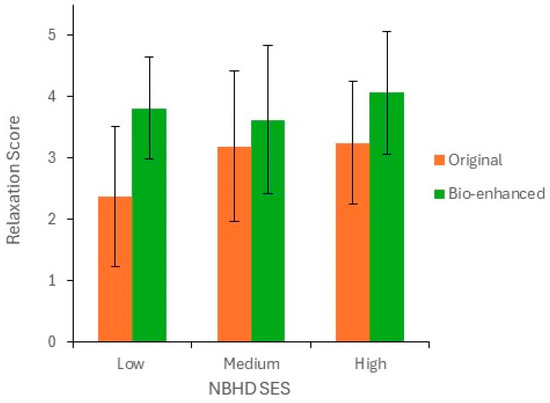
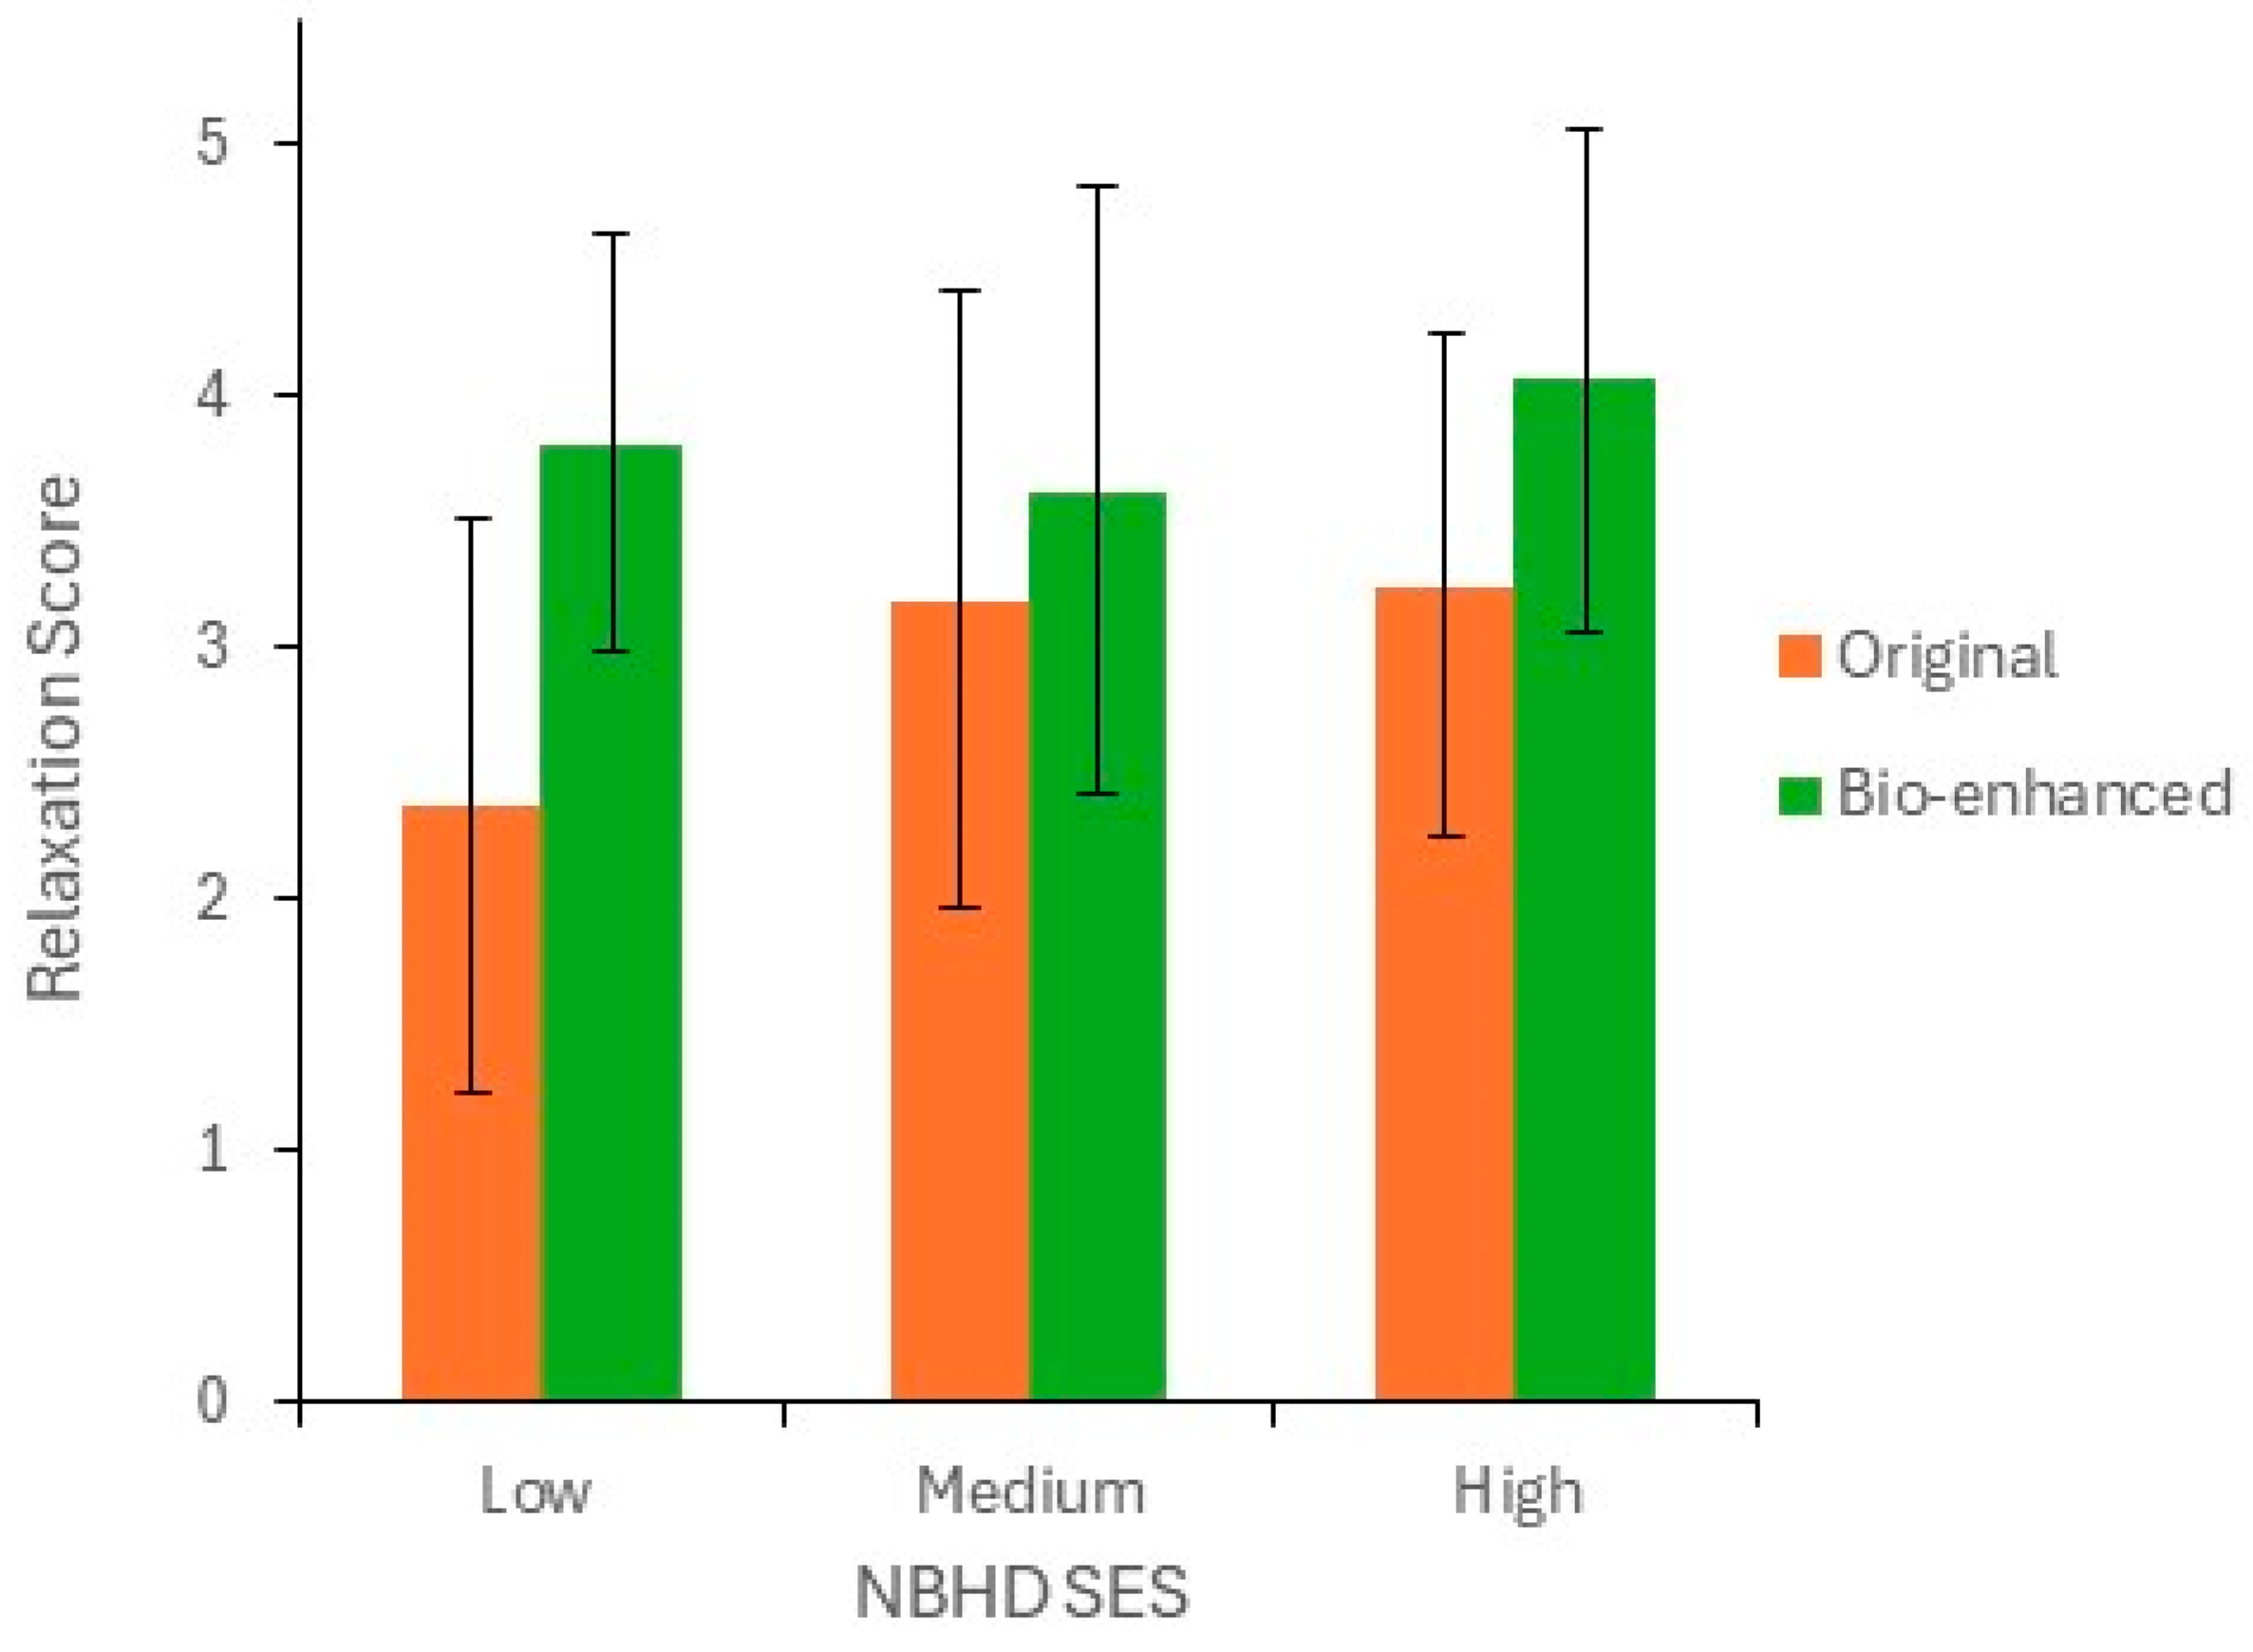
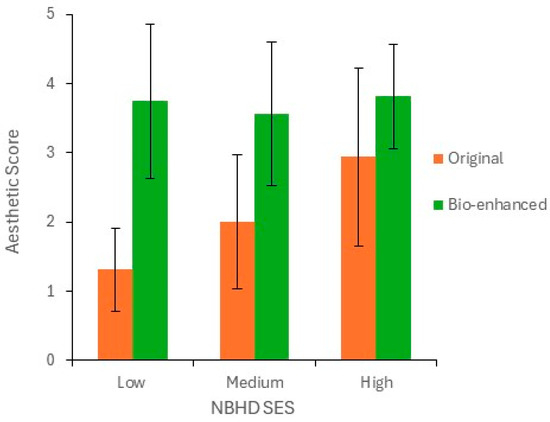
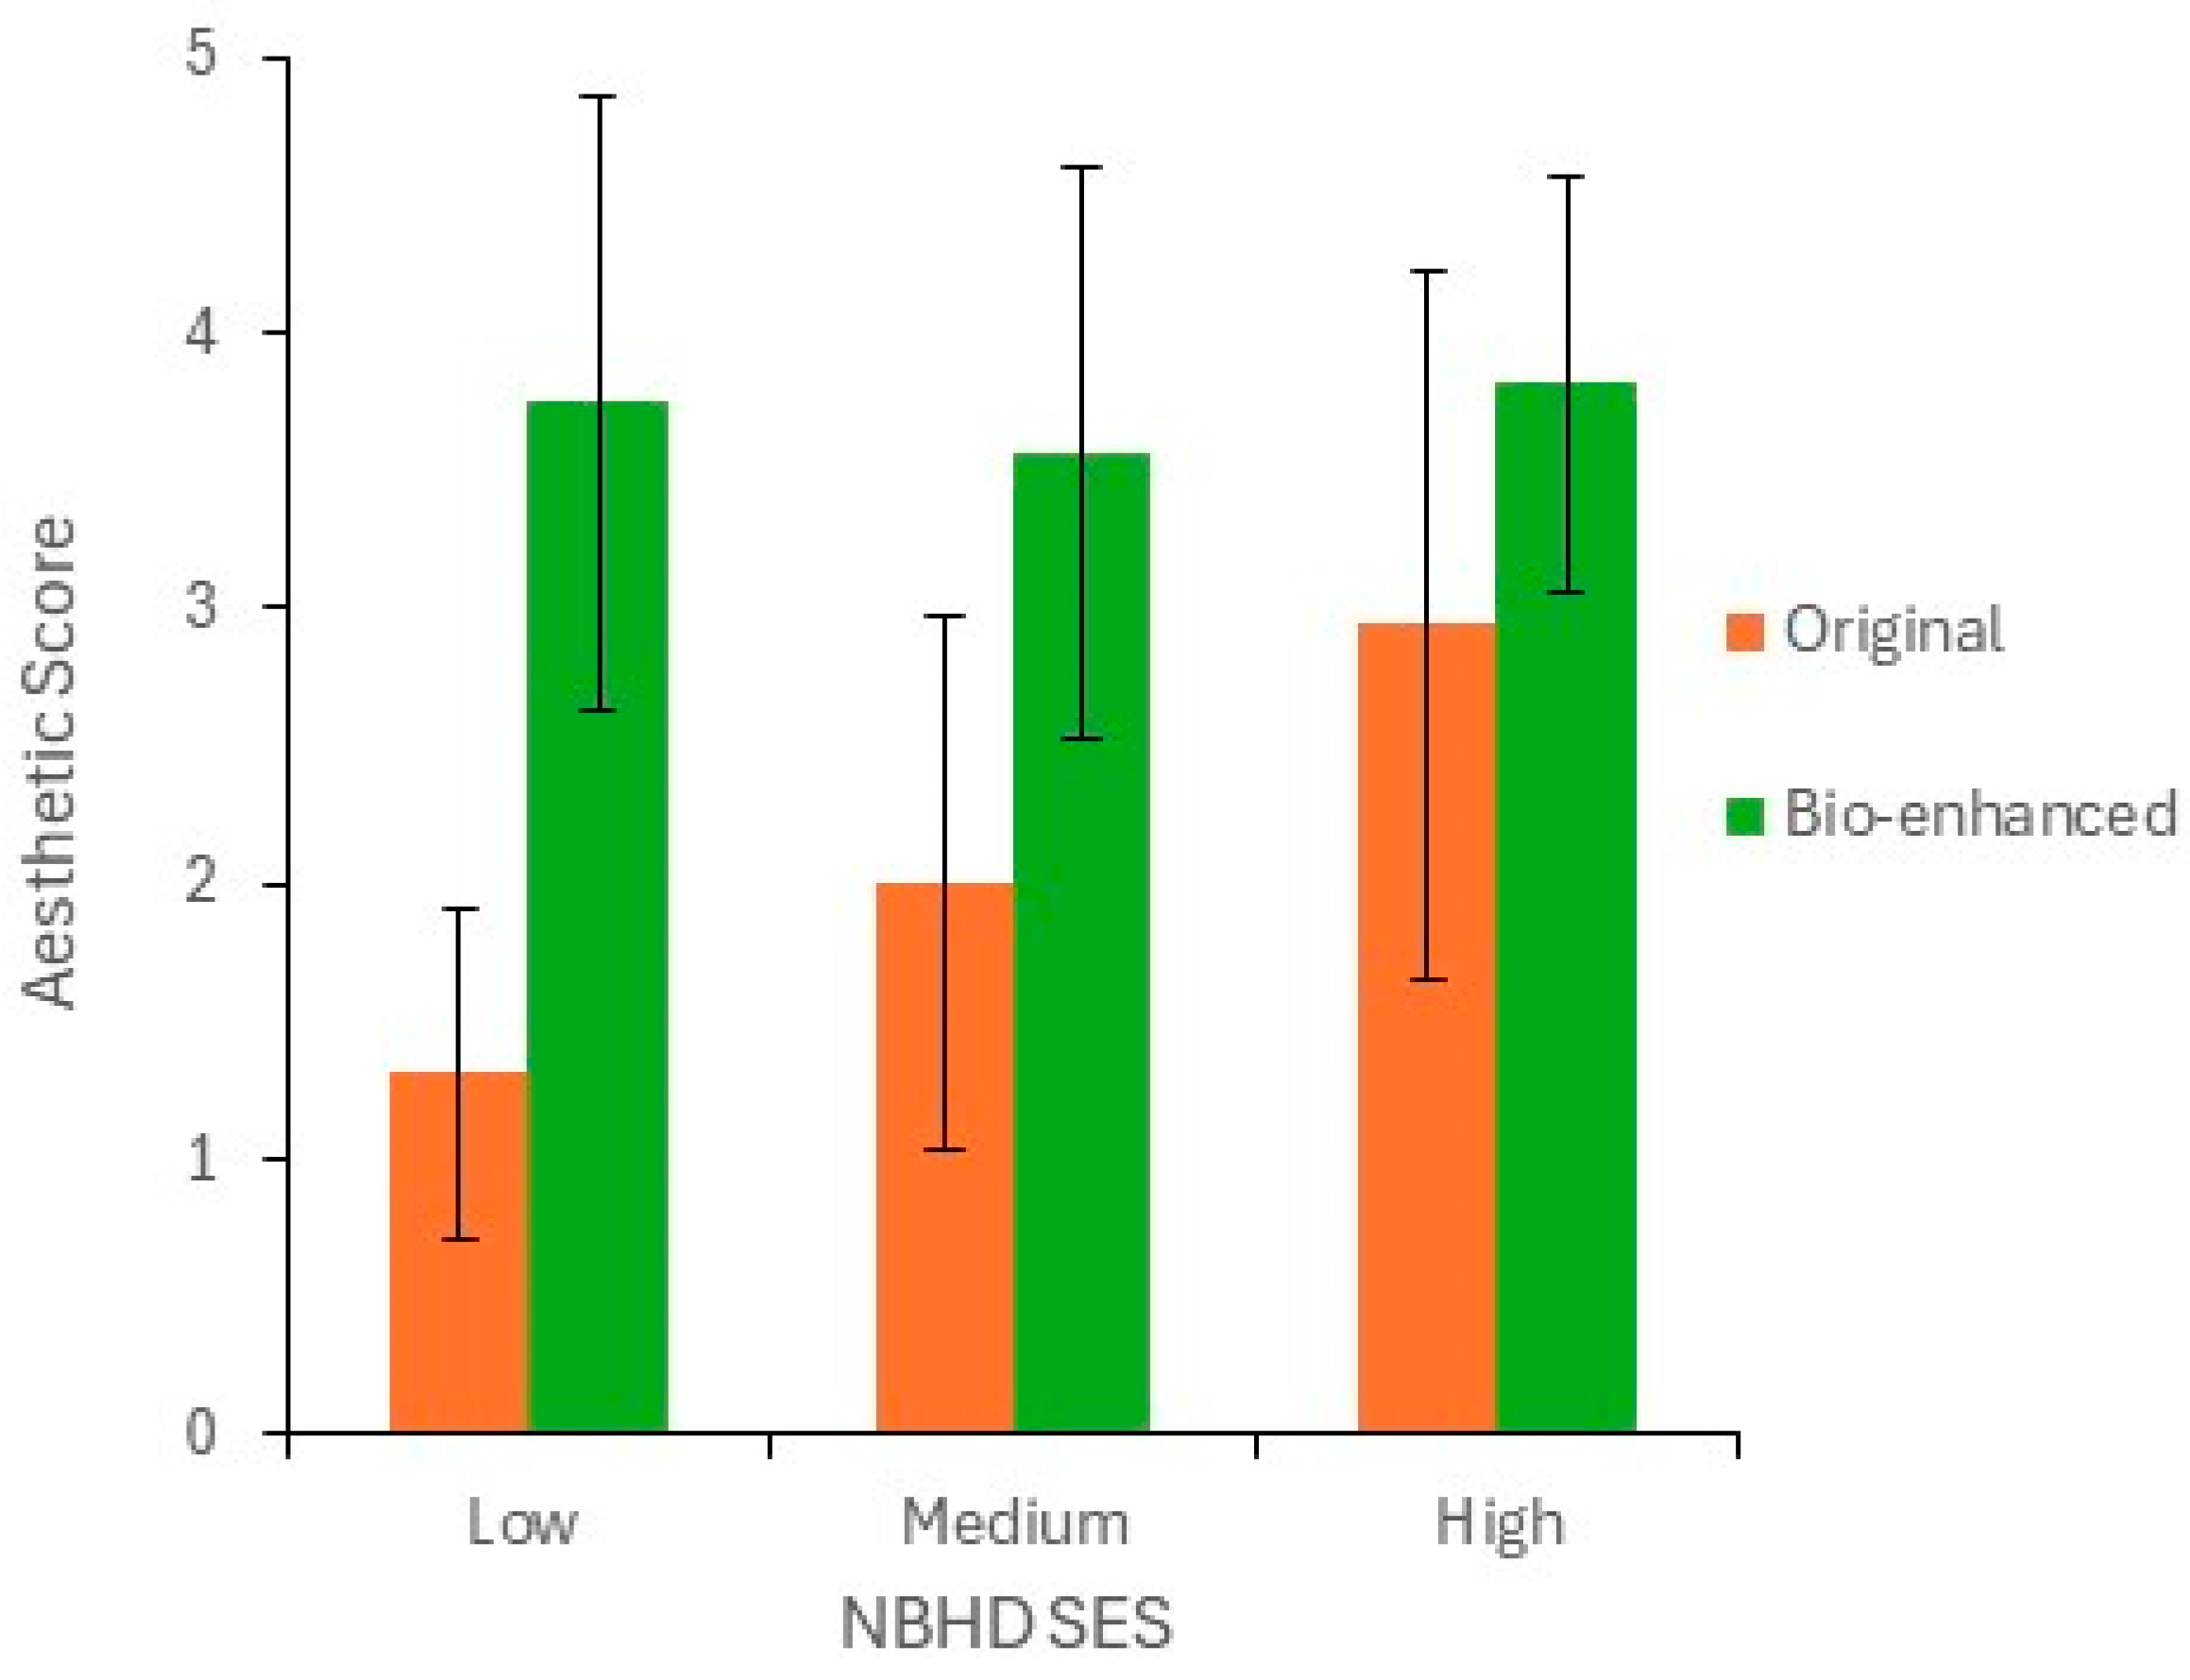
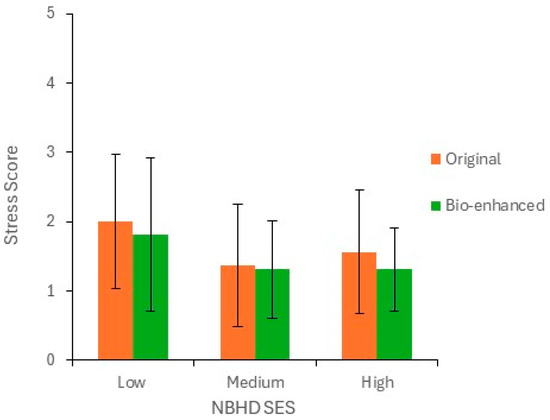
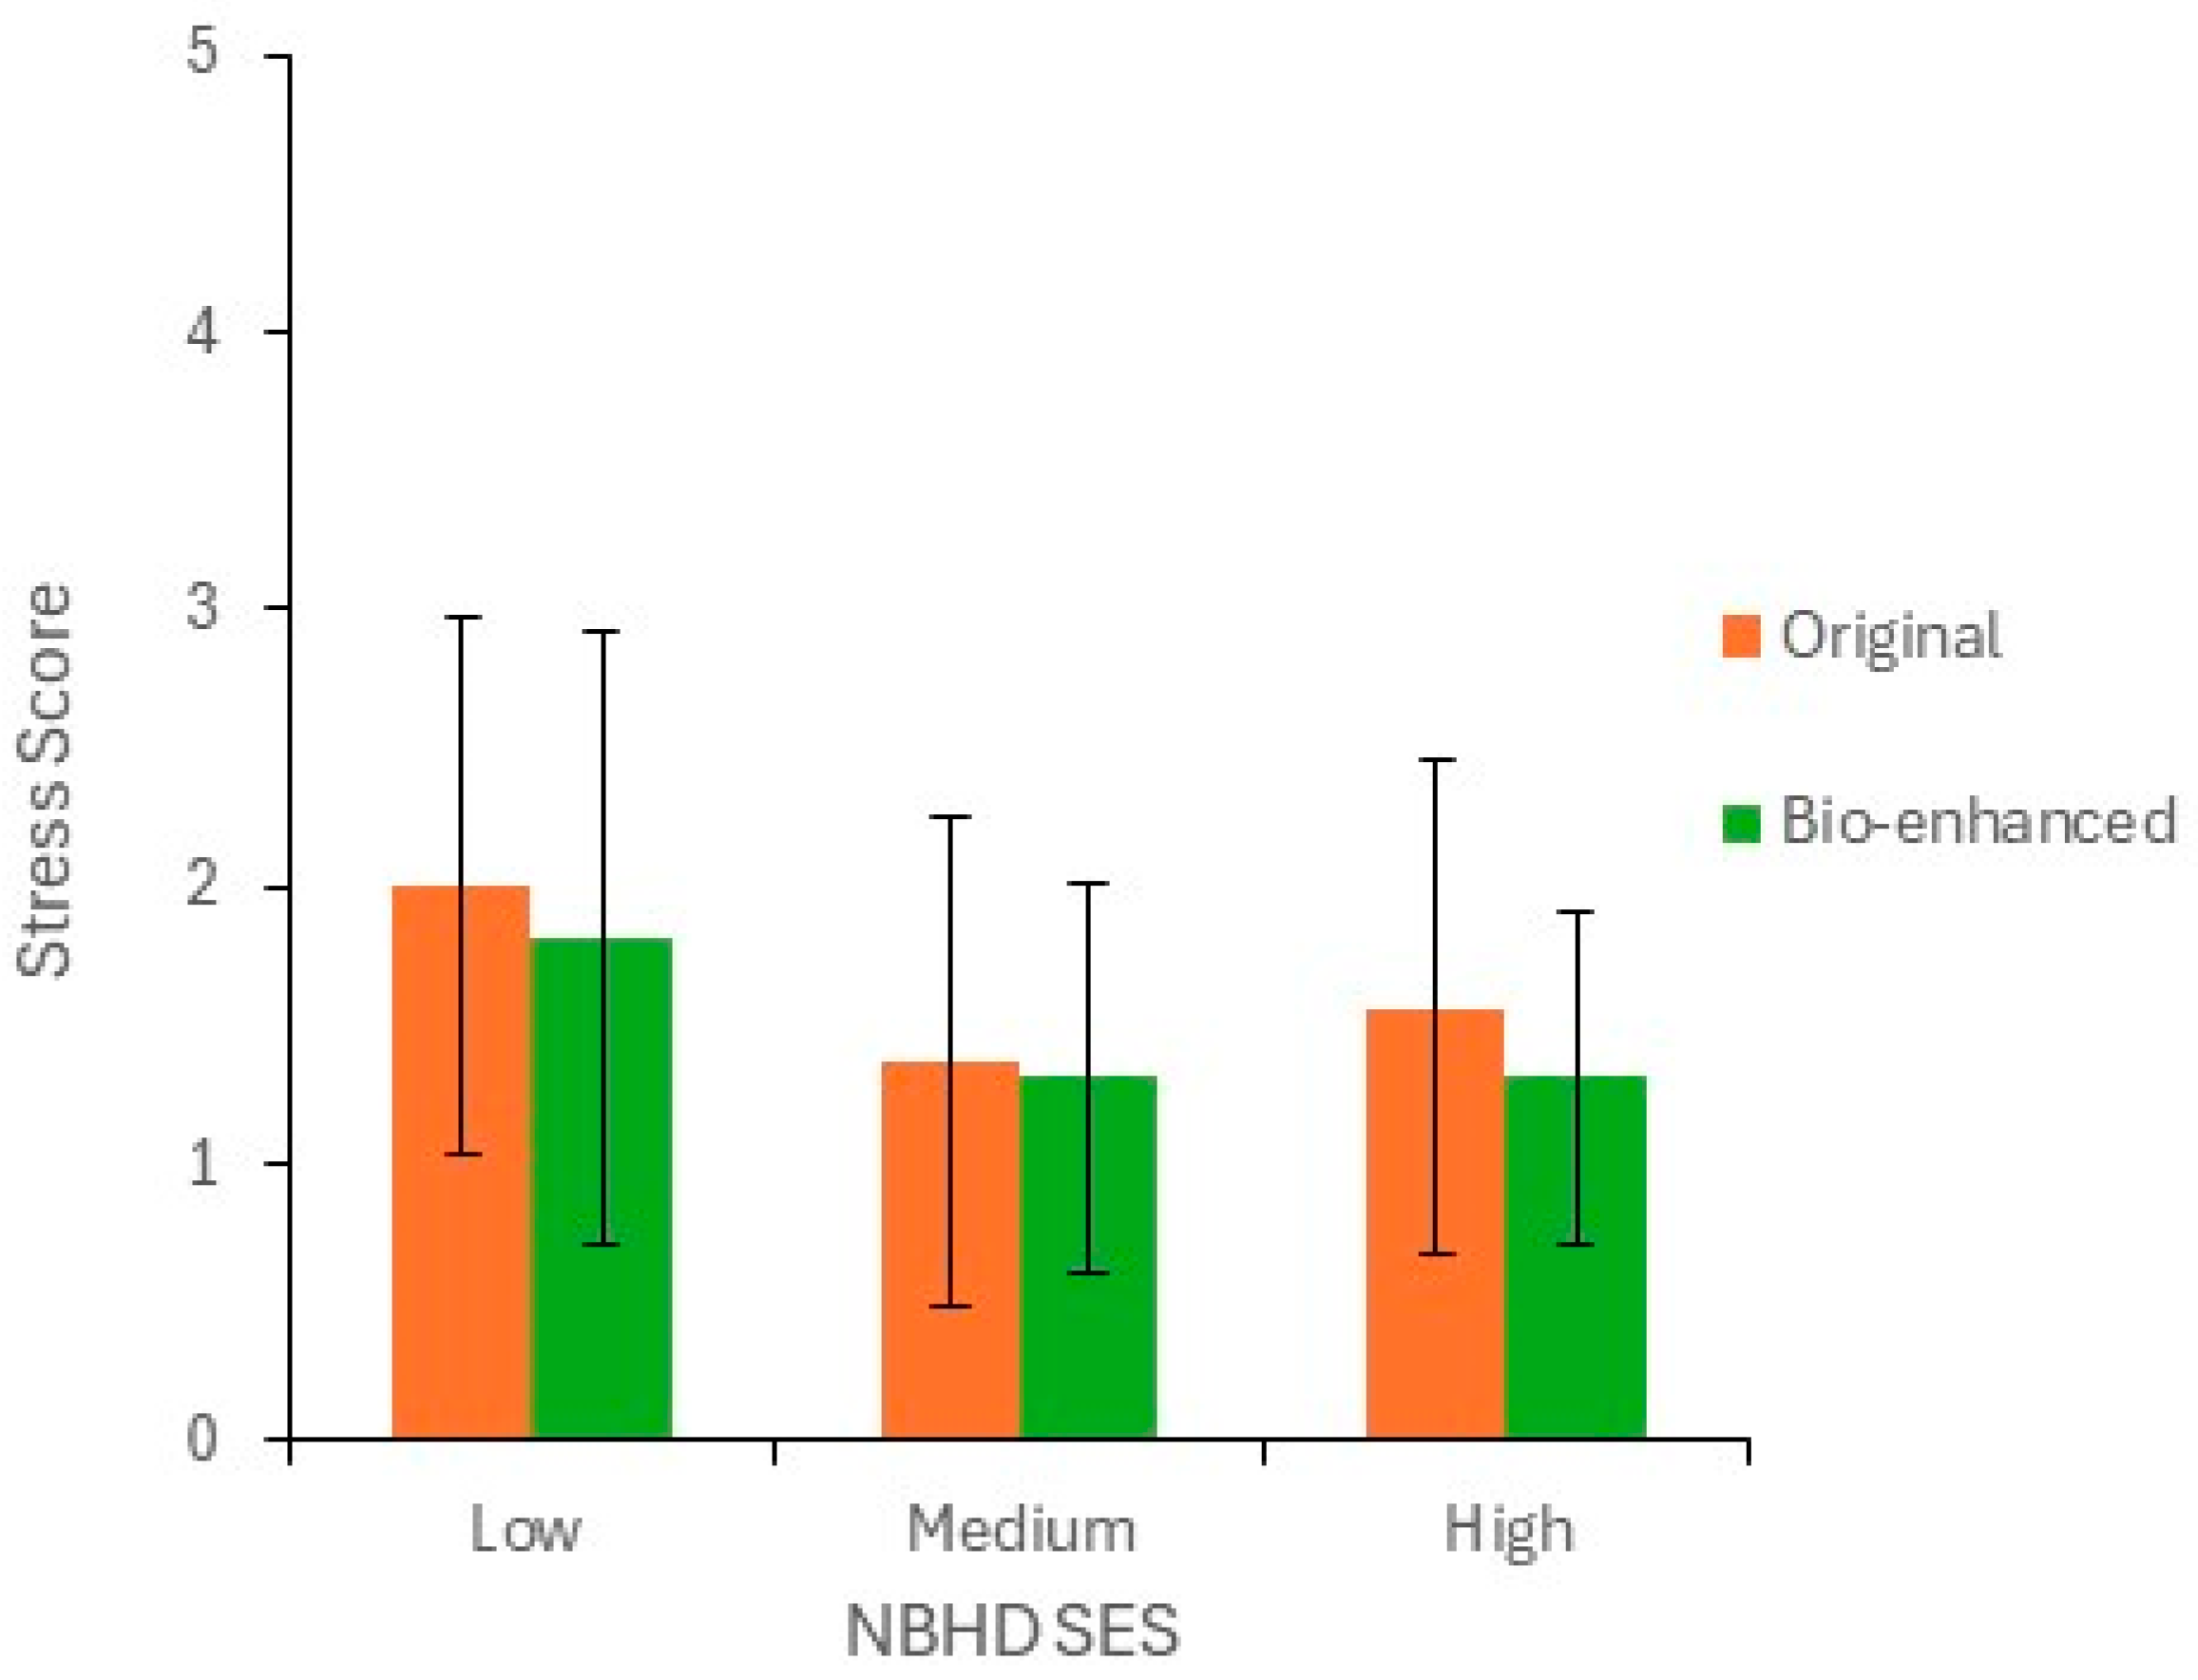
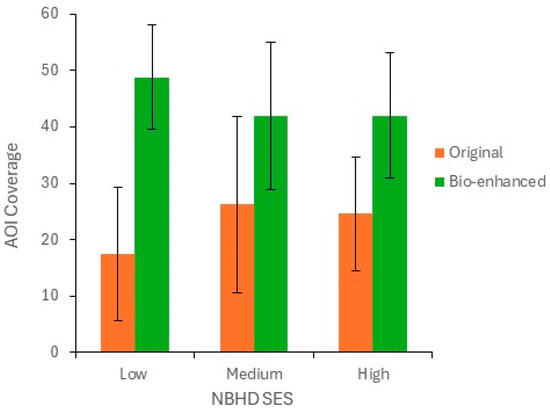
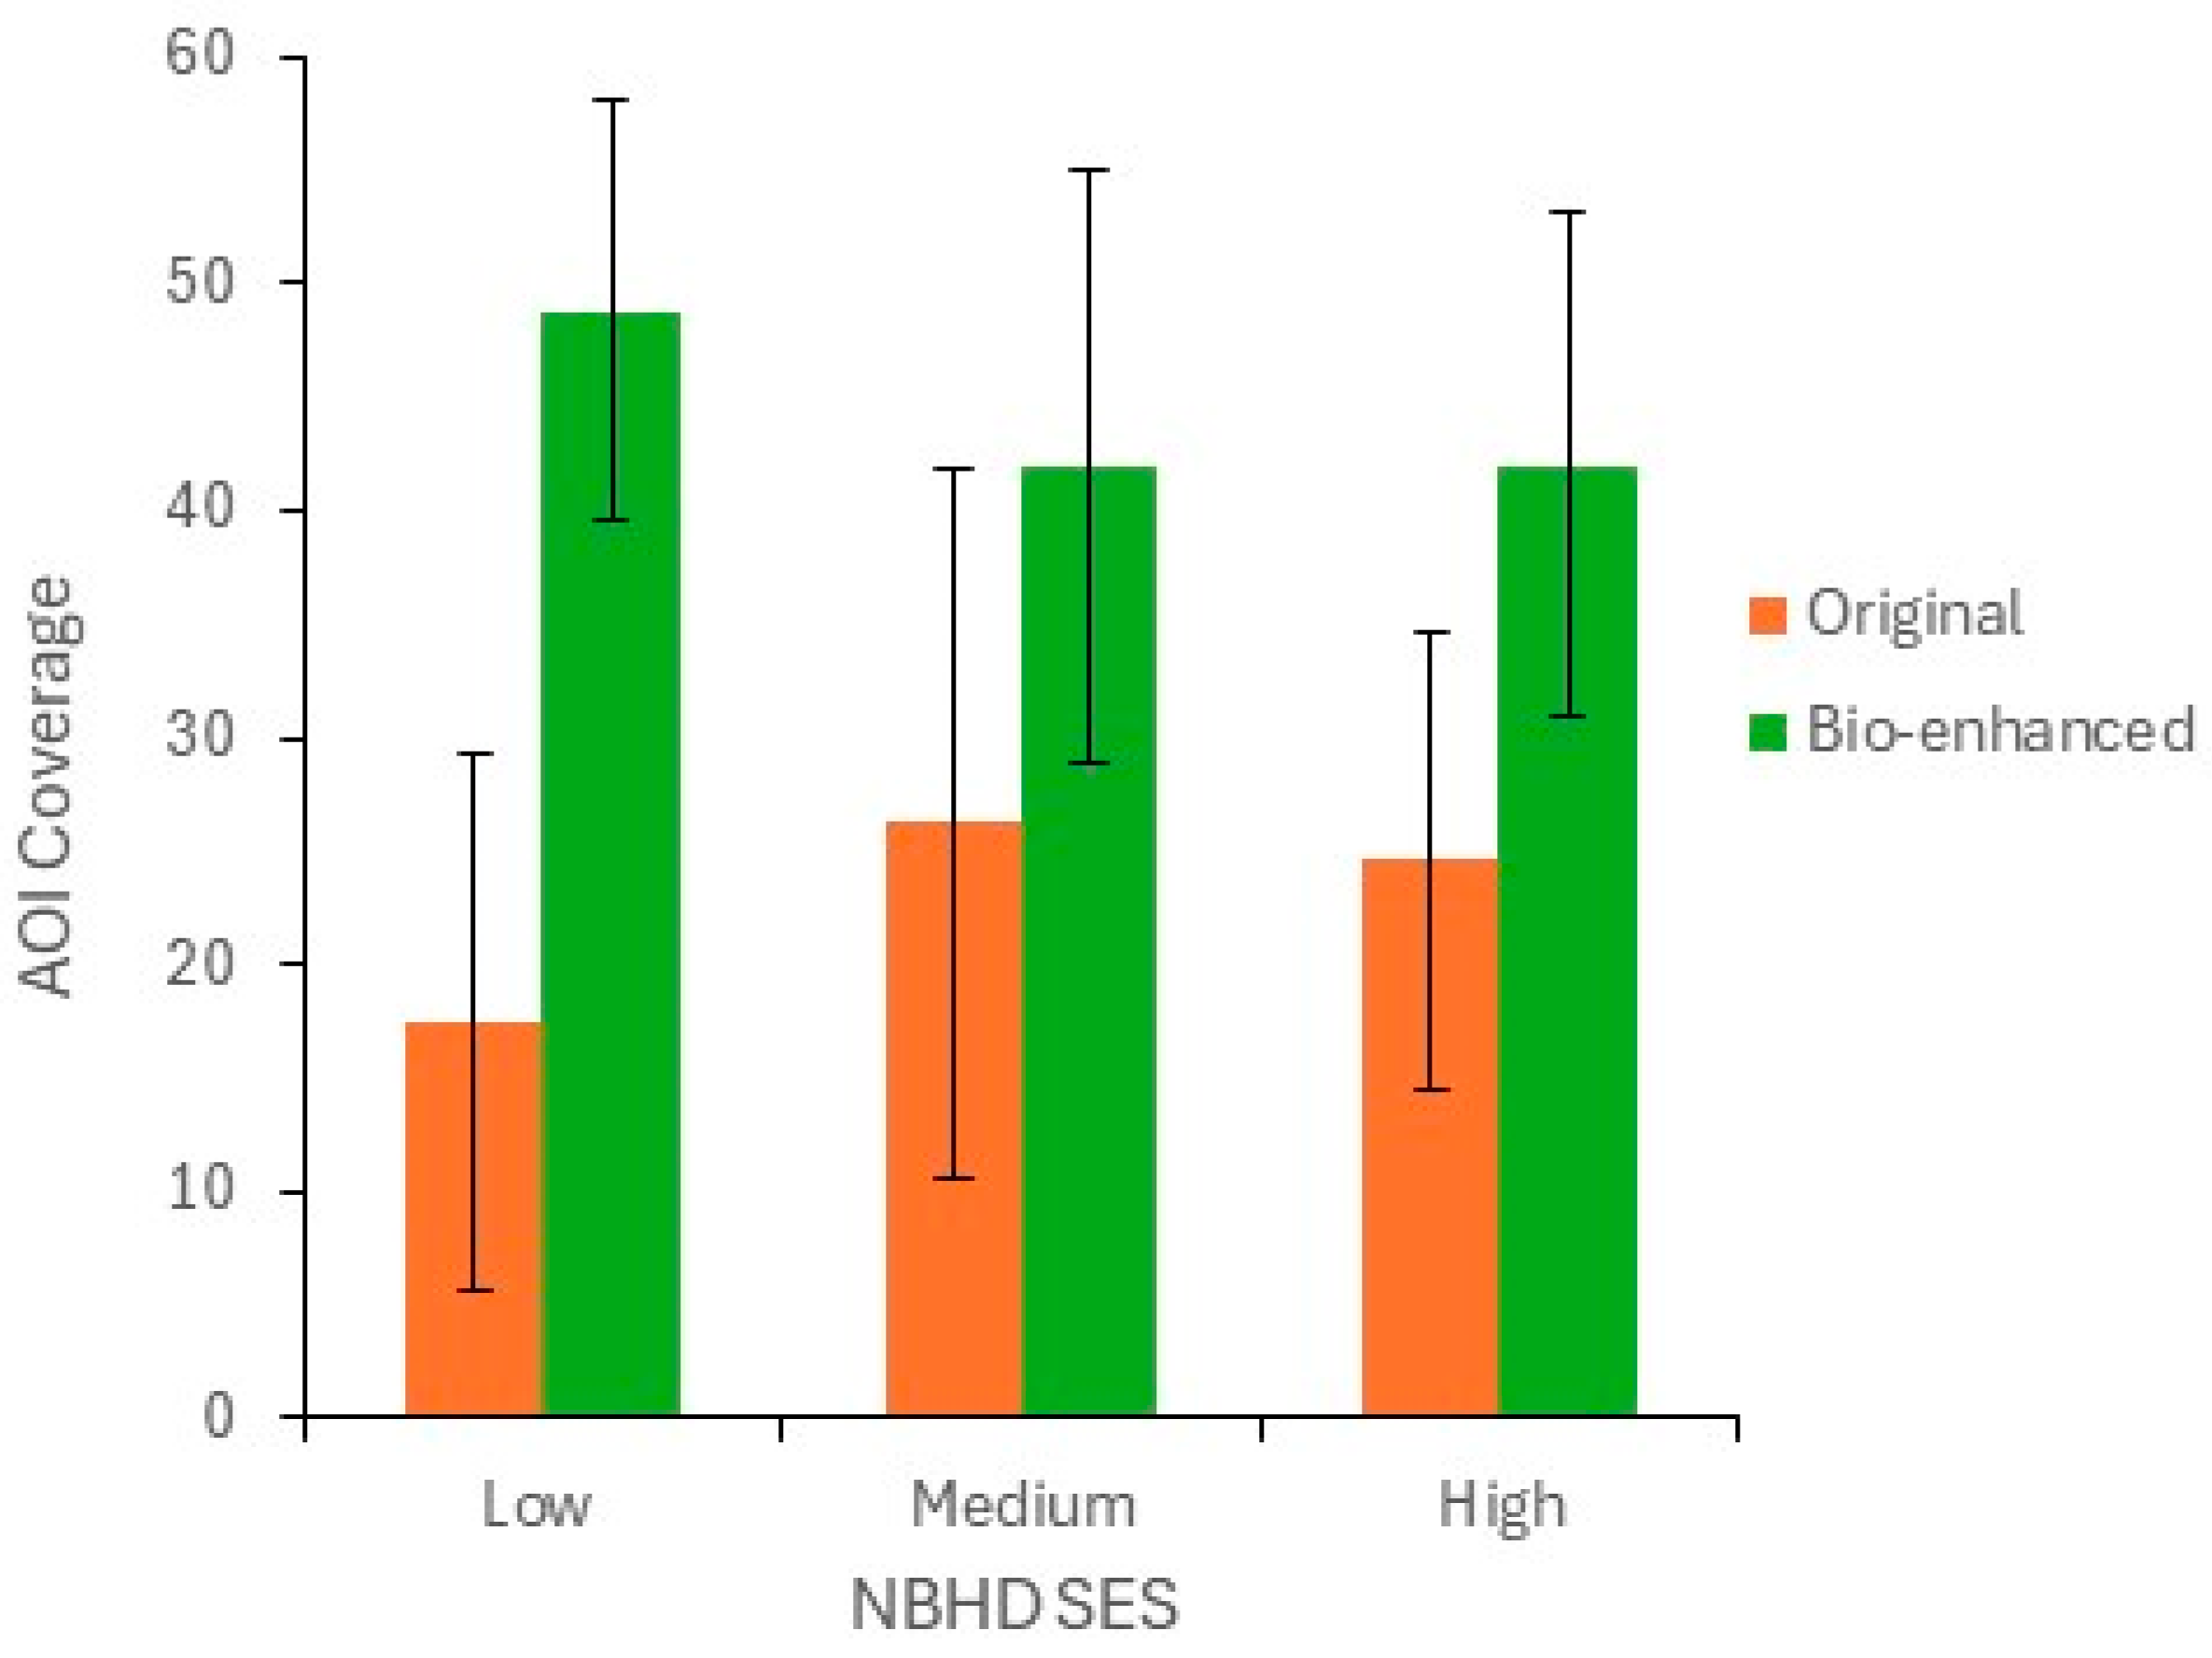
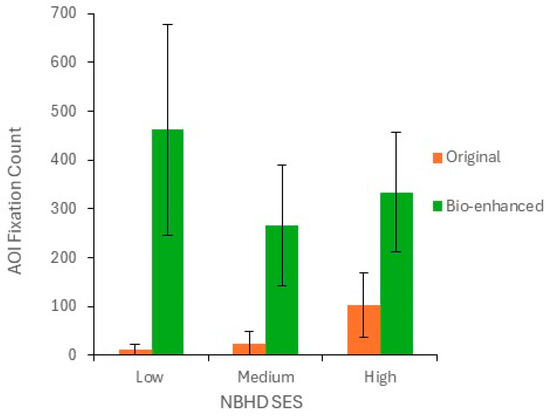
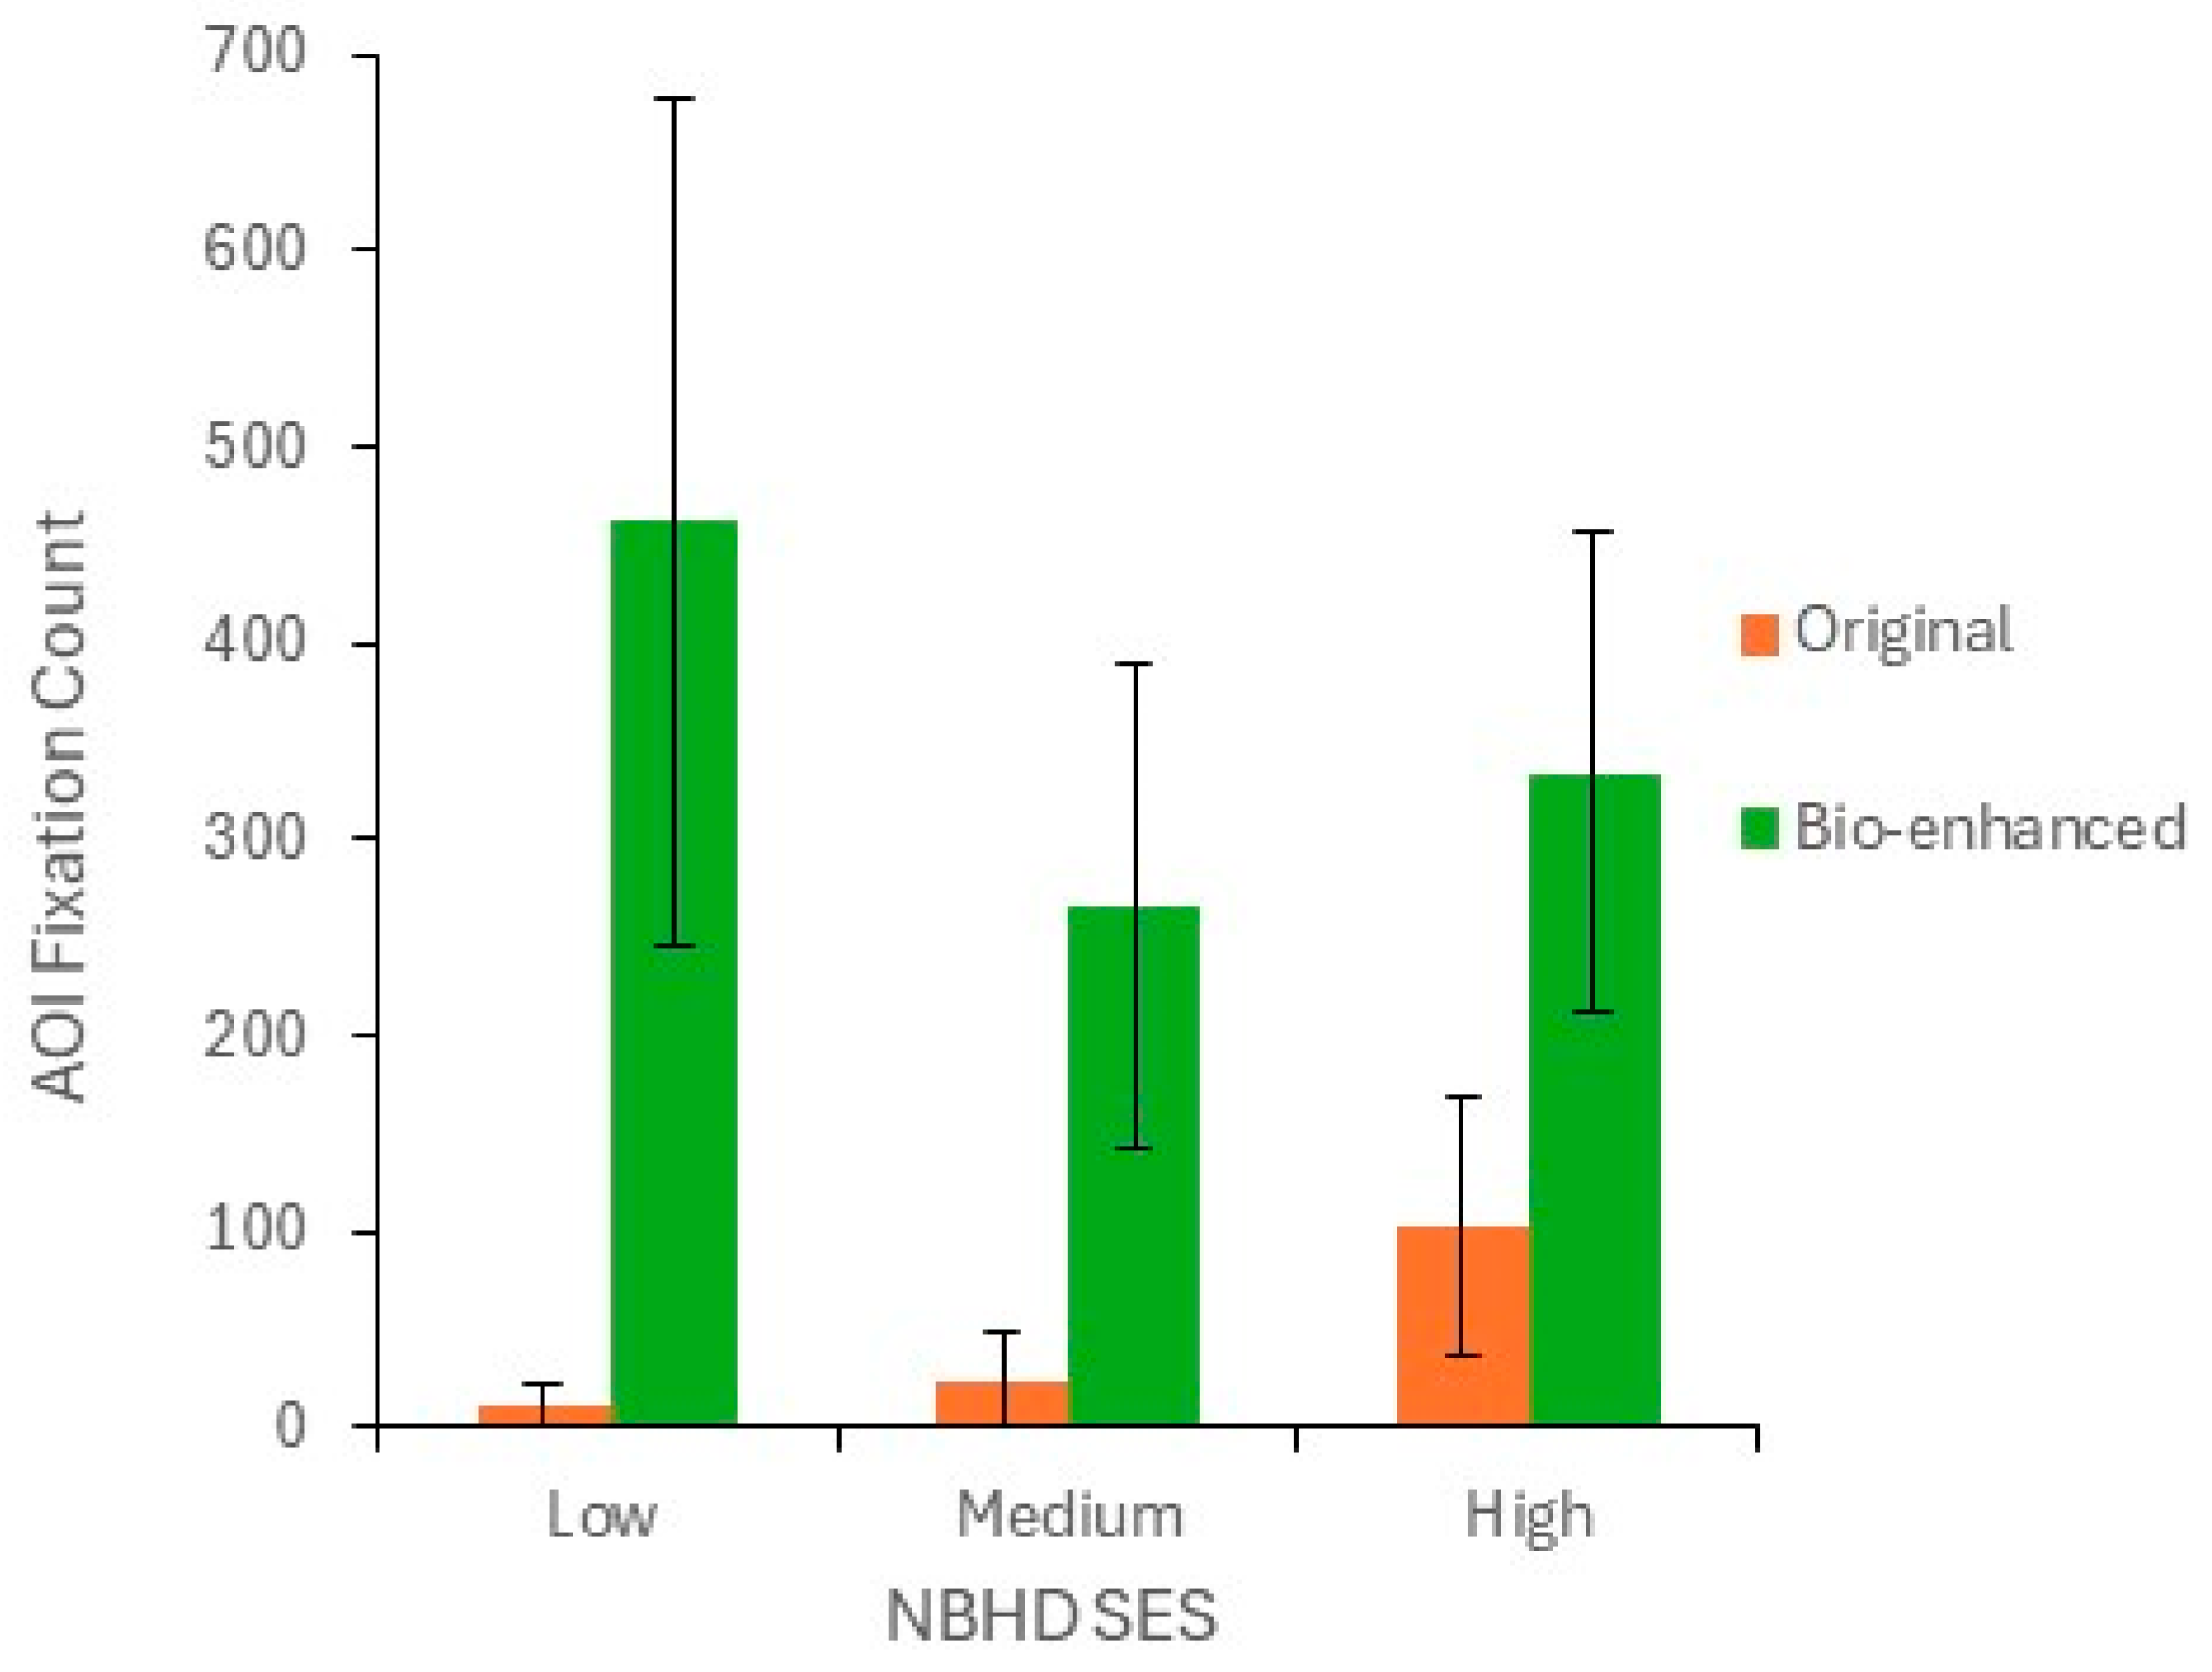
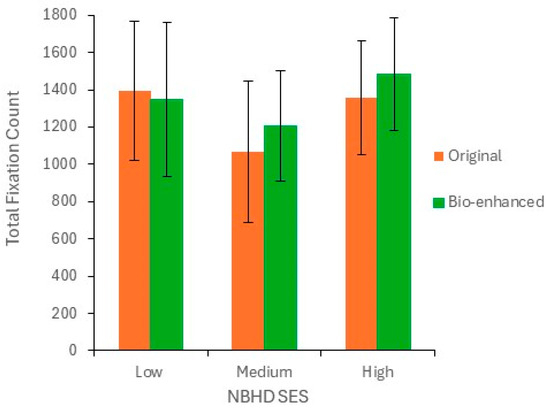
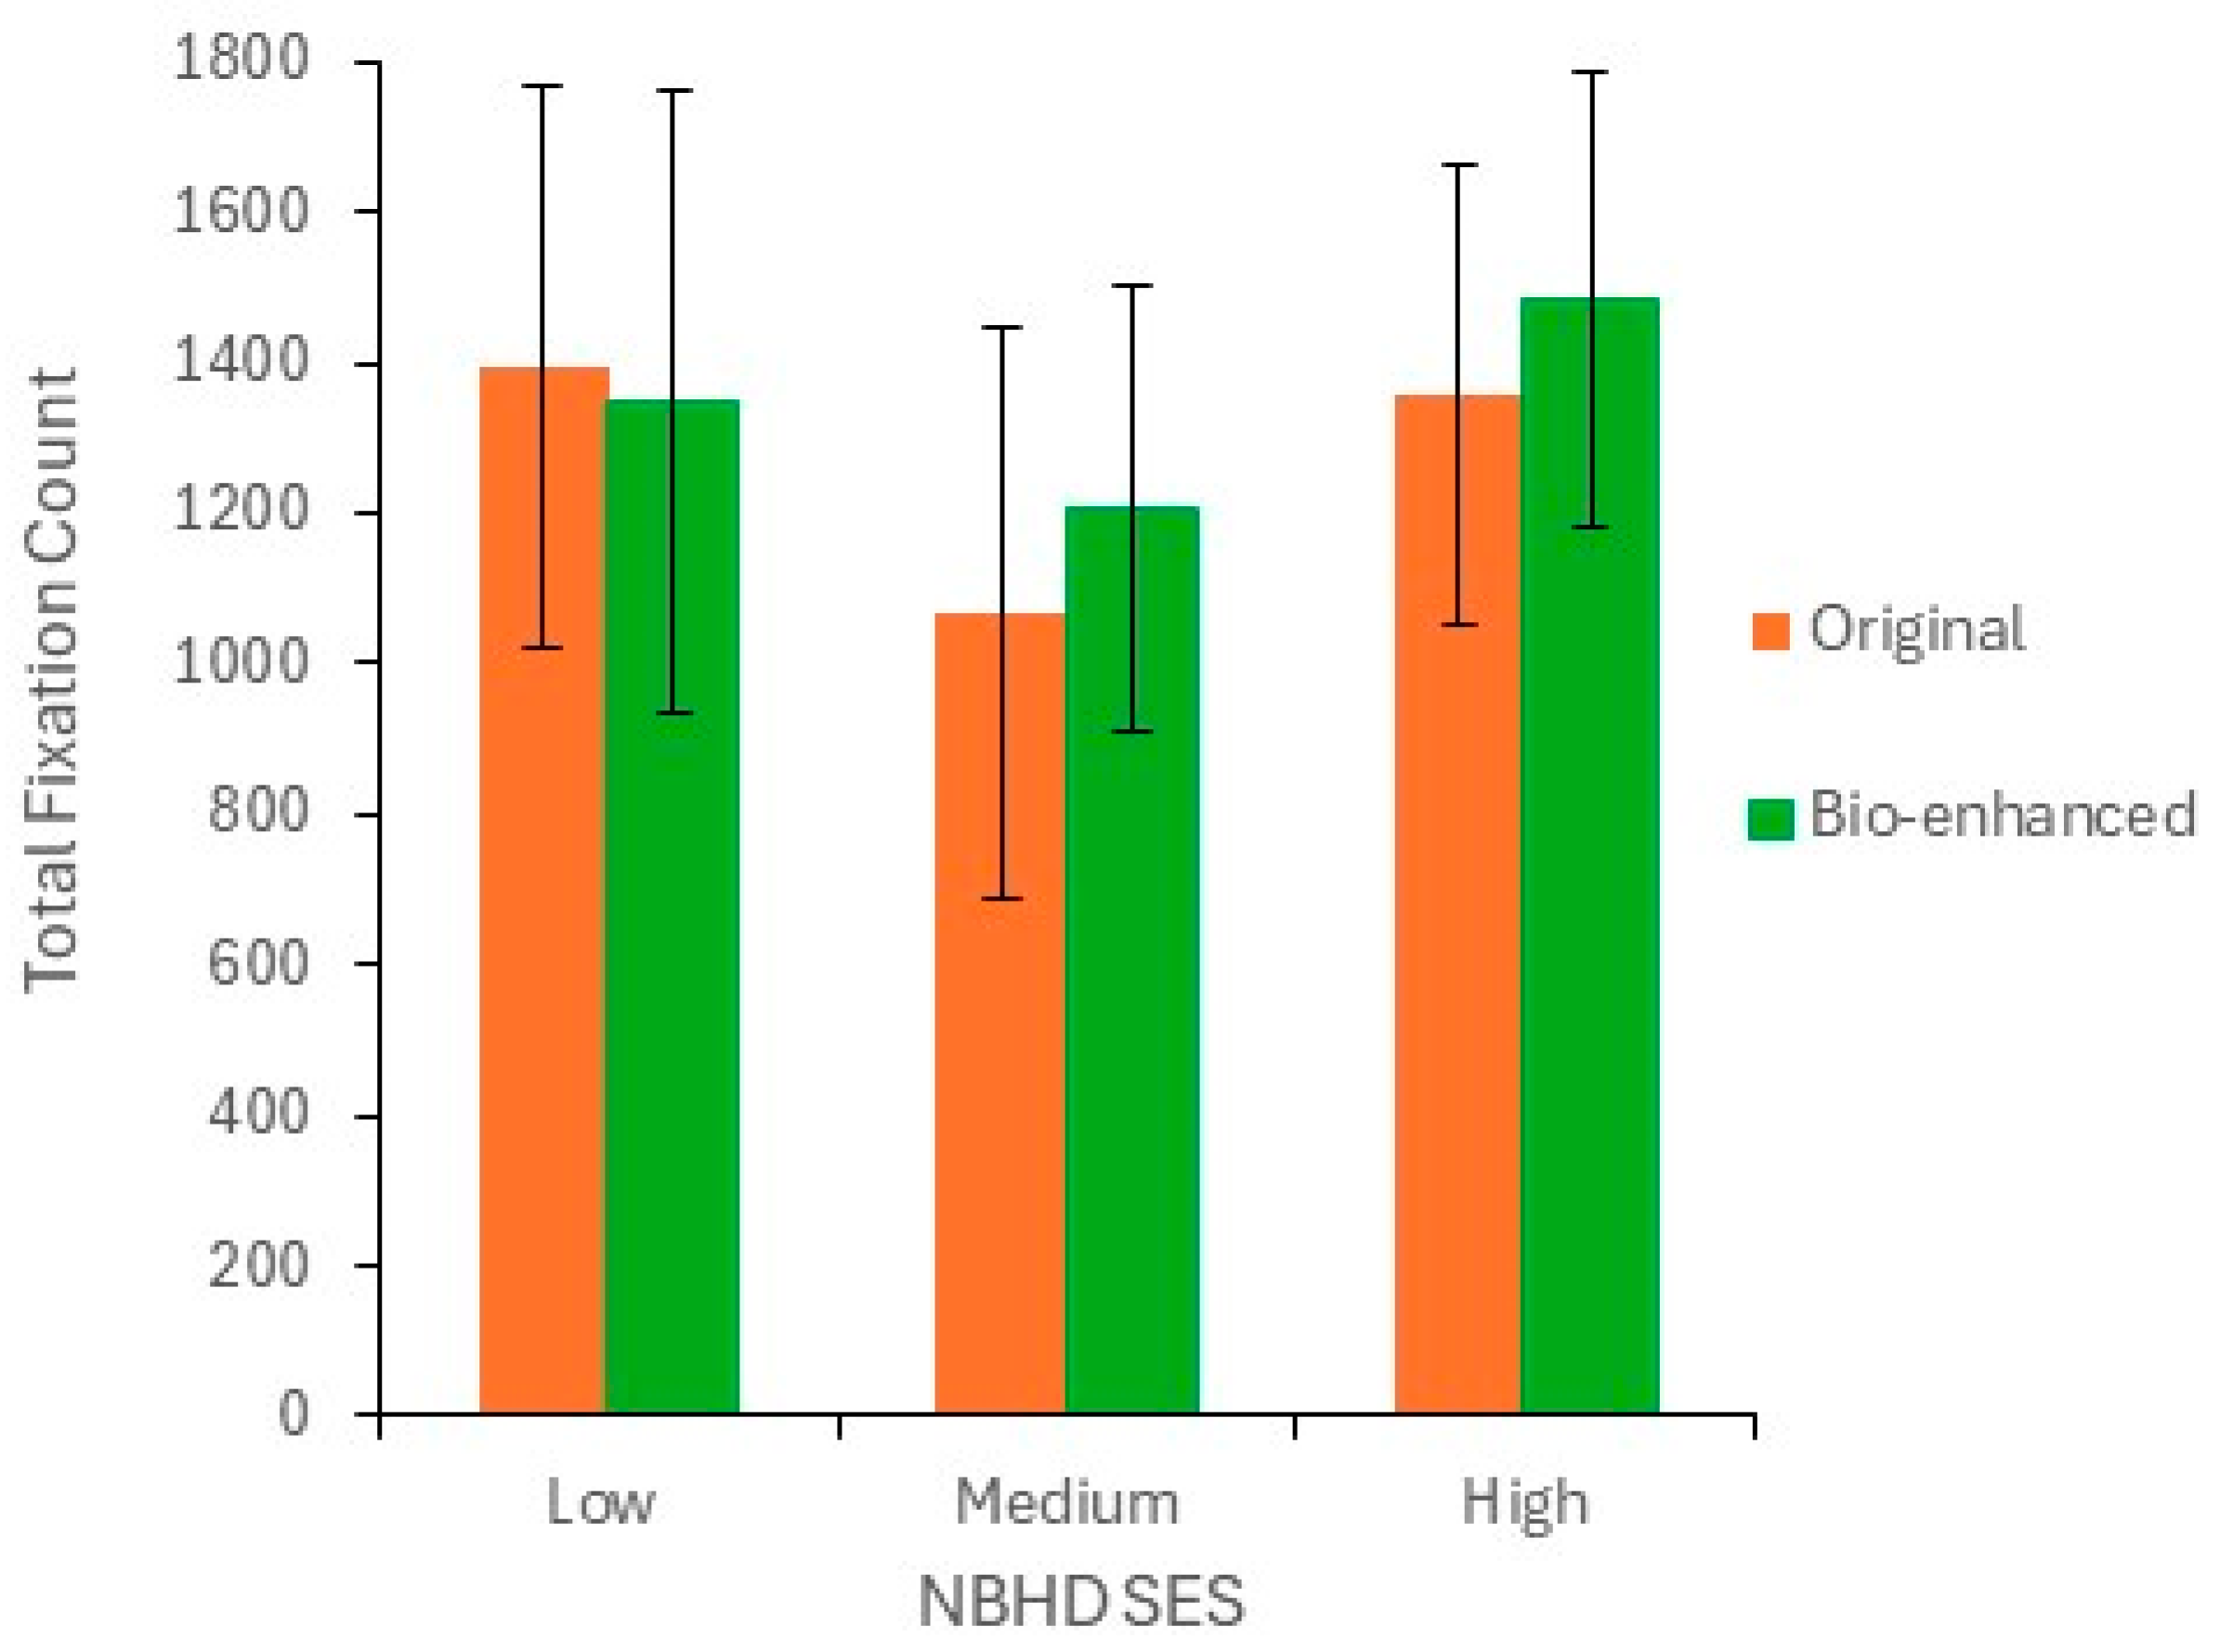
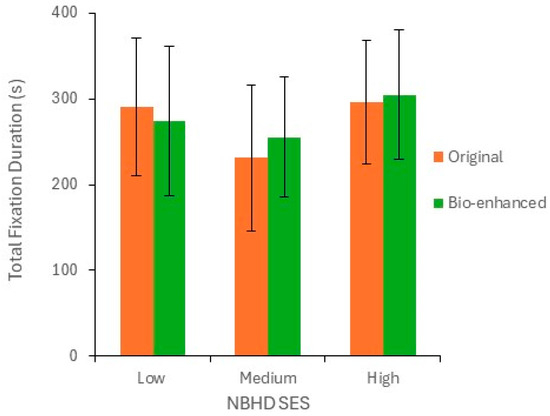
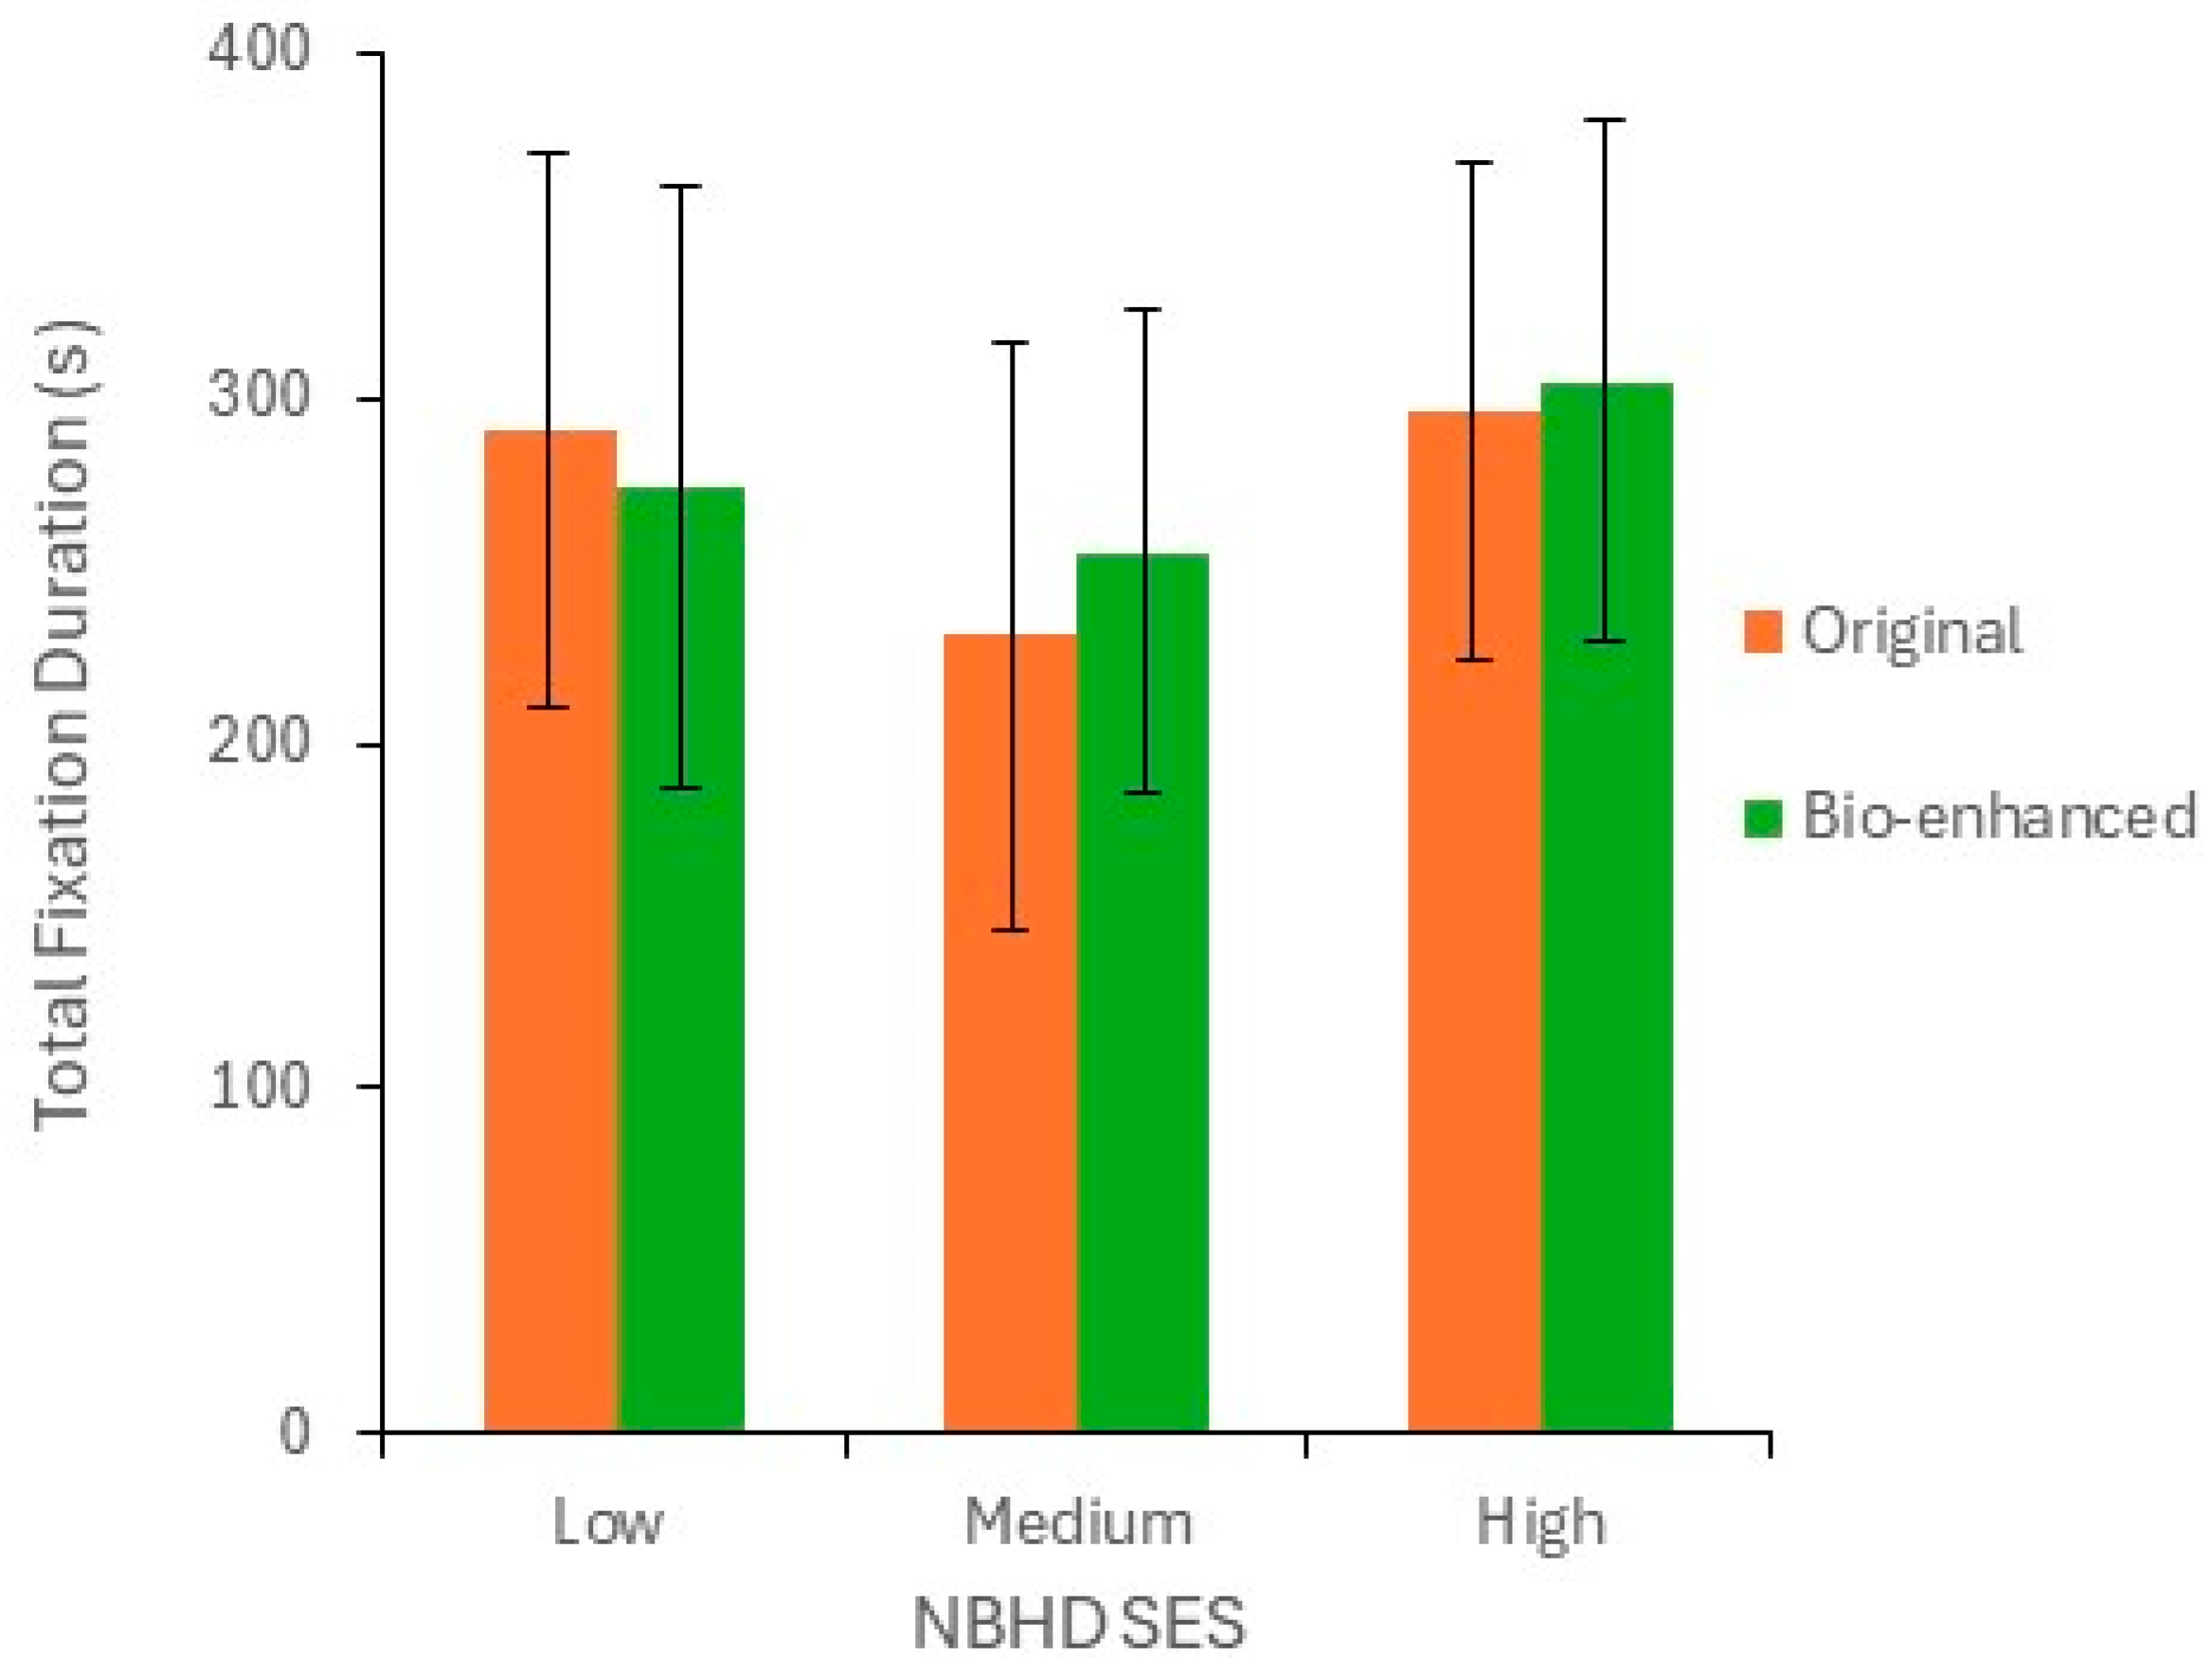
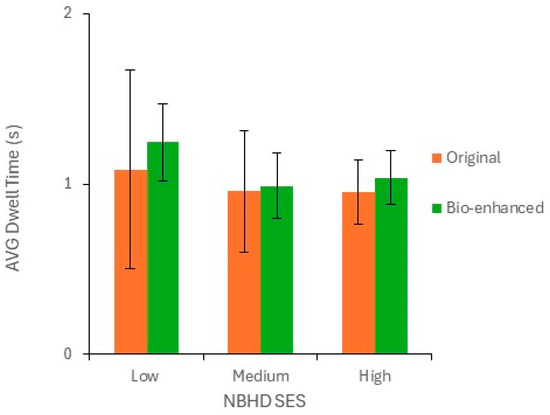
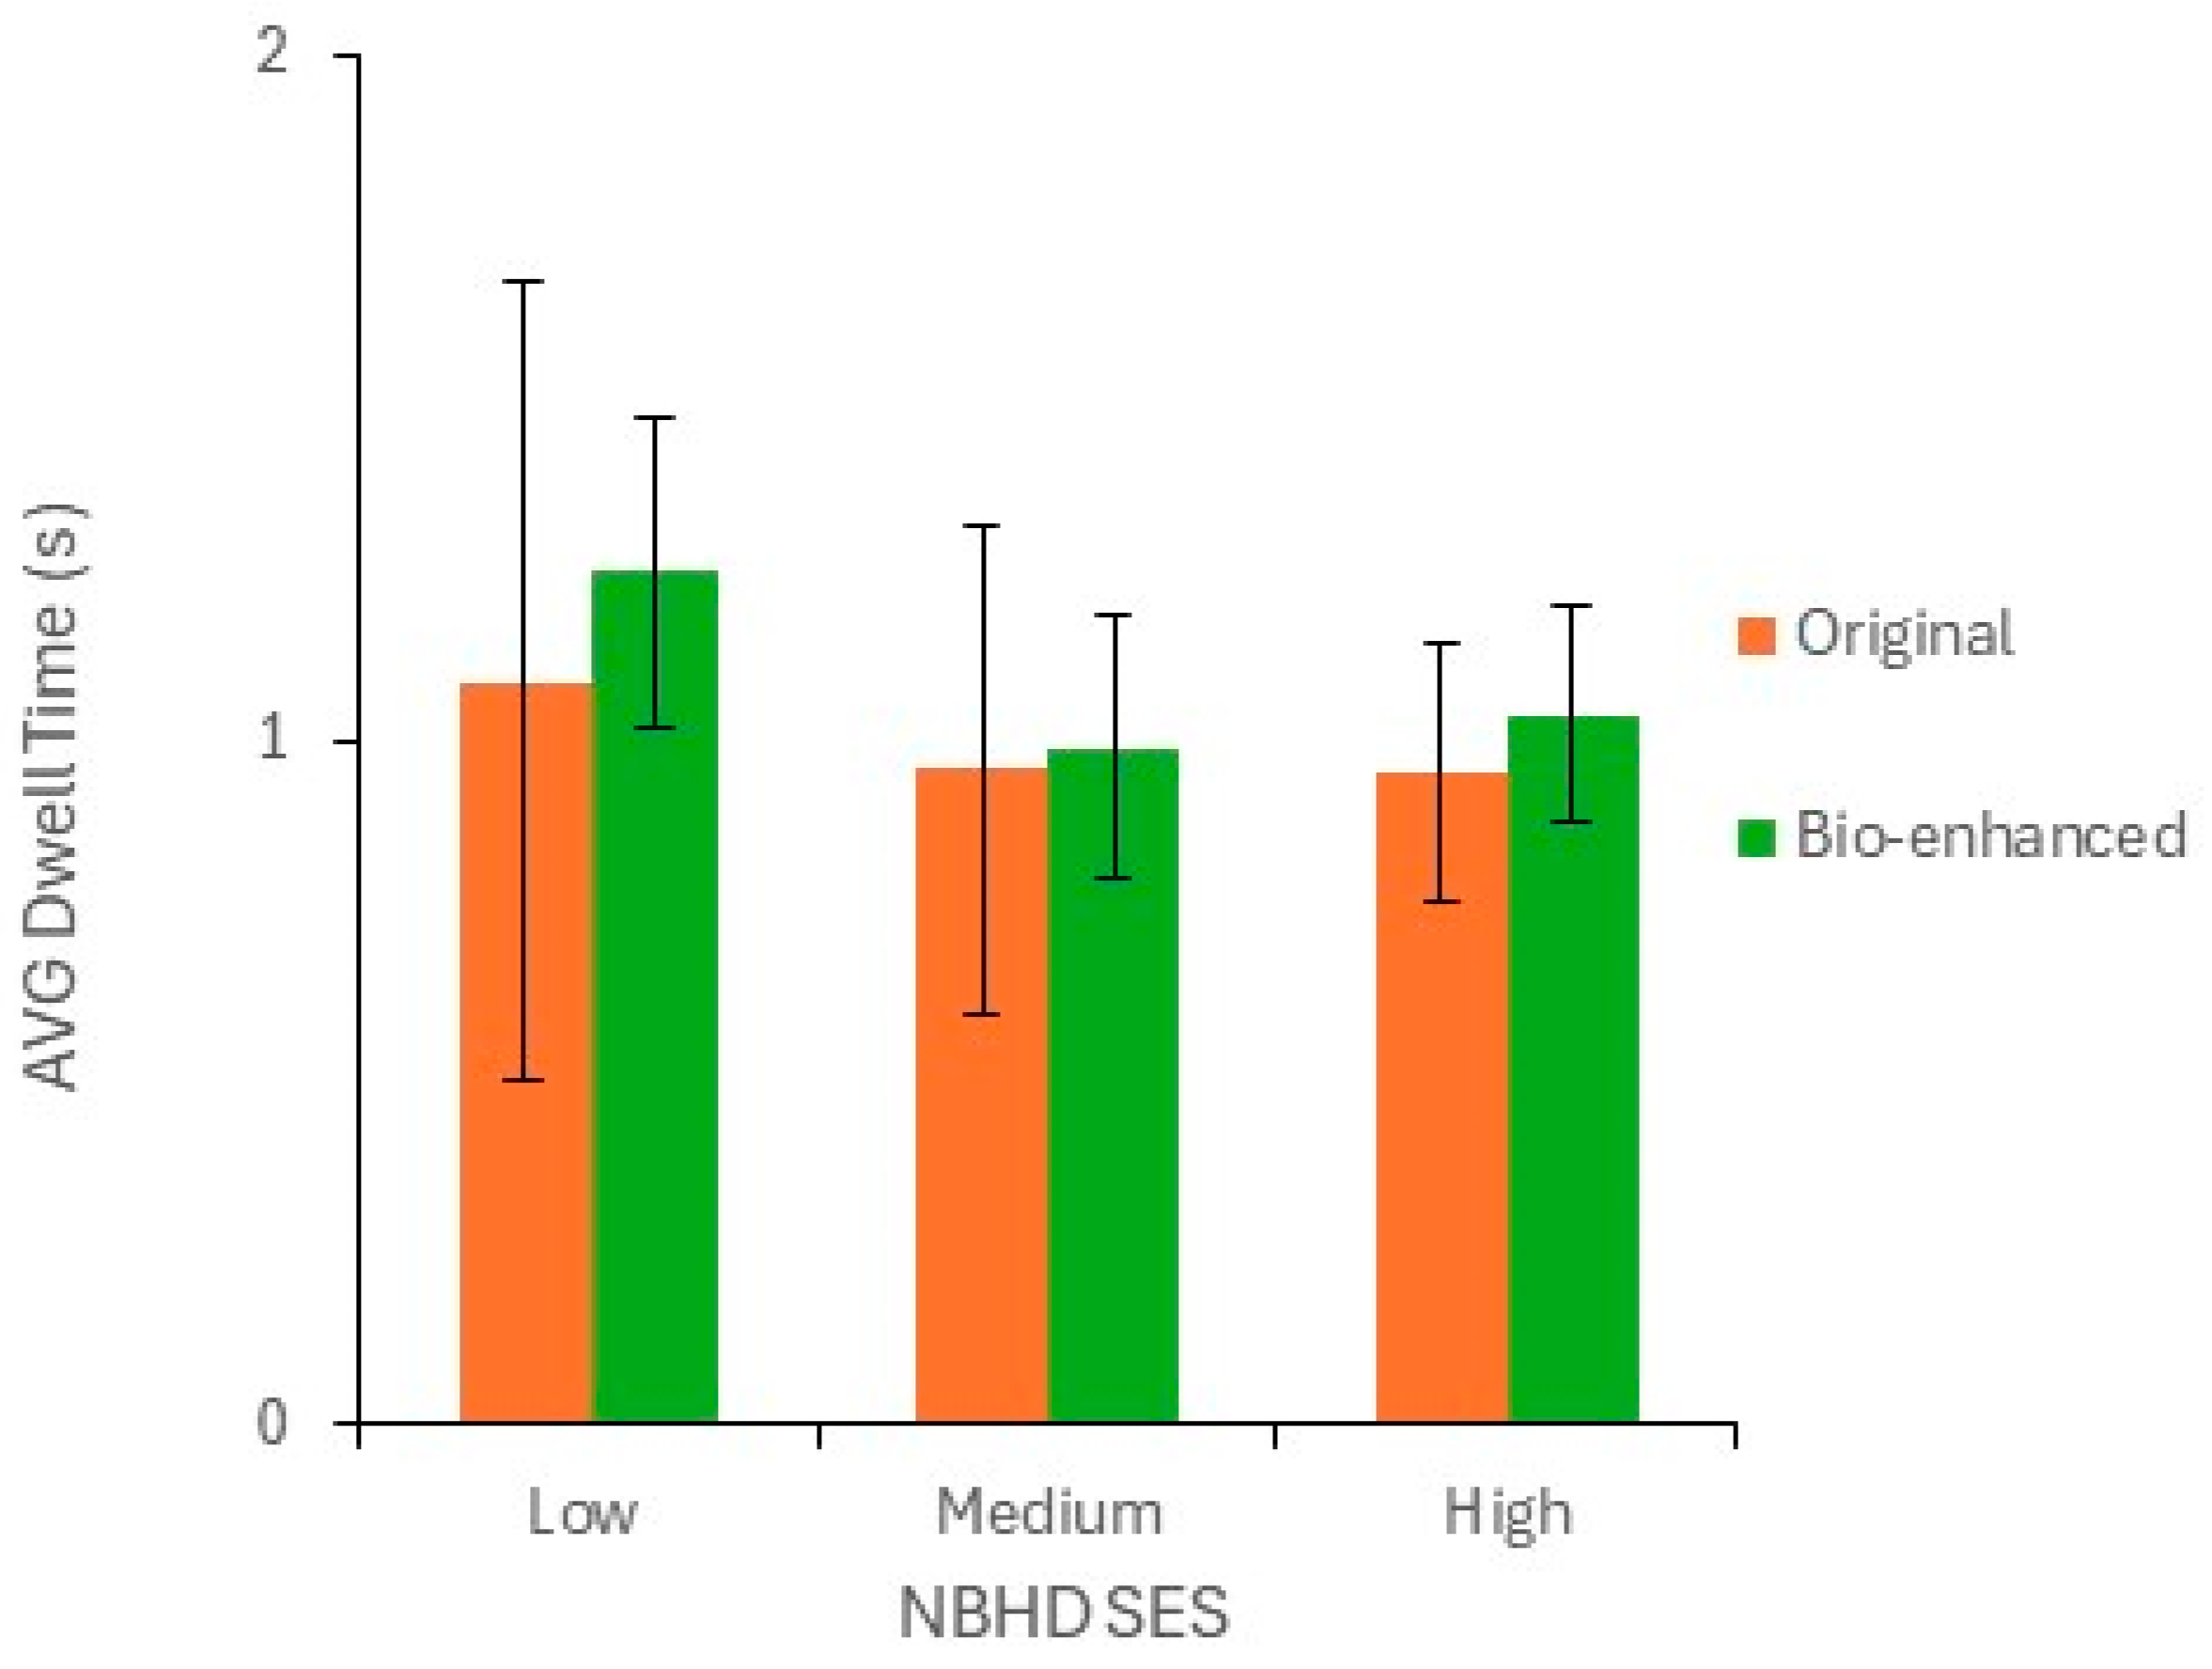
Disclaimer/Publisher’s Note: The statements, opinions and data contained in all publications are solely those of the individual author(s) and contributor(s) and not of MDPI and/or the editor(s). MDPI and/or the editor(s) disclaim responsibility for any injury to people or property resulting from any ideas, methods, instructions or products referred to in the content. |
© 2026 by the authors. Licensee MDPI, Basel, Switzerland. This article is an open access article distributed under the terms and conditions of the Creative Commons Attribution (CC BY) license.