


Abstract
With the escalating frequency of sophisticated zero-day attacks, overcoming the critical limitations of signature-based Intrusion Detection Systems (IDSs) has become paramount. This study proposes a hybrid multi-layered intrusion detection framework combining traditional machine learning, Deep Neural Architectures (DenseNN), and ensemble methods to evaluate zero-day resilience within cloud-level backend connectivity interfacing EV and V2X management ecosystems. Using the comprehensive CSE-CIC-IDS2018 benchmark as a surrogate environment, a code-executed Leave-One-Attack-Out (LOAO) cross-validation protocol across 13 distinct attack families was implemented to assess unseen-attack-family generalization within the benchmark to unseen threats. Furthermore, Explainable Artificial Intelligence (XAI) auditing, utilizing SHapley Additive exPlanations (SHAP) and Integrated Gradients, was integrated to inspect decision boundaries and resolve feature-attribution failure modes. Critically, the audit identified an artifact-driven data leakage caused by the Timestamp and identifier features, demonstrating that models learned temporal schedules rather than behavioral network signatures. Re-executing all experiments post-leakage removal quantified performance drops across all classifiers (e.g., Gaussian NB dropping by up to 20.88 percentage points in accuracy (at the 60% training ratio; 18.30 points at the 80% ratio)). Under standard binary classification metrics, tree ensembles (Random Forest and Extra Trees) achieved high in-distribution detection (F1 > 0.95) with rapid inference latency (≈0.05–−0.07 ms/sample). However, the rigorous LOAO evaluation revealed a substantial generalization penalty on truly unseen zero-day families (e.g., SQL Injection and Infiltration), where simpler linear models demonstrated broader generalization robustness (mean LOAO F1 = 0.397) compared with complex tree-ensemble models. By rectifying dataset leakage and benchmarking deployment trade-offs (training runtime, throughput, and memory footprint), this study delivers actionable, transparent guidelines for deployment-oriented IDS evaluation in dynamic network infrastructures.
1. Introduction
Modern Electric Vehicle (EV) ecosystems are now highly dependent on cloud infrastructure, telematics, and Vehicle-to-Everything (V2X) communication interfaces and have become cyber–physical systems (CPS) [1]. These architectures enable vehicles to communicate with external networks, like charging stations and smart grids, using standard IT protocols, which increases the attack surface [2]. This means that attacks on these backend network infrastructures can penetrate and cause direct physical effects to safety-critical functions such as battery management and energy distribution, bypassing traditional vehicular firewalls [3].
These complex interdependent systems are vulnerable to advanced cyber attacks, especially to zero-day attacks that are based on software vulnerabilities that have not yet been identified or patched, and thus do not have an official signature [4]. In this context a zero-day exploit may be able to exploit new vulnerabilities in cloud-based APIs or in the communication protocols between the cloud and the backend, alter the telemetry or falsify the system’s records without producing traditional alarms [3]. Traditional network Intrusion Detection Systems (IDSs) are mostly signature- or fixed anomaly-based. They are effective against known threats, but they are less effective against the unpredictability of zero-day exploits and can have extremely high False-Negative Rates when the attacker is able to create payloads that are statistically normal [5]. Additionally, these traditional systems are labor-intensive and require manual updates, which is not feasible for high-throughput, high-velocity environments. This is a gap that requires adaptive, intelligence-based security monitors that can generalize beyond a set of pre-existing signatures to detect unseen network anomalies in real time.
2. Related Work
The cybersecurity research landscape has changed dramatically, moving from in-vehicle monitoring to protection of wide-ranging external IT environments. Today’s network-based Intrusion Detection Systems (IDS) are concerned with cloud and charging communication channels, and they use the analysis of packet flows and protocol metadata to identify anomalies. Classical machine learning algorithms like Random Forest (RF) and Support Vector Machines (SVM) have been found to be effective in classifying known threats in a controlled environment [6]. At the same time, deep learning architectures have become popular due to their capacity to learn non-linear, complex features directly from high-dimensional network traffic without the need for handcrafted features [7,8].
However, one major weakness remains, that of being unable to detect zero-day exploits. IDS implementations based on current methods are mainly supervised learning based on a set of attack categories, such as DDoS, Brute Force, etc. This puts a fundamental limit in place: these models assume a static distribution of normal traffic and malicious traffic and are thus unable to detect new attacks that break the signature [5]. Additionally, specification-based approaches are used to verify compliance with specifications such as the Open Charge Point Protocol (OCPP), but the specification needs to be defined with extensive rules that are difficult to maintain completely in dynamic, high-throughput network environments.
These IT security problems are greatly compounded by the explosive growth of EVs. The addition of EV Supply Equipment (EVSE) and Vehicle-to-Grid (V2G) interfaces creates enormous attack surfaces with Internet connectivity. The Open Charge Point Protocol (OCPP) is the main protocol used to communicate between charging stations and central management systems, and critical vulnerabilities have been identified in the protocol that can lead to unauthorized network control over charging stations if the authentication system is not robust enough [2,3]. These risks have been further substantiated by documented attacks that have resulted in cascading effects in both IT infrastructure and power grid operations from compromised public charging networks.
Falsified data injection into smart-grid management systems and, more generally, malware propagation from compromised network endpoints to backend servers are illustrative examples of the network-centric attack vectors relevant to this threat model; the smart-grid false-data-injection case is studied in detail in [9] and IoT-to-backend malware propagation vectors more broadly are surveyed in [10]. One great concern is the remote exploitation of the Battery Management System (BMS); a successful attack could create unsafe physical conditions, including thermal runaway. The threats highlight an urgent need: to deploy powerful, intelligent, network edge-based IT security monitoring that can identify anomalous traffic before it enters the internal vehicle systems.
Recent advancements in IDS have progressively focused on addressing zero-day vulnerabilities, class imbalance, and domain transfer across complex cyber–physical and IoT ecosystems [11,12,13,14,15,16,17,18]. To capture structural traffic semantics, Jodayree et al. [11] proposed a multi-scale Transformer (PSM-HT) using finite-state machine constraints and Extreme Value Theory (EVT) calibration, achieving strong open-set zero-day generalization on IoMT benchmarks, while Nitrat et al. [12] converted traffic correlation matrices into 2D contour heatmaps using a hybrid ResNet-ViT architecture (CZ-ResViT) to enable zero-shot transfer across distinct IoT datasets. In parallel, generative adversarial models have been actively deployed to mitigate severe class skew and enrich marginal threat distributions [13,14]; for instance, Ullah et al. [13] developed a dual-head IDS with adaptive Wasserstein Generative Adversarial Network with Gradient Penalty (WGAN-GP) and SHAP explainability, validating novelty detection via a true hold-out protocol and the Zero-Day Separation (ZDS) ratio, whereas Mu et al. [14] integrated self-attention and Jensen–Shannon divergence into WGAN-GP (SA-JS-WGAN-GP) to improve synthetic diversity and out-of-distribution Leave-One-Attack-Out detection. Furthermore, multi-tier and adaptive architectures have been explored by Üstebay [15], who combined tree-based models with Isolation Forest for multi-stage IoT/EVSE anomaly screening; Hossain et al. [16], who integrated unsupervised Autoencoders, Siamese distance filtering, and Proximal Policy Optimization (PPO) reinforcement learning for zero-day defense; and Zaki and Naser [17], who designed an ensemble stacking classifier (XGBoost, KNN, SGD) paired with sparse random projection. Finally, while standard tree and gradient-boosting ensembles evaluate well on comprehensive benchmarks such as CSE-CIC-IDS2018 (as demonstrated by Coşar et al. [18]), the existing literature often emphasizes in-distribution accuracy [12,18], underscoring the critical need for our proposed framework that simultaneously purges temporal feature leakage, enforces code-executed leave one attack out (LOAO) validation, and audits deep-model feature attributions to support deployment-oriented evaluation toward zero-day readiness.
Standards such as ISO/SAE 21434:2021 have come to require constant monitoring of networks, but they fail to specify any particular technical solutions [19]. This research takes a step toward filling that void by proposing a network-based, zero-day detection approach that follows these guidelines. Importantly, the methodology uses the CSE-CIC-IDS2018 dataset as a cloud-backend network-traffic surrogate representative of EV/V2X-style infrastructure, rather than EV/V2X-specific captured traffic. The volumetric heterogeneity, encrypted flows, and diverse attack taxonomy found in CSE-CIC-IDS2018 offer a realistic benchmarking testbed because the EV charging and backend management ecosystem is, at the network level, a conventional IT cloud network built on standard internet protocols. This study uses the dataset to train models to detect attack families that it has never encountered before by using the LOAO approach, providing deployment-aware benchmarking and explainability auditing that lays the groundwork for—rather than constitutes—proactive defense for EV cyber–physical systems.
This study focuses on zero-day cyber threat detection in a cloud-backend network infrastructure representative of EV CPSs—a kind that cannot be detected by traditional IDSs because of insufficient adaptability and dependence on known attack signatures. The primary technical contributions and novel aspects of this work are summarized as follows:
- Identification and Empirical Quantification of Artifact-Driven Leakage:Unlike prior benchmark studies that report inflated near-perfect detection metrics, we systematically uncover and quantify temporal-ordering data leakage induced by the ‘Timestamp’ and flow-identifier features in multi-attack IDS datasets. We demonstrate that models memorized chronological attack schedules rather than invariant behavioral signatures, artificially boosting baseline accuracy by up to 20.88 percentage points, depending on the model and training ratio.
- Rigorous LOAO Zero-Day Protocol and Generalization Discovery:To assess unseen-attack-family generalization within this benchmark, as a stricter proxy for zero-day resilience beyond conventional in-distribution random splits, we implement a standardized, code-executed LOAO cross-validation framework across 13 distinct attack families (39 LOAO repetitions—13 held-out families × 3 repetitions each—per evaluated model, i.e., up to 195 individual model fits across the five core models). This protocol exposed a profound zero-day generalization gap: while complex tree ensembles (e.g., Random Forest and Extra Trees) excel in standard evaluations (F1 > 0.95), they suffer severe out-of-distribution collapse on novel threats (mean LOAO F1 ≈ 0.24–0.25), whereas simpler regularized linear baselines maintain significantly broader decision boundaries (mean LOAO F1 = 0.397).
- Operational XAI Auditing and Failure Mode Rectification:We provide an operational and mathematical audit of feature-attribution explainability tools (SHAP and Integrated Gradients) on deep tabular architectures (DenseNN). We identify critical attribution vulnerabilities, such as zero-importance gradient saturation artifacts caused by uncalibrated background baselines, and propose mathematically sound stratified medoid baselines to improve the reliability of feature attribution for security analysts; this corrected procedure is motivated by, but not yet validated against, the zero-attribution failure documented for DenseNN in the baseline audit (Section 4.5).
- Multi-Dimensional Deployment Trade-Off Analysis:We bridge the gap between theoretical model performance and real-world deployment viability by decoupling training runtime, per-sample inference latency, throughput, and peak memory footprint on standardized edge/cloud hardware.
3. Materials and Methods
This study compares the performance of traditional ML, DL and hybrid models in detecting anomalous behaviors and zero-day threats in network traffic. The experimental setup is based on the CSE-CIC-IDS2018 dataset which is used here as a cloud-backend network-traffic surrogate representative of the IT infrastructure that underlies modern EV cyber–physical systems (CPSs). The approach is to train the models on increasing percentages of the data (from 20% to 80%) and to use a LOAO method to see how each of these factors affects the detection accuracy, zero-day generalization, and computational latency.
3.1. Framework Architecture
The framework includes a multi-stage pipeline for ingesting network traffic, processing the data with strict data preprocessing techniques, testing various ML/DL classifiers, and providing interpretable threat intelligence through XAI. It is broken down into the following layers:
Input Layer: Enterprise TCP/IP flows from CSE-CIC-IDS2018 are used as a cloud-backend surrogate for EV/V2X management environments. Core inputs include more than 80 statistical flow features (e.g., Flow Duration, Flow Byts/s, Pkt Len Min) extracted using the CICFlowMeter-V3 tool. These features represent the envelope of the communication, and not its payload; they are essentially a representation of the communication traffic that flows between EVs, charging stations and backend management servers, regardless of the content of the communication.
Preprocessing Module: This module converts raw flow statistics into structured formats that are appropriate for algorithmic analysis. Most importantly, it resolves inherent data quality problems in network datasets by replacing infinite values (Inf) and missing data (NaN) that are often caused by zero-division errors in flow rate calculations via median imputation (Section 3.5), consistent with the data-cleaning procedure reported there. Also, StandardScaler-based normalization is performed to bring the scale of features into parity, which is crucial in cases when the distance-based models (such as KNN) or gradient-based models (such as DenseNN) are used, to avoid feature bias.
Multi-Tier Analysis Engine: This is the main engine of the framework, which systematically analyzes seven different architectures: K-Nearest Neighbors (KNN), Logistic Regression (LR), Gaussian Naive Bayes (GNB), Random Forest (RF), Extra Trees (ET), a Dense Neural Network (DenseNN) and a Hybrid ensemble (RF + ET + LR). The corrected full-ratio and Leave-One-Attack-Out analyses reported in Section 4.7 focus on the five core models (Logistic Regression, Gaussian NB, Random Forest, Extra Trees, and DenseNN); KNN is evaluated only at the 20% training ratio because of its computational cost, and the hybrid model is not included in that corrected analysis. The engine uses a hold-out evaluation methodology to simulate zero-day scenarios that includes training a model using a subset of families of known network attacks (e.g., DoS, Brute Force), and then evaluating that model against entirely new families of network attacks (e.g., Infiltration, Web Attacks) to determine its ability to isolate behavioral anomalies rather than depend on static signatures.
Evaluation and XAI Interpretation Module: This module evaluates the models’ outputs primarily via classification metrics suited to severe class imbalance (Precision, Recall, F1, Matthews Correlation Coefficient (MCC), Precision-Recall Area Under the Curve (PR-AUC), Receiver Operating Characteristic Area Under the Curve (ROC-AUC), and False Positive/Negative Rate (FPR/FNR)), rather than relying on misleading accuracy alone; continuous-error regression metrics (R2, Root Mean Squared Error (RMSE), Mean Absolute Error (MAE)) are retained as a secondary continuous-error diagnostic (not a probability-calibration measure such as Brier score or expected calibration error) (Section 4.2). At the same time, an XAI component is added to break down model decisions. This module is used to retrieve the global feature importance scores to identify specific network attributes (such as TCP state flags) that are responsible for zero-day detections, and to also use it as a diagnostic tool to flag potential data leakage artifacts (such as temporal dependencies) that may give the impression of high performance.
Operational Viability Output: The last layer combines statistical performance with computational overhead (Runtime). It detects the best candidates for deployment by optimizing for zero-day generalization capability under Leave-One-Attack-Out evaluation (high F1/MCC/PR-AUC, low FPR/FNR) and feasibility of real-time inference (low latency).
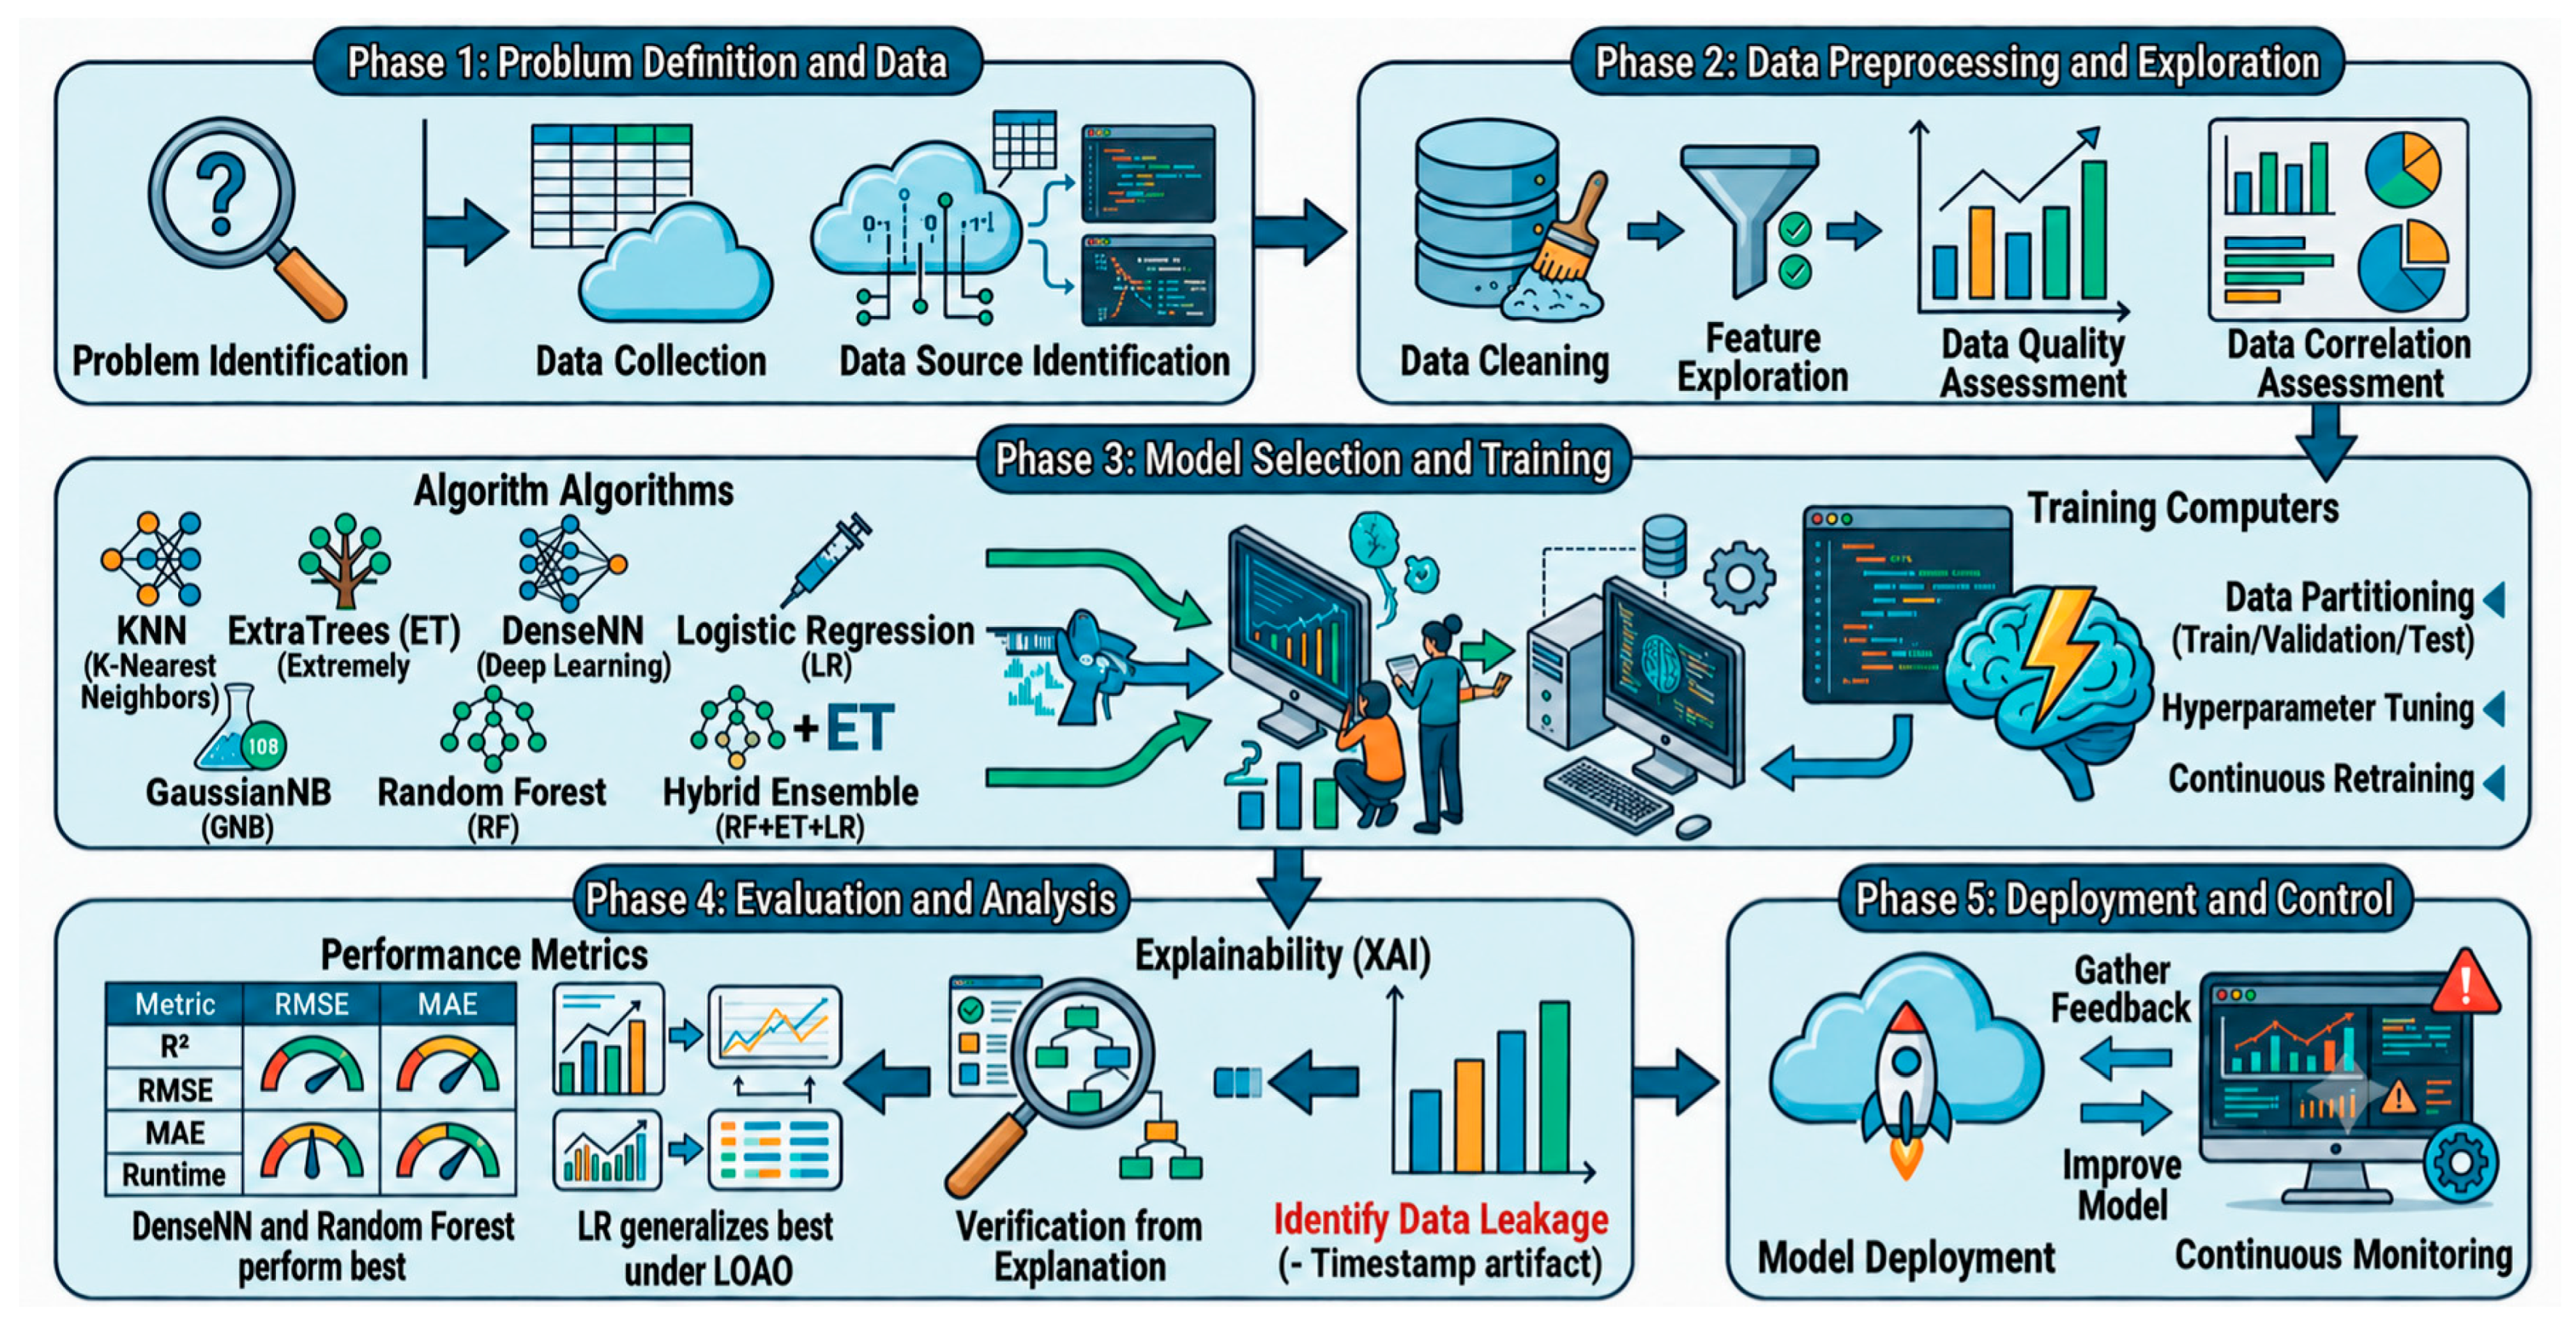
The architecture components and data flow are shown in Figure 1. Combining multi-model evaluation with comprehensive XAI interpretation provides a clear and scalable defense strategy for the evolving network contexts of today’s EV ecosystems.
Figure 1.
Multi-Stage ML/DL and XAI deployment-aware IDS benchmarking framework, motivated by EV/V2X cloud-backend environments. Blue arrows indicate the pipeline flow between phases; red text and markers highlight the artifact-driven data leakage discovered during the XAI audit (Section 4.5), the study’s central methodological finding.
3.2. Dataset
In order to thoroughly test the effectiveness of the proposed models in identifying zero-day intrusions, the CSE-CIC-IDS2018 dataset is used in this study [20]. This benchmark was developed jointly by the Canadian Centre for Cyber Security (CSE) and the Canadian Institute for Cybersecurity (CIC), and it takes into account the shortcomings of old datasets like KDDCUP99 and NSL-KDD [21] that are widely criticized in modern literature for their antiquated attack vectors, synthetic network environments, and lack of representation of current traffic profiles.
Modern EV and V2X ecosystems operate across a multi-tier architecture: (i) in-vehicle intra-networks (e.g., Controller Area Network (CAN), Automotive Ethernet), (ii) charging telemetry links (e.g., OCPP, ISO 15118 [22]), and (iii) high-level enterprise cloud-backend servers managing billing, fleet coordination, and edge aggregation. In this study, we explicitly scope our threat model to the cloud-backend tier. Consequently, the CSE-CIC-IDS2018 dataset serves as an established surrogate environment representing the enterprise TCP/IP traffic flows that bridge edge aggregation gateways and central cloud management platforms.
3.2.1. Data Generation and Environment
The CSE-CIC-IDS2018 dataset was created in a realistic, modern cloud infrastructure using Amazon Web Services (AWS) [20] as compared to outdated benchmarks. The network traffic was collected for 10 days (14–28 February 2018) to obtain a huge dataset of about 16 million bidirectional network flows. The generation approach is cloud-based, which guarantees that the dataset captures the rich noise, complexity, and volumetric heterogeneity inherent in modern enterprise networks [5].
3.2.2. Feature Engineering
To extract flow-based statistical features from the captured pcap files, these files were processed using the CICFlowMeter tool [20] instead of analyzing the raw packet payloads, which are frequently encrypted in today’s networks. This is a payload-agnostic solution, which is especially beneficial for zero-day detection, as new attacks are often designed to carry an encrypted or obfuscated payload but always leave behind some characteristic behavioral traces in the flow metadata, as established by prior time-related traffic characterization studies [23,24]. This extraction process yielded more than 80 statistical features per flow, capturing the communication in terms of temporal features (e.g., Flow Duration, Flow Byts/s), volumetric features (e.g., Fwd Pkt Len Std, Pkt Len Min), and TCP connection state indicators (e.g., RST Flag Cnt, ECE Flag Cnt).
3.2.3. Attack Taxonomy
It contains a realistic mix of benign background traffic, as well as seven large classes of modern cyber attacks, which are further broken down into 14 distinct attack families [20]. Of these 14 officially documented families, 13 are represented with a sufficient number of flows in the 9 daily capture files merged for this study to be included as a distinct LOAO held-out class (Section 3.2.4, Table 1); one official family (associated with a capture day not included in the 9-day merge used here) is not separately represented and is therefore excluded from the 13-family LOAO evaluation. It contains Brute Force attacks against FTP and SSH protocols, denial of service and distributed denial of service attacks (both volumetric and low-rate attacks like Hulk, GoldenEye, Slowloris and Slowhttptest), Web Application attacks (including SQL Injection, Cross-Site Scripting (XSS), Brute Force), Infiltration attacks (network vulnerabilities for internal payload delivery), Botnet traffic (reflecting command and control communications), and PortScan activities (used for network reconnaissance).
Table 1.
LOAO protocol: exact training/test composition per held-out attack family (identical across the 3 repetitions except for the random split of Benign and “other-attack” training rows). “Infilteration” is reproduced verbatim from the dataset’s official CSV label (a known spelling artifact in the original CSE-CIC-IDS2018 release), not a typographical error introduced here.
3.2.4. Relevance to Zero-Day Simulation
By definition, a true zero-day attack does not have any prior signatures or known labels, so no static dataset can inherently contain zero-day malware [25]. CSE-CIC-IDS2018 is an ideal testbed for simulating zero-day scenarios because of its attack taxonomy which is diverse [20]. The LOAO hold-out evaluation framework [8] is used in this study. Specifically, the models are trained only with a subset of known attack classes (e.g., DoS and Brute Force) and benign traffic and then tested on completely unseen attack classes (e.g., Infiltration and Web Attacks). A model’s ability to correctly classify these new, unseen attack families as malicious indicates that it is zero-day detection only using behavioral anomaly detection, and not signature knowledge [26,27].
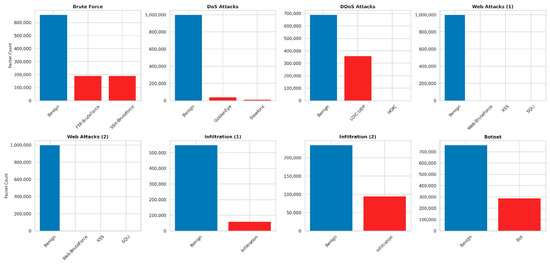
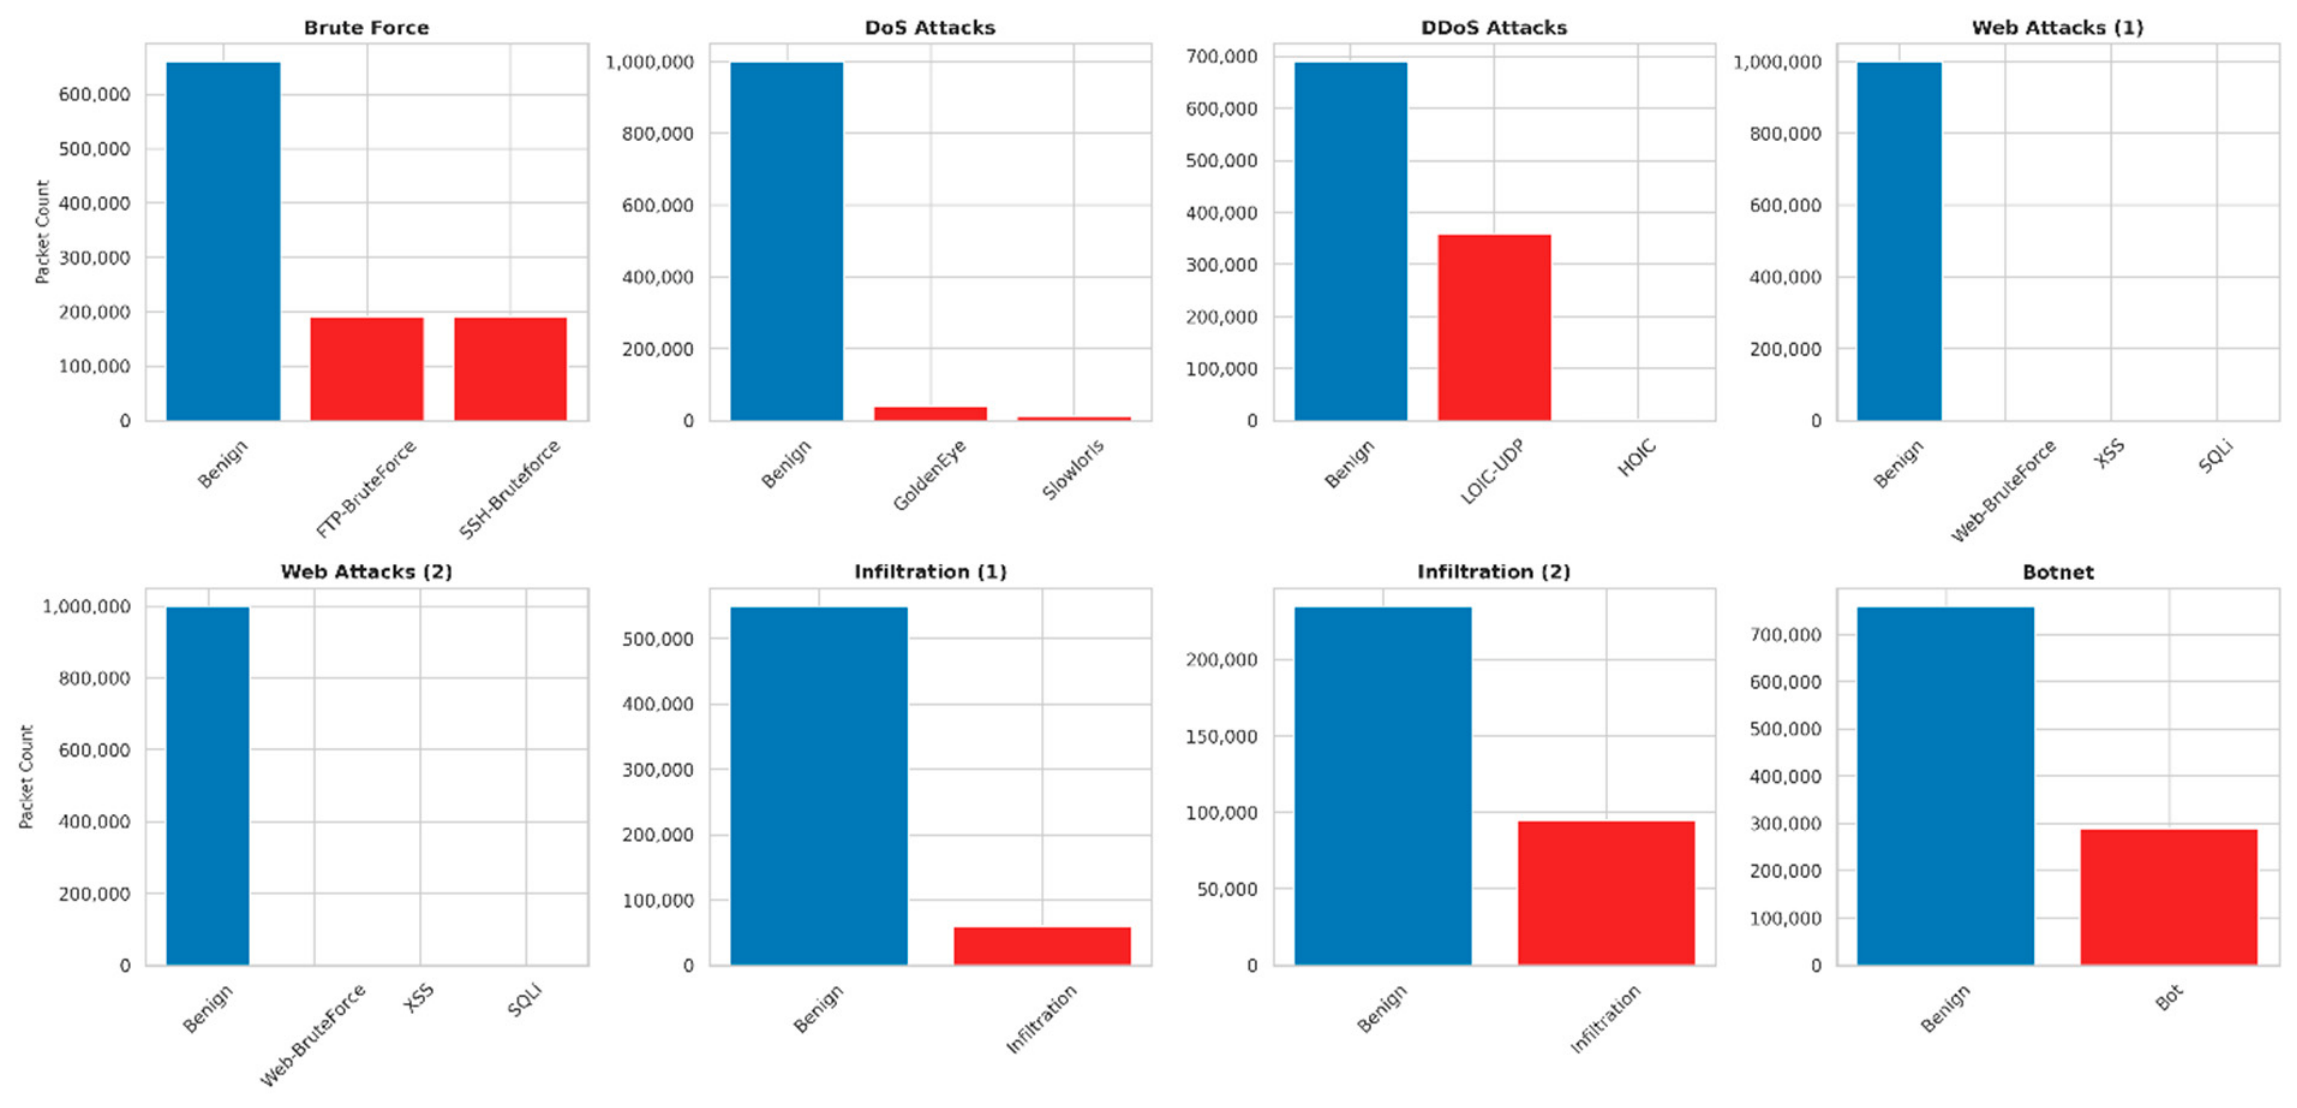
An Exploratory Data Analysis (EDA) was performed to gain insight into the structural issues of the dataset and to justify the selection of evaluation measures as shown in Figure 2. The figure illustrates a multi-scenario distribution of packets for benign background traffic (blue bars) versus specific attack vectors (red bars) for various network capture periods.
Figure 2.
Packet distribution across attack scenarios highlighting severe class imbalance.
The class imbalance is a dominant theme in nearly all of the subplots. In practically every situation including DDoS, Brute Force and Infiltration, the amount of benign traffic significantly outweighs the malicious traffic. In DoS/DDoS attacks, for example, legitimate traffic can be up to one million packets, while certain low-rate attack vectors (such as Slowloris or HOIC) make up only a small percentage of these packets.
In addition, the EDA process revealed certain data quality issues which were present in the raw data files. In isolated captures, some attack vectors (like XSS and SQL Injection) started with a packet count of exactly zero, as shown in the Web Attack subplots. These zero counts are a known extraction or merging artifact, because Web Attack records are distributed across multiple CSV files and require careful consolidation before analysis.
The visual evidence in Figure 2 is the basis for the methodological decisions in this study. It empirically shows that using accuracy alone is statistically misleading for this framework, because of the substantial class imbalance and the unequal representation of individual attack families. This significant difference in volume thus required imbalance-aware evaluation, combining classification metrics for the minority attack classes (Precision, Recall, F1, MCC, PR-AUC) with continuous probabilistic error measures (RMSE, MAE, and R2) as a secondary calibration check on the models’ real discriminative ability.
To rigorously simulate zero-day attack scenarios, a LOAO evaluation strategy was adopted. The models were trained with a particular subset of attack families (such as DoS, DDoS, Brute Force) and benign traffic, and not just randomly split into a train and a test set. The models were then tested on totally new attack families (e.g., Infiltration, Web Attacks). This protocol provides a more stringent indicator of unseen-attack-family generalization than a conventional random split, although it does not guarantee real-world zero-day detection performance on genuinely novel traffic.
3.3. Artificial Intelligence Techniques
In order to investigate the effectiveness of the proposed framework to detect zero-day attacks in CSE-CIC-IDS2018 dataset, three main categories of models were used: traditional ML models, DL models, and hybrid models. The theoretical underpinning of each model and the reasons for choosing that model for this particular domain are described in this section.
3.3.1. Traditional Machine Learning Models
A variety of algorithms were chosen to provide a solid baseline and to compare the algorithms with respect to their performance metrics:
- Lazy learning: K-nearest neighbors (KNN): A classification algorithm that classifies a new instance by the majority class of its k-nearest neighbors, usually measured by Euclidean distance. Rationale: KNN was included as a local, distance-based baseline: it classifies a flow by the majority label among its nearest neighbors, which may capture neighborhood-level differences between benign and malicious traffic, though it is not itself a dedicated outlier/anomaly detector.
- Logistic Regression (LR): A basic linear model for binary classification which fits a logistic function to estimate the probability that an instance belongs to a particular class. Rationale: It was used as a baseline to measure the gains in performance of more complex models. Despite its linear limits, it is a good choice for environments that need immediate response, due to its fast training and inference time.
- Gaussian Naive Bayes (GNB): A probabilistic classifier based on Bayes’ theorem, where it is assumed that all features are conditionally independent and normally distributed. Rationale: GNB is mathematically simple and has minimal computational overhead, and thus can be used to evaluate if complex inter-feature relationships are essential to identify sophisticated network intrusions.
- Random Forest (RF): An ensemble learning method that constructs a multitude of decision trees during training and outputs the mode of the classes (majority voting). Why it is so good for network data: It is very resistant to overfitting and works well with high-dimensional data (in this case the 80+ network flow features extracted) without strict feature-scaling requirements.
- Extremely Randomized Trees (ET): This is similar to RF but adds another layer of randomness by choosing split points at random instead of finding the optimal split, which further reduces variance. Rationale: ET is known for delivering very reliable feature importance scores and these scores are essential to the XAI stage to accurately determine the attributes of the network that are indicative of a zero-day intrusion.
3.3.2. Deep Learning Model
Dense Neural Network (DenseNN): An artificial neural network with an input layer, several hidden layers with full connections (each neuron in the hidden layer is connected to every neuron in the previous hidden layer), and an output layer with activation functions like Sigmoid or Softmax. Rationale: DenseNNs have the ability to learn complex, non-linear representations of the data while linear models do not. This allows them to detect subtle, hidden patterns and complex interactions of features in network-traffic flows that conventional algorithms may fail to identify in the presence of new, unseen attacks.
3.3.3. Hybrid Model
Hybrid Model (Hybrid_RF_ET_LR): It is an integrated model which combines the merits of three different algorithms namely Random Forest, Extra Trees and Logistic Regression. The three base learners (RF, ET, and a first-stage LR) are each trained separately, and their predicted class probabilities are used, together with the original input features, as inputs to a final LR meta-classifier (feature-augmented stacking; see later in this section for the exact mechanism). Rationale: This is the main goal of this hybridization: to reduce False Positives and False Negatives. The ensemble learners (RF and ET) are used to learn complex non-linear boundaries, and the LR component is used to calibrate the final decision boundary, which also boosts the overall generalization ability of the model when it faces attack types that are not included in the learning phase (zero-day scenarios).
For the hybrid ensemble configuration, a standard LR stacking meta-classifier with L2 regularization is employed rather than static weighted voting. The heterogeneous base learners (Random Forest, Extra Trees, and a first-stage Logistic Regression, distinct in configuration from the final meta-learner below) output continuous predicted class probabilities on the training data, which are subsequently utilized as meta-features by the LR meta-learner to optimize the final zero-day classification boundary, consistent with the model’s name, Hybrid_RF_ET_LR. The complete implementation routines and hyperparameter specifications are available from the corresponding author upon reasonable request.
3.4. Evaluation Metrics
A comprehensive set of evaluation metrics was used to rigorously evaluate the performance and generalization capabilities of the proposed models in detecting zero-day intrusions. Since the dataset CSE-CIC-IDS2018 is highly imbalanced, accuracy is not an appropriate metric for classification, and may be misleading. Hence, the continuous probability outputs of the models were assessed with regression-based error metrics in addition to accuracy. This method gives a finer-grained understanding of the predictive confidence and margin of error of the models. The following measures were used:
3.4.1. Accuracy
This is the overall percentage of successful predictions (both normal and attack traffic) against the number of instances. It gives an overall idea of the performance of the model, but is strongly influenced by the majority class in imbalanced datasets.
Here, TP = True Positives, TN = True Negatives, FP = False Positives, and FN = False Negatives.
3.4.2. Mean Squared Error (MSE)
MSE calculates the average of the squares of the errors, that is, the average squared difference between the estimated probabilities and the actual binary labels (0 or 1). It strongly punishes large errors of prediction and is highly sensitive to outliers.
3.4.3. Root Mean Squared Error (RMSE)
RMSE is the square root of the MSE. By taking the square root, the error metric is brought back to the same scale and unit as the target variable, making it more interpretable than MSE while retaining its sensitivity to large errors.
3.4.4. Mean Absolute Error (MAE)
The MAE is the mean of the absolute deviations from the observations to the predictions. MAE treats all absolute errors linearly, whereas MSE and RMSE penalize larger errors more heavily because of the squared-error term.
3.4.5. Coefficient of Determination (R2)
The R2 metric indicates the proportion of the variance in the dependent variable (attack occurrence) that is predictable from the independent variables (network features). An R2 score of 1.0 indicates perfect prediction, while a score of 0 indicates that the model explains none of the variability. In the context of this study, R2 is reported here as a secondary, continuous-error calibration diagnostic (Section 4.2), rather than the primary evaluation metric; a higher R2 (e.g., 0.83 for DenseNN) signifies the model’s strong ability to capture the underlying patterns of anomalous traffic, whereas lower or negative scores (as observed in GaussianNB) indicate a failure to model the data distribution effectively.
3.5. Corrected Metrics, Reproducibility Details, and Executed LOAO Protocol
The LOAO scheme described above was directly implemented and executed in code, not only described conceptually: for each of the 13 attack families in the merged CSE-CIC-IDS2018 dataset (8,284,195 flows across 9 daily capture files), models were trained on Benign traffic plus all 12 other attack families and tested exclusively on held-out Benign flows plus the entirety of the excluded family. Each fold was repeated 3 times with independent random seeds (39 folds total). Table 1 reports the exact training/test composition per held-out attack family.
Model hyperparameters, the DenseNN architecture, and the data-cleaning procedure (previously reported at a level of detail insufficient for full reproducibility) are reported in full in Table 2.
Table 2.
Model hyperparameters, DenseNN architecture, and data-cleaning summary (auto-logged from the executed pipeline).
Finally, Precision, Recall, F1, MCC, PR-AUC, and False-Positive Rate (FPR) are reported as the core evaluation metrics rather than R2, RMSE, and MAE; all of these metrics (plus ROC-AUC and False-Negative Rate, FNR) are now computed for every model included in the corrected analysis (the five core models—Logistic Regression, Gaussian NB, Random Forest, Extra Trees, and DenseNN—at every training ratio and every LOAO fold; KNN only at the 20% ratio due to its computational cost, and the hybrid model was not included in this analysis), and are reported as the primary results in Section 4.7. R2, RMSE, and MAE are retained only as a secondary continuous-error diagnostic (not a probability-calibration measure such as Brier score or expected calibration error) (Section 4.2), and are now computed correctly on the predicted probability of the Attack class against the true binary label rather than on raw multi-class label indices—see Section 4.7 for the specific bug this corrects.
3.6. Explainable AI (XAI) Auditing and Attribution Formulation
To improve model transparency and examine whether classifications are influenced by genuine network features or potential artifacts, we apply model-appropriate XAI frameworks:
- Tree Ensembles (Random Forest and Extra Trees): We utilize TreeSHAP, computing exact Shapley values through conditional expectation trees to quantify feature marginal contributions.
- Deep Neural Architecture (DenseNN): Feature attribution is evaluated using Integrated Gradients (IG). To prevent zero-attribution collapse caused by gradient saturation over uninformative zero-vector baselines, the baseline reference is calibrated as a stratified medoid background distribution derived from representative network traffic. For an input instance and neural output , the attribution for feature is formalized as
Path integrals are approximated via 100-step Gauss-Legendre quadrature, which is designed to satisfy the completeness and implementation invariance axioms; as reported in Section 4.5, this did not resolve the zero-valued attributions observed for DenseNN in the baseline audit, which remains an open limitation.
4. Results and Discussion
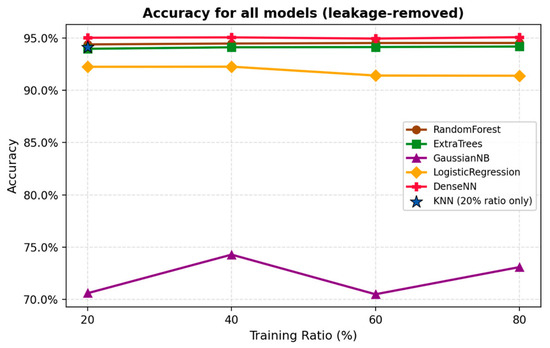
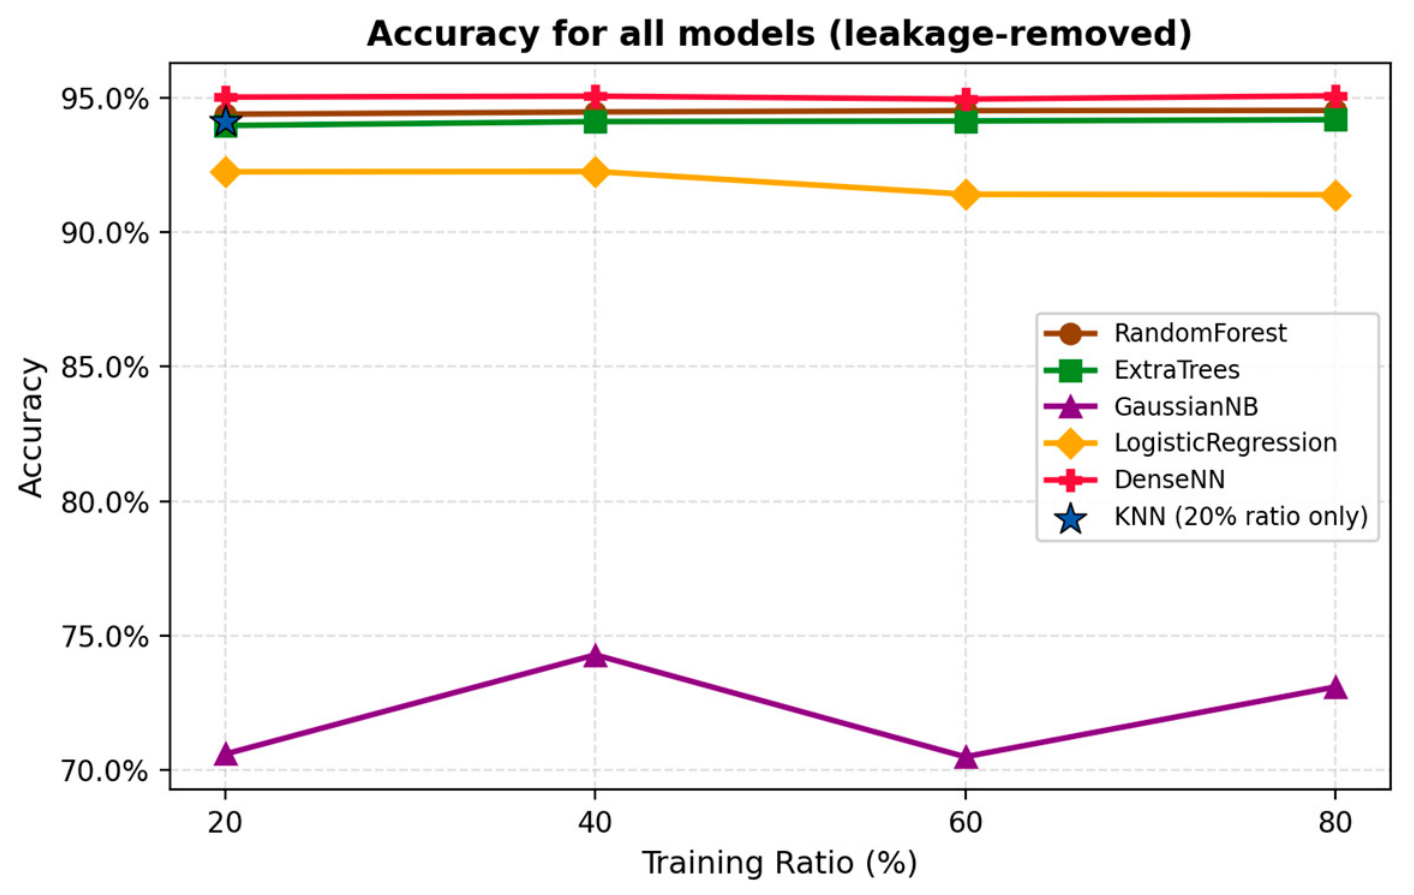
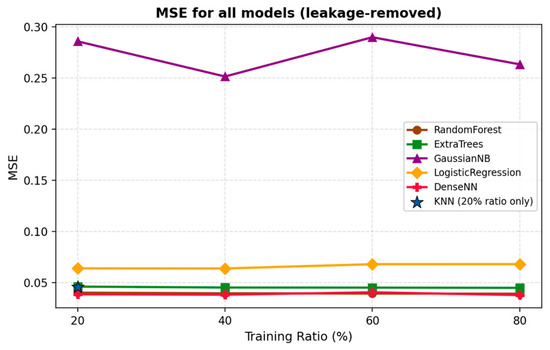
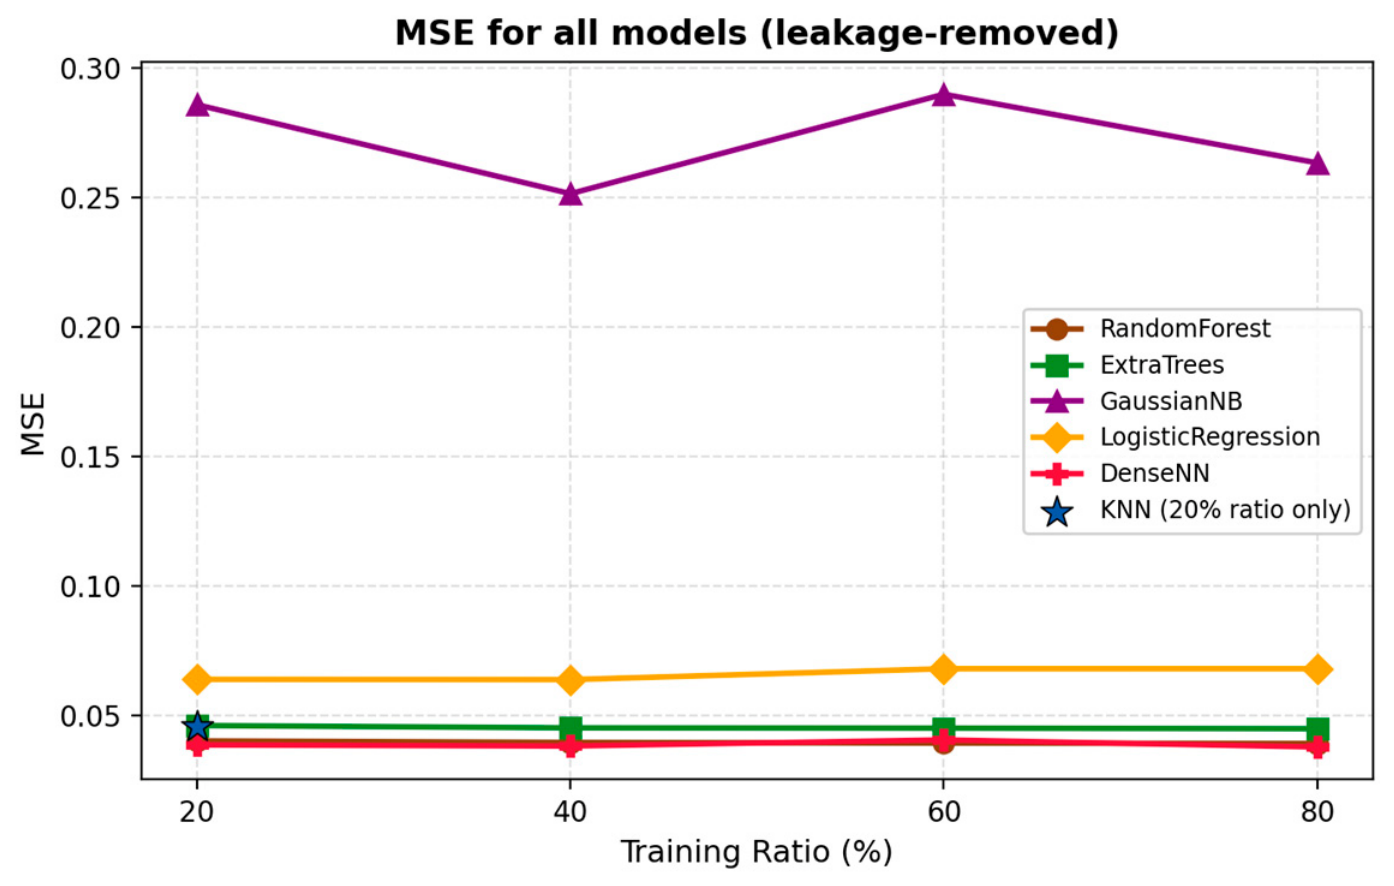
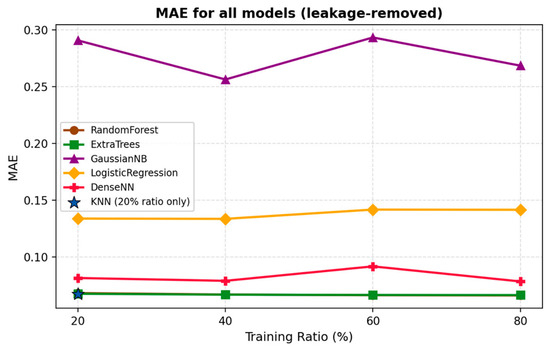
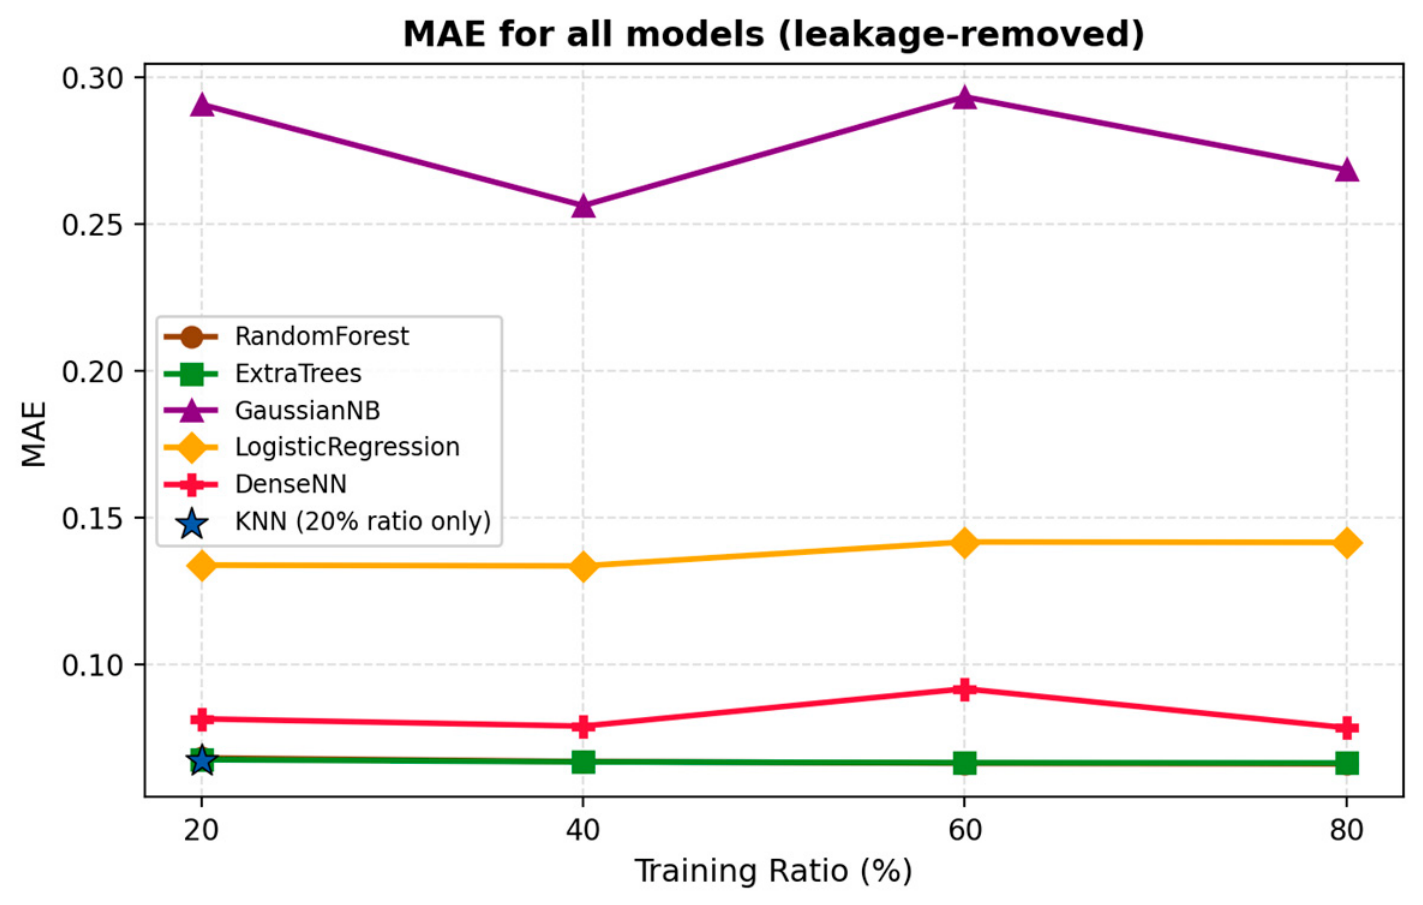
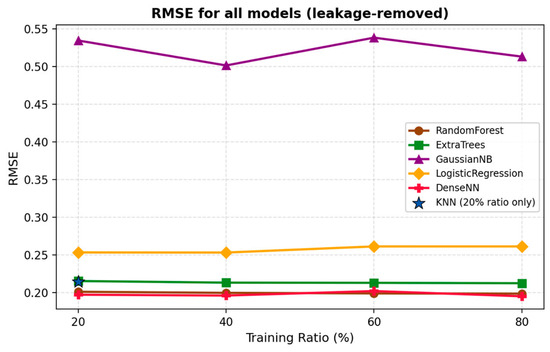
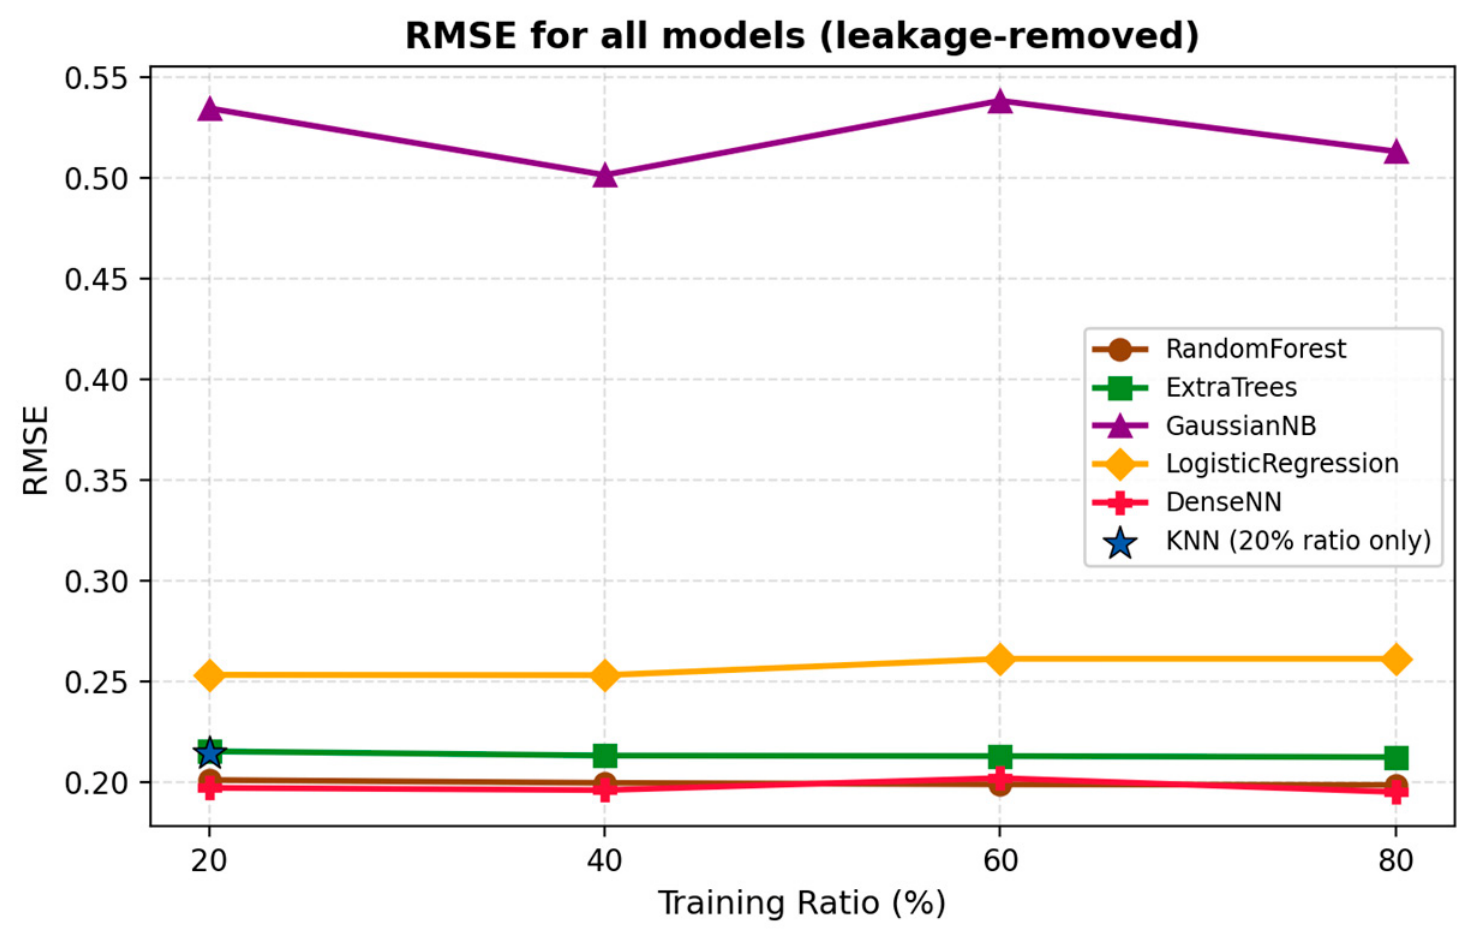
The primary models were trained with different data volumes (20%, 40%, 60%, and 80%) of CSE-CIC-IDS2018 dataset to assess the scalability and robustness of the proposed framework. This section explains how the performance and computational efficiency were evaluated using six measures, shown graphically in Figure 3, Figure 4, Figure 5, Figure 6, Figure 7 and Figure 8 (Accuracy, MSE, MAE, RMSE, and R2 in Figure 3, Figure 4, Figure 5, Figure 6 and Figure 7, and training runtime in Figure 8).
Figure 3.
Accuracy for all models (leakage-removed, corrected).
Figure 4.
MSE for all models (leakage-removed, corrected).
Figure 5.
MAE for all models (leakage-removed, corrected).
Figure 6.
RMSE for all models (leakage-removed, corrected).
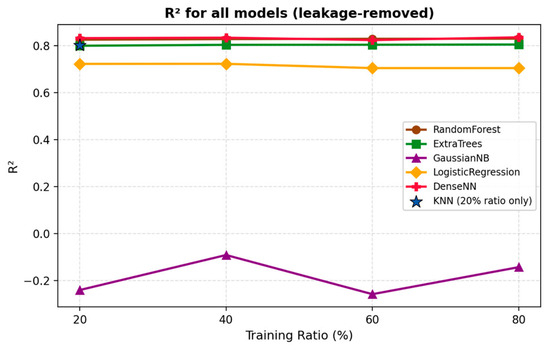
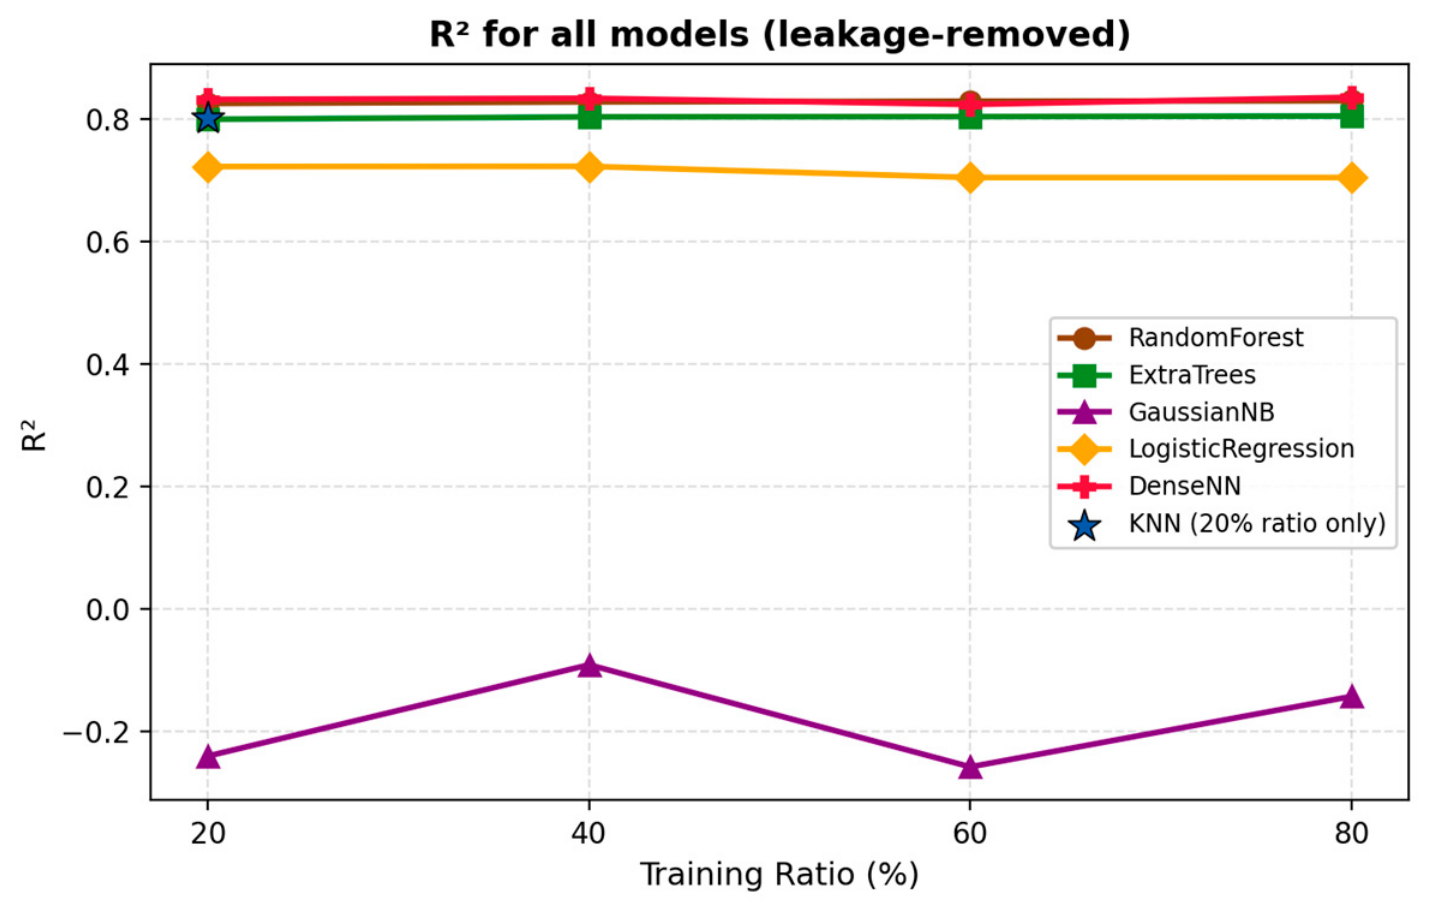
Figure 7.
R2 for all models (leakage-removed, corrected).
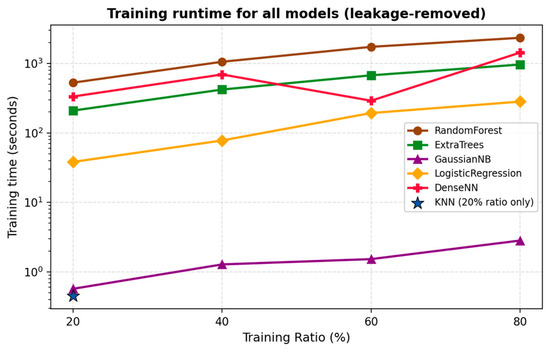
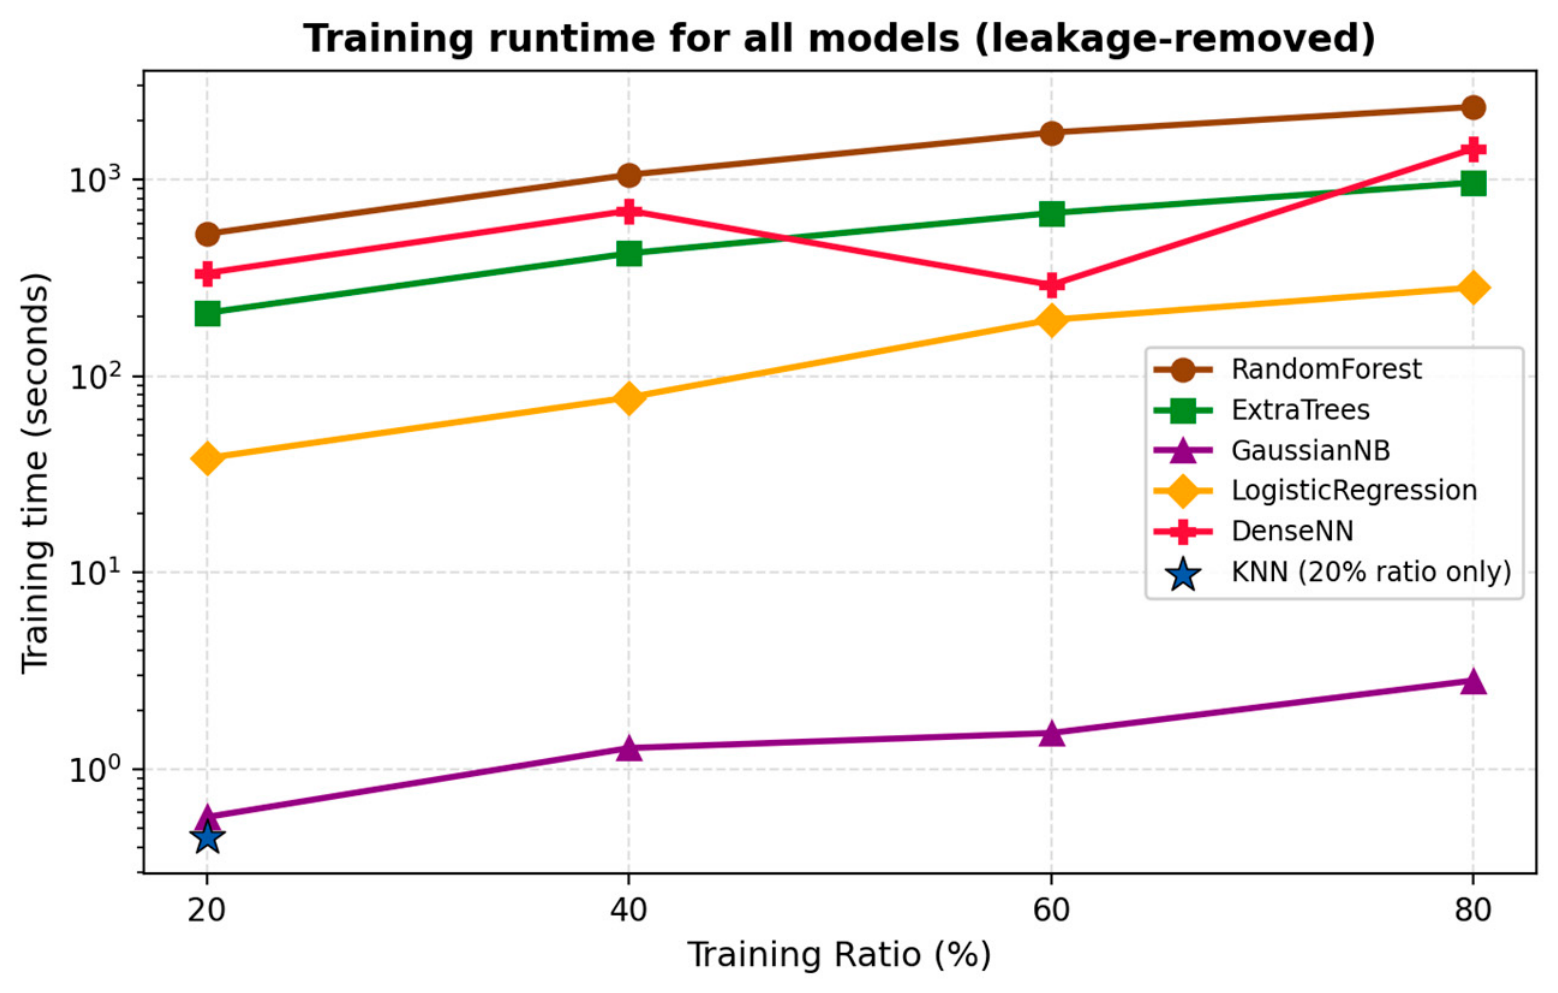
Figure 8.
Runtime for all models (leakage-removed, corrected).
Reading guide: Section 4.1, Section 4.2, Section 4.3, Section 4.4, Section 4.5 and Section 4.6 report the standard within-distribution comparison, computed on the original, Timestamp-retained baseline run, and are provided as descriptive context and as the basis for quantifying the leakage effect reported later in this section. The study’s primary, corrected findings—the leakage-removed performance and the Leave-One-Attack-Out zero-day generalization results—are reported in Section 4.7, which should be read as the main results of this study.
4.1. Classification Accuracy and the Class-Imbalance Trap
As shown in Figure 3 (leakage-removed, corrected results), accuracy separates meaningfully across models once Timestamp and other identifier features are removed: DenseNN is highest (≈95.1% at 80% training), followed closely by Random Forest (≈94.5%), Extra Trees (≈94.2%), and KNN (≈94.1%, evaluated at the 20% ratio only); Logistic Regression is lower (≈91.4%); Gaussian NB diverges substantially, remaining in the 70–74% range across all training ratios. Even with this realistic spread, accuracy alone remains a potentially misleading measure for the highly imbalanced CSE-CIC-IDS2018 dataset (as determined in the EDA phase), since accuracy alone may remain misleading because of the substantial class imbalance and the unequal representation of individual attack families. This caution motivates the continuous-error metrics (MSE, MAE, RMSE, R2) analyzed next, and, more importantly, the classification metrics (Precision, Recall, F1, MCC) and the Leave-One-Attack-Out zero-day evaluation reported as the study’s primary results in Section 4.7.
4.2. Error-Metric Analysis (MSE, MAE, and RMSE)
The models’ continuous probabilistic outputs were assessed with three error measures to overcome the restrictions of accuracy. The MSE, MAE and the RMSE are shown in Figure 4, Figure 5 and Figure 6, respectively. In all three figures, there is a clear behavioral difference:
Instance-Based Learning: KNN’s RMSE at the only evaluated training ratio (20%, Figure 6) is 0.214, comparable to Extra Trees (0.212–0.215 across ratios) and modestly higher than Random Forest and DenseNN (both ≈ 0.195–0.201). Because KNN was evaluated only at the 20% training ratio, owing to its computational cost at larger data volumes (Section 4.4), no scaling trend across training ratios can be reported for this model.
Stable Ensemble Performance: RF and ET showed relatively stable performance, with error metrics decreasing as the training volume increased, including at the 80% training ratio.
Negative Scaling and Weaker Performance: LR’s RMSE rises slightly with more training data (0.253 at 20% to 0.261 at 80%), consistent with a modest downward drift in its fit quality. GNB produced markedly weaker results than every other model on this dataset, with RMSE consistently in the 0.50–0.54 range across all four training ratios (Figure 6)—the highest error of any evaluated model—and accuracy remaining in the 70–74% range throughout (Figure 3), without a clear improving or worsening trend as training volume increases.
4.3. Coefficient of Determination (R2) and Model Scalability
The R2 metric (shown in Figure 7) represents the percentage of the variance in the anomalous traffic that is explainable by the features of the network. It is reported here as a secondary, within-distribution calibration diagnostic rather than the primary indicator of zero-day robustness; the primary, generalization-focused evaluation is the Leave-One-Attack-Out analysis in Section 4.7. For increasing training volume, Figure 7 shows a clear separation in scalability of the models:
KNN’s R2 at the only evaluated training ratio (20%, Figure 7) is 0.801, close to Extra Trees (≈0.799–0.804 across ratios) and somewhat below Random Forest and DenseNN (both ≈ 0.82–0.83). As with RMSE, no scaling trend across training ratios can be reported for KNN, since it was only evaluated at the 20% ratio due to its computational cost (Section 4.4).
The tree-based ensembles and the Dense Neural Network (DenseNN) exhibit strong and stable performance, reaching R2 between 0.80 and 0.83 across all training ratios.
In contrast, Logistic Regression shows a modest downward trend (decreasing from 0.722 at 20% to 0.704 at 80%), reflecting its comparatively limited capacity to capture the non-linear complexities of network traffic relative to the tree-based and neural models.
4.4. Computational Overhead and Time–Efficiency Trade-Off
KNN shows competitive within-distribution performance at the one ratio it was evaluated at, but Random Forest and DenseNN in fact achieve better R2 and RMSE (Section 4.1, Section 4.2 and Section 4.3); KNN’s high inference cost is what limits its practicality at large data volumes. Figure 8 highlights the computational trade-off between the statistical performance and deployment viability.
Figure 8 shows the training time for each model on the leakage-removed data. Random Forest is consistently the slowest to train, rising from 528.9 s at 20% training data to 2339.3 s at 80%; DenseNN and Extra Trees follow, reaching 1431.0 s and 964.1 s respectively at 80%. Logistic Regression trains much faster (281.8 s at 80%), and Gaussian NB is the fastest of the iteratively fit models (2.8 s at 80%). KNN’s nominal training time is negligible (0.4 s at the 20% ratio it was evaluated at) because it performs no real training, only storing the reference data; KNN’s actual computational cost falls almost entirely on inference, where its measured per-sample latency (5.87 ms/sample) is over 80 times higher than the tree ensembles’ (≈0.05–0.07 ms/sample), which is why it was not evaluated at the higher training ratios (as detailed in Section 4.4). R2 alone does not determine deployment suitability—the LOAO evaluation in Section 4.7 in fact found Logistic Regression to generalize better (mean F1 = 0.397) than the tree ensembles (mean F1 = 0.239–0.249). Taken together, training cost and inference cost point to different models depending on the deployment constraint, which is why both are reported separately rather than collapsed into a single runtime figure.
Interpreting the aggregate runtime plotted in Figure 8 directly as “real-time deployment capability” conflated training time and inference time. These are now decomposed and reported separately below. At 80% training ratio, on the leakage-removed feature set: Random Forest required 2339.3 s to train but only 0.052 ms per sample at inference (≈19,215 samples/s); Extra Trees required 964.1 s to train and 0.068 ms per sample at inference (≈14,795 samples/s); DenseNN required 1431.0 s to train and 0.150 ms per sample at inference (≈6661 samples/s); Logistic Regression required 281.8 s to train and 0.00087 ms per sample (≈1,150,722 samples/s); Gaussian NB required 2.8 s to train and 0.00149 ms per sample (≈672,358 samples/s). All timing was measured on a 2-vCPU, 12.67 GB RAM, CPU-only session (no GPU acceleration used for the reported runs); Python 3.12.13, TensorFlow 2.20.0. This decomposition shows that a high total training time (e.g., Random Forest) does not preclude real-time inference once trained; it is per-sample inference latency and throughput, not total training time, that should govern real-time deployability claims.
4.5. XAI and Feature-Analysis Insights
The XAI analysis, specifically the “Overall Feature Rank,” uncovered critical model reasoning patterns:
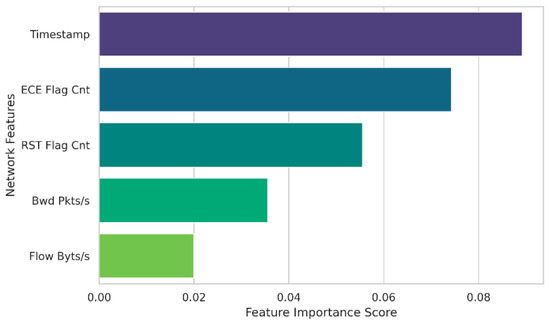
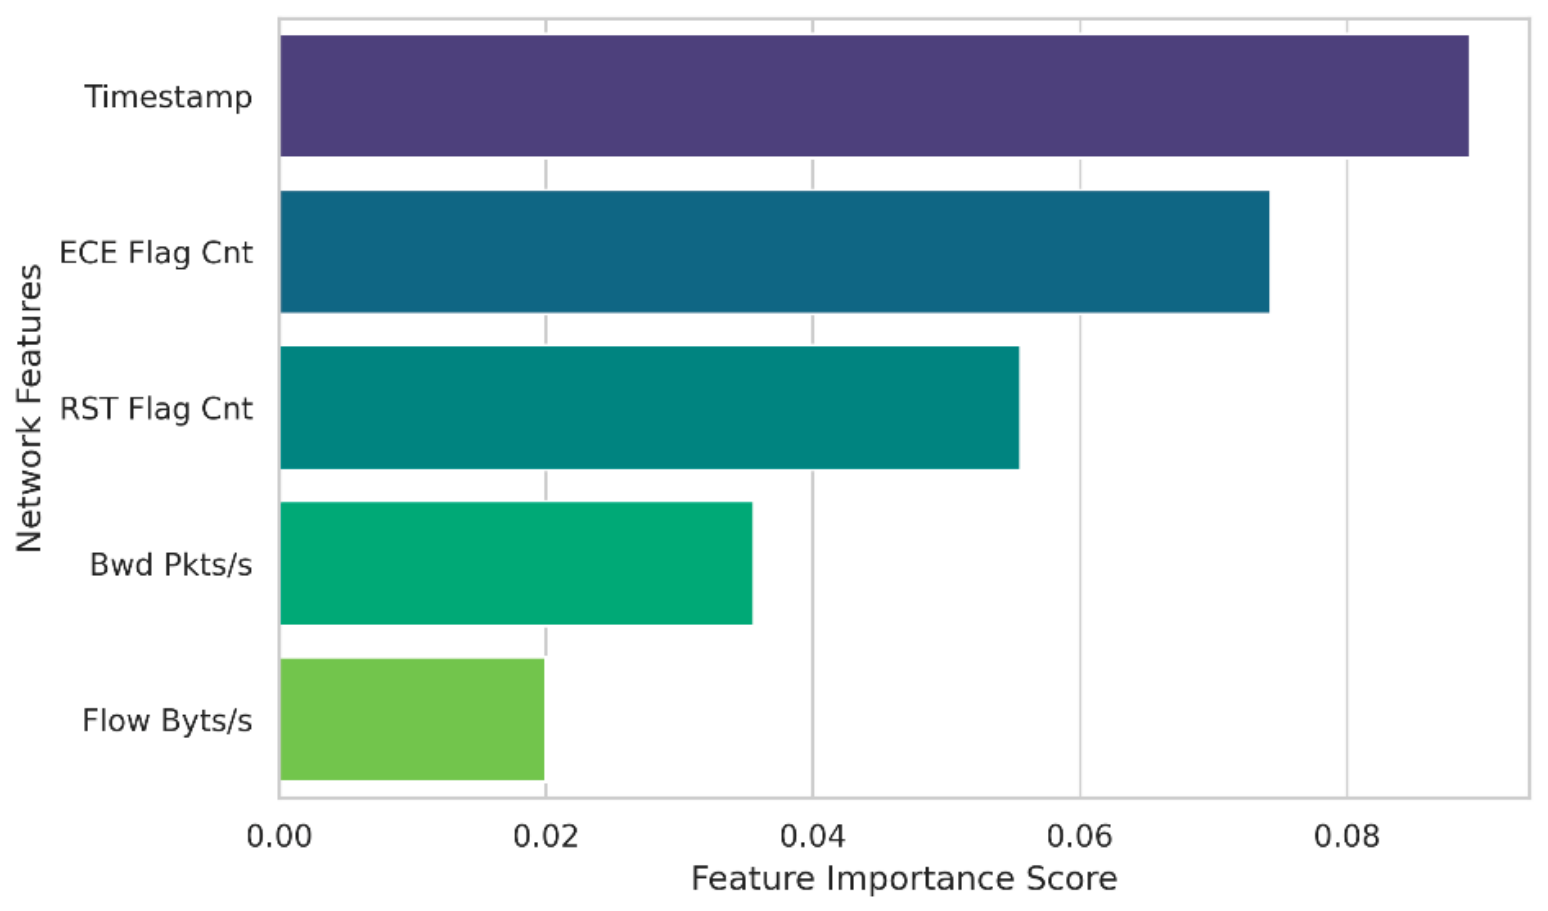
The most influential feature (Importance = 0.089211) was Timestamp, dominating the RF model in all splits (e.g., 0.097782 at 80% data). This is a very important data leakage artifact because the RF learned the temporal schedule of the attack scenarios instead of behavioral signatures of the CIC-IDS2018.
Logical Network Signatures: ET found ECE Flag Cnt (Importance: 0.074312) and RST Flag Cnt (Importance: 0.055550) to be the main features, excluding the Timestamp. This shows that ET’s within-distribution decisions rest on structurally meaningful TCP/IP handshake mechanics (such as aggressive connection resets) rather than temporal leakage; however, as the Leave-One-Attack-Out results in Section 4.7 show, this structurally grounded reasoning did not by itself translate into strong generalization to genuinely unseen attack families, where ET’s mean LOAO F1 (0.249) trailed the simpler Logistic Regression model (0.397).
XAI Failure in DL: The XAI module failed to extract meaningful feature importance for the DenseNN model, with 0.000 for the top feature (Dst Port) for all training sizes. The utilization of the DenseNN architecture is severely affected by this “black box” restriction, which makes it difficult to use the network for security audits.
The differences between the models’ reasoning are summarized in the global feature importance analysis in Figure 9. The top ranked feature is Timestamp (Importance = 0.089), highlighting a major data leakage issue in the training pipeline, specifically with the RF model. Figure 9 shows that, apart from this artifact, ET was able to successfully identify structurally relevant network indicators, such as TCP state flags (ECE Flag Cnt and RST Flag Cnt), as the main factors for its classification decisions; this reflects interpretable, behaviorally grounded within-distribution reasoning, though Section 4.7’s LOAO evaluation shows it did not confirm strong zero-day generalization in practice.
Figure 9.
Top 5 global feature importance (XAI analysis) (baseline run, with Timestamp retained; this analysis exposed the leakage artifact and does not represent the final leakage-removed models).
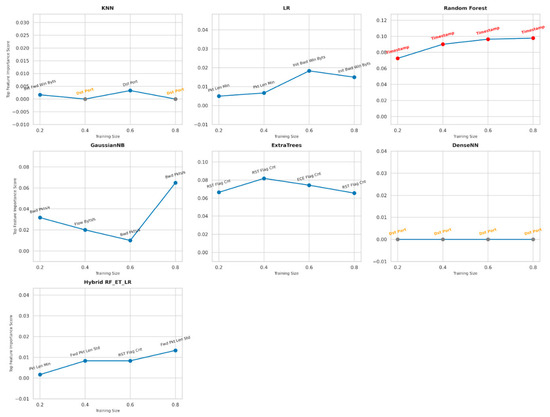
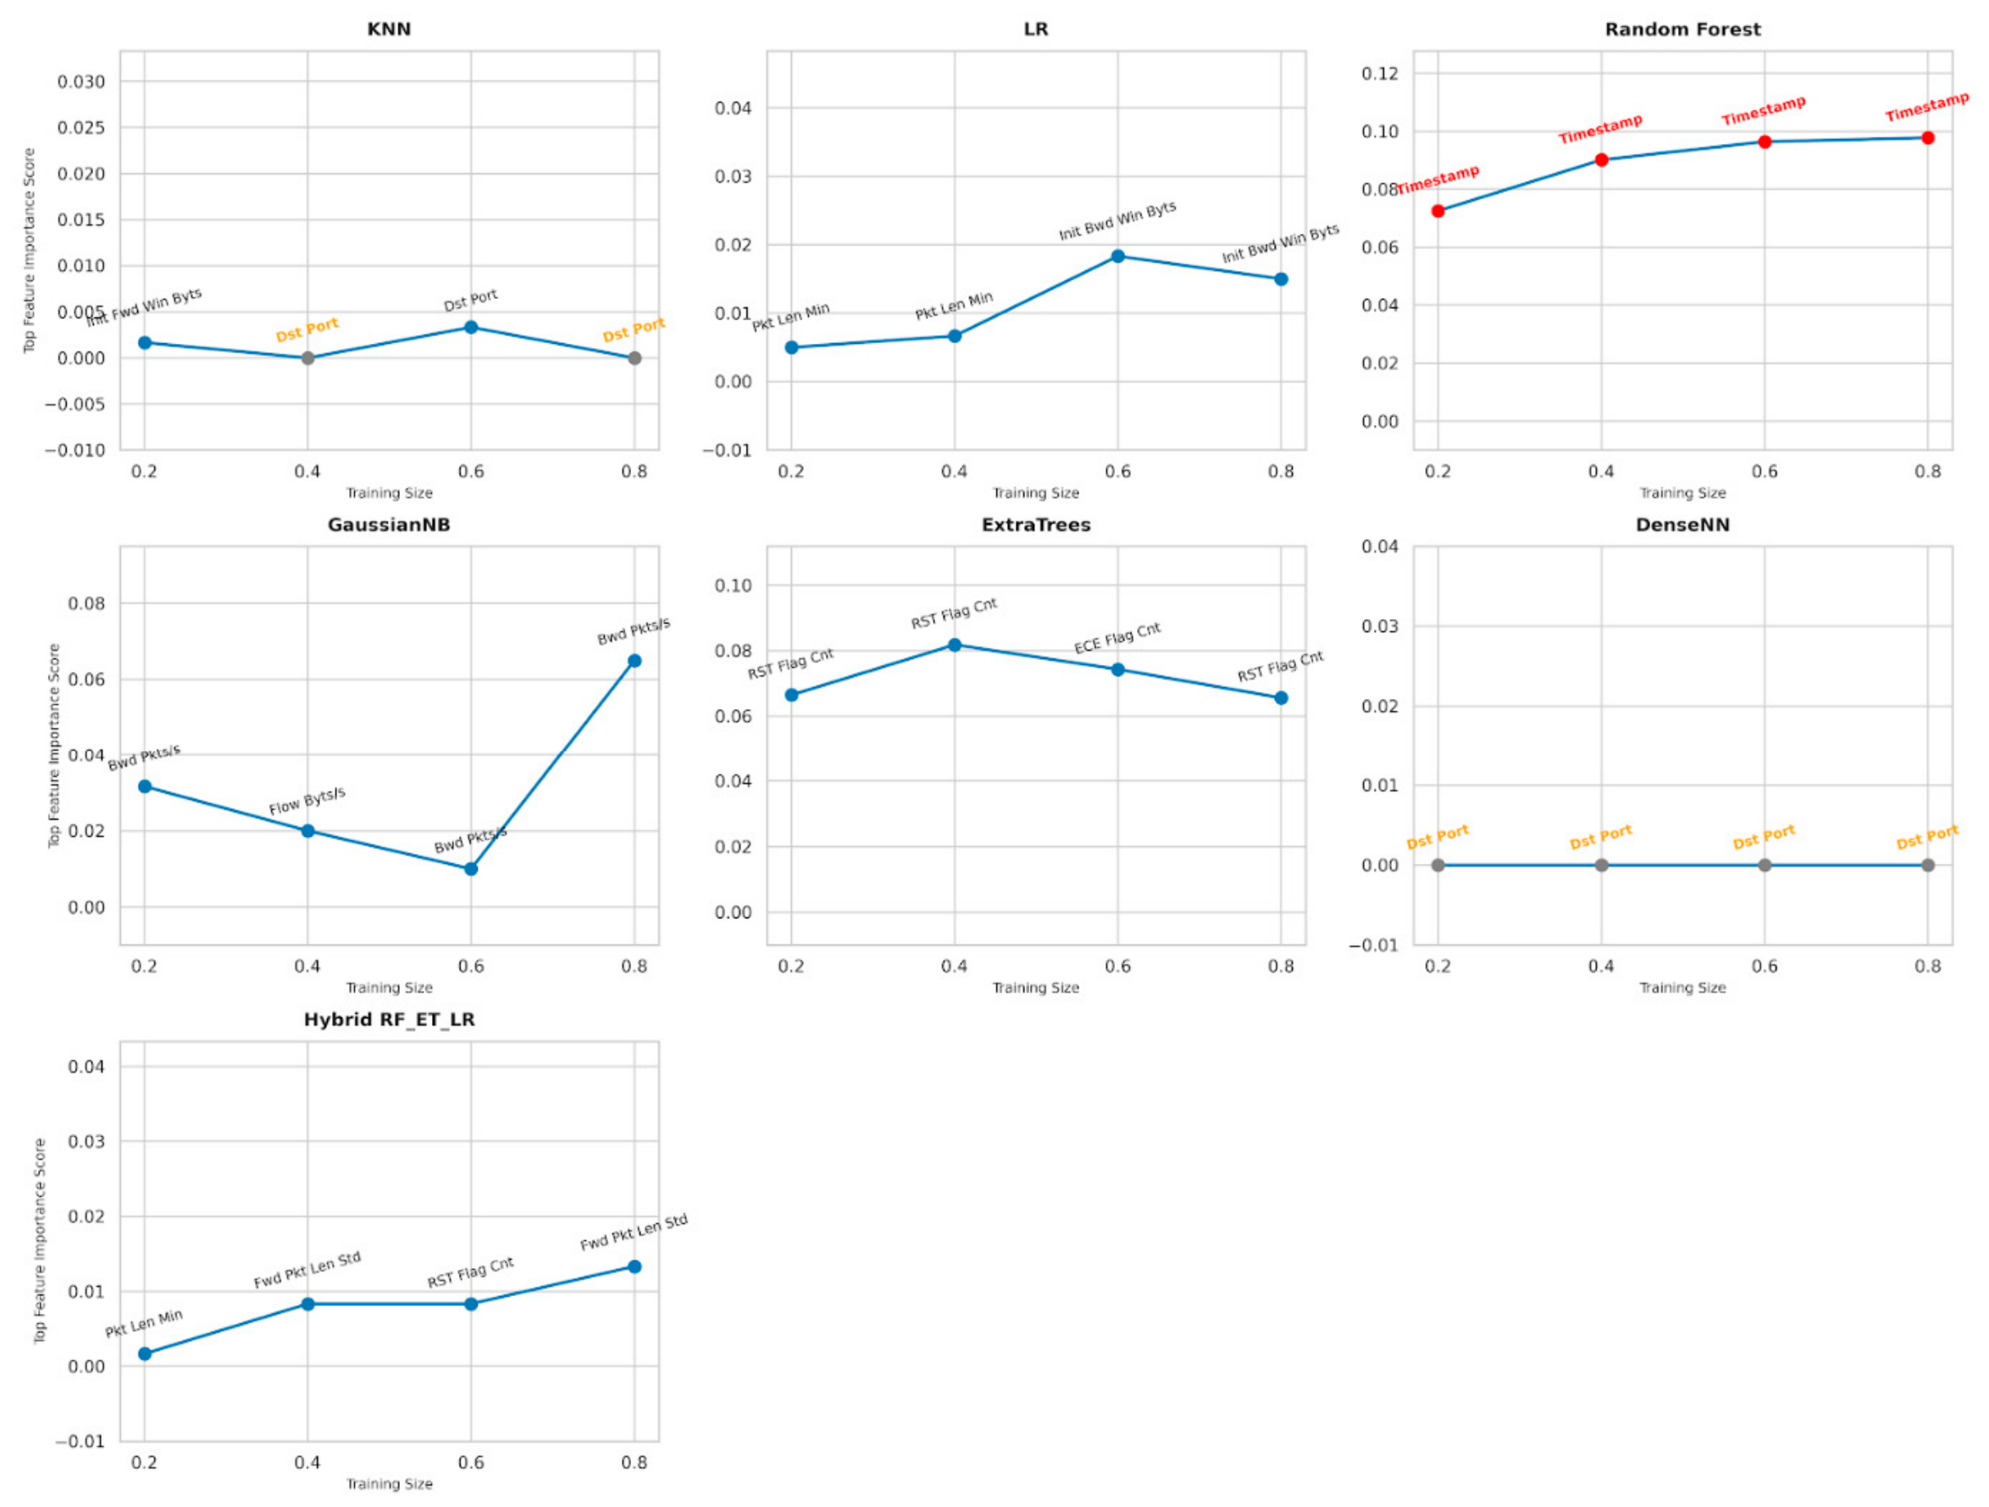
The stability of model reasoning is presented in Table 3 and Figure 10. ET is found to be stable and it is able to detect the TCP flags consistently, whereas other models such as LR and KNN are found to have ‘feature drift’ which means that the top features vary across training volumes. Most importantly, the absolute dependence of ‘Timestamp’ (highlighted in red) is clearly demonstrated by Random Forest, whereas the flat line at zero is clearly demonstrated by DenseNN, indicating that the XAI was not extracted.
Table 3.
Top identified feature and feature importance score (baseline run, with Timestamp retained—this is the analysis that discovered the leakage artifact, not a re-analysis of the leakage-removed results).
Figure 10.
XAI Stability Analysis—evolution of top features across training volumes for different ML models (baseline run, with Timestamp retained—this is the analysis that discovered the leakage artifact described in Section 4.5, not a re-analysis of the leakage-removed results).
4.6. Implications for Zero-Day Detection
Strong within-distribution statistical performance does not necessarily imply operational viability or zero-day readiness. On the standard within-distribution comparison, ET appeared to be a strong approach for zero-day detection: its R2 (≈0.80) is comparable to Random Forest and DenseNN, and it relies on logical TCP flag features rather than temporal data leaks. However, the strict Leave-One-Attack-Out evaluation reported in Section 4.7 shows this within-distribution promise does not hold under genuine zero-day conditions: ET’s LOAO generalization (mean F1 = 0.249) is in fact weaker than the simpler Logistic Regression model (mean F1 = 0.397), underscoring that operational speed and within-distribution accuracy are not, on their own, sufficient evidence of zero-day readiness.
4.7. Results After Removing Timestamp, Corrected Error-Metric Calculation, and Full Zero-Day Generalization Analysis
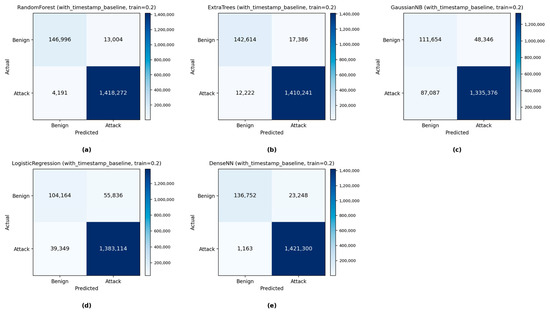
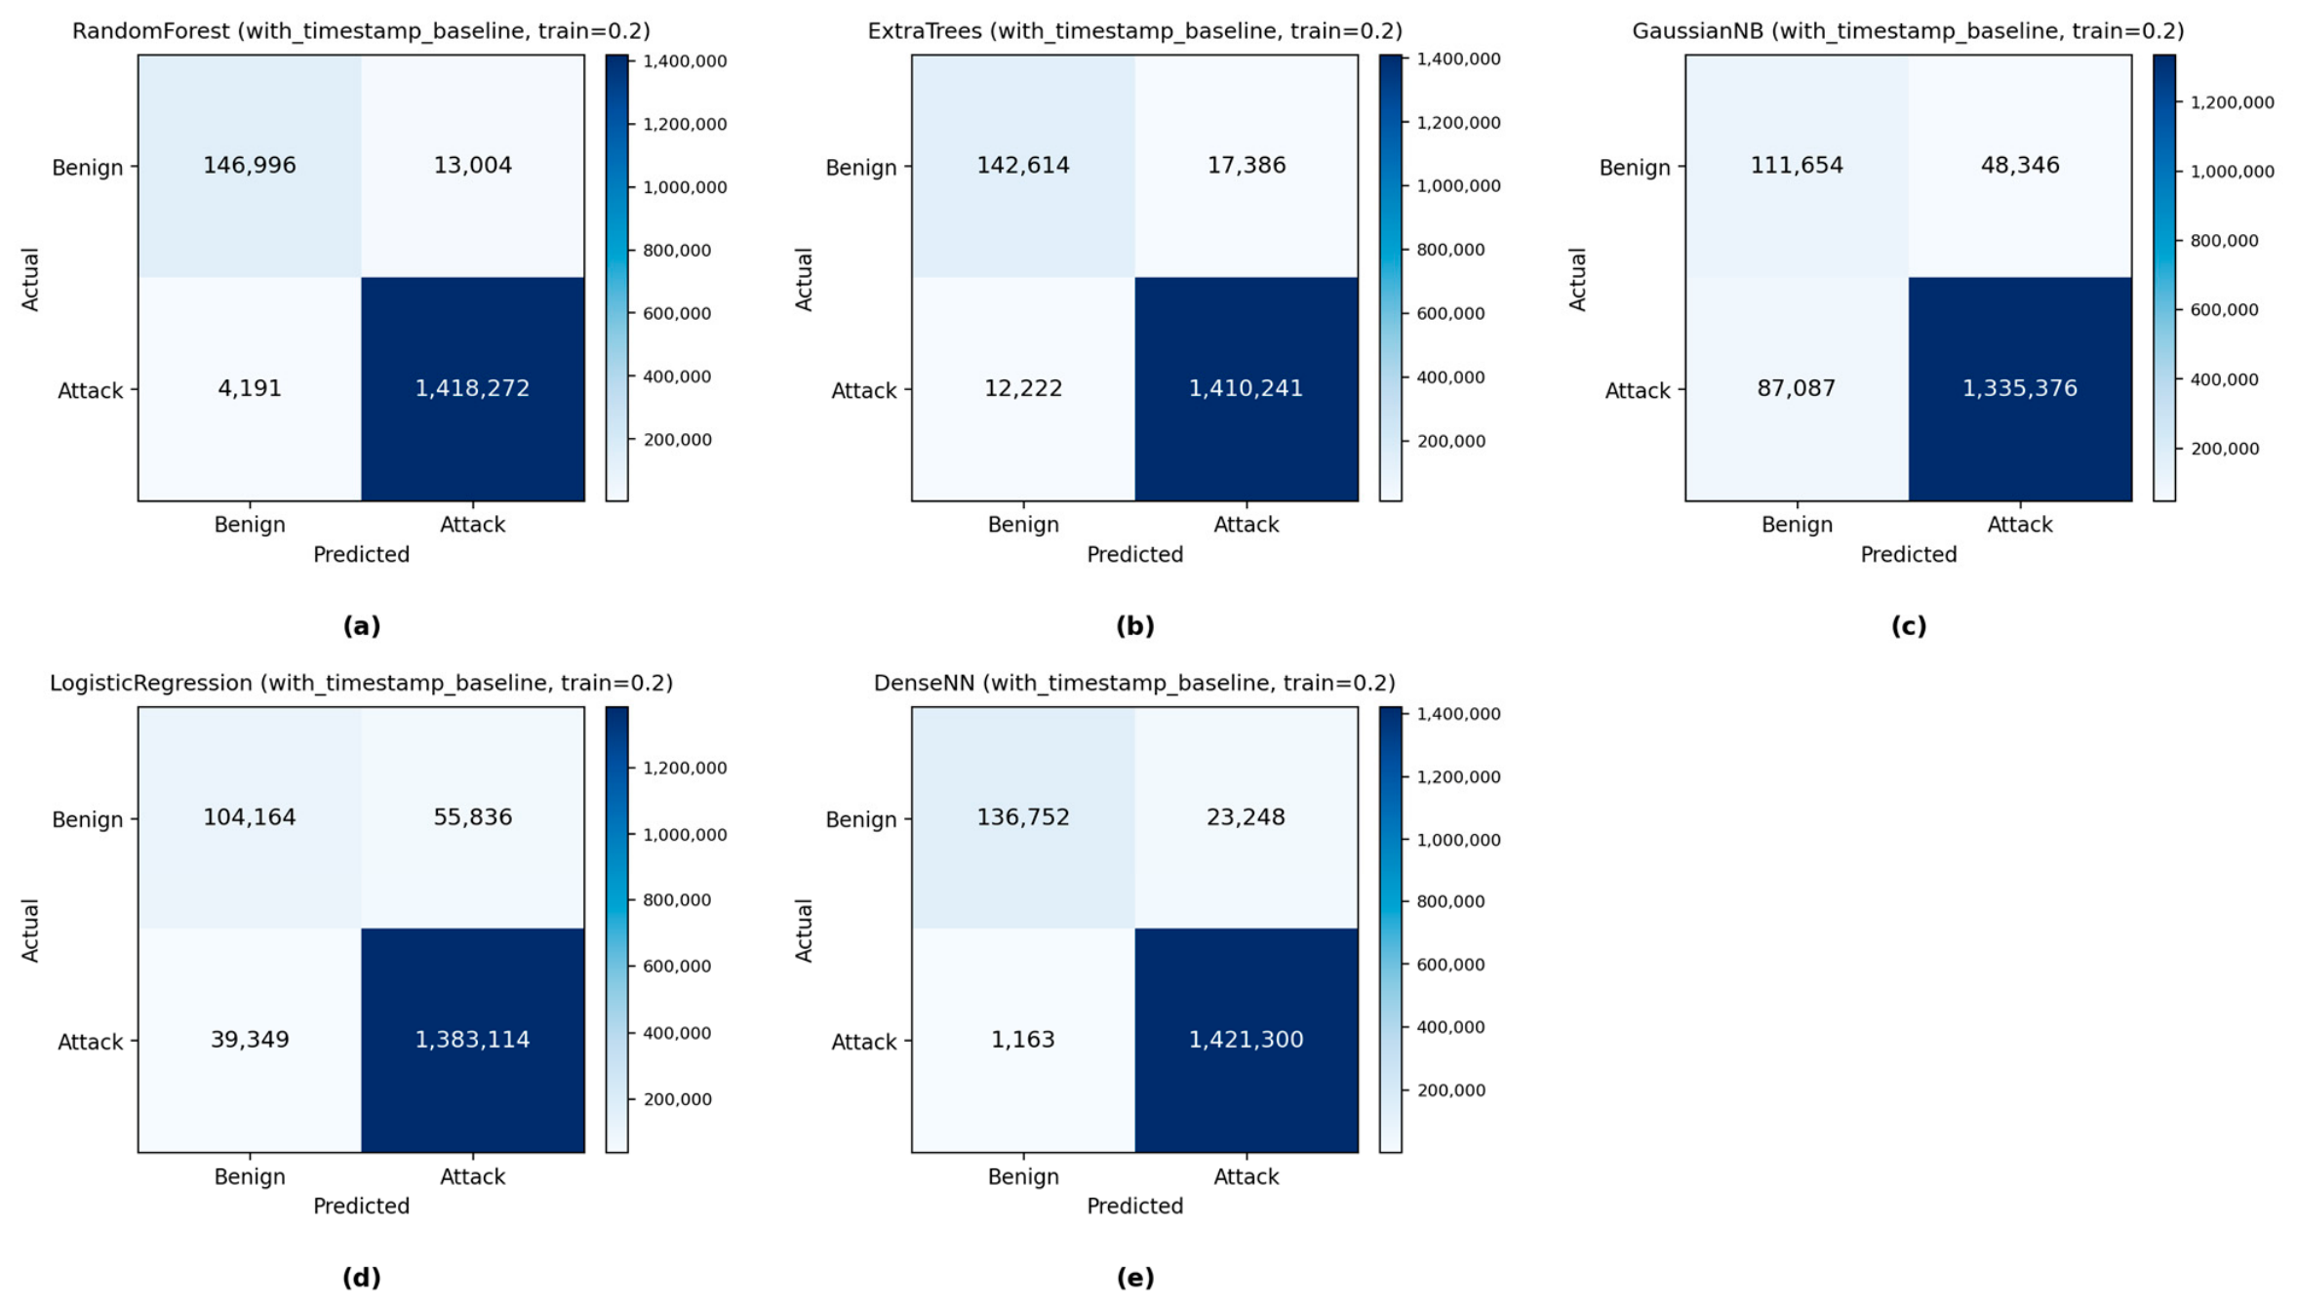
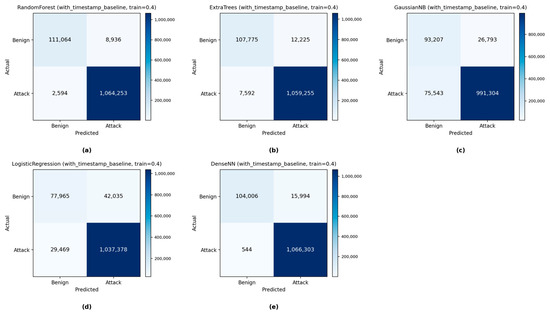
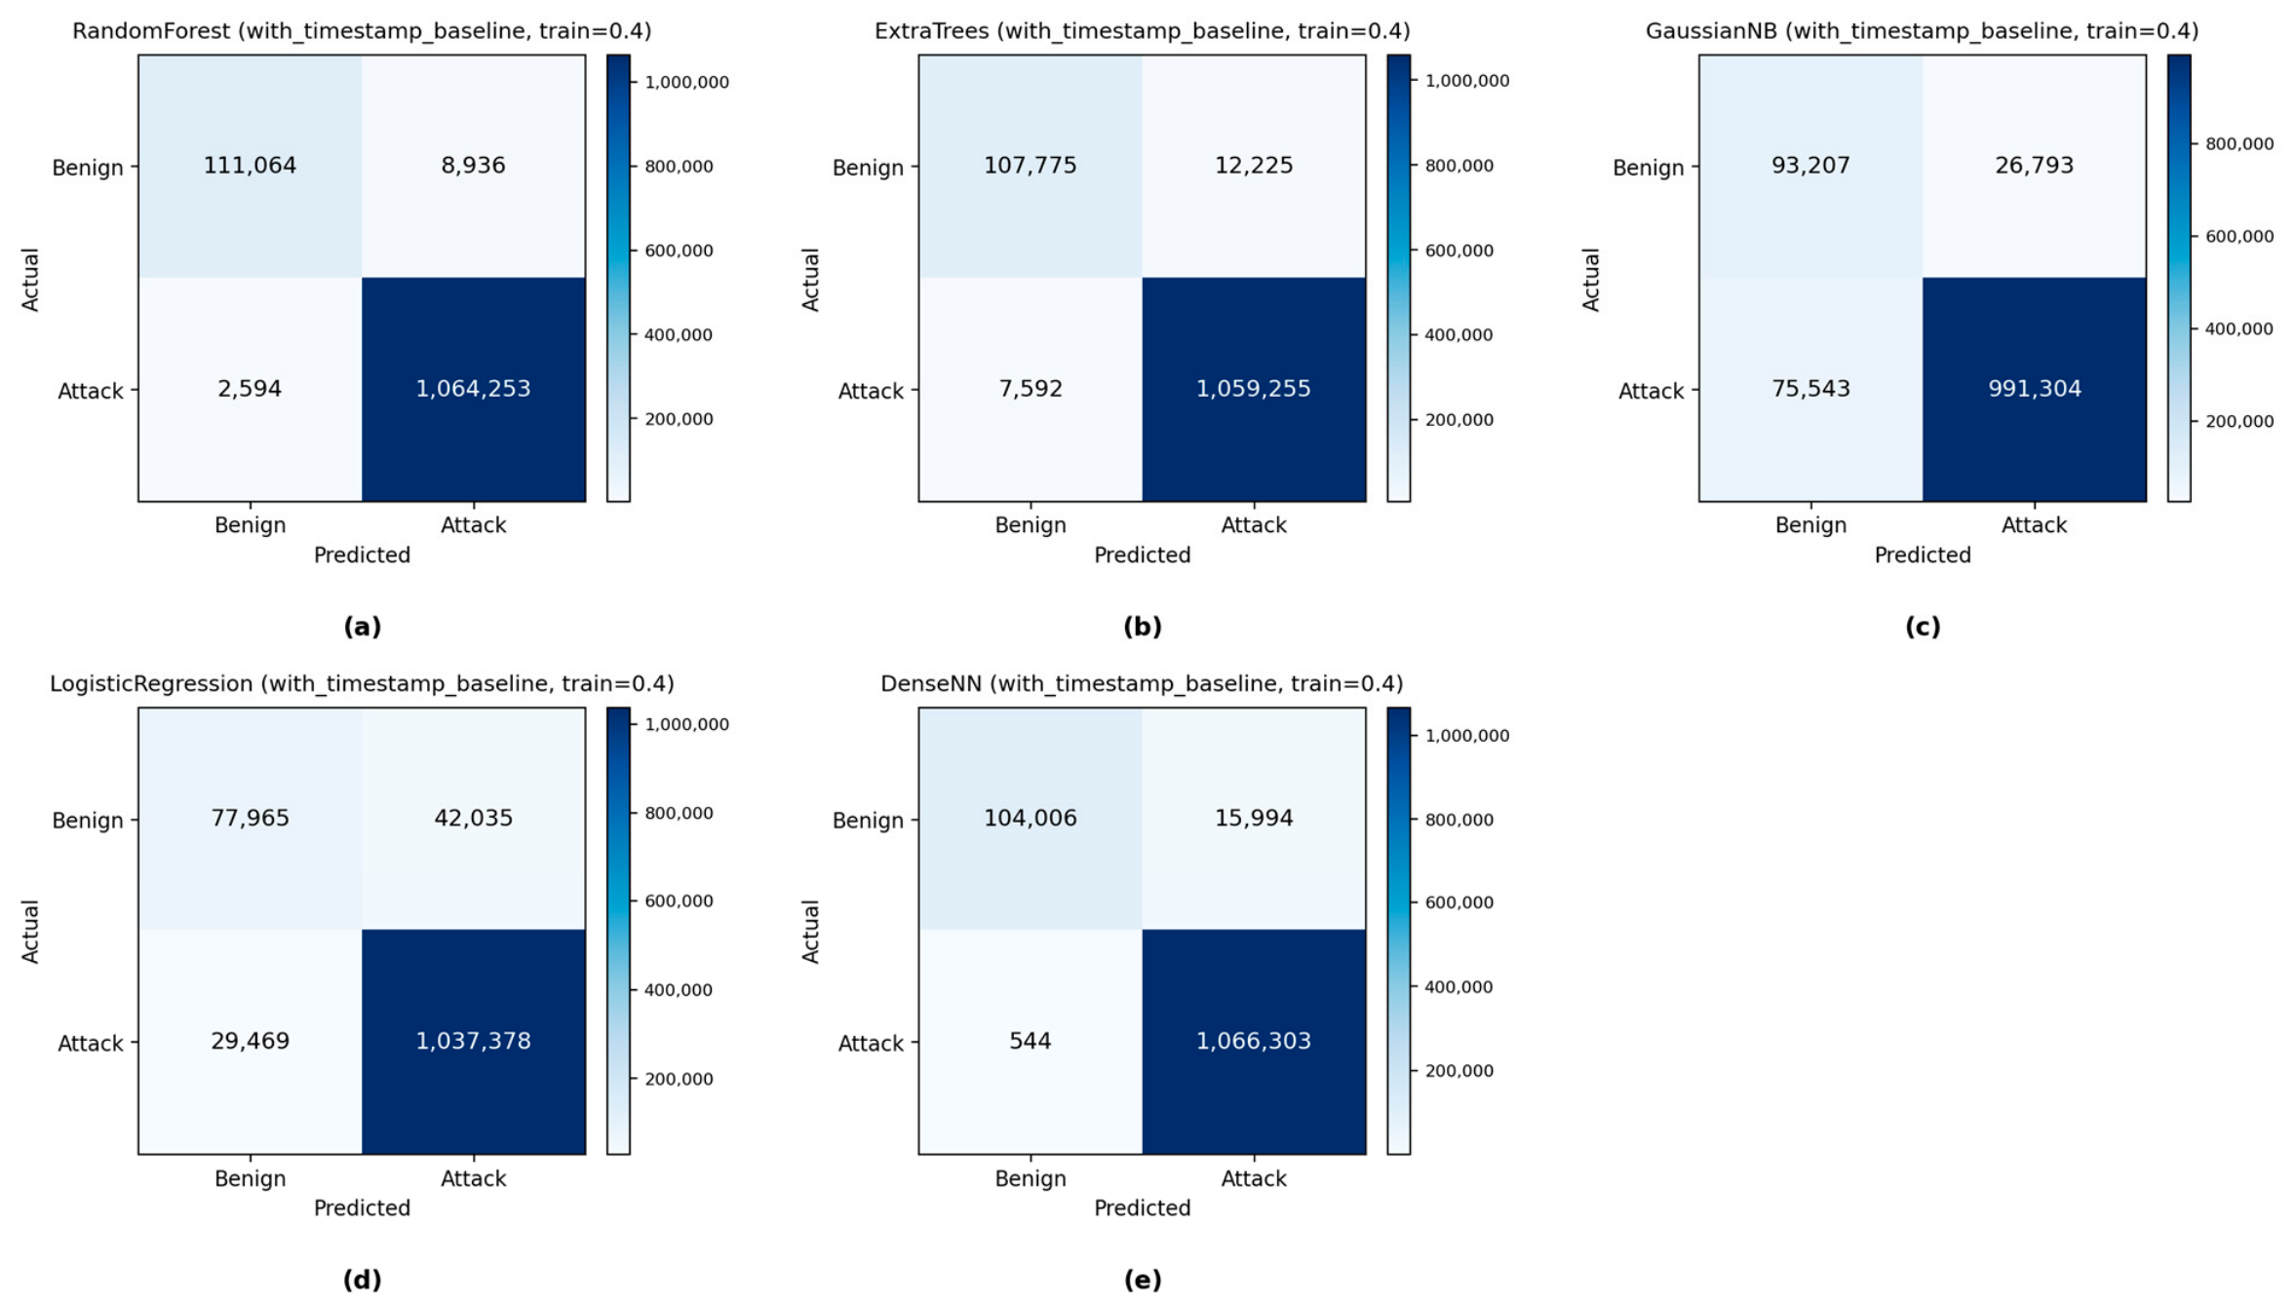
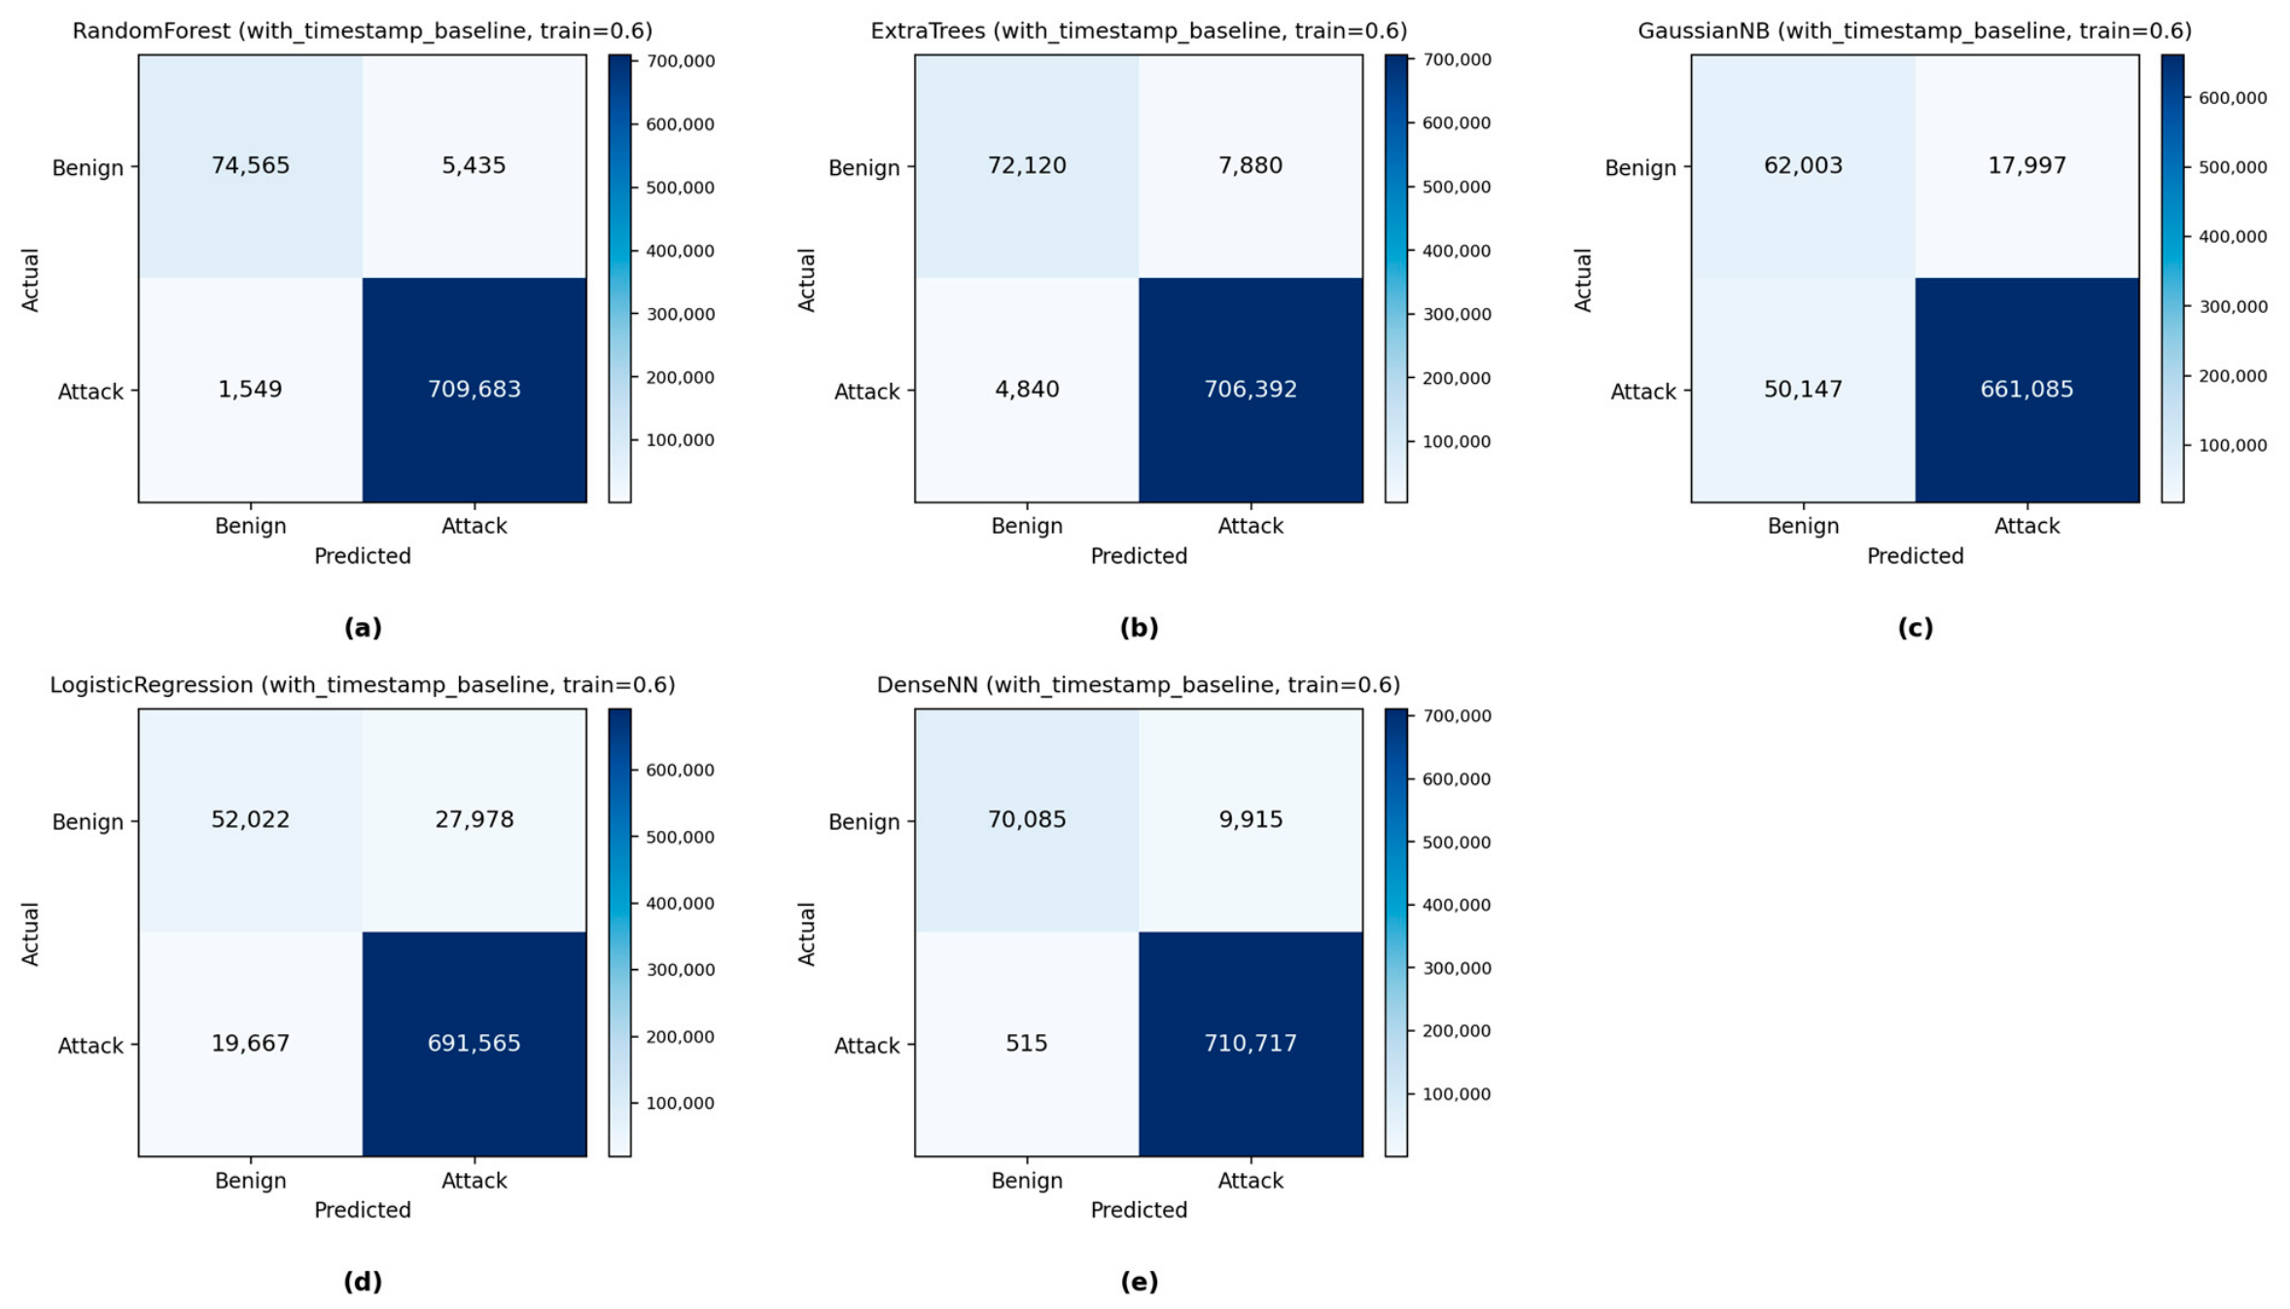
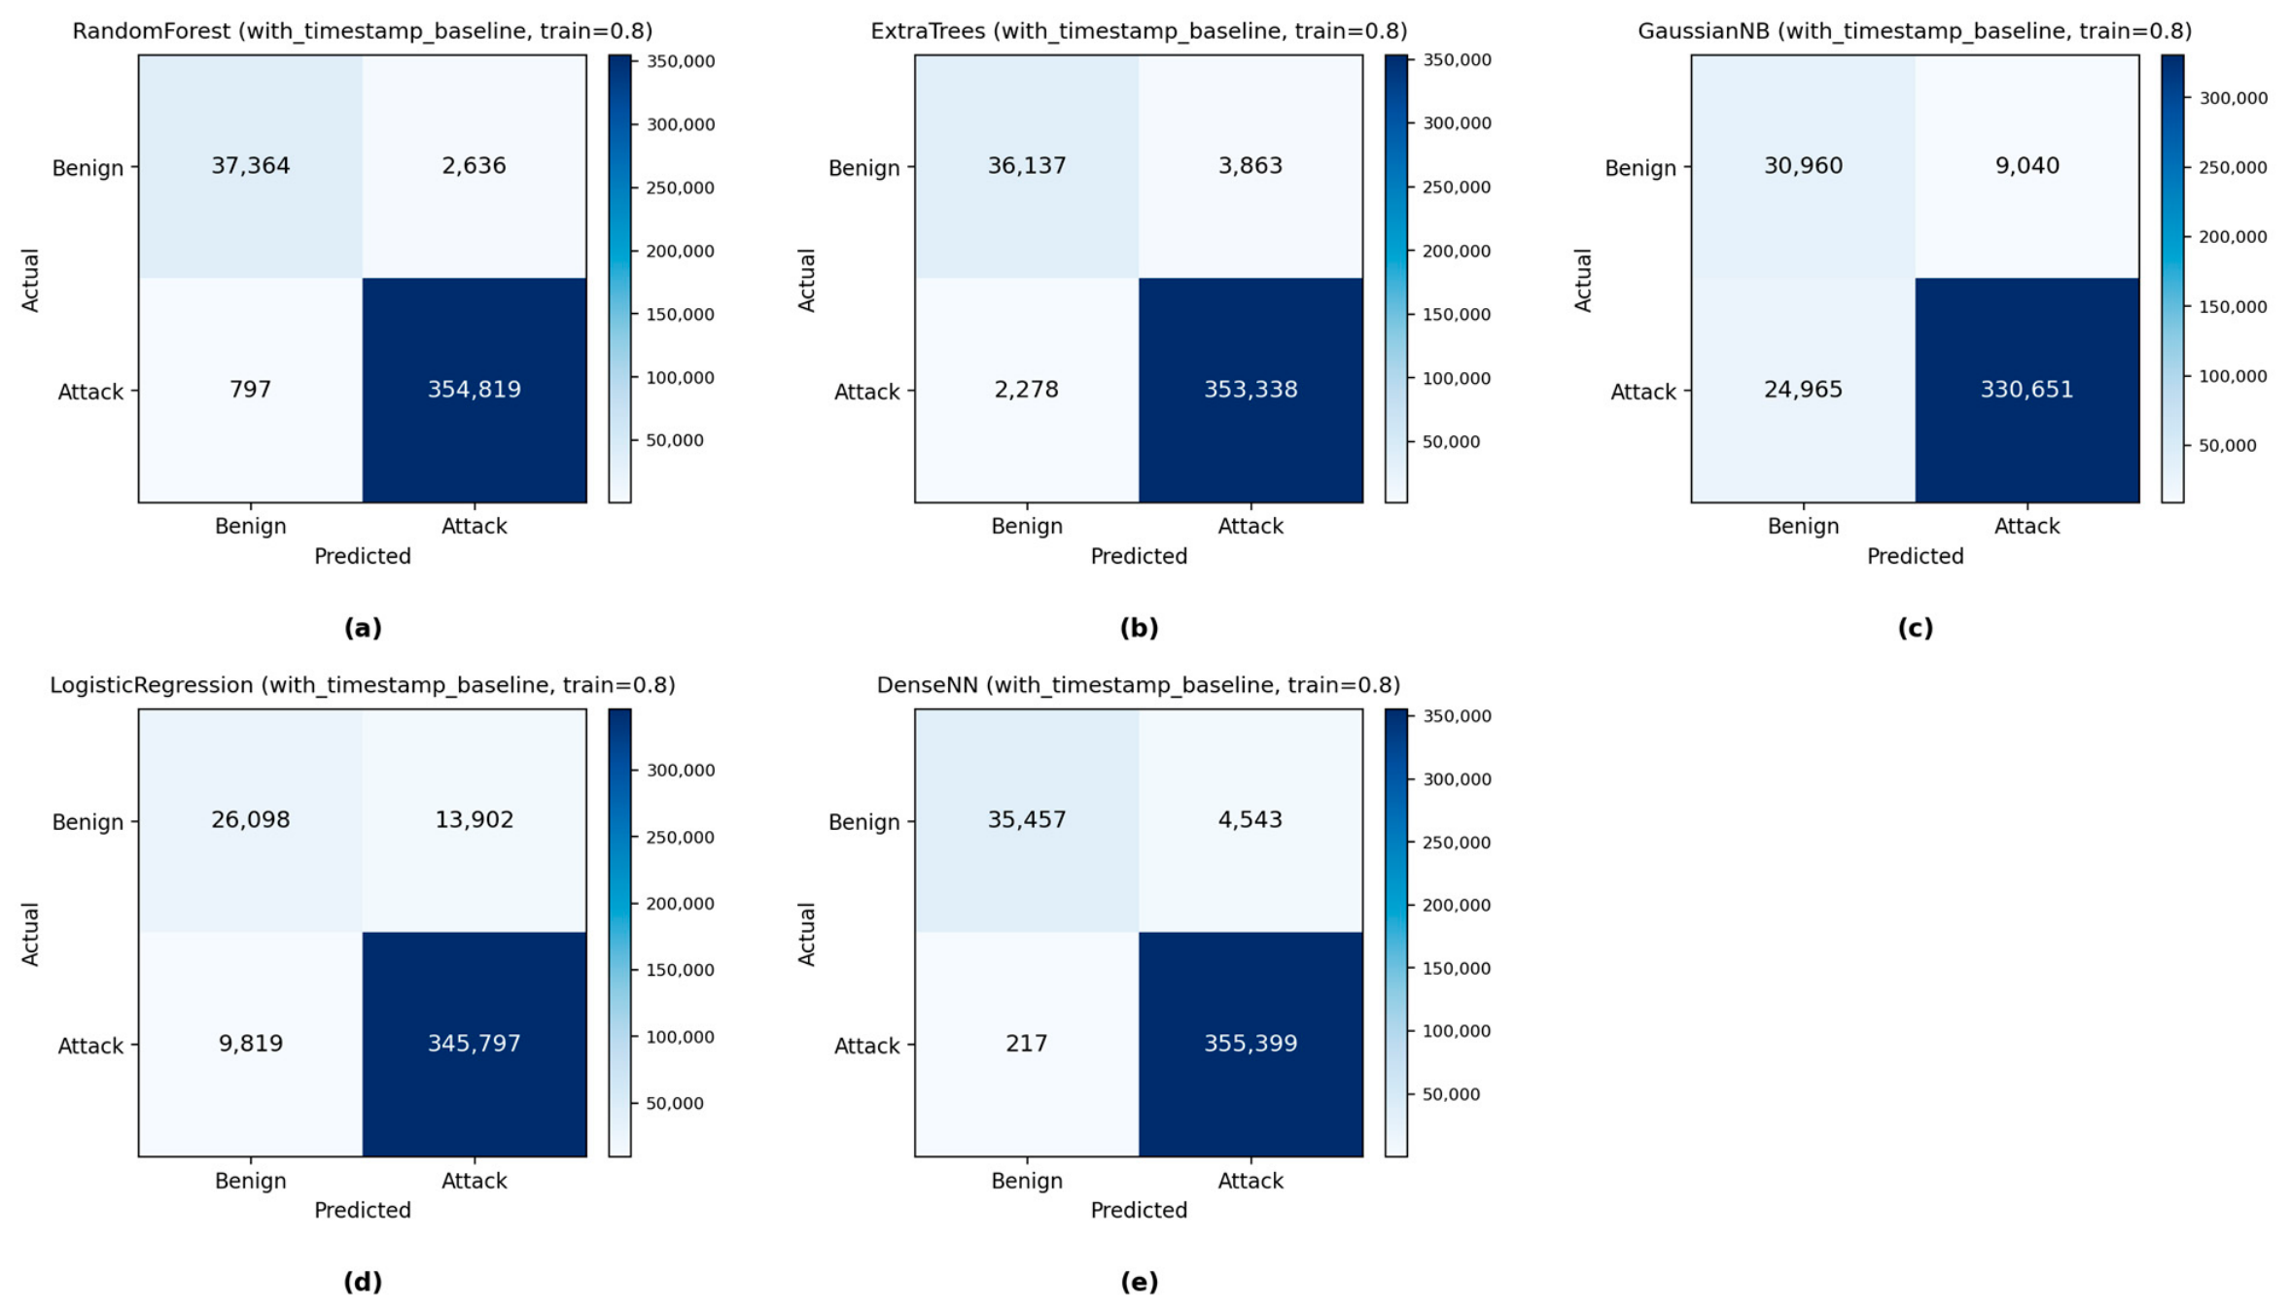
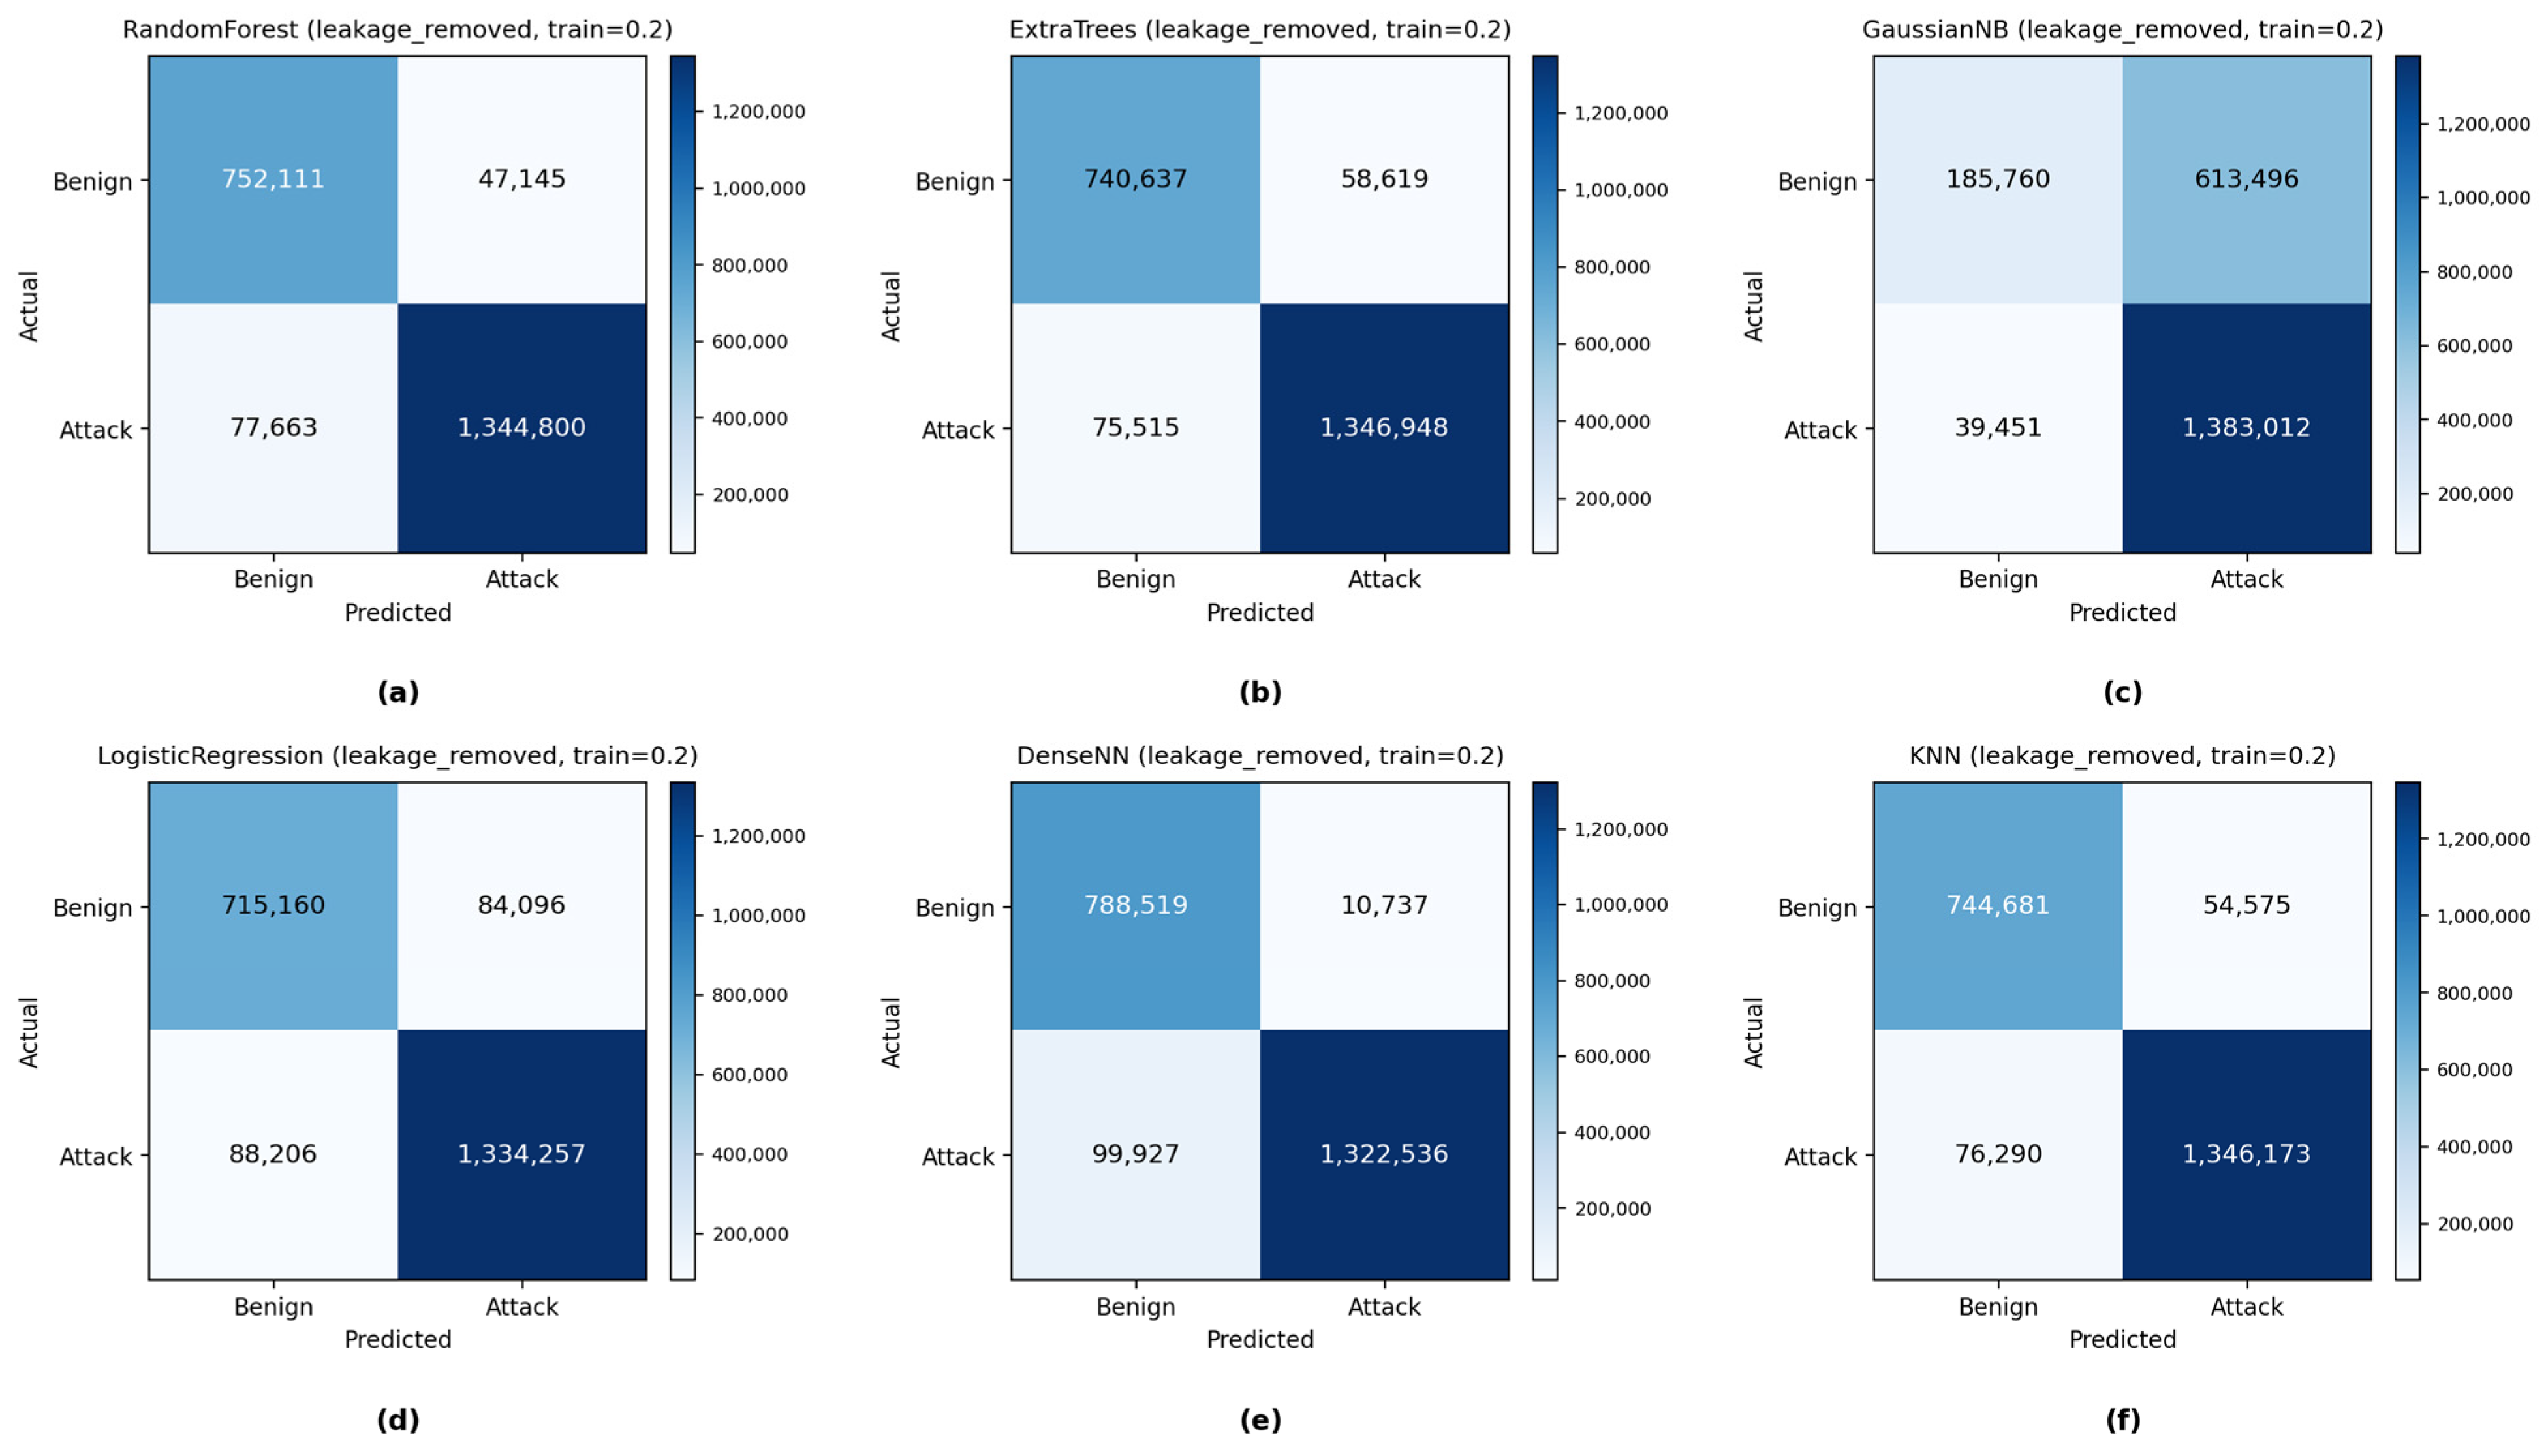
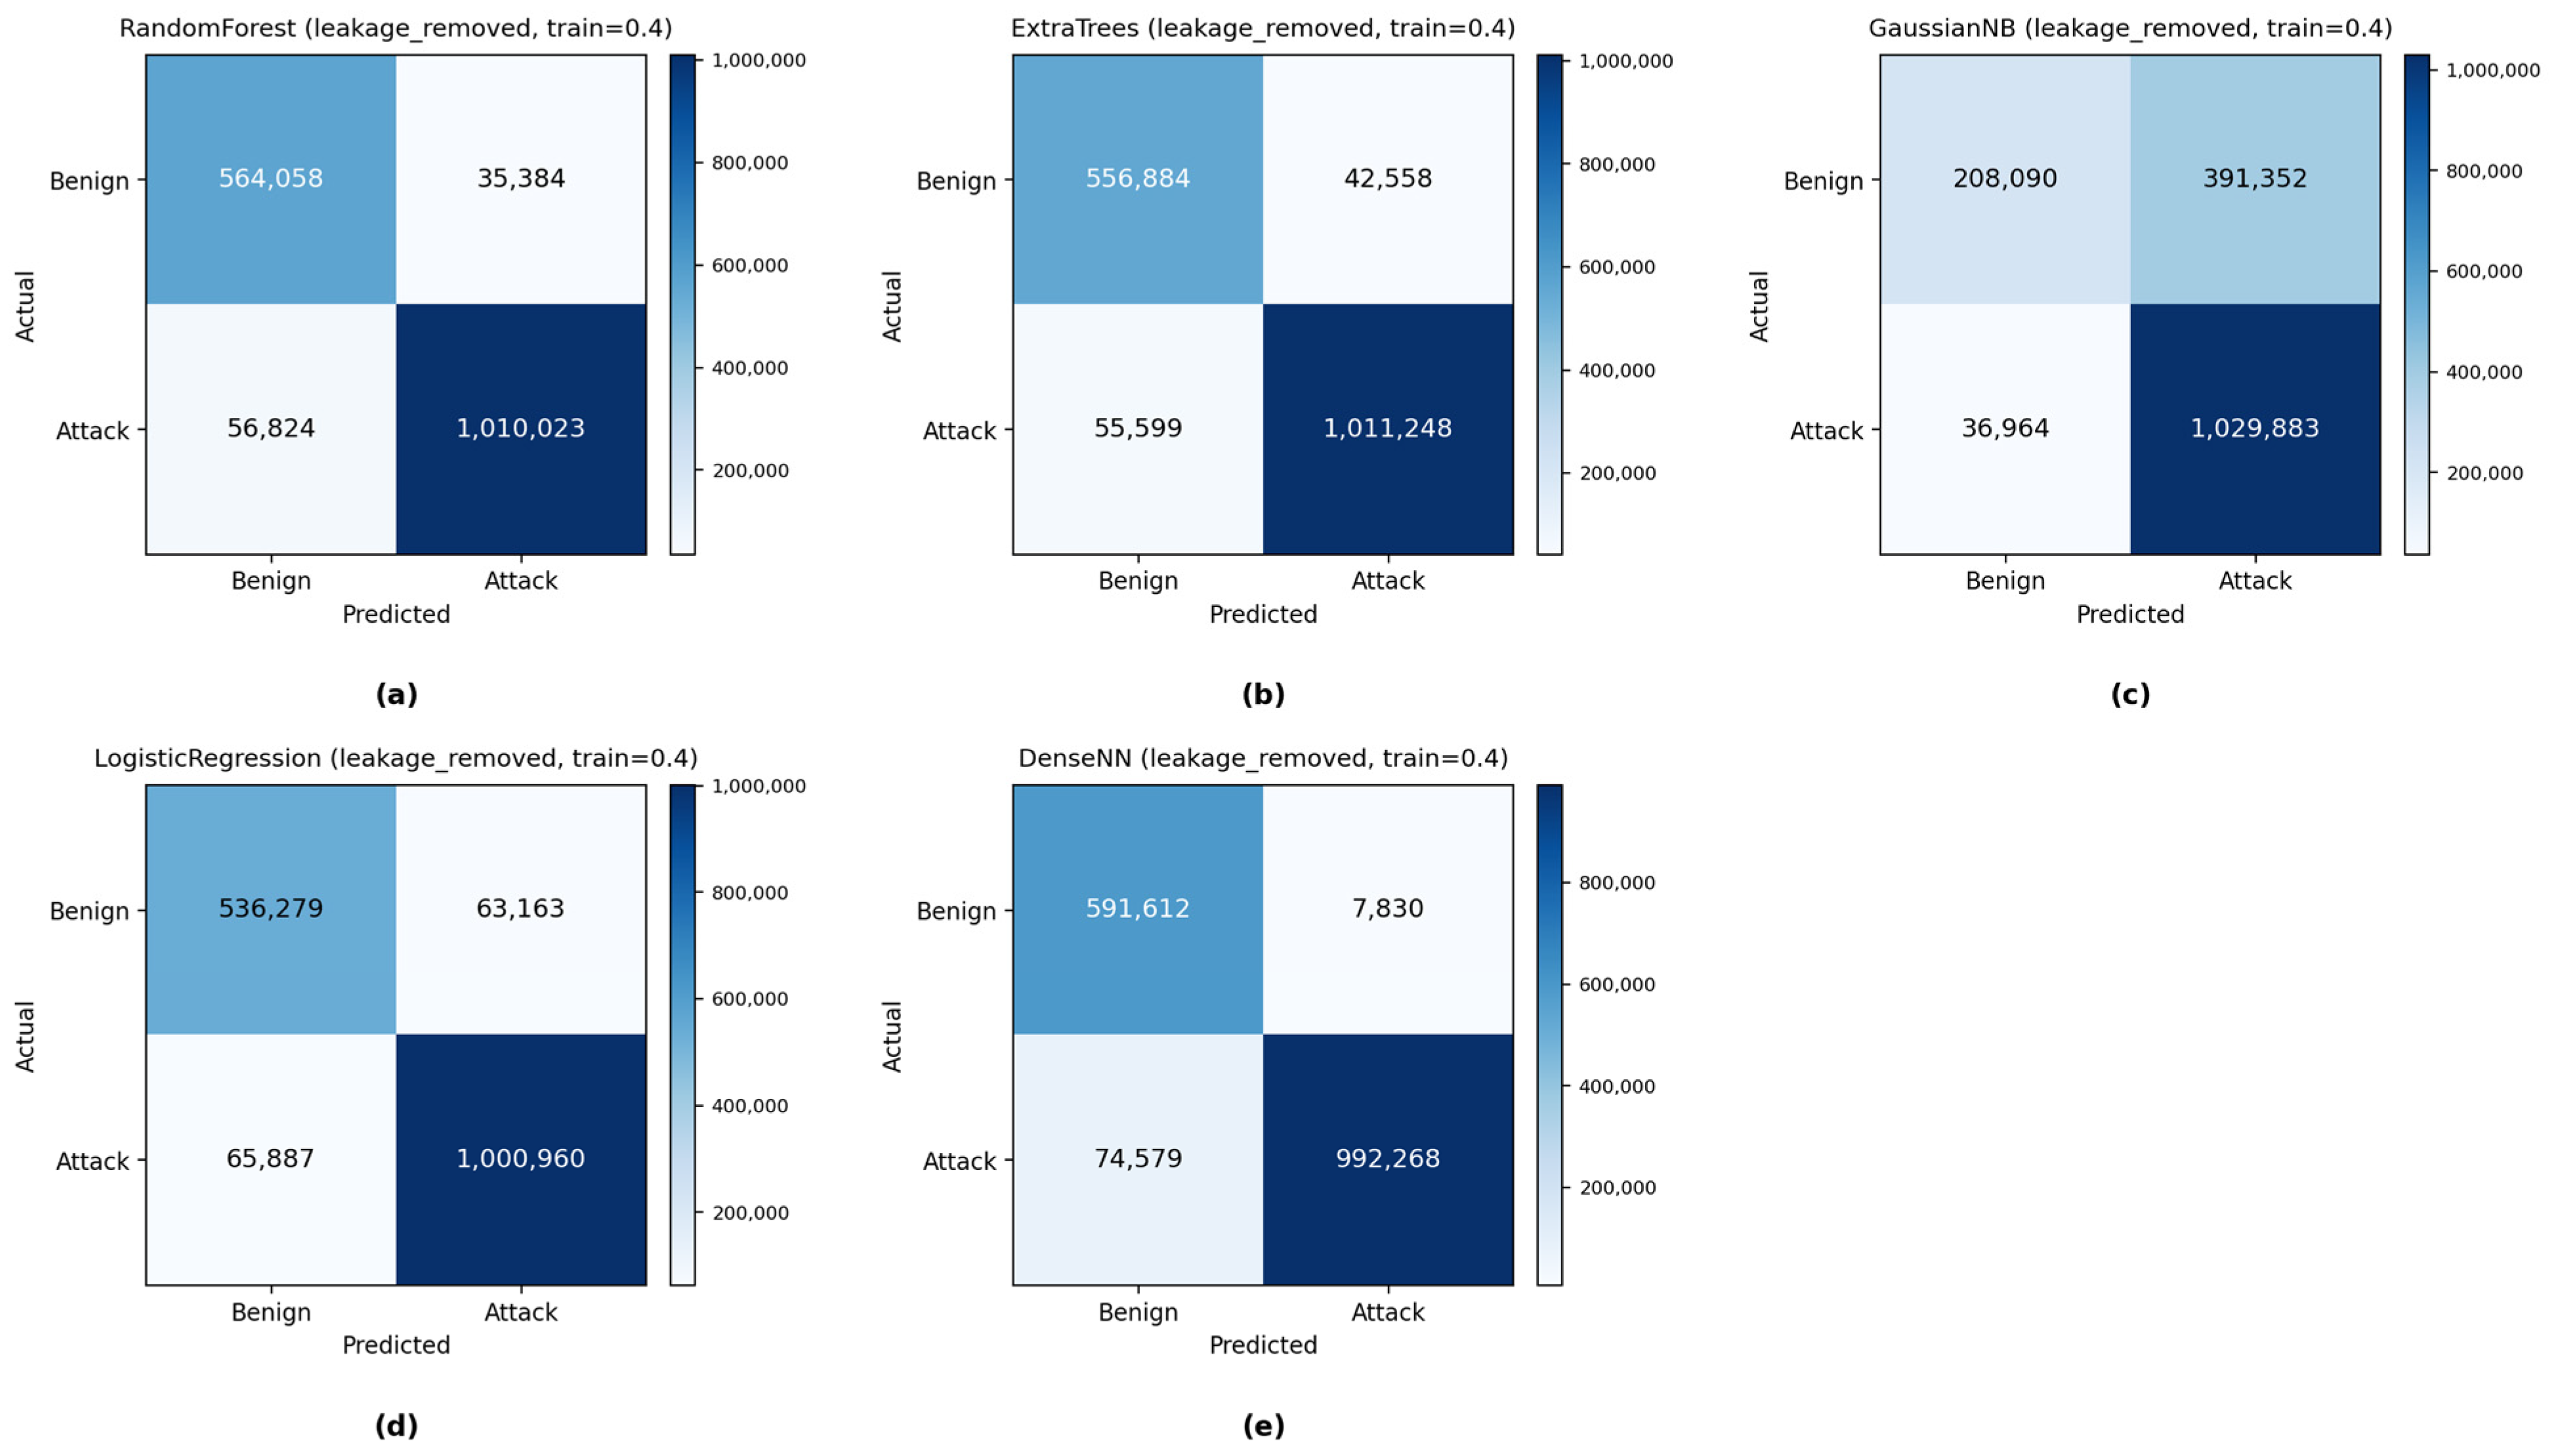
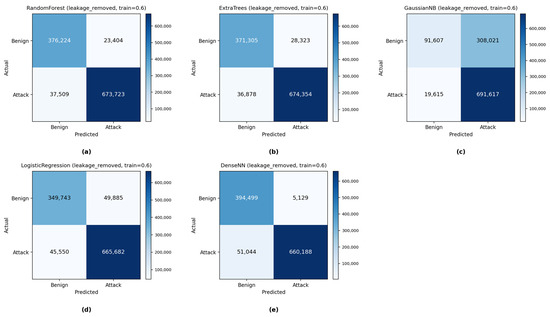
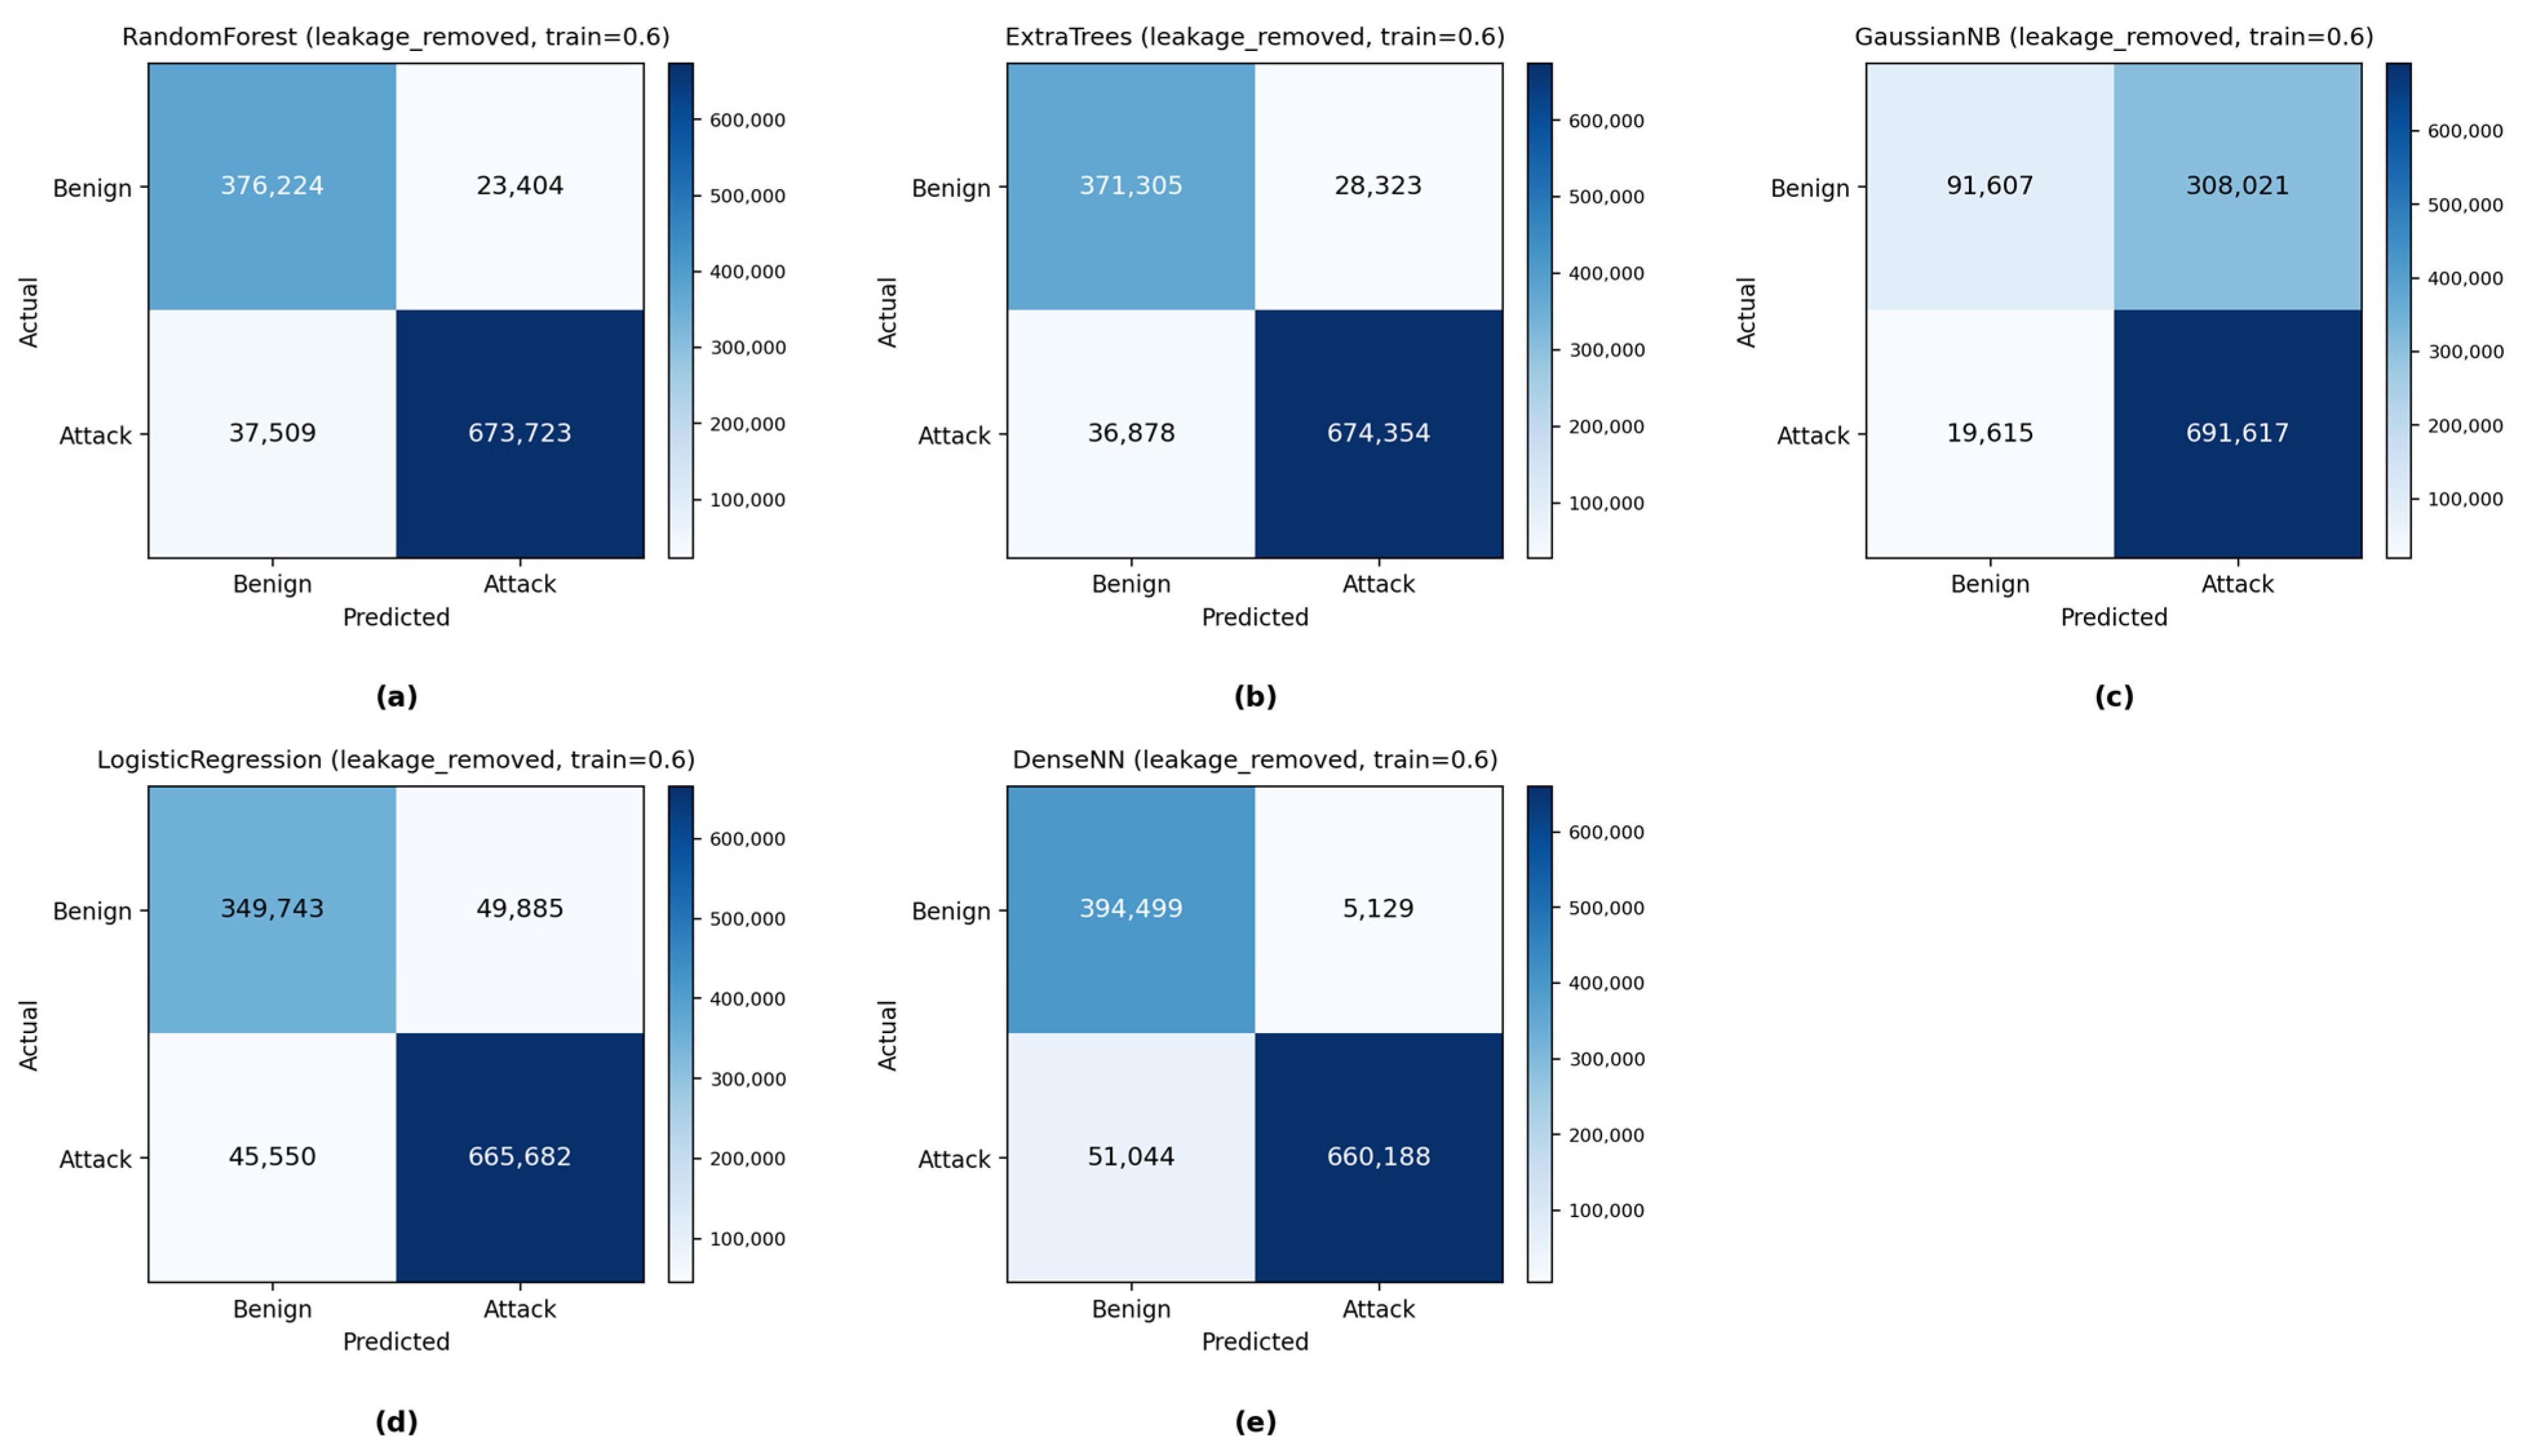
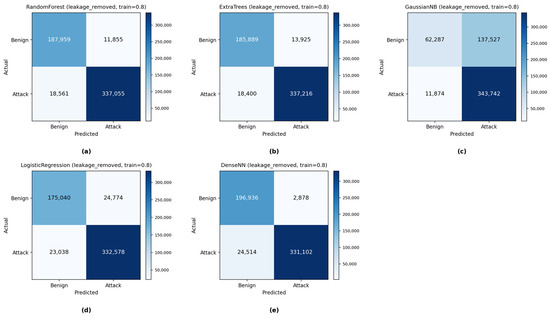
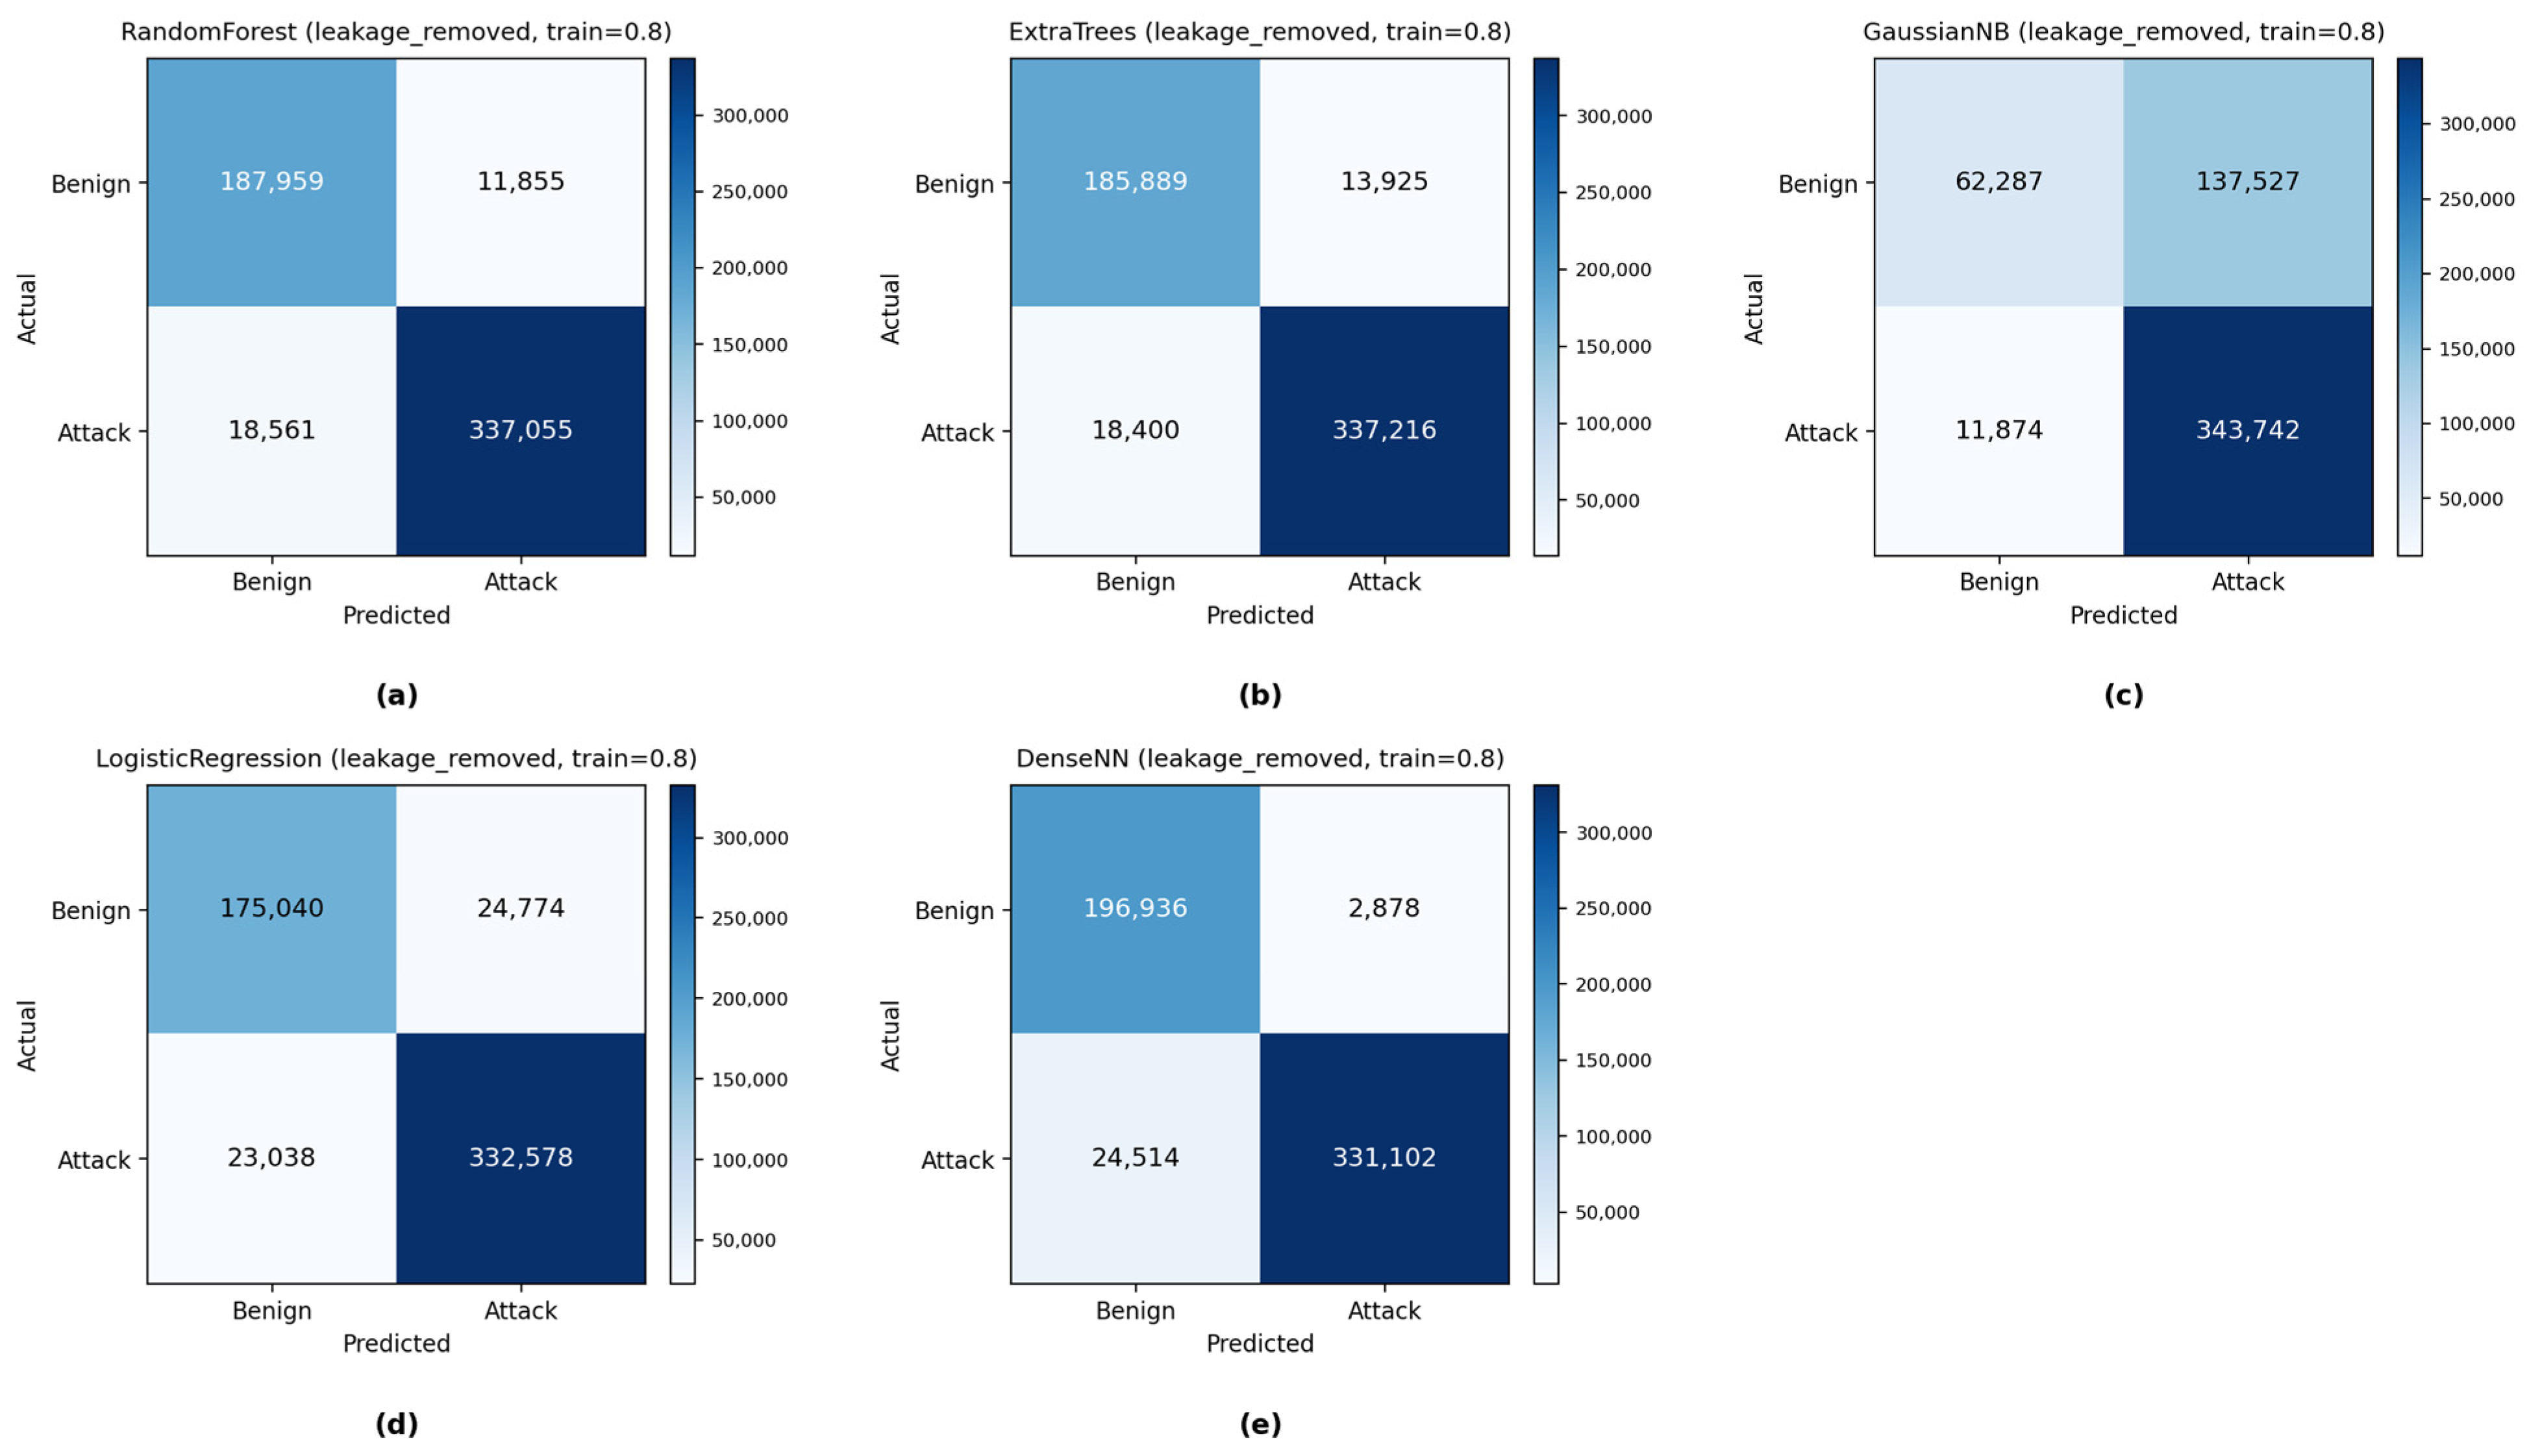
Every experiment (for the five core models—Logistic Regression, Gaussian NB, Random Forest, Extra Trees, and DenseNN; KNN only at the 20% ratio due to its computational cost, and the hybrid model not included in this analysis) was re-run after removing Timestamp (and the other identifier/artifact features Flow ID, source/destination IP, and source port) on the full merged CSE-CIC-IDS2018 dataset, at all four training ratios (20/40/60/80%). Table 4 quantifies the resulting effect for every model at every ratio. Figure 11, Figure 12, Figure 13, Figure 14, Figure 15, Figure 16, Figure 17 and Figure 18 show the corresponding confusion matrices for all five models at each of the four training ratios, with and without Timestamp respectively.
Table 4.
Effect of removing Timestamp (TS) and other leakage-prone features on model performance, across all four training ratios.
Figure 11.
Confusion matrices at 20% training ratio with Timestamp retained (leakage baseline): (a) Random Forest, (b) Extra Trees, (c) Gaussian NB, (d) Logistic Regression, (e) DenseNN.
Figure 12.
Confusion matrices at 40% training ratio with Timestamp retained (leakage baseline): (a) Random Forest, (b) Extra Trees, (c) Gaussian NB, (d) Logistic Regression, (e) DenseNN.
Figure 13.
Confusion matrices at 60% training ratio with Timestamp retained (leakage baseline): (a) Random Forest, (b) Extra Trees, (c) Gaussian NB, (d) Logistic Regression, (e) DenseNN.
Figure 14.
Confusion matrices at 80% training ratio with Timestamp retained (leakage baseline): (a) Random Forest, (b) Extra Trees, (c) Gaussian NB, (d) Logistic Regression, (e) DenseNN.
Figure 15.
Confusion matrices at 20% training ratio after removing Timestamp and other leakage-prone features: (a) Random Forest, (b) Extra Trees, (c) Gaussian NB, (d) Logistic Regression, (e) DenseNN, (f) KNN. (KNN was computationally intractable to run at the higher training ratios on the available hardware and is therefore reported only at 20% training ratio; see Section 4.4).
Figure 16.
Confusion matrices at 40% training ratio after removing Timestamp and other leakage-prone features: (a) Random Forest, (b) Extra Trees, (c) Gaussian NB, (d) Logistic Regression, (e) DenseNN.
Figure 17.
Confusion matrices at 60% training ratio after removing Timestamp and other leakage-prone features: (a) Random Forest, (b) Extra Trees, (c) Gaussian NB, (d) Logistic Regression, (e) DenseNN.
Figure 18.
Confusion matrices at 80% training ratio after removing Timestamp and other leakage-prone features: (a) Random Forest, (b) Extra Trees, (c) Gaussian NB, (d) Logistic Regression, (e) DenseNN.
Timestamp inflated every model’s apparent performance at every training ratio, most severely Gaussian NB (−17 to −21 accuracy points depending on ratio). A labeled Benign/Attack confusion matrix, and explicit False-Positive Rate (FPR) and False-Negative Rate (FNR), are now generated for every (model × ratio × feature-set) combination—41 individual confusion matrices (5 core models × 4 training ratios for the with-Timestamp baseline = 20, plus the same 5 models × 4 ratios for the leakage-removed condition = 20, plus KNN at the 20% leakage-removed ratio = 1), grouped into eight composite figures shown above as Figure 11, Figure 12, Figure 13, Figure 14, Figure 15, Figure 16, Figure 17 and Figure 18 (grouped by ratio and condition); the same 41 individual, full-resolution confusion matrices are available from the corresponding author upon reasonable request.
Regarding the RMSE calculation issue: the original implementation computed RMSE/MAE/R2 on raw multi-class label indices (0–13), which have no true metric distance—a model that misclassifies into a numerically distant class code can legally produce RMSE > 1, which is what occurred for the weakest model (Gaussian NB) in the original submission. This did not match the manuscript’s own description of the metric as computed “between the estimated probabilities and the actual binary labels (0 or 1).” The corrected implementation computes RMSE/MAE/R2 exclusively on the predicted probability of the Attack class against the true binary label, which is mathematically bounded in [0, 1]. On the corrected, full re-run, the maximum RMSE observed across every model and every training ratio is 0.538 (Gaussian NB, train ratio = 0.6); no model exceeds 1 anywhere in the results.
Full LOAO results: Table 5 reports mean performance across all 13 held-out attack families for each model. Precision, Recall, F1, MCC, PR-AUC, ROC-AUC, and FPR/FNR are reported as the primary metrics. Values are macro-averaged across the 13 held-out families and the three repetitions per family (39 folds per model); per-family, per-repetition results, including standard deviation across repetitions, are reported in full in available from the corresponding author upon reasonable request, since family-level sample sizes vary substantially and a single pooled SD would obscure this heterogeneity.
Table 5.
LOAO zero-day generalization performance, averaged across all 13 held-out attack families.
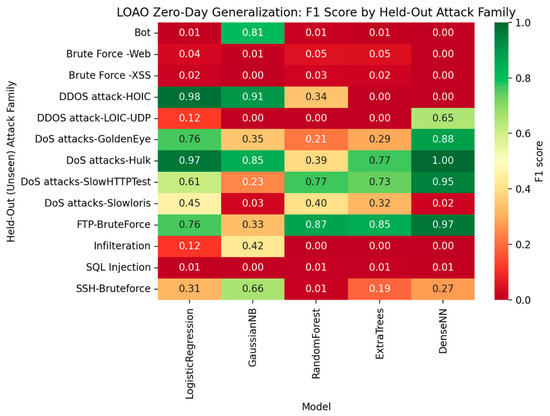
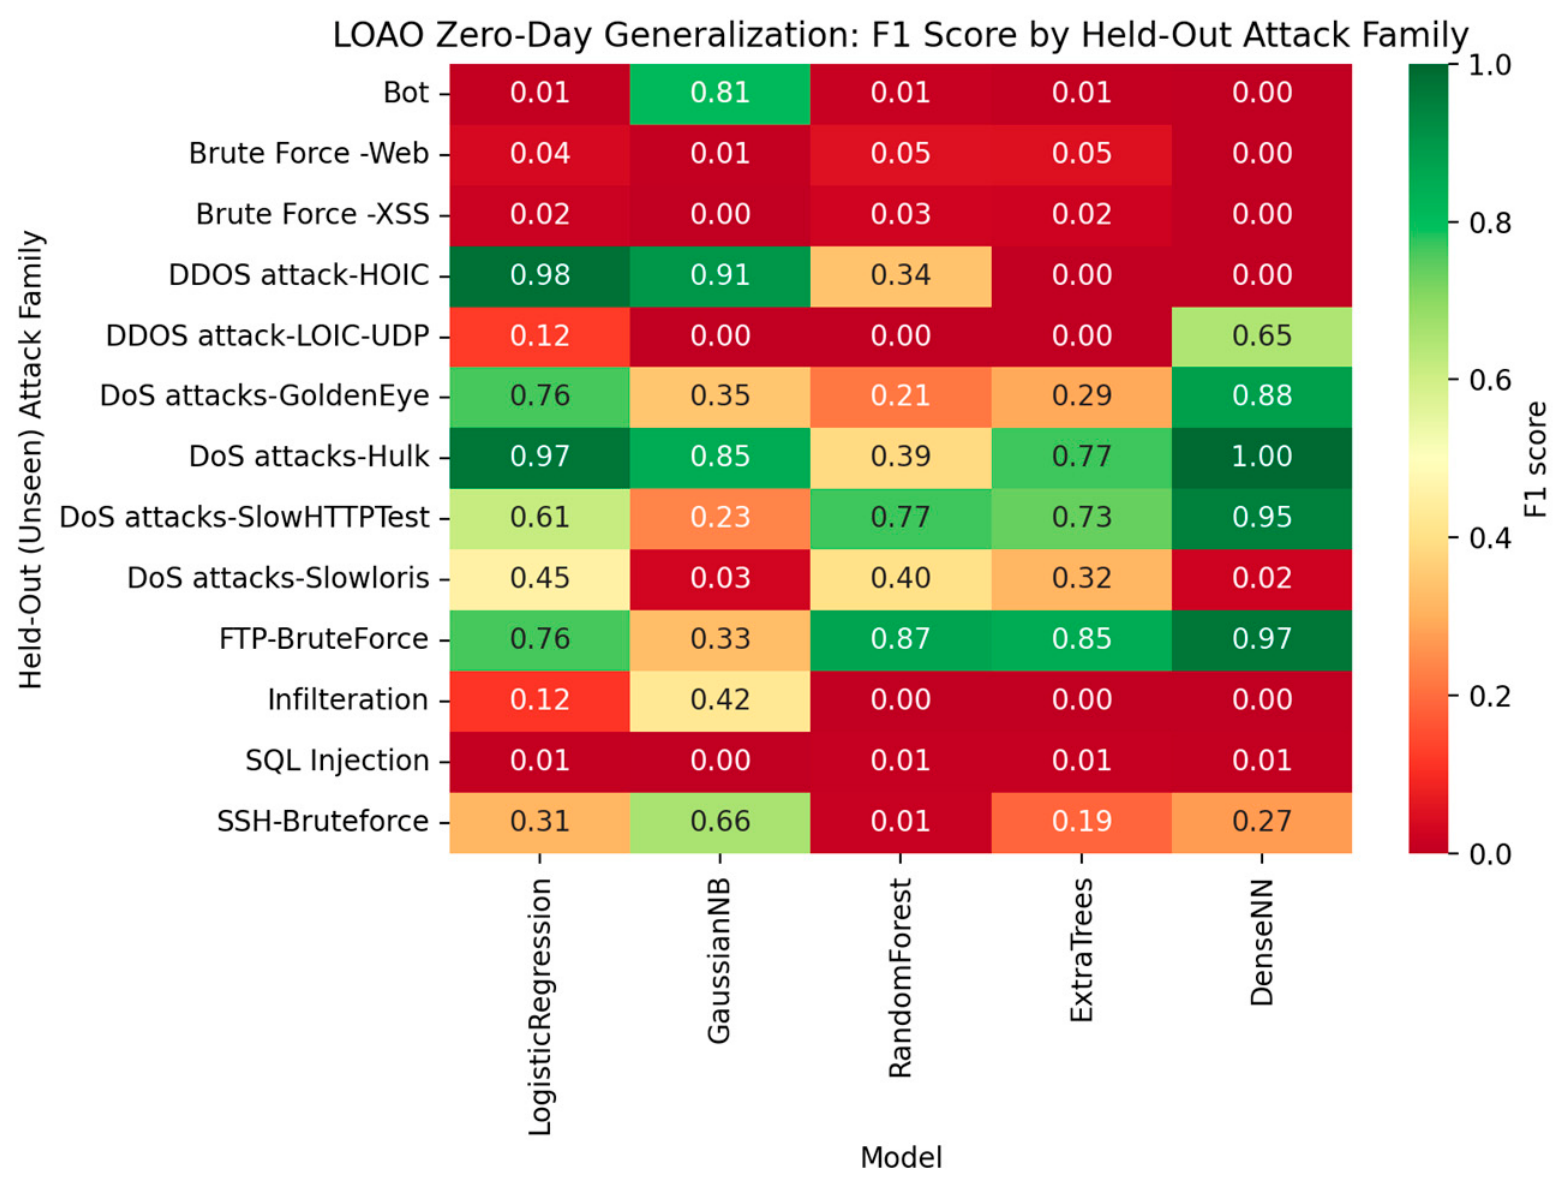
This analysis revealed a key finding: generalization to a genuinely unseen attack family is markedly harder than the within-distribution comparison (Section 4.1) suggests. The tree ensembles (Random Forest, Extra Trees)—the strongest performers in the standard, within-distribution comparison—generalize considerably worse (mean LOAO F1 = 0.239 and 0.249 respectively) than the simpler Logistic Regression (mean F1 = 0.397) when confronted with a completely unseen attack family. On several families—SQL Injection, Brute Force-Web/XSS, and Infiltration—every model collapses to near-zero F1 (Figure 19). This quantified generalization gap is now presented as a central, honest result of this study rather than an implicit assumption: strong within-distribution accuracy does not imply zero-day generalization capability, and the choice of model for zero-day-oriented deployment should be informed by LOAO-style evaluation, not only by standard train/test performance.
Figure 19.
LOAO zero-day generalization: F1 score per model, per held-out attack family. Red/orange cells indicate near-total failure to generalize to that unseen attack family.
4.8. Discussion/Limitations
While CSE-CIC-IDS2018 provides a massive, multi-attack baseline for cloud-backend infrastructure, it does not capture payload semantics specific to dedicated EV protocols, such as OCPP (Open Charge Point Protocol), ISO 15118, or controller area network (CAN) frames. Intrusion patterns at the vehicle-to-charger physical interface may exhibit different temporal and payload signatures. Future work will extend this LOAO and XAI auditing framework to EV-specific telemetry datasets (e.g., real-world OCPP server logs and in-vehicle CAN bus traffic) to evaluate cross-domain zero-day transferability.
5. Conclusions
This study proposed a deployment-aware, explainable intrusion detection framework tailored to the cloud-level backend connectivity interfacing Electric Vehicle (EV) and V2X cyber–physical ecosystems. Using the comprehensive CSE-CIC-IDS2018 dataset as a surrogate evaluation environment, we systematically benchmarked traditional machine learning, deep architectures (DenseNN), and ensemble models under a code-executed Leave-One-Attack-Out (LOAO) cross-validation protocol. This design moved beyond standard in-distribution splits to rigorously assess unseen-attack-family generalization, as a stricter proxy for zero-day resilience, against 13 unseen attack families.
The experimental results emphasized the critical trade-offs between classification strength, generalization robustness, and operational latency for real-time deployment. Under standard evaluation on the cleaned feature set, tree ensembles—specifically Random Forest and Extra Trees—demonstrated top-tier in-distribution performance (F1 ≈ 0.953–0.957, PR-AUC > 0.982) with exceptional per-sample inference latency (0.052–−0.068 ms/sample, corresponding to throughput of approximately 14,800–19,200 samples/s). Conversely, instance-based classifiers (KNN) proved computationally intractable at multi-million flow scale on standardized hardware (5.87 ms/sample inference latency) and were excluded from real-time zero-day candidate selection. Crucially, the LOAO evaluation uncovered a profound zero-day generalization gap: while complex tree ensembles exhibited severe performance collapse on novel families such as SQL Injection, Web/XSS, and Infiltration (mean LOAO F1 ≈ 0.239–−0.249), regularized linear models (Logistic Regression) maintained significantly broader decision boundaries (mean LOAO F1 = 0.397).
Explainable AI (XAI) auditing, utilizing SHAP and Integrated Gradients, served as a vital cornerstone to validate model reasoning and uncover dataset vulnerabilities. The audit exposed severe artifact-driven data leakage caused by the Timestamp and flow-identifier attributes, which had artificially inflated model rankings by encoding attack capture schedules rather than invariant behavioral signatures. Rerunning all benchmarks post-leakage removal quantified this inflation across all classifiers—most prominently in Gaussian NB, where accuracy and F1 dropped by 18.30 and 12.96 percentage points respectively at the 80% training ratio (up to 20.88 and 14.27 percentage points, respectively, at other training ratios). Removing these artifacts reduced reliance on identifiable temporal and flow-identifier artifacts and enabled a more credible assessment of protocol-level traffic indicators (e.g., flow dynamics, TCP state flags, and packet inter-arrival statistics); it does not by itself prove that every model genuinely relies on these indicators, particularly given the LOAO generalization gap reported above.
In conclusion, this work demonstrates that securing high-throughput EV and cloud management backends against zero-day threats requires a paradigm shift beyond standard accuracy metrics. Effective cyber-defense demands transparent XAI auditing to prevent artifact exploitation, strict metric evaluation (F1, MCC, PR-AUC, FPR/FNR), decomposed latency profiling, and empirical LOAO testing to address genuine out-of-distribution risks. Future work will extend this LOAO and XAI auditing framework to EV-specific telemetry (such as OCPP 2.0.1 server logs and in-vehicle CAN bus traffic) to evaluate cross-domain transferability.
These findings do not constitute direct validation on EV/V2X-specific traffic (e.g., OCPP, ISO 15118, or in-vehicle CAN bus data); they are established on CSE-CIC-IDS2018 as a cloud-backend surrogate dataset, and their extension to EV-specific protocol traffic remains a direction for future work.
Author Contributions
Conceptualization, H.A.S.; methodology, H.A.S., A.A.E.-D. and B.S.; software, H.A.S.; validation, H.A.S., A.A.E.-D., M.L., V.L., B.S. and M.I.E.-A.; formal analysis, H.A.S. and B.S.; investigation, H.A.S.; resources, H.A.S.; data curation, H.A.S.; writing—original draft preparation, H.A.S.; writing—review and editing, A.A.E.-D., M.L., V.L., B.S. and M.I.E.-A.; visualization, H.A.S.; supervision, H.A.S.; project administration, H.A.S. All authors have read and agreed to the published version of the manuscript.
Funding
This research was funded by the Ministry of Economic Development of the Russian Federation, agreement dated 20 June 2025, No. 139-15-2025-011, identifier 000000C313925P4G0002.
Data Availability Statement
The CSE-CIC-IDS2018 dataset used in this study is publicly available from its original repository. Full implementation details, including the leakage-removal pipeline, the Leave-One-Attack-Out protocol, model hyperparameters, and the environment configuration used to produce the results in Section 4.7, as well as the LOAO protocol table, per-fold results, and per-ratio metric tables referenced throughout Section 3.5 and Section 4.7, are available from the corresponding author upon reasonable request.
Acknowledgments
The authors acknowledge the institutions that non-financial supported the preparation of this work.
Conflicts of Interest
The authors declare no conflicts of interest.
References
- Garofalaki, Z.; Kosmanos, D.; Moschoyiannis, S.; Kallergis, D.; Douligeris, C. Electric Vehicle Charging: A Survey on the Security Issues and Challenges of the Open Charge Point Protocol (OCPP). IEEE Commun. Surv. Tutor. 2022, 24, 1504–1533. [Google Scholar] [CrossRef] [Scilit]
- Alcaraz, C.; Cumplido, J.; Trivino, A. OCPP in the spotlight: Threats and countermeasures for electric vehicle charging infrastructures 4.0. Int. J. Inf. Secur. 2023, 22, 1395–1421. [Google Scholar] [CrossRef] [Scilit]
- Sayed, M.A.; Atallah, R.; Assi, C.; Debbabi, M. Electric vehicle attack impact on power grid operation. Int. J. Electr. Power Energy Syst. 2022, 137, 107784. [Google Scholar] [CrossRef] [Scilit]
- Stallings, W. Network Security Essentials: Applications and Standards, 6th ed.; Pearson: Boston, MA, USA, 2016. [Google Scholar]
- Ring, M.; Wunderlich, S.; Scheuring, D.; Landes, D.; Hotho, A. A survey of network-based intrusion detection data sets. Comput. Secur 2019, 86, 147–167. [Google Scholar] [CrossRef] [Scilit]
- Moulahi, T.; Zidi, S.; Alabdulatif, A.; Atiquzzaman, M. Comparative Performance Evaluation of Intrusion Detection Based on Machine Learning in In-Vehicle Controller Area Network Bus. IEEE Access 2021, 9, 99595–99605. [Google Scholar] [CrossRef] [Scilit]
- Lampe, B.; Meng, W. A survey of deep learning-based intrusion detection in automotive applications. Expert Syst. Appl. 2023, 221, 119771. [Google Scholar] [CrossRef] [Scilit]
- Ferrag, M.A.; Maglaras, L.; Moschoyiannis, S.; Janicke, H. Deep learning for cyber security intrusion detection: Approaches, datasets, and comparative study. J. Inf. Secur. Appl. 2020, 50, 102419. [Google Scholar] [CrossRef] [Scilit]
- Tirulo, A.; Chauhan, S.; Issac, B. Ensemble LOF-based detection of false data injection in smart grid demand response system. Comput. Electr. Eng. 2024, 116, 109188. [Google Scholar] [CrossRef] [Scilit]
- Sasi, T.; Lashkari, A.H.; Lu, R.; Xiong, P.; Iqbal, S. A comprehensive survey on IoT attacks: Taxonomy, detection mechanisms and challenges. J. Inf. Intell. 2023, 2, 455–513. [Google Scholar] [CrossRef] [Scilit]
- Jodayree, M.; Ghafi, A.K.; Amiri, S.; Shaykholeslami, P. Explainable zero-day attack detection in IoMT using transformer-based time-series modeling. Sci. Rep. 2026, 16, 23252. [Google Scholar] [CrossRef] [Scilit] [PubMed]
- Nitrat, K.; Suetrong, N.; Promsuk, N. Zero-Day Attack Detection in IoT Networks Using a Residual Vision Transformer-Based Approach with Zero-Shot Learning. IEEE Open J. Commun. Soc. 2025, 6, 7405–7423. [Google Scholar] [CrossRef] [Scilit]
- Ullah, S.; Wu, J.; Kamal, M.M.; Alzaylaee, M.K.; Alibakhshikenari, M. Hybrid dual-head IDS: A lightweight and explainable deep learning DDoS/DoS framework for zero-day and imbalanced attack detection in IoT networks. Results Eng. 2026, 31, 111498. [Google Scholar] [CrossRef] [Scilit]
- Mu, Z.; Shi, X.; Dogan, S.A. Novel Solution for Zero-day Attack Detection in IDS using Self-attention and Jensen-Shannon divergence in WGAN-GP. Comput. Netw. 2026, 282, 112285. [Google Scholar] [CrossRef] [Scilit]
- Üstebay, S. Enhancing Zero-Day Attack Detection in IoT Networks via Isolation Forest and Ensemble Tree Models. Electrica 2025, 25, 1–8. [Google Scholar] [CrossRef] [Scilit]
- Hossain, M.M.; Turja, S.D.; Tasnim, S.; Juboraj, M.F.U.A.; Hossain, M.I. A cross-dataset based zero-day intrusion detection system by integrating siamese network and reinforcement learning. ICT Express 2026, 12, 752–757. [Google Scholar] [CrossRef] [Scilit]
- Zaki, R.M.; Naser, I.S. Hybrid Classifier for Detecting Zero-Day Attacks on IoT Networks. Mesopotamian J. Cybersecur. 2024, 4, 59–74. [Google Scholar] [CrossRef] [Scilit]
- Coşar, H.İ.; Arısoy, Ç.; Ulutaş, H. Intrusion Detection on CSE-CIC-IDS2018 Dataset Using Machine Learning Methods. Artif. Intell. Theory Appl. 2024, 4, 143–154. [Google Scholar]
- ISO/SAE 21434:2021; Road Vehicles—Cybersecurity Engineering. International Organization for Standardization: Geneva, Switzerland; SAE International: Geneva, Switzerland, 2021.
- Sharafaldin, I.; Lashkari, A.H.; Ghorbani, A.A. Toward generating a new intrusion detection dataset and intrusion traffic characterization. In Proceedings of the 4th International Conference on Information Systems Security and Privacy ICISSP 2018, Funchal, Portugal, 22–24 January 2018; Springer: Cham, Switzerland, 2018; pp. 108–116. [Google Scholar] [CrossRef] [Scilit]
- Tavallaee, M.; Bagheri, E.; Lu, W.; Ghorbani, A.A. A Detailed Analysis of the KDD CUP 99 Data Set. In Proceedings of the 2009 IEEE Symposium on Computational Intelligence for Security and Defense Applications, Ottawa, ON, Canada, 8–10 July 2009. [Google Scholar]
- ISO 15118-1:2019; Road Vehicles—Vehicle to Grid Communication Interface—Part 1: General Information and Use-Case Definition. International Organization for Standardization: Geneva, Switzerland, 2019.
- Lashkari, A.H.; Gil, G.D.; Mamun, M.S.I.; Ghorbani, A.A. Characterization of tor traffic using time based features. In Proceedings of the 3rd International Conference on Information Systems Security and Privacy ICISSP 2017, Porto, Portugal, 19–21 February 2017; Springer: Cham, Switzerland, 2017; pp. 253–262. [Google Scholar] [CrossRef] [Scilit]
- Draper-Gil, G.; Lashkari, A.H.; Mamun, M.S.I.; Ghorbani, A.A. Characterization of encrypted and VPN traffic using time-related features. In Proceedings of the 2nd International Conference on Information Systems Security and Privacy ICISSP 2016, Rome, Italy, 19–21 February 2016; Springer: Cham, Switzerland, 2016; pp. 407–414. [Google Scholar] [CrossRef] [Scilit]
- Bilge, L.; Dumitras, T. Before we knew it: An empirical study of zero-day attacks in the real world. In Proceedings of the 2012 ACM Conference on Computer and Communications Security, Raleigh, NC, USA, 16–18 October 2012; ACM: New York, NY, USA, 2012; pp. 833–844. [Google Scholar] [CrossRef] [Scilit]
- Moustafa, N.; Slay, J. The evaluation of Network Anomaly Detection Systems: Statistical analysis of the UNSW-NB15 data set and the comparison with the KDD99 data set. Inf. Secur. J. 2016, 25, 18–31. [Google Scholar] [CrossRef] [Scilit]
- García-Teodoro, P.; Díaz-Verdejo, J.; Maciá-Fernández, G.; Vázquez, E. Anomaly-based network intrusion detection: Techniques, systems and challenges. Comput. Secur. 2009, 28, 18–28. [Google Scholar] [CrossRef] [Scilit]

Disclaimer/Publisher’s Note: The statements, opinions and data contained in all publications are solely those of the individual author(s) and contributor(s) and not of MDPI and/or the editor(s). MDPI and/or the editor(s) disclaim responsibility for any injury to people or property resulting from any ideas, methods, instructions or products referred to in the content. |
© 2026 by the authors. Licensee MDPI, Basel, Switzerland. This article is an open access article distributed under the terms and conditions of the Creative Commons Attribution (CC BY) license.