


Abstract
Power line component and insulator defect detection is an important task in intelligent transmission line inspection. However, UAV-based inspection images often contain small, densely distributed targets under complex backgrounds, making it difficult for existing detectors to balance accuracy and model compactness. To address these challenges, this paper proposes a lightweight YOLOv8-based detector named DSCMamba-TAD-YOLOv8. First, depthwise separable convolutions are introduced into the Neck to reduce parameters and computational cost. Second, DSCMambaNet replaces the original C2f module to enhance multi-scale feature representation by combining lightweight local feature extraction and cross-region contextual modeling. An embedded CBAM component is further integrated inside DSCMambaNet to strengthen informative channel responses and spatial regions. Finally, a Task-Aware Dynamic Detection Head, named TADetect, improves head adaptability through scale-aware and task-aware feature modulation. Experiments on the InsPLAD-det dataset show that DSCMamba-TAD-YOLOv8 achieves 91.86% Precision, 88.02% Recall, 91.83% mAP@0.5, and 74.82% mAP@0.5:0.95. Compared with YOLOv8n, the proposed model improves Precision, mAP@0.5, and mAP@0.5:0.95 by 4.09, 2.43, and 4.46 percentage points, respectively, while maintaining a comparable Recall level with a slight increase from 87.04% to 88.02%. Meanwhile, Params decrease from 3.209 M to 2.702 M and GFLOPs from 8.2 to 7.5. On the revised TPL-SOD held-out test subset, the proposed model improves Precision from 86.20% to 88.16%, mAP@0.5 from 87.09% to 88.81%, and mAP@0.5:0.95 from 68.44% to 70.13%, while Recall remains stable and slightly increases from 91.75% to 92.33%. These results demonstrate that DSCMamba-TAD-YOLOv8 improves detection accuracy and localization quality while maintaining a compact structure and stable recall performance.
1. Introduction
Insulators are important components of power transmission systems, and their reliable operation is essential for maintaining grid safety. With the continuous growth of electricity demand, transmission lines have expanded rapidly, leading to a substantial increase in the number of insulators and other line components that require regular inspection. Statistics show that, as of 2022, the length of transmission lines at voltage levels of 220 kV and above in China had reached 879,000 km [1]. Traditional manual inspection is labor-intensive, inefficient, and difficult to scale to large transmission networks. In recent years, UAV-based inspection has become an important technical solution because UAVs can collect high-resolution images of power line components from flexible viewpoints. Therefore, developing accurate and compact object detection algorithms for UAV-based power line inspection has important practical significance [2].
Existing power line inspection methods can be broadly divided into traditional image-processing methods and deep learning-based methods. Traditional methods usually rely on handcrafted features, image preprocessing, and predefined rules. For example, Zhao et al. [3] used prior knowledge of orientation angles and binary shapes to localize multiple insulators from different angles. Yin et al. [4] introduced a dual-parity morphological-gradient operator for identifying deteriorated insulators. Jiao et al. [5] adopted motion compensation and an improved three-frame difference method to detect foreign objects on transmission lines. Texture-based features such as kurtosis wavelet energy [6] and kurtosis curvelet energy [7] have also been used for image detection. These methods can achieve satisfactory detection results for images with simple backgrounds, but their accuracy deteriorates in complex backgrounds, making them insufficient for real-world operating conditions.
Deep learning-based object detection methods have significantly improved the automation and accuracy of power line inspection [8,9,10]. Li et al. [9] improved Faster R-CNN using ResNeXt-101 and online hard example mining, increasing insulator recognition accuracy by 1.7%. Wang et al. [10] compared SSD and Faster R-CNN for foreign-object detection and reported that SSD achieved an mAP of 85.2% with a frame rate of 26 FPS. Xie et al. [11] improved YOLOv3 by extracting features from Darknet19 and replacing the loss function with GIoU. More recently, YOLO-based methods have been widely adopted for insulator and power line component detection because of their favorable balance between accuracy and inference speed. For example, He et al. [12] combined YOLOv8s with Swin Transformer and an enhanced bidirectional feature pyramid network to improve insulator defect detection accuracy. Zhang et al. [13] introduced a multi-scale large-kernel attention module and a GSC_C2f module into YOLOv8 to enhance multi-scale feature representation.
Although these deep learning-based detectors have achieved promising results, several limitations remain in lightweight UAV-based power line inspection. First, many accuracy-oriented models introduce additional attention modules, transformer blocks, or complex feature-fusion structures, which improve detection performance but also increase Params, GFLOPs, and runtime overhead. Second, lightweight detectors reduce model complexity, but simplified convolutional feature fusion may weaken the representation of small and fine-grained targets such as shackles, dampers, fittings, and defective insulators. Third, UAV inspection images often contain dense linear structures, complex tower backgrounds, vegetation interference, and strong scale variation, making it difficult for purely local convolutional operations to capture long-range contextual relationships among spatially separated components. Fourth, the original YOLOv8 decoupled head receives the same multi-scale features for classification and localization, which may not sufficiently adapt to the different feature requirements of object category discrimination and bounding-box regression. Therefore, there is still a need for a compact detector that can improve local–global feature representation and task-specific prediction adaptability without excessively increasing model complexity.
Recently, state-space models represented by Mamba have attracted increasing attention because of their ability to model long-range dependencies with linear-time sequence modeling [14]. Compared with convolutional operations that mainly focus on local feature extraction, Mamba provides an efficient way to capture global contextual information. This property is suitable for UAV-based power line inspection, where small components are often distributed along conductors and structurally related to surrounding power-line assets. Therefore, Mamba-based contextual modeling is introduced into the Neck to provide a mechanism for capturing cross-region contextual relationships among small and spatially distributed targets. However, because Mamba-based feature modeling and attention operations may introduce additional runtime overhead, the lightweight property in this study mainly refers to a compact parameter and GFLOP profile rather than guaranteed faster inference on all hardware platforms.
To address the above challenges, this paper proposes DSCMamba-TAD-YOLOv8 based on YOLOv8n. The proposed method retains the original Backbone and mainly improves the Neck and detection head. In the Neck, depthwise separable convolution is introduced to reduce computational redundancy, and DSCMambaNet is designed to enhance multi-scale feature fusion by combining local feature extraction, Mamba-based contextual modeling, and embedded CBAM refinement. In the detection head, TADetect is introduced to perform scale-aware and task-aware feature modulation before the original YOLOv8 prediction branches. Through these designs, the proposed model aims to improve detection accuracy and localization quality for UAV-based power line inspection while maintaining a compact model profile in terms of Params and GFLOPs. It should be noted that practical runtime efficiency and edge-device deployment performance still depend on hardware characteristics, inference engines, memory access patterns, and operator-level optimization.
The main contributions of this paper are summarized as follows:
- A lightweight feature-fusion Neck based on DSConv and DSCMambaNet is proposed. In this Neck, DSConv is used to reduce computational redundancy, while DSCMambaNet integrates lightweight local feature extraction, Mamba-based global contextual modeling, and embedded CBAM refinement to improve the representation of small power line components under complex backgrounds.
- A Task-Aware Dynamic Detection Head, named TADetect, is designed to improve the adaptability of the detection head to multi-scale targets and task-specific prediction requirements for classification and localization.
- Experiments are conducted on the InsPLAD-det dataset and the revised TPL-SOD dataset to evaluate the proposed method for multi-class power line asset detection and two-class insulator status detection. The results verify the effectiveness of the proposed modules in improving detection accuracy and localization quality while maintaining a compact model profile in terms of Params and GFLOPs.
2. Preliminaries
2.1. YOLOv8
YOLOv8, proposed by Ultralytics, is an advanced one-stage object detection model. Owing to its excellent detection accuracy and real-time performance, it has been widely used in the field of object detection. The basic structure of YOLOv8 consists of a Backbone, a Neck, and a Head [15,16]. The Backbone extracts features through a series of convolutional layers. The Neck further extracts features by upsampling feature maps to three different sizes. The Head computes the losses for object localization and classification and performs detection accordingly. The Backbone uses the C2f module for feature extraction, improving feature representation by enhancing feature reuse and gradient flow. The Neck combines a feature pyramid network (FPN) [17] and a path aggregation network (PAN) [18] to fuse features at different scales, thereby enhancing the model’s ability to detect multi-scale objects. The detection head adopts a decoupled-head design and introduces an anchor-free mechanism, separating object classification from bounding-box regression to improve detection accuracy and training efficiency.
YOLOv8 is an upgraded model based on YOLOv5 and includes several significant changes. First, the convolution kernel size in the Backbone is reduced from 6 × 6 to 3 × 3. The smaller kernel size leads to lower memory usage and computational demand, enabling finer-grained learning by detecting smaller local regions multiple times. Second, the C3 block in YOLOv5 is replaced by the C2f block. The C3 module is used in YOLOv5 [19], whereas the C2f block in YOLOv8 is an improved structure that enhances feature reuse and gradient flow [16]. Based on ideas from ResNet [20] and DenseNet [21], it alleviates the gradient vanishing problem and promotes information transfer from shallow layers to deeper layers. Third, YOLOv8 shifts from anchor-based detection to anchor-free detection. Traditional anchor-based detection is affected by three predefined anchor aspect ratios. In contrast, anchor-free detection does not use predefined anchors but directly predicts object center points, allowing it to handle targets with more diverse aspect ratios.
The YOLOv8 family provides multiple model scales with different trade-offs between detection accuracy and computational complexity. Compared with YOLOv8s, YOLOv8m, YOLOv8l, and YOLOv8x, YOLOv8n has the smallest parameter size and computational cost, making it suitable as the baseline architecture for lightweight detection.
2.2. Depthwise Separable Convolution
Depthwise separable convolution (DSC) decomposes a standard convolution into two consecutive operations: depthwise convolution and pointwise convolution, as shown in Figure 1. Specifically, depthwise convolution applies a spatial convolution independently to each input channel, while pointwise convolution uses a convolution to fuse cross-channel information. In this way, depthwise separable convolution decouples spatial feature extraction from channel feature fusion, thereby greatly reducing the number of parameters and computational cost compared with standard convolution. Owing to its lightweight structure, DSC has been widely used in efficient neural network architectures, such as MobileNet [22] and EfficientNet [23].
Figure 1.
Structure of depthwise separable convolution. Arrows indicate the feature-processing flow, and the ellipsis indicates omitted repeated feature channels for visual simplicity. Different colors are used only for visual distinction and do not represent additional semantic information.
Assume that the input feature map is , where H and W denote the height and width of the feature map, and C represents the number of input channels. For a standard convolution with a kernel size of and M output channels, the computational cost can be expressed as:
In contrast, depthwise separable convolution first applies depthwise convolution to each input channel independently. The computational cost of depthwise convolution is:
Then, pointwise convolution is performed using convolution to fuse information across channels. Its computational cost is:
Therefore, the total computational cost of depthwise separable convolution is:
Compared with standard convolution, the computational cost ratio of DSC can be calculated as:
Accordingly, the theoretical reduction ratio of computational cost is:
This demonstrates that DSC can significantly reduce computational cost when the number of output channels M and the kernel size K are sufficiently large. Therefore, replacing selected standard convolutions in the Neck with DSC can reduce the complexity of the detection model while preserving local spatial feature extraction and cross-channel information fusion.
2.3. State Space Model and Mamba
The state space model (SSM), originating from control theory, provides a mathematical framework for describing the evolution of dynamic systems [24]. It introduces a latent state to summarize historical information and updates this state through recursive transition equations. Therefore, SSMs can model long-range dependencies in an efficient manner. Recently, Mamba has extended SSM-based sequence modeling by introducing a selective state-space mechanism, in which several key parameters are dynamically generated according to the input sequence [14].
Given a continuous input signal and an output signal , a continuous-time state space model can be written as:
where denotes the hidden state, is the state transition matrix, is the input projection matrix, is the output projection matrix, and is the direct transfer matrix.
Since visual feature maps are processed in discrete form, the continuous SSM needs to be converted into a discrete representation. Assume that the input is held constant within each sampling interval , where denotes the sampling step. Using the Zero-Order Hold (ZOH) discretization rule [14], the hidden state at the next step can be derived as:
Accordingly, the discrete state transition matrix and input projection matrix are:
Here, and denote the discretized counterparts of the continuous matrices A and B, respectively. When the direct transfer term is not used, D can be set to zero. The discrete SSM can then be expressed as:
Conventional linear time-invariant SSMs use fixed matrices during sequence modeling. Although this design is efficient, it limits the ability of the model to adaptively select input-dependent information. Mamba addresses this limitation by introducing a selective state-space mechanism. For an input sequence , where L is the sequence length and D is the feature dimension, Mamba generates input-dependent parameters for each token:
where , , and are learnable projection matrices, and is constrained to be positive by the activation function. Therefore, the discretized parameters become token-dependent:
The selective state update can be written as:
Through this input-dependent parameter generation process, Mamba can selectively retain useful information and suppress irrelevant information when processing long sequences. In addition, Mamba employs a hardware-aware parallel scan algorithm to improve the computational efficiency of selective state-space sequence modeling [14]. These properties make Mamba suitable for modeling long-range contextual dependencies in visual feature representations.
2.4. Convolutional Block Attention Module (CBAM)
The Convolutional Block Attention Module (CBAM) is a lightweight and efficient attention mechanism designed to enhance the feature representation capability of convolutional neural networks. CBAM adaptively refines intermediate feature maps by sequentially applying channel attention and spatial attention [25]. The channel attention module determines ”what” information is important by assigning adaptive weights to different feature channels, whereas the spatial attention module determines “where” the informative regions are located by modeling spatial relationships within the feature map. The combination of these two complementary attention mechanisms enables the network to emphasize important channels and target regions while suppressing irrelevant background information.
Given an intermediate feature map, the processing procedure of CBAM can be summarized as follows:
- 1.
- Global average pooling and global max pooling are first performed along the spatial dimensions of the input feature map to generate two channel descriptors.
- 2.
- The two channel descriptors are separately passed through a shared multilayer perceptron (MLP), which consists of two fully connected layers. The resulting features are added together and processed by a sigmoid activation function to generate the channel attention weights.
- 3.
- The channel attention weights are multiplied element-wise with the original input feature map to obtain the channel-refined feature map.
- 4.
- Channel-wise average pooling and channel-wise max pooling are then applied to the channel-refined feature map, producing two spatial descriptors.
- 5.
- The two spatial descriptors are concatenated along the channel dimension and processed by a convolution followed by a sigmoid activation function to generate the spatial attention map.
- 6.
- Finally, the spatial attention map is multiplied element-wise with the channel-refined feature map to obtain the final CBAM-refined feature representation.
Owing to its simple structure, low computational cost, and effective feature refinement capability, CBAM has been widely applied to computer vision tasks such as image classification, object detection, semantic segmentation, and fault diagnosis. In the proposed DSCMamba-TAD-YOLOv8 model, CBAM is embedded inside DSCMambaNet to refine the fused multi-scale features before they are forwarded to the detection head.
3. DSCMamba-TAD-YOLOv8
For UAV-based transmission line inspection, compact object detection models are desirable because practical inspection platforms often have limited computational resources, storage capacity, and communication bandwidth. Therefore, YOLOv8n is selected as the baseline architecture for compact model optimization because it has the smallest parameter size and computational cost among the YOLOv8 series.
In this study, the term “lightweight” mainly refers to a compact model profile in terms of parameter count and GFLOPs, rather than guaranteed faster inference on all hardware platforms. Actual deployment efficiency on UAV or embedded devices depends on hardware characteristics, inference engines, memory access patterns, operator-level optimization, and power constraints. Therefore, this study focuses on improving detection accuracy and localization quality while reducing Params and GFLOPs, whereas practical edge-device deployment is treated as a direction for future hardware-specific validation.
This paper proposes DSCMamba-TAD-YOLOv8 based on YOLOv8n. Since the YOLOv8 Backbone already has strong feature extraction capability, the proposed model retains the original Backbone to preserve the basic feature extraction ability and mainly improves the Neck network and the detection head. In the Neck, depthwise separable convolution is introduced to reduce computational complexity, and DSCMambaNet is designed to replace the original C2f module to enhance lightweight multi-scale feature fusion. Meanwhile, an embedded CBAM component is introduced inside DSCMambaNet to strengthen key channel responses and important spatial regions. In the detection head, a Task-Aware Dynamic Detection Head, named TADetect, is designed to improve the adaptability of the head to different object scales and to the different requirements of classification and localization tasks. The overall architecture of the proposed model is shown in Figure 2.
Figure 2.
Structure of DSCMamba-TAD-YOLOv8.
3.1. Lightweight Neck Design Based on DSCMambaNet
In transmission line inspection tasks, insulators, fittings, dampers, shackles, and defect regions usually appear at small scales and are easily affected by complex backgrounds, viewpoint variations, and dense structural interference. The Neck network in YOLOv8 is responsible for fusing multi-scale features from the Backbone and therefore plays an important role in small-object detection. However, the standard convolution layers and C2f modules in the original Neck still introduce certain computational redundancy. To address this issue, this paper proposes a lightweight Neck design based on DSConv and DSCMambaNet, aiming to reduce model complexity while enhancing local–global feature representation.
First, depthwise separable convolution is used to replace selected standard convolution layers in the Neck. Depthwise separable convolution consists of depthwise convolution and pointwise convolution. The depthwise convolution extracts spatial information independently for each channel, while the pointwise convolution fuses cross-channel information using a convolution. This design reduces the number of parameters and computational cost while preserving local feature extraction capability, making the Neck more compact for resource-constrained inspection scenarios.
Second, DSCMambaNet is designed to replace selected C2f modules in the Neck. The core local–global unit of DSCMambaNet is DSCMamba, which combines a local DSConv branch, a Mamba-based contextual modeling branch, feature fusion, and residual connection. An embedded CBAM component is further introduced inside DSCMambaNet after local–global feature interaction to refine the fused feature representation. In this structure, the Mamba branch is used to model long-range contextual dependencies among spatial locations, while the DSConv branch is used to extract local texture, edge, and structural information. The Mamba branch is placed in the Neck because the Neck directly handles multi-scale fused features from the Backbone. Modeling long-range dependencies at this stage helps capture contextual relationships among spatially separated power line components, such as insulator strings, dampers, and shackles, before the features are forwarded to the detection head. Therefore, DSCMambaNet combines local detail extraction and cross-region contextual modeling, improving the representation ability of the model for small targets and fine-grained power line components under complex backgrounds. The structures of DSCMambaNet and the internal DSCMamba unit are shown in Figure 3.
Figure 3.
Structure of the proposed DSCMambaNet. (a) C2f-style split–transform–concat–fuse structure of DSCMambaNet. The black arrows denote the main forward feature propagation path, while the blue arrows denote feature reuse connections to the concatenation operation. (b) Internal structure of the DSCMamba unit, which combines a local DSConv branch and a tokenized Mamba branch through feature concatenation, convolution, and residual connection. The black arrows denote the normal forward feature transformation paths, while the blue arrow denotes the residual shortcut connection from the input feature to the addition operation.
Recent studies have also explored the integration of Mamba-based state-space modeling into YOLO-style object detectors. Mamba-YOLO introduces SSM-based modeling into the YOLO detection framework and designs ODSSBlock to improve global contextual representation for real-time object detection. In addition, local spatial modeling and channel representation are strengthened through LSBlock and RG Block, respectively, so as to compensate for the limitations of pure sequence modeling in visual detection tasks [26]. AKCMamba-YOLO further integrates selective state-space modeling into YOLO and introduces 3CAKCMamba and 4CAKCMamba modules in the Backbone and Neck to enhance channel interaction, cross-layer semantic fusion, and multi-scale feature representation [27].
Different from these general Mamba-based YOLO detectors, the proposed DSCMamba-TAD-YOLOv8 focuses on UAV-based power line inspection and adopts a compact YOLOv8n-based design. The proposed method does not redesign the whole YOLO framework or replace the Backbone with a Mamba-based backbone. Instead, DSCMambaNet is inserted into the Neck to preserve the C2f-style split–transform–concat–fuse structure while combining local DSConv processing, tokenized Mamba-based contextual modeling, and embedded CBAM refinement. In addition, TADetect is introduced as a lightweight scale-aware and task-aware modulation mechanism for the original YOLOv8 decoupled detection head. Therefore, the contribution of this study lies in the joint design of a compact local–global Neck and a task-aware detection head for power line asset and insulator-status detection, rather than simply inserting Mamba into YOLOv8.
Since Mamba is originally designed for sequence modeling, the two-dimensional feature maps in the Neck need to be converted into token sequences before being processed by the Mamba block. Given an input feature map , where B, C, H, and W denote the batch size, channel number, height, and width, respectively, the spatial dimensions are flattened into a one-dimensional sequence:
In this paper, a row-major raster scan order is adopted to construct the token sequence. For a spatial position in the original feature map, the corresponding token index l is defined as:
Thus, each token corresponds to one spatial location in the original two-dimensional feature map. After sequence modeling, the output sequence is reshaped back to the original spatial layout according to the same index mapping. No additional positional embedding is introduced in this implementation; the spatial correspondence is preserved by the deterministic flattening and reshaping process, while the local geometric information is further strengthened by the DSConv branch.
After flattening, the token sequence is normalized and projected into an expanded feature space before entering the selective state-space operator:
where denotes Layer Normalization, denotes the input linear projection, and is the expanded feature dimension. With an expansion ratio of 2, in this implementation. Then, a lightweight one-dimensional convolution is applied along the sequence dimension for local token mixing:
where denotes the internal one-dimensional convolution with kernel size . The locally mixed sequence is then processed by the selective state-space operator:
Following the Mamba block design, the sequence output is projected back to the original channel dimension:
Finally, the output sequence is reconstructed as a two-dimensional feature map:
In the implementation, the Mamba-related hyperparameters are set as , , and the expansion ratio is set to 2. Here, denotes the internal state dimension of the selective state-space model, which controls the capacity for preserving contextual information during sequence modeling. The parameter denotes the kernel size of the lightweight one-dimensional convolution used inside the Mamba block for local token mixing. The expansion ratio controls the intermediate channel expansion in the Mamba block; that is, the input feature dimension is first expanded to a higher-dimensional representation and then projected back to the original channel dimension. These settings are used to balance contextual modeling ability and computational efficiency.
Through the above tokenization and reconstruction process, the Mamba branch can model long-range dependencies among different spatial positions of the feature map, while the feature-map structure required by the detection Neck is preserved.
For clarity, the batch dimension is omitted in the following equations. Let denote the input feature map of DSCMambaNet. Following the split–transform–concat–fuse design of the original C2f module, the input feature is first projected by a depthwise separable convolution:
where replaces the input convolution of the original C2f module to reduce computational redundancy.
The projected feature is then split into two feature parts along the channel dimension:
where is kept as a shortcut-like feature for feature reuse, and is sent into the following enhanced transformation units.
For the i-th transformation unit, the input feature is processed by a DSCMamba unit, which combines local feature extraction and Mamba-based contextual modeling:
where , n denotes the number of DSCMamba units, and denotes the i-th DSCMamba unit.
Inside each DSCMamba unit, the local DSConv branch and the Mamba branch are used to model complementary information from the same input feature:
where extracts local spatial and channel-wise features, and denotes the tokenized Mamba operation described above, including feature flattening, Layer Normalization, linear projection, Conv1D-based local token mixing with SiLU activation, selective state-space modeling, output projection, and feature-map reconstruction.
The local and global features are concatenated along the channel dimension and then fused by a convolution:
A residual connection is further used to preserve the original input information and stabilize optimization:
After the iterative DSCMamba transformation, the retained feature , the initial transformed feature , and the outputs of all DSCMamba units are concatenated:
Finally, the concatenated feature is fused by another depthwise separable convolution:
An embedded CBAM component is then applied inside DSCMambaNet to recalibrate the fused feature representation:
CBAM contains a channel attention branch and a spatial attention branch. The channel attention branch enhances discriminative channels related to insulators, fittings, dampers, and defects, while the spatial attention branch highlights target regions and suppresses background interference such as conductors, towers, vegetation, and sky regions. Therefore, CBAM is used as an embedded feature refinement component inside DSCMambaNet rather than as a component of the detection head. The refined multi-scale feature maps are then forwarded to the detection head for final classification and localization prediction. Through the above design, the proposed Neck improves multi-scale feature representation while maintaining a low number of parameters and computational cost.
3.2. Task-Aware Dynamic Detection Head
Although YOLOv8 adopts an anchor-free decoupled detection head for classification and bounding box regression [15,16], the two prediction branches still receive the same input feature at each detection scale. For transmission line inspection, the targets usually exhibit large scale variation, complex background interference, and fine-grained category differences [28]. In this case, a fixed detection head may not sufficiently adapt to different object scales or the different feature requirements of classification and localization tasks. Previous studies have shown that classification and localization have different feature preferences and may suffer from task misalignment in object detection [29,30].
To address this problem, this paper proposes a Task-Aware Dynamic Detection Head, named TADetect, to replace the original Detect head in YOLOv8n. The proposed head preserves the original YOLOv8 bounding box decoding, Distribution Focal Loss prediction, stride processing, and output format [16,31]. It only introduces lightweight dynamic feature modulation before the original regression and classification branches. Therefore, TADetect can improve the adaptability of the detection head without changing the inference interface of YOLOv8.
Given three detection feature maps from the Neck, denoted as , , and , which follow the common multi-scale feature representation used in feature pyramid detection frameworks [17], the original YOLOv8 detection head can be formulated as:
where is the detection feature at scale i, is the bounding box regression prediction, is the classification prediction, and is the final raw prediction of this scale. Although and are separate branches, they are both generated from the same feature . This limits the ability of the detection head to adaptively generate task-specific features.
3.2.1. Overall Structure of TADetect
The overall structure of TADetect consists of two key components: a Scale-Aware Gate and task-aware gates for classification and regression. First, the Scale-Aware Gate dynamically adjusts the contributions of , , and according to the global information of the input image. Then, for each detection scale, two independent TaskGates are used to generate regression-oriented and classification-oriented features. The output features are finally fed into the original YOLOv8 regression and classification branches.
The overall process can be written as:
The overall architecture of TADetect is illustrated in Figure 4.
Figure 4.
Overall architecture of the proposed TADetect head.
In this way, the original fixed detection head is transformed into a task-aware dynamic detection head. The Scale-Aware Gate focuses on inter-scale feature adaptation, while the TaskGates focus on intra-scale task-specific feature modulation.
3.2.2. Scale-Aware Gate
The three detection feature maps , , and correspond to different resolutions and semantic levels. Such multi-scale feature representations are widely used in feature pyramid detection frameworks to improve object detection across different scales [17]. has a higher spatial resolution and is more suitable for small-object detection. is responsible for medium-scale objects, while contains stronger semantic information for larger objects. However, the original YOLOv8 detection head treats these scale features in a fixed manner.
To enhance scale adaptability, TADetect first extracts a global descriptor from each feature map using global average pooling:
where . Since the channel dimensions of different scale features are not the same, each descriptor is projected into a unified dimension d using a convolution:
where denotes the projection function for the i-th scale, and . Then, the projected descriptors are concatenated and passed through a lightweight mapping function to generate scale weights:
where is the number of detection scales, denotes the lightweight mapping function, and represents the dynamic weights of the three scales. Multiplying by (N) keeps the average value of the scale weights close to 1:
This design avoids obvious changes in the overall magnitude of the multi-scale features.
The detailed structure of the Scale-Aware Gate is illustrated in Figure 5.
Figure 5.
Detailed structure of the Scale-Aware Gate.
The final scale-modulated feature is calculated by residual modulation:
where ⊙ denotes element-wise multiplication, and is a learnable scale modulation strength initialized to 0. At the beginning of training,
so that
Therefore, the Scale-Aware Gate is initialized as an identity mapping and will not disturb the original YOLOv8 feature distribution at the early training stage. During training, the model gradually learns how to adjust the contributions of different scale features according to the input image.
In the implementation, the unified descriptor dimension of the Scale-Aware Gate is set to . The descriptors of , , and are projected to this unified dimension using independent convolution layers and are then concatenated to generate three scale weights through a lightweight mapping network. The Scale-Aware Gate parameters are shared across all input images during inference, but the generated scale weights are dynamically conditioned on each input image. For the TaskGates, independent regression-oriented and classification-oriented gates are used at each detection scale. The channel reduction ratio is set to 16, and the spatial gate uses a convolution. The modulation strength parameters , , and are initialized to zero, so both the Scale-Aware Gate and the TaskGates behave as identity mappings at the beginning of training.
3.2.3. Task-Aware Gates for Regression and Classification
Object detection contains two different subtasks: classification and localization. Classification focuses more on semantic discrimination and category-related regions, whereas localization relies more on object boundaries, spatial positions, and geometric structures [29,30]. Although YOLOv8 uses a decoupled head, the two branches still share the same input feature before prediction. Therefore, TADetect introduces independent task-aware gates for the regression and classification branches.
For each scale feature , the regression and classification features are generated as:
The detailed structure of the Task-Aware Gate is illustrated in Figure 6.
Figure 6.
Detailed structure of the Task-Aware Gate.
The regression feature is fed into the original bounding box branch, while the classification feature is fed into the original classification branch. In this manner, the two prediction tasks receive task-specific feature representations instead of directly sharing the same feature map.
Each TaskGate consists of a channel gate and a spatial gate. This design is inspired by channel-spatial attention mechanisms, which have been shown to enhance feature representation by emphasizing informative channels and spatial regions [25]. Given an input feature , the channel gate first obtains a channel descriptor through global average pooling:
Then, two convolutions and a nonlinear activation function are used to generate the channel attention weight:
where and are convolutional mappings, denotes the SiLU activation function, and denotes the Sigmoid function. represents the importance of different channels.
The spatial gate generates a spatial weight map by using channel-wise average pooling and max pooling:
The two spatial descriptors are concatenated and processed by a convolution:
where . The final joint gate is obtained by combining the channel and spatial weights:
To improve training stability, the task-aware modulation is also implemented in a residual form:
where is a learnable task modulation strength initialized to 0. Thus, the TaskGate is also an identity mapping at the beginning of training. For the i-th scale, the regression and classification task features can be expressed as:
where and are independent learnable modulation strengths for regression and classification, respectively. This design enables each detection scale and each prediction task to learn its own dynamic modulation pattern.
3.2.4. Design Analysis of TADetect
Compared with the original YOLOv8 Detect head, TADetect has three advantages. First, it introduces scale-aware feature modulation, enabling the detection head to adaptively emphasize the most suitable detection scale according to the input image. This is useful for UAV-based transmission line inspection, where small fittings, insulators, dampers, and larger structural components may appear at different scales.
Second, TADetect introduces task-aware feature modulation for regression and classification. Instead of using the same feature for both tasks, TADetect generates localization-oriented and classification-oriented features separately. This helps the regression branch focus more on object boundaries and geometric structures, while the classification branch focuses more on semantic discrimination.
Third, both the scale gate and the task gates are initialized as identity mappings through residual modulation. This allows the proposed head to preserve the behavior of the original YOLOv8 detection head at the early training stage and gradually learn dynamic feature modulation during training. Therefore, TADetect improves the adaptability of YOLOv8n without changing its decoding process or output format.
3.2.5. Conceptual Comparison with Related Attention and Detection-Head Designs
Although TADetect is related to attention-based feature modulation and task-aware detection head design, it differs from existing methods such as CBAM, DyHead, and TOOD in both motivation and implementation [25,30,32]. CBAM is a general-purpose attention module for convolutional neural networks. It sequentially generates channel attention and spatial attention maps from an intermediate feature map and multiplies them with the input feature for adaptive feature refinement [25]. Therefore, CBAM mainly focuses on generic feature enhancement and does not explicitly model the different requirements of classification and localization in the detection head.
DyHead unifies scale-aware, spatial-aware, and task-aware attentions in the detection head to enhance detection-head representation across feature levels, spatial locations, and prediction tasks [32]. In contrast, TADetect adopts a simpler plug-in design for the decoupled YOLOv8 detection head. It does not introduce a complete spatial dynamic attention module or change the original YOLOv8 decoding process. Instead, it applies scale-aware residual modulation across , , and and introduces independent regression and classification TaskGates before the original prediction branches. Therefore, TADetect focuses on lightweight scale and task modulation rather than a full dynamic-head redesign.
TOOD focuses on task alignment between classification and localization in one-stage object detection and introduces task-aligned head design and learning strategies [30]. Different from TOOD, TADetect does not modify the label assignment strategy, loss functions, bounding-box decoding process, or Distribution Focal Loss prediction of YOLOv8. Instead, it generates regression-oriented and classification-oriented features through lightweight residual gates while preserving the original YOLOv8 training and inference pipeline. Therefore, TADetect is not a direct replacement of DyHead or TOOD, but a lightweight task-aware modulation mechanism designed for the YOLOv8 decoupled head in UAV-based power line inspection. It should be noted that the above discussion provides a conceptual comparison based on architectural design. DyHead and TOOD were not reimplemented and evaluated under the same YOLOv8n architecture and training protocol in this study; therefore, no direct empirical claim of superiority over these related detection-head designs is made. Instead, the present study evaluates the contribution of TADetect through controlled comparisons with the original YOLOv8 detection head and fine-grained ablation experiments of its internal scale-aware and task-aware components.
4. Experimental Results and Analysis
4.1. Dataset Description
4.1.1. TPL-SOD Dataset
- TPL-SOD Dataset Construction and Annotation Protocol
To further evaluate the detection capability of the proposed DSCMamba-TAD-YOLOv8 model in transmission line small-object inspection scenarios, this study constructs a two-class object detection dataset named TPL-SOD. Different from an image-level classification dataset, TPL-SOD is designed for object detection, requiring each insulator target to be localized by a bounding box and assigned to a specific category. The dataset contains two object categories: normal_insulator and defect_insulator.
The TPL-SOD dataset is constructed by combining publicly available Roboflow Universe datasets and self-collected UAV inspection images. The composition of the TPL-SOD dataset is summarized in Table 1. For the public-source subset, defective insulator images are selected from the insulator-defect Dataset [33], and normal insulator images are selected from the insulators Dataset [34]. The original Roboflow projects contain 1578 defective insulator images and 1871 normal insulator images, respectively. To improve dataset validity and reduce the risk of data leakage, an additional screening and quality-control process was conducted. After duplicate screening, near-duplicate screening, annotation verification, and quality filtering, 822 defective insulator images and 1036 normal insulator images were selected from the two Roboflow projects for constructing the revised TPL-SOD dataset.
Table 1.
Composition of the revised TPL-SOD dataset.
In addition to the public-source images, 600 UAV inspection images were self-collected from real transmission-line inspection scenarios, including 213 defective insulator images and 387 normal insulator images. Therefore, the revised TPL-SOD dataset contains 2458 images in total, including 1035 defective insulator images and 1423 normal insulator images. The revised TPL-SOD dataset was then remixed, re-split, and used to rerun the corresponding model experiments.
To improve the traceability and reproducibility of the public-source subset, the exact Roboflow projects used in this study were rechecked and recorded. The project names, dataset versions, licenses, original project image counts, selected classes, and numbers of images used after screening are summarized in Table 2. According to the “Cite This Project” section of the corresponding Roboflow project pages, both public-source datasets are distributed under the CC BY 4.0 license. Therefore, the public-source images were used with proper citation and attribution. The selected images were further checked, cleaned, and standardized into YOLO annotation format for the TPL-SOD object detection task.
Table 2.
Public-source information of the Roboflow Universe datasets used in TPL-SOD.
In this study, a defective insulator is defined as an insulator or insulator string showing visible abnormal conditions that may affect its structural integrity or operational reliability, such as broken sheds, missing sheds, cracks, surface damage, or other visually identifiable defects. A normal insulator refers to an insulator or insulator string without visible structural damage or obvious abnormal appearance in the image. Ambiguous samples whose status could not be reliably determined from the image were excluded during data cleaning.
The bounding-box annotation protocol was designed according to the two-class status-detection setting of TPL-SOD. In this dataset, the class label represents the overall visual condition of an insulator target rather than the location of a local defect region. For the normal_insulator class, the bounding box covers the complete visible normal insulator or insulator string. For the defect_insulator class, if one or more visible abnormal regions appear on an insulator or insulator string, the complete visible insulator or insulator string is annotated as defect_insulator. Therefore, the bounding box for a defective sample also covers the whole target rather than only the local damaged area.
This annotation strategy is adopted because TPL-SOD is constructed as a two-class object detection dataset for distinguishing normal and defective insulator targets. The objective is to localize insulator targets and classify their overall condition, rather than to perform fine-grained defect-region localization or pixel-level defect segmentation. Using the same object granularity for both categories avoids a category-definition mismatch in which normal samples are annotated as complete insulator objects while defective samples are annotated only by local defect regions. In images containing both normal and defective insulators, each visible insulator target is annotated independently with its corresponding status label. The term “mixed insulator” is used only for organizing representative examples and is not treated as an additional object category.
All annotations were stored in YOLO format. The annotation process was performed by one annotator with experience in deep-learning-based object detection. The annotations were subsequently checked through repeated visual inspection by the first author under the guidance of the corresponding author. During quality control, image-label consistency was verified by checking whether each image had a corresponding label file, whether all class IDs were valid, whether the normalized bounding-box coordinates were within the range [0, 1], and whether the bounding boxes covered the complete visible target according to the annotation protocol. Images with severe blur, extreme occlusion, unreadable targets, duplicated content, ambiguous insulator status, or invalid labels were removed or corrected. After annotation verification and quality control, the revised TPL-SOD dataset contained 2458 images with corresponding YOLO-format annotation files and 2783 annotated object instances, including 1626 normal_insulator instances and 1157 defect_insulator instances. On average, each image contained approximately 1.13 annotated object instances, indicating that most images contain one primary insulator target while some images contain multiple visible insulator targets.
Since the self-collected images involve real power infrastructure scenes, specific geographic coordinates, line numbers, tower identifiers, and other sensitive infrastructure-related information are not disclosed. Before being used in the experiments, the self-collected UAV images were anonymized by removing or avoiding the disclosure of sensitive metadata. Due to the licensing conditions of the original public-source datasets and the sensitivity of self-collected power-infrastructure images, the complete TPL-SOD dataset is not publicly redistributed. To support transparency and reproducibility, the dataset source information, annotation protocol, class definitions, screening criteria, split statistics, fixed split lists, and representative anonymized samples are provided as Supplementary Materials.
- TPL-SOD Data Splitting and Leakage Prevention
To reduce the risk of data leakage, the dataset was split using a source-aware and group-aware strategy rather than a purely random image-level split. Before splitting, duplicate and near-duplicate screening was conducted. Exact duplicate images were checked using MD5 file hashing, and near-duplicate images were screened using a 64-bit perceptual hashing with a Hamming-distance threshold of . This process removed exact duplicate images and near-duplicate image clusters. These images were removed or assigned to the same subset before model training and evaluation. Candidate near-duplicate image pairs were manually inspected. Images identified as exact duplicates or near-duplicates were either removed or assigned to the same subset to prevent visually similar images from appearing across different subsets.
For the self-collected UAV subset, images were first grouped according to acquisition sequence and inspection site when metadata or collection records were available. For images without explicit metadata, visually similar images from the same tower segment, infrastructure scene, or inspection viewpoint were manually grouped before splitting. All images within the same group were assigned to the same subset. For the public-source subset, the original Roboflow project source was retained as source metadata for stratified splitting, while near-duplicate clusters were treated as indivisible groups and assigned to the same subset. This procedure was used to reduce the possibility that images of the same infrastructure, the same UAV sequence, or highly similar public-source images appeared simultaneously in the training and evaluation subsets.
The revised TPL-SOD was divided into training, validation, and held-out test subsets. The training subset was used for model parameter learning, the validation subset was used for checkpoint selection and model-selection-related monitoring, and the held-out test subset was used only once for final performance evaluation. The held-out test subset was not used for architecture design, hyperparameter tuning, checkpoint selection, early stopping, or ablation-based model selection. The fixed split lists are provided in Supplementary Materials to ensure that the reported results can be reproduced.
The split statistics of the revised TPL-SOD are shown in Table 3. To further evaluate cross-source generalization, the held-out test subset contains both public-source images and self-collected UAV images. Separate evaluation results for the public-source test subset and the self-collected UAV test subset are reported in Section 4.3.1.
Table 3.
Train/validation/test split of the revised TPL-SOD dataset.
A source-wise summary of the TPL-SOD split is further provided in Table 4. This table is included to clarify the distribution of public-source and self-collected UAV images across the training, validation, and held-out test subsets. The detailed source- and category-wise distribution of the revised TPL-SOD dataset is further summarized in Table 5.
Table 4.
Source-wise split statistics of the revised TPL-SOD dataset.
Table 5.
Source- and category-wise split of the revised TPL-SOD dataset.
4.1.2. InsPLAD-Det Power Line Inspection Dataset
The InsPLAD-det dataset is derived from the InsPLAD benchmark for power line asset inspection in UAV images [28]. It contains 17 target categories in transmission line inspection scenarios. YOLO-format annotation files are used for training and validation in the experiments. The official train/validation split of InsPLAD-det is used as the basis of the experimental partition to ensure consistency with the original dataset protocol. During data loading, 48 images included in the official split could not be successfully decoded by the adopted image-loading pipeline and were therefore excluded from the experiments. These exclusions resulted solely from image-decoding failures and were not based on object category, annotation content, detection difficulty, or model performance. Consequently, the final experimental subsets contained 7933 training images and 2626 validation images, and the same filtered subsets were used consistently for all compared models and ablation experiments.
Because InsPLAD-det contains many small-sized targets, fine-grained targets, and visually similar categories, such as multiple types of shackles and spacers, this dataset imposes higher requirements on feature extraction capability, feature fusion capability, and the rationality of lightweight model design. Therefore, InsPLAD-det is suitable as a validation platform for the lightweight transmission line detection model proposed in this paper. The statistical information of the InsPLAD-det dataset is summarized in Table 6.
Table 6.
Statistics of the InsPLAD-det dataset.
4.1.3. Model-Selection and Evaluation Protocol
For TPL-SOD, the revised dataset is divided into training, validation, and held-out test subsets. The training subset is used for model parameter learning, the validation subset is used for checkpoint selection and model-selection-related monitoring, and the held-out test subset is used only for final evaluation.
For InsPLAD-det, the official training/validation split assignments were retained for all successfully decoded images. Since an independent public test set with annotations is not available, the reported InsPLAD-det results should be interpreted as comparative validation results under this experimental protocol rather than as performance estimates from a completely independent held-out test set. All compared models and ablation variants are trained and evaluated using the same filtered training/validation subsets, input resolution, optimizer, learning-rate schedule, training epochs, batch size, augmentation strategy, and checkpoint-selection criterion. No model-specific confidence threshold, NMS threshold, or class-specific postprocessing adjustment is applied.
4.2. Implementation Details and Evaluation Metrics
All YOLO-based experiments were implemented using the Ultralytics framework version v8.3.161. The experiments were conducted under Ubuntu 22.04.5 LTS with Python 3.12.13 and PyTorch 2.11.0+cu128. The hardware platform was equipped with an NVIDIA Tesla T4 GPU with 15 GB memory, an Intel Xeon CPU @ 2.00 GHz, and 12 GB system memory. The CUDA runtime version used by PyTorch was 12.8. To improve reproducibility, the model configuration files, training scripts, evaluation scripts, and fixed data split lists are provided as Supplementary Materials.
For all experiments, the input images were uniformly resized to pixels. The YOLOv8n baseline and the proposed YOLOv8n-based variants were initialized with the pretrained weights yolov8n.pt, while other compared models were initialized with their corresponding pretrained weights when available. The number of training epochs was set to 100, the batch size was set to 8, and the number of workers was set to 2. During training, the AdamW optimizer [35] was adopted with an initial learning rate of 0.001 and a weight decay of 0.0005. The learning rate was adjusted using a cosine annealing strategy [36]. In addition, Mosaic augmentation [37] was disabled in the last 10 epochs to improve training stability in the final stage. Unless otherwise specified, all models were trained under the same training configuration.
For evaluation, the checkpoint with the best validation performance was used for each model. No model-specific confidence threshold, NMS threshold, or class-specific postprocessing adjustment was applied. This unified protocol was adopted to ensure a controlled comparison among different models, although it may not represent the individually optimized upper-bound performance of every alternative detector.
To comprehensively evaluate the performance of the proposed model in power line inspection object detection tasks, Precision, Recall, mAP@0.5, mAP@0.5:0.95, Params, GFLOPs, and FPS are reported as the main evaluation metrics. Precision, Recall, mAP@0.5, and mAP@0.5:0.95 are used to evaluate detection accuracy and localization quality, while Params, GFLOPs, and FPS are used to evaluate model complexity and inference efficiency.
For model complexity, Params and GFLOPs are used as evaluation metrics.
TP denotes true positives, i.e., the number of targets correctly detected by the model; FP denotes false positives, i.e., the number of background regions or incorrect categories mistakenly detected as targets; and FN denotes false negatives, i.e., the number of real targets present in the image that are not detected by the model. Precision measures the proportion of correct predictions among all predicted results; a higher Precision indicates fewer false detections. Recall measures the proportion of real targets correctly detected by the model; a higher Recall indicates fewer missed detections.
In object detection tasks, the matching relationship between predicted boxes and ground-truth boxes is usually determined by the intersection over union . is the ratio between the intersection area and the union area of the predicted box and the ground-truth box.
denotes the predicted bounding box, denotes the ground-truth bounding box, ∩ denotes the intersection of two regions, and ∪ denotes the union of two regions. When the between a predicted box and a ground-truth box exceeds the predefined threshold, the predicted box can be regarded as a correct detection.
AP (Average Precision) denotes the area under the Precision–Recall curve for a specific category under different confidence thresholds, and is used to measure the model’s detection performance for a single category.
P denotes Precision and R denotes Recall. (mean Average Precision) represents the average AP over all categories and is used to comprehensively evaluate the overall detection performance of the model in multi-category object detection tasks. Here, C denotes the total number of categories in the dataset, and denotes the average precision of the i-th category.
mAP@0.5 represents the mean AP of all categories when the IoU threshold is 0.5. IoU is used to measure the overlap between a predicted box and a ground-truth box. When the IoU between them exceeds the predefined threshold, the predicted box can be considered a correct detection. mAP@0.5 is a commonly used comprehensive evaluation metric in object detection tasks; a higher value indicates better overall detection performance. mAP@0.5:0.95 indicates that mAP is calculated at multiple IoU thresholds from 0.5 to 0.95 with a step size of 0.05, and then averaged over all thresholds. Compared with mAP@0.5, mAP@0.5:0.95 imposes stricter requirements on bounding-box localization accuracy and can therefore more rigorously reflect the comprehensive detection capability of the model. In power line inspection tasks, some power components are small and easily affected by complex backgrounds, occlusion, and changes in shooting angle. Therefore, mAP@0.5:0.95 is important for evaluating the model’s bounding-box localization capability. In addition to detection accuracy metrics, this paper uses Params and GFLOPs to evaluate the lightweight degree of the model.
4.3. Model Testing and Result Analysis
4.3.1. Experiments Using the TPL-SOD Dataset
To verify the detection capability of DSCMamba-TAD-YOLOv8 in transmission line small-object scenarios, this paper compares the YOLOv8n baseline with DSCMamba-TAD-YOLOv8 on the self-built mixed dataset TPL-SOD. TPL-SOD is constructed as a two-class object detection dataset, including normal insulators and defect insulators. Therefore, this experiment is not a simple image classification task; instead, it requires the model to locate insulator targets in images and further distinguish whether they are normal or defective. All results in this subsection are reported on the held-out test subset of the revised TPL-SOD dataset.
The overall experimental results are shown in Table 7. On the held-out test subset of TPL-SOD, YOLOv8n achieves 86.20% Precision, 91.75% Recall, 87.09% mAP@0.5, and 68.44% mAP@0.5:0.95. In comparison, DSCMamba-TAD-YOLOv8 improves these metrics to 88.16%, 92.33%, 88.81%, and 70.13%, respectively. Compared with YOLOv8n, the proposed model improves Precision, Recall, mAP@0.5, and mAP@0.5:0.95 by 1.96, 0.58, 1.72, and 1.69 percentage points, respectively.
Table 7.
Comparison results on the held-out test subset of TPL-SOD.
For class-wise detection performance, DSCMamba-TAD-YOLOv8 improves the AP@0.5 of normal insulators from 88.67% to 90.58%, corresponding to an increase of 1.91 percentage points. The AP@0.5 of defective insulators is improved from 85.51% to 87.04%, corresponding to an increase of 1.53 percentage points. These results indicate that the proposed model improves the detection performance for both normal and defective insulators. In particular, the improvement in defect-insulator AP suggests that DSCMamba-TAD-YOLOv8 is more effective in recognizing defective insulator targets under the two-class object detection setting.
The corresponding Precision–Recall curves are shown in Figure 7. The curves provide a visual supplement to the class-wise AP results in Table 7. Compared with YOLOv8n, DSCMamba-TAD-YOLOv8 obtains a larger area under the curve for both normal and defective insulators, indicating a better precision–recall trade-off under different confidence thresholds.
Figure 7.
PR curves of YOLOv8n and DSCMamba-TAD-YOLOv8 on the held-out test subset TPL-SOD. (a) YOLOv8n. (b) DSCMamba-TAD-YOLOv8.
To further evaluate whether the performance improvement is consistent across different data sources, source-wise evaluation results are reported in Table 8. On the public-source test subset, DSCMamba-TAD-YOLOv8 improves Precision from 87.45% to 89.13%, Recall from 92.44% to 93.98%, mAP@0.5 from 88.25% to 89.56%, and mAP@0.5:0.95 from 70.55% to 73.80%. On the self-collected UAV test subset, the proposed model improves Precision from 84.66% to 86.72%, Recall from 88.14% to 88.53%, mAP@0.5 from 84.70% to 86.68%, and mAP@0.5:0.95 from 65.21% to 69.45%. These results show that DSCMamba-TAD-YOLOv8 achieves consistent performance gains on both public-source images and self-collected UAV images.
Table 8.
Source-wise evaluation results on the held-out test subset of TPL-SOD.
It can also be observed that the absolute performance on the self-collected test subset is lower than that on the public-source test subset. This is reasonable because the self-collected images are captured from real transmission-line inspection scenarios and may contain more complex backgrounds, viewpoint changes, scale variations, and imaging disturbances. Nevertheless, DSCMamba-TAD-YOLOv8 still outperforms YOLOv8n on this subset, indicating that the proposed method maintains effectiveness in more challenging UAV inspection scenarios.
In addition, mAP@0.5:0.95 evaluates detection performance under multiple IoU thresholds and imposes stricter requirements on bounding-box localization accuracy. DSCMamba-TAD-YOLOv8 improves this metric from 68.44% to 70.13% on the overall held-out test subset. The improvement suggests that the proposed method not only improves detection performance at IoU = 0.5, but also enhances bounding-box localization quality under stricter IoU thresholds.
To further analyze the optimization process, the training box loss curves of YOLOv8n and DSCMamba-TAD-YOLOv8 on the revised TPL-SOD training subset are plotted in Figure 8. Both models show a decreasing loss trend as the number of epochs increases, indicating normal convergence on the revised TPL-SOD dataset. Compared with YOLOv8n, DSCMamba-TAD-YOLOv8 maintains a lower box loss during most of the training process and converges to a lower final loss level, suggesting better bounding-box regression behavior on the training samples.
Figure 8.
Training box loss curves of YOLOv8n and DSCMamba-TAD-YOLOv8 on the TPL-SOD dataset. (The sharp step near the final training stage is related to disabling Mosaic augmentation 10 epochs before the end of training).
The sharp step observed near the final training stage is mainly related to the training strategy described in Section 4.2, where Mosaic augmentation is disabled 10 epochs before the end of training. This transition changes the training samples from Mosaic-augmented composite images to non-Mosaic images that are closer to the original image distribution, which may cause a step-like change in the box loss curve rather than indicating abnormal model divergence. The training box loss curve is used only as a supplementary analysis of the optimization process, while the main conclusions are based on the held-out test results reported in Table 7 and Table 8. Overall, the results on the revised TPL-SOD dataset demonstrate that DSCMamba-TAD-YOLOv8 provides better insulator detection performance than YOLOv8n and maintains consistent improvements across both public-source and self-collected test subsets.
4.3.2. Experiments Using the InsPLAD-Det Power Line Inspection Dataset
To quantitatively analyze the object detection performance and lightweight effect of the proposed method, this paper compares DSCMamba-TAD-YOLOv8 with several mainstream object detection models, including YOLOv5s [19], YOLOv6s [38], YOLOv8s [15], MHAF-YOLO [39], YOLO-NAS-s [40], and RT-DETR-R18 [41].
As shown in Table 9, DSCMamba-TAD-YOLOv8 achieves the best Precision, mAP@0.5, and mAP@0.5:0.95 among all compared models, reaching 91.86%, 91.83%, and 74.82%, respectively. Compared with the YOLOv8n baseline, whose Precision, Recall, mAP@0.5, and mAP@0.5:0.95 are 87.77%, 87.04%, 89.40%, and 70.36%, respectively, the proposed DSCMamba-TAD-YOLOv8 improves these metrics to 91.86%, 88.02%, 91.83%, and 74.82%. Specifically, Precision, mAP@0.5, and mAP@0.5:0.95 are increased by 4.09, 2.43, and 4.46 percentage points, respectively. Recall is also maintained at a comparable level and slightly increases from 87.04% to 88.02%. These results indicate that the proposed method mainly improves prediction precision and localization quality while preserving the target recall capability of the YOLOv8n baseline. Meanwhile, the number of parameters is reduced from 3.2 M to 2.7 M, corresponding to a reduction of approximately 15.6%, and the GFLOPs are reduced from 8.2 to 7.5, corresponding to a reduction of approximately 8.5%. These results indicate that the proposed method improves detection accuracy and localization quality while reducing model size and computational complexity.
Table 9.
Comparison results on the InsPLAD-det dataset.
Compared with YOLOv8s, DSCMamba-TAD-YOLOv8 shows a better balance between detection accuracy and lightweight design. YOLOv8s achieves the highest Recall of 89.48%, indicating strong target recall capability. However, its Precision, mAP@0.5, and mAP@0.5:0.95 are 90.36%, 90.88%, and 73.12%, respectively, which are lower than those of DSCMamba-TAD-YOLOv8. In particular, DSCMamba-TAD-YOLOv8 improves mAP@0.5 by 0.95 percentage points and mAP@0.5:0.95 by 1.70 percentage points compared with YOLOv8s. In addition, YOLOv8s requires 11.2 M parameters and 28.5 GFLOPs, whereas DSCMamba-TAD-YOLOv8 only requires 2.7 M parameters and 7.5 GFLOPs. Therefore, the parameter count and computational cost of DSCMamba-TAD-YOLOv8 are only about 24.1% and 26.3% of those of YOLOv8s, respectively. This demonstrates that the proposed model achieves higher detection accuracy and localization quality with a much smaller model scale.
Compared with YOLOv5s and YOLOv6s, DSCMamba-TAD-YOLOv8 obtains higher Precision, Recall, mAP@0.5, and mAP@0.5:0.95 with significantly fewer parameters and lower computational cost. The mAP@0.5 values of YOLOv5s and YOLOv6s are 86.34% and 87.05%, respectively, while DSCMamba-TAD-YOLOv8 reaches 91.83%. Meanwhile, the proposed model requires only 2.7 M parameters and 7.5 GFLOPs, which are much lower than those of YOLOv5s and YOLOv6s. Although YOLOv6s achieves the highest FPS of 288.1, it has much larger model complexity and lower detection accuracy than the proposed method.
MHAF-YOLO and RT-DETR-R18 achieve relatively high Precision values of 90.83% and 91.11%, respectively. However, their mAP@0.5 values are 87.86% and 87.57%, and their mAP@0.5:0.95 values are 72.51% and 73.68%, respectively, which are lower than those of DSCMamba-TAD-YOLOv8. Moreover, MHAF-YOLO requires 7.5 M parameters and 26.8 GFLOPs, while RT-DETR-R18 requires 19.9 M parameters and 57.0 GFLOPs. In contrast, DSCMamba-TAD-YOLOv8 achieves higher Precision, mAP@0.5, and mAP@0.5:0.95 with only 2.7 M parameters and 7.5 GFLOPs. This shows that the proposed model has better overall detection performance and a more compact computational structure.
It should be noted that DSCMamba-TAD-YOLOv8 does not achieve the highest FPS. The FPS of DSCMamba-TAD-YOLOv8 is 163.9, which is lower than that of YOLOv5s, YOLOv6s, YOLOv8s, and YOLOv8n. This is mainly because the proposed model introduces additional feature modulation and multi-branch operations, such as DSCMambaNet, CBAM, and TADetect, which increase runtime overhead. Nevertheless, DSCMamba-TAD-YOLOv8 still maintains a GPU FPS above 160 and is faster than MHAF-YOLO, YOLO-NAS-s, and RT-DETR-R18. More importantly, it achieves the best Precision, mAP@0.5, and mAP@0.5:0.95, as well as the smallest parameter count and the lowest GFLOPs. Therefore, the proposed model focuses on improving detection accuracy and reducing model complexity while maintaining acceptable inference speed, rather than simply pursuing the highest FPS.
In summary, DSCMamba-TAD-YOLOv8 achieves a strong balance between detection performance and lightweight design on the InsPLAD-det dataset. Compared with the YOLOv8n baseline, it improves Precision, Recall, mAP@0.5, and mAP@0.5:0.95 while reducing the number of parameters and GFLOPs. Compared with other mainstream detection models, it achieves the highest Precision, mAP@0.5, and mAP@0.5:0.95 with the smallest model size and the lowest computational complexity.
4.4. Ablation Experiments
To verify the effects of the proposed modules on detection performance and lightweight design, ablation experiments were conducted on the InsPLAD-det dataset using YOLOv8n as the baseline. At the module level, Neck DSConv, DSCMambaNet, and TADetect were introduced separately and in different combinations. The performance was evaluated using Precision, Recall, mAP@0.5, mAP@0.5:0.95, Params, GFLOPs, and FPS.
In addition to the module-level ablation study, fine-grained ablation experiments were conducted to isolate the internal effects of DSCMambaNet and TADetect. For DSCMambaNet, the local DSConv branch, Mamba branch, residual connection, and embedded CBAM component were analyzed. For TADetect, the Scale-Aware Gate, Regression TaskGate, and Classification TaskGate were evaluated independently and jointly.
The experimental results of the module-level ablation study are shown in Table 10. The baseline YOLOv8n achieves 87.77% Precision, 87.04% Recall, 89.40% mAP@0.5, and 70.36% mAP@0.5:0.95, with 3.209 M parameters and 8.2 GFLOPs. These results indicate that YOLOv8n provides a competitive lightweight baseline for power-line component detection. However, UAV-based transmission line inspection images usually contain small-scale fittings, complex backgrounds, and fine-grained object categories, which still leave room for improving feature representation and detection-head adaptability.
Table 10.
Ablation study of different modules on the InsPLAD-det dataset.
When only Neck DSConv is introduced, the model becomes more compact, with Params decreasing from 3.209 M to 2.634 M and GFLOPs decreasing from 8.2 to 7.3. The FPS increases from 277.80 to 282.19. These results show that DSConv can effectively reduce model complexity and improve computational efficiency. However, mAP@0.5 and mAP@0.5:0.95 decrease to 87.16% and 67.86%, respectively, suggesting that DSConv alone reduces computational redundancy but weakens feature representation in complex small-object scenes.
When DSCMambaNet is introduced without replacing the Neck convolution layers with DSConv, the model achieves 88.41% Precision, 87.08% Recall, 89.96% mAP@0.5, and 71.73% mAP@0.5:0.95. Compared with the baseline, Precision, Recall, mAP@0.5, and mAP@0.5:0.95 are improved by 0.64, 0.04, 0.56, and 1.37 percentage points, respectively. Meanwhile, the number of parameters is reduced from 3.209 M to 2.836 M, and the GFLOPs are reduced from 8.2 to 7.5. These results indicate that DSCMambaNet improves the feature representation capability of the Neck while maintaining a smaller model size. The improvement mainly comes from local–global feature modeling and embedded attention refinement inside DSCMambaNet. However, its FPS decreases to 161.08, suggesting that the additional feature modeling and attention operations introduce runtime overhead.
When Neck DSConv and DSCMambaNet are combined, the model achieves the highest Recall of 89.65%, which is 2.61 percentage points higher than that of the baseline. The mAP@0.5 and mAP@0.5:0.95 are also improved to 89.82% and 71.88%, respectively. In terms of model complexity, the parameter count decreases to 2.805 M and the GFLOPs decrease to 7.3. These results suggest that combining lightweight convolution with DSCMambaNet can improve the model’s ability to detect more target instances while reducing computational complexity. The FPS of this variant is 212.46, which is lower than that of the baseline but higher than that of DSCMambaNet alone. This indicates that replacing Neck convolution layers with DSConv can partially compensate for the runtime overhead introduced by DSCMambaNet.
When only TADetect is used to replace the original YOLOv8n detection head, the model achieves 90.88% Precision, 86.92% Recall, 90.45% mAP@0.5, and 73.58% mAP@0.5:0.95. Compared with the baseline, Precision, mAP@0.5, and mAP@0.5:0.95 are improved by 3.11, 1.05, and 3.22 percentage points, respectively. This shows that the scale-aware and task-aware feature modulation in TADetect can improve prediction adaptability and localization quality. Nevertheless, TADetect slightly increases model complexity, with the number of parameters increasing from 3.209 M to 3.272 M and GFLOPs increasing from 8.2 to 8.3.
The combination of DSCMambaNet and TADetect further improves the overall detection performance. This variant achieves 90.65% Precision, 88.83% Recall, 91.53% mAP@0.5, and 74.63% mAP@0.5:0.95. Compared with the baseline, Precision, Recall, mAP@0.5, and mAP@0.5:0.95 are improved by 2.88, 1.79, 2.13, and 4.27 percentage points, respectively, while the number of parameters is reduced from 3.209 M to 2.868 M. These results demonstrate the complementarity between Neck feature enhancement and task-aware detection-head design. DSCMambaNet enhances multi-scale feature representation, while TADetect further improves the prediction adaptability of the detection head for classification and localization.
The final DSCMamba-TAD-YOLOv8 model integrates Neck DSConv, DSCMambaNet, and TADetect. It achieves the best Precision of 91.86%, the best mAP@0.5 of 91.83%, and the best mAP@0.5:0.95 of 74.82% among all module-level ablation variants. Compared with the baseline YOLOv8n, Precision, Recall, mAP@0.5, and mAP@0.5:0.95 are improved by 4.09, 0.98, 2.43, and 4.46 percentage points, respectively. Meanwhile, the number of parameters is reduced from 3.209 M to 2.702 M, corresponding to a reduction of approximately 15.80%, and the GFLOPs are reduced from 8.2 to 7.5, corresponding to a reduction of approximately 8.54%. These results indicate that the proposed model improves detection accuracy and localization quality while maintaining a compact model scale.
It should also be noted that the final model does not achieve the highest FPS. The FPS decreases from 277.80 for the baseline to 163.90 for the final model. This is mainly because DSCMambaNet, CBAM, and TADetect introduce additional feature modulation and multi-branch operations, which increase runtime overhead despite reducing the number of parameters and GFLOPs. Therefore, the proposed method focuses on improving detection accuracy and reducing model complexity while maintaining acceptable inference speed, rather than simply maximizing FPS.
To further examine the statistical reliability of the main performance improvements, the principal configurations selected from Table 10 were repeated over three independent random seeds, as shown in Table 11. Specifically, YOLOv8n, DSCMambaNet-only, TADetect-only, and the final DSCMamba-TAD-YOLOv8 model were selected to represent the baseline, the key Neck-side feature enhancement module, the key detection-head module, and the final integrated model, respectively. The results are reported as mean ± standard deviation over seeds 0, 1, and 2. The final DSCMamba-TAD-YOLOv8 model consistently achieves the highest mean Precision, Recall, mAP@0.5, and mAP@0.5:0.95 among these principal configurations. The relatively small standard deviations also indicate that the main performance gains are stable under different random initialization, data augmentation, and mini-batch ordering conditions.
Table 11.
Statistical reliability analysis of the principal configurations selected from the module-level ablation study in Table 10 over three independent seeds on the InsPLAD-det dataset.
The fine-grained ablation results of DSCMambaNet are shown in Table 12. Compared with the YOLOv8n baseline, the Local DSConv-only variant reduces the number of parameters from 3.209 M to 2.757 M and increases the FPS from 277.80 to 284.95. However, its mAP@0.5 and mAP@0.5:0.95 decrease to 86.84% and 66.37%, respectively. This indicates that a lightweight local convolutional branch alone is insufficient to maintain the detection performance of the original baseline.
Table 12.
Fine-grained ablation study of DSCMambaNet components on the InsPLAD-det dataset.
The Mamba-only variant achieves 87.47% Precision, 85.86% Recall, 86.97% mAP@0.5, and 68.61% mAP@0.5:0.95. Although the Mamba-only variant improves mAP@0.5:0.95 compared with the Local DSConv-only variant, its performance still remains below the baseline. Therefore, the fine-grained ablation results suggest that the Mamba branch alone does not provide consistent improvements over the baseline across all evaluation metrics.
A comparison between A1 and A3 provides a more direct view of the contribution of the Mamba branch, since both variants retain the Local DSConv branch and residual connection, while A3 additionally introduces Mamba-based contextual modeling. From A1 to A3, Precision increases from 86.32% to 87.04%, Recall from 86.48% to 86.74%, mAP@0.5 from 86.84% to 87.80%, and mAP@0.5:0.95 from 66.37% to 69.29%. In particular, the 2.92-percentage-point improvement in mAP@0.5:0.95 suggests that the Mamba branch provides useful complementary contextual information to the lightweight local convolutional structure. Although the A3 configuration does not yet exceed the original YOLOv8n baseline before CBAM refinement is introduced, the fine-grained results indicate that Mamba contributes to recovering detection performance within the lightweight local–global design rather than acting as an isolated source of performance gain.
After the embedded CBAM component is further added to the local–global structure, the complete DSCMambaNet variant (A4) reaches 88.41% Precision, 87.08% Recall, 89.96% mAP@0.5, and 71.73% mAP@0.5:0.95. Compared with A3, Precision, Recall, mAP@0.5, and mAP@0.5:0.95 increase by 1.37, 0.34, 2.16, and 2.44 percentage points, respectively. With the complete DSCMambaNet configuration, the mAP metrics are restored to levels comparable to those of the original YOLOv8n baseline, while the lightweight structural benefits of the redesigned Neck are retained. These results suggest that the effectiveness of DSCMambaNet arises from the joint effect and complementary roles of lightweight local feature extraction, Mamba-based contextual modeling, and subsequent CBAM-based feature refinement, rather than from any single component in isolation.
The fine-grained ablation results of TADetect are shown in Table 13. The Scale-Aware Gate alone improves Precision from 87.77% to 89.80%, mAP@0.5 from 89.40% to 89.98%, and mAP@0.5:0.95 from 70.36% to 72.74%, indicating that scale-level feature modulation helps the detection head better adapt to multi-scale targets. The Regression TaskGate alone achieves 89.12% Precision and 72.62% mAP@0.5:0.95, showing that regression-oriented feature modulation improves localization-related performance. The Classification TaskGate alone improves mAP@0.5:0.95 from 70.36% to 73.00%, although Precision and Recall slightly decrease. This suggests that classification-oriented feature modulation may improve confidence ranking and localization-sensitive AP under stricter IoU thresholds, but it is not sufficient alone to improve all detection metrics.
Table 13.
Fine-grained ablation study of TADetect components on the InsPLAD-det dataset.
When both regression and classification TaskGates are used, Precision increases to 91.50%, which is the highest Precision among the TADetect fine-grained variants. This shows that task-specific feature modulation can improve prediction discriminability. Finally, the complete TADetect module, which combines the Scale-Aware Gate, Regression TaskGate, and Classification TaskGate, achieves 90.88% Precision, 90.45% mAP@0.5, and 73.58% mAP@0.5:0.95. Compared with each individual gate setting, the complete TADetect provides the best overall mAP performance, confirming the effectiveness of combining scale-aware and task-aware feature modulation in the detection head.
In summary, the ablation experiments demonstrate that different modules contribute to the proposed model in different ways. Neck DSConv mainly reduces parameters and GFLOPs, but using it alone may weaken detection accuracy. DSCMambaNet improves multi-scale feature representation through local–global feature modeling and attention refinement. TADetect improves prediction adaptability by introducing scale-aware and task-aware modulation in the detection head. The final DSCMamba-TAD-YOLOv8 model combines these advantages and achieves the best overall detection accuracy with fewer parameters and lower GFLOPs than the YOLOv8n baseline, verifying the effectiveness and complementarity of the proposed modules for UAV-based transmission line inspection.
4.5. Class-Wise Precision–Recall Analysis
To further examine category-specific detection performance on the InsPLAD-det dataset, the class-wise precision–recall curves of YOLOv8n and DSCMamba-TAD-YOLOv8 are compared in Figure 9. The PR curves are presented for a representative evaluation run to provide class-level diagnostic information, whereas the aggregate performance values reported in Table 9 are the mean results over three independent random-seed runs. Therefore, slight differences between the all-class mAP@0.5 values shown in the PR curves and the corresponding mean values reported in the table are expected.
Figure 9.
Class-wise precision–recall curves from a representative evaluation run on the InsPLAD-det validation set. (a) YOLOv8n. (b) DSCMamba-TAD-YOLOv8.
The class-wise results show that the performance gains are not uniformly distributed across categories and are more pronounced for several challenging and fine-grained power-line components. In particular, the AP@0.5 of spacer increases from 81.1% to 93.7%, corresponding to an improvement of 12.6 percentage points. For the visually similar glass-insulator shackle categories, the AP@0.5 values of glass insulator big shackle, glass insulator small shackle, and glass insulator tower shackle increase from 54.9%, 60.4%, and 63.7% to 64.7%, 63.8%, and 71.7%, respectively. Lightning rod shackle and polymer insulator lower shackle also improve from 85.6% to 88.3% and from 89.1% to 91.6%, respectively.
In contrast, several categories with already high baseline AP@0.5 values remain at similarly high performance levels and exhibit only minor class-dependent fluctuations. For example, yoke suspension changes from 99.0% to 98.9%, stockbridge damper from 98.5% to 98.2%, and polymer insulator from 99.1% to 98.9%. Taken together, these results indicate that the overall improvement is mainly associated with enhanced performance on several relatively challenging fine-grained categories rather than uniform gains across all asset classes. The class-wise PR analysis therefore provides a more detailed view of category-specific detection performance and the precision–recall characteristics of different power-line components.
4.6. Confusion Matrix Analysis
To further analyze the class-level recognition performance of the proposed model, the normalized confusion matrices of YOLOv8n and DSCMamba-TAD-YOLOv8 are compared on the InsPLAD-det validation set. It is used as a supplementary analysis to observe the misclassification patterns among different power line components and to further evaluate the recognition stability of the proposed model.
As shown in Figure 10, some categories have distinctive structural features, such as yoke, yoke suspension, tower id plate, vari-grip, and spiral damper. They obtain high diagonal responses in both models. This indicates that these categories can be recognized relatively reliably. In contrast, fine-grained fittings such as glass insulator big shackle, glass insulator small shackle, and glass insulator tower shackle show lower diagonal values, suggesting that these visually similar small components are more difficult to distinguish and rely more heavily on detailed local structures and surrounding contextual information.
Figure 10.
Normalized confusion matrices of YOLOv8n and DSCMamba-TAD-YOLOv8 on the InsPLAD-det validation set. (a) YOLOv8n. (b) DSCMamba-TAD-YOLOv8.
Compared with YOLOv8n, DSCMamba-TAD-YOLOv8 improves the recognition accuracy of several challenging categories. For example, the diagonal value of yoke increases from 0.95 to 0.96, spacer increases from 0.82 to 0.86, glass insulator big shackle increases from 0.48 to 0.49, glass insulator tower shackle increases from 0.52 to 0.57, and spiral damper increases from 0.99 to 1.00. These improvements indicate that the proposed model enhances the recognition ability for some small and fine-grained power line components.
In addition, DSCMamba-TAD-YOLOv8 reduces part of the background-related confusion. For instance, the proportion of spacer misclassified as background decreases from 0.18 to 0.14, and the proportion of glass insulator tower shackle misclassified as background decreases from 0.47 to 0.38. This suggests that the proposed local–global feature fusion design and task-aware detection head help the model better perceive small targets under complex UAV inspection backgrounds.
Overall, the confusion matrix comparison demonstrates that DSCMamba-TAD-YOLOv8 provides more balanced and stable class-level recognition on the InsPLAD-det dataset, further supporting the effectiveness of the proposed model.
4.7. Visualization of Detection Results
To more intuitively analyze the detection performance of DSCMamba-TAD-YOLOv8 for insulators and defect targets in real transmission line scenarios, images from different scenes were used for testing and validation. Visual analyses were conducted on both the InsPLAD-det and TPL-SOD datasets.
The visualization results show that the improved DSCMamba-TAD-YOLOv8 can effectively reduce false detections, missed detections, and repeated detections. As shown in Figure 11, for some white ceramic insulators located at marginal positions, the original model suffers from false negatives because these targets are easily confused with the background. In the first row of images, there are two insulators, one normal and one defective. The original YOLOv8 model identifies the defective insulator as normal, even though the defect is extremely small. The second row of images also suffers from false positives for the same reason. In contrast, the final DSCMamba-TAD-YOLOv8 model can identify these targets more stably. In scenarios where insulators and defects are detected simultaneously, the final DSCMamba-TAD-YOLOv8 model achieves higher detection confidence.
Figure 11.
Visual comparison between the two methods on the TPL-SOD dataset. (a) Results of YOLOv8n. (b) Results of DSCMamba-TAD-YOLOv8.
On the InsPLAD-det dataset, as shown in Figure 12, the selected examples include typical UAV inspection scenarios with oblique viewing angles, scale variations, dense small components, and complex backgrounds. In the first and second rows, multiple stockbridge dampers are distributed along different conductors, and the target sizes vary due to perspective changes. Compared with YOLOv8n, DSCMamba-TAD-YOLOv8 detects more small damper targets and produces more complete bounding boxes, indicating that the proposed DSCMambaNet-based Neck improves the perception of small and spatially distributed objects. In the images in the third row, the background contains dense vegetation and complex tower structures, which easily interfere with the detection of fittings and shackles. The proposed model can identify more fine-grained components around the tower, such as yoke suspension and polymer insulator lower shackle, showing stronger robustness under background interference. In addition, for relatively larger objects such as polymer insulators and lightning rod suspensions, DSCMamba-TAD-YOLOv8 also maintains stable localization and classification performance, as reflected by the higher confidence scores in the two images in the fourth row. These visualization results demonstrate that the proposed model can maintain relatively stable detection performance under complex backgrounds, viewpoint variations, and multi-scale target distributions, supporting its effectiveness for small-object detection in UAV-based transmission line inspection.
Figure 12.
Visual comparison between the two methods on the InsPLAD-det dataset. (a) Results of YOLOv8n. (b) Results of DSCMamba-TAD-YOLOv8.
5. Conclusions
To improve the detection performance of power line components and insulator defects in UAV inspection scenarios while maintaining a lightweight model structure, this paper proposes an improved YOLOv8-based detector named DSCMamba-TAD-YOLOv8. The proposed model addresses the challenge of balancing detection accuracy, localization quality, and model complexity in transmission line inspection. Specifically, a lightweight Neck based on DSConv and DSCMambaNet is designed to reduce computational redundancy and enhance local–global feature representation, while the embedded CBAM component further refines discriminative channel and spatial features. In addition, TADetect is introduced to improve the adaptability of the detection head to multi-scale targets and task-specific prediction requirements.
The experimental results on the InsPLAD-det dataset demonstrate that DSCMamba-TAD-YOLOv8 achieves a good balance between detection accuracy, localization quality, and model compactness. Compared with the YOLOv8n baseline, DSCMamba-TAD-YOLOv8 improves Precision from 87.77% to 91.86%, mAP@0.5 from 89.40% to 91.83%, and mAP@0.5:0.95 from 70.36% to 74.82%, corresponding to improvements of 4.09, 2.43, and 4.46 percentage points, respectively. At the same time, Recall is maintained at a comparable level and slightly increases from 87.04% to 88.02%. Meanwhile, the number of parameters is reduced from 3.209 M to 2.702 M, and the GFLOPs are reduced from 8.2 to 7.5, corresponding to reductions of approximately 15.80% and 8.54%, respectively. These results show that the proposed model improves detection accuracy and localization quality while maintaining a compact parameter and GFLOP profile. However, the proposed model does not achieve higher runtime speed than YOLOv8n. The FPS decreases from 277.8 to 163.9 on the tested NVIDIA Tesla T4 GPU because the Mamba-based contextual modeling, CBAM refinement, and task-aware multi-branch gating introduce additional runtime overhead. Therefore, the current study does not claim fully validated real-time edge deployment performance. Instead, the results support the structural compactness of the proposed model in terms of Params and GFLOPs. Future work will further evaluate batch-one latency, peak memory usage, serialized model size, power consumption, TensorRT-optimized inference, and embedded-platform performance on representative UAV or edge-computing devices.
The effectiveness of DSCMamba-TAD-YOLOv8 is further verified on the revised TPL-SOD dataset for two-class insulator detection. On the held-out test subset of TPL-SOD, DSCMamba-TAD-YOLOv8 improves Precision from 86.20% to 88.16%, mAP@0.5 from 87.09% to 88.81%, and mAP@0.5:0.95 from 68.44% to 70.13% compared with YOLOv8n, while Recall remains stable and slightly increases from 91.75% to 92.33%. The AP@0.5 values of normal and defective insulators are also improved from 88.67% and 85.51% to 90.58% and 87.04%, respectively. In addition, source-wise evaluation shows that the proposed model consistently improves performance on both public-source images and self-collected UAV images. These results indicate that DSCMamba-TAD-YOLOv8 can improve the detection performance and localization stability of normal and defective insulator targets under the two-class object detection setting.
Overall, DSCMamba-TAD-YOLOv8 achieves higher detection accuracy, better localization quality, lower parameter count, and lower computational complexity than the YOLOv8n baseline, while maintaining comparable recall performance. The comparison experiments, ablation studies, statistical reliability analysis, confusion matrix analysis, and visualization results jointly verify the effectiveness and complementarity of DSConv, DSCMambaNet, CBAM, and TADetect for transmission line inspection.
Although the proposed method achieves promising results, it still has several limitations. First, the inference speed of the final model is lower than that of the original YOLOv8n because of the additional dynamic modulation and multi-branch feature modeling operations. Second, the current experiments are mainly conducted on InsPLAD-det and TPL-SOD, and the generalization ability of the model under more diverse real-world inspection conditions still requires further verification. Third, although the model has a compact parameter scale and low GFLOPs, its actual deployment performance on edge computing platforms has not yet been fully evaluated. Fourth, although TADetect is conceptually compared with closely related detection-head designs such as DyHead and TOOD, these methods were not reimplemented and evaluated under identical YOLOv8n architecture and training settings. Therefore, direct empirical comparisons with these related detection-head designs under unified experimental settings remain to be investigated in future work. Fifth, object-size-specific quantitative evaluation has not been conducted, and the performance of the proposed model across different target scales requires further investigation. Future work will include more power equipment categories and defect types to improve dataset diversity, conduct object-size-specific evaluations across different target scales, and perform direct comparisons with related detection-head designs under unified architectural and training settings. Moreover, batch-one latency, peak memory usage, serialized model size, power or energy consumption, TensorRT acceleration, quantization, pruning, and representative UAV or embedded-platform deployment will be investigated to further evaluate and improve practical inference efficiency.
Supplementary Materials
The following supporting information can be downloaded at: https://www.mdpi.com/article/10.3390/computers15080550/s1, Supplementary Materials for the TPL-SOD dataset, including a representative subset, annotation examples, class distribution, train/test split statistics, label definitions, YOLO-format configuration, and annotation guidelines.
Author Contributions
Conceptualization, Z.L. and C.D.; methodology, Z.L.; software, Z.L.; validation, Z.L.; formal analysis, Z.L.; investigation, Z.L.; resources, Z.L. and C.D.; data curation, Z.L.; writing—original draft preparation, Z.L.; writing—review and editing, Z.L. and C.D.; visualization, Z.L.; supervision, C.D.; project administration, C.D. All authors have read and agreed to the published version of the manuscript.
Funding
This research received no external funding.
Data Availability Statement
The InsPLAD-det dataset analyzed in this study is publicly available from the official InsPLAD repository: https://github.com/andreluizbvs/InsPLAD (accessed on 16 August 2026). The self-built TPL-SOD dataset is not publicly available due to privacy, confidentiality, and security restrictions related to real power infrastructure. To improve reproducibility, the fixed train/validation/test split lists, dataset source information, annotation protocol, screening criteria, representative anonymized samples, model configuration files, training scripts, and evaluation scripts are provided as Supplementary Materials. Access requests for the non-public self-collected UAV images for academic and non-commercial research purposes may be considered by the corresponding author on a case-by-case basis.
Conflicts of Interest
The authors declare no conflicts of interest.
Abbreviations
The following abbreviations are used in this manuscript:
| AP | Average Precision |
| CBAM | Convolutional Block Attention Module |
| DSC | Depthwise Separable Convolution |
| DSConv | Depthwise Separable Convolution |
| FPS | Frames Per Second |
| GFLOPs | Giga Floating-Point Operations |
| IoU | Intersection over Union |
| mAP | Mean Average Precision |
| SSM | State Space Model |
| TADetect | Task-Aware Dynamic Detection Head |
| UAV | Unmanned Aerial Vehicle |
| YOLO | You Only Look Once |
References
- China Electricity Council. CEIC Data. China Length of Electricity Transmission Circuit: 220 kV and Above. 2024. Available online: https://www.ceicdata.com/en/china/length-of-electricity-transmission-circuit/cn-length-of-electricity-transmission-circuit-220kv-and-above (accessed on 16 August 2026).
- Yang, L.; Fan, J.; Liu, Y.; Li, E.; Peng, J.; Liang, Z. A review on state-of-the-art power line inspection techniques. IEEE Trans. Instrum. Meas. 2020, 69, 9350–9365. [Google Scholar] [CrossRef] [Scilit]
- Zhao, Z.; Liu, N.; Wang, L. Localization of multiple insulators by orientation angle detection and binary shape prior knowledge. IEEE Trans. Dielectr. Electr. Insul. 2015, 22, 3421–3428. [Google Scholar] [CrossRef] [Scilit]
- Yin, J.; Lu, Y.; Gong, Z.; Jiang, Y.; Yao, J. Edge detection of high-voltage porcelain insulators in infrared image using dual parity morphological gradients. IEEE Access 2019, 7, 32728–32734. [Google Scholar] [CrossRef] [Scilit]
- Jiao, S.; Wang, H. The research of transmission line foreign body detection based on motion compensation. In Proceedings of the 2016 First International Conference on Multimedia and Image Processing (ICMIP), Bandar Seri Begawan, Brunei, 1–3 June 2016; IEEE: New York, NY, USA, 2016; pp. 10–14. [Google Scholar]
- Akbarizadeh, G. A new statistical-based kurtosis wavelet energy feature for texture recognition of SAR images. IEEE Trans. Geosci. Remote Sens. 2012, 50, 4358–4368. [Google Scholar] [CrossRef] [Scilit]
- Akbarizadeh, G.; Tirandaz, Z. Segmentation parameter estimation algorithm based on curvelet transform coefficients energy for feature extraction and texture description of SAR images. In Proceedings of the 2015 7th Conference on Information and Knowledge Technology (IKT), Urmia, Iran, 26–28 May 2015; IEEE: New York, NY, USA, 2015; pp. 1–4. [Google Scholar]
- Liu, Y.; Liu, D.; Huang, X.; Li, C. Insulator defect detection with deep learning: A survey. IET Gener. Transm. Distrib. 2023, 17, 3541–3558. [Google Scholar] [CrossRef] [Scilit]
- Li, X.; Su, H.; Liu, G. Insulator defect recognition based on global detection and local segmentation. IEEE Access 2020, 8, 59934–59946. [Google Scholar] [CrossRef] [Scilit]
- Wang, B.; Wu, R.; Zheng, Z.; Zhang, W.; Guo, J. Study on the method of transmission line foreign body detection based on deep learning. In Proceedings of the 2017 IEEE Conference on Energy Internet and Energy System Integration (EI2), Beijing, China, 26–28 November 2017; IEEE: New York, NY, USA, 2017; pp. 1–5. [Google Scholar]
- Xie, J.; Long, Z.; Song, Q.; Liu, Z.; Du, Y.; Wang, T. Visible-light insulator defect detection based on improved YOLOv3. In Proceedings of the 2023 3rd International Conference on Electrical Engineering and Mechatronics Technology (ICEEMT), Nanjing, China, 21–23 July 2023; IEEE: New York, NY, USA, 2023; pp. 287–292. [Google Scholar]
- He, Z.; Yang, W.; Liu, Y.; Zheng, A.; Liu, J.; Lou, T.; Zhang, J. Insulator defect detection based on YOLOv8s-SwinT. Information 2024, 15, 206. [Google Scholar] [CrossRef] [Scilit]
- Zhang, L.; Li, B.; Cui, Y.; Lai, Y.; Gao, J. Research on improved YOLOv8 algorithm for insulator defect detection. J. Real-Time Image Process. 2024, 21, 22. [Google Scholar] [CrossRef] [Scilit]
- Gu, A.; Dao, T. Mamba: Linear-time sequence modeling with selective state spaces. arXiv 2023, arXiv:2312.00752. [Google Scholar]
- Jocher, G.; Chaurasia, A.; Qiu, J. Ultralytics YOLOv8. 2023. Available online: https://github.com/ultralytics/ultralytics (accessed on 16 August 2026).
- MMYOLO Contributors. Algorithm Principles and Implementation with YOLOv8. 2023. Available online: https://mmyolo.readthedocs.io/en/latest/recommended_topics/algorithm_descriptions/yolov8_description.html (accessed on 16 August 2026).
- Lin, T.-Y.; Dollár, P.; Girshick, R.; He, K.; Hariharan, B.; Belongie, S. Feature pyramid networks for object detection. In Proceedings of the 2017 IEEE Conference on Computer Vision and Pattern Recognition (CVPR), Honolulu, HI, USA, 21–26 July 2017; IEEE: New York, NY, USA, 2017; pp. 2117–2125. [Google Scholar]
- Liu, S.; Qi, L.; Qin, H.; Shi, J.; Jia, J. Path aggregation network for instance segmentation. In Proceedings of the 2018 IEEE/CVF Conference on Computer Vision and Pattern Recognition, Salt Lake City, UT, USA, 18–23 June 2018; IEEE: New York, NY, USA, 2018; pp. 8759–8768. [Google Scholar]
- Jocher, G. Ultralytics YOLOv5. 2020. Available online: https://github.com/ultralytics/yolov5 (accessed on 16 August 2026).
- He, K.; Zhang, X.; Ren, S.; Sun, J. Deep residual learning for image recognition. In Proceedings of the 2016 IEEE Conference on Computer Vision and Pattern Recognition (CVPR), Las Vegas, NV, USA, 27–30 June 2016; IEEE: New York, NY, USA, 2016; pp. 770–778. [Google Scholar]
- Huang, G.; Liu, Z.; van der Maaten, L.; Weinberger, K.Q. Densely connected convolutional networks. In Proceedings of the 2017 IEEE Conference on Computer Vision and Pattern Recognition (CVPR), Honolulu, HI, USA, 21–26 July 2017; IEEE: New York, NY, USA, 2017; pp. 4700–4708. [Google Scholar]
- Howard, A.G.; Zhu, M.; Chen, B.; Kalenichenko, D.; Wang, W.; Wey, T.; Andreetto, M.; Adam, H. MobileNets: Efficient convolutional neural networks for mobile vision applications. arXiv 2017, arXiv:1704.04861. [Google Scholar]
- Tan, M.; Le, Q. EfficientNet: Rethinking model scaling for convolutional neural networks. In Proceedings of the 36th International Conference on Machine Learning (ICML 2019), Long Beach, CA, USA, 9–15 June 2019; PmLR: Cambridge, MA, USA, 2019; pp. 6105–6114. [Google Scholar]
- Kalman, R.E. A new approach to linear filtering and prediction problems. J. Basic Eng. 1960, 82, 35–45. [Google Scholar] [CrossRef] [Scilit]
- Woo, S.; Park, J.; Lee, J.-Y.; Kweon, I.S. CBAM: Convolutional block attention module. In Computer Vision—ECCV 2018, Proceedings of the 15th European Conference, Munich, Germany, 8–14 September 2018; Springer: Berlin/Heidelberg, Germany, 2018; pp. 3–19. [Google Scholar]
- Wang, Z.; Li, C.; Xu, H.; Zhu, X.; Li, H. Mamba YOLO: A simple baseline for object detection with state space model. Proc. AAAI Conf. Artif. Intell. 2025, 39, 8205–8213. [Google Scholar] [CrossRef] [Scilit]
- Chen, L.; Wang, H.; Xu, M.; Li, Z.; Fan, Z. AKCMamba-YOLO: Selective state space models for real-time object detection. In Proceedings of the IEEE/CVF Conference on Computer Vision and Pattern Recognition (CVPR), Denver, CO, USA, 3–7 June 2026; IEEE: New York, NY, USA, 2026; pp. 4438–4447. [Google Scholar]
- Vieira E Silva, A.L.B.; Felix, H.C.; Simões, F.P.M.; Teichrieb, V.; dos Santos, M.M.; Santiago, H.; Sgotti, V.; Lott Neto, H. InsPLAD: A dataset and benchmark for power line asset inspection in UAV images. Int. J. Remote Sens. 2023, 44, 7294–7320. [Google Scholar] [CrossRef] [Scilit]
- Wu, Y.; Chen, Y.; Yuan, L.; Liu, Z.; Wang, L.; Li, H.; Fu, Y. Rethinking classification and localization for object detection. In Proceedings of the 2020 IEEE/CVF Conference Computer Vision and Pattern Recognition (CVPR), Seattle, WA, USA, 13–19 June 2020; IEEE: New York, NY, USA, 2020; pp. 10186–10195. [Google Scholar]
- Feng, C.; Zhong, Y.; Gao, Y.; Scott, M.R.; Huang, W. TOOD: Task-aligned one-stage object detection. In Proceedings of the 2021 IEEE/CVF International Conference Computer Vision (ICCV), Montreal, QC, Canada, 10–17 October 2021; IEEE: New York, NY, USA, 2021; pp. 3490–3499. [Google Scholar]
- Li, X.; Wang, W.; Wu, L.; Chen, S.; Hu, X.; Li, J.; Tang, J.; Yang, J. Generalized focal loss: Learning qualified and distributed bounding boxes for dense object detection. Adv. Neural Inf. Process. Syst. 2020, 33, 21002–21012. [Google Scholar]
- Dai, X.; Chen, Y.; Xiao, B.; Chen, D.; Liu, M.; Yuan, L.; Zhang, L. Dynamic head: Unifying object detection heads with attentions. In Proceedings of the 2021 IEEE/CVF International Conference Computer Vision (ICCV), Montreal, QC, Canada, 10–17 October 2021; IEEE: New York, NY, USA, 2021; pp. 7373–7382. [Google Scholar]
- Trash Detection. Insulator-Defect Dataset. Roboflow Universe, Roboflow. 2025. Available online: https://universe.roboflow.com/trash-detection-zqfed/insulator-defect-gcnfq (accessed on 28 July 2026).
- Wangbo. Insulators Dataset. Roboflow Universe, Roboflow. 2025. Available online: https://universe.roboflow.com/wangbo/insulators-kkhyx (accessed on 28 July 2026).
- Loshchilov, I.; Hutter, F. Decoupled weight decay regularization. In Proceedings of the 7th International Conference on Learning Representations (ICLR), New Orleans, LA, USA, 6–9 May 2019. [Google Scholar]
- Loshchilov, I.; Hutter, F. SGDR: Stochastic gradient descent with warm restarts. In Proceedings of the 5th International Conference on Learning Representations (ICLR), Toulon, France, 24–26 April 2017. [Google Scholar]
- Bochkovskiy, A.; Wang, C.-Y.; Liao, H.-Y.M. YOLOv4: Optimal speed and accuracy of object detection. arXiv 2020, arXiv:2004.10934. [Google Scholar]
- Li, C.; Li, L.; Jiang, H.; Weng, K.; Geng, Y.; Li, L.; Ke, Z.; Li, Q.; Cheng, M.; Nie, W.; et al. YOLOv6: A single-stage object detection framework for industrial applications. arXiv 2022, arXiv:2209.02976. [Google Scholar]
- Yang, Z.; Guan, Q.; Yu, Z.; Xu, X.; Long, H.; Lian, S.; Hu, H.; Tang, Y. MHAF-YOLO: Multi-branch heterogeneous auxiliary fusion YOLO for accurate object detection. arXiv 2025, arXiv:2502.04656. [Google Scholar]
- Deci, A.I. YOLO-NAS. 2023. Available online: https://github.com/Deci-AI/super-gradients/blob/master/YOLONAS.md (accessed on 16 August 2026).
- Zhao, Y.; Lv, W.; Xu, S.; Wei, J.; Wang, G.; Dang, Q.; Liu, Y.; Chen, J. DETRs beat YOLOs on real-time object detection. In Proceedings of the 2024 IEEE/CVF Conference Computer Vision and Pattern Recognition (CVPR), Seattle, WA, USA, 16–22 June 2024; IEEE: New York, NY, USA, 2024; pp. 16965–16974. [Google Scholar]
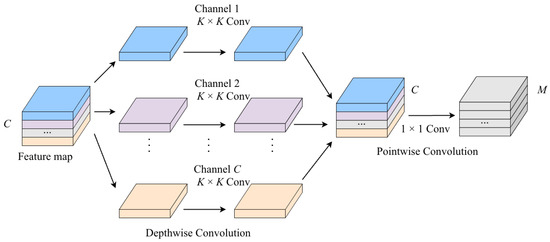
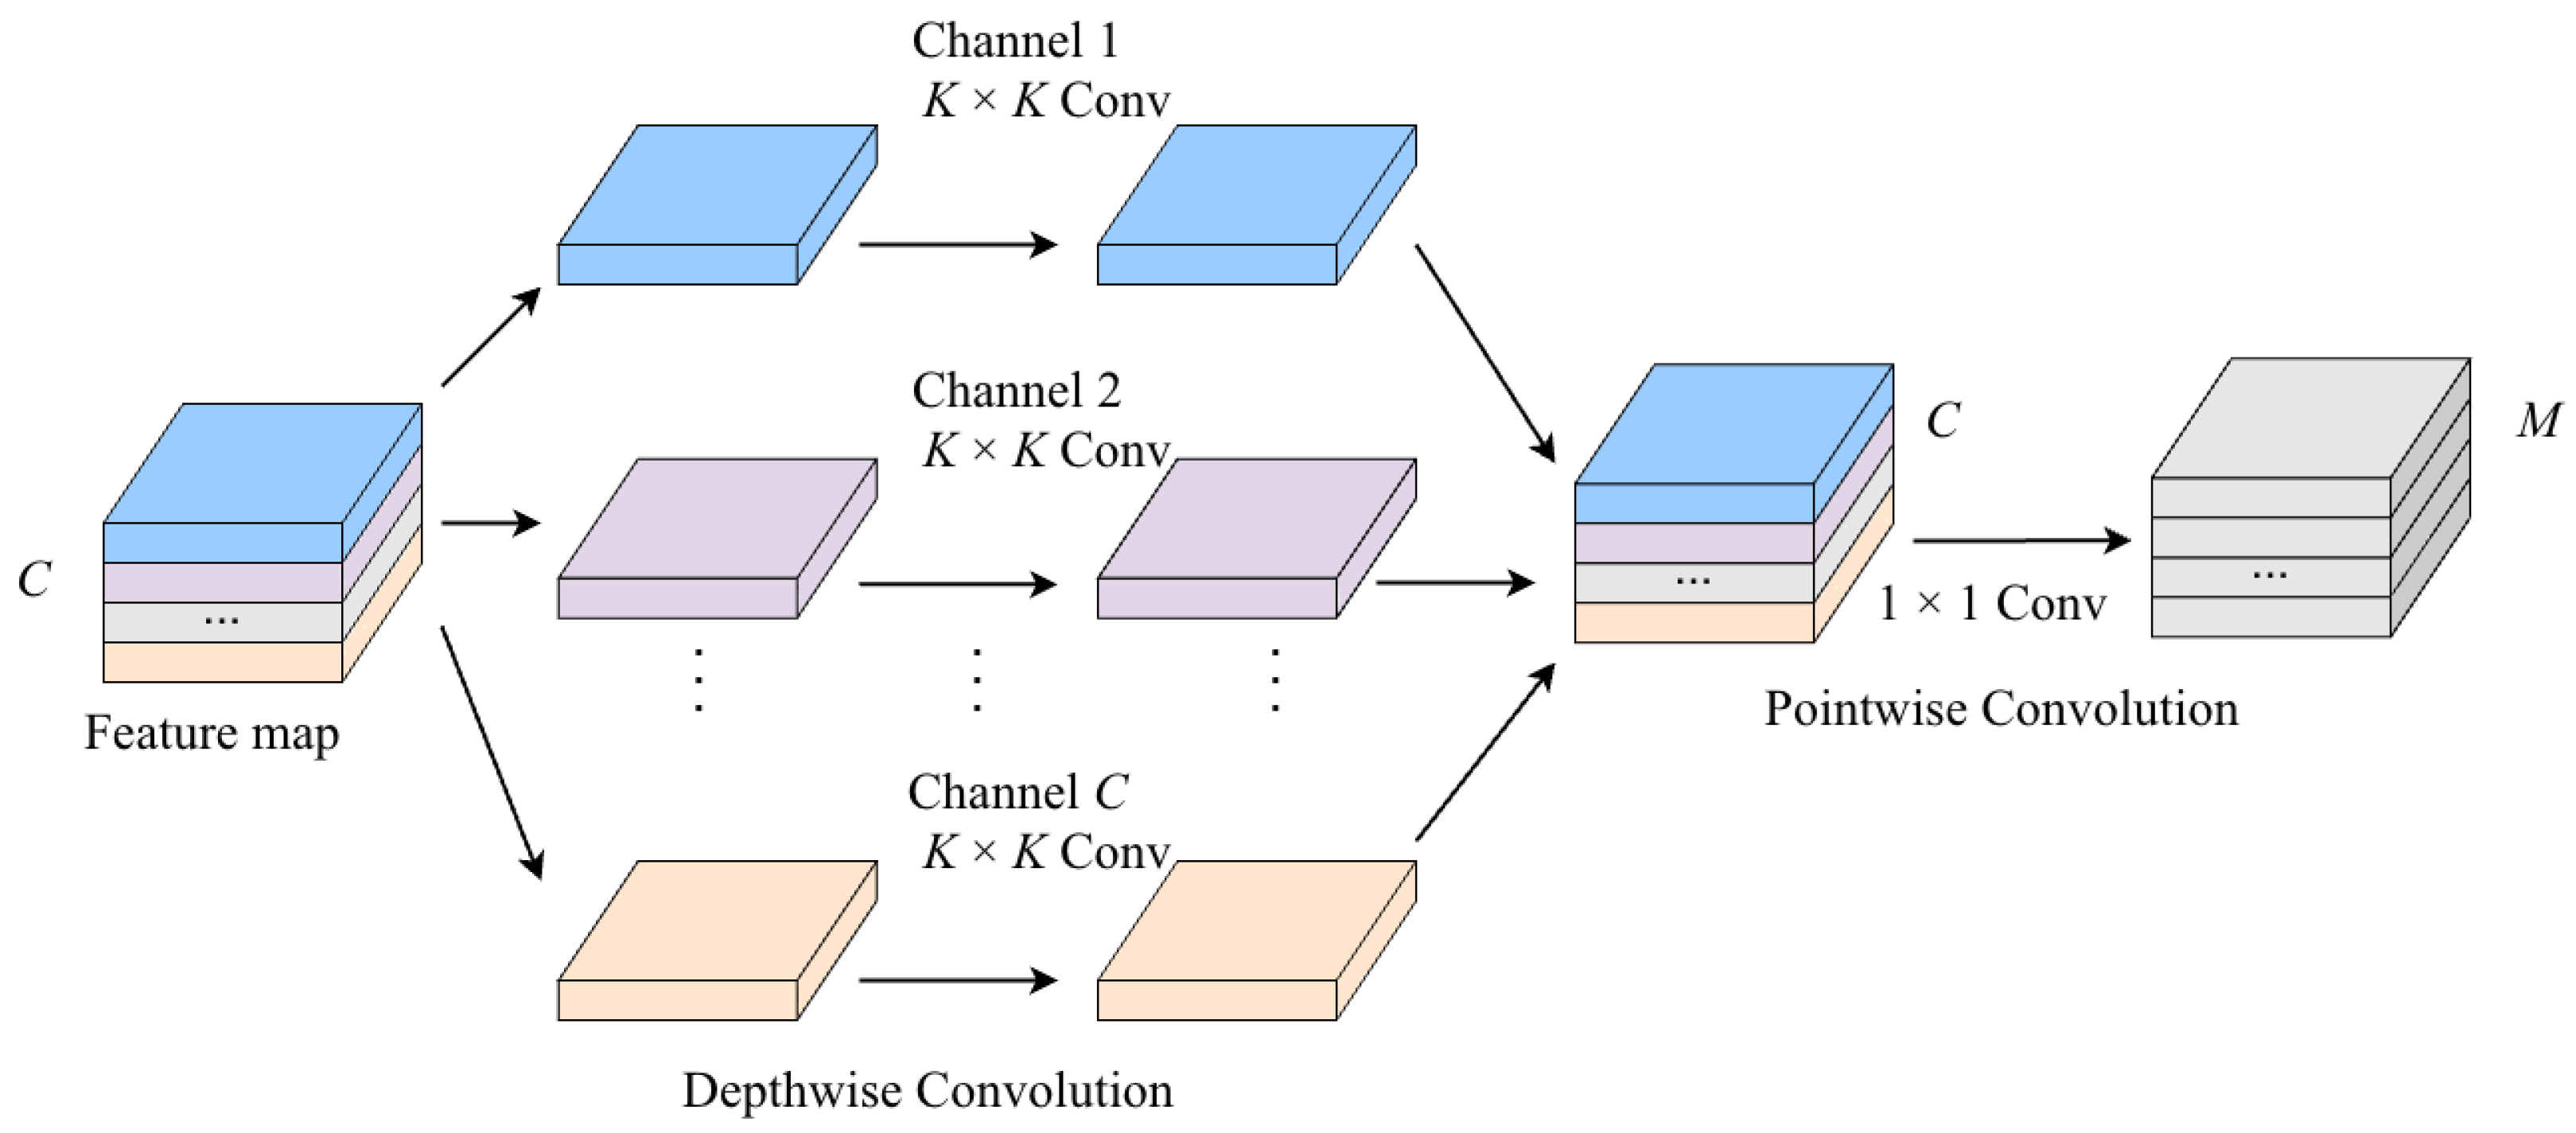
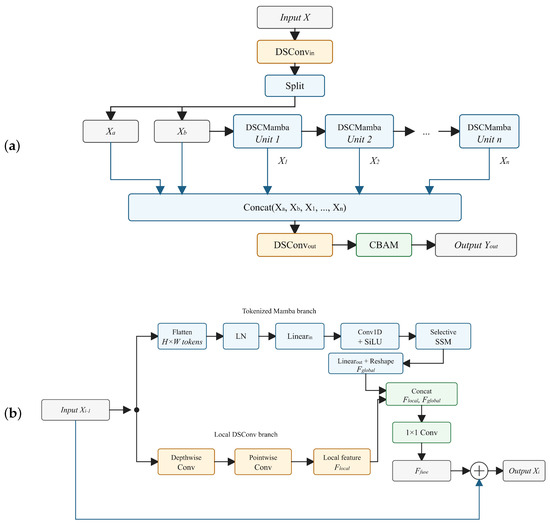
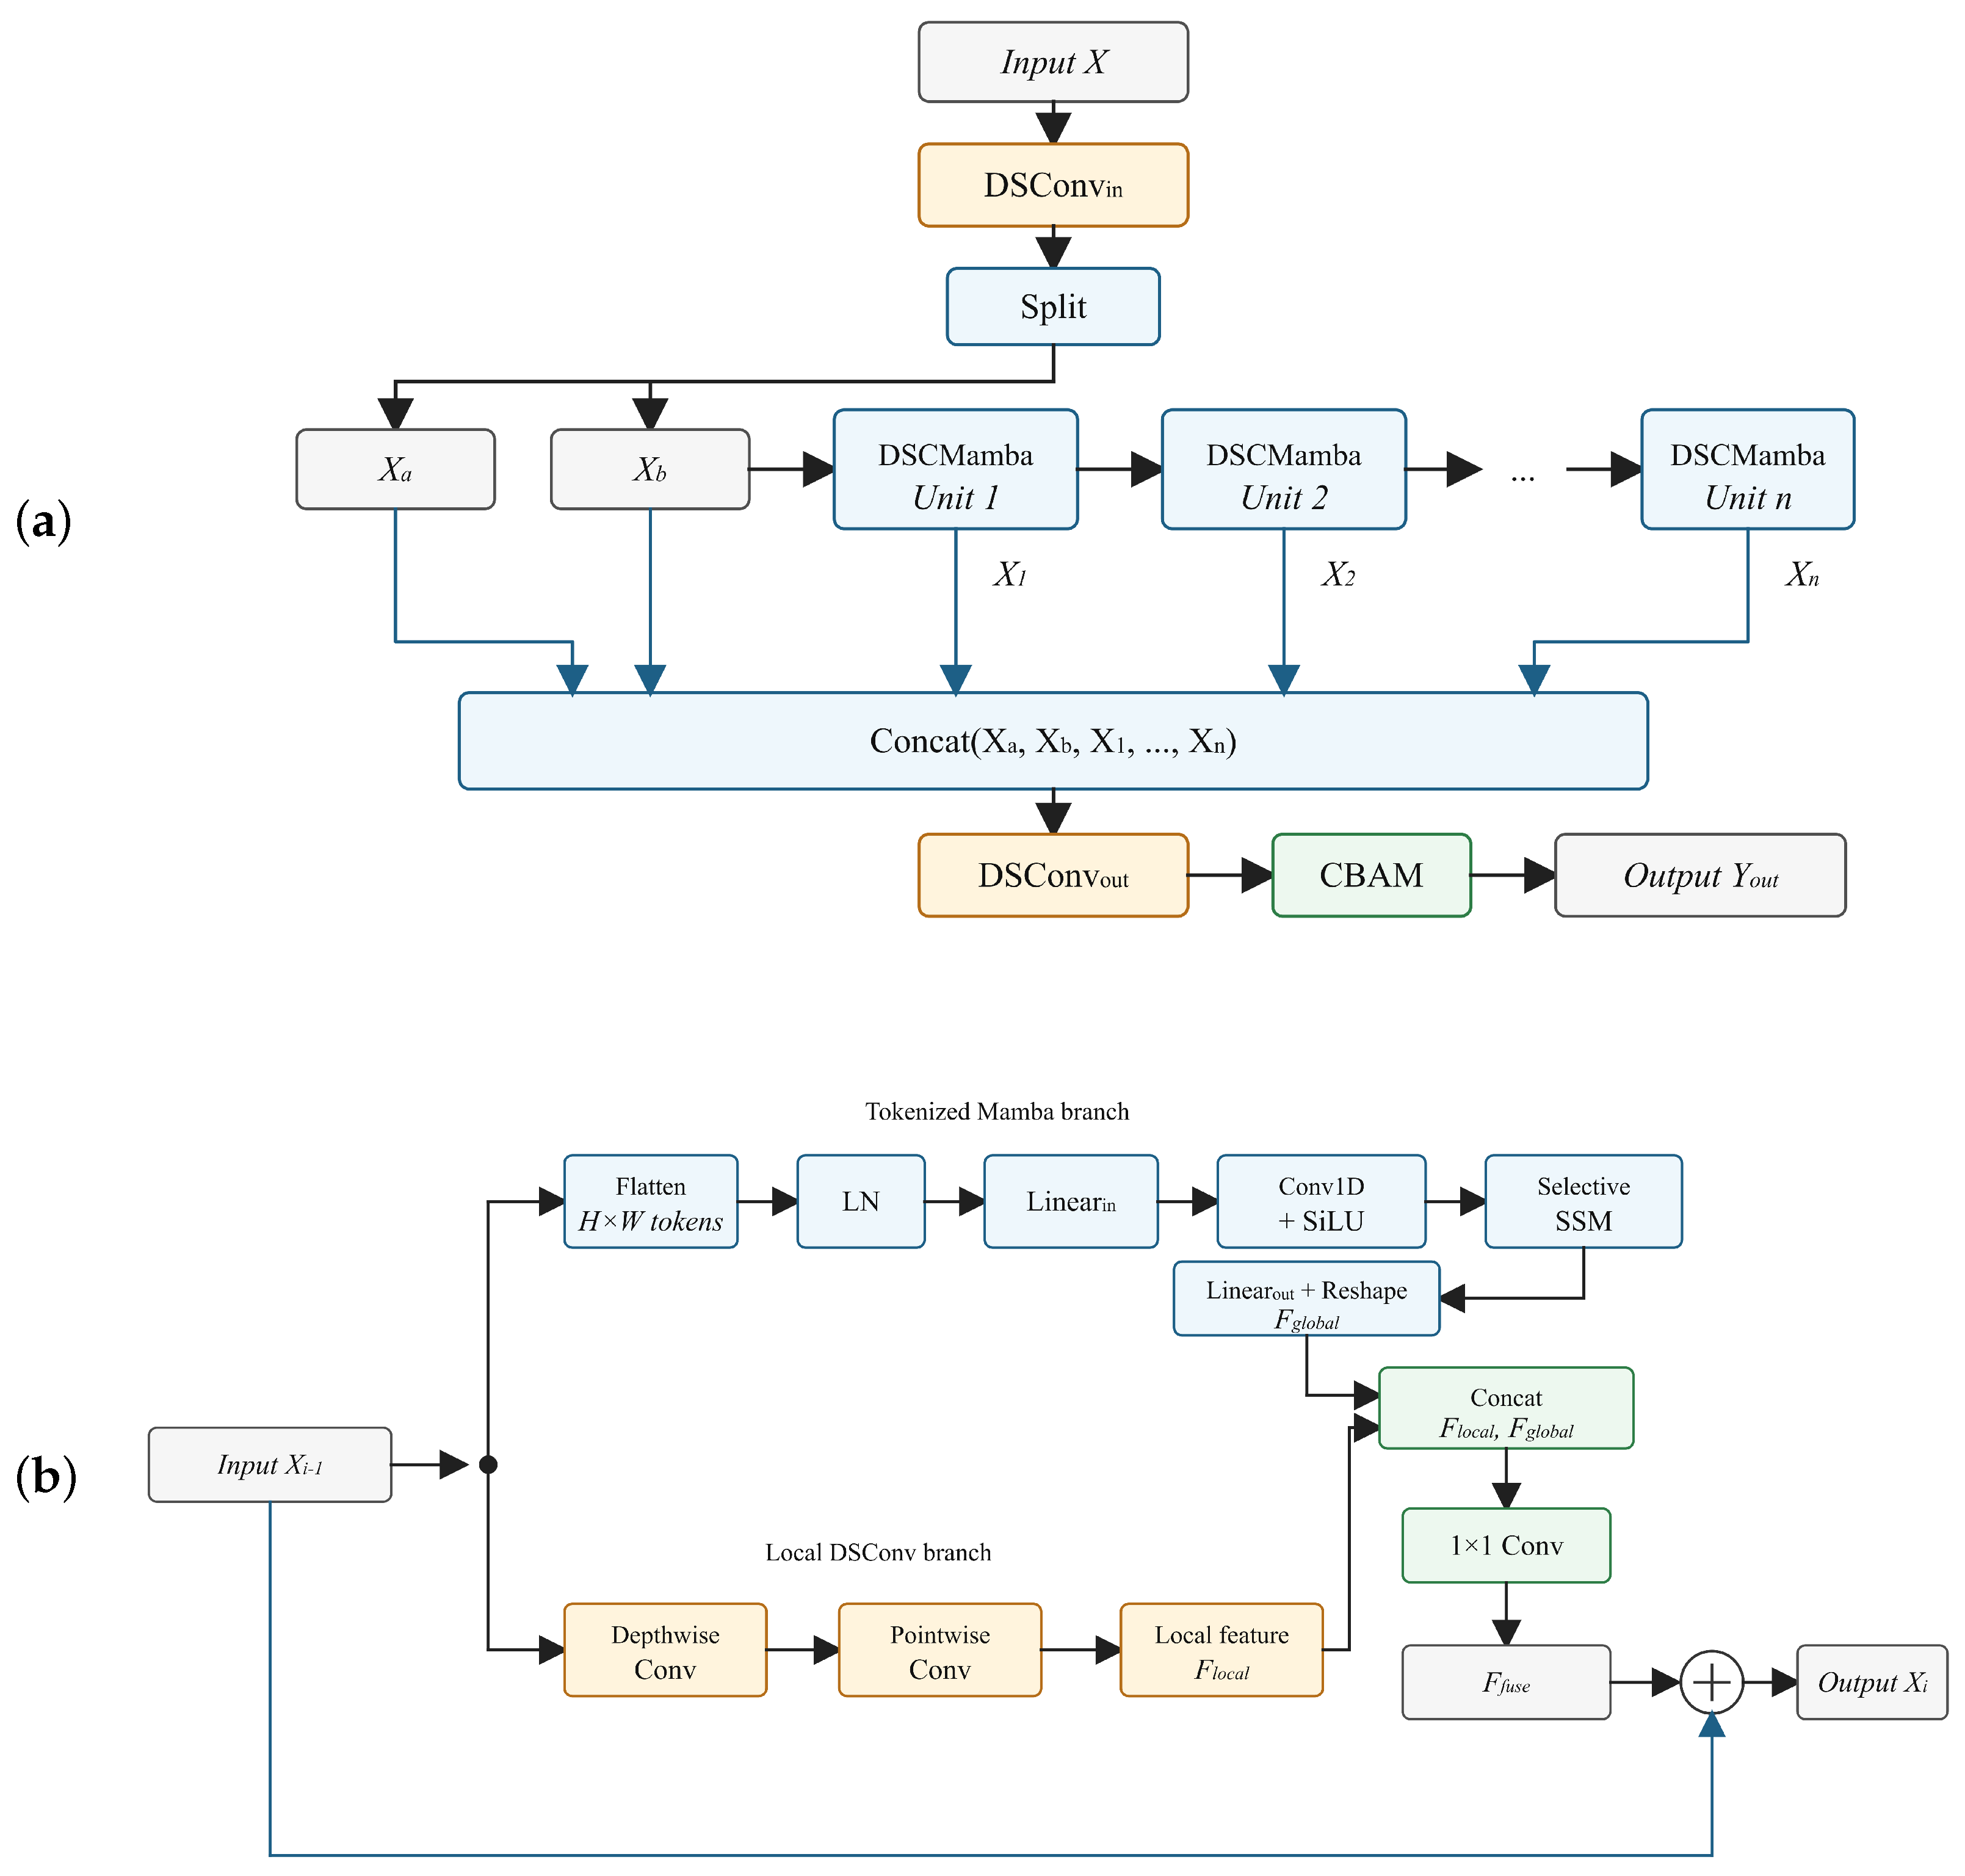
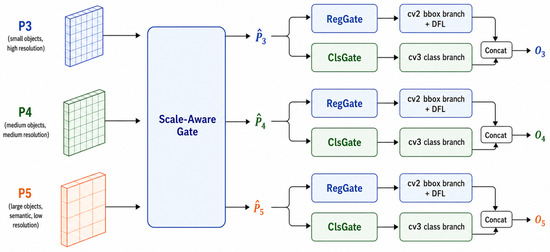
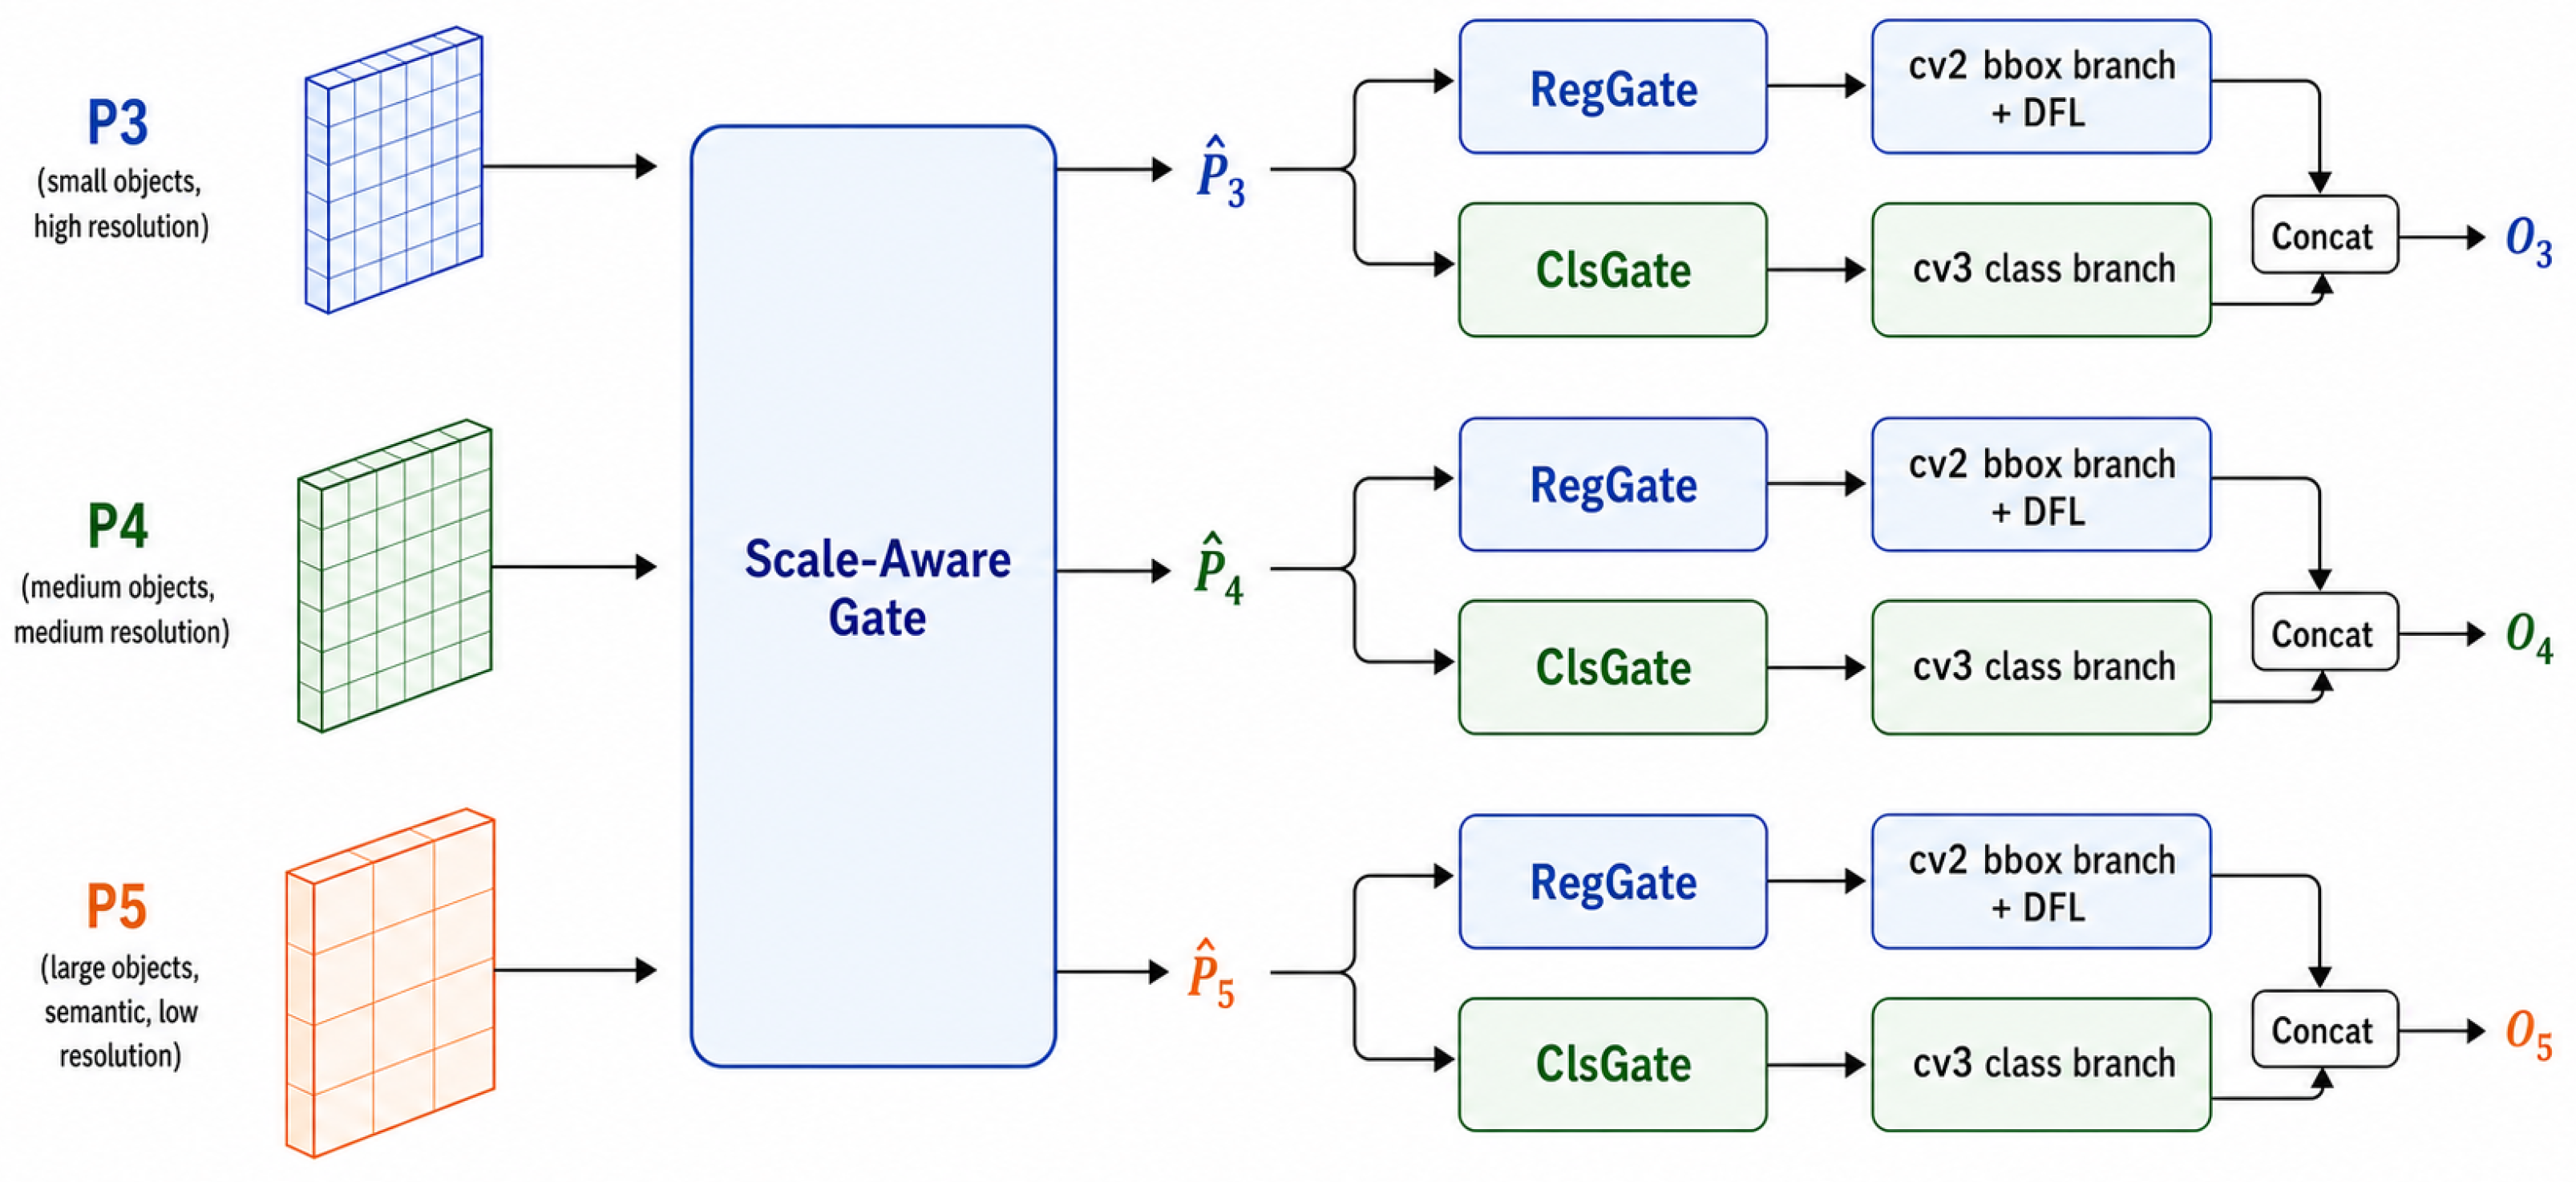
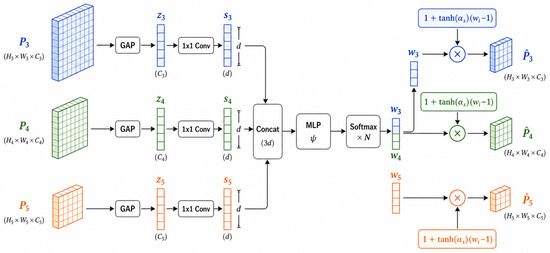
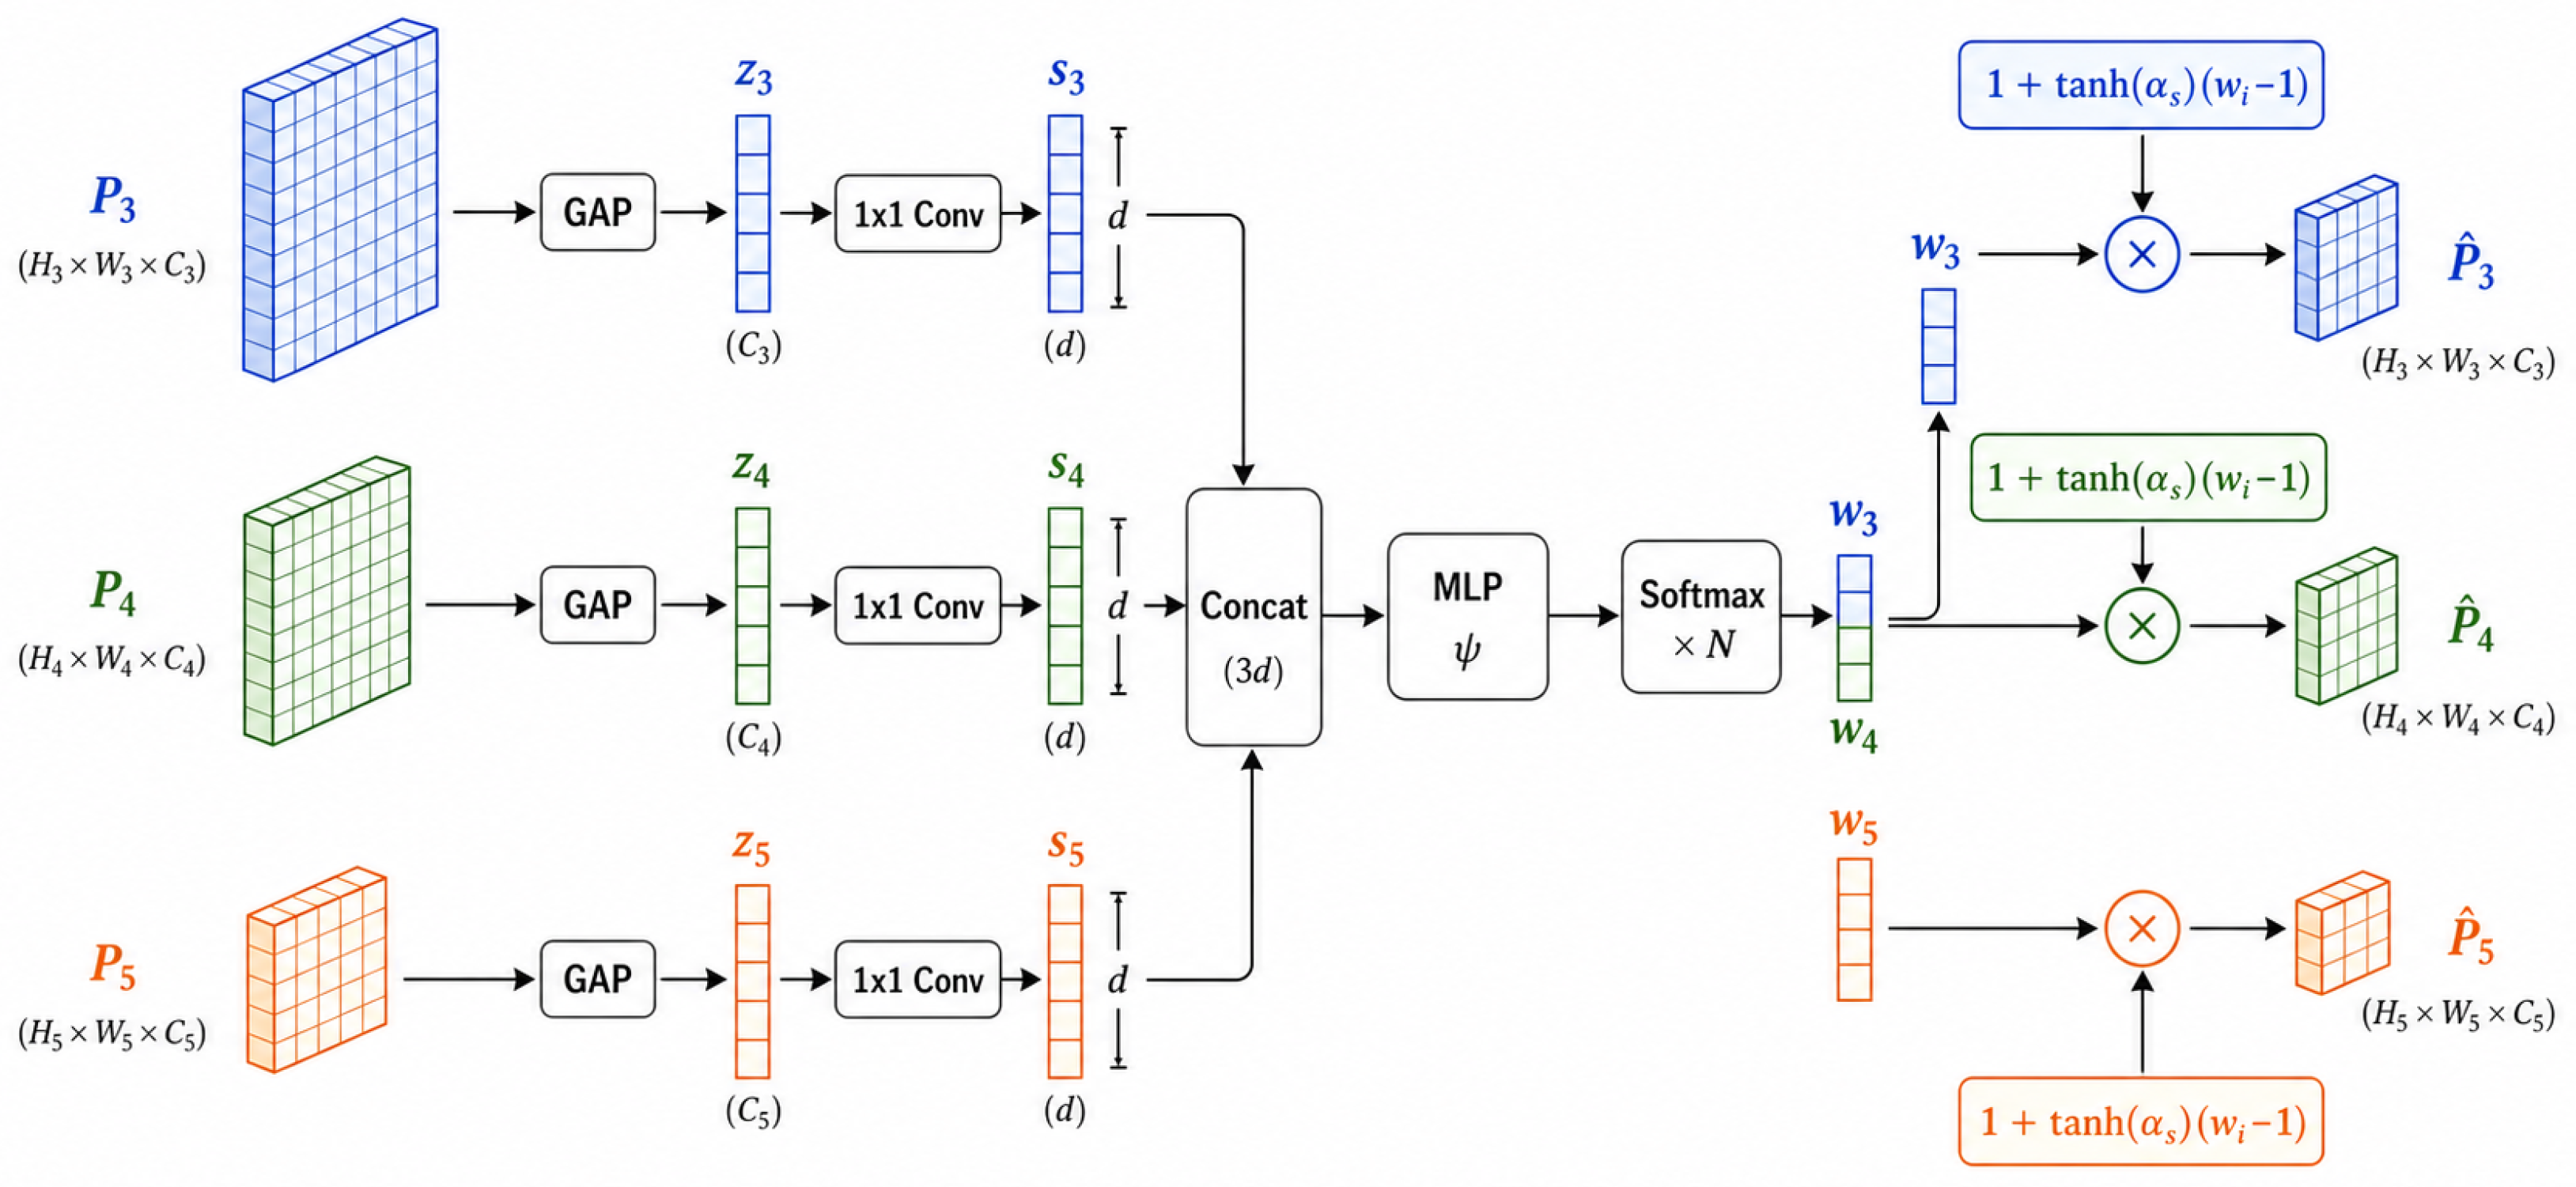
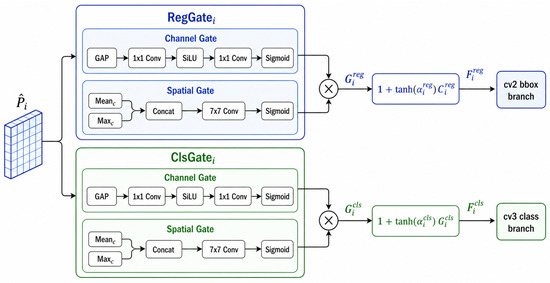
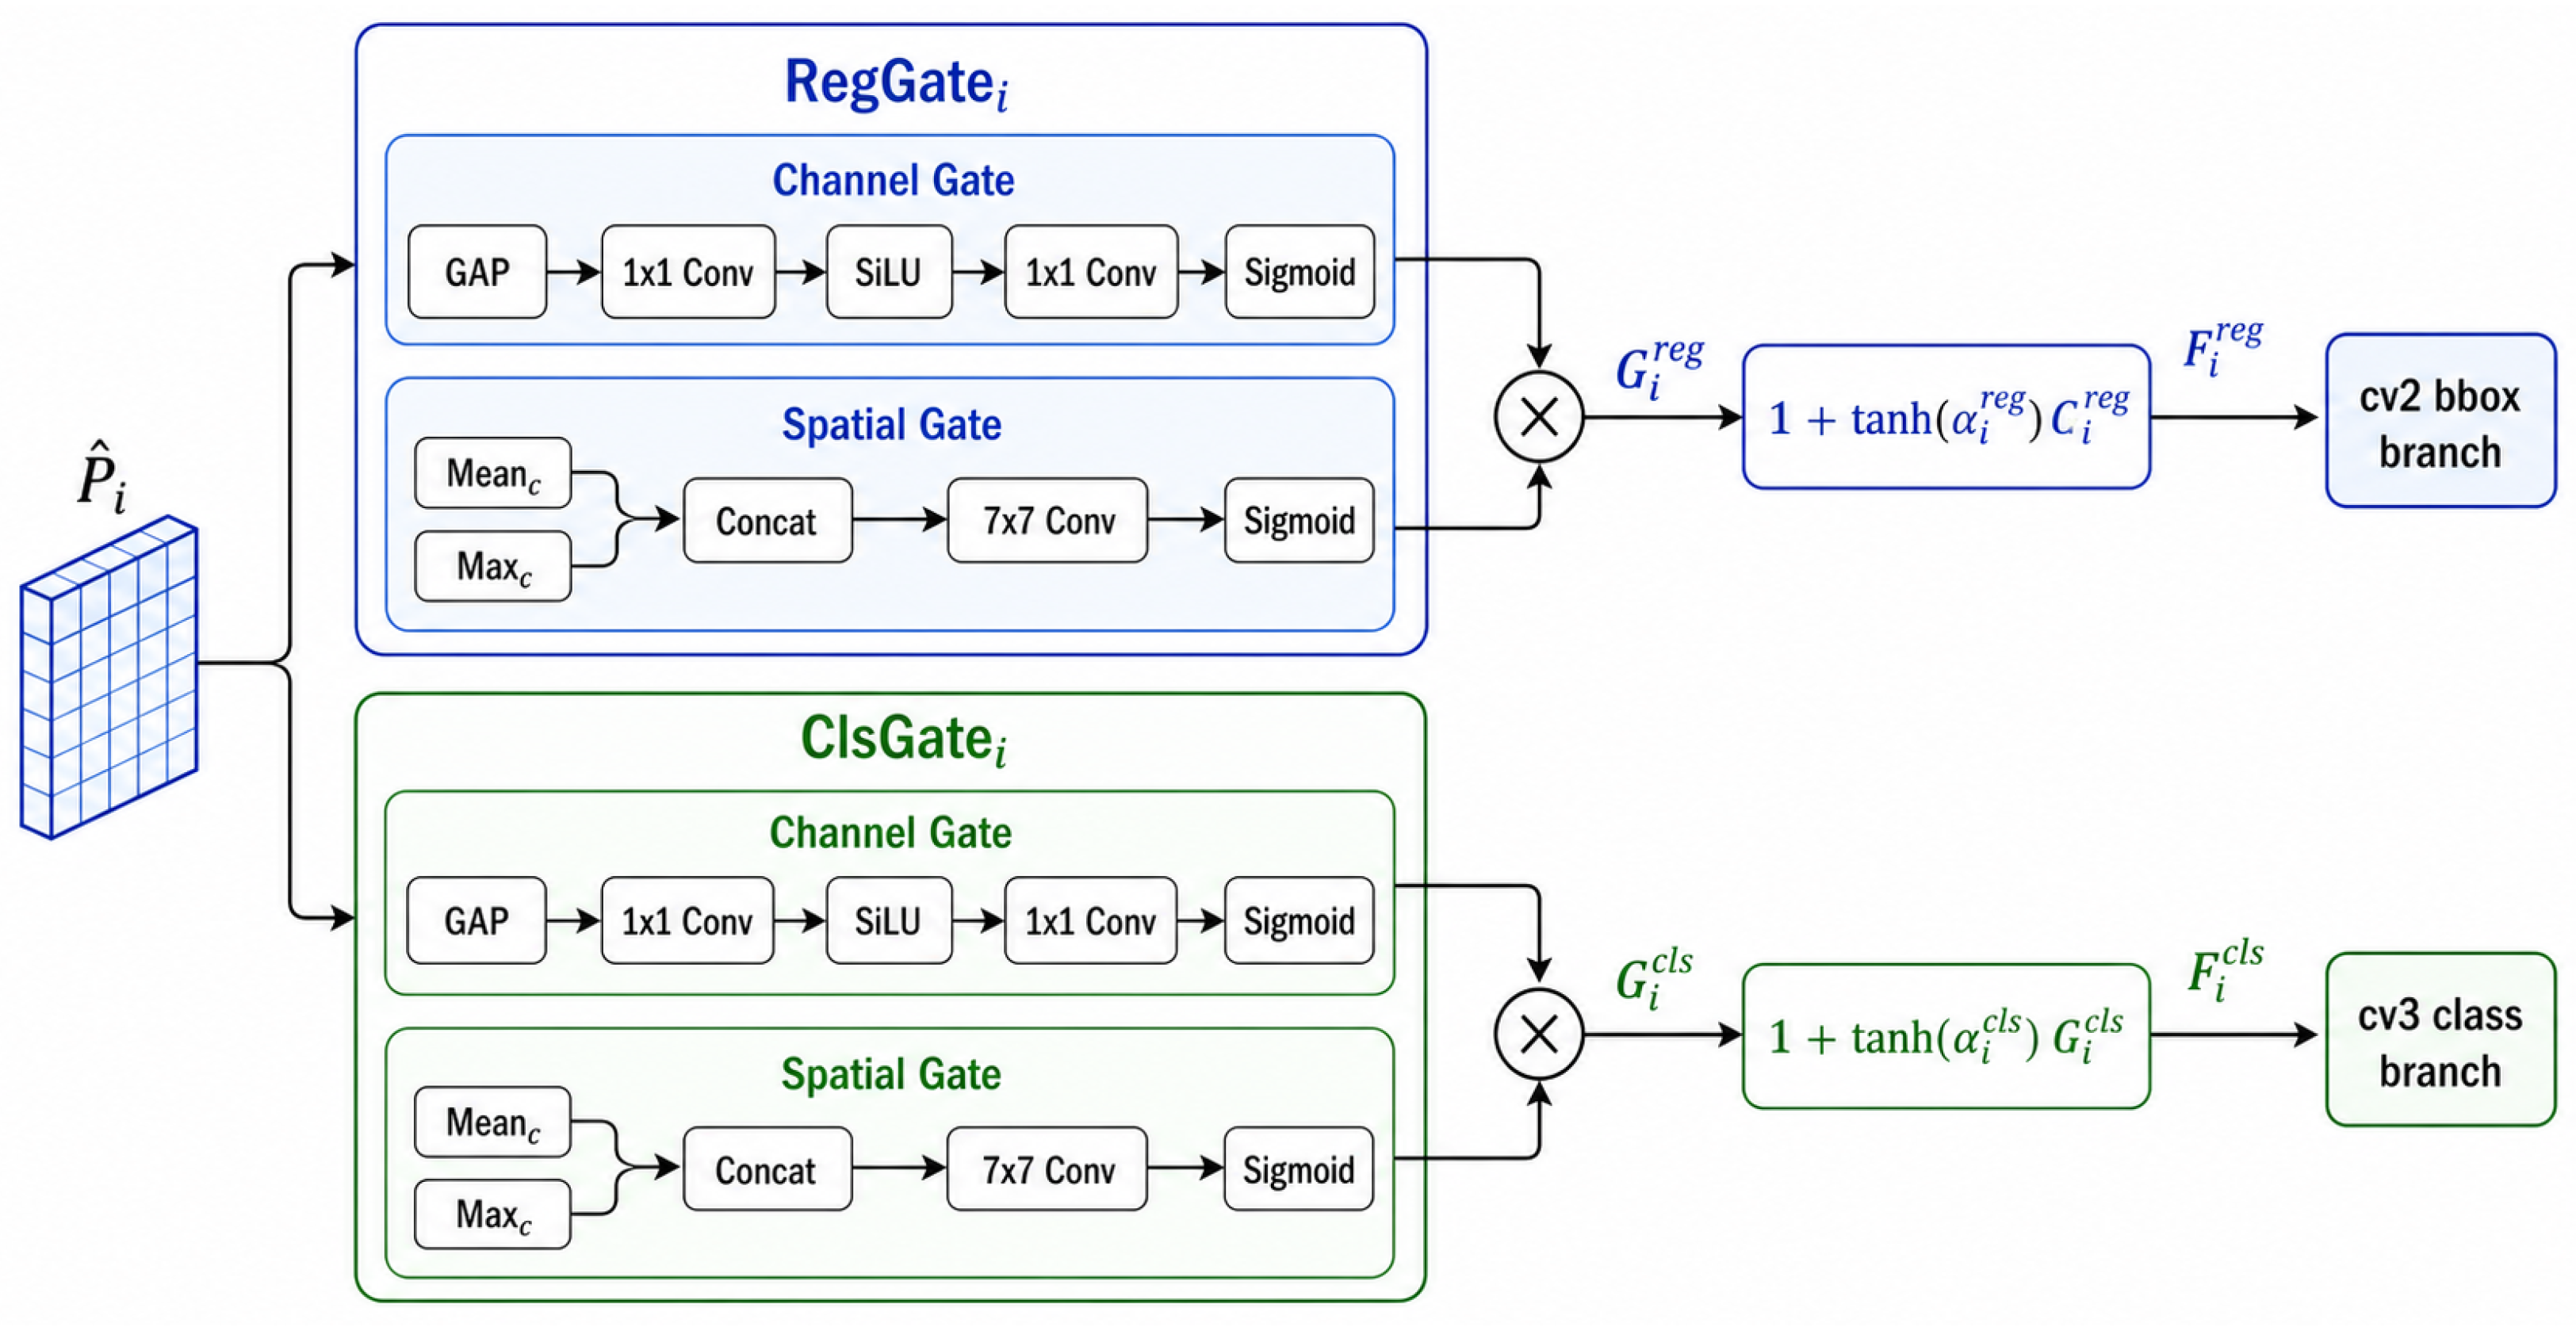
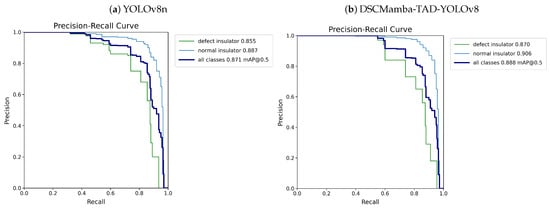
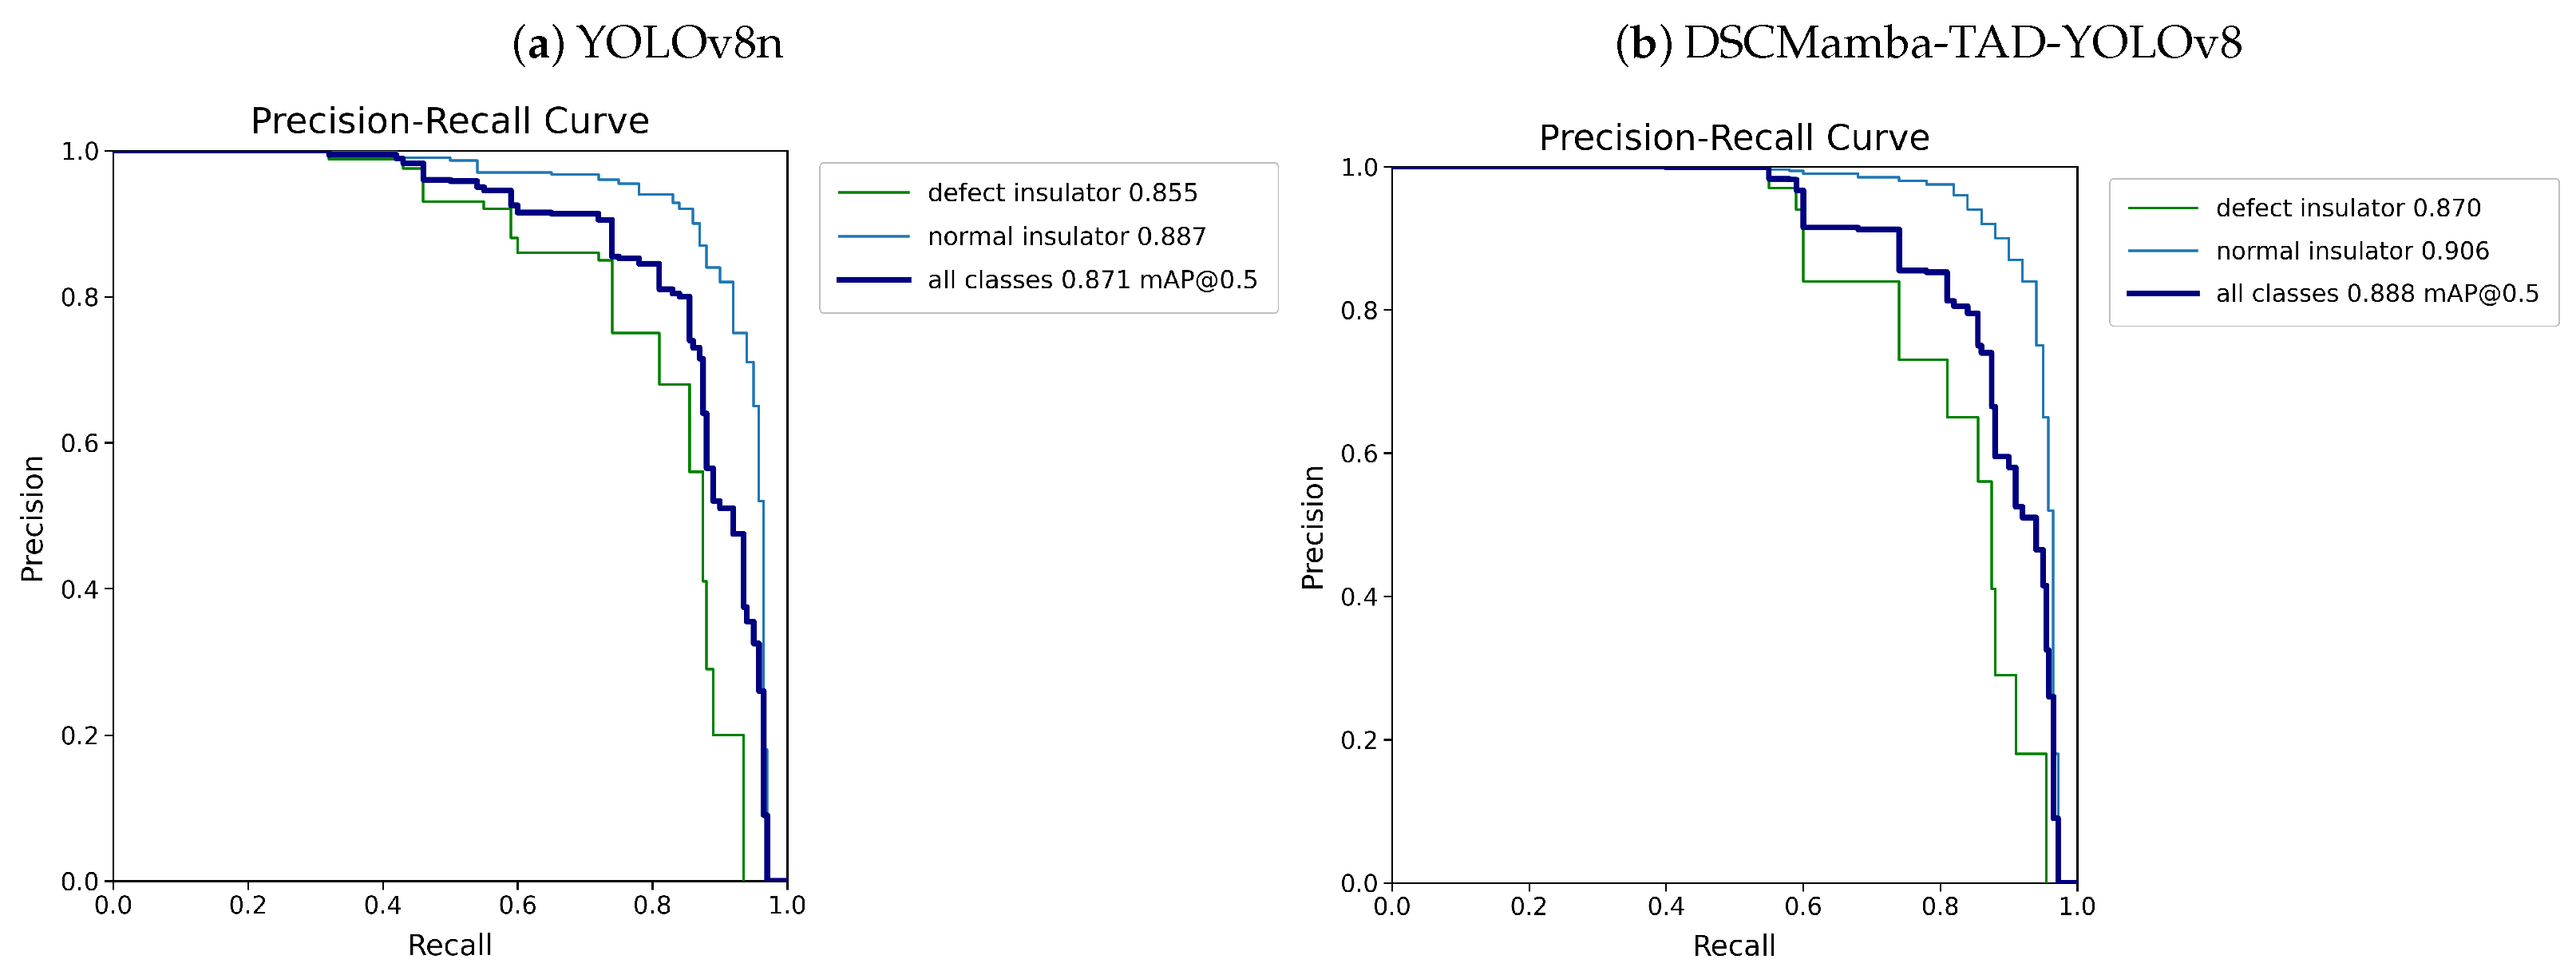
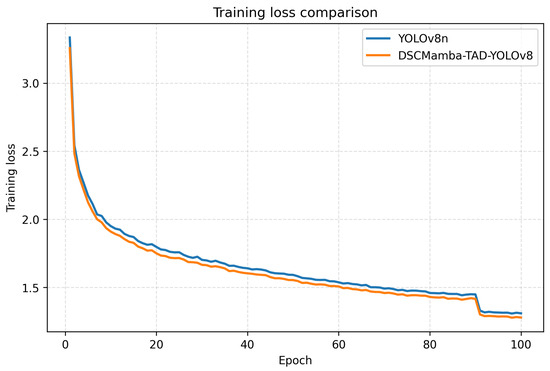
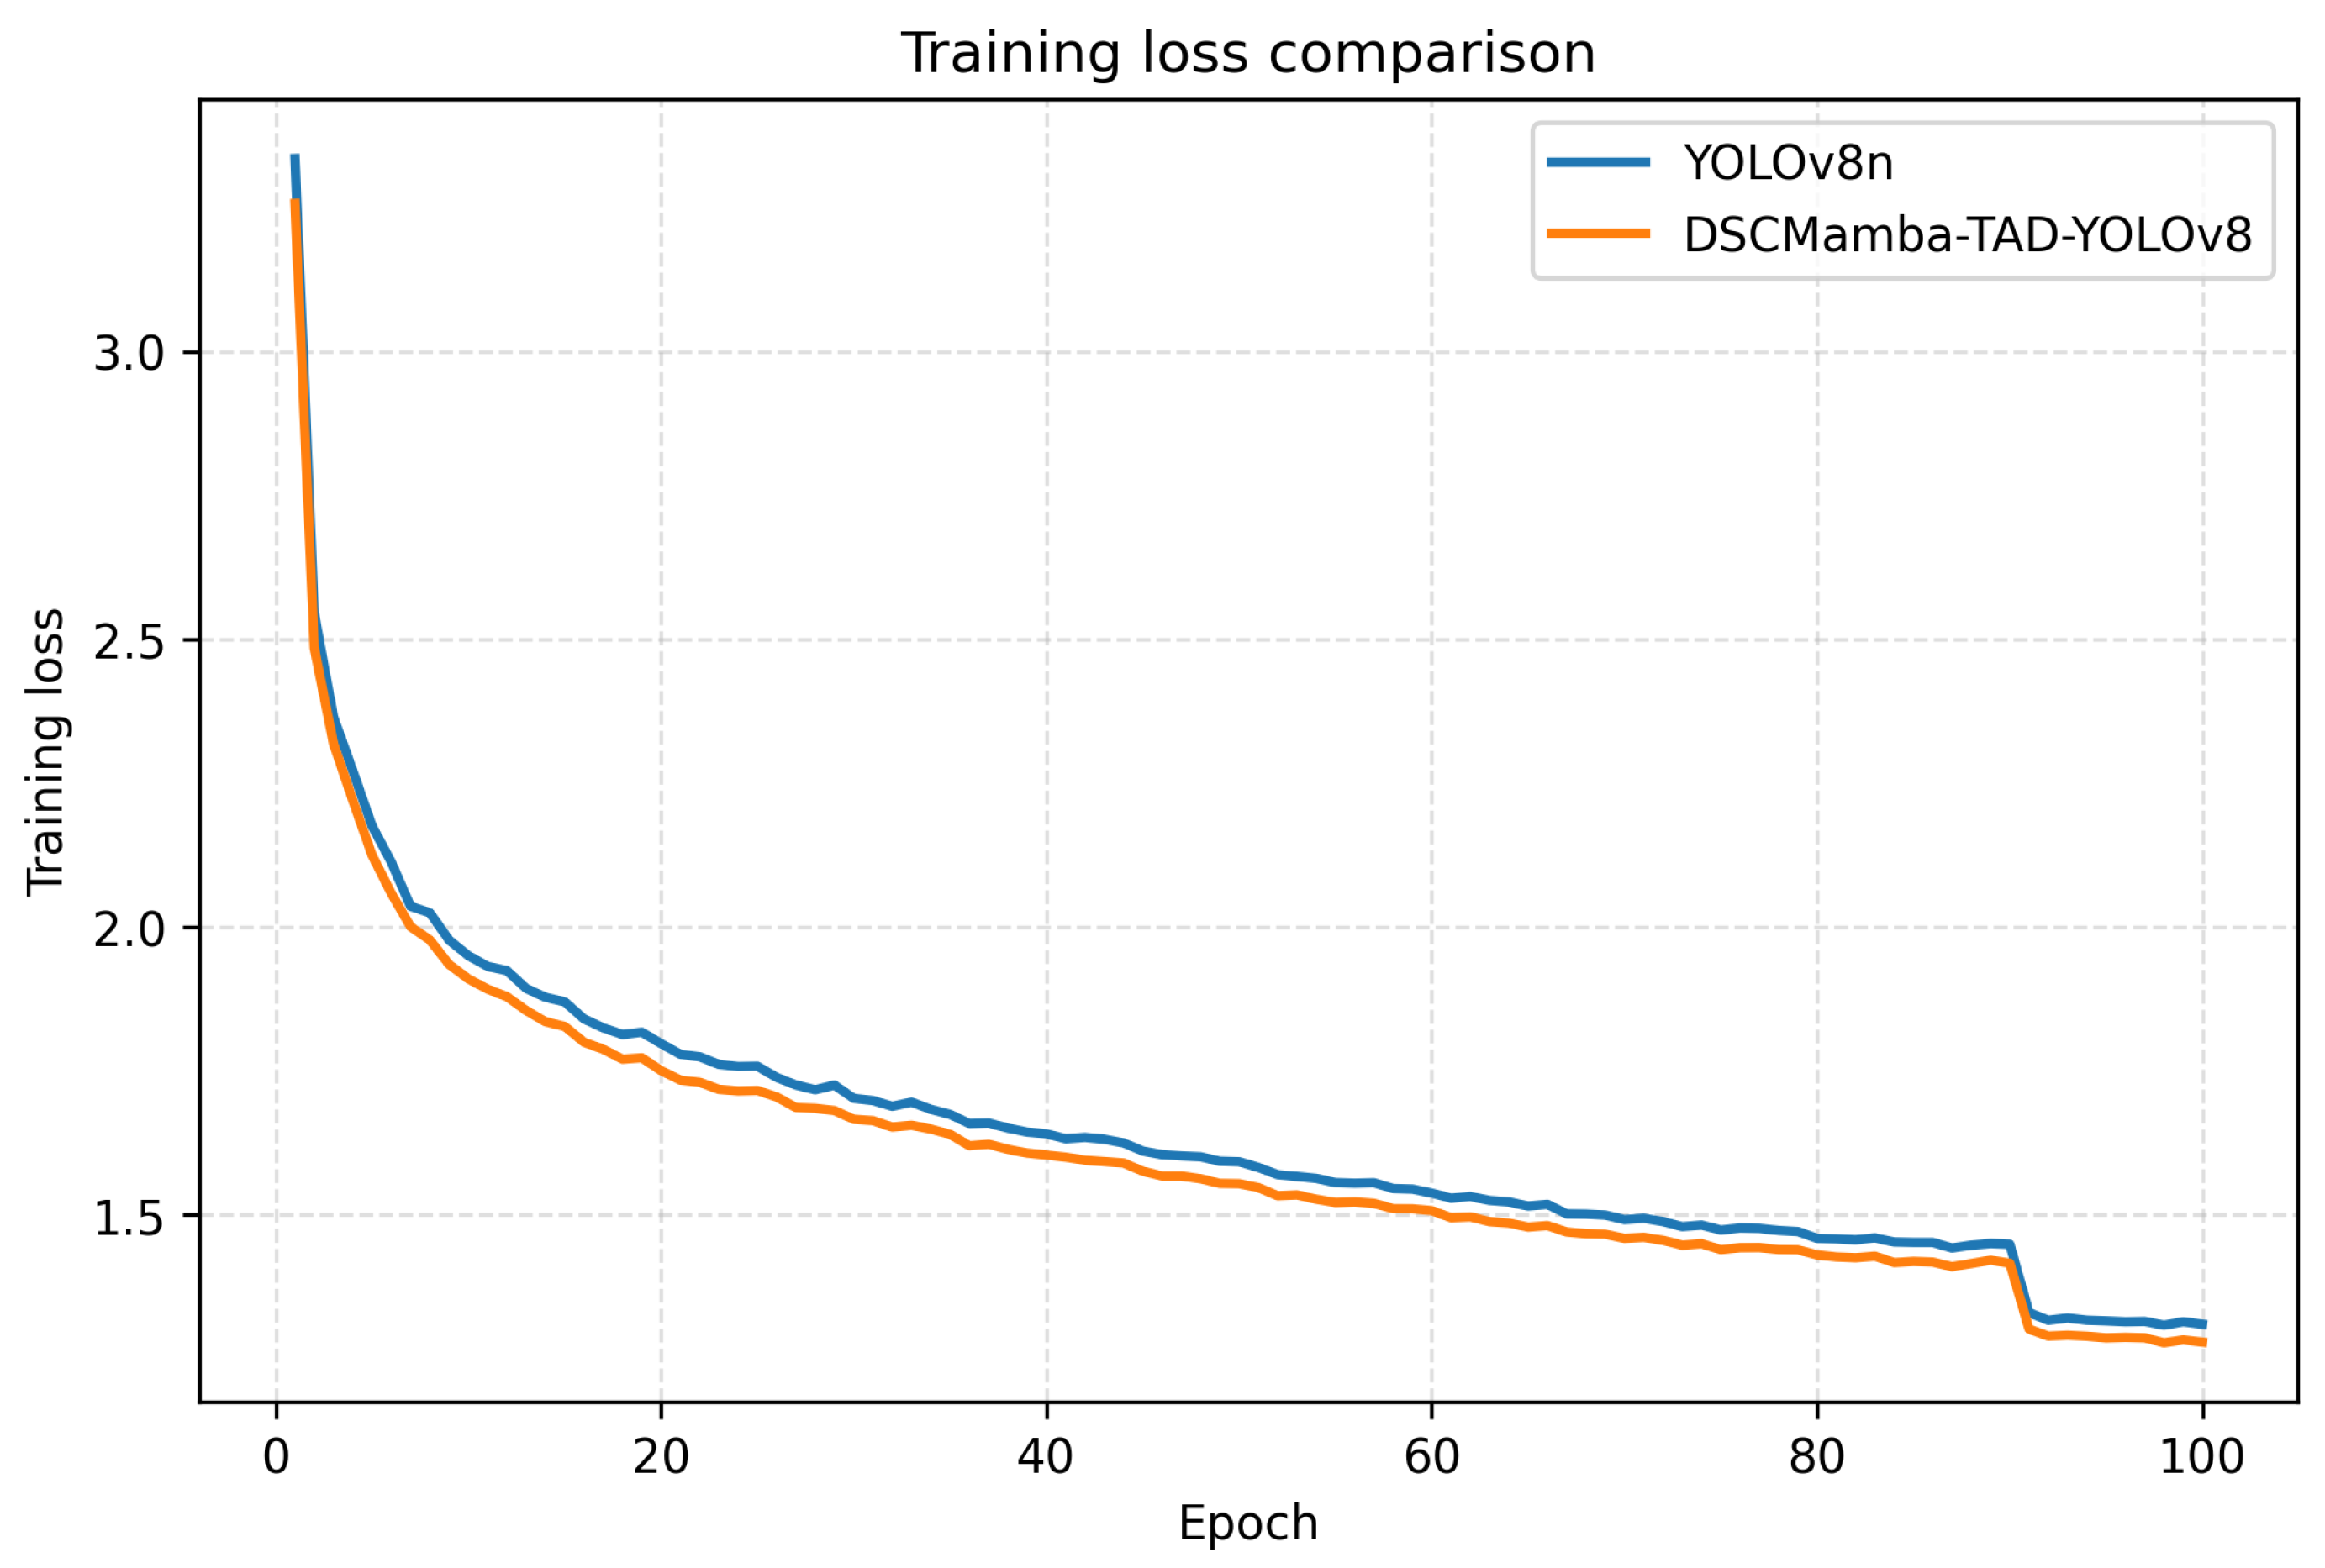
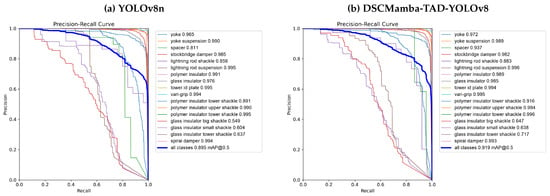
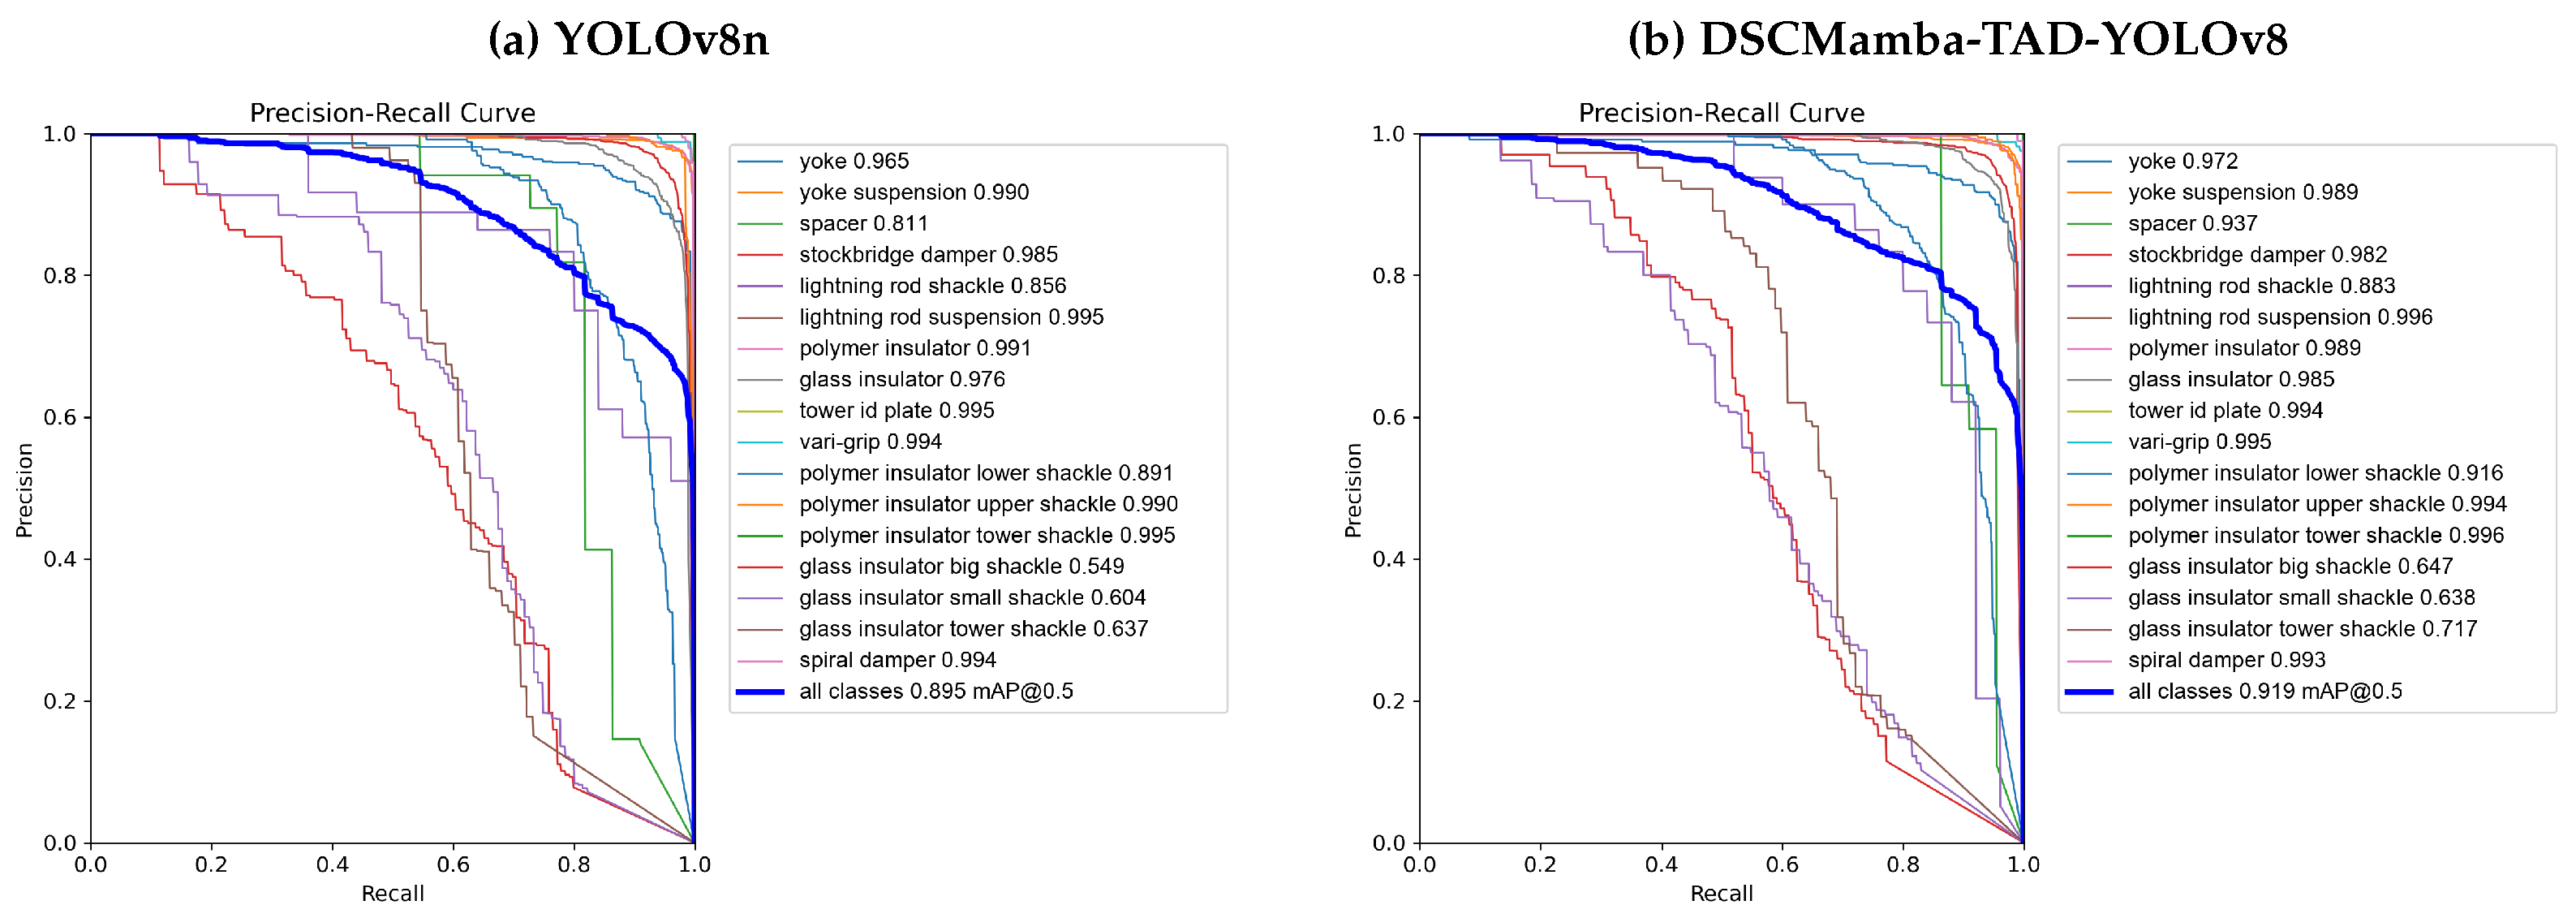
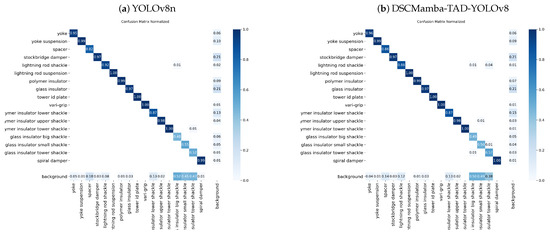
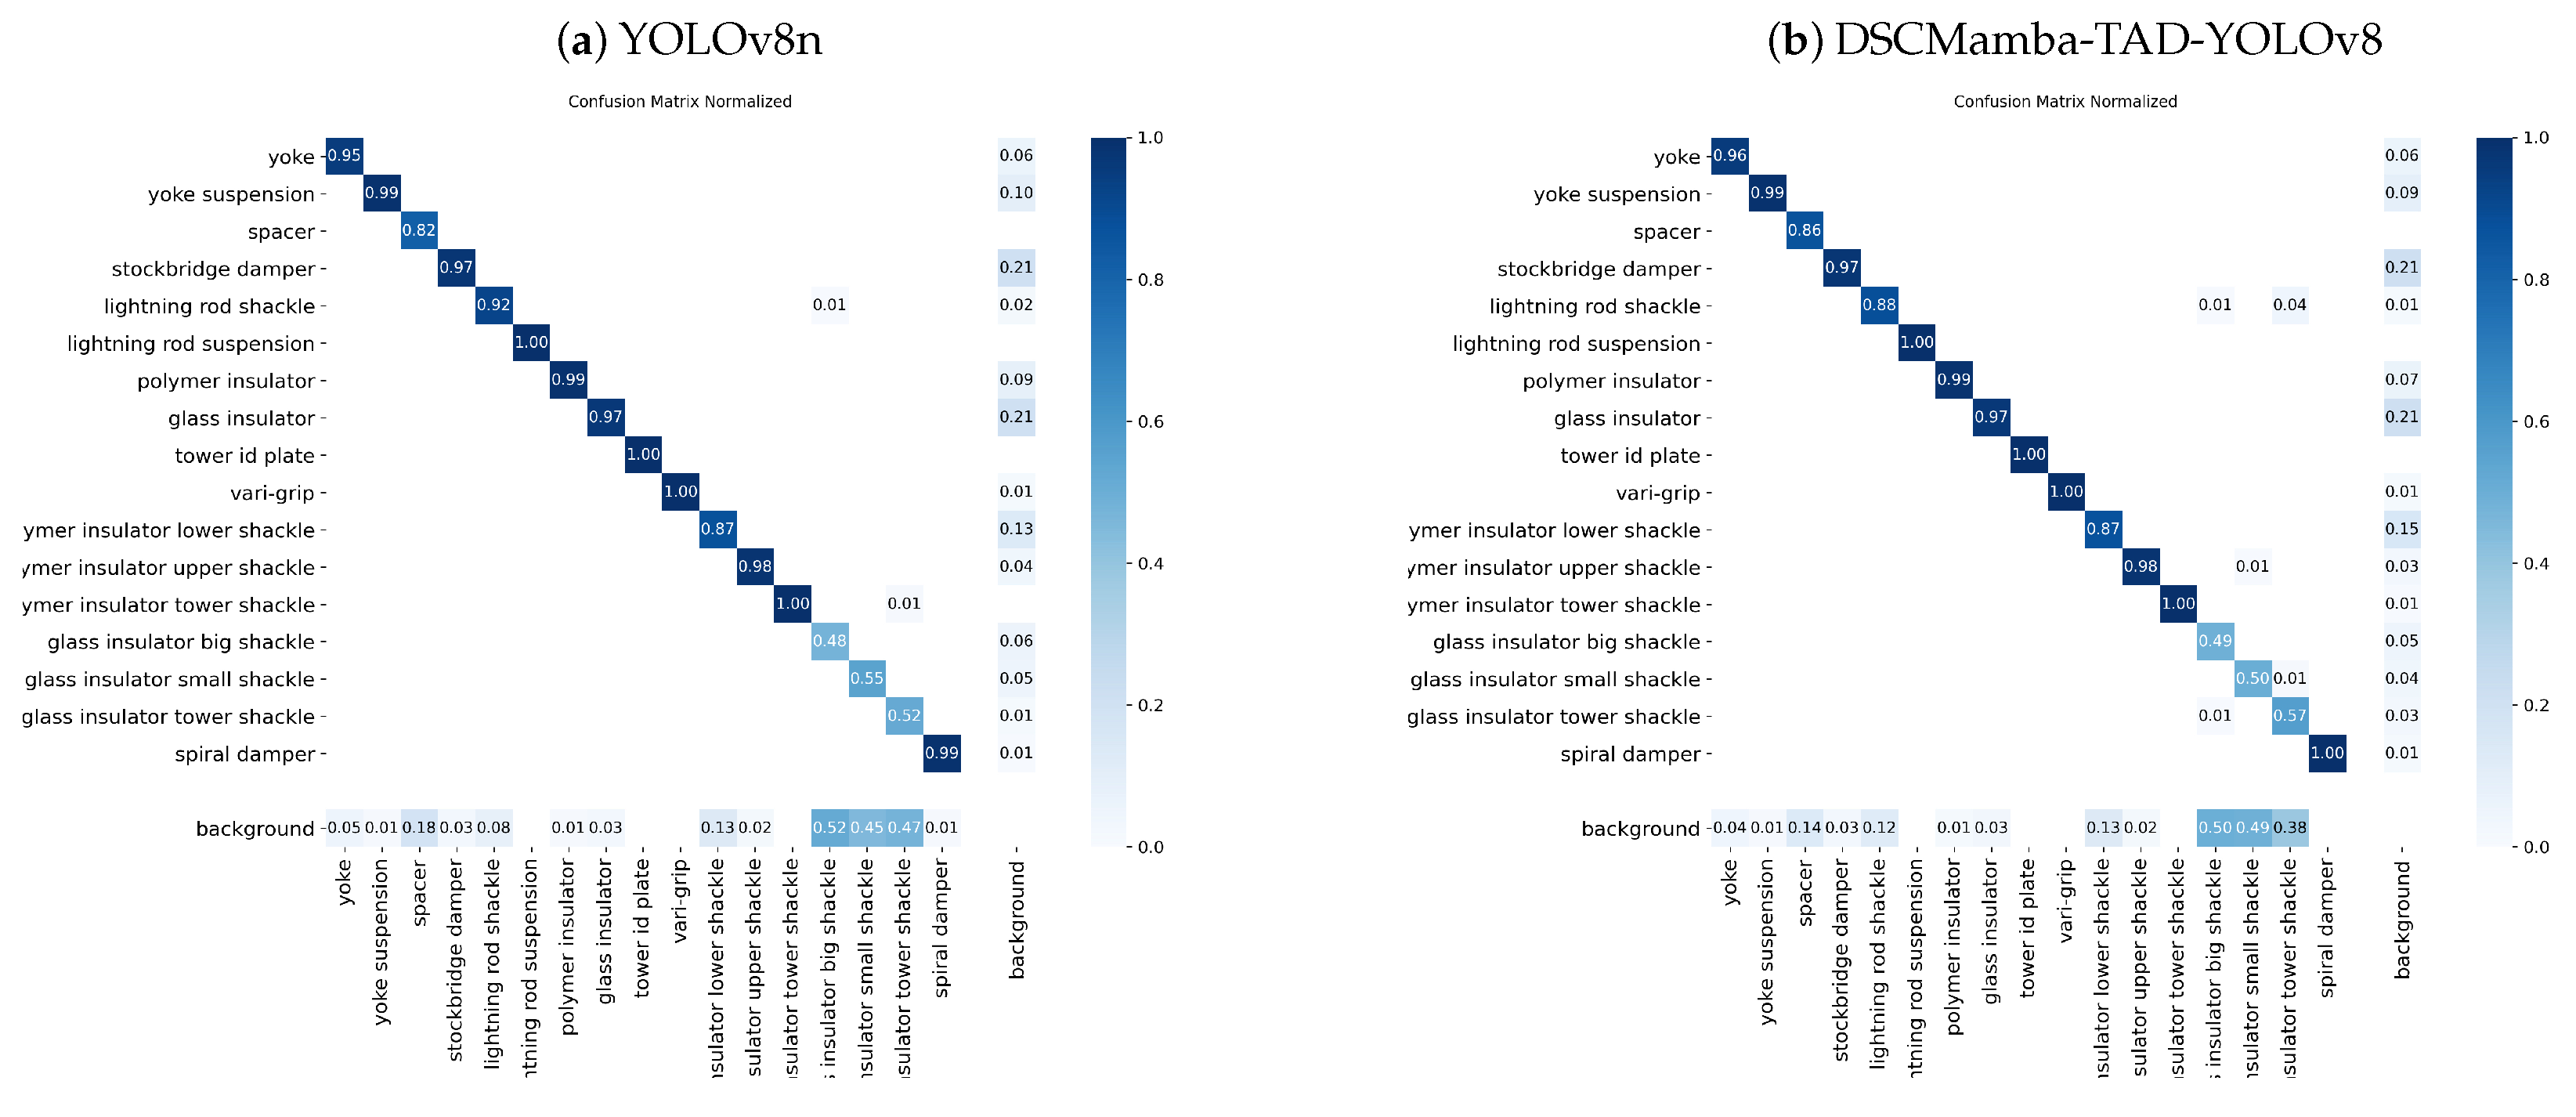
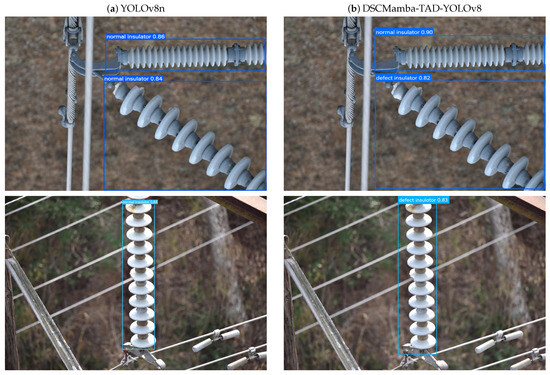
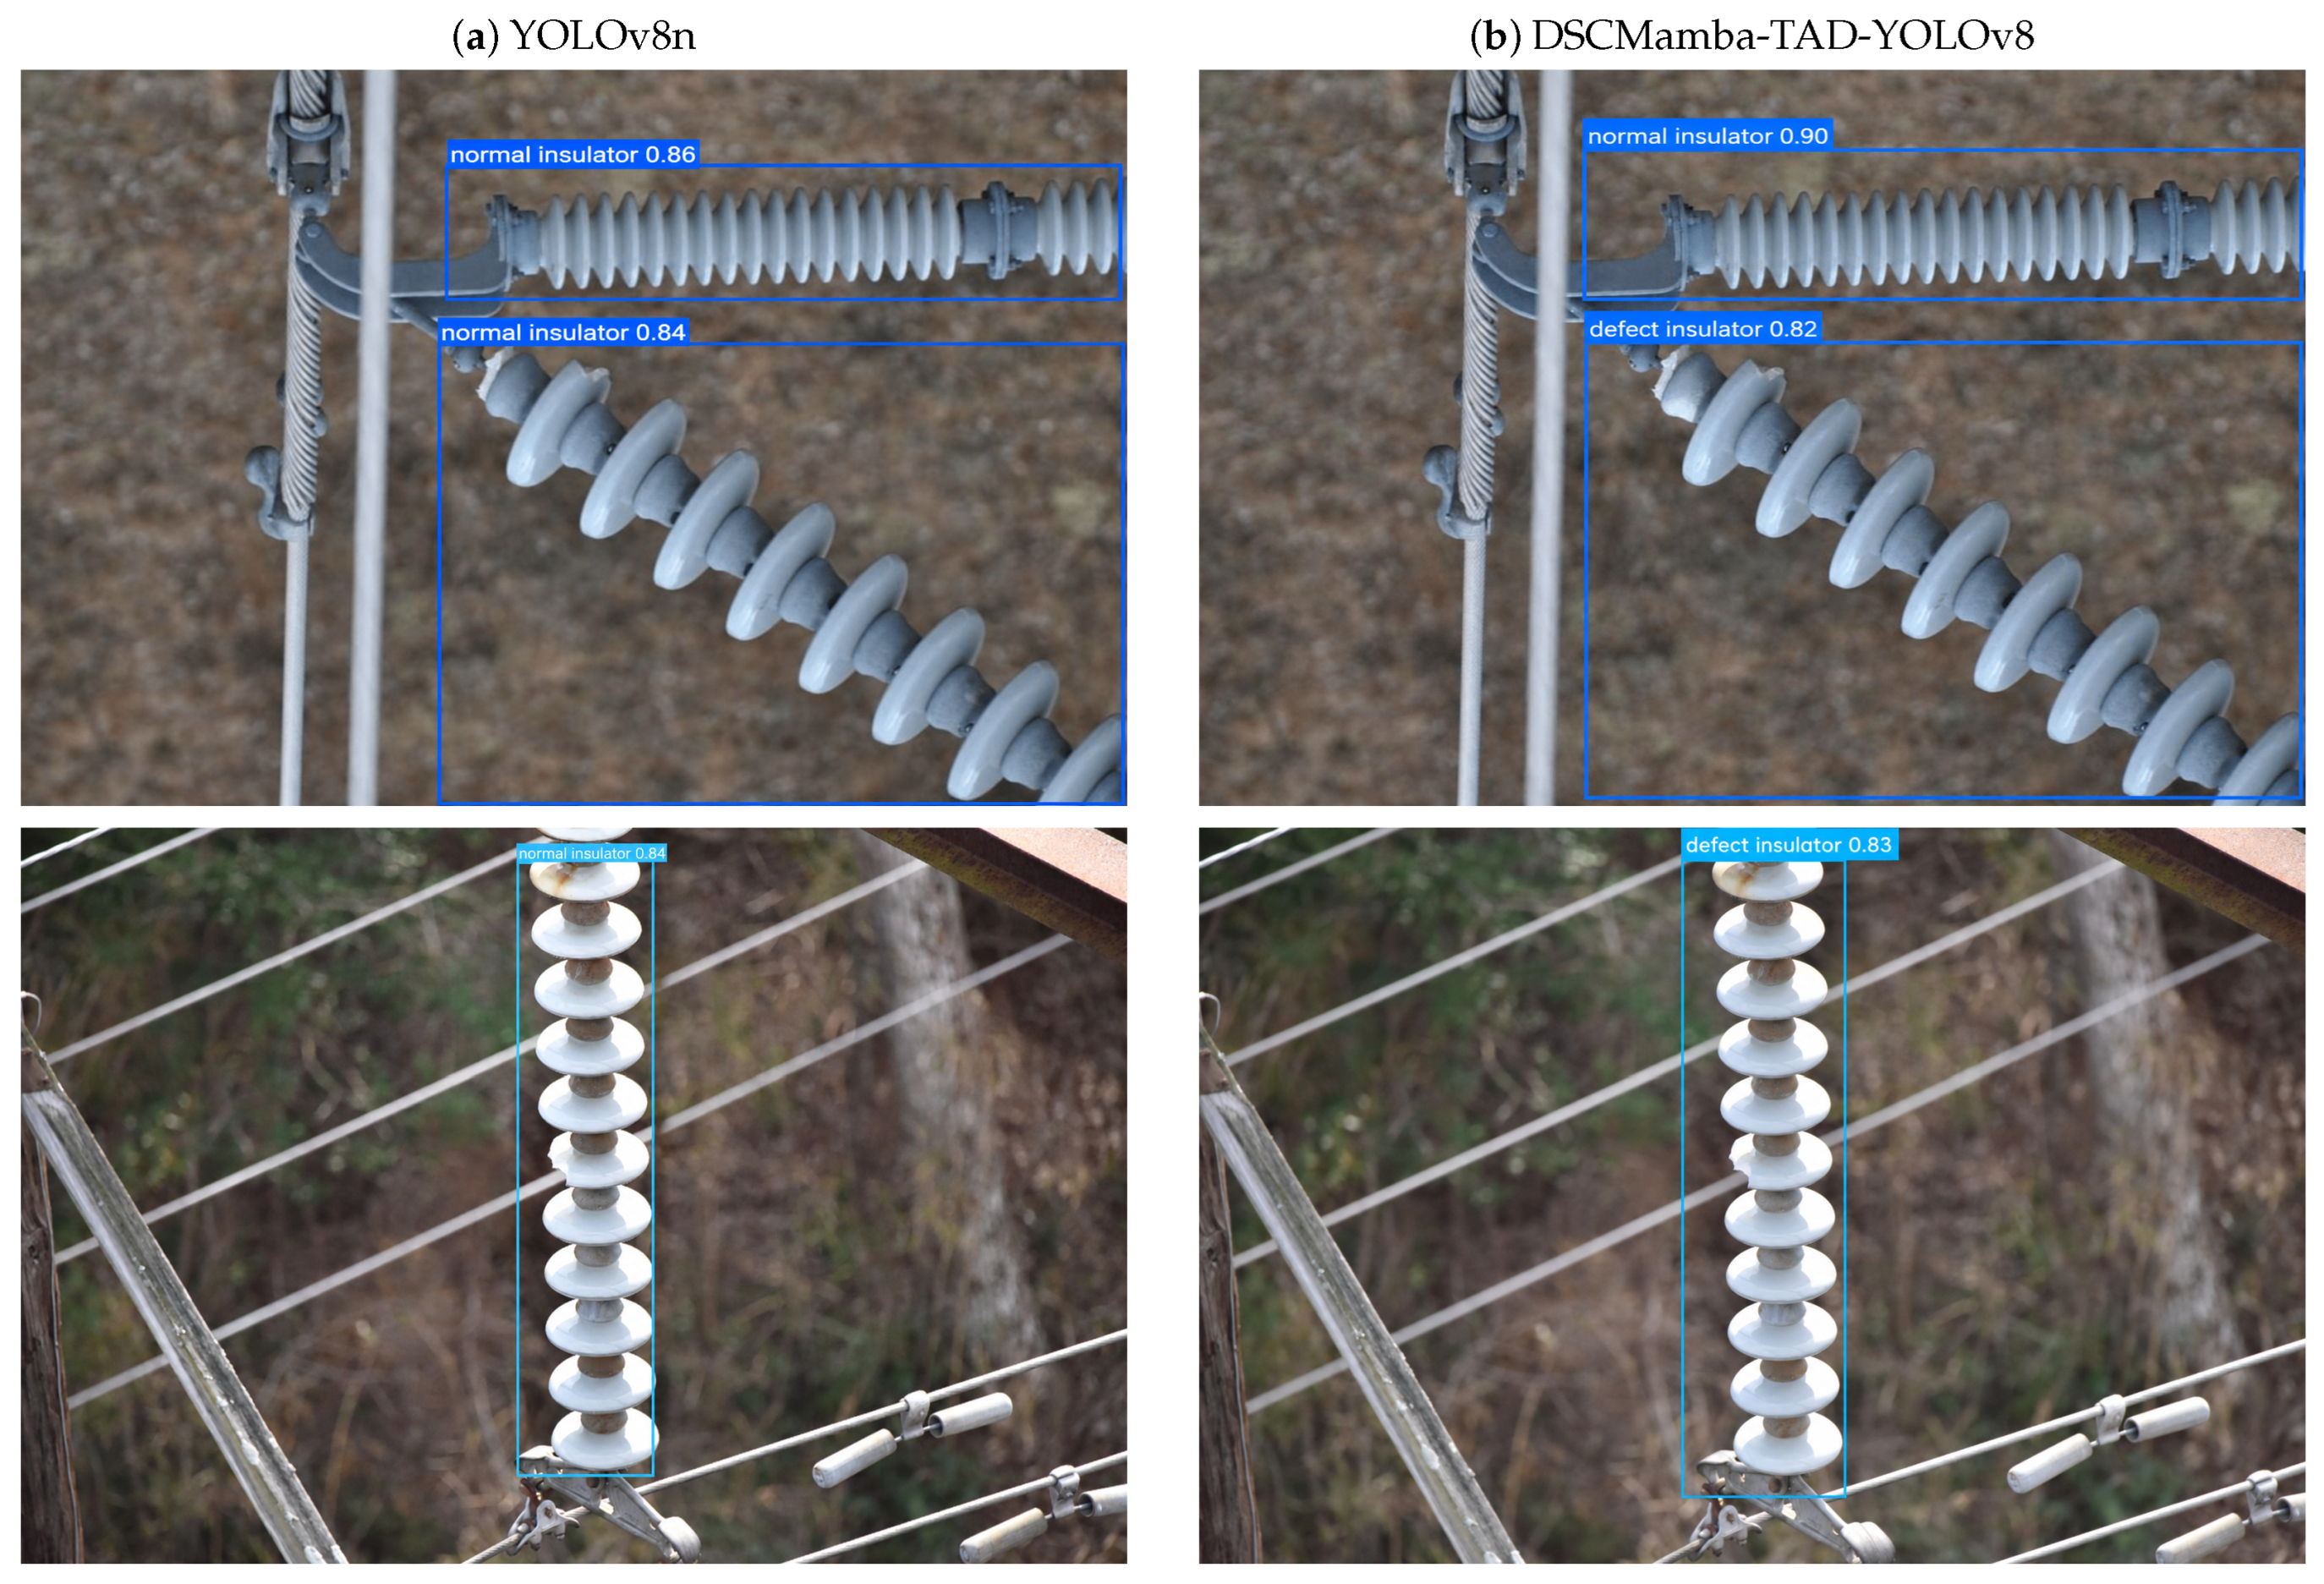
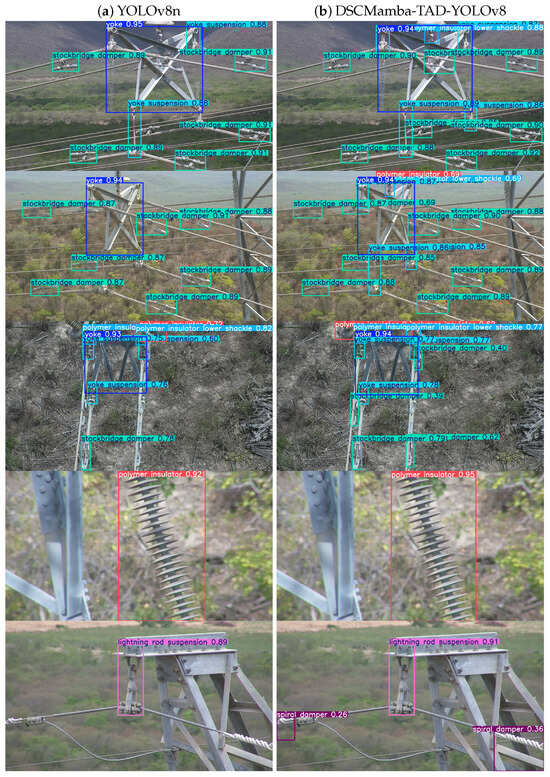
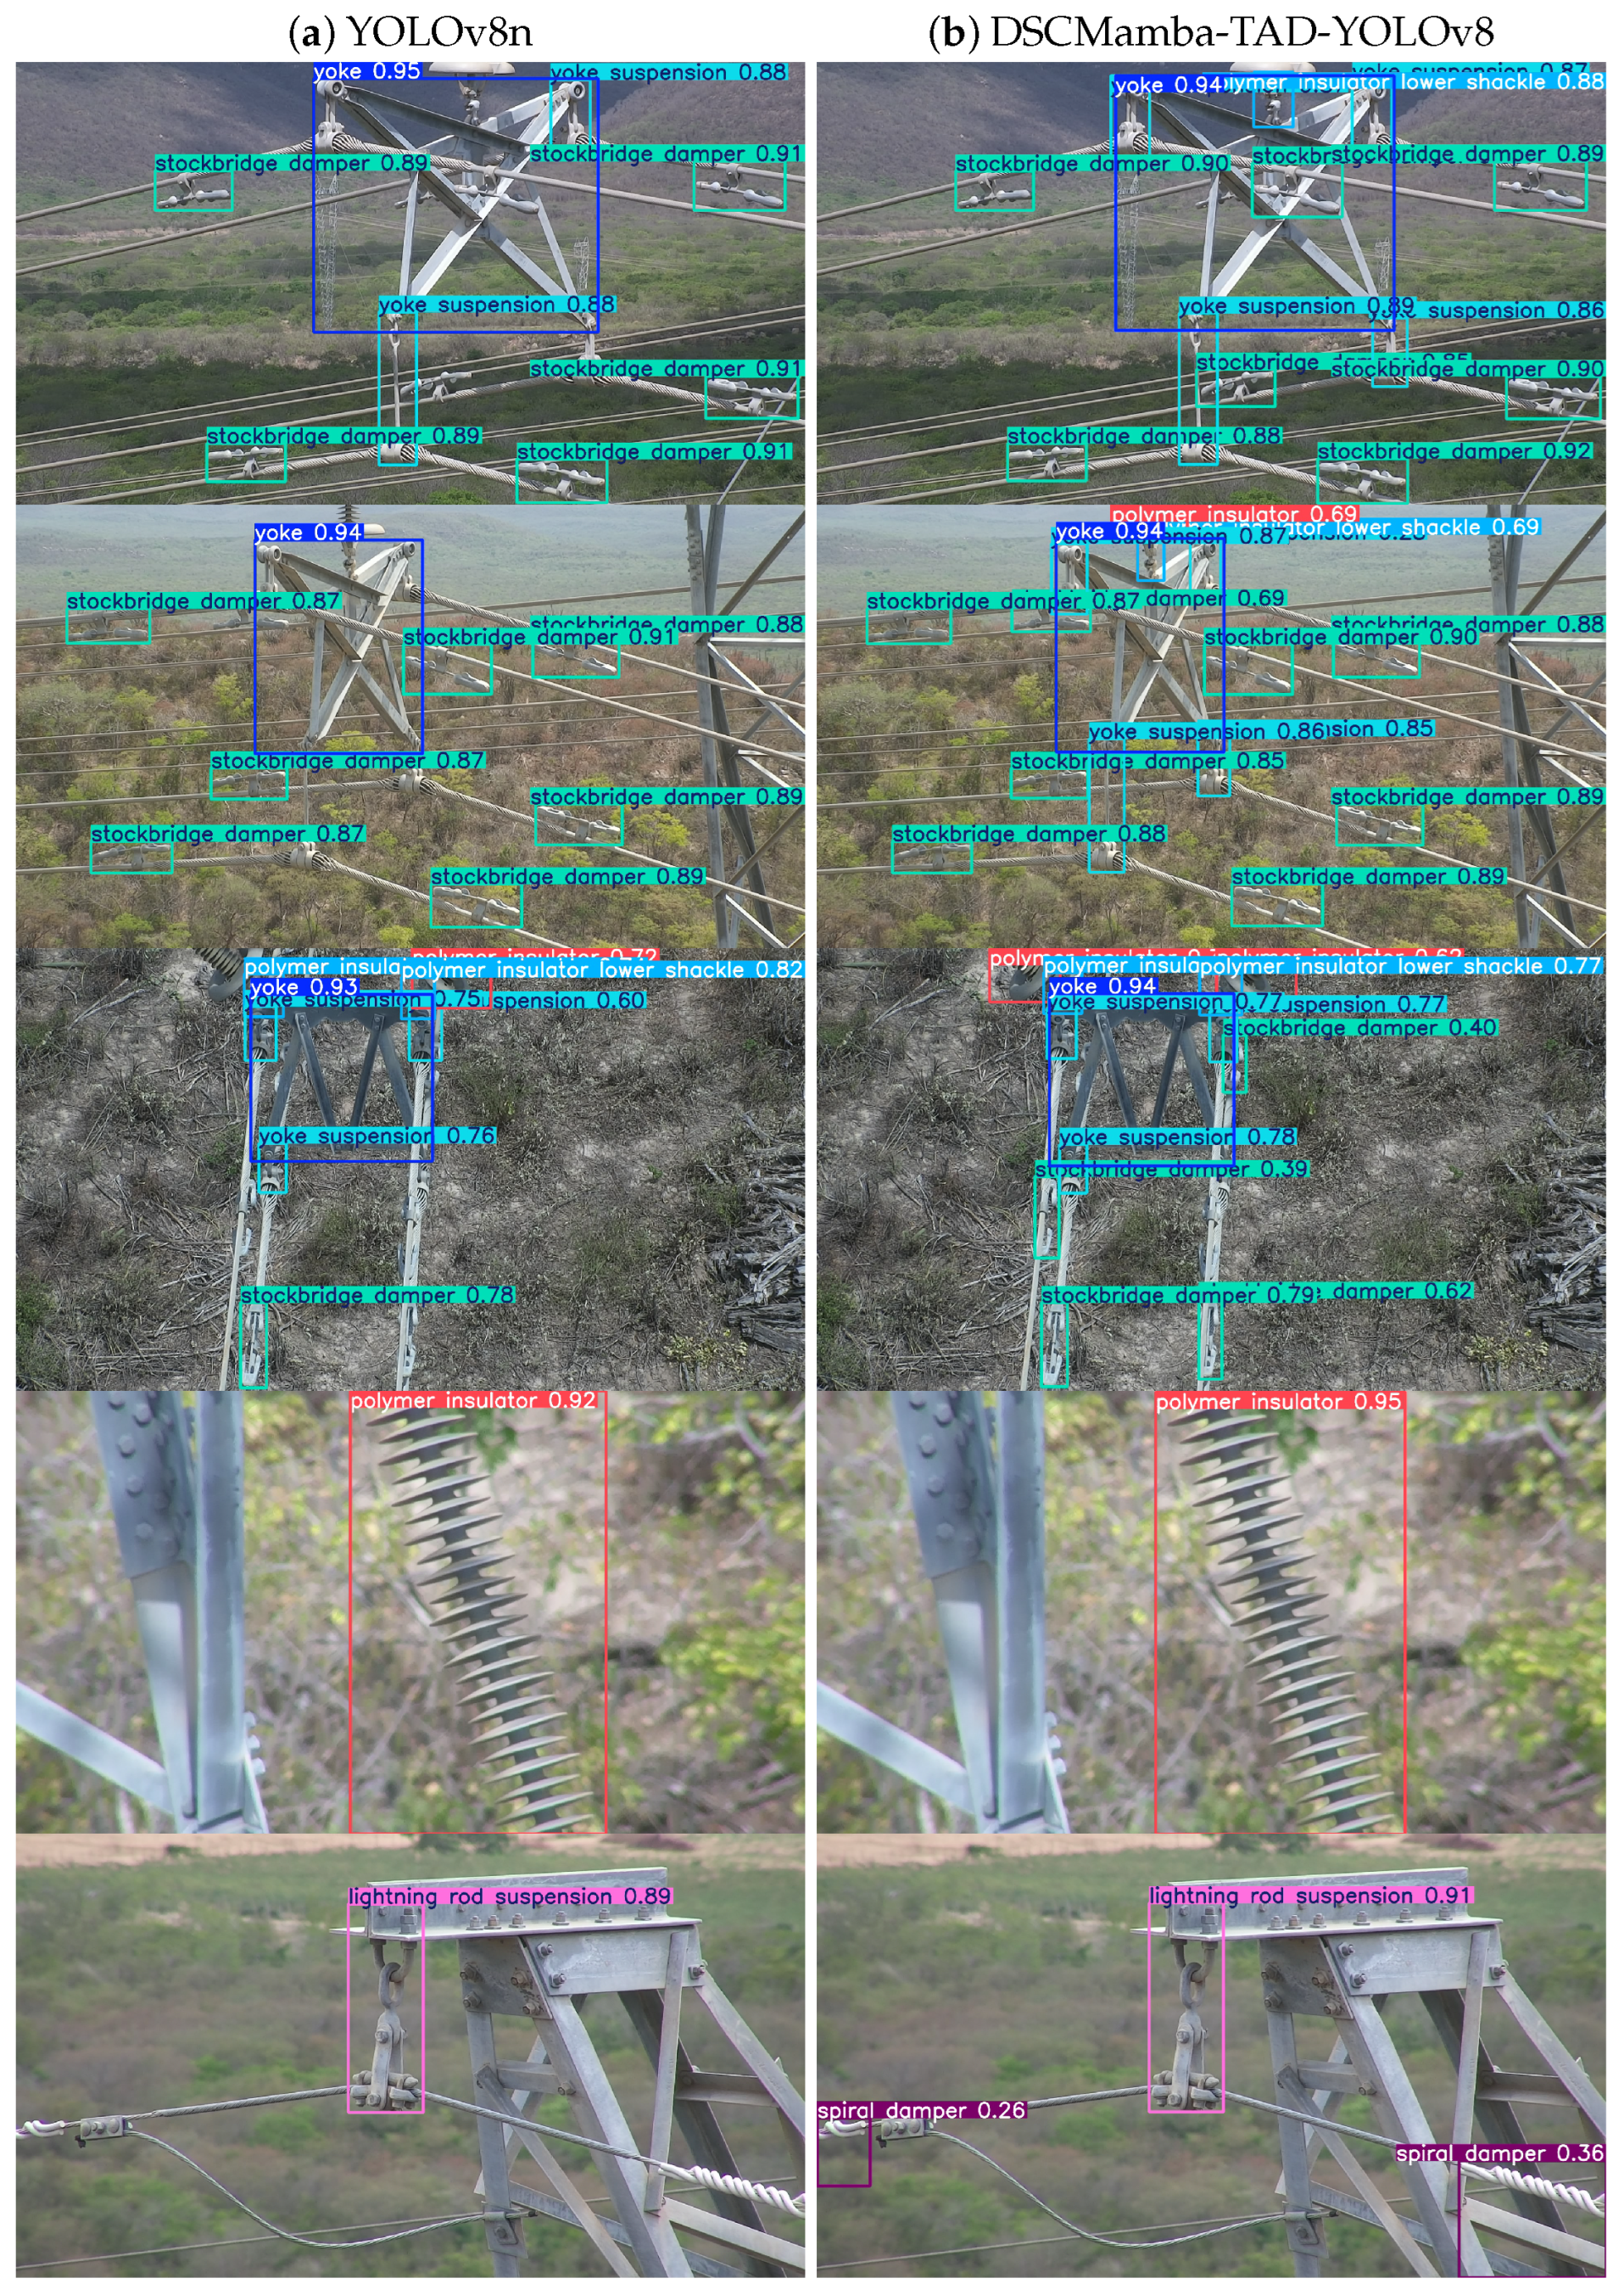

Disclaimer/Publisher’s Note: The statements, opinions and data contained in all publications are solely those of the individual author(s) and contributor(s) and not of MDPI and/or the editor(s). MDPI and/or the editor(s) disclaim responsibility for any injury to people or property resulting from any ideas, methods, instructions or products referred to in the content. |
© 2026 by the authors. Licensee MDPI, Basel, Switzerland. This article is an open access article distributed under the terms and conditions of the Creative Commons Attribution (CC BY) license.