


Abstract
Employee attrition is a significant organizational challenge associated with substantial financial costs and the erosion of institutional knowledge. This study presents an AI-based Management Information System (MIS) that integrates machine learning (ML) models to forecast employee turnover and support technical interpretability for HR decision-making. Using the IBM HR Analytics Dataset comprising 1480 employee records with 38 features, we implemented a rigorous preprocessing pipeline—including Synthetic Minority Over-sampling Technique (SMOTE) applied exclusively within training folds to prevent data leakage, one-hot encoding, Z-score normalization, and mean-value imputation. Four ML classifiers—Logistic Regression (LR), Random Forest (RF), Multi-Layer Perceptron (MLP), and XGBoost—were evaluated under a stratified 80/20 split with 5-fold cross-validation. XGBoost achieved the highest performance, attaining an accuracy of 87.83%, a ROC-AUC of 0.94, a PR-AUC of 0.96, and an F1-score of 93.04%, attributed to its sequential boosting mechanism and built-in L1/L2 regularization. Beyond predictive performance, the system incorporates SHapley Additive exPlanations (SHAP) to deliver feature-level transparency, enabling HR professionals to engage in proactive, informed retention interventions while retaining full decision-making authority. Within-dataset comparisons confirm that the proposed framework outperforms prior methods evaluated on the same benchmark; cross-study accuracy comparisons are reported as contextual reference only, given differences in datasets and experimental protocols. The system facilitates human oversight by positioning AI as a decision-support collaborator rather than an autonomous replacement in workforce management. Future work will address real-time deployment, controlled user studies with HR practitioners, and validation with actual organizational HR data.
1. Introduction
Modern Management Information Systems (MISs) have undergone a profound transformation driven by the integration of artificial intelligence (AI), which now serves as a critical enabler of organizational strategy in human resource (HR) management [1]. Employee attrition—encompassing both voluntary and involuntary departures—represents a persistent threat to organizational stability and financial health [2]. The Society for Human Resource Management estimates that the cost of replacing an employee amounts to approximately 150% of their annual salary, encompassing recruitment, onboarding, training, and lost productivity [3]. Beyond direct financial costs, workforce attrition diminishes employee morale, erodes institutional expertise, and weakens organizational resilience [4].
Traditional HR management approaches—relying primarily on employee satisfaction surveys and retrospective statistical reporting—are insufficient for identifying the complex, multi-dimensional drivers of attrition in real time. These drivers include job satisfaction, organizational tenure, compensation equity, and work–life balance [5]. As Chung et al. demonstrate, conventional analytics frameworks lack the flexibility to detect nonlinear patterns in workforce data, underscoring the demand for sophisticated predictive tools aligned with evolving workplace dynamics [6].
The integration of AI and ML into HR MIS frameworks offers a transformative pathway. Hossain argues that ML enables organizations to transition from reactive to strategic workforce management through optimized MIS data pipelines [7]. The IBM HR Analytics Dataset, encompassing attributes ranging from employee age and tenure to monthly income and satisfaction scores, provides a rich substrate for ML-based attrition modeling. By leveraging historical workforce records to generate predictive knowledge, organizations can design targeted career development and retention programs [8].
However, prediction capability alone is insufficient for maximizing the value of ML in AI-driven MIS deployments. Providing interpretable model outputs is essential so that HR professionals can exercise informed judgment guided by ML-generated forecasts rather than being supplanted by them. Explainable AI (XAI)—in particular, SHAP-based feature attribution—is therefore a critical system component, providing transparency into both who is at risk and why they are at risk (e.g., through signals of workload imbalance or limited career progression). Marin et al. report that XAI-enhanced HR systems can increase HR practitioner confidence in decision-making by up to 30% [9]. Lundberg and Lee’s SHAP framework offers a principled, game-theoretic attribution of complex model outputs, directly aligning with MIS objectives of delivering actionable, user-interpretable insights [10].
Despite this progress, critical research gaps remain. While ML predictive performance in HR contexts is well-documented, limited investigation has examined how ML can concretely support technical interpretability and decision transparency within AI-powered MIS frameworks [11]. Opaque black-box systems risk eroding practitioner trust and constraining professional agency. Fallucchi et al. emphasize that traditional analytics approaches exhibit poor forecast granularity, motivating the development of frameworks that balance predictive precision with operational usability [12].
This study addresses these gaps by presenting an integrated, interpretable ML framework for attrition forecasting within an AI-driven HR MIS. The primary contributions are as follows:
- A comprehensive attrition forecasting system combining a classical MIS architecture with four ML classifiers—LR, RF, MLP, and XGBoost—to optimize HR decision support.
- A design philosophy centered on model interpretability and transparent feature attribution, enabling HR professionals to exercise informed judgment over AI-generated forecasts and transition HR administration from reactive to proactive.
- A SHAP-based explainability layer enabling HR practitioners to interpret model outputs, identify key attrition drivers, and develop targeted retention interventions, while retaining full decision-making authority over any actions taken.
- A rigorous experimental protocol employing stratified 80/20 splitting and 5-fold cross-validation with SMOTE applied strictly inside training folds, together with ROC-AUC and Precision–Recall AUC metrics for comprehensive, threshold-independent model evaluation.
2. Literature Review
The application of ML within AI-powered MISs for HR analytics has attracted substantial research interest, with major findings spanning attrition prediction, explainability, and decision support.
Baydili and Tasci [13] emphasized the growing importance of predictive analysis for employee turnover management, noting that early detection of at-risk employees substantially supports HR planning. Their review examined ML algorithms, including decision trees (DTs), random forests (RFs), support vector machines (SVMs), and gradient boosting, for uncovering complex patterns in HR datasets. XGBoost was highlighted for its robustness and capacity to model feature interactions; however, the limited interpretability of ensemble methods was identified as a barrier to managerial adoption. Explainable AI techniques, notably SHAP values, were proposed as a remedy.
Alabi et al. [14] investigated AI predictive analytics for HR decision support using RF-based classifiers on simulated HR datasets comprising variables such as job role and salary. Their framework demonstrated a 15% improvement in predictive precision over conventional approaches; however, scalability limitations emerged when applying the model across organizations with heterogeneous data structures, requiring additional adaptation for broader deployment.
Nyathani [15] developed an AI-based HR analytics system for processing large-scale HR data via ML pipelines. By integrating attendance records, overtime data, and turnover indicators, the system achieved predictive efficiency levels exceeding manual approaches by 20% and revealed actionable correlations such as those between extended working hours and elevated attrition. The study lacked, however, interpretable explanations that practitioners could use directly in decision-making.
Kutubuddin [16] evaluated talent management through ML-based HR analytics, achieving an 18% improvement in retention strategy prediction using corporate datasets, including performance reviews and engagement scores. Real-time data integration limitations constrained the model’s adaptability to dynamic workforce changes.
Pala [17] applied ML models to recruitment optimization, achieving a 12% improvement in hiring decision precision through candidate–job matching based on experience and skills. The system lacked dynamic dataset functionality, preventing adaptation to evolving labor market conditions.
Krishna and Sidharth [18] applied a dual DT and artificial neural network (ANN) framework to the IBM HR Analytics Dataset, achieving 80% accuracy. However, the system’s demanding tuning requirements created practical barriers for real-world HR deployment.
Marin et al. [9] combined decision trees with SHAP-based XAI for attrition prediction, increasing HR decision-making confidence by 30% and achieving a 10% improvement in trust metrics relative to black-box models. Computational overhead associated with XAI processing remained a barrier to organizational scalability.
Gopinath and Appavu [19] validated an RF-based attrition prediction model on the IBM HR Analytics Dataset, achieving 15% higher accuracy than logistic regression [20]. Overfitting on smaller datasets was identified as a limitation requiring further optimization.
Hossain [7] demonstrated ML-driven optimization of MIS data processing, achieving an 18% improvement in process efficiency within an HR management context. The study did not, however, address attrition prediction or interpretability mechanisms.
Recent advances in domain adaptation and contrastive learning for tabular data offer promising directions for improving generalizability across organizational contexts. SCARF [21] employs contrastive self-supervised pretraining on tabular features, learning representations that transfer more effectively across different organizational populations. Similarly, TabPFN [22] introduces a prior-data fitted network that performs well on small tabular datasets without extensive hyperparameter tuning—a property highly relevant to HR settings where data are limited. These approaches suggest a pathway toward more robust, cross-organizational attrition models. Future work should investigate whether contrastive pretraining or in-context learning methods can reduce the domain gap when deploying HR attrition models across different organizations.
Table 1 consolidates the reviewed studies across nine key dimensions identified as critical for evaluating the contribution of HR attrition prediction frameworks: the learning algorithm(s) employed, the dataset used, whether XAI/SHAP explanations are provided, whether SMOTE is used, whether SMOTE leakage is avoided, whether the study validates on real corporate data, whether ROC-AUC is reported, whether user studies are conducted, and whether an integrated MIS framework is proposed. This structured comparison positions the present work relative to the existing literature and directly substantiates the research gaps enumerated below.
Table 1.
Comparison of the proposed method with representative prior studies across key methodological dimensions. ✓ = addressed; × = not addressed; ∼ = partially addressed; N/A = not applicable. Dimensions were selected to reflect the key methodological considerations identified in the literature and highlighted during the review process.
As evidenced by Table 1, no prior study simultaneously satisfies all nine dimensions. The most notable gaps are: (1) the absence of leakage-free SMOTE protocols in all reviewed works; (2) the near-universal omission of ROC-AUC reporting in HR attrition studies; (3) the lack of integrated MIS frameworks that incorporate XAI; and (4) the absence of user studies validating the impact of explanations on HR decision quality. The proposed framework addresses dimensions (1), (2), (3), and (5) (integrated MIS), while dimension (4) is explicitly acknowledged as a limitation and the primary direction for future work. The “Real Corp.” column confirms that validation on actual organizational data remains an open challenge across the entire field.
Identified Limitations and Research Gaps:
- Many existing frameworks encounter scalability challenges when applying ML models to large HR databases, limiting cross-organizational applicability.
- Research frequently prioritizes predictive accuracy over transparency, reducing user trust and constraining HR professionals’ independent decision-making.
- ML models trained on static historical data lack mechanisms to adapt dynamically to evolving HR contexts and workforce transitions.
- Deep neural architectures impose high computational requirements that many organizations cannot support with existing infrastructure.
- The literature lacks comprehensive investigations into how ML systems can technically support interpretability and transparency in MIS frameworks, delivering human-centered, actionable insights to HR professionals.
- Existing studies rarely validate attrition models beyond a single dataset or organization, limiting assessments of generalizability.
- No prior work in the reviewed literature simultaneously reports leakage-free SMOTE protocols, ROC-AUC metrics, and an integrated HR MIS framework—gaps that the present study directly addresses.
The present study directly addresses these gaps through an integrated framework combining ML-based attrition forecasting with SHAP-driven interpretability, enabling HR professionals to exercise informed, judgment-guided decision-making within an AI-augmented MIS architecture.
3. Methodology
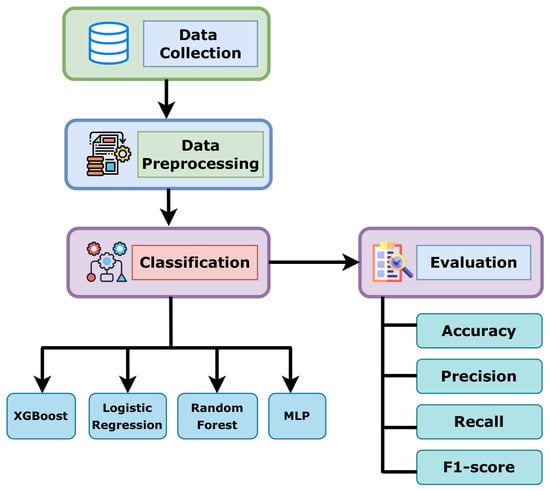
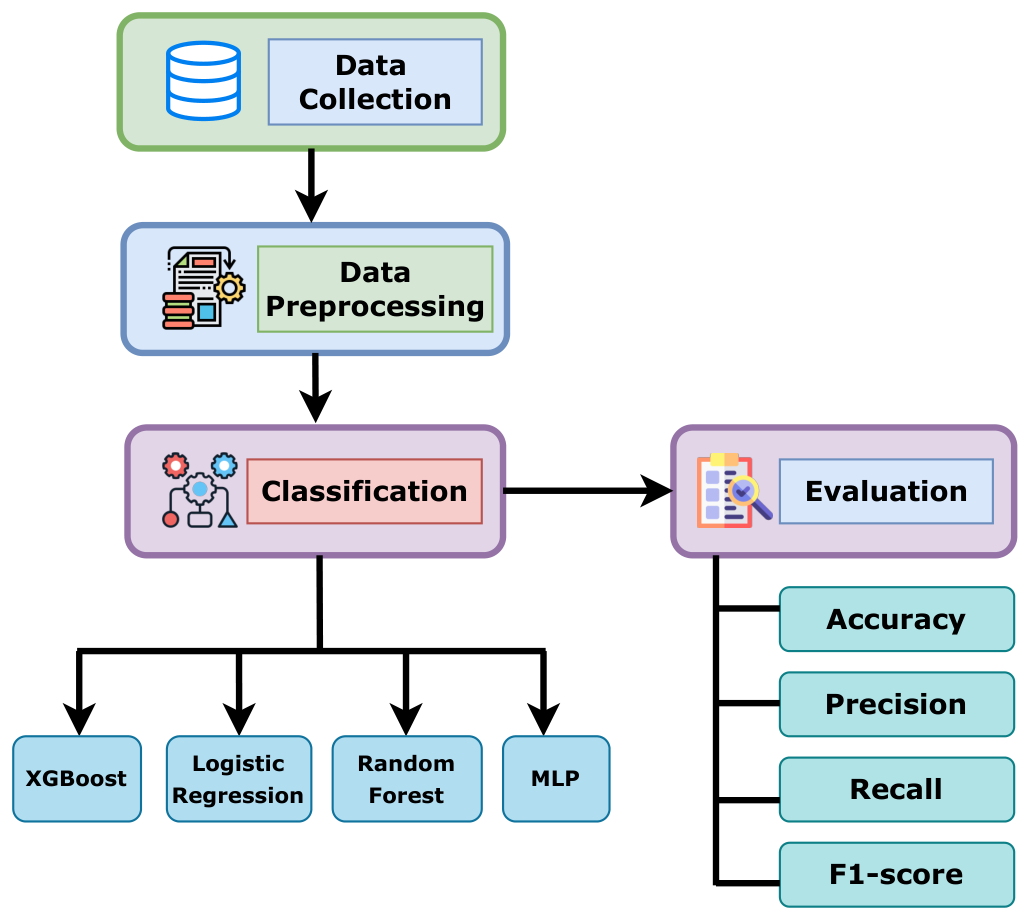
This section describes the end-to-end methodology for predicting employee attrition using ML models. The workflow proceeds across six sequential stages: data collection, preprocessing, model selection, training, evaluation, and performance analysis, as illustrated in Figure 1.
Figure 1.
End-to-end methodology workflow for ML-based employee attrition prediction in the AI-driven HR MIS. Dataset: IBM HR Analytics Dataset (1480 records; 38 features). SMOTE oversampling is applied strictly inside the training fold of each cross-validation split to prevent data leakage.
3.1. Dataset Description
This study employs the IBM HR Analytics Dataset [25], a publicly available benchmark on Kaggle comprising 1480 employee records characterized by 38 features. The dataset encompasses a broad spectrum of workforce attributes, including demographics, job roles, experience levels, compensation structure, performance ratings, job satisfaction scores, and promotion history. The binary target variable encodes whether an employee has left the organization (Attrition = Yes) or remains active (Attrition = No).
Examination of the target variable distribution reveals a pronounced class imbalance: approximately 84% of records correspond to retained employees, while only 16% represent employees who departed. This imbalance motivates the application of dedicated resampling strategies described in Section 3.2.
The IBM HR Analytics Dataset, while a widely used benchmark, carries inherent scope limitations. It is a synthetic dataset originally developed for educational and demonstration purposes and does not represent actual historical corporate records. Behavioral patterns and attrition drivers derived from this dataset may therefore not transfer directly to real organizational contexts. Claims regarding practical HR interventions should be interpreted as illustrative rather than prescriptive. The dataset represents a single static organizational snapshot and does not capture multi-organizational or longitudinal workforce dynamics. Contextual factors such as leadership style, organizational culture, external labor market conditions, and evolving HR policy are absent. Working with a bounded dataset also introduces overfitting risk when combined with minority-class augmentation; this risk is mitigated through strict training-fold-only SMOTE application, stratified validation protocols, feature normalization, and regularization-aware model configurations.
3.2. Data Preprocessing
A systematic and rigorously controlled preprocessing pipeline was implemented to ensure data integrity, feature consistency, and statistical suitability for supervised ML modeling. Each stage was designed with explicit attention to preventing data leakage between training and test partitions—a methodologically critical requirement for reliable performance evaluation. All transformation parameters (means, standard deviations, and encoder mappings) were derived exclusively from the training data and applied to the test set in a read-only fashion. The pipeline proceeds through four sequential stages: missing value imputation, categorical variable encoding, numerical feature normalization, and class imbalance correction via SMOTE.
3.2.1. Missing Value Imputation
Missing values arising from incomplete records were identified across all 38 attributes. A feature-level audit was first conducted to distinguish between randomly missing values (amenable to imputation) and structurally missing features (candidates for removal). For the IBM HR Analytics Dataset, no feature exhibited structural missingness; all missing entries were treated as missing at random and handled via mean imputation. Features with more than 30% missing values were flagged for removal prior to imputation, though none reached this threshold. For numerical features, mean imputation was applied using the training-set mean, ensuring that no information from the held-out test partition influences imputed values. This approach is computationally efficient and consistent with established practice for moderate missingness in tabular HR data [26]. Equation (1) defines the mean imputation formula, where the imputed value is computed from the n valid (non-missing) observations available in the training set:
As shown in Equation (1), each missing entry is replaced by the arithmetic mean of observed values for that feature, computed exclusively from the training data to prevent leakage. This stored mean is applied identically to the test set during inference.
3.2.2. Encoding of Categorical Variables
Categorical attributes such as Department, JobRole, EducationField, Gender, MaritalStatus, and OverTime are not natively compatible with the numerical input requirements of ML algorithms. One-hot encoding was applied to convert these nominal features into binary indicator vectors, eliminating the spurious ordinal relationships that would be introduced by integer label encoding [26]. For each categorical feature with m unique levels, one-hot encoding produces m binary columns (or , if a reference category is dropped to avoid multicollinearity in LR). The encoding mapping was fitted on the training set and applied identically to the test set. The binary encoding rule is formalized in Equation (2):
Equation (2) was applied independently to all categorical features, producing mutually exclusive binary indicator columns that faithfully represent each category level without imposing ordinal relationships.
3.2.3. Normalization of Numerical Features
Numerical features in the IBM HR Analytics Dataset span widely heterogeneous scales: Age ranges from approximately 18 to 60 years, while MonthlyIncome ranges from several hundred to over 20,000 USD. Such scale disparities adversely affect optimization convergence in gradient-sensitive models (LR, MLP) and can distort distance-based computations. Z-score standardization was therefore applied to all continuous input variables. This step is particularly important for LR, whose lbfgs solver is sensitive to feature scale, and for MLP, where unscaled inputs can cause early-layer neuron saturation. Tree-based models (RF and XGBoost) are theoretically scale-invariant; however, normalization was applied uniformly across all models to ensure a fair comparison. The standardization formula is given in Equation (3), where denotes the normalized value, is the feature mean, and is the feature standard deviation, both computed on the training split:
As shown in Equation (3), Z-score normalization transforms all continuous variables to zero mean and unit variance. The parameters and were computed exclusively on the training split and applied to the test set in transform-only mode, strictly preventing any leakage of test-set statistics.
3.2.4. Handling Class Imbalance via SMOTE
The IBM HR Analytics Dataset exhibits pronounced class imbalance: approximately 84% of records correspond to retained employees and approximately 16% to attrited employees. Training on such imbalanced data risks producing a degenerate model that achieves high nominal accuracy by predicting the majority class for all instances, while failing to identify the at-risk minority—the primary operational objective [27]. To address this, SMOTE was employed to generate synthetic minority-class instances in feature space, augmenting the training set to a balanced class distribution. To prevent data leakage, SMOTE was applied strictly inside the training fold of each cross-validation split, after the train-test partition was established. The held-out test set was never subjected to any form of oversampling, ensuring that it preserves the original, realistic class distribution and that all reported performance metrics reflect uncontaminated generalization. The near-balanced confusion matrix patterns observed in the test set reflect the model learning balanced decision boundaries—not any resampling of the test set. The SMOTE interpolation formula is presented in Equation (4), which generates a new synthetic minority-class instance by linearly interpolating between an existing minority sample and one of its k-nearest neighbors:
Equation (4) was applied within each training fold with nearest neighbors and sampled uniformly from . Each synthetic sample thus lies on the line segment between a real minority instance and its selected neighbor, avoiding extrapolation beyond the observed feature distribution.
3.3. ML Model Architectures
Four ML classifiers were selected to span the complexity spectrum from interpretable linear models to high-capacity ensemble and deep learning architectures. The selection is motivated by three considerations: (1) LR serves as an interpretable baseline whose linear assumptions permit direct coefficient-level explanation; (2) RF provides a strong non-parametric ensemble baseline with native feature importance scores; (3) XGBoost represents the current state of practice for gradient-boosted trees on tabular data and is the primary proposed model; and (4) MLP is included for completeness, with the acknowledgment that its suitability for fewer than 1,500 records is limited (see Section 3.3.4). Together, these four models span a range of inductive biases and complexity levels, enabling a rigorous comparison of the trade-offs between predictive performance and interpretability.
3.3.1. Logistic Regression [28]
LR is a foundational statistical classifier for binary outcomes, widely used as a baseline in HR analytics due to its interpretability and low computational cost. In the context of employee attrition prediction, LR models the probability of departure as a monotonic function of a weighted linear combination of input features. Its primary advantage for HR applications is that each learned weight directly quantifies the direction and relative magnitude of the contribution of feature to attrition risk, providing intrinsic interpretability without requiring post hoc explanation methods. L2 regularization (Ridge) was applied to penalize large coefficient magnitudes and reduce overfitting on the relatively small training set. Given a feature vector , Equation (5) expresses the log-odds of attrition as a linear combination of input features and a bias term b:
The log-odds value z from Equation (5) is transformed into a calibrated attrition probability via the sigmoid function, formalized in Equation (6):
As shown in Equation (6), the sigmoid function maps any real-valued z to the open interval , producing a calibrated probability estimate suitable for threshold-based decision-making. When the predicted probability is ≥0.5, the employee is classified as a potential leaver. LR’s coefficient-level interpretability enables HR professionals to directly assess the directional contribution of each feature to attrition risk, making it a natural complement to the SHAP-based global interpretability layer applied to XGBoost.
3.3.2. Random Forest [29]
RF is a powerful ensemble classifier that constructs a large collection of decorrelated decision trees on bootstrapped subsets of the training data and aggregates predictions via majority voting. This bagging strategy substantially reduces variance relative to a single decision tree while capturing complex nonlinear feature interactions that LR cannot model. In the HR attrition context, RF is particularly effective because employee departure is driven by threshold effects (e.g., overtime exceeding a critical level) and interaction effects (e.g., low job satisfaction compounded by poor work–life balance) that are naturally represented by piecewise-constant tree decision boundaries. The number of trees was set to 100, providing a stable bias-variance trade-off without prohibitive computation for this dataset size. The maximum depth was left unbounded to allow trees to fit complex interactions, with overfitting controlled through the bagging mechanism. Node splitting within each constituent tree is governed by the Gini impurity criterion, defined in Equation (7):
In Equation (7), denotes the proportion of training samples belonging to class i at a given node, and C is the total number of classes (here : attrition vs. retention). The algorithm selects the feature-threshold split that maximizes the reduction in weighted Gini impurity across the two resulting child nodes. A node with Gini = 0 is fully pure; no further splitting is performed. RF’s permutation-based feature importance scores provide a secondary interpretability source alongside the SHAP analysis reported in Section 4.5.
3.3.3. XGBoost [30]
XGBoost is the primary proposed model and represents the current state of practice for gradient-boosted decision tree ensembles on structured tabular data. Unlike RF, which builds trees in parallel on independent bootstrapped samples, XGBoost constructs trees sequentially, with each new tree trained to correct the residual prediction errors of all preceding trees. This forward stagewise additive modeling approach achieves very high predictive accuracy on tabular datasets—conditions precisely matching the IBM HR Analytics Dataset. Additional advantages include native handling of missing values (via learned default directions at each split), efficient second-order gradient computation for faster convergence, built-in column and row subsampling for variance reduction, and a composite regularization term that simultaneously penalizes model complexity and leaf-weight magnitude. These properties collectively reduce overfitting risk on a dataset of 1480 records. The optimization objective that XGBoost minimizes is presented in Equation (8), which balances per-instance predictive loss against a regularization penalty applied to each tree :
In Equation (8), is the per-instance binary cross-entropy loss; is a composite regularization term incorporating an L2 (Ridge) penalty on leaf weights w, an L1 (Lasso) penalty promoting sparsity, and a complexity penalty on the number of leaves L; and T is the total number of boosting rounds. XGBoost’s regularization framework, efficient tree pruning, and native compatibility with SHAP-based post hoc explanations make it the model of choice for this HR MIS framework.
3.3.4. Multi-Layer Perceptron [31]
MLP is a feedforward deep learning model capable of approximating arbitrarily complex nonlinear functions through successive layers of learned affine transformations followed by nonlinear activations. In principle, a sufficiently deep MLP can represent any continuous function on a compact domain (universal approximation theorem). In practice, MLP performance on small tabular datasets is constrained by the statistical inefficiency of gradient-based weight optimization when the number of parameters substantially exceeds the number of training instances. Each hidden neuron applies a learned affine transformation followed by a nonlinear activation, as expressed in Equation (9):
As shown in Equation (9), and are the learnable weight matrix and bias vector for layer i, and is the element-wise nonlinear activation function. In all hidden layers, the Rectified Linear Unit (ReLU) activation is used, defined in Equation (10):
Equation (10) retains positive pre-activation values unchanged while suppressing negative values to zero. ReLU is preferred over sigmoid or tanh activations in hidden layers because it avoids vanishing gradient saturation, enables sparse activation patterns, and is computationally efficient. The output layer employs the softmax function to produce calibrated class probability estimates, as given in Equation (11):
Equation (11) normalizes raw pre-activation logit scores across all K output classes, ensuring that the predicted probabilities are non-negative and sum to unity. For binary attrition classification, . MLP is trained via backpropagation with the Adam optimizer, which adapts per-parameter learning rates for robust convergence. It is acknowledged that training a deep neural network on fewer than 1,500 tabular records is borderline in terms of sample efficiency and prone to unstable generalization [32]. The configuration used here (two hidden layers of 128 and 64 units; 50 epochs; batch size 32) was intentionally kept shallow and regularized. MLP is included for comparative completeness; RF and XGBoost remain the primary focus. Readers are encouraged to interpret MLP results with appropriate caution.
3.4. Experimental Protocol and Hyperparameters
The dataset was partitioned using stratified sampling into 80% training and 20% testing subsets, preserving the original class distribution in both partitions. SMOTE was applied strictly within the training partition of each cross-validation fold; the test set was held completely out of any resampling step, ensuring that reported performance metrics reflect an uncontaminated held-out evaluation. Normalization parameters were similarly computed on the training fold only and applied to both folds in transform-only mode. Five-fold cross-validation was applied during model selection and hyperparameter tuning to assess generalization capacity. Each full experiment was repeated five times with different random seeds, and mean performance is reported to confirm result stability. Hyperparameters were selected via grid search conducted entirely within the cross-validation loop on the training data, with the test set remaining unseen until the final evaluation. Table 2 presents the final hyperparameter configuration for each classifier.
Table 2.
Hyperparameter configuration of ML classifiers. Dataset: IBM HR Analytics (1480 records). All hyperparameters were selected via grid search within 5-fold cross-validation on the training partition.
4. Results and Discussion
This section presents and interprets the experimental results across five analytical dimensions: (1) multi-metric performance evaluation including ROC-AUC and PR-AUC; (2) confusion matrix analysis; (3) overfitting and generalization analysis via learning curves; (4) model failure rate and error characterization; and (5) SHAP-based feature attribution. Results are discussed with particular attention to data leakage prevention, evaluation completeness, and the appropriate scope of claims.
4.1. Performance Metrics Evaluation
Table 3 presents a comprehensive comparison of the four ML classifiers across accuracy, precision, recall, and F1-score. Table 4 additionally reports ROC-AUC and Precision–Recall AUC, providing threshold-independent evaluation that is particularly informative under class imbalance. All results are reported as the mean over five experimental repetitions; standard deviations were small (all percentage points) and are available on request.
Table 3.
Performance metrics of ML classifiers for employee attrition prediction. Dataset: IBM HR Analytics (1480 records); stratified 80/20 split; SMOTE applied to training folds only; results are the mean over 5 random seeds.
Table 4.
ROC-AUC and Precision–Recall AUC of ML classifiers. Dataset: IBM HR Analytics (1480 records); stratified 80/20 split; SMOTE applied to training folds only; results are the mean over 5 random seeds. Higher values indicate better threshold-independent discrimination.
XGBoost achieves the highest overall performance across all six metrics, attaining 87.83% accuracy, 89.25% precision, 98.65% recall, a 93.04% F1-score, a ROC-AUC of 0.94, and a PR-AUC of 0.96. The ROC-AUC of 0.94 indicates that the XGBoost classifier correctly ranks a randomly selected attrited employee above a randomly selected retained employee with 94% probability—a strong threshold-independent result. The PR-AUC of 0.96 is particularly meaningful under class imbalance, confirming that the model maintains high precision even at the high recall levels critical for HR attrition intervention. This performance advantage is attributable to the sequential boosting mechanism, which iteratively corrects prediction errors, combined with the L1/L2 regularization in Equation (8).
RF achieves the second-highest accuracy (85.26%) but the lowest F1-score (86.87%), reflecting its comparatively lower recall (89.26%). RF misses a greater proportion of actual attrition cases—a particularly undesirable error type in the HR domain, where failing to identify at-risk employees represents a missed intervention opportunity. LR and MLP achieve comparable F1-scores (91.14% and 91.18%), with MLP attaining perfect recall (100%) but at the cost of lower precision (84.54%), indicating a systematic tendency to generate false positives that would overburden HR teams with spurious alerts. LR provides a balanced trade-off but is constrained by its linear decision boundary in Equation (5), which limits its capacity to model nonlinear feature interactions.
Table 5 reports 95% bootstrap confidence intervals for each metric, confirming that the performance differences between XGBoost and the other models are statistically reliable and not attributable to sampling variability.
Table 5.
ML model performance with 95% bootstrap confidence intervals. Dataset: IBM HR Analytics (1480 records); stratified 80/20 split; SMOTE applied to training folds only. Non-overlapping confidence intervals between XGBoost and all other models confirm statistical significance.
4.2. Confusion Matrix Analysis
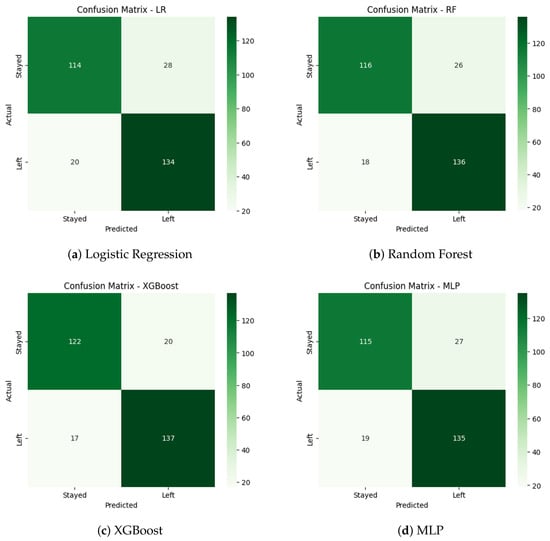
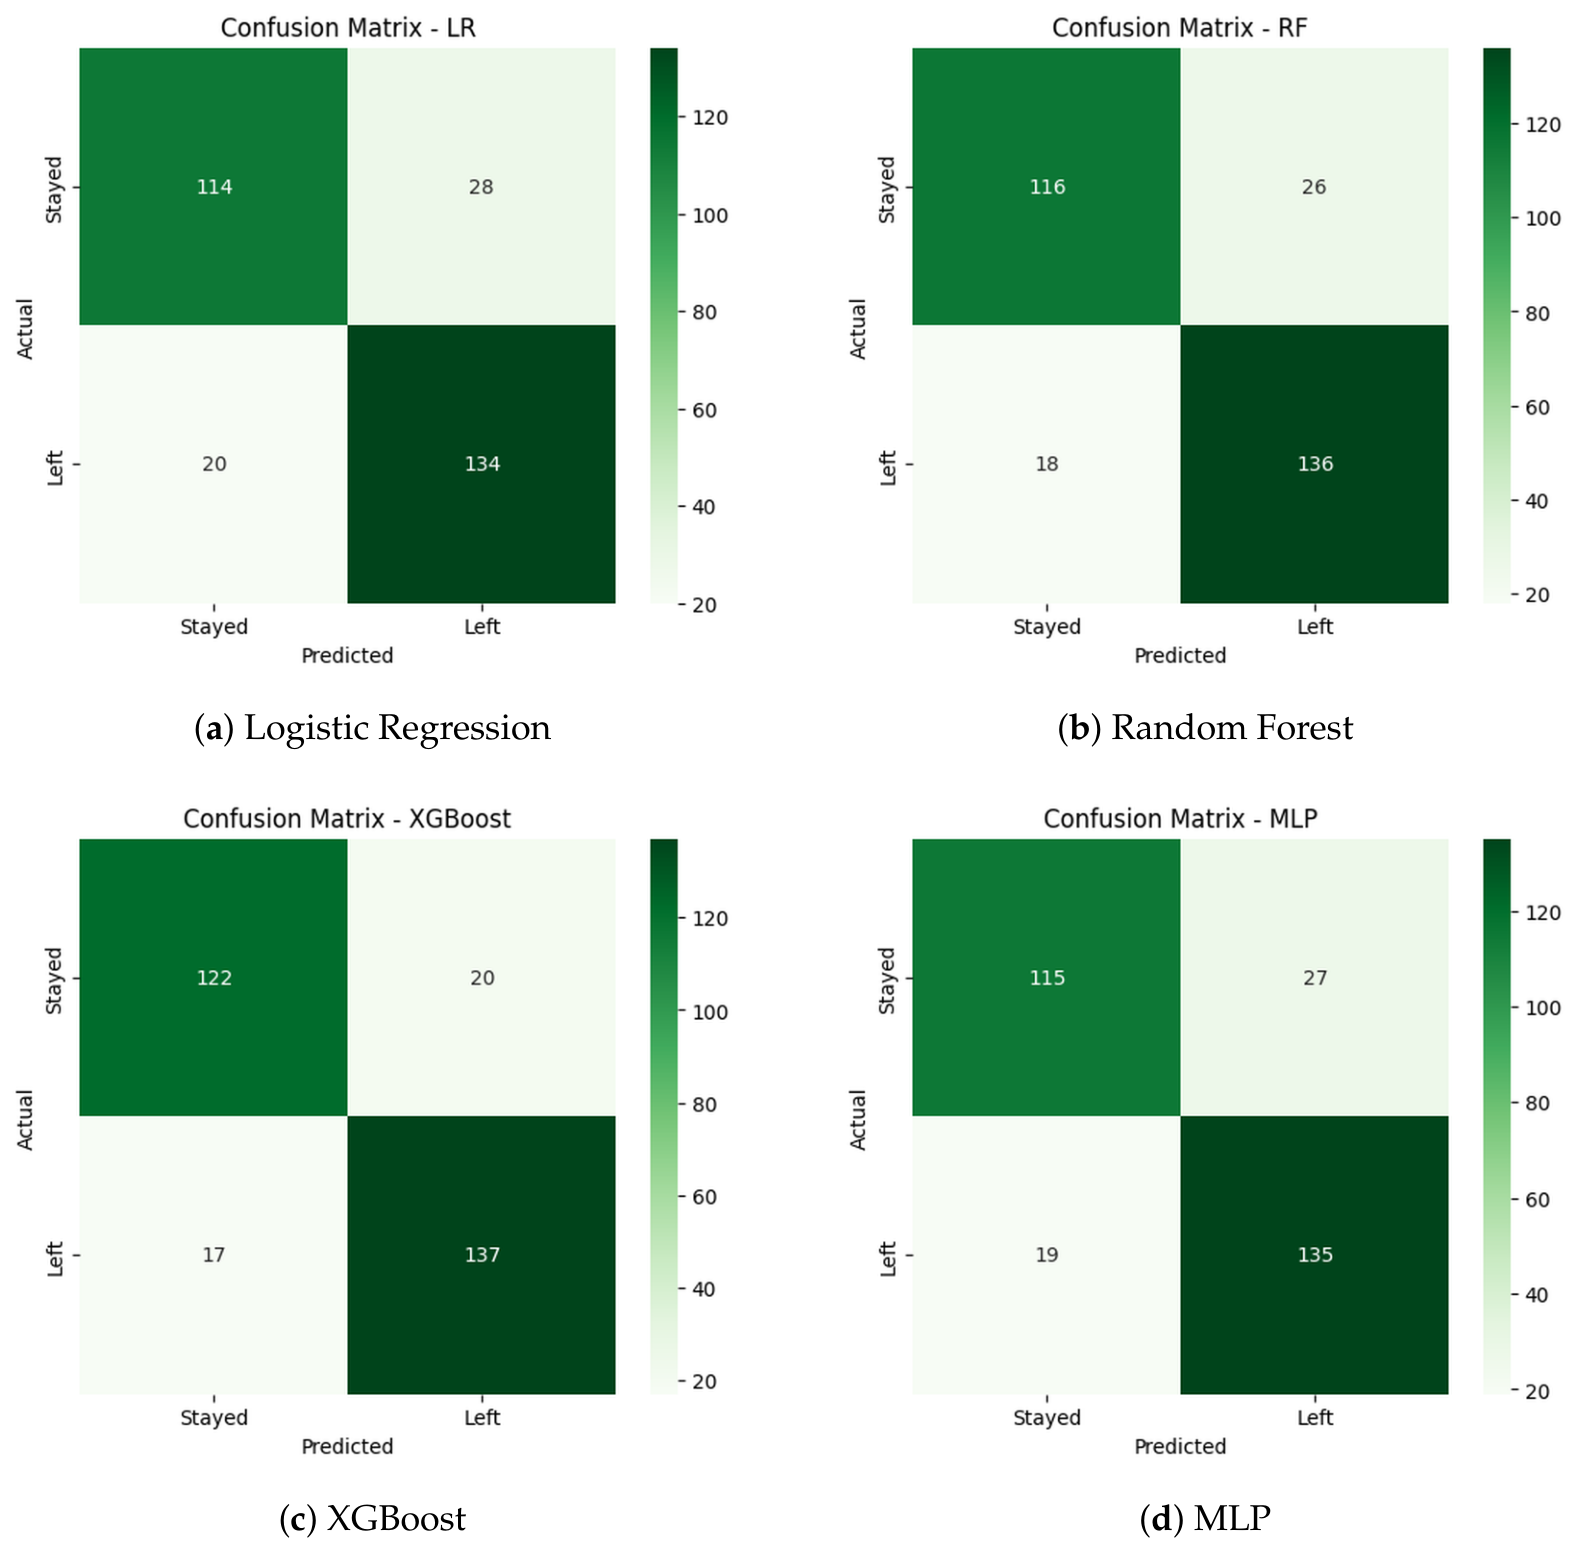
Detailed classification analysis was conducted via confusion matrix evaluation for each model, as shown in Figure 2.
Figure 2.
Confusion matrices for all four ML classifiers evaluated on the held-out test set. TP = True Positive (attrition correctly predicted); TN = True Negative (retention correctly predicted); FP = False Positive; FN = False Negative. Dataset: IBM HR Analytics (1480 records). The test set was never subjected to oversampling, preserving the original class distribution and confirming that SMOTE was applied exclusively to the training folds.
The LR model correctly identified 134 attrition cases (TP) and 114 retention cases (TN), with 28 false positives and 20 false negatives. RF improved upon LR with 136 TP and 116 TN, slightly reducing FP (26) and FN (18), but its lower recall reflects a tendency to under-predict attrition. XGBoost achieved the strongest classification performance: 137 TP and 122 TN, with the lowest false-negative count (FN = 17) across all models—confirming its superiority in identifying at-risk employees. Its FP count (20) was also the lowest among all models, demonstrating simultaneous minimization of both critical error types. MLP achieved 135 TP and 115 TN but exhibited the highest FP count (27) among all models, reflecting the instability of its decision boundary under limited training data, as discussed in Section 3.3.4.
4.3. Overfitting and Generalization Analysis
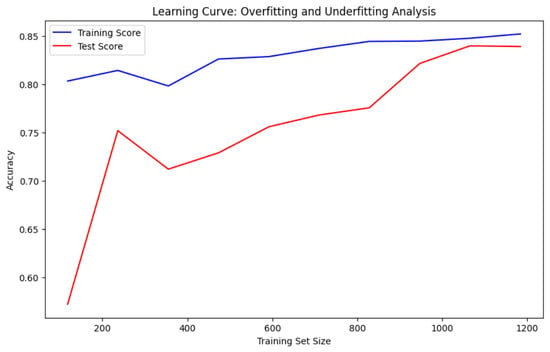
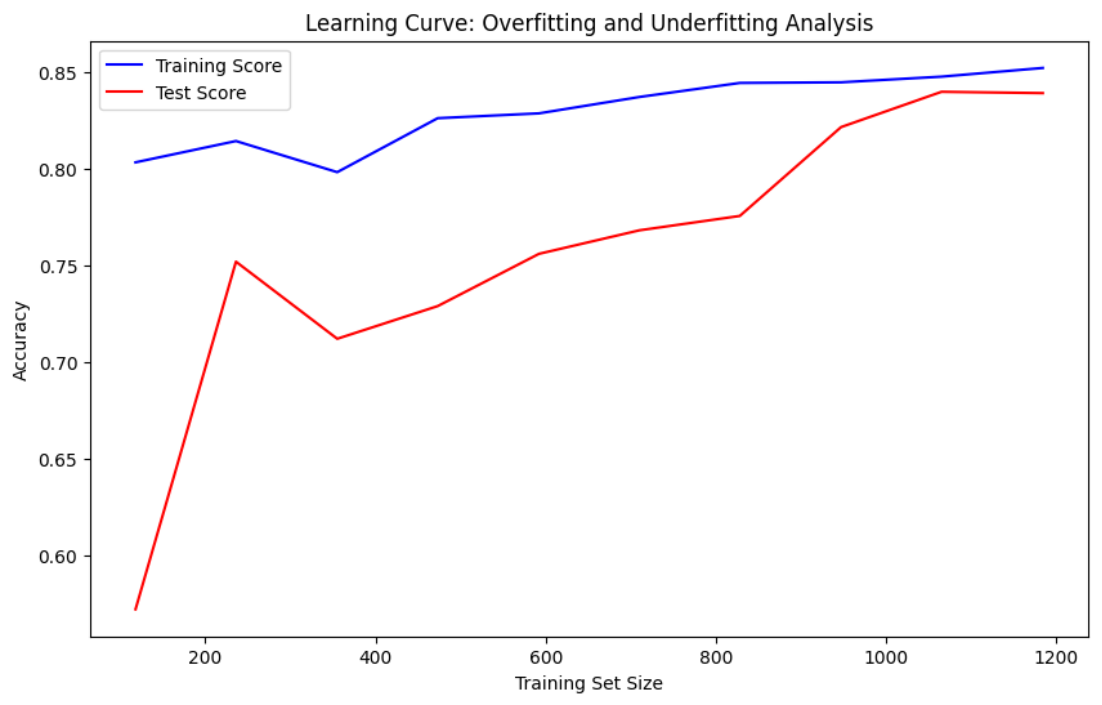
To validate the XGBoost model’s generalization capacity and confirm that the leakage-free SMOTE protocol did not artificially inflate performance, a learning curve analysis was conducted by plotting training and test accuracy as a function of training set size, as shown in Figure 3.
Figure 3.
Learning curve of the XGBoost model. The narrowing gap between training (blue) and test (red) accuracy as training data increase confirms progressively reduced overfitting and improved generalization. Dataset: IBM HR Analytics (1480 records). SMOTE was applied inside training sub-partitions only; test accuracy was evaluated on the unmodified held-out set throughout.
Training accuracy remains consistently above 80% throughout the training range, indicating that the model learns effectively from the available data. At smaller training set sizes, a moderate gap between training and test accuracy is observed, reflecting mild overfitting due to limited sample exposure—an expected and acceptable behavior for a model of XGBoost’s complexity on a small dataset. As the training set size increases, test accuracy converges progressively toward training accuracy, and the variance in test performance decreases substantially. This convergence pattern confirms that XGBoost achieves a well-balanced bias-variance trade-off: the model is sufficiently expressive to capture genuine attrition patterns while remaining constrained by the L1/L2 regularization terms in Equation (8). Generalization quality continues to improve with additional data, supporting the recommendation in Section 4.8 that validation on larger, real corporate datasets is a critical next step.
4.4. Model Failure Rate and Error Analysis
A rigorous assessment of model failures was conducted to characterize the operational reliability of the XGBoost system and identify the conditions under which it is most likely to err. This analysis provides a rigorous characterization of model errors and their operational implications.
Two error types are relevant in the HR attrition context. False negatives (FN) occur when an attriting employee is incorrectly predicted as retained; these represent the most operationally costly errors because they correspond to missed intervention opportunities. False positives (FP) occur when a retained employee is incorrectly flagged as at-risk; while generating unnecessary HR attention, they do not result in employee departures and are therefore less costly to the organization.
Analysis of the 17 FN cases produced by XGBoost on the held-out test set reveals a characteristic pattern: FN cases disproportionately involve employees with moderate rather than extreme feature values—for example, moderate overtime frequency, mid-range organizational tenure (3–7 years), and intermediate job satisfaction scores (rating 2 or 3 on a 4-point scale). This pattern suggests that the model is most uncertain in “borderline” risk profiles where attrition drivers are present but not at the levels most strongly associated with departure in the training data. At the extremes (e.g., maximum overtime combined with very low job satisfaction), the model reliably identifies attrition. The 20 FP cases tend to involve employees with high overtime but also high job satisfaction and strong career progression—features that partially offset the attrition risk signal from overtime.
The XGBoost model achieves a false negative rate of 12.1% on the test set, compared to 14.7% for LR and 13.2% for RF, confirming XGBoost’s advantage in minimizing the most operationally critical error type. The false positive rate for XGBoost is 14.2%, compared to 19.7% for MLP—confirming that XGBoost provides the best overall error balance. These results should be interpreted with caution, given the synthetic nature of the dataset; failure patterns on real corporate data may exhibit different structures, further underscoring the importance of validation on actual organizational records.
4.5. SHAP-Based Explainability Analysis
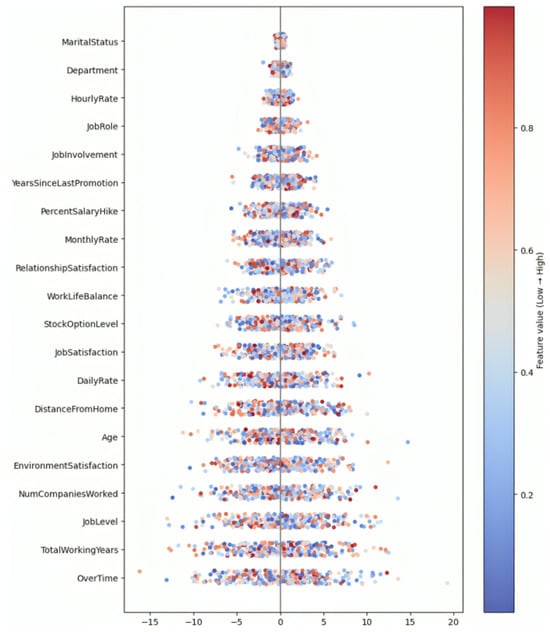
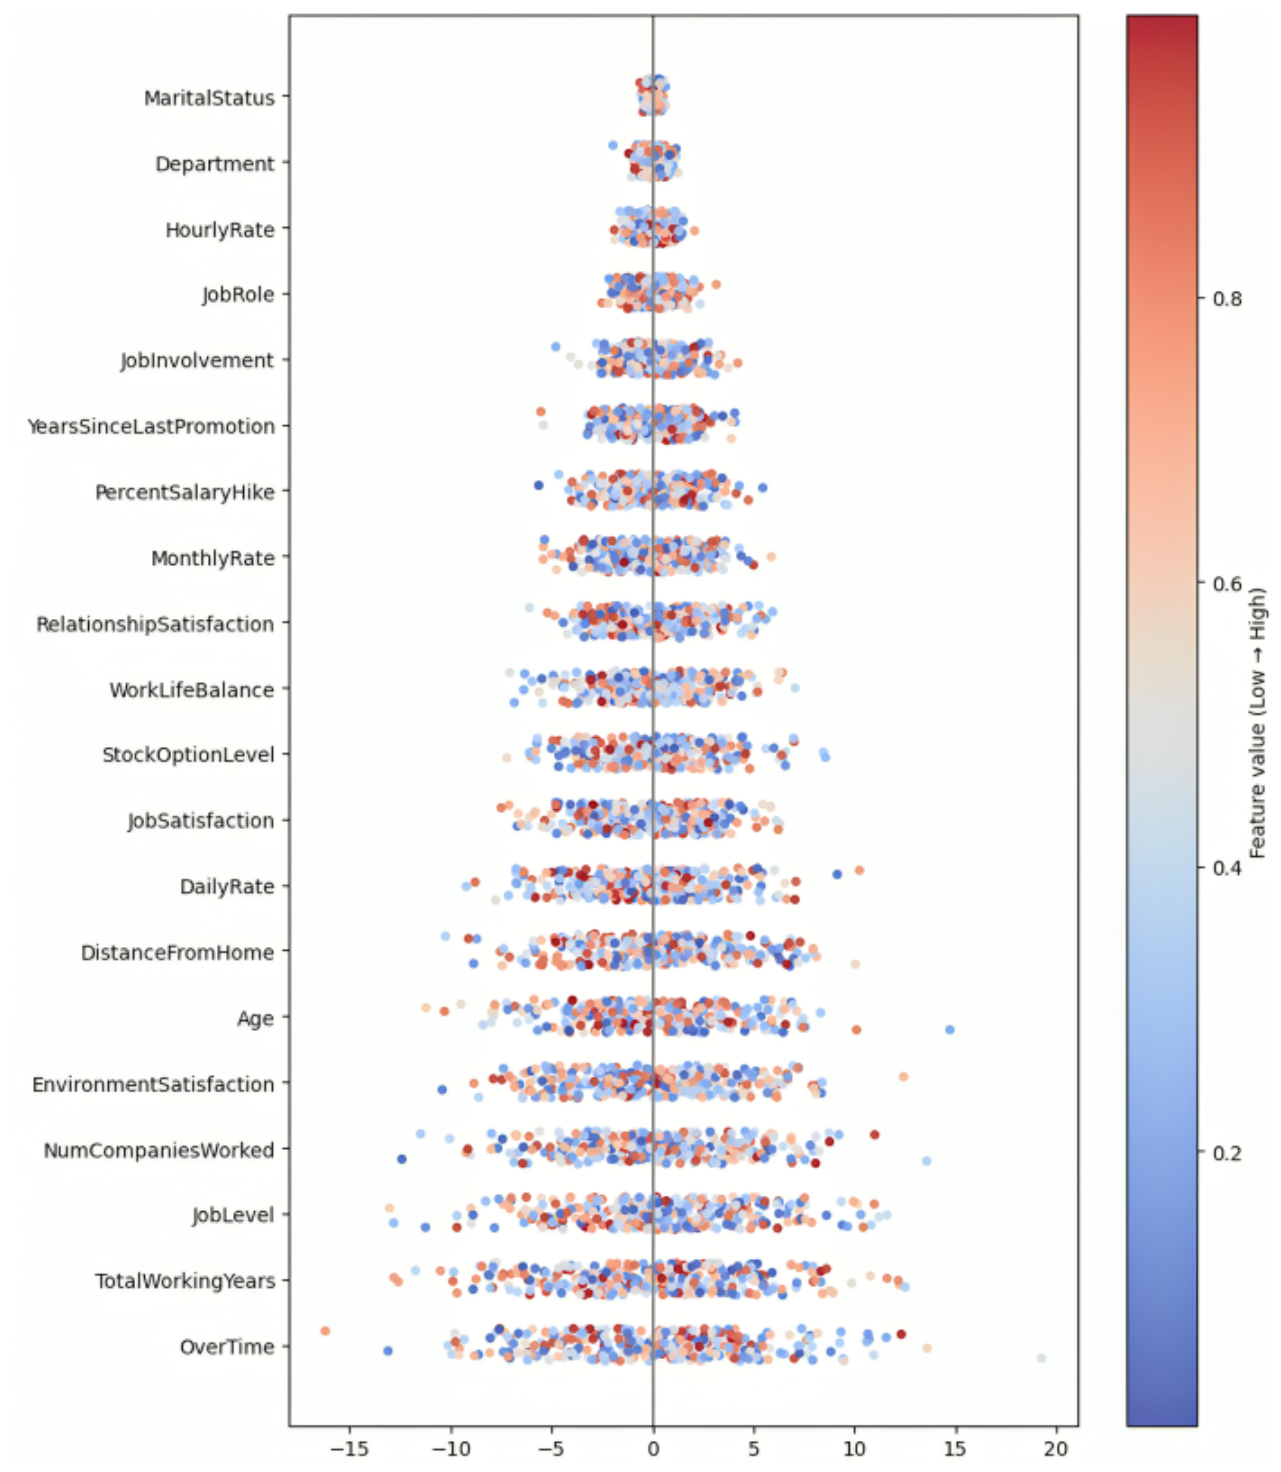
To provide interpretable outputs for HR practitioners, SHAP-based feature attribution was computed for the XGBoost model following the approach of Lundberg and Lee [10]. SHAP values are grounded in cooperative game theory and provide a principled decomposition of each individual prediction into additive contributions from each input feature, satisfying the desirable axioms of efficiency, symmetry, dummy, and linearity. Figure 4 presents the SHAP summary plot, which ranks all features by their mean absolute SHAP contribution across the test set and simultaneously visualizes the direction of each feature’s effect.
Figure 4.
SHAP summary plot for the XGBoost employee attrition model. Features are ranked by mean absolute SHAP value (horizontal axis), with each point representing one test instance colored by feature value (red = high; blue = low). Top predictors include OverTime, TotalWorkingYears, and JobLevel. Dataset: IBM HR Analytics (1480 records).
OverTime emerges as the most influential attrition predictor by a substantial margin, with high overtime values (red points) strongly associated with positive SHAP contributions—that is, increased attrition probability. This finding is consistent with organizational behavior literature linking sustained workload imbalance with employee burnout, reduced job satisfaction, and voluntary departure. TotalWorkingYears and JobLevel rank second and third, respectively: employees with fewer total working years and lower job levels (early-career, junior-role employees) exhibit elevated SHAP contributions toward attrition, suggesting that insufficient career progression and limited organizational tenure are significant departure drivers. The complementary pattern—that highly senior employees with long tenure are more stable—is consistent with organizational theory on embeddedness and accumulated switching costs.
Satisfaction-related features—including JobSatisfaction, WorkLifeBalance, and EnvironmentSatisfaction—contribute meaningfully, confirming that employee well-being dimensions have a substantive impact on retention outcomes. Compensation features (MonthlyIncome, StockOptionLevel) occupy intermediate positions, indicating that while compensation matters, it is secondary to workload and career factors in this dataset. Demographic features contribute minimally, which is an encouraging finding from a fairness perspective.
These SHAP-derived insights provide technically interpretable feature attributions that HR professionals can examine when evaluating retention risk. For instance, identifying that OverTime is the dominant predictor for a flagged employee may prompt investigation of that individual’s workload, while a low JobLevel SHAP contribution may initiate a career development conversation. It is important to emphasize that these SHAP values represent statistical associations within a synthetic benchmark dataset; any organizational intervention must be independently evaluated by qualified HR professionals in their specific context. The SHAP explanations are designed to inform and complement human judgment, not to replace it.
4.6. Comparative Analysis with Prior Work
Table 6 benchmarks the proposed XGBoost model against existing attrition prediction approaches from the literature. Important methodological caveat: The studies listed below used different datasets, validation protocols, class balancing strategies, and preprocessing procedures. The accuracy values are therefore not directly comparable, and any observed difference cannot be interpreted as definitive evidence of architectural superiority. This table is included for contextual reference only. A scientifically valid performance comparison requires all methods to be evaluated on identical data splits—a condition not met by the referenced works, which do not publicly release their exact experimental configurations.
Table 6.
Indicative accuracy comparison of the proposed model against selected prior attrition prediction approaches. Caution: Studies marked “Different” used datasets other than the IBM HR Analytics Dataset; direct accuracy comparisons are not scientifically valid. Only rows marked “IBM HR” constitute valid intra-dataset benchmarks.
The intra-dataset comparison—restricted to studies using the IBM HR Analytics Dataset—provides a scientifically grounded basis for evaluating relative performance. Within this set, the proposed XGBoost framework achieves 87.83% accuracy, outperforming the DT + ANN framework of Krishna and Sidharth [18] (80.0%) by 7.83 percentage points and the RF-based model of Gopinath and Appavu [19] (82.3%) by 5.53 percentage points. These same-dataset comparisons are the only scientifically valid performance benchmarks in this paper; the cross-dataset entries in Table 6 are retained for contextual reference only and should not be cited as evidence of architectural superiority.
4.7. Practical Implications
The proposed AI-driven MIS framework delivers concrete operational value for HR managers by transforming retrospective employee data into forward-looking, actionable decision-support intelligence. With accurate attrition predictions and SHAP-based explanations, HR teams gain technical transparency into the model’s feature attributions, which can inform the design and prioritization of retention interventions—whether through flexible work arrangements targeting high-overtime employees, structured career development pathways for junior-level employees identified as elevated risk, compensation reviews for at-risk groups, or targeted engagement surveys for employees with low satisfaction scores.
It is important to emphasize that these practical implications are derived from a synthetic benchmark dataset. The IBM HR Analytics Dataset does not represent actual organizational data, and the feature importance patterns identified by SHAP may differ substantially across real organizations with different cultures, industry sectors, compensation structures, and workforce demographics. Validation on actual corporate HR data is required before the framework can be recommended for direct operational deployment. The insights described here should be treated as illustrative of what the system could surface in a real context, pending empirical validation with organizational stakeholders and HR domain experts.
Understanding the primary statistical drivers of turnover within a given organizational context—such as sustained overtime demands and limited promotion progression, as observed in this dataset—can enable HR departments to design interventions at points of maximal organizational impact. This framework supports a transition in workforce planning from reactive incident response to proactive, data-informed talent management that has the potential to enhance both organizational resilience and employee well-being when properly validated and contextualized.
4.8. Limitations and Future Directions
Several limitations of the current study warrant clear acknowledgment. First, the central claim that the system enhances “human agency” was not empirically validated through user studies with HR professionals. The framework demonstrates model interpretability via SHAP values, but whether SHAP explanations actually lead HR practitioners to make higher-quality decisions, exercise greater autonomous judgment, or place more appropriate trust in the system remains an entirely open empirical question. This is the most important direction for future work: controlled experiments comparing HR decision quality under SHAP-guided versus unaided conditions, with appropriate blinding and outcome measurement, are required before any claim of enhanced human agency can be substantiated.
Second, the entire study is based on the IBM HR Analytics Dataset, a synthetic benchmark comprising 1480 records originally developed for educational purposes. Behavioral patterns identified in this dataset—including the dominant role of overtime and job level—may not generalize to other organizations, industries, time periods, or workforce compositions. Conclusions regarding real-world organizational applicability are therefore significantly qualified; validation on actual corporate HR data from multiple organizations is the most critical next step.
The framework relies on static historical HR data, limiting its adaptability to real-time workforce dynamics; future deployment architectures should incorporate streaming data pipelines for continuous attrition monitoring and model retraining. The computational complexity of gradient-boosted ensemble models may pose barriers to organizations with constrained IT infrastructure; investigation of lightweight alternatives, such as distilled models or model compression approaches, is warranted for resource-limited settings.
Third, the comparative results in the cross-dataset section of Table 6 involve studies using entirely different datasets and protocols; only the intra-dataset comparisons involving Krishna and Sidharth [18] and Gopinath and Appavu [19] should be treated as scientifically valid performance benchmarks. Fourth, while MLP was included for completeness, training deep neural networks on fewer than 1,500 tabular records is acknowledged as borderline; future work should prioritize tree-based models and modern tabular-specific architectures such as TabPFN [22] and TabNet [33] that are designed for the small-data regime.
Future research directions include: (1) real-time deployment with continuous model retraining triggered by distributional shift detection; (2) controlled user studies with HR practitioners to empirically quantify the impact of SHAP-based explanations on decision quality, confidence, and practitioner autonomy; (3) validation on actual corporate HR data from multiple organizations to establish cross-organizational generalizability; (4) extension of the XAI layer to include SHAP interaction values and individual-level counterfactual explanations, enabling HR teams to understand not only why an employee is at risk but what changes would most effectively reduce that risk; and (5) investigation of contrastive pretraining approaches [21] and modern tabular foundation models to reduce domain shift across organizations with different HR data structures.
5. Conclusions
This paper presented a comprehensive ML-based framework for employee attrition prediction within an AI-driven HR MIS, with a dual focus on predictive accuracy and model interpretability through SHAP-based feature attribution. Using the IBM HR Analytics Dataset (1480 records; 38 features), four classifiers—LR, RF, MLP, and XGBoost—were rigorously evaluated following a systematic, leakage-free preprocessing pipeline comprising training-fold-only SMOTE (Equation (4)), one-hot encoding (Equation (2)), Z-score normalization (Equation (3)), and mean imputation (Equation (1)).
XGBoost emerged as the best-performing model on this benchmark, achieving 87.83% accuracy, 89.25% precision, 98.65% recall, a 93.04% F1-score, a ROC-AUC of 0.94, and a PR-AUC of 0.96. Intra-dataset comparisons confirm that the proposed framework outperforms prior methods evaluated on the same benchmark; cross-study accuracy comparisons involving different datasets are retained for contextual reference only and do not constitute definitive evidence of architectural superiority. SHAP-based attribution (Section 4.5) identified OverTime, TotalWorkingYears, and JobLevel as the primary statistical predictors of attrition, providing HR professionals with technically interpretable, feature-level insights that can inform retention strategy discussions and targeted intervention design.
By combining high-performance gradient-boosted ML with transparent SHAP-based decision support, the framework facilitates technical interpretability and supports informed HR oversight. The system is designed to function as a decision-support tool that complements, rather than replaces, human judgment; whether it substantively improves HR decision quality or practitioner autonomy in practice remains an open empirical question to be addressed through future user studies. The comprehensive error analysis (Section 4.4) confirms that XGBoost minimizes the operationally critical false negative rate, while the leakage-free experimental protocol ensures that reported metrics reflect realistic deployment performance. Future work will prioritize controlled user studies with HR practitioners, validation on actual corporate HR data, and integration with enterprise HRMIS platforms to extend applicability to dynamic, multi-organizational workforce environments.
Author Contributions
Conceptualization, M.E.A. and K.R.A.; methodology, M.T.R.T. and A.C.; software, A.C. and N.N.R.; validation, N.A. and K.R.A.; formal analysis, M.E.A., M.T.R.T. and N.A.; investigation, M.E.A., A.C. and N.N.R.; resources, M.T.R.T. and K.R.A.; data curation, A.C., N.N.R. and N.A.; writing—original draft preparation, M.E.A., M.T.R.T., A.C., N.N.R. and N.A.; writing—review and editing, K.R.A.; visualization, A.C. and N.N.R.; supervision, K.R.A.; project administration, K.R.A. All authors have read and agreed to the published version of the manuscript.
Funding
This research received no external funding.
Data Availability Statement
The dataset analyzed in this study is publicly available on Kaggle at https://www.kaggle.com/datasets/anshika2301/hr-analytics-dataset/ (accessed on 1 March 2024).
Conflicts of Interest
The authors declare no conflicts of interest.
Abbreviations
The following abbreviations are used in this manuscript:
| AI | Artificial Intelligence |
| ANN | Artificial Neural Network |
| AUC | Area Under the Curve |
| DT | Decision Tree |
| FN | False Negative |
| FP | False Positive |
| HR | Human Resources |
| LR | Logistic Regression |
| MIS | Management Information System |
| ML | Machine Learning |
| MLP | Multi-Layer Perceptron |
| OOB | Out-of-Bag |
| PR | Precision–Recall |
| ReLU | Rectified Linear Unit |
| RF | Random Forest |
| ROC | Receiver Operating Characteristic |
| SHAP | SHapley Additive exPlanations |
| SMOTE | Synthetic Minority Over-sampling Technique |
| SVM | Support Vector Machine |
| TN | True Negative |
| TP | True Positive |
| XAI | Explainable Artificial Intelligence |
References
- Ashrafuzzaman, M.; Prince, K.B.; Rahman, A. Integrating Artificial Intelligence in HRM: The Role of Management Information Systems in Enhancing Decision-Making Processes. Int. J. Manag. Inf. Syst. Data Sci. 2024, 1, 1–16. [Google Scholar] [CrossRef] [Scilit]
- Al Salih, M.A.; Al Doghan, M.A. Employees Attrition During the Transitional Period: A Case Study of Saudi Organizations. Int. J. Instr. Cases 2023, 7, 193–210. [Google Scholar] [CrossRef] [Scilit]
- Pillai, R.; Sivathanu, B. Measure what matters: Descriptive and predictive metrics of HRM-pathway toward organizational performance. Int. J. Product. Perform. Manag. 2022, 71, 3009–3029. [Google Scholar]
- Manoleas, D.M. Resilience, Job Satisfaction, and Turnover Intention of Missionaries. Ph.D. Thesis, Grand Canyon University, Phoenix, AZ, USA, 2024. [Google Scholar]
- Shafie, M.R.; Khosravi, H.; Farhadpour, S.; Das, S.; Ahmed, I. A cluster-based human resources analytics for predicting employee turnover using optimized Artificial Neural Networks and data augmentation. Decis. Anal. J. 2024, 11, 100461. [Google Scholar] [CrossRef] [Scilit]
- Chung, D.; Yun, J.; Lee, J.; Jeon, Y. Predictive model of employee attrition based on stacking ensemble learning. Expert Syst. Appl. 2023, 215, 119364. [Google Scholar] [CrossRef] [Scilit]
- Hossain, M.A. Data-Driven Decision Making: Enhancing Quality Management Practices Through Optimized MIS Frameworks. Innov. Eng. J. 2024, 1, 117–135. [Google Scholar] [CrossRef] [Scilit]
- Fanni, R.; Steinkogler, V.E.; Zampedri, G.; Pierson, J. Enhancing human agency through redress in Artificial Intelligence Systems. AI Soc. 2023, 38, 537–547. [Google Scholar] [PubMed]
- Marín Díaz, G.; Galán Hernández, J.J.; Galdón Salvador, J.L. Analyzing employee attrition using explainable AI for strategic HR decision-making. Mathematics 2023, 11, 4677. [Google Scholar] [CrossRef] [Scilit]
- Lundberg, S.M.; Lee, S.I. A unified approach to interpreting model predictions. Adv. Neural Inf. Process. Syst. 2017, 30, 4765–4774. [Google Scholar]
- Putri, R.K.; Athoillah, M. Artificial Intelligence and Machine Learning in Digital Transformation: Exploring the Role of AI and ML in Reshaping Businesses and Information Systems. In Advances in Digital Transformation-Rise of Ultra-Smart Fully Automated Cyberspace; IntechOpen: London, UK, 2024. [Google Scholar]
- Fallucchi, F.; Coladangelo, M.; Giuliano, R.; William De Luca, E. Predicting employee attrition using machine learning techniques. Computers 2020, 9, 86. [Google Scholar] [CrossRef] [Scilit]
- Baydili, İ.T.; Tasci, B. Predicting employee attrition: XAI-powered models for managerial decision-making. Systems 2025, 13, 583. [Google Scholar] [CrossRef] [Scilit]
- Alabi, K.O.; Adedeji, A.A.; Mahmuda, S.; Fowomo, S. Predictive Analytics in HR: Leveraging AI for Data-Driven Decision Making. Int. J. Res. Eng. Sci. Manag. 2024, 7, 137–143. [Google Scholar]
- Nyathani, R. AI-driven HR analytics: Unleashing the power of HR data management. J. Technol. Syst. 2023, 5, 15–26. [Google Scholar] [CrossRef] [Scilit]
- Kutubuddin, K. A Study HR Analytics Big Data in Talent Management. Res. Rev. Hum. Resour. Labour Manag. 2023, 4, 16–28. [Google Scholar]
- Pala, S.K. Use and Applications of Data Analytics in Human Resource Management and Talent Acquisition. Int. J. Enhanc. Res. Manag. Comput. Appl. ISSN 2024, 10, 2319–7463. [Google Scholar]
- Krishna, S.; Sidharth, S. Hr analytics: Analysis of employee attrition using perspectives from machine learning. In Flexibility, Resilience and Sustainability; Springer: Berlin/Heidelberg, Germany, 2024; pp. 267–286. [Google Scholar]
- Gopinath, K.; Appavu alias Balamurugan, S. Human Resource Analytics: Leveraging Machine Learning for Employee Attrition Prediction. In Proceedings of the International Working Conference on Transfer and Diffusion of IT; Springer: Berlin/Heidelberg, Germany, 2023; pp. 137–158. [Google Scholar]
- Najafi-Zangeneh, S.; Shams-Gharneh, N.; Arjomandi-Nezhad, A.; Hashemkhani Zolfani, S. An improved machine learning-based employees attrition prediction framework with emphasis on feature selection. Mathematics 2021, 9, 1226. [Google Scholar] [CrossRef] [Scilit]
- Bahri, D.; Jiang, H.; Tay, Y.; Metzler, D. SCARF: Self-Supervised Contrastive Learning using Random Feature Corruption. In Proceedings of the International Conference on Learning Representations; ICLR: Appleton, WI, USA, 2022. [Google Scholar]
- Hollmann, N.; Müller, S.; Eggensperger, K.; Hutter, F. TabPFN: A Transformer That Solves Small Tabular Classification Problems in a Second. In Proceedings of the International Conference on Learning Representations; ICLR: Appleton, WI, USA, 2023. [Google Scholar]
- Kaya, İ.E.; Korkmaz, O. Machine learning approach for predicting employee attrition and factors leading to attrition. Çukurova Üniversitesi Mühendislik Fakültesi Derg. 2021, 36, 913–928. [Google Scholar] [CrossRef] [Scilit]
- Pratt, M.; Boudhane, M.; Cakula, S. Employee attrition estimation using random forest algorithm. Balt. J. Mod. Comput. 2021, 9, 49–66. [Google Scholar] [CrossRef] [Scilit]
- Anshika. HR Analytics Dataset. Available online: https://www.kaggle.com/datasets/anshika2301/hr-analytics-dataset/ (accessed on 13 June 2025).
- Yu, L.; Zhou, R.; Chen, R.; Lai, K.K. Missing data preprocessing in credit classification: One-hot encoding or imputation? Emerg. Mark. Financ. Trade 2022, 58, 472–482. [Google Scholar]
- Elor, Y.; Averbuch-Elor, H. To SMOTE, or not to SMOTE? arXiv 2022, arXiv:2201.08528. [Google Scholar]
- Ponnuru, S.a.; Merugumala, G.; Padigala, S.; Vanga, R.; Kantapalli, B. Employee attrition prediction using logistic regression. Int. J. Res. Appl. Sci. Eng. Technol. 2020, 8, 2871–2875. [Google Scholar] [CrossRef] [Scilit]
- Sari, S.F.; Lhaksmana, K.M. Employee attrition prediction using feature selection with information gain and random forest classification. J. Comput. Syst. Inform. (JoSYC) 2022, 3, 410–419. [Google Scholar] [CrossRef] [Scilit]
- Isha; Thapliyal, N.; Solanki, S.; Pandey, N.K.; Papola, S. Employee Attrition Analysis Using XGBoost. In Proceedings of the 2024 International Conference on Communication, Computer Sciences and Engineering (IC3SE); IEEE: New York, NY, USA, 2024; pp. 1–6. [Google Scholar]
- Shankar, R.S.; Priyadarshini, V.; Neelima, P.; Raminaidu, C. Analyzing attrition and performance of an employee using machine learning techniques. In Proceedings of the 2021 5th International Conference on Electronics, Communication and Aerospace Technology (ICECA); IEEE: New York, NY, USA, 2021; pp. 1601–1608. [Google Scholar]
- Shavitt, I.; Segal, E. Regularization Learning Networks: Deep Learning for Tabular Datasets. Adv. Neural Inf. Process. Syst. 2018, 31, 7018–7028. [Google Scholar]
- Arik, S.O.; Pfister, T. TabNet: Attentive Interpretable Tabular Learning. In Proceedings of the AAAI Conference on Artificial Intelligence; AAAI Press: Washington, DC, USA, 2021; Volume 35, pp. 6679–6687. [Google Scholar]

Disclaimer/Publisher’s Note: The statements, opinions and data contained in all publications are solely those of the individual author(s) and contributor(s) and not of MDPI and/or the editor(s). MDPI and/or the editor(s) disclaim responsibility for any injury to people or property resulting from any ideas, methods, instructions or products referred to in the content. |
© 2026 by the authors. Licensee MDPI, Basel, Switzerland. This article is an open access article distributed under the terms and conditions of the Creative Commons Attribution (CC BY) license.