


Abstract
This study analyzes the determinants of generative artificial intelligence (GAI) use intensity among the Spanish working population, as well as the possible existence of gender gaps in its adoption. To this end, a conceptual model is proposed that incorporates perceived economic and productive usefulness (PEU), perceived social usefulness (PSU), three dimensions of the Technology Readiness Index—technological optimism (OPTI), innovativeness (INNOV), and insecurity (INSEC)—and three sociodemographic variables: entrepreneurial status, gender, and generational cohort. The model is implemented using artificial neural networks (ANNs) endowed with explanatory capability through Shapley Additive Explanations (SHAP). The application of SHAP enables the assessment of both the global and local importance of the explanatory variables, as well as the potential existence of gender biases in their contribution to GAI use. The results indicate that the most relevant variables are PEU, generational cohort, and INNOV. Although gender does not rank among the most important variables in terms of global importance, women exhibit lower levels of GAI use, and gender-related differences are also observed in the contribution of several explanatory variables. In particular, substantive effect sizes are observed for PSU, OPTI, INSEC, entrepreneurial status, and membership in Generation Y. By contrast, differences associated with especially relevant variables such as PEU and INNOV, as well as membership in Generation Z, do not exhibit meaningful effect sizes.
1. Introduction
The emergence of generative artificial intelligence (GAI) since the early 2020s has decisively transformed both economic and business processes and everyday life [1]. In the productive sphere, GAI opens the door to the automation of cognitive and knowledge-intensive service activities [2], implying a profound shift in the labor market [3]. At the same time, it is driving substantial changes in organizational structures and processes across sectors such as industry [4]. Its potential also extends to everyday life. In healthcare, it can improve quality of care, optimize management, and strengthen health literacy [5]. Moreover, it may contribute to democratizing access to information, education, and public services through personalized support tools [6].
This promise of improved socioeconomic conditions coexists with risks such as occupational displacement, labor market polarization, and the increasing concentration of technological power in large corporations [7]. There are also concerns about the reproduction of algorithmic biases, the generation of misinformation, and the erosion of trust in digital content, as the boundary between human and artificial production becomes increasingly blurred. Its widespread adoption requires a reconsideration of regulatory, educational, and ethical frameworks in order to ensure an equitable and responsible social impact [8,9].
Given that the rise of GAI simultaneously affects everyday life and the practice of numerous professions, analyzing the social drivers and barriers that shape its use among the working population is of particular interest. This study is situated in the Spanish context and draws on data from the macro-survey conducted by the Spanish Centre of Sociological Research on the use of generative artificial intelligence in Spanish society [10]. The explanation of GAI use is structured around two main axes.
The first axis is cognitive in nature and combines classic behavioral approaches, such as the Theory of Planned Behavior (TPB) [11], with more specific theories on innovation acceptance and information systems adoption, such as the Technology Acceptance Model (TAM) [12] and its extension incorporating the Technology Readiness Index (TRI) [13], known as the Technology Readiness Acceptance Model (TRAM) [14].
The second axis incorporates sociodemographic characteristics, specifically entrepreneurial status, gender, and generational cohort. This axis captures personal dimensions that influence both perceived opportunities and evaluative frameworks associated with GAI. While entrepreneurial status may act as an incentive factor for GAI use [15], both gender and age have been widely documented as factors associated with gaps in adoption and use [16,17].
Based on this framework, summarized in Figure 1, two research objectives (ROs) are defined:
Figure 1.
Theoretical groundwork used in this paper.
RO1: To develop a theoretical model explaining the adoption of GAI that can subsequently be empirically estimated. Based on this model, the hierarchy of relevance of the proposed explanatory variables in accounting for GAI use is determined.
RO2: To estimate the magnitude of the gender gap in GAI use. This gap involves both quantifying the effect of gender on use and establishing whether structural gender-based differences exist in the intensity with which the variables affect the outcome.
The estimation of behavioral models such as the one presented in Figure 1 typically relies on regression-based methods. In contrast, this study adopts an approach grounded in artificial neural networks (ANNs), specifically multilayer perceptrons (MLPs). In regression or structural equation models, relationships between variables must be explicitly specified by the researcher, for example, in the form of mediations or moderations. In TRAM, perceived usefulness mediates the influence of optimism, innovativeness, and technological insecurity on use [14], whereas in the unified theory of acceptance and use of technology (UTAUT), sociodemographic variables (such as age or gender) moderate the effect of perceived usefulness or ease of use on behavioral intention [18]. By contrast, ANNs do not require the prior specification of these causal structures, as they can automatically identify nonlinear influence patterns, complex interactions, and emergent effects directly from the data [19]. Furthermore, ANNs have been shown to outperform the predictive performance of regression methods in studies on the acceptance of new information systems, such as mobile money [20], the use of GAI [21], the adoption of blockchain technologies in public infrastructure management [22], and the adoption of Enterprise Resource Planning software by firms [23].
ANNs have traditionally been criticized for their opaque nature, which has limited their use in studies on the acceptance of new information systems, where they are typically employed as a complement to more traditional structural equation modelling approaches [19,24]. However, in recent years, techniques have been developed to enhance the explainability of machine learning and deep learning models, facilitating the inference of the importance of explanatory variables on the outcome. This study employs the Shapley Additive Explanations (SHAP) methodology [25]. SHAP enables the measurement of variable importance at both the local and global levels, thereby translating the outputs of any predictive tool—even if initially considered a black box—into interpretable results. This capability is particularly relevant in behavioral studies such as those on technology adoption [26].
The remainder of the article is structured as follows. The next section develops the theoretical model. Subsequently, the data and analytical methodology are described. The fourth section presents the results. The article concludes with a discussion of these findings and the main conclusions derived from the study.
2. Conceptual Groundwork
2.1. Overview of the Model
The analyzed outcome is the intensity of use of generative artificial intelligence (USE), in contrast to the mainstream literature, which typically focuses on behavioral intention. Although intention to use may approximate actual behavior, the two constructs do not always coincide [27]. In certain technologies, an initial barrier separates intention from effective adoption, whether due to access constraints or the need for a specific purpose to employ the technology. In such cases, prior intention is a prerequisite for action to be carried out, as use must be deliberate and conscious [28].
However, GAI is already integrated into everyday applications such as WhatsApp, into social media platforms such as X, and is immediately accessible through any web browser. This high level of availability substantially lowers the entry threshold, making GAI an easily accessible tool that individuals may routinely turn to when facing cognitive or informational tasks, often as a convenient default option rather than as the result of a fully deliberative evaluation of alternatives. Under these conditions, it is more appropriate to focus the analysis on actual use rather than on behavioral intention [28]. Moreover, this study does not concentrate on a specific type of use (e.g., GAI as a writing assistant), which would imply referring to GAI use within a narrowly defined and premeditated context, but rather on use for multiple purposes, encompassing a broad range of cognitive and creative tasks [29].
In analytical frameworks such as TAM [12] or UTAUT [18], the central variable explaining the use of technological systems is perceived usefulness [30]. This construct refers to the degree to which an individual believes that a technology enhances productivity and efficiency [12]. In the original formulation of TAM, perceived usefulness exerts a decisive influence on attitude toward use, which can be conceptualized as the personal evaluation an individual makes about performing a specific behavior—that is, the extent to which the behavior is perceived as positive or negative, beneficial or harmful [11]. From this perspective, perceived economic and productive usefulness (PEU) and perceived social usefulness (PSU) should be understood as extensions of perceived usefulness that shape the individual’s overall evaluation of GAI.
These two dimensions should be understood as related but analytically distinct. PEU captures perceived benefits that are more directly measurable in productive or economic terms, whereas PSU captures perceived benefits that are more closely linked to social well-being. This distinction is consistent with the well-established differentiation in the literature on development and human welfare between economic performance and social well-being as separate, although interconnected, dimensions of progress [31]. While both contribute to the overall evaluation of GAI, PEU refers to its perceived contribution to outcomes such as employment, sectoral performance, economic efficiency, and productivity, whereas PSU refers to its perceived contribution to broader outcomes such as health, safety, environmental sustainability, and quality of life. This dual perspective is also reflected in influential frameworks such as the Sustainable Development Goals, in which productive and economic objectives such as decent work, growth, and innovation (SDGs 8 and 9) coexist with social and environmental goals related to health, sustainable communities, and climate action (SDGs 3, 11, and 13) [32], as well as in the Human Development Index, which was explicitly designed to move beyond growth-only assessments by incorporating social dimensions such as health and education alongside income [33]. In this sense, PEU captures the perceived economic and productive usefulness of GAI, whereas PSU captures its perceived social usefulness.
In models such as TRAM, factors including technological optimism (OPTI), innovativeness (INNOV), and technological insecurity (INSEC) are conceived as stable traits that condition how individuals evaluate and relate to innovations [13]. These predispositions influence perceptions of key technological attributes, such as relative advantage, complexity, or compatibility [34], ultimately affecting use either directly or indirectly through perceived usefulness [14] and therefore through attitude.
The second group of variables includes employment status (entrepreneur versus salaried worker) and the sociodemographic characteristics of gender and age. The inclusion of gender is justified by the persistence of gaps in technology acceptance [35], which may intensify in the context of GAI [16]. Regarding age, the literature identifies systematic differences across generations: digital natives (Generations Y and Z) show a greater predisposition to adopt information technologies that have emerged since the 1990s compared to older cohorts [36]. In models such as UTAUT and its extensions [18,37], age and gender do not directly affect the acceptance outcome but instead moderate dimensions such as performance expectancy or effort expectancy.
Although regression models and structural equation modelling remain predominant in the analysis of emerging technology acceptance [38], recent years have seen a growing use of ANNs in technology adoption studies, typically as a complement to regression-based approaches rather than as the main analytical method [24]. This practice is common when ANNs are employed solely for predictive purposes, as they have traditionally been associated with black-box models. However, recent advances in explainable machine learning techniques, such as permutation feature importance and SHAP, allow neural models to be used with explicitly explanatory objectives [26]. The latter technique is employed in the present study to provide interpretability to the estimated ANN.
Given that ANNs enable the empirical identification of nonlinear relationships and complex interactions among variables without the need to pre-specify mediation or moderation structures, the hypotheses of this study are oriented toward evaluating the overall effect of the proposed variables on the intensity of GAI use.
2.2. Influence of Variables Linked to Attitude
GAI can be used both to support everyday activities and to perform complex intellectual tasks, giving it significant transformative potential at both the economic and social levels [39]. Perceived usefulness and perceived efficiency have been shown to be particularly relevant in the adoption of AI and, consequently, GAI [40,41], whether among firm employees [42], in AI-powered products [43], or in the educational domain [44,45].
The perceived usefulness of GAI can be justified from two complementary perspectives: on the one hand, its economic and productive usefulness (PEU); on the other, its social usefulness (PSU). As discussed in the previous section, the first dimension reflects the impact of GAI on productive tasks, implying effects on productivity, employment, and economic growth. The second dimension, by contrast, captures impacts of a more social nature. Although both ultimately contribute to human well-being, they represent related but non-overlapping sources of utility, that is, two conceptually distinct dimensions [31,33].
With regard to PEU, GAI tools increase productivity and improve work quality in knowledge-intensive fields [46]. In academia, they assist researchers and educators by automating repetitive tasks, facilitating data analysis, and supporting academic writing, thereby enabling professionals to focus on activities requiring high levels of creativity [47]. GAI can also serve as a key enabling technology in industrial transformation, fostering innovation through applications such as predictive maintenance, supply chain optimization, advanced automation, quality control, and data-driven decision-making [48].
The potential impact of GAI on the labor market is broad but markedly heterogeneous across occupations, which may foster pessimism among many workers. Approximately 33% of occupations could be fully affected by tools such as ChatGPT, while 37% would experience partial impact and 30% would remain unaffected [3]. Thus, the risk of substitution or job degradation in occupations based on standardized cognitive tasks generates substantial labor uncertainty, even in the absence of direct job destruction—particularly in administrative work [49]. Accordingly, we propose:
Hypothesis 1 (H1).
Higher PEU leads to greater GAI use.
Given that GAI can also be embedded in domestic and everyday contexts, another dimension within the broader construct of perceived usefulness is PSU. In daily life, GAI optimizes routine activities such as household management [50] and healthcare services [51]. Natural language models can empower patients by providing continuous access to personalized and comprehensible information, thereby encouraging active participation in healthcare decisions [5,52].
GAI also holds considerable potential for environmental awareness, by delivering clear, accessible, and useful information about ecological issues, reinforcing awareness of their consequences and strengthening moral responsibility [53]. Moreover, it may contribute to public safety by assisting law enforcement agencies in analyzing large volumes of textual data from social media, emails, or online forums, facilitating the detection of patterns relevant to criminal investigations. It can also provide basic information and initial guidance to victims of crime [54].
The literature also warns about the negative impacts of GAI. One frequently cited concern is environmental, as the training and operation of GAI models require substantial amounts of energy and water, generating a significant carbon footprint [29]. In the absence of clear legal frameworks, robust anonymization mechanisms, and transparency in data use, GAI may infringe fundamental rights and erode institutional trust [7]. The literature further highlights the risk of exacerbating structural inequalities due to algorithmic biases and digital divides. Inequalities may persist or widen because of disparities in access to GAI resulting from connectivity or cost barriers [55], as well as the concentration of technological power in large corporations [7]. Potential malicious uses of GAI must also be considered, including the facilitation of fraud and scams through advanced phishing, identity theft, the creation of deepfakes, and the dissemination of misinformation and propaganda [54]. Accordingly, we propose the following hypothesis:
Hypothesis 2 (H2).
Higher PSU leads to greater GAI use.
2.3. Variables Linked to Technology Readiness Index
Technological optimism (OPTI) is understood as the belief that technological innovations enable higher levels of control, efficiency, adaptability, and well-being. This attitude functions as a motivational driver that predisposes individuals to engage actively and productively with new digital tools [56]. Individuals with a favorable orientation toward technology tend to perceive innovations as more advantageous, less complex, and more aligned with their needs, thereby facilitating adoption and acceptance [34].
Similarly, the personal disposition to try and adopt emerging technologies—that is, innovativeness (INNOV)—constitutes a key element in the perception and acceptance of new technological solutions [57]. Individuals with high levels of INNOV tend to evaluate technologies as more useful, easier to use, and more compatible with their needs, which increases their propensity to adopt them [58]. When faced with the same technological tool, more innovative individuals are more likely to develop positive beliefs regarding its use [13]. This association has been confirmed both in studies on artificial intelligence in general [43,59] and specifically in the context of GAI [60].
In contrast, technological insecurity (INSEC) refers to an individual’s distrust of technology, as well as doubts regarding its reliability, security, proper functioning, or potential dehumanizing effects, especially when its use may entail significant consequences [13]. This perception acts as a psychological barrier that inhibits adoption, even when benefits are evident. Insecurity is closely related to the uncertainty and perceived risk that accompany any innovation. Accordingly, individuals with high levels of insecurity tend to delay adoption or to fall into the category of late adopters [34].
OPTI, INNOV, and INSEC have been incorporated into established technology acceptance models such as TAM [12] through TRAM [14]. Within this framework, these factors influence intention to use indirectly through perceived usefulness [61].
Empirical evidence confirms that the components of TRI, particularly OPTI, play a relevant role in shaping favorable attitudes toward a wide range of technologies [61]. This relationship has also been observed in the adoption of AI-based systems in diverse contexts, including healthcare [59] and library services [62]. Accordingly, the following hypotheses are proposed:
Hypothesis 3 (H3).
Higher OPTI leads to greater GAI use.
Hypothesis 4 (H4).
Higher INNOV leads to greater GAI use.
Hypothesis 5 (H5).
Higher INSEC leads to lower GAI use.
2.4. Influence of Entrepreneurial Orientation and Sociodemographic Variables on the Perception of the Economic Consequences of GAI
For entrepreneurs (ENTREP), GAI can function as an enabling technology by supporting business idea generation and the structuring of business plans in a more agile and efficient manner [63]. It contributes to lowering market entry barriers by allowing new ventures to be launched with lower fixed costs and shorter implementation timelines [15].
GAI enhances decision-making through the advanced analysis of large volumes of data and support for strategic planning [64]. Its ability to process information rapidly and systematically enables firms to anticipate market trends, manage uncertainty, optimize costs, and coordinate complex organizations more accurately [65]. It also facilitates the automation of administrative and supervisory processes, freeing managerial time and human resources for higher value-added and more strategic activities [66]. Accordingly, we propose the following hypothesis:
Hypothesis 6 (H6).
ENTREP leads to a higher level of GAI use.
The literature has consistently shown that gender constitutes a relevant factor in technology use and acceptance, as men tend to adopt new technological advances more readily. A commonly cited explanation for this phenomenon is that such technologies are often designed and marketed from a predominantly masculine logic, prioritizing values such as control, competition, or technical performance, to the detriment of dimensions such as communication, care, or cooperation [35].
Among the challenges posed by GAI, the existence of gender gaps in its use and adoption is particularly salient [67]. On average, men tend to report higher levels of use and trust, especially in technical and professional contexts, whereas women often express greater ethical concerns and higher perceptions of risk [68]. Indeed, the deployment of GAI may give rise to a double gap: the underrepresentation of women in AI system development and the reproduction of gender biases in algorithms and applications [16]. These biases may translate into discriminatory outcomes in key domains such as recruitment, advertising, or automated decision-making [69].
GAI particularly affects language- and communication-intensive occupations—such as administration, customer service, basic marketing, or certain educational functions—which are highly feminized. Consequently, women may perceive greater labor-related risks associated with GAI, including job loss or wage reduction, reinforcing a more cautious attitude toward its adoption [16,70]. Accordingly, we propose the following hypothesis:
Hypothesis 7 (H7).
Women tend to use GAI less than men.
The distinction between Generations Y (millennials) and Z (Zoomers) and earlier generations, such as Generation X or baby boomers, is justified by marked attitudinal, technological, and motivational differences in their relationship with information technologies [71]. Digital natives (millennials and Zoomers) tend to rely more on cues such as popularity or ease of use, whereas digital immigrants (Generation X and older cohorts) evaluate technological risks and benefits more critically [36].
Perceptions of and trust in GAI also vary by age: younger individuals, accustomed to interacting with digital technologies from an early age, tend to perceive it as a useful and reliable tool, whereas older adults often adopt a more cautious or skeptical stance [17]. Even among digital native generations, relevant differences can be observed: Generation Z places greater emphasis on intrinsic motivation and shows higher sensitivity to motivational stimuli, whereas Generation Y more frequently develops introjected regulation mechanisms [39]. Accordingly, we propose the following hypothesis:
Hypothesis 8 (H8).
Members of Generations Z and Y tend to use GAI more than digital immigrants.
3. Materials and Methods
3.1. Sampling and Sample
This study draws on the survey used in the study [10], whose target population consisted of individuals residing in Spain aged 18 or older. The sample was designed to include 4000 interviews, with a final total of 4004 completed. The sampling procedure combined random selection of telephone numbers with quotas for gender and age. Strata were defined by the combination of Spain’s autonomous communities and municipality size. Interviews were conducted during the first half of February 2025.
The final number of observations included in this study corresponds to respondents who qualified as part of the working population, whose occupations were classified according to the Spanish National Classification of Occupations (CNO-11) [72], and who declared being familiar with GAI. This resulted in a total of 2432 observations, whose demographic profile is presented in Table 1.
Table 1.
Sociodemographic profile of the sample.
Women represent 57.07% of the sample, while men account for 42.93%. This imbalance reflects a common pattern in survey-based research, where women typically display higher response rates than men [73]. Importantly, both groups remain well represented in the dataset, ensuring sufficient statistical variation for the empirical analysis.
3.2. Measurement of Variables and Data Preprocessing
The variables analyzed in this study are derived from items provided in [10]. Table 2 presents in detail both the items used to construct the outcome and the input variables. It also describes the procedure followed for preprocessing and transforming them into composite indicators, as well as the measures used to assess their robustness [74,75].
Table 2.
Items and variables included in the analyses conducted in the study.
The scores for PEU, PSU, OPTI, INNOV, and INSEC are constructed as the standardized value of the first principal component obtained through Principal Component Analysis (PCA). This strategy makes it possible to synthesize the common information contained in each set of items into a single latent indicator, reducing dimensionality and capturing the shared variance among the items of each construct [75].
Beyond dimensionality reduction in a purely mechanical sense, PCA was used here as a construct-building strategy. The items grouped under PEU, PSU, OPTI, INNOV, and INSEC were designed to capture common latent dimensions; therefore, entering them separately would have treated conceptually related indicators as if they were fully independent predictors. In addition to preserving the theoretical structure of the model, this decision improved parsimony within the ANN framework. As shown in Table 2, replacing the five composite indicators with all their underlying items would have increased the number of explanatory inputs from 9 to 23. This increase is not trivial in neural-network modelling, since it substantially enlarges the number of trainable parameters. For example, under the Hecht–Nielsen heuristic, according to which the hidden layer contains 2p + 1 neurons, the number of hidden neurons would rise from 19 to 47, and the total number of trainable parameters in a one-hidden-layer MLP would increase from 210 in a 9 → 19 → 1 architecture to 1176 in a 23 → 47 → 1 architecture. Therefore, PCA served both a measurement purpose, by summarising the shared variance of each construct, and a modelling purpose, by limiting unnecessary input redundancy and helping to contain model complexity.
By contrast, for USE, a differentiated methodological approach was adopted since, as noted by [67], the procedure used to aggregate items into composite indicators must respect their theoretical meaning. Specifically, the maximum reported frequency of use among the evaluated tools was considered. A traditional average or the use of PCA could assign a higher score to users who employ several tools sporadically than to those who use a single tool intensively and recurrently, when it is the latter who, in fact, exhibit more intensive GAI use.
Table 3 demonstrates the robustness of the composite indicators constructed through PCA. In all cases, factor loadings exceed 0.5, Bartlett’s test of sphericity rejects the null hypothesis of an identity correlation matrix, and—with the exception of PSU and INNOV—the Kaiser–Meyer–Olkin index exceeds 0.7. In the least favorable cases (PSU and INNOV), it exceeds 0.6, which, although not optimal, is still considered acceptable, particularly in light of the remaining indicators derived from the factor analysis, which reach adequate values. These results confirm the suitability of the factorial structure and the adequacy of the sample for analysis, supporting the validity of the composite indicators employed [75].
Table 3.
Measures of the goodness of construction of the composite variables using principal component analysis.
Regarding the entrepreneur–non-entrepreneur dichotomy (ENTREP), the term entrepreneur is operationalized as self-employed. This is the most commonly used definition in the empirical literature, primarily due to the greater availability and comparability of statistical data [76]. In our case, as shown in Table 2, the categories include business owners or self-employed professionals (with or without employees), as well as members of cooperatives.
The gender variable is dichotomous (0 = male; 1 = female) and is therefore denoted as FEM. Participants are grouped into generational cohorts according to their year of birth and age at the time of the study. The most widely accepted definition considers individuals born in 1997 or later—aged up to 28 at the time of the survey—as Generation Z (GZ). Those born between 1981 and 1996—aged between 29 and 44—belong to Generation Y or millennials (GY). Digital immigrant generations (Generation X or earlier) include those born in 1980 or earlier, that is, individuals aged 45 or older at the time of the study [77], and constitute the reference category.
Table 4 reports the correlation matrix for the variables included in the analysis. As expected, PEU and PSU are positively and significantly correlated (r = 0.62, p < 0.01), which indicates that both capture favorable evaluations of GAI while still representing analytically distinct dimensions of perceived usefulness since the correlation is far from being high enough to suggest empirical redundancy. In addition, most explanatory variables display statistically significant bivariate correlations with USE and with the expected sign. Specifically, PEU, PSU, OPTI, INN, and the generational variables show positive associations with GAI use, whereas INSEC and FEM display negative correlations. The only variable that does not exhibit a statistically significant bivariate association with USE is entrepreneurial status.
Table 4.
Correlation Matrix.
3.3. Data Analysis
After data preprocessing, the data analysis followed the sequence outlined below, aimed at addressing the two research objectives. All analyses were implemented using R (version 4.4.2) libraries.
Step 1. The sample was randomly divided into a training set (80%) and an external test set (20%). This split preserved the original proportions of gender, generational cohorts, and the entrepreneur/non-entrepreneur dichotomy, in order to avoid representation biases in predictive evaluation. The test set was kept fully isolated and was not used at any stage of model training or selection, thus ensuring an unbiased and strictly out-of-sample evaluation of the predictive performance of the artificial neural networks (ANNs). This procedure was implemented using standard reproducible sampling and data manipulation tools in R.
Step 2. Five multilayer perceptron (MLP) architectures were designed, all with the same continuous dependent variable and the same set of p = 9 explanatory variables, evaluated according to different heuristics [78].
Specifically, the following networks were estimated: (i) ANN1: 9 → 6 → 1, based on the heuristic rule 2/3·p; (ii) ANN2: 9 → 19 → 1, following the Hecht–Nielsen heuristic (2p + 1); (iii) ANN3: 9 → 4 → 1, inspired by the Widrow rule; (iv) ANN4: 9 → 18 → 9 → 1, a funnel-type architecture with two decreasing hidden layers; and (v) ANN5: 9 → 14 → 7 → 1, a conservative funnel designed to mitigate the risk of overfitting [79]. This variety of architectures allows the capture of different degrees of nonlinearity, interaction effects, and functional complexity in explaining GAI use. The architectures were implemented using the torch package in R. Throughout the entire training and validation process, a linear regression model was considered as a benchmark.
The estimation of multiple MLP architectures was not intended as an exercise in unrestricted hyperparameter tuning, but rather as a bounded and theory-informed sensitivity analysis of the ANN specification. Relying on a single arbitrarily chosen architecture could make the results dependent on a particular network configuration, while testing a large number of architectures without guidance would introduce an opposite form of arbitrariness. To avoid both situations, we evaluated a limited set of plausible MLP structures derived from established heuristic rules (e.g., the 2/3·p rule, the Hecht–Nielsen heuristic, and the Widrow rule), together with parsimonious funnel-type configurations. This strategy allowed us to assess whether predictive performance was robust across reasonable architectural choices and to select the final model on the basis of out-of-sample predictive performance and parsimony [79]. In addition, the linear regression model provided a benchmark from a different modeling family for evaluating the predictive contribution of the neural-network approach.
Step 3. The neural networks were trained following a homogeneous protocol aimed at ensuring convergence and minimizing overfitting. All architectures were optimized using the Adam algorithm, with a fixed learning rate (lr = 0.001) and L2 regularization (weight decay = 10−4). The loss function was the mean squared error (MSE), consistent with the continuous nature of the dependent variable (USE). ReLU (Rectified Linear Unit) activation functions were used in all hidden layers, while the output layer employed a linear activation. Training was conducted using mini-batches of size 32, with a maximum of 400 epochs. To control overfitting, an early stopping scheme was implemented using an internal validation subset equivalent to 20% of the training set, halting the process when validation loss did not improve for 30 consecutive epochs.
Additionally, diagnostic indicators of the learning process were recorded, including the optimal stopping epoch, the minimum validation MSE, and the standard deviation of the validation MSE over the last ten epochs, in order to assess convergence stability. Explanatory and predictive performance were evaluated using the coefficient of determination on the training set (R2) and the predictive statistic Q2 on the external test set (20%), enabling a homogeneous comparison of in-sample and out-of-sample performance. The entire training procedure was implemented using the torch package.
Step 4. Predictive comparison among the trained networks, between these and the linear regression model, and the final model selection were conducted exclusively on the external test set. To assess the stability and robustness of out-of-sample performance, a bootstrap procedure with 5000 replications was applied to the test set. In each bootstrap replication, a sample with replacement was drawn from the original test set, and three predictive metrics were computed for each neural network: the predictive coefficient Q2, the root mean squared error (RMSE), and the mean absolute error (MAE). This approach yielded empirical distributions of the metrics for each architecture, from which means and standard deviations were estimated.
Comparisons between architectures were conducted using paired t-tests, complemented by effect sizes estimated through Cohen’s dz coefficient. This step was implemented using statistical functions from the stats package.
Step 5. Variable importance was analyzed using Shapley Additive Explanations (SHAP) [25]. The selected neural model was interpreted through beeswarm plots to inspect the direction of effects and assess the adequacy of the theoretical hypotheses, as well as through the estimation of global variable importance based on the mean absolute SHAP value (mean|SHAP|). Given the local nature of SHAP, the mean|SHAP| analysis was replicated across tertiles of the level of use, allowing the evaluation of the stability of the explanatory hierarchy along the adoption continuum. This analysis was conducted in R using the fastshap package, together with ggplot2 for visualization.
Step 6. Finally, the potential existence of gender-related gaps in GAI use was examined. Beyond differences in the mean level of use, the relative importance of explanatory variables across the full sample—measured through mean|SHAP|—was compared between gender groups using unpaired statistical tests and effect sizes. This approach makes it possible to identify whether the explanatory structure of GAI use systematically differs by gender.
A unified view of all data analysis, i.e., data preprocessing and steps 1–5 described in this subsection, is provided in Figure 2.
Figure 2.
Methodological workflow of the study.
4. Results
4.1. Results of the In-Sample Fit and Predictive Evaluation of the Estimated Neural Networks
Table 5 reports the training results for the five neural network architectures estimated following the heuristic rules described in Section 3.3. In terms of explanatory capacity, the R2 values in the training phase fall within a narrow range (between 0.235 and 0.252), indicating a moderate and homogeneous level of fit across models. All architectures outperform the linear regression benchmark. The most complex architecture (ANN4) achieves the highest R2 value, followed by ANN2, although the differences relative to the more parsimonious networks are small.
Table 5.
Training-phase results of the artificial neural network architectures.
Consistently, the error indicators (RMSE and MAE) display only minimal variation across architectures, with very similar values and all lower than those obtained from linear regression. The early stopping criterion determines a relatively low optimal number of epochs (between 14 and 49), which, together with the small standard deviations of the mean squared error in the final iterations (all below 0.002), indicates smooth convergence and the absence of instability or overfitting during the training phase.
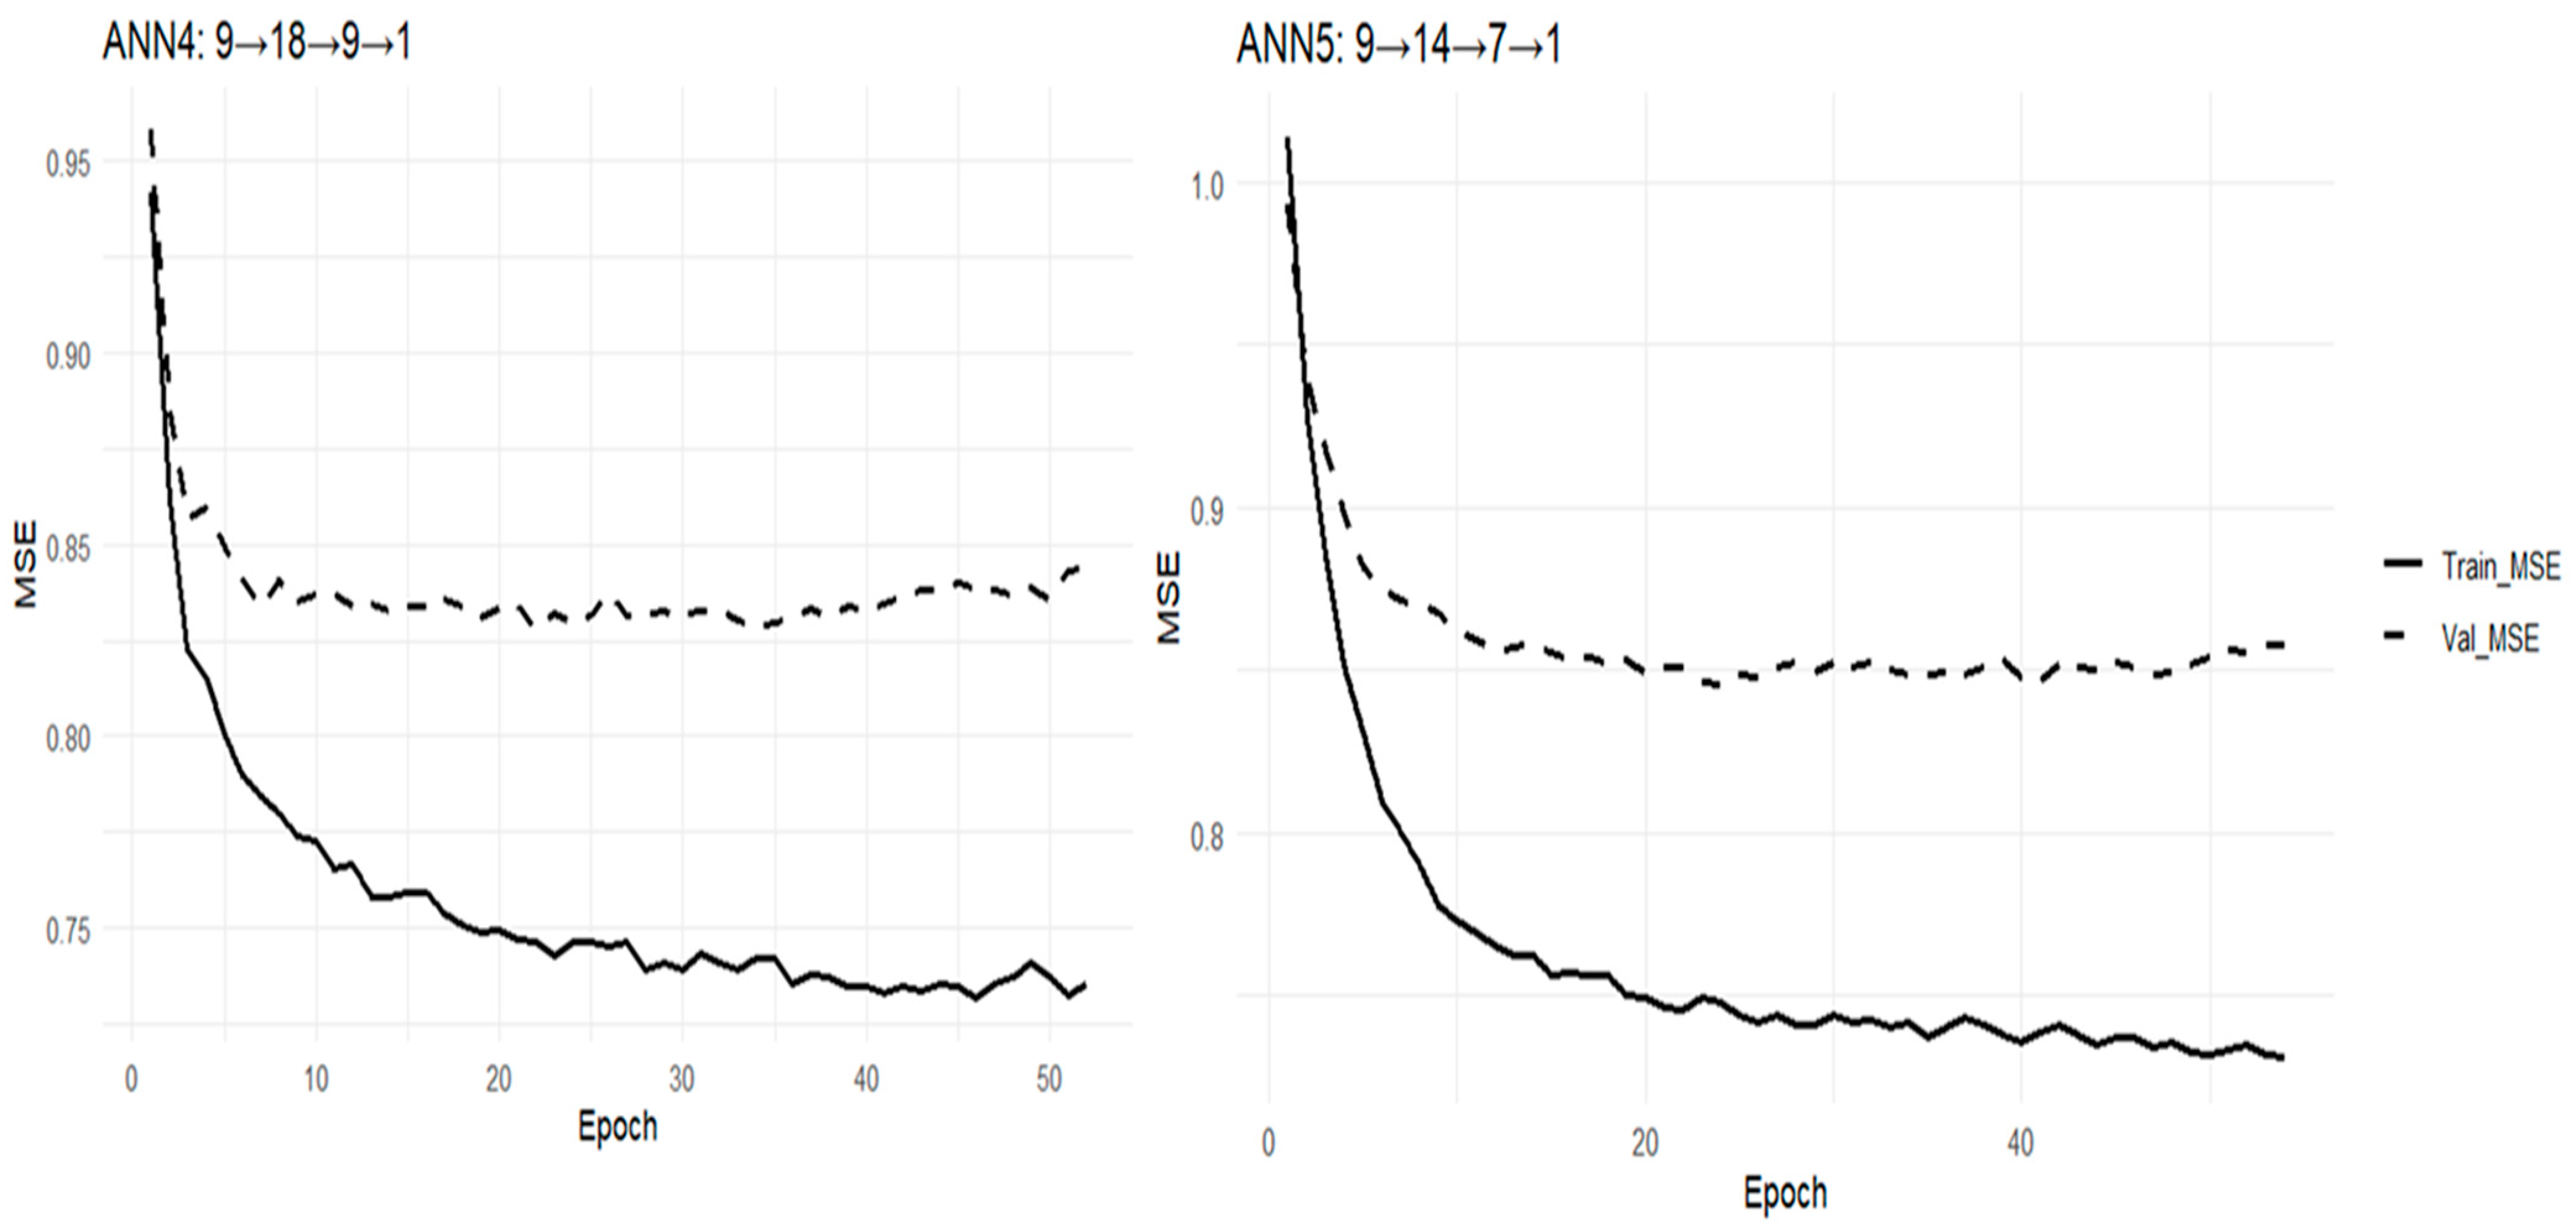
The learning dynamics of the estimated networks are illustrated in Figure A1 and Figure A2 in the Appendix A. These figures show the evolution of training and validation loss across epochs for architectures with one and two hidden layers, respectively. In all cases, both losses decrease during the initial epochs and stabilize shortly thereafter, exhibiting a smooth and stable convergence pattern. The absence of systematic divergence between training and validation curves provides additional evidence that the early stopping mechanism effectively prevented overfitting and that the networks achieved stable generalization performance.
Table 6 presents the test-phase results for the neural network architectures, obtained through bootstrap resampling of the external test set. The mean Q2 values are positive across all architectures and fall within a relatively narrow range (between 0.276 and 0.295), indicating moderate but consistent out-of-sample predictive capacity. All architectures clearly outperform the linear regression benchmark.
Table 6.
Test-phase results of the artificial neural network architectures.
ANN3 achieves the highest mean Q2 and the lowest mean RMSE, followed very closely by ANN1, suggesting a slightly more favorable bias–variance trade-off in these more parsimonious configurations, although differences relative to the remaining models are small. Similarly, the mean RMSE and MAE values exhibit high stability across architectures, with very similar standard deviations, demonstrating robust predictive performance across different sample partitions.
Overall, these results confirm that predictive performance is only marginally sensitive to the specific neural architecture selected and reinforce the absence of overfitting previously observed during the training phase.
Table 7 reports the results of the paired comparisons based on mean RMSE across the different neural network architectures. Although all pairwise comparisons are statistically significant, the magnitude of the differences must be interpreted in light of the corresponding effect sizes. In this regard, some comparisons yield small or even trivial effect sizes (e.g., ANN1 versus ANN3, with dz ≈ 0.11), indicating that RMSE differences are practically limited in certain cases. However, architecture ANN3 (9 → 4 → 1) consistently exhibits the lowest RMSE values and shows large effect sizes (|dz| ≥ 1) in most comparisons against more complex architectures (ANN2, ANN4, and ANN5), evidencing a substantively superior predictive performance. For this reason, the subsequent interpretability analysis using SHAP is conducted with ANN3 as the reference model.
Table 7.
Table of paired tests on the mean differences in RMSE between ANNs.
The set of architectures explored also spans different levels of model complexity, ranging from very parsimonious networks with a single small hidden layer to deeper funnel-type architectures with two hidden layers. This strategy makes it possible to assess whether the results depend on a specific network configuration. In our case, the performance differences across architectures are relatively small and the most parsimonious architecture (ANN3) provides the best predictive performance, suggesting that the results are robust to reasonable variations in network complexity.
4.2. Results of SHAP Analysis
4.2.1. General Findings
Figure 3 displays the marginal contribution of each variable to the prediction of GAI use, ordered from highest to lowest global importance (mean|SHAP|). PEU emerges as the dominant predictor. High values of PEU are systematically associated with positive SHAP contributions, whereas low values generate pronounced negative effects, evidencing a clearly monotonic relationship consistent with H1. PSU exhibits a positive effect—supporting H2—but its contribution is comparatively smaller, ranking among the variables with the lowest global importance. This result suggests that GAI use appears to be driven more strongly by economic, productive, and individual technological predisposition motives than by considerations of social usefulness.
Figure 3.
Beeswarm plot of SHAP values for the variables included in the analysis.
INNOV also occupies a prominent position, showing a positive association: high levels of innovativeness are linked to positive SHAP contributions, while low levels reduce predicted use. OPTI displays a consistent positive relationship as well, although of smaller magnitude than PEU and INNOV. In contrast, INSEC shows an inverse pattern, with higher values associated with negative contributions, confirming its inhibiting role. Among the TRI-related variables, INNOV is the most relevant. Overall, the model estimates allow us to support H3, H4, and H5.
FEM and ENTREP exhibit more limited effects. Nevertheless, the female gender shows a predominantly negative contribution, consistent with the existence of a gender gap in GAI use, thereby supporting H7. By contrast, entrepreneurial status does not generate clear or systematic effects, and its sign is not consistently defined, leading to a lack of support for H6.
Generational variables display differentiated effects. GZ shows clearly positive and high-magnitude contributions, indicating that belonging to Generation Z substantially increases predicted use. GY also presents a positive effect, although of lower intensity and with more moderate dispersion. This pattern suggests that both digital native generations exhibit higher levels of use than digital immigrants, thus supporting H8. Additionally, Generation Z shows higher predicted use than Generation Y.
Table 8 reports mean|SHAP| values for the full sample and across tertiles of the dependent variable. In the overall sample, the results reveal a clear hierarchical structure in which PEU emerges as the dominant explanatory factor of GAI use. It is followed by the generational variables (GY and GZ) and the TRI dimension INNOV. OPTI shows greater relevance than INSEC, although both carry substantially less weight than PEU, GY, and INNOV. FEM, PSU, and ENTREP appear as the least influential variables in the full sample.
Table 8.
Mean absolute SHAP values in the overall sample and by tertiles.
The tertile-based analysis reveals that the relative importance of GZ, INNOV, and OPTI increases from the first to the third tertile. Similarly, ENTREP and FEM also increase their contribution in the upper tertiles, although their explanatory weight remains relatively marginal. By contrast, PEU maintains high and relatively stable importance across tertiles, confirming its structural role at all levels of use. Finally, PSU emerges as the least influential variable in the upper two tertiles and shows little variation across the distribution of use.
4.2.2. Evaluation of Gender Gaps in the Influence of Explanatory Variables
The beeswarm plot in Figure 3 clearly reveals the existence of a gender gap in GAI use, showing that being female exerts an inhibiting effect on use. Beyond this difference in overall usage levels, Table 9 allows us to assess whether gender also conditions the relative influence of the explanatory variables on use.
Table 9.
Evaluation of the gender GAP in the influence of assessed variables on GAI use.
The results suggest that although statistically significant differences are observed for nearly all variables, their practical relevance varies substantially. In the case of PEU, while the difference between women and men is statistically significant, the effect size is trivial (|dz| = 0.120). Similarly, for GZ, no statistically significant or substantively meaningful differences are observed in the variable’s contribution, suggesting that the gender gap may not be present among the youngest cohort. INNOV also shows no practically relevant difference (|dz| = 0.128).
By contrast, perceptible differences are detected for the remaining variables, with medium (|dz| > 0.20) and in some cases large (|dz| > 0.50) effect sizes. In particular, OPTI, INSEC, ENTREP, PSU, and GY exhibit a greater contribution to the prediction of GAI use among men than among women.
Overall, the results indicate that although three of the four most relevant variables (PEU, INNOV, and GZ) do not display perceptible gender-based differences in their influence on USE, meaningful heterogeneity exists across the remaining factors. This suggests that the gender gap in GAI use is reflected not only in adoption levels but also in the underlying explanatory mechanisms—though not in the most structurally important ones.
The cross-generational comparison reported in Table 10 reveals that the gender gap associated with several determinants of GAI use (PSU, OPTI, INSEC, and ENTREP) remains remarkably stable across cohorts. By contrast, the behaviour of the two attitudinal drivers with the greatest explanatory weight in the model, PEU and INNOV, is more cohort-dependent. In GY, PEU still shows a significant gender difference, whereas in GZ this difference disappears and even changes sign, although without statistical significance. Similarly, INNOV exhibits no significant gender difference in either GY or GZ. This pattern helps explain why the overall gender gap appears more pronounced for GY than for GZ: among younger respondents, gender differences tend to vanish precisely in those variables that make the strongest contribution to explaining actual GAI use. A plausible interpretation is that, although gender differences persist in broader social perceptions, OPTI, INSEC, and ENTREP, younger cohorts show greater convergence in the economic and innovation-related assessment of GAI. This convergence may attenuate the overall gender divide in this group.
Table 10.
Gender gap in the influence of explanatory variables across generations.
5. Discussion
5.1. General Considerations
The present study develops an explanatory model of the determinants of generative artificial intelligence (GAI) use, drawing on elements from different technology acceptance theories such as TAM and TRAM. The model was estimated using ANNs, and the contribution of the explanatory variables was assessed through Shapley Additive Explanations (SHAP).
Regarding the first research objective, several ANN architectures were tested and SHAP was applied to the best-performing model. The results indicate that the main explanatory variables of use (USE) are, in order of importance, perceived economic usefulness (PEU) and generational status associated with the digital native–digital immigrant distinction. Digital immigrants tend to use GAI less intensively and, among digital natives, Zoomers exhibit higher levels of use than millennials. Furthermore, all ANNs display superior predictive performance (both in-sample and out-of-sample) compared to a conventional linear regression model that would typically have been used to evaluate USE.
The relatively modest R2 values observed in the training phase should be interpreted considering the nature of behavioural phenomena and survey-based social research, where explained variance is often limited by unobserved heterogeneity, measurement error, and contextual factors not captured in the model. In this context, moderate levels of explanatory power are not uncommon and do not invalidate theoretically meaningful relationships [80]. Importantly, the neural-network models consistently outperform the linear regression benchmark in terms of predictive performance, indicating that the nonlinear architectures capture additional patterns in the data. Moreover, although artificial neural networks are often criticized for their lack of transparency, the use of SHAP allows the contribution of each variable to be interpreted in a systematic and theoretically meaningful way [25]. This approach helps reconcile predictive modelling with interpretability, addressing the well-known tension between explanation and prediction in behavioural research [81].
Concerning the second research objective, the findings reveal the existence of a gender gap in GAI use. Beyond the fact that women, on average, tend to use GAI less than men, this gap appears to be concentrated among millennials and older generations. Differences are also observed in constructs of secondary importance such as OPTI, INSEC, and PSU, which show greater explanatory power for use among men than among women. However, for two of the four most relevant variables (PEU and INNOV), these differences exhibit only negligible effect sizes.
The finding that perceived usefulness constitutes the primary driver of GAI use is consistent with the central role this construct typically plays in technology adoption, particularly in contexts where ease of use is, to some extent, taken for granted [82]. This appears to be the case for GAI, since although maximizing its performance may require precision in prompt formulation, obtaining direct outputs relies on intuitive natural language interaction, similar to communicating with another person via a messaging system, even in artistic works [83]. Large language models have been explicitly shaped to be more instructable and less evasive, thereby facilitating their use by non-expert users [8]. The relevance of this construct in GAI adoption has been confirmed in generic usage contexts [40,41], among firm employees [42], in AI-powered products [43], and in educational settings [44,45]. Nevertheless, it should be emphasized that the relevance of perceived usefulness is primarily associated with economic and productive aspects rather than social considerations, suggesting that GAI use is likely concentrated in work-related contexts, where usefulness is especially salient under mandatory conditions [84].
Although it was expected that younger generations would use GAI more intensively than older cohorts, it is noteworthy that age ranks above TRI constructs and perceived social usefulness in terms of explanatory importance. This finding confirms that older adults tend to adopt a more cautious or skeptical stance toward GAI [17]. Differences are also observed within digital native generations, in line with the findings of [34].
With the exception of INNOV, TRI constructs exert a more secondary influence than economic–productive perceived usefulness, yet their explanatory weight exceeds that of perceived social usefulness. Moreover, the fact that driver-related factors (OPTI and INNOV) are more relevant than the inhibitor (INSEC) is consistent with what is typically observed in empirical studies [61].
Entrepreneurial status does not exhibit a clear relationship with GAI use. Despite the technological potential of GAI, this result may be explained by the sectoral composition of self-employment in Spain, which is primarily concentrated in small retail, hospitality, construction, and agriculture [85]—sectors that are generally not among those most affected by the rise of GAI [3]. This finding suggests, as noted by [69], that although self-employment is the most common proxy for entrepreneurship, it does not adequately capture entrepreneurial activity in its purest sense.
Finally, gender emerges as a relevant factor in GAI use, with men tending to report higher levels of use than women, in line with prior literature [67]. However, this effect is clearly less decisive than that of age. The gender gap is evident among millennials and older cohorts, whereas it appears to fade among Generation Z. A particularly relevant finding is that this attenuation does not occur because all gender differences disappear, but because they no longer affect the most influential drivers of GAI use. This pattern suggests that intergenerational change may be reducing gender asymmetries precisely in the core instrumental and innovation-related evaluation of GAI, i.e., PEU and INNOV.
5.2. Theoretical Implications
Although the performance differences among the various ANNs are not particularly large in absolute terms, they are consistent, with medium-sized effects in favor of a specific architecture when RMSE is considered the relevant error metric—interestingly, the simplest one. This result reinforces the convenience, in behavioral analysis studies—where the use of ANNs is becoming increasingly common [19]—of testing different network configurations and architectures, both in terms of the number of neurons and the number of layers. Moreover, all ANNs outperform linear regression in both in-sample fit and out-of-sample predictive tasks.
The study also highlights the usefulness of SHAP as an exploratory and explanatory tool beyond the mere identification of global variable importance. The combined use of beeswarm representations, tertile-based stratified analyses, and interaction inspection allows for a richer and more nuanced understanding of how different configurations of attitudes, perceptions, and experiences translate into differentiated levels of the outcome, facilitating a substantive interpretation of inherently nonlinear models [25]. Therefore, the ANN-based approach should not necessarily be viewed as merely complementary to regression-based methods; rather, it can be employed as a standalone alternative to regression.
Finally, the results obtained in the GAI use models underscore the need to explicitly consider sociodemographic variables such as age and the existence of gender gaps, which operate transversally across cognitive explanatory variables. These findings suggest that explanatory models of GAI use should be expanded to incorporate structural and generational factors that significantly shape the adoption and effective use of this technology.
5.3. Practical and Public Policy Implications
The findings of this study offer several relevant implications for both public policymakers and organizations and economic agents interested in promoting an efficient, equitable, and socially responsible use of GAI.
The clear primacy of PEU as the main determinant of use suggests that GAI diffusion and adoption strategies should focus on tangibly demonstrating its benefits in terms of efficiency, productivity, and improvements in job performance. From a public policy perspective, this points to the desirability of promoting training programs oriented toward concrete use cases—particularly in professional contexts—that illustrate how GAI can be integrated into real tasks and generate immediate returns. This approach is especially relevant in a context such as Spain, characterized by a high prevalence of SMEs and microenterprises, where technological adoption is often strongly conditioned by the perception of clear, short-term benefits.
Age and generational status emerge as key structural factors in explaining GAI use. The lower intensity of use observed among digital immigrants highlights the need to design cohort-differentiated training policies. For older workers, providing access to technology is not sufficient; it is also necessary to reduce the uncertainty and perceived risk associated with its use. In this regard, active labor market policies and lifelong learning programs should incorporate specific GAI literacy modules, oriented not only toward basic technical skills but also toward understanding its limitations, risks, and practical applications. This is essential to prevent a new form of digital exclusion in the labor market.
A particularly relevant implication stems from the gender gap identified in GAI use. Although this gap is less pronounced among members of Generation Z, it remains significant among millennials and older cohorts, and it manifests not only in usage levels but also in certain underlying explanatory mechanisms. From a public policy perspective, these results suggest the need to explicitly incorporate the gender dimension into GAI promotion strategies. Training, awareness, and support programs should take into account that women tend to assign greater importance to social and ethical implications, whereas men show greater sensitivity to factors related to technological optimism and insecurity. Ignoring these differences could contribute to reproducing or even widening pre-existing inequalities in access to and effective use of GAI.
Finally, the fact that entrepreneurial status does not act as a clear incentive for GAI use suggests that entrepreneurship support policies should go beyond merely ensuring the availability of technological tools. In traditional self-employment sectors, where the potential impact of GAI may be less evident, it is necessary to design targeted programs that help identify relevant and sector-adapted applications. Otherwise, there is a risk that the benefits of GAI will become concentrated in specific segments of the labor market, reinforcing dynamics of technological polarization.
6. Conclusions
6.1. Principal Takeaways
This study provides an integrated and empirically grounded view of the determinants of GAI use among the Spanish working population, combining ANNs and SHAP. The use of GAI is predominantly driven by perceptions of economic and productive usefulness. The perception that these tools enhance efficiency, productivity, and job performance emerges as the most relevant explanatory factor, well above other cognitive or attitudinal constructs. This finding confirms that, in professional contexts, GAI adoption primarily follows an instrumental logic, consistent with classical technology acceptance frameworks, but here reinforced through a nonlinear, data-driven approach.
Generational status also constitutes a key structural axis in explaining GAI use. Digital natives use these tools more intensively than digital immigrants, and within this group, Generation Z exhibits higher levels of use than Generation Y. This result indicates that age does not merely act as a secondary moderator but rather as a central determinant of effective use, underscoring the risk of a new digital divide associated with GAI.
Technological predisposition factors remain relevant, albeit with a distinctive pattern. Innovativeness (INNOV) is by far the most influential of these constructs and, as commonly observed in empirical studies, driver-related factors exert greater explanatory weight than barriers.
The existence of a gender gap in GAI use is also noteworthy. It manifests both in overall usage levels and in certain underlying explanatory mechanisms. Women tend to use GAI less than men, particularly among millennials and older generations. The absence of relevant differences within Generation Z suggests that this gap may attenuate in the medium term. Differences are also observed in how certain factors influence use, although these are concentrated in secondary constructs. For the most relevant variables (PEU and INNOV), while statistically significant, gender differences exhibit negligible effect sizes.
From a methodological standpoint, the study demonstrates that ANNs, combined with explainability techniques such as SHAP, constitute a valid and powerful tool for analyzing technological behavior. This approach enables the identification of nonlinear relationships and structural heterogeneity that would be difficult to detect using traditional linear models, thereby providing a solid basis for the formulation of theoretical, practical, and public policy implications.
6.2. Limitations and Further Research
Despite the contributions of this study, several limitations must be acknowledged, which in turn open clear avenues for future research. The analysis is based on cross-sectional data, which prevents the establishment of strict causal relationships between perceptions, attitudes, and GAI use. Although the use of ANNs enables the identification of nonlinear relationships and complex patterns, it does not allow for determining the temporal direction of the observed effects. Future research could address this limitation through longitudinal or panel designs, enabling the examination of how GAI use and its determinants evolve over time.
The dependent variable focuses on the aggregate intensity of GAI use without distinguishing between specific application contexts. While this approach is appropriate for capturing general adoption patterns in a technology characterized by immediate access and transversal use, it does not differentiate between professional, educational, creative, or recreational applications. Subsequent studies could delve deeper by disaggregating use according to task type or domain, thereby identifying whether explanatory factors vary across contexts of utilization.
The operationalization of entrepreneurship through self-employment constitutes a practical but limited proxy. This measure does not adequately capture the heterogeneity of entrepreneurial activity, particularly in innovative or knowledge-intensive domains where the potential impact of GAI is likely to be greater. Future research could incorporate more refined indicators of entrepreneurial status, innovation intensity, or sectoral specialization in order to more precisely analyze the relationship between entrepreneurship and GAI use.
Although the study explicitly examines the gender gap, it does so using a binary classification and without considering other relevant social dimensions. Future investigations could adopt an intersectional perspective, exploring how gender interacts with variables such as age, educational level, occupation, or socioeconomic status in explaining GAI use. Complementary qualitative approaches could also provide deeper insights into the motivations, concerns, and barriers that cannot be fully captured through structured survey data.
The study is confined to the Spanish context, relying on data from a national macro-survey. While this strengthens the internal validity of the findings, it limits their generalizability to countries with different productive structures, levels of digitalization, or regulatory frameworks. In this regard, cross-national comparative studies represent a particularly promising line of research to assess the robustness and transferability of the results.
Finally, from a methodological perspective, although the combination of ANNs and SHAP substantially enhances the interpretability of nonlinear models, the results remain dependent on the analytical approach adopted. Future research could strengthen robustness by comparing different machine learning algorithms or integrating alternative explainability techniques, in order to test the stability of the explanatory hierarchies identified.
Author Contributions
Conceptualization, T.T.-C. and O.L.R.; methodology, T.T.-C. and Á.C.-A.; software: J.d.A.-S.; validation: O.L.R.; formal analysis: T.T.-C.; investigation. T.T.-C. and O.L.R.; resources, Á.C.-A.; data curation, J.d.A.-S.; writing—original draft preparation, T.T.-C. and J.d.A.-S.; writing—review and editing, Á.C.-A.; visualization, J.d.A.-S.; supervision, Á.C.-A.; project administration, O.L.R. and Á.C.-A.; funding acquisition: J.d.A.-S. and O.L.R. All authors have read and agreed to the published version of the manuscript.
Funding
This research was supported by Telefonica and the Telefonica Chair on Smart Cities of the Universitat Rovira i Virgili and Universitat de Barcelona (project number: 42. DB.00.18.00).
Data Availability Statement
The original data presented in the study are openly available at https://www.cis.es/es/detalle-ficha-estudio?origen=estudio&codEstudio=3495 (accessed on 2 May 2025).
Acknowledgments
During the preparation of this manuscript/study, the authors used ChatGPT 5.2. for the purposes of linguistic improvement. The authors have reviewed and edited the output and take full responsibility for the content of this publication.
Conflicts of Interest
The authors declare no conflicts of interest.
Abbreviations
The following abbreviations are used in this manuscript:
| AI | Artificial Intelligence |
| ANN/ANNs | Artificial Neural Network(s) |
| CIS | Spanish Center of Sociological Research |
| CNO-11 | Spanish National Classification of Occupations |
| FEM | Dummy variable for gender (male = 0, female = 1) |
| GAI | Generative Artificial Intelligence |
| Gen Z | Generation Z (Zoomers) |
| Gen Y | Generation Y (Millennials) |
| Gen X | Generation X |
| GPT | Generative Pre-trained Transformer |
| GZ | (dummy) Generation Z |
| GY | (dummy) Generation Y |
| INNOV | Innovativeness |
| INSEC | Insecurity |
| KMO | Kaiser–Meyer–Olkin (measure) |
| L2 | L2 regularization |
| lr | Learning rate |
| MAE | Mean Absolute Error |
| MLP | Multilayer Perceptron |
| MSE | Mean Squared Error |
| NR | Not reported |
| OPTI | Technological Optimism |
| PCA | Principal Component Analysis |
| PEU | Perceived Economic and Productive Usefulness |
| PSU | Perceived Social Usefulness |
| Q2 | Predictive coefficient of determination (out-of-sample) |
| R2 | Coefficient of determination |
| ReLU | Rectified Linear Unit |
| RMSE | Root Mean Squared Error |
| SD | Standard Deviation |
| SDGs | Sustainable Development Goals |
| SHAP | Shapley Additive Explanations |
| TRI | Technology Readiness Index |
| TRAM | Technology Readiness and Acceptance Model |
| TAM | Technology Acceptance Model |
| UTAUT | Unified Theory of Acceptance and Use of Technology |
| dz | Cohen’s dz |
Appendix A. Learning Curves of Fitted ANNs
Figure A1.
Learning curves of the ANNs with one hidden layer.
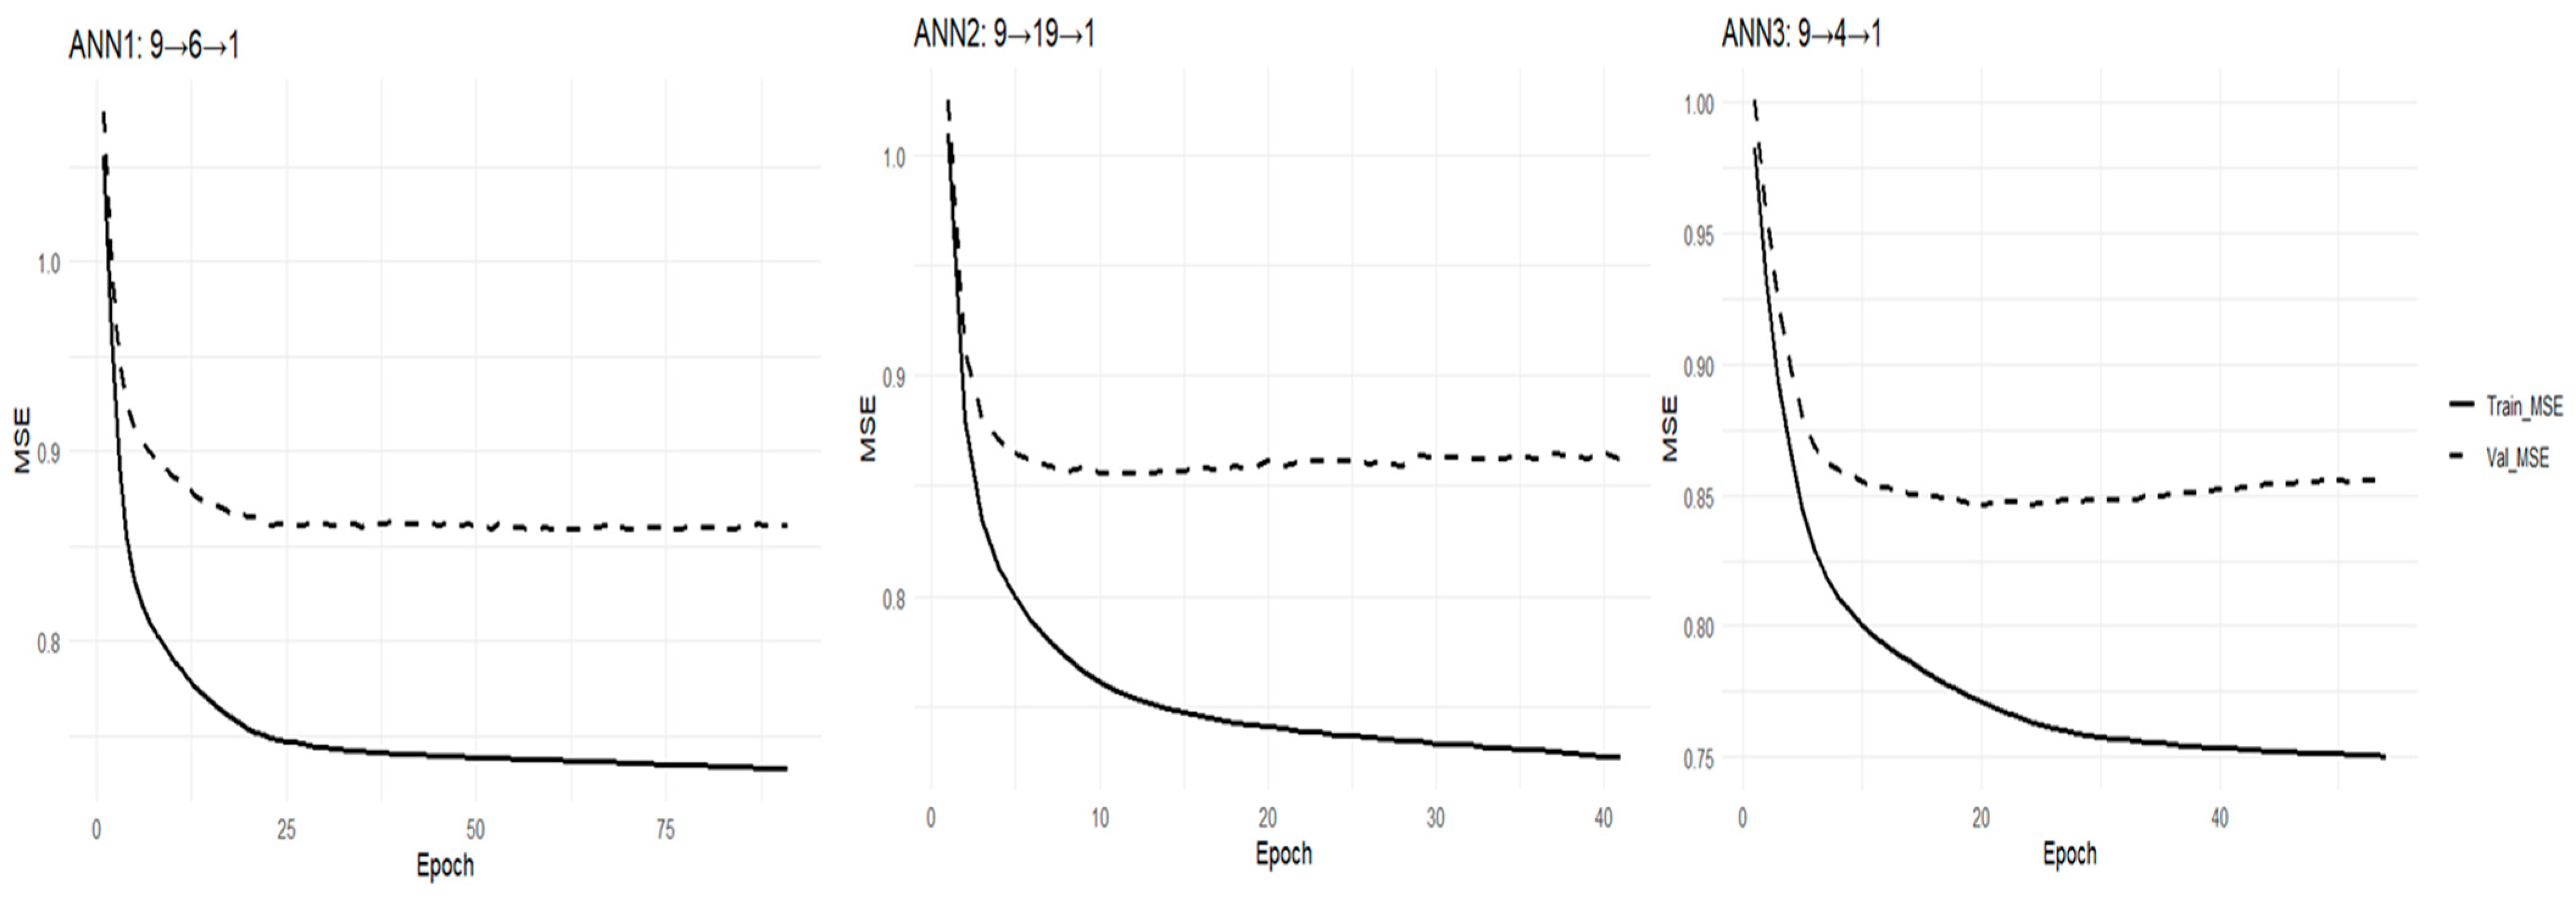
Figure A2.
Learning curves of the ANNs with two hidden layers.
References
- Polak, P.; Anshari, M. Exploring the multifaceted impacts of artificial intelligence on public organizations, business, and society. Humanit. Soc. Sci. Commun. 2024, 11, 1373. [Google Scholar] [CrossRef] [Scilit]
- Chatterji, A.; Cunningham, T.; Deming, D.; Hitzig, Z.; Ong, C.; Shan, C.; Wadman, K. How People Use ChatGPT. 2025. Available online: https://cdn.openai.com/pdf/a253471f-8260-40c6-a2cc-aa93fe9f142e/economic-research-chatgpt-usage-paper.pdf (accessed on 1 February 2026).
- Zarifhonarvar, A. Economics of ChatGPT: A labor market view on the occupational impact of artificial intelligence. J. Electron. Bus. Digit. Econ. 2024, 3, 100–116. [Google Scholar] [CrossRef] [Scilit]
- Tamvada, J.P.; Narula, S.; Audretsch, D.; Puppala, H.; Kumar, A. Adopting new technology is a distant dream? The risks of implementing Industry 4.0 in emerging economy SMEs. Technol. Forecast. Soc. Change 2022, 185, 122088. [Google Scholar] [CrossRef] [Scilit]
- Ghasemi, S.F.; Amiri, P.; Galavi, Z. Advantages and limitations of ChatGPT in healthcare: A scoping review. Health Sci. Rep. 2025, 8, e71219. [Google Scholar] [CrossRef] [Scilit]
- Pérez-Portabella, A.; Andrés-Sánchez Jde Arias-Oliva, M.; Souto-Romero, M. Integrating Machine Learning Techniques and the Theory of Planned Behavior to Assess the Drivers of and Barriers to the Use of Generative Artificial Intelligence: Evidence in Spain. Algorithms 2025, 18, 410. [Google Scholar] [CrossRef] [Scilit]
- Fraisl, D. The Potential of Artificial Intelligence for the SDGs and Official Statistics. PARIS21 Working Paper. 2024. Available online: https://www.paris21.org/sites/default/files/related_documents/2024-04/the-potential-of-ai-for-the-sdgs-and-official-stats_working-paper_0.pdf (accessed on 7 February 2026).
- Zhou, J.; Müller, H.; Holzinger, A.; Chen, F. Ethical ChatGPT: Concerns, challenges, and commandments. Electronics 2024, 13, 3417. [Google Scholar] [CrossRef] [Scilit]
- Alboaneen, D.; Alhajri, S.; Alhajri, K.; Aljalal, M.; Alalyani, N.; Alsaadan, H.; Al Thonayan, Z.; Alyafer, R. Siyasat: AI-Powered AI Governance Tool to Generate and Improve AI Policies According to Saudi AI Ethics Principles. Computers 2025, 14, 452. [Google Scholar] [CrossRef] [Scilit]
- Centro de Investigaciones Sociológicas. Inteligencia Artificial. Estudio 3495 2025. Available online: https://www.cis.es/documents/d/cis/es3495mar-pdf (accessed on 7 February 2026).
- Ajzen, I. The theory of planned behavior. Organ. Behav. Hum. Decis. Process 1991, 50, 179–211. [Google Scholar] [CrossRef] [Scilit]
- Davis, F.D. Perceived Usefulness, Perceived Ease of Use, and User Acceptance of Information Technology. MIS Q. 1989, 13, 319–340. [Google Scholar] [CrossRef] [Scilit]
- Parasuraman, A. Technology Readiness Index (TRI): A Multiple-Item Scale to Measure Readiness to Embrace New Technologies. J. Serv. Res. 2000, 2, 307–320. [Google Scholar] [CrossRef] [Scilit]
- Lin, C.-H.; Shih, H.-Y.; Sher, P.J. Integrating Technology Readiness into Technology Acceptance: The TRAM Model. Psychol. Mark. 2007, 24, 641–657. [Google Scholar] [CrossRef] [Scilit]
- Fernandes, A.J.C.; Ferreira, J.J.; Fernandes, C.I.; Kraus, S. Digital entrepreneurship: Theoretical foundations, methods, and trends. Found. Trends Entrep. 2024, 20, 574–678. [Google Scholar] [CrossRef] [Scilit]
- Borwein, S.; Magistro, B.; Loewen, P.; Bonikowski, B.; Lee-Whiting, B. The gender gap in attitudes toward workplace technological change. Socioecon. Rev. 2024, 22, 993–1017. [Google Scholar] [CrossRef] [Scilit]
- Kozak, J.; Fel, S. How Sociodemographic Factors Relate to Trust in Artificial Intelligence Among Students in Poland and the United Kingdom. Sci. Rep. 2024, 14, 28776. [Google Scholar] [CrossRef] [Scilit] [PubMed]
- Venkatesh, V.; Morris, M.G.; Davis, G.B.; Davis, F.D. User Acceptance of Information Technology: Toward a Unified View. MIS Q. 2003, 27, 425–478. [Google Scholar] [CrossRef] [Scilit]
- Leong, L.-Y.; Hew, T.-S.; Ooi, K.-B.; Tan, G.W.-H.; Koohang, A. An SEM-ANN Approach-Guidelines in Information Systems Research. J. Comput. Inf. Syst. 2025, 65, 706–737. [Google Scholar] [CrossRef] [Scilit]
- Gbongli, K.; Xu, Y.; Amedjonekou, K.M. Extended technology acceptance model to predict mobile-based money acceptance and sustainability. Sustainability 2019, 11, 3639. [Google Scholar] [CrossRef] [Scilit]
- Salifu, I.; Arthur, F.; Arkorful, V.; Nortey, S.A.; Osei-Yaw, R.S. Economics students’ behavioural intention and usage of ChatGPT in higher education. Cogent Soc. Sci. 2024, 10, 2300177. [Google Scholar] [CrossRef] [Scilit]
- Legesse, A.; Beshah, B.; Berhan, E.; Tesfaye, E. Exploring the influencing factors of blockchain technology adoption in national quality infrastructure: A Dual-Stage structural equation model and artificial neural network approach using TAM-TOE framework. Cogent Eng. 2024, 11, 2369220. [Google Scholar] [CrossRef] [Scilit]
- Yudhistyra, W.I.; Srinuan, C. Adoption of industry-oriented enterprise resource planning systems: A rigorous empirical research in the mining industry leveraging PLS-SEM and artificial neural networks models. Results Eng. 2025, 28, 107280. [Google Scholar] [CrossRef] [Scilit]
- Albahri, A.S.; Alnoor, A.; Zaidan, A.A.; Albahri, O.S.; Hameed, H.; Zaidan, B.B.; Peh, S.S.; Zain, A.B.; Siraj, S.B.; Masnan, A.H.B.; et al. Hybrid artificial neural network and structural equation modelling techniques: A survey. Complex Intell. Syst. 2022, 8, 1781–1801. [Google Scholar] [CrossRef] [Scilit] [PubMed]
- Lundberg, S.M.; Lee, S.-I. A unified approach to interpreting model predictions. Adv. Neural Inf. Process Syst. 2017, 30, 4765–4774. [Google Scholar]
- de Andrés-Sánchez, J.; Arias-Oliva, M.; Souto-Romero, M.; Llorens-Marín, M. Integrating Machine Learning Techniques and the Unified Theory of Acceptance and Use of Technology to Evaluate Drivers for the Acceptance of Blockchain-Based Loyalty Programmes. Comput. Econ 2026. [Google Scholar] [CrossRef] [Scilit]
- Berkowsky, R.W.; Sharit, J.; Czaja, S.J. Factors Predicting Decisions About Technology Adoption Among Older Adults. Innov. Aging 2017, 1, igy002. [Google Scholar] [CrossRef] [Scilit]
- Viglia, G.; Dolnicar, S.; Acuti, D.; Nicolau, J.L. If you want to learn about real behaviour, measure real behaviour. J. Sustain. Tour. 2024, 32, 2245–2257. [Google Scholar] [CrossRef] [Scilit]
- Feuerriegel, S.; Hartmann, J.; Janiesch, C.; Zschech, P. Generative AI. Bus. Inf. Syst. Eng. 2024, 66, 111–126. [Google Scholar] [CrossRef] [Scilit]
- Taylor, S.; Todd, P.A. Understanding Information Technology Usage: A Test of Competing Models. Inf. Syst. Res. 1995, 6, 144–176. [Google Scholar] [CrossRef] [Scilit]
- Stiglitz, J.E.; Sen, A.; Fitoussi, J.-P. Report by the Commission on the Measurement of Economic Performance and Social Progress 2009. Available online: https://www.researchgate.net/publication/258260767_Report_of_the_Commission_on_the_Measurement_of_Economic_Performance_and_Social_Progress_CMEPSP (accessed on 7 February 2026).
- United Nations. Transforming Our World: The 2030 Agenda for Sustainable Development 2015. Available online: https://sdgs.un.org/2030agenda (accessed on 7 February 2026).
- United Nations Development Programme. Human Development Report 2023/2024. 2024. Available online: https://hdr.undp.org/system/files/documents/global-report-document/hdr2023-24reporten.pdf (accessed on 7 February 2026).
- Rogers, E.M. Diffusion of Innovations, 5th ed.; Free Press: New York, NY, USA, 2003. [Google Scholar]
- Oudshoorn, N.; Rommes, E.; Stienstra, M. Configuring the User as Everybody: Gender and Design Cultures in Information and Communication Technologies. Sci. Technol. Hum. Values 2004, 29, 30–63. [Google Scholar] [CrossRef] [Scilit]
- Hoffmann, C.P.; Lutz, C.; Meckel, M. Digital natives or digital immigrants? The impact of user characteristics on online trust. J. Manag. Inf. Syst. 2014, 31, 138–171. [Google Scholar] [CrossRef] [Scilit]
- Venkatesh, V.; Thong, J.Y.L.; Xu, X. Consumer Acceptance and Use of Information Technology: Extending the Unified Theory of Acceptance and Use of Technology. MIS Q. 2012, 36, 157–178. [Google Scholar] [CrossRef] [Scilit]
- Souto-Romero, M.; Arias-Oliva, M.; de Andrés-Sánchez, J.; Llorens-Marín, M. The Relevance of Cognitive and Affective Factors to Explain the Acceptance of Blockchain Use: The Case of Loyalty Programmes. Computers 2024, 14, 8. [Google Scholar] [CrossRef] [Scilit]
- Mahmoud, A.B.; Kumar, V.; Spyropoulou, S. Identifying the Public’s Beliefs about Generative Artificial Intelligence: A Big Data Approach. IEEE Trans. Eng. Manag. 2025, 72, 827–841. [Google Scholar] [CrossRef] [Scilit]
- Camilleri, M.A. Factors affecting performance expectancy and intentions to use ChatGPT: Using SmartPLS to advance an information technology acceptance framework. Technol. Forecast. Soc. Chang. 2024, 201, 123247. [Google Scholar] [CrossRef] [Scilit]
- Ibrahim, F.; Münscher, J.-C.; Daseking, M.; Telle, N.-T. The technology acceptance model and adopter type analysis in the context of artificial intelligence. Front. Artif. Intell. 2025, 7, 1496518. [Google Scholar] [CrossRef] [Scilit]
- Yudhistyra, W.I.; Srinuan, C. Exploring the Acceptance of Technological Innovation Among Employees in the Mining Industry: A Study on Generative Artificial Intelligence. IEEE Access 2024, 12, 165797–165809. [Google Scholar] [CrossRef] [Scilit]
- Gansser, O.A.; Reich, C.S. A new acceptance model for artificial intelligence with extensions to UTAUT2: An empirical study in three segments of application. Technol. Soc. 2021, 65, 101535. [Google Scholar] [CrossRef] [Scilit]
- Al Darayseh, A. Acceptance of artificial intelligence in teaching science: Science teachers’ perspective. Comput. Educ. Artif. Intell. 2023, 4, 100132. [Google Scholar] [CrossRef] [Scilit]
- Strzelecki, A. To use or not to use ChatGPT in higher education? A study of students’ acceptance and use of technology. Interact. Learn. Environ. 2024, 32, 5142–5155. [Google Scholar] [CrossRef] [Scilit]
- Benbya, H.; Strich, F.; Tamm, T. Navigating Generative Artificial Intelligence Promises and Perils for Knowledge and Creative Work. J. Assoc. Inf. Syst. 2024, 25, 23–36. [Google Scholar] [CrossRef] [Scilit]
- Barros, A.; Prasad, A.; Sliwa, M. Generative artificial intelligence and academia: Implication for research, teaching and service. Manag. Learn. 2023, 54, 597–604. [Google Scholar] [CrossRef] [Scilit]
- Phatthanachaisuksiri, L.; Cai, M.; Karam, H.; Palliyil, V.; Suhre, N.; Kaßens-Noor, E. Exploring the role of AI in achieving the SDGs: A systematic review of academic studies on AI in the industry sector. Open Res. Eur. 2025, 5, 160. [Google Scholar] [CrossRef] [Scilit]
- Dwivedi, Y.K.; Kshetri, N.; Hughes, L.; Slade, E.L.; Jeyaraj, A.; Kar, A.K.; Baabdullah, A.M.; Koohang, A.; Raghavan, V.; Ahuja, M.; et al. Opinion paper: “So what if ChatGPT wrote it?” Multidisciplinary perspectives on opportunities, challenges and implications of generative conversational AI for research, practice and policy. Int. J. Inf. Manag. 2023, 71, 102642. [Google Scholar] [CrossRef] [Scilit]
- Shirali-Shahreza, S. Set up my smart home as I want. Computer 2024, 57, 65–73. [Google Scholar] [CrossRef] [Scilit]
- Daungsupawong, H.; Wiwanitkit, V. Correspondence: Generative artificial intelligence in healthcare. Int. J. Med. Inf. 2024, 189, 105498. [Google Scholar] [CrossRef] [Scilit]
- Hamad, Z.T.; Jamil, N.; Belkacem, A.N. ChatGPT’s impact on education and healthcare: Insights, challenges, and ethical consideration. IEEE Access 2024, 12, 114858–114877. [Google Scholar] [CrossRef] [Scilit]
- Rodriguez-Sanchez, C.; Sancho-Esper, F.M.; Casaló, L.V.; López, M. Generative AI as a source of information on environmental problems: Understanding its influence on Generation Z. Technol. Soc. 2025, 83, 103036. [Google Scholar] [CrossRef] [Scilit]
- INTERPOL Innovation Centre. ChatGPT: Impacts on Law Enforcement 2023. Available online: https://worldpolicesummit.com/chatgpt-impacts-on-law-enforcement/ (accessed on 7 February 2026).
- Madsen, D.Ø.; Toston, D.M. ChatGPT and Digital Transformation: A Narrative Review of Its Role in Health, Education, and the Economy. Digital 2025, 5, 24. [Google Scholar] [CrossRef] [Scilit]
- Parasuraman, A.; Colby, C.L. An Updated and Streamlined Technology Readiness Index: TRI 2.0. J. Serv. Res. 2015, 18, 59–74. [Google Scholar] [CrossRef] [Scilit]
- Agarwal, R.; Prasad, J. A conceptual and operational definition of personal innovativeness in the domain of information technology. Inf. Syst. Res. 1998, 9, 204–215. [Google Scholar] [CrossRef] [Scilit]
- Lu, J.; Yao, J.E.; Yu, C.-S. Personal innovativeness, social influences and adoption of wireless Internet services via mobile technology. J. Strateg. Inf. Syst. 2005, 14, 245–268. [Google Scholar] [CrossRef] [Scilit]
- Chalutz Ben-Gal, H. Artificial intelligence (AI) acceptance in primary care during the coronavirus pandemic: What is the role of patients’ gender, age and health awareness? A two-phase pilot study. Front. Public Health 2023, 10, 931225. [Google Scholar] [CrossRef] [Scilit]
- Biloš, A.; Budimir, B. Understanding the Adoption Dynamics of ChatGPT among Generation Z: Insights from a Modified UTAUT2 Model. J. Theor. Appl. Electron. Commer. Res. 2024, 19, 863–879. [Google Scholar] [CrossRef] [Scilit]
- Blut, M.; Wang, C. Technology Readiness: A Meta-Analysis of Conceptualizations of the Construct and Its Impact on Technology Usage. J. Acad. Mark. Sci. 2020, 48, 649–669. [Google Scholar] [CrossRef] [Scilit]
- Tunmibi, S.; Okuonghae, N. Technological Readiness as Predictor of Artificial Intelligence Technology Adoption among Librarians in Nigeria. Libr. Philos. Pract. 2023, 7876. [Google Scholar] [CrossRef] [Scilit]
- Abaddi, S. GPT revolution and digital entrepreneurial intentions. J. Entrep. Emerg. Econ. 2024, 16, 1903–1930. [Google Scholar] [CrossRef] [Scilit]
- Spaniol, M.J.; Rowland, N.J. AI-assisted scenario generation for strategic planning. Futures Foresight Sci. 2023, 5, e148. [Google Scholar] [CrossRef] [Scilit]
- Biloslavo, R.; Edgar, D.; Aydin, E.; Bulut, C. Artificial intelligence (AI) and strategic planning process within VUCA environments. Manag. Decis. 2024, 63, 3599–3624. [Google Scholar] [CrossRef] [Scilit]
- Ponnock, J. Generative AI for strategic plan development. arXiv 2025, arXiv:2508.07405. [Google Scholar] [CrossRef] [Scilit]
- Tang, C.; Li, S.; Hu, S.; Zeng, F.; Du, Q. Gender disparities in the impact of generative artificial intelligence: Evidence from academia. PNAS Nexus 2025, 4, pgae591. Available online: https://academic.oup.com/pnasnexus/article/4/2/pgae591/7996465 (accessed on 1 February 2026).
- Otis, N.G.; Cranney, K.; Delecourt, S.; Koning, R. Global Evidence on Gender Gaps and Generative AI. 2024. Available online: https://osf.io/preprints/osf/h6a7c_v1 (accessed on 1 February 2026).
- Graño Calvete, M. La brecha de Género en la era de la Inteligencia Artificial. OBS Business School, 2024. Available online: https://marketing.onlinebschool.es/Prensa/Informes/Informe%20OBS%20Brecha%20de%20genero%20en%20la%20era%20IA.pdf (accessed on 1 February 2026).
- Aldasoro, I.; Armantier, O.; Doerr, S.; Gambacorta, L.; Oliviero, T. The GenAI Gender Gap. Econ. Lett. 2024, 241, 111814. [Google Scholar] [CrossRef] [Scilit]
- Chan, C.K.Y.; Lee, K.K.W. The AI generation gap: Are Gen Z students more interested in adopting generative AI such as ChatGPT in teaching and learning than their Gen X and millennial generation teachers? Smart Learn. Environ. 2023, 10, 60. [Google Scholar] [CrossRef] [Scilit]
- Instituto Nacional de Estadística. Clasificación Nacional de Ocupaciones 2011 (CNO-11). 2011. Available online: https://www.ine.es/daco/daco42/clasificaciones/cno11_notas.pdf (accessed on 7 February 2026).
- Becker, R. Gender and Survey Participation: An Event History Analysis of the Gender Effects of Survey Participation in a Probability-based Multi-wave Panel Study with a Sequential Mixed-mode Design. Methods Data Anal. 2022, 16, 3–32. [Google Scholar] [CrossRef]
- Greco, S.; Ishizaka, A.; Tasiou, M.; Torrisi, G. On the methodological framework of composite indices: A review of the issues of weighting, aggregation, and robustness. Soc. Indic. Res. 2019, 141, 61–94. [Google Scholar] [CrossRef] [Scilit]
- Nardo, M.; Saisana, M.; Saltelli, A.; Tarantola, S. Tools for Composite Indicators Building; Joint Research Centre European Commission: Ispra, Italy, 2005. [Google Scholar]
- Bjuggren, C.M.; Johansson, D.; Stenkula, M. Using self-employment as proxy for entrepreneurship: Some empirical caveats. Int. J. Entrep. Small Bus. 2012, 17, 290–303. [Google Scholar] [CrossRef] [Scilit]
- Caballero, M.; Baigorri, A. Glocalising the theory of generations: The case of Spain. Time Soc. 2019, 28, 333–357. [Google Scholar] [CrossRef] [Scilit]
- Haykin, S. Neural Networks and Learning Machines, 3rd ed.; Pearson: London, UK, 2009. [Google Scholar]
- de Andrés-Sánchez, J.; Arias-Oliva, M.; Souto-Romero, M.; Llorens-Marín, M. Evaluating explanatory factors of the acceptance of blockchain-based loyalty programs with neural networks. Data Sci. Financ. Econ. 2026, 6, 58–84. [Google Scholar] [CrossRef] [Scilit]
- Ozili, P.K. The acceptable R-square in empirical modelling for social science research. In Social Research Methodology and Publishing Results; Springer: Berlin/Heidelberg, Germany, 2023; pp. 134–143. [Google Scholar]
- Yarkoni, T.; Westfall, J. Choosing prediction over explanation in psychology: Lessons from machine learning. Perspect. Psychol. Sci. 2017, 12, 1100–1122. [Google Scholar] [CrossRef] [Scilit] [PubMed]
- Venkatesh, V.; Thong, J.Y.L.; Xu, X. Unified Theory of Acceptance and Use of Technology: A Synthesis and the Road Ahead. J. Assoc. Inf. Syst. 2016, 17, 328–376. [Google Scholar] [CrossRef] [Scilit]
- Ansone, A.; Zalite-Supe, Z.; Daniela, L. Generative Artificial Intelligence as a Catalyst for Change in Higher Education Art Study Programs. Computers 2025, 14, 154. [Google Scholar] [CrossRef] [Scilit]
- Venkatesh, V.; Bala, H. Technology Acceptance Model 3 and a Research Agenda on Interventions. Decis. Sci. 2008, 39, 273–315. [Google Scholar] [CrossRef] [Scilit]
- Ministerio de Trabajo y Seguridad Social. El Empleo Autónomo en España. 2025. Available online: https://sepe.es/dctm/informes:09019af480268def/RElTRVdFQg==/4613-1.pdf (accessed on 7 February 2026).
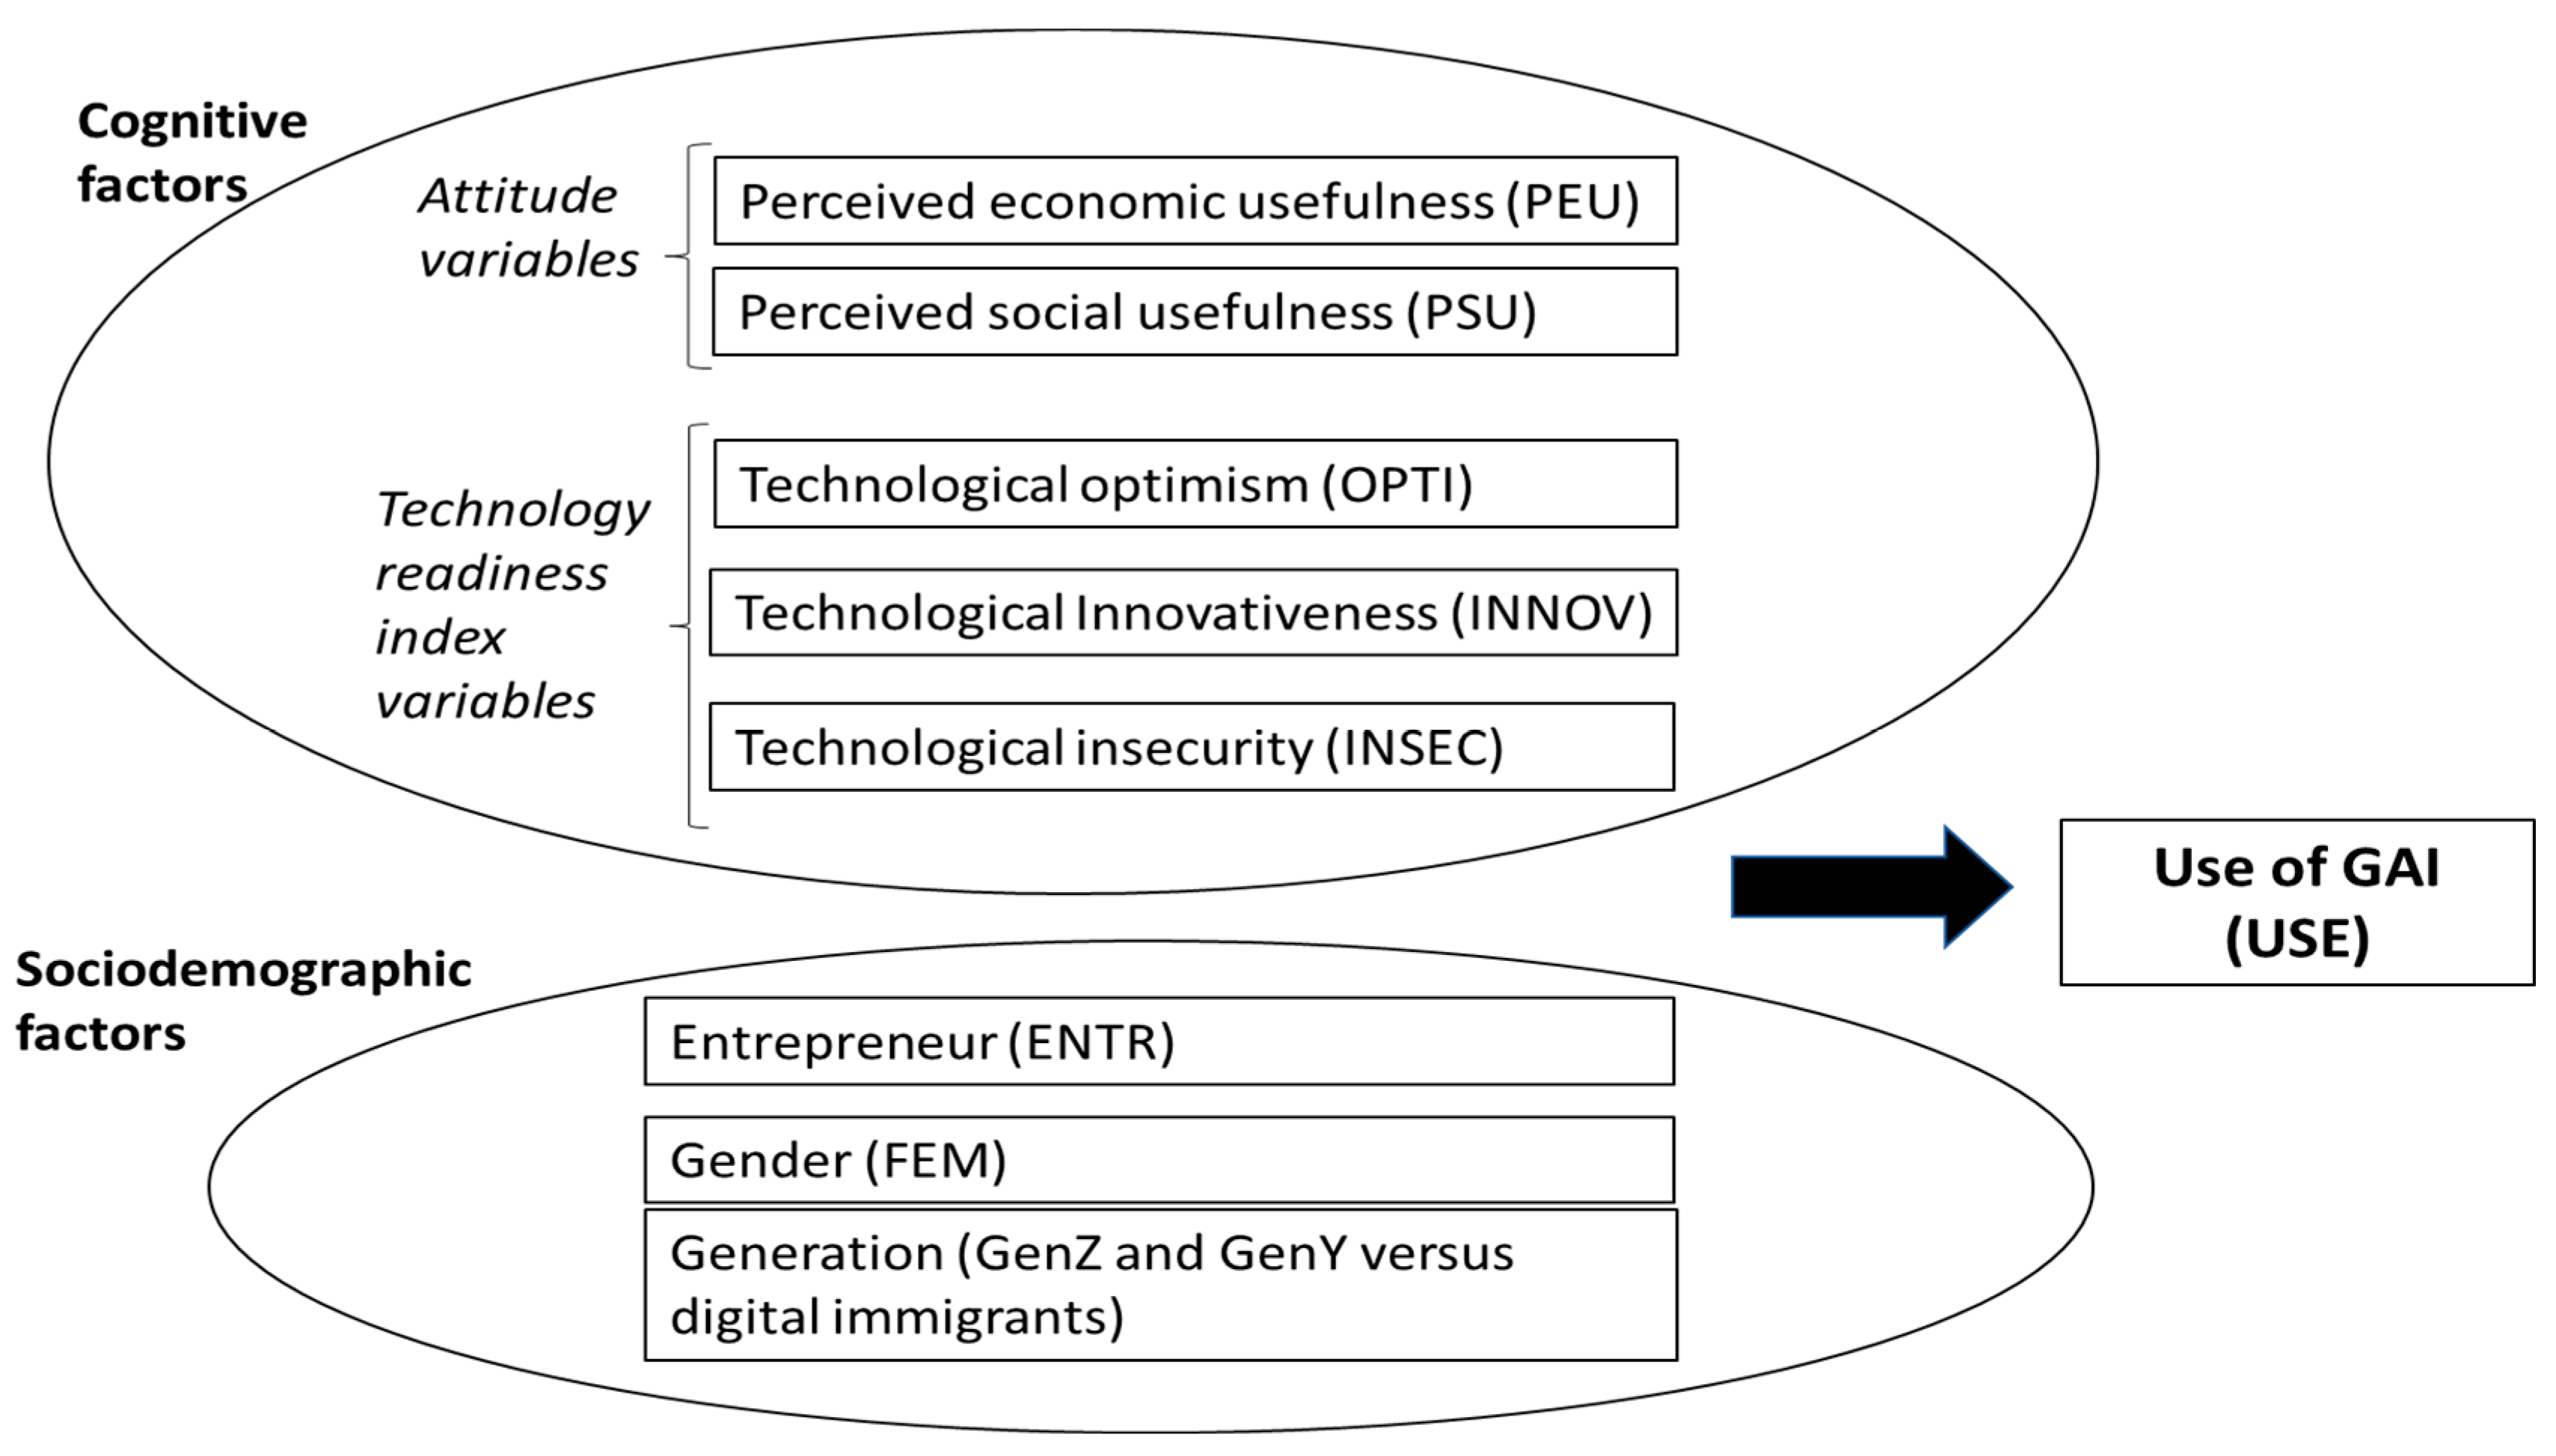
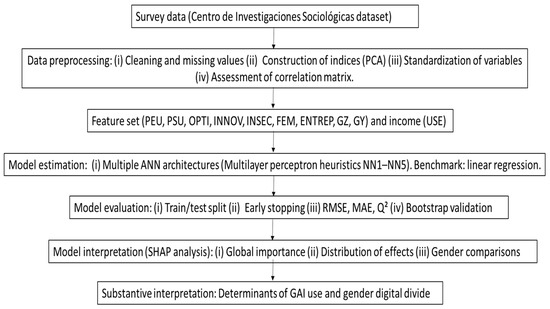
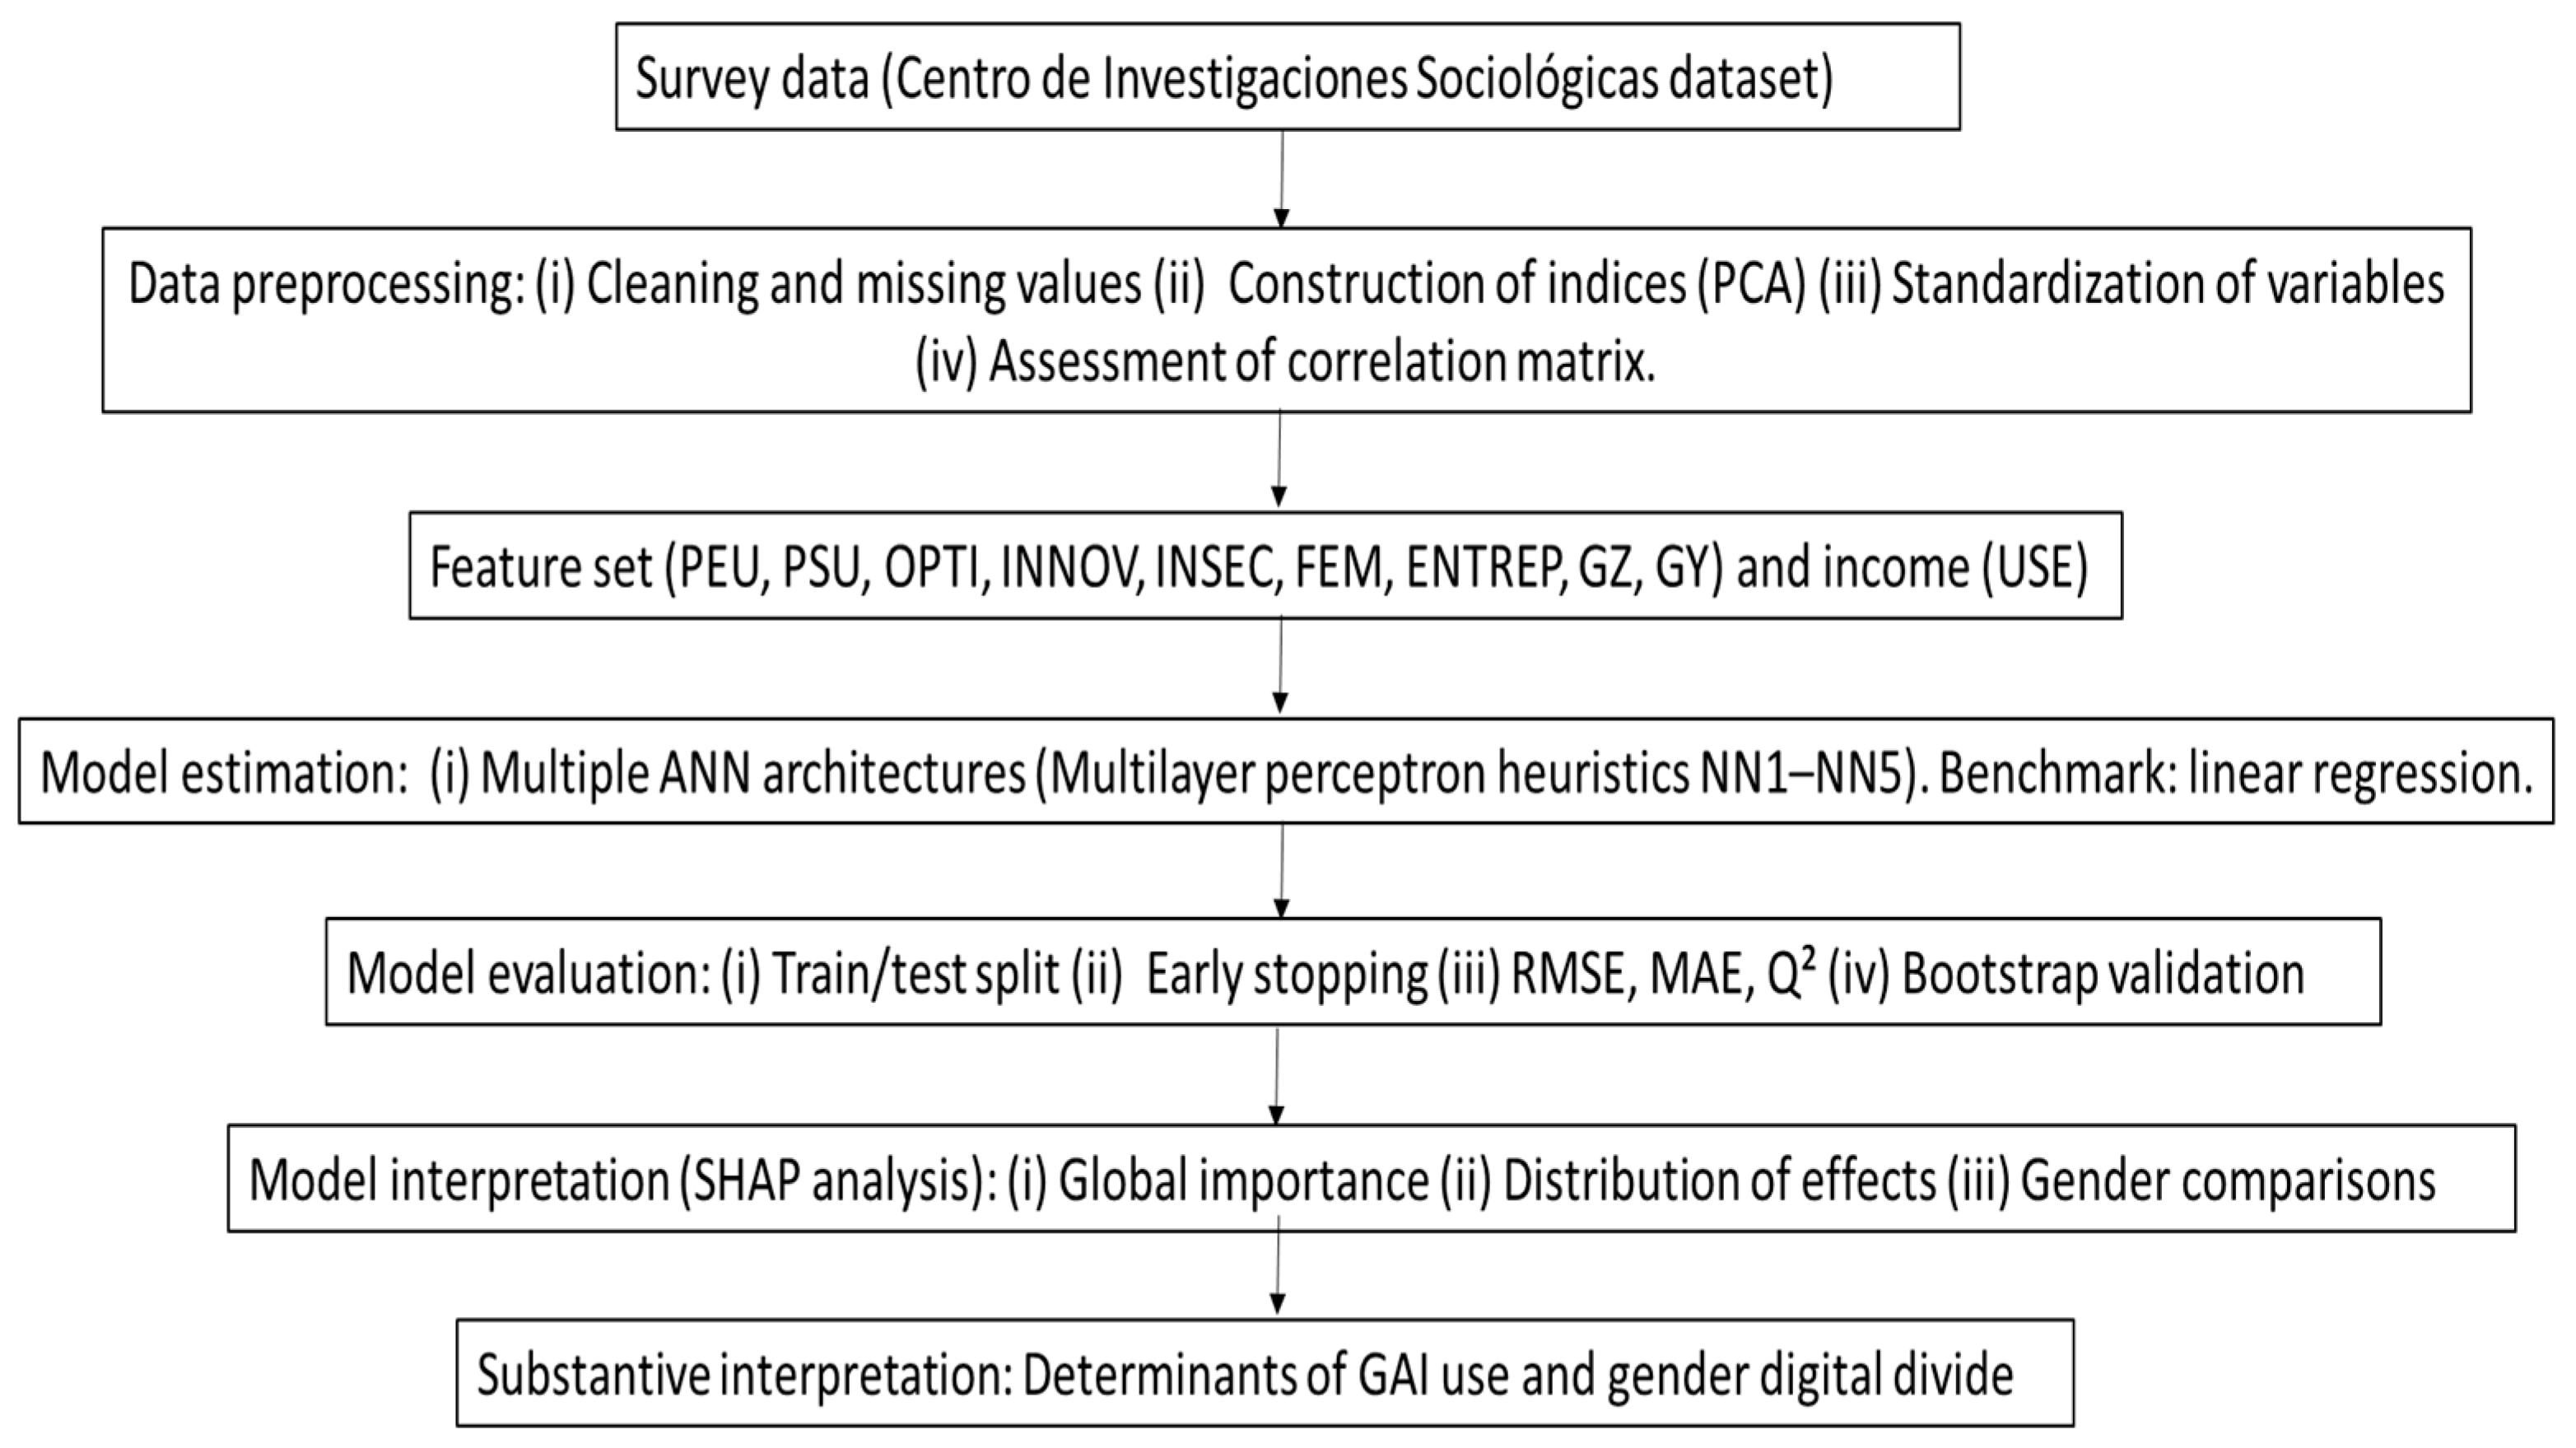
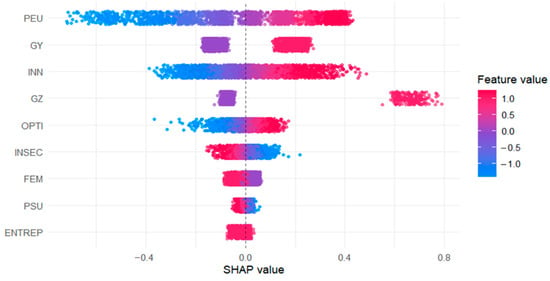
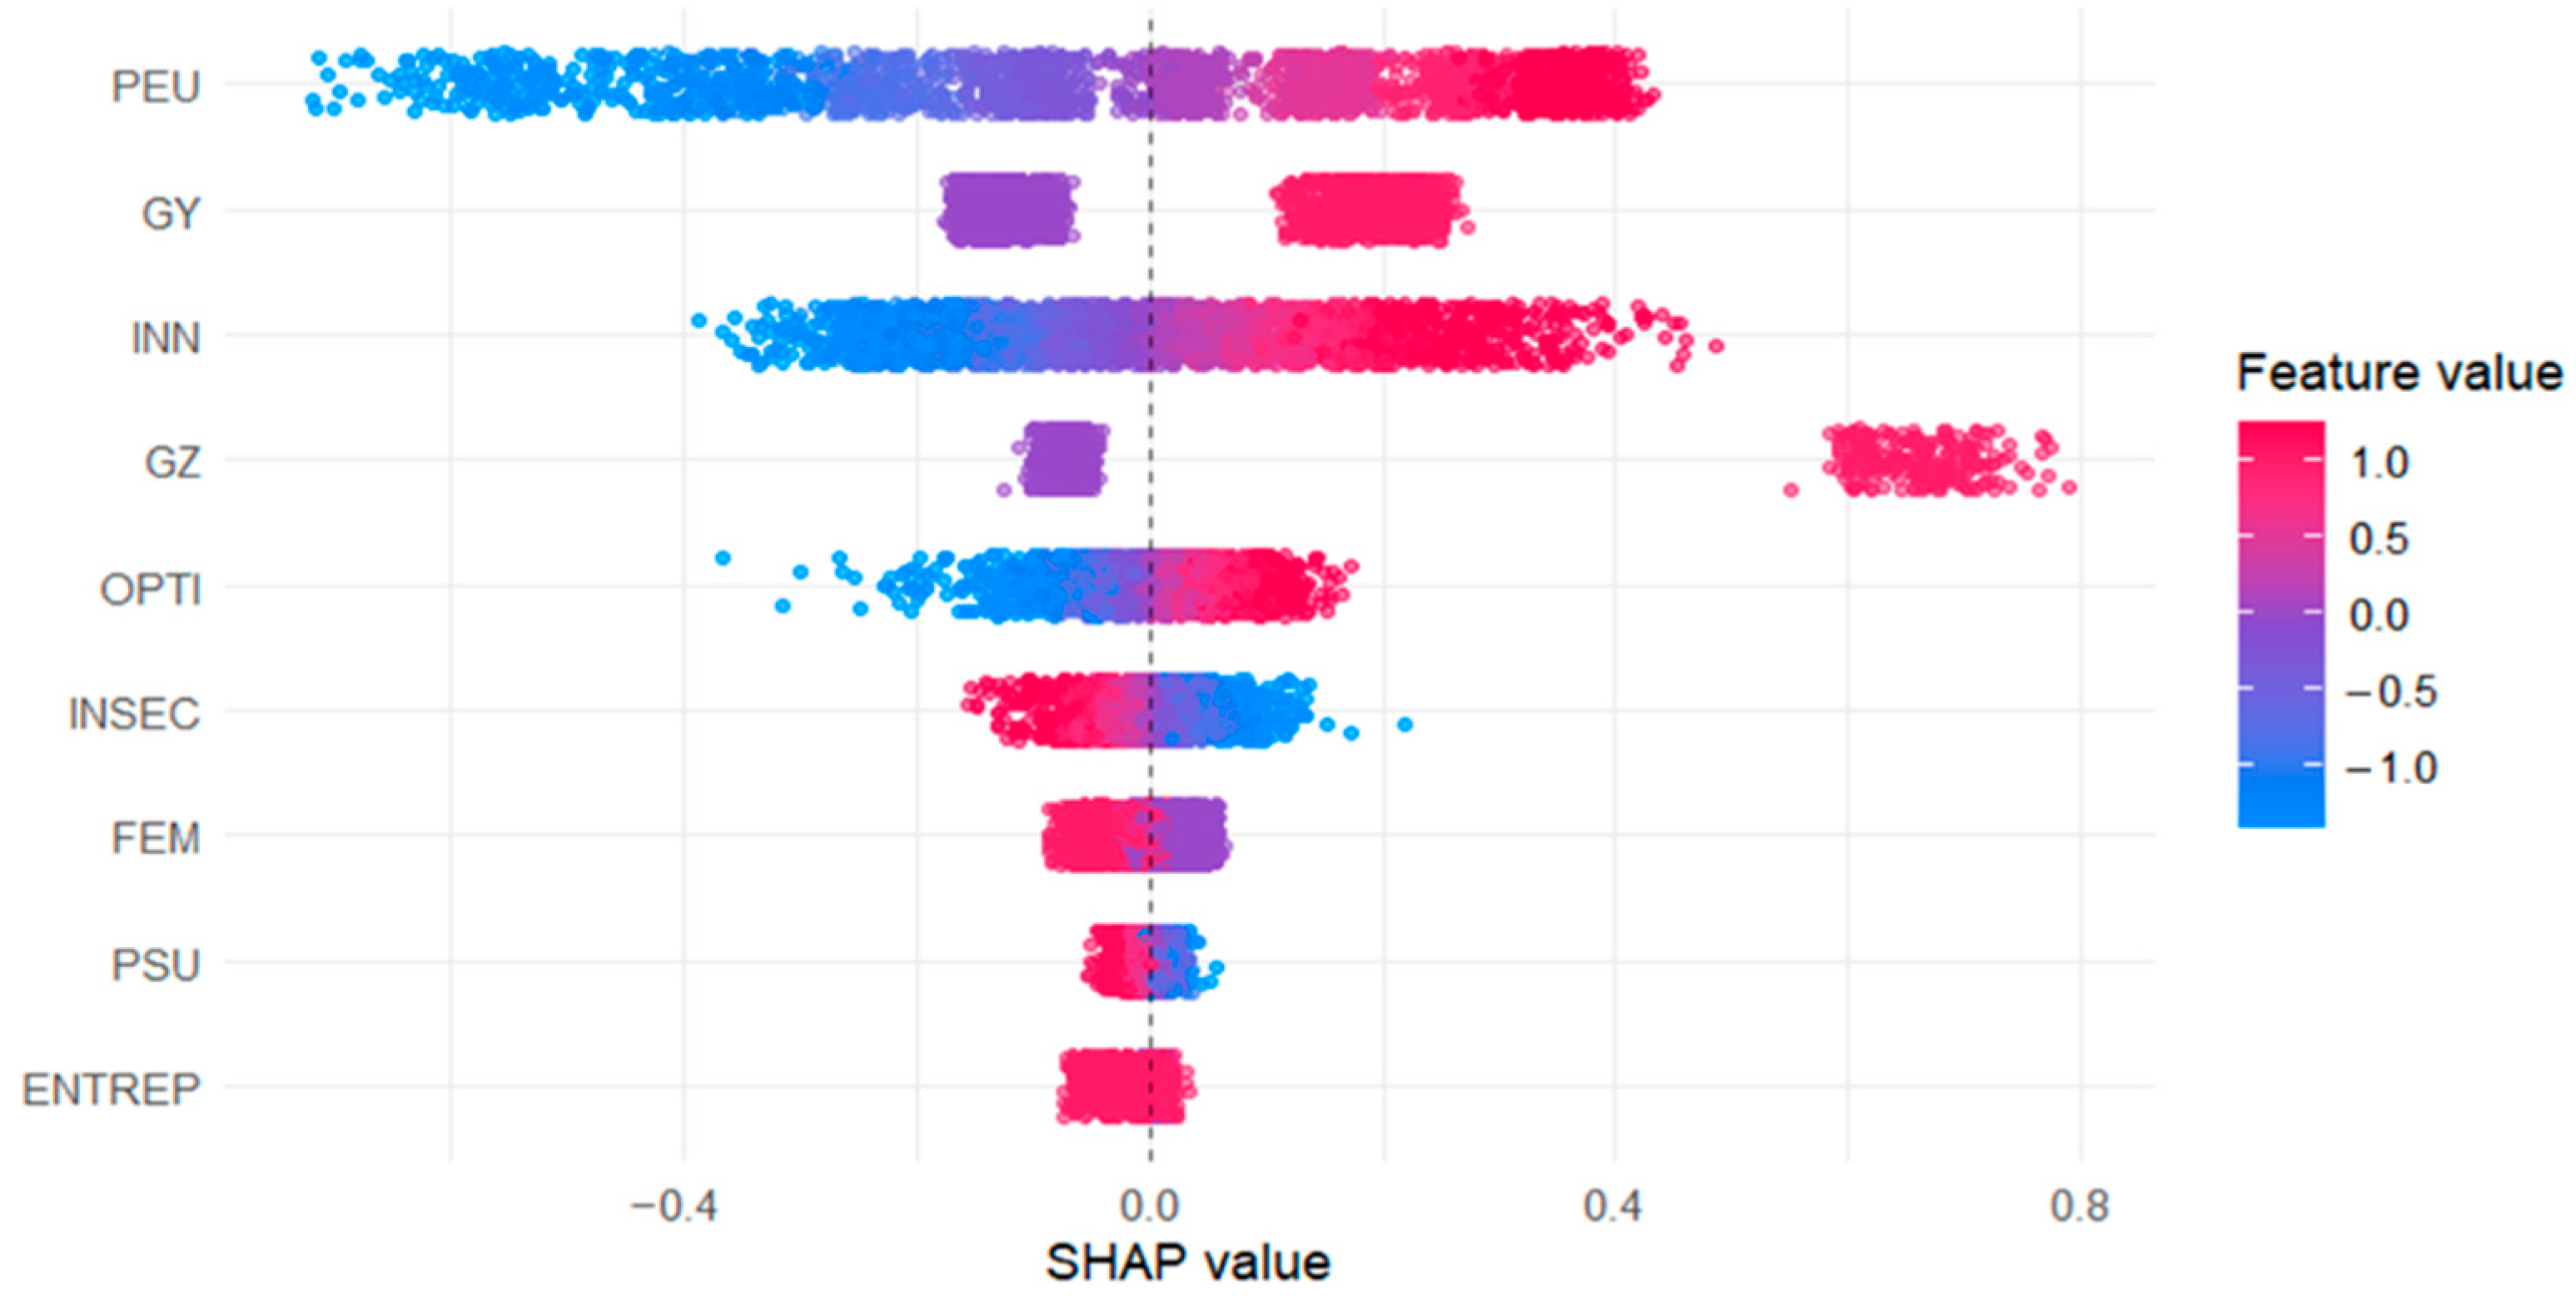

Disclaimer/Publisher’s Note: The statements, opinions and data contained in all publications are solely those of the individual author(s) and contributor(s) and not of MDPI and/or the editor(s). MDPI and/or the editor(s) disclaim responsibility for any injury to people or property resulting from any ideas, methods, instructions or products referred to in the content. |
© 2026 by the authors. Licensee MDPI, Basel, Switzerland. This article is an open access article distributed under the terms and conditions of the Creative Commons Attribution (CC BY) license.