


Abstract
Organizational productivity and workforce management are highly affected by employee attrition. Thus, an employee attrition prediction system may allow human resource management to enhance the workplace by minimizing attrition. This study proposes a new and interpretable ensemble learning framework for employee attrition prediction. The model integrates SHapley Additive exPlanations (SHAP)-based feature selection, Optuna hyperparameter optimization, and dual explainability using SHAP and Local Interpretable Model-agnostic Explanations (LIME). Random oversampling (ROS) is used to address class imbalance. The proposed framework allows for both global and local interpretability, enabling actionable insights into retention drivers. It was assessed using two benchmark datasets: the Kaggle HR Analytics dataset (14,999 records) and the IBM HR dataset (1470 records). The results revealed that the most impactful factors on employee attrition are promotion history, tenure, job satisfaction, workload, average monthly hours, overtime, and financial incentives. Furthermore, the proposed model achieved exceptional performance on both datasets. On the Kaggle dataset, it reached an accuracy of 98.72%, an F1-score of 97.29%, and an ROC–AUC of 0.994, while on the IBM dataset, it produced an accuracy of 97.72%, an F1-score of 97.74%, and an ROC–AUC of 0.995. Moreover, the proposed approach shows high computational efficiency, demonstrating that it is suitable for real-world deployment. These findings indicate that integrating explainable AI techniques, resampling tools, and automated hyperparameter tuning can achieve robust, accurate, and actionable employee attrition predictions, supporting HR managers’ decision-making.
1. Introduction
Business organizations have always been in pursuit of profit maximization, return on investment, and stakeholder wealth. Recently, however, this quest has taken place within a progressively multifaceted and competitive environment molded by hasty advances in digitalization, artificial intelligence (AI), and machine learning (ML) [1]. These expansions have presented significant strategic and operational obstacles, compelling firms to reassess their business models, in addition to sustainable organizational and managerial problems that may formerly have received limited attention. Nonetheless, technological progress has offered new possibilities for tackling such issues through more advanced systematic, data-driven, and evidence-based approaches [2].
Employee attrition is one of many never-ending organizational challenges. Despite the fact that employee departure has been known for a long time, and taking into consideration that organizations have conventionally endeavored to manage its effects, attrition nevertheless continues to pose serious difficulties. Such an issue becomes more potent when departing employees have particular skills that are difficult to replace. Moreover, even if the replacement is managed, attrition remains costly since it requires extensive time and resources dedicated to recruitment, selection, and training, in addition to loss in productivity during the adjustment time [3].
Scholars, and even managers, mix the terms “employee attrition” and “employee turnover”, but there is a difference between them. When referring to “employee attrition”, it means that employees have left their organization and their positions remain unfilled for an extended period, or are eliminated altogether [4]. Consequently, the organization may go through a provisional or enduring decrease in workforce number. Such a decrease often requires the rearrangement of responsibilities between remaining employees, which can upsurge workload pressures and, in some cases, increase attrition rate. On the other hand, “employee turnover” is about including all employment separations, irrespective of whether the vacated positions are filled afterwards. In this sense, attrition might be considered as a subset of turnover that results in long-term vacancies or job abolitions. While high attrition rates may progressively bring about organizational shrinkage, high turnover rates can coincide with stability or growth, as is recurrently witnessed in diverse sectors such as retail.
Within the human resource management literature, a common distinction is made between voluntary and involuntary attrition. Voluntary attrition refers to situations in which employees decide to leave an organization on their own initiative [5]. Such decisions may be motivated by personal considerations, career opportunities, dissatisfaction with working conditions, or the pursuit of improved work–life balance. Organizations may choose not to replace these employees, may face challenges in doing so, or may experience extended delays in the replacement process. Involuntary attrition, on the other hand, arises from employer-initiated terminations that are accompanied by the elimination of positions. This form of attrition is most often associated with organizational restructuring, downsizing, or mergers and acquisitions [6].
A substantial body of research has identified several factors that contribute to employee attrition, including inadequate compensation, excessive job demands, unfavorable organizational cultures, and poor work–life balance [7]. Regardless of its underlying causes, attrition imposes significant costs on organizations. These costs manifest in reduced productivity, lower employee morale, operational inefficiencies, and increased expenditures related to recruitment and training. When attrition remains unmanaged, it can negatively affect organizational performance and ultimately undermine competitive advantage [8]. Organizational effectiveness is therefore closely linked to the ability to maintain a stable and engaged workforce within a supportive work environment.
Previous studies have also emphasized the importance of skills, knowledge, and continuous learning for sustained organizational performance. To develop these capabilities, organizations invest considerable resources in recruiting, selecting, training, and integrating employees. From this perspective, employees represent a long-term investment rather than a short-term expense. When an employee leaves, the organization loses not only valuable skills and tacit knowledge but also the resources already invested in that individual. These losses are further compounded by the additional investments required to recruit and develop replacement employees, a process that is often lengthy and costly [9].
In light of the importance of managing attrition, organizations have increasingly sought to identify its determinants and to predict employee departures before they occur. In recent years, artificial intelligence has been applied across a wide range of domains, including business, education, healthcare, economics, and public administration. In particular, the application of AI and machine learning techniques to employee attrition prediction has attracted growing academic interest. Human resource data can be systematically collected and analyzed to uncover patterns and trends, thereby enabling the development of predictive models grounded in empirical evidence [10].
Machine learning, as a subfield of artificial intelligence, allows systems to learn from historical data and generate predictions about future outcomes. In the context of employee attrition, ML approaches are commonly formulated as binary classification problems, aimed at predicting whether an employee is likely to remain with or leave an organization. These models typically rely on structured data, including demographic characteristics, performance indicators, job-related attributes, and working conditions. Commonly used supervised learning algorithms include Logistic Regression, Decision Trees, Random Forests, Support Vector Machines, and K-Nearest Neighbors. To improve predictive performance, ensemble techniques such as voting and stacking have also been employed. More recently, some studies have explored deep learning approaches, including Artificial Neural Networks and Multilayer Perceptron [11].
Despite the progress achieved through AI-based approaches, existing employee attrition models continue to exhibit notable limitations. In particular, many models struggle to adequately address class imbalance within attrition datasets and offer limited transparency in terms of model interpretation. These shortcomings restrict their practical usefulness and may hinder their adoption in real organizational settings.
Thus, this study aims to develop an efficient and explainable ensemble learning framework for accurate employee attrition prediction in real HR analytics environments. The main objective is to optimize XGBoost using Optuna while effectively addressing class imbalance without synthetic data generation. Additionally, the study seeks to enhance model transparency through SHAP-based feature selection and multi-level explainability, enabling both global and individual-level interpretation of predictions. In addition, this research aims to provide a comprehensive comparative evaluation of ensemble learning models and class imbalance handling techniques across multiple HR datasets, examining their predictive performance using accuracy, F1-score, ROC-AUC, and confusion matrix metrics to determine the most robust and generalizable approach. Moreover, the computational sustainability of the proposed models is evaluated by introducing and analyzing green efficiency in order to select the high-performance yet resource-efficient solution suitable for real-world HR analytics deployment.
This paper is organized into five main sections. The previous systems are described in Section 2 with a presentation of their limitations and the main motivation of this study. The proposed approach is described and compared in Section 3. The results of applying the proposed method on two HR datasets are illustrated in Section 4. This paper concludes in Section 5.
2. Existing Models
As explained above, employee attrition presents numerous challenges for organizations, resulting in diminished productivity, lowered employee morale, and financial instability. Consequently, it causes losses and may waste recruitment and training expenditures. The application of standard machine learning methodologies encounters two principal challenges, their inadequacy in addressing unbalanced classes and their deficiency in transparency, as these models often work as black boxes and provide little information, which may not be useful for human resource (HR) managers to better comprehend main elements such as job satisfaction, workload, or compensation that may affect employee attrition. This limited interpretability may reduce trust in the model’s decisions and inhibit organizations from transforming the outcomes of the models into actionable and fair retention strategies. Consequently, conventional machine learning models are inadequate in offering a viable solution for employee attrition.
Recent research has concentrated on developing more resilient intelligence systems to aid organizations in identifying employee attrition and the primary factors behind it. The authors in [12] introduced an explainable AI (XAI) framework designed to achieve enhanced predictive accuracy and interpretability in turnover forecasting. The study utilized two accessible HR datasets from IBM and Kaggle, which were subjected to preprocessing via label encoding and MinMax scaling. The researchers employed Generative Adversarial Network (GAN)-based synthetic data generation to mitigate the impact of class imbalance. The three-layer Transformer encoder executed binary classification, while SHAP generated both general and specific elucidations regarding feature significance. The model’s performance was assessed using accuracy, precision, recall, F1-score, and Receiver Operating Characteristic–Area Under the Curve (ROC AUC) metrics. One study [13] examines the capacity of ML models to forecast employee performance and retention, as these elements influence organizational success. The organization necessitates data-driven solutions to address its performance deficiencies and employee retention challenges that could result in significant financial losses. The authors conduct a comprehensive review of existing research to identify the factors that may most significantly influence employee performance. Then, they present a methodology for constructing predictive models that aid organizations in forecasting events, demonstrating that these models enable businesses to optimize resource allocation, resulting in enhanced efficiency and reduced employee attrition costs. The researchers in [14] propose an enhanced method for feature selection employing machine learning techniques to forecast employee turnover patterns. The system employs a hybrid approach that integrates filtering techniques with wrapper and embedding methods to identify essential predictors while reducing data dimensions by 60%. The study utilizes a dataset comprising 1470 employee records with 35 attributes. The MinMaxScaler normalization is employed in conjunction with the SMOTE to address class imbalance issues. The SHAP value analysis indicates that overtime requirements, monthly earnings, and work involvement influence employee attrition rates, while revealing a strong correlation between salary levels and work hours. The system design enhances model comprehension while preserving predictive capabilities, enabling HR personnel to formulate targeted employee retention strategies.
In [15], the methodology used for predicting employee attrition enables the implementation of talent management measures that were previously executed retrospectively. The authors utilize 1470 entries from the “IBM HR Analytics Employee Attrition and Performance data” for this objective. They create a two-stage staking ensemble model that combines the fundamental models of Random Forest, K-Nearest Neighbor, Naïve Bayes, and Decision Tree with the meta-model of Logistic Regression for prediction purposes. In [16], the researchers offer an ensemble learning model to predict the intention to quit (IQ) based on selected indicators, including job involvement (JI), organizational commitment (OC), activity on professional networking sites (APNS), and updating profiles on job portals (PJP). The Receiver Operating Characteristic (ROC) assesses the accuracy of the model. The most significant correlation for predicting the intention to resign is shown between engagement on professional networking platforms and the updating of profiles on job portals on social media. Seven classification algorithms—Gradient Boosting, Random Forest, K-Nearest Neighbor, Logistic Regression, Neural Network, Support Vector Machine, and Naïve Bayes—are employed to construct the classification model. Furthermore, four combinations of the aforementioned strategies are employed to develop an ensemble learning classification model.
Another study [17] investigates the capacity of supervised machine learning methods to convert raw data into strategic insights within human resource management. The authors examine a database comprising approximately 205 variables and 2932 observations pertaining to a global telecommunications firm, evaluating the predictive and analytical efficacy of classification Decision Trees in identifying the factors influencing voluntary employee attrition. The authors in [18] examine the critical issue of anticipating employee attrition, enabling managers to implement effective retention measures and save the substantial expenses linked to recruiting and training new staff. Unlike prior research, this study describes an innovative deep learning approach that incorporates an intermediary layer to autonomously produce a concealed picture representation from tabular data. This intermediary stage enables the effective use of Convolutional Neural Networks tailored to picture data, thus improving prediction accuracy. Additionally, the authors utilize the prevalent Synthetic Minority Over-sampling Technique (SMOTE) to address imbalanced data and enhance the model’s performance. The research in [19] aims to forecast employee attrition by utilizing ML models on actual data sourced from a leading Italian financial institution. The authors concentrate on the examination of the pivotal aspect of feature direction, employing the SHAP algorithm to both detect feature contributions and evaluate their direction. The authors in [20] use XAI techniques to assess employees. They focus on improving strategic decision-making in HR management. They use three ML models, including Logistic Regression, Random Forest, and Gradient Boosted Trees (GBT). SHAP was employed to assess the impact of each factor on employee attrition. In [21], the authors use a comprehensive preprocessing step based on removing non-informative features and transforming categorical data into numeric data based on label encoding techniques. The StandardScaler was employed for normalizing quantitative values. They handled class imbalance within HR data using a hybrid sampling strategy that integrates the Synthetic Minority Over-sampling Technique (SMOTE) and Adaptive Synthetic Sampling (ADASYN). The predictive model was built using a soft voting ensemble that integrates Random Forest, XGBoost, and Logistic Regression.
2.1. Research Gaps
Table 1 summarizes the existing models for employee attrition prediction. Indeed, current ML-based systems focus on achieving high prediction accuracy by using advanced models, Transformers, Convolutional Networks, and GAN-augmented models. These methods demonstrate their ability and efficiency in detecting employee attrition [12]. However, they require significant resources and processing time. In addition, they fail in interpreting the results of essential Transformers and HR systems.
Table 1.
Summary of existing model for employee attrition prediction.
Additionally, recent studies that consider class balance used data-level methods, including SMOTE or other resampling techniques [14]. Such techniques alter the original data distribution by artificial datasets, which are not handled effectively by current algorithm-based solutions for employee attrition prediction.
Recent studies also used explainable artificial intelligence (XAI) methods with SHAP as their primary tool. However, most of these systems used these techniques in after-the-fact analysis [12,14,19]. The research community needs to study SHAP as a feature selection tool, as it shows promise to decrease data dimensions while preserving its ability to make accurate predictions.
2.2. Motivation of This Research
The aim of this study is to address the existing gaps by creating an efficient ensemble learning model able to produce explainable results and allow researchers to replicate their findings for employee attrition prediction in actual HR analytics environments.
As tree-based ensemble models, such as XGBoost, require fewer computational resources than deep learning approaches, they will be adopted as the main classifier for detecting employee attrition in this study. This classifier will be optimized using the Optuna technique to select the most suitable attributes to achieve successful classification. Class imbalance is handled in this study based on random oversampling (ROS) that balances the dataset by duplicating minority-class samples to guarantee equal representation during training. Unlike synthetic data generation techniques, ROS replicates existing observations without creating artificial samples, thereby preserving the original data distribution while promoting stable and reliable model learning.
The proposed model uses SHAP-based feature selection for decreasing data dimensions while making the model more explainable. The system applies SHAP to evaluate feature importance at multiple levels, allowing HR decision-makers to understand both general employee departure factors and individual employee prediction results through Local Interpretable Model-agnostic Explanations (LIME) instance-level explanations. Thus, the proposed methodology provides an operational ensemble learning system that achieves performance optimization, feature selection, and multi-level explainability to generate important data-driven insights for HR management.
Interpretability plays an essential role as fairness and bias considerations are critical in HR predictive modeling. Indeed, employee datasets may include several historical or organizational biases associated with demographic, social, or workplace elements. Such factors should be addressed carefully, or ML models may inadvertently propagate these biases and provide unfair recommendations in retention strategies. Thus, using explainable AI techniques becomes essential to allow HR practitioners to assess feature contributions and guarantee that model-driven decisions remain fair, accountable, and aligned with responsible AI practices.
In addition, this study provides a comprehensive comparative evaluation of ensemble learning models and class imbalance handling techniques across two HR datasets, assessing their predictive performance based on different classification metrics to determine the most robust and generalizable approach. Moreover, the computational sustainability of the proposed models is evaluated by introducing and analyzing green efficiency in order to select the high-performance yet resource-efficient solution suitable for real-world HR analytics deployment. Green efficiency represents the ability of a process, system, or organization to maximize desired outputs while reducing negative environmental impacts like energy consumption, emissions, and waste.
3. Proposed Approach
The paper proposes an explainable machine learning system that combines XGBoost with SHAP-based feature selection and Optuna-based hyperparameter tuning, incorporating LIME-based local interpretation to reach excellent performance through F1-score and ROC–AUC evaluation. The proposed pipeline, illustrated in Algorithm 1, includes six fundamental components that work together to clean the dataset, handle the class imbalance challenge, apply a feature selection step based on SHAP values, optimize the ML model using Opuna techniques, improve model performance, and enhance global and local model interpretability using SHAP and LIME techniques.
3.1. Data Collection, Preparation, and Feature Engineering
Let be the collected dataset, where () represents the feature vector for the (i)-th employee, () is the associated binary target indicating employee attrition, and (N) is the total number of employees. In this study, two datasets were adopted: the Kaggle HR Analytics dataset [22] and the IBM HR dataset [23]. Indeed, the positive class is consistently encoded as employee attrition in this paper. Thus, the value represents attrition (employee leaves the organization), and value illustrates no attrition (employee stays).
The dataset undergoes two initial cleaning steps. First, all missing values are removed. After that, two engineered features are created to make the feature space more expressive:
- The workload ratio () feature shows the average amount of work that each employee needs to handle per assigned task:
- Tenure level (): Employee tenure is transformed into a categorical variable representing the career stage based on the number of years spent in the company:
The complete feature set () consists of original numeric attributes, categorical variables, and the engineered features and . The dataset is split into training and testing subsets using stratified sampling to preserve the original class distribution:
The preprocessing step applies label encoding to convert categorical information into numeric values, which become . The numerical data receives z-score normalization to achieve standardization [24]:
where and denote the mean and standard deviation of feature j in the training data. represents the total number of numerical features in the dataset and is the value of the j-th numerical feature for the i-th sample. The preprocessing transformations run with identical parameters on training and testing data through a column-based transformation sequence. The processed feature is a matrix that contains the following information:
The processing steps ensure that the input data receives appropriate scaling and encoding, which makes it suitable for XGBoost modeling.
3.2. Baseline XGBoost Training for Feature Attribution
To select the most impactful features before optimizing the ML model, a baseline Extreme Gradient Boosting (XGBoost) classifier, called , was trained on the preprocessed training dataset . XGBoost was selected in this paper due to its strong performance on tabular data and its compatibility with tree-based explainability techniques [25]. Due to the presence of class imbalance in the training data, a data-level balancing technique was adopted in this study. Specifically, random oversampling (ROS) was applied to increase the representation of the minority class by randomly duplicating its samples within the training set. This approach ensures a more balanced class distribution during model learning without modifying the original test data, thereby improving the classifier’s ability to detect minority-class instances [26].
The mode was trained using fixed hyperparameters (, and ) to offer a stable and unbiased basis for feature attribution. The model optimization objective is to reduce the regularized loss function [27]:
where represents the logistic loss, given by
is the true label, represents the predicted probability for instance , represents the Decision Tree, and is a regularization term controlling model complexity, provided by
where is the number of leaves in tree , represents the weight associated with leaf in tree k, shows the penalty for number of leaves (controls tree complexity), and is the L2 regularization term on leaf weights (prevents large weights).
| Algorithm 1. Proposed ensemble learning approach with SHAP-based feature selection, Optuna optimization, and LIME | |
| Input | |
| |
| Step 1: Data Collection, Preparation, and Feature Engineering | |
| |
| Step 2: Handle Class Imbalance and Apply Baseline XGBoost Model | |
| |
| Step 3: Select Most Important Features Based on Global Importance Values | |
| |
| Step 4: Hyperparameter Optimization Using Optuna | |
| |
| Step 5: Model Training and Performance Evaluation | |
| |
| Step 6: Explainable AI (XAI) Analysis using SHAP and LIME | |
| |
| End Algorithm | |
3.3. SHAP-Based Feature Importance and Selection
For better understanding of how each feature impacts the results, SHapley Additive exPlanations (SHAP) is used using a TreeExplainer. For each feature , the global importance was calculated as the mean absolute SHAP value for all training samples [28]:
where is the SHAP value of feature for sample . The greater the values, the more significant the contribution of feature to the model’s prediction. Thus, the top K = 15 features with the highest mean absolute SHAP values were selected. The training and testing datasets were then reduced based on these features, yielding and . This approach helps subsequent models to prioritize the most informative predictors, making the results easier to understand and reducing feature dimensionality.
3.4. Hyperparameter Optimization Using Optuna
To improve the predictive performance of the XGBoost model, a hyperparameter optimization step is performed based on the Optuna technique [29]. It is a method that automatically tunes a model’s hyperparameters to achieve the best performance. In this study, Optuna is used to maximize the F1-score, which balances precision and recall, especially in imbalanced classification problems. Let represent the XGBoost model trained on the (K)-selected SHAP features () with hyperparameters (). The optimal hyperparameters () are defined as [30]
where is the F1-score values that balance precision and recall by comparing the predicted labels with the true ones, and T refers to the number of hyperparameter trials. To find the best hyperparameters, the Tree-structured Parzen Estimator (TPE) sampler was used. It intelligently explores the search space by learning from previous trials and focusing on the most promising regions, even when the parameter space is large or continuous. The optimization was performed for 30 trials, which was selected as a balance between computational efficiency and sufficient exploration of the hyperparameter space.
The search space for hyperparameters is illustrated in Table 2.
Table 2.
XGBoost parameters considered in Optuna technique.
3.5. Model Training and Performance Evaluation
In this step, the final optimized XGBoost model is trained and evaluated using the reduced feature space obtained from SHAP-based feature selection. Using the optimal hyperparameters () resulting from the Optuna optimization stage (Section 3.4), the final XGBoost model is trained using
After this, the training model is applied to the testing to provide predicted class labels and posterior probabilities:
The performance of the is assessed based on multiple complementary metrics [24]:
where , , , and represent, respectively, the true positive, true negative, false positive, and false negative, given by the confusion matrix illustrated in Table 3.
Table 3.
Confusion matrix summarizing the classification outcomes in terms of true positives (TPs), true negatives (TNs), false positives (FPs), and false negatives (FNs).
The Receiver Operating Characteristic (ROC) Curve is used also to evaluate the proposed model by varying the classification threshold applied to (). The True Positive Rate (TPR) and False Positive Rate (FPR) are calculated using
The Area Under the ROC Curve (ROC–AUC) is also employed as a threshold-independent measure to distinguish between classes.
The green efficiency metric is computed using
The training time and memory usage were measured based on the Python functions time. Time () and psutil. Process ().memory_info ().rss.
3.6. Explainable AI (XAI) Analysis
Explainable artificial intelligence (XAI) analysis is conducted using both global and local explanation techniques to improve the transparency and interpretability of the optimized model . SHapley Additive exPlanations (SHAP) is used to illustrate global feature importance. However, Local Interpretable Model-agnostic Explanations (LIME) is used to provide instance-level explanations.
SHAP offers a unified framework for assessing the contribution of each feature to the model’s predictions based on cooperative game theory. For each set of feature associated with sample i, the SHAP value for feature (j) shows its contribution to the prediction of () [31]. The prediction of instance i by model is given by
is the expected model output over the training data and represents the contribution of the j-th feature to the prediction.
Global feature importance can be computed by aggregating the absolute SHAP values from all samples in the training set:
On the other hand, LIME can provide explanations of individual predictions for each instance. The LIME Tabular Explainer is initialized based on SHAP-selected training data to guarantee consistency of the reduced feature space based on the model training.
For a selected test instance , LIME approximates the complex decision boundary of the model locally by fitting an interpretable surrogate model ) in the neighborhood of [32]:
where L(.) quantifies the fidelity of the surrogate model to within the locality defined by the proximity function , and penalizes model complexity to ensure interpretability. is given by
where z denoted any data point in the input space, represents a distance metric, usually Euclidean for numerical features between and z, and σ is a kernel width parameter that controls how fast the weight decays with distance. The resulting explanation is presented by
where offers a ranked list of features contributing positively or negatively to the predicted class probability, giving intuitive, human-understandable insights into individual model decisions.
4. Results
In this section, the results of the application of the proposed approach on two datasets are presented and discussed. First, the datasets are represented and described. After this, the results associated with each dataset are described, compared, and discussed. The experiments were performed on a workstation equipped with an Intel Core i7 CPU (3.6 GHz), 32 GB of RAM, and an NVIDIA RTX 3060 GPU. All software was run with Python 3.12 and the library versions specified in the manuscript. All ML models in this section are assessed based on the same data split and identical cross-validation folds to ensure a fair and consistent comparison. Furthermore, the resampling techniques were applied only on the training data. The test set remained untouched to avoid data leakage.
4.1. Datasets
In this study, two datasets are considered: the Kaggle HR dataset and IBM dataset.
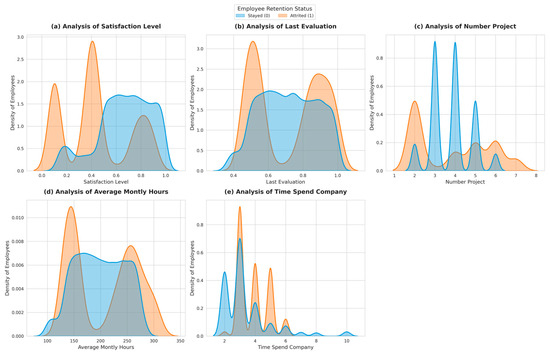
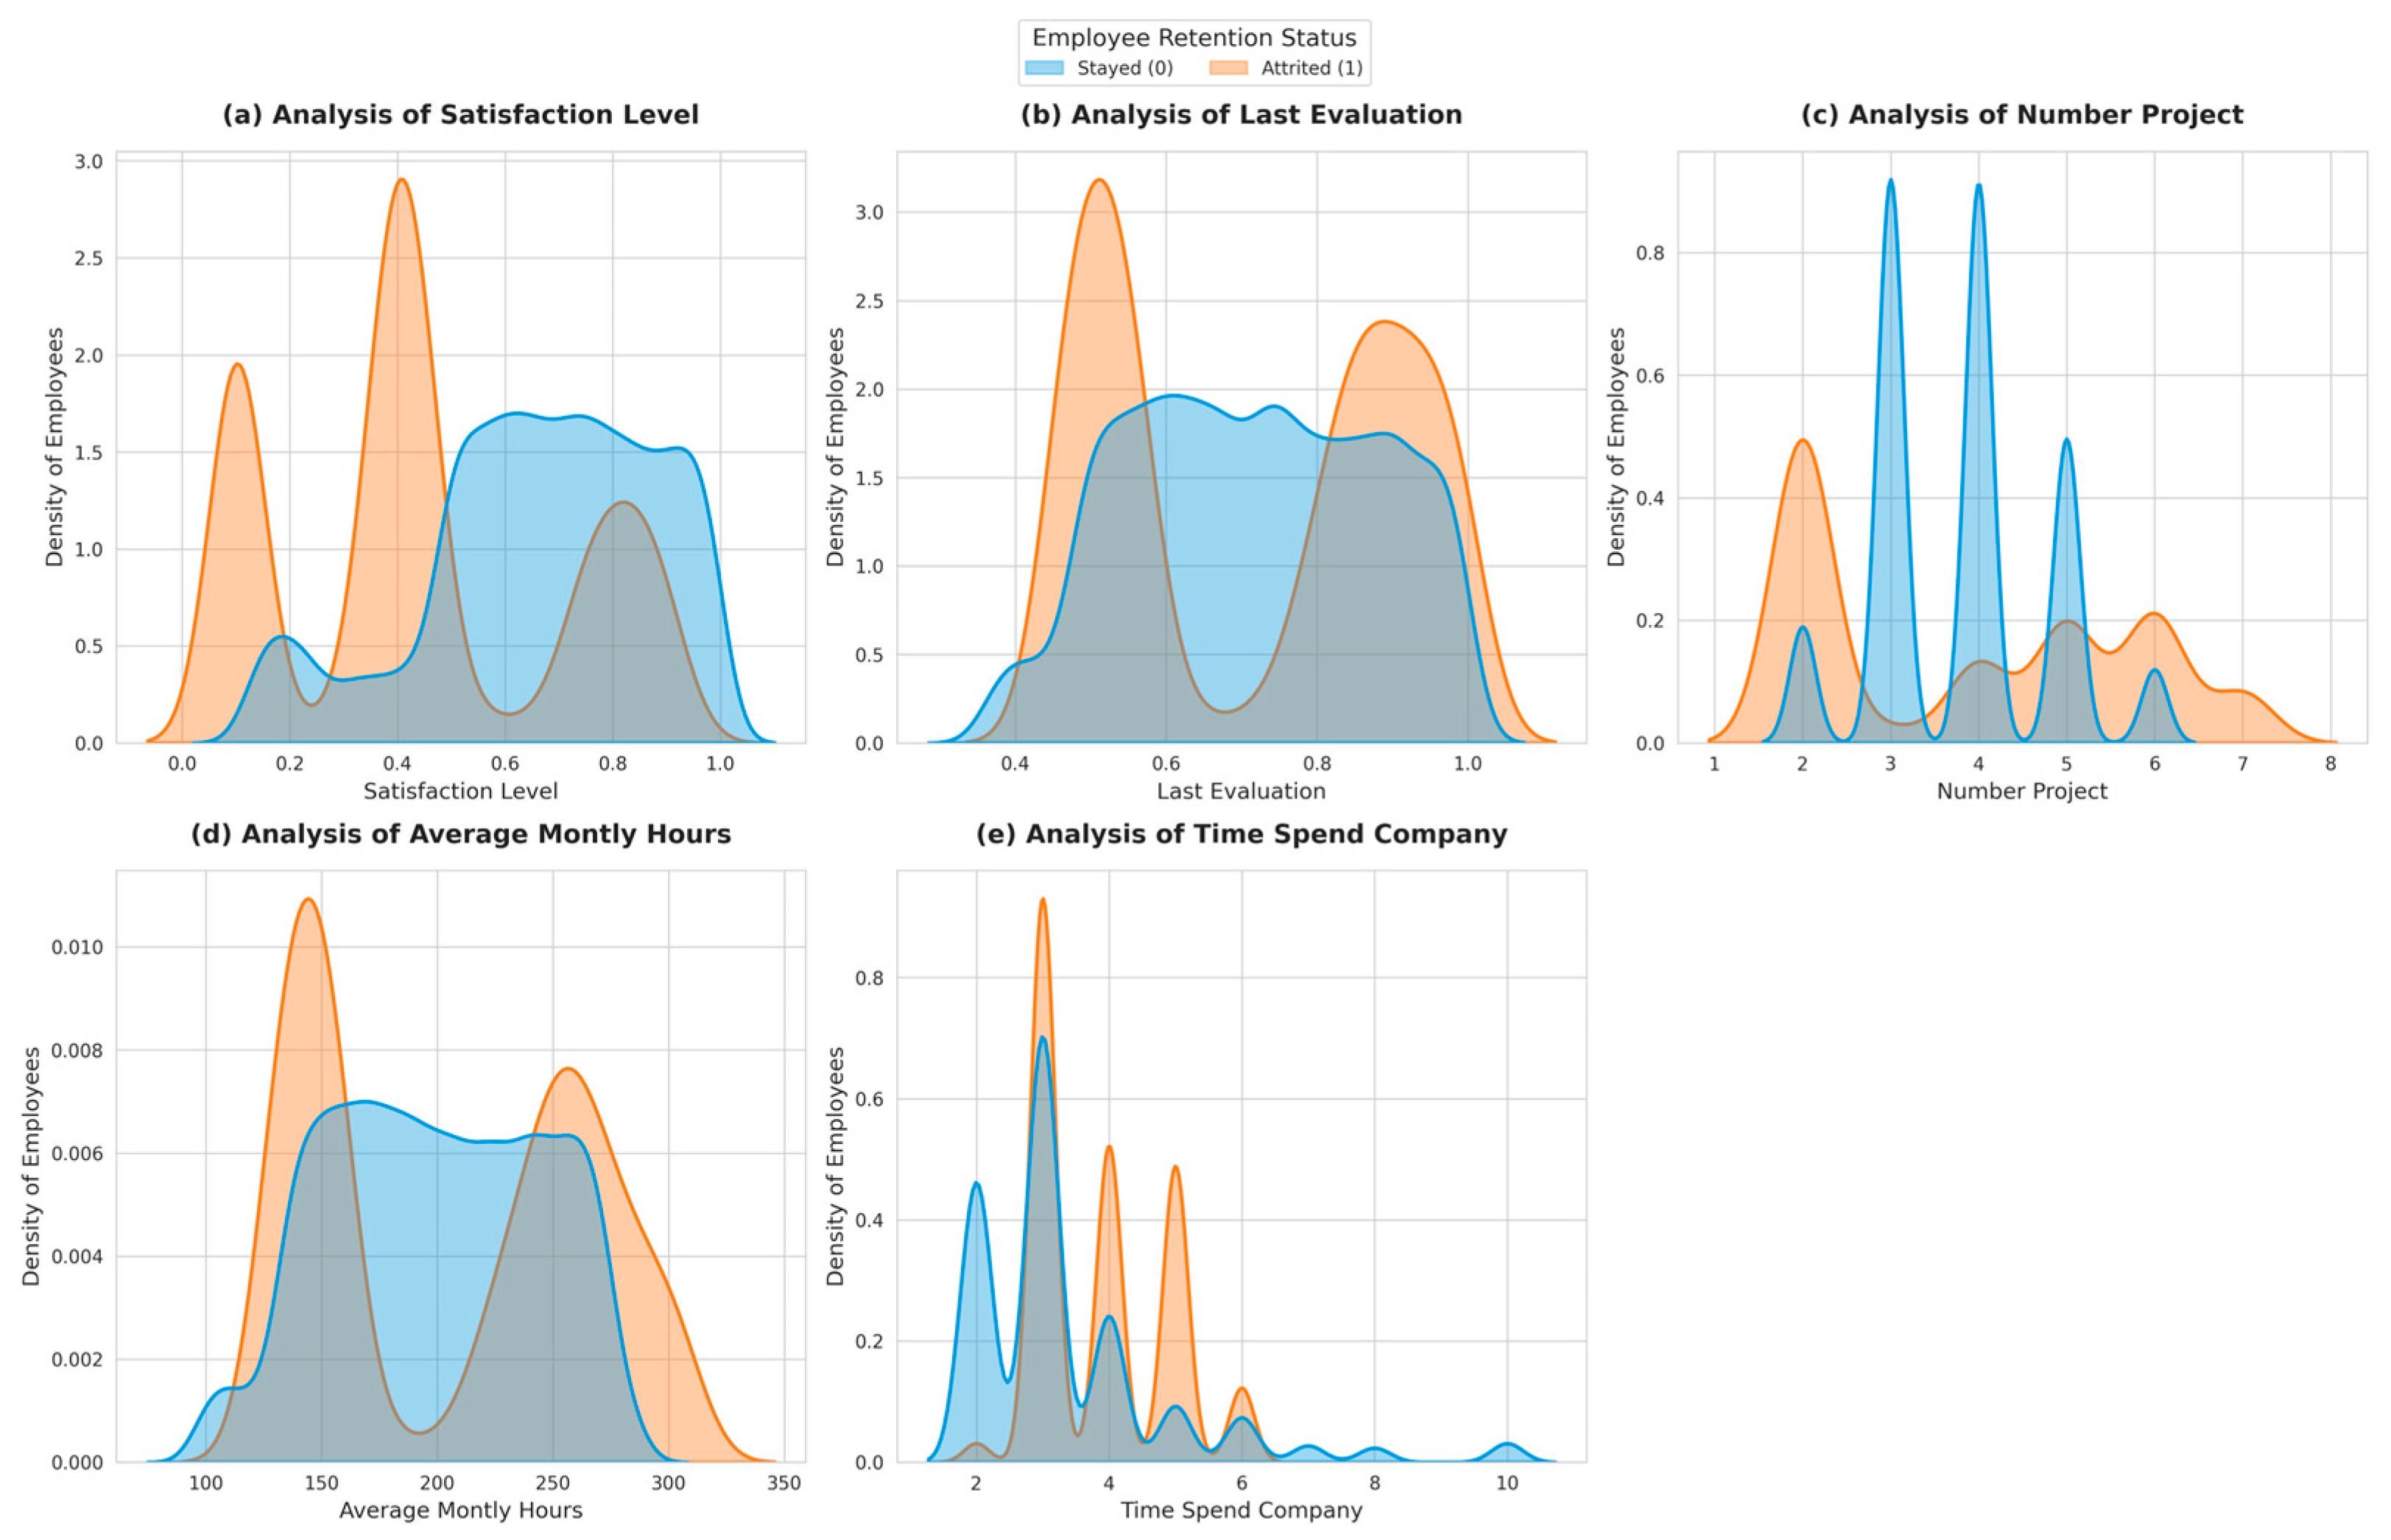
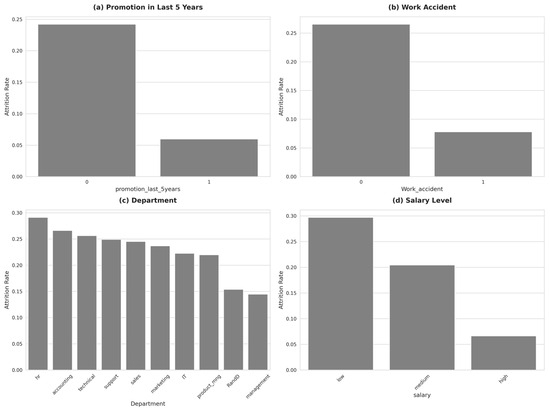
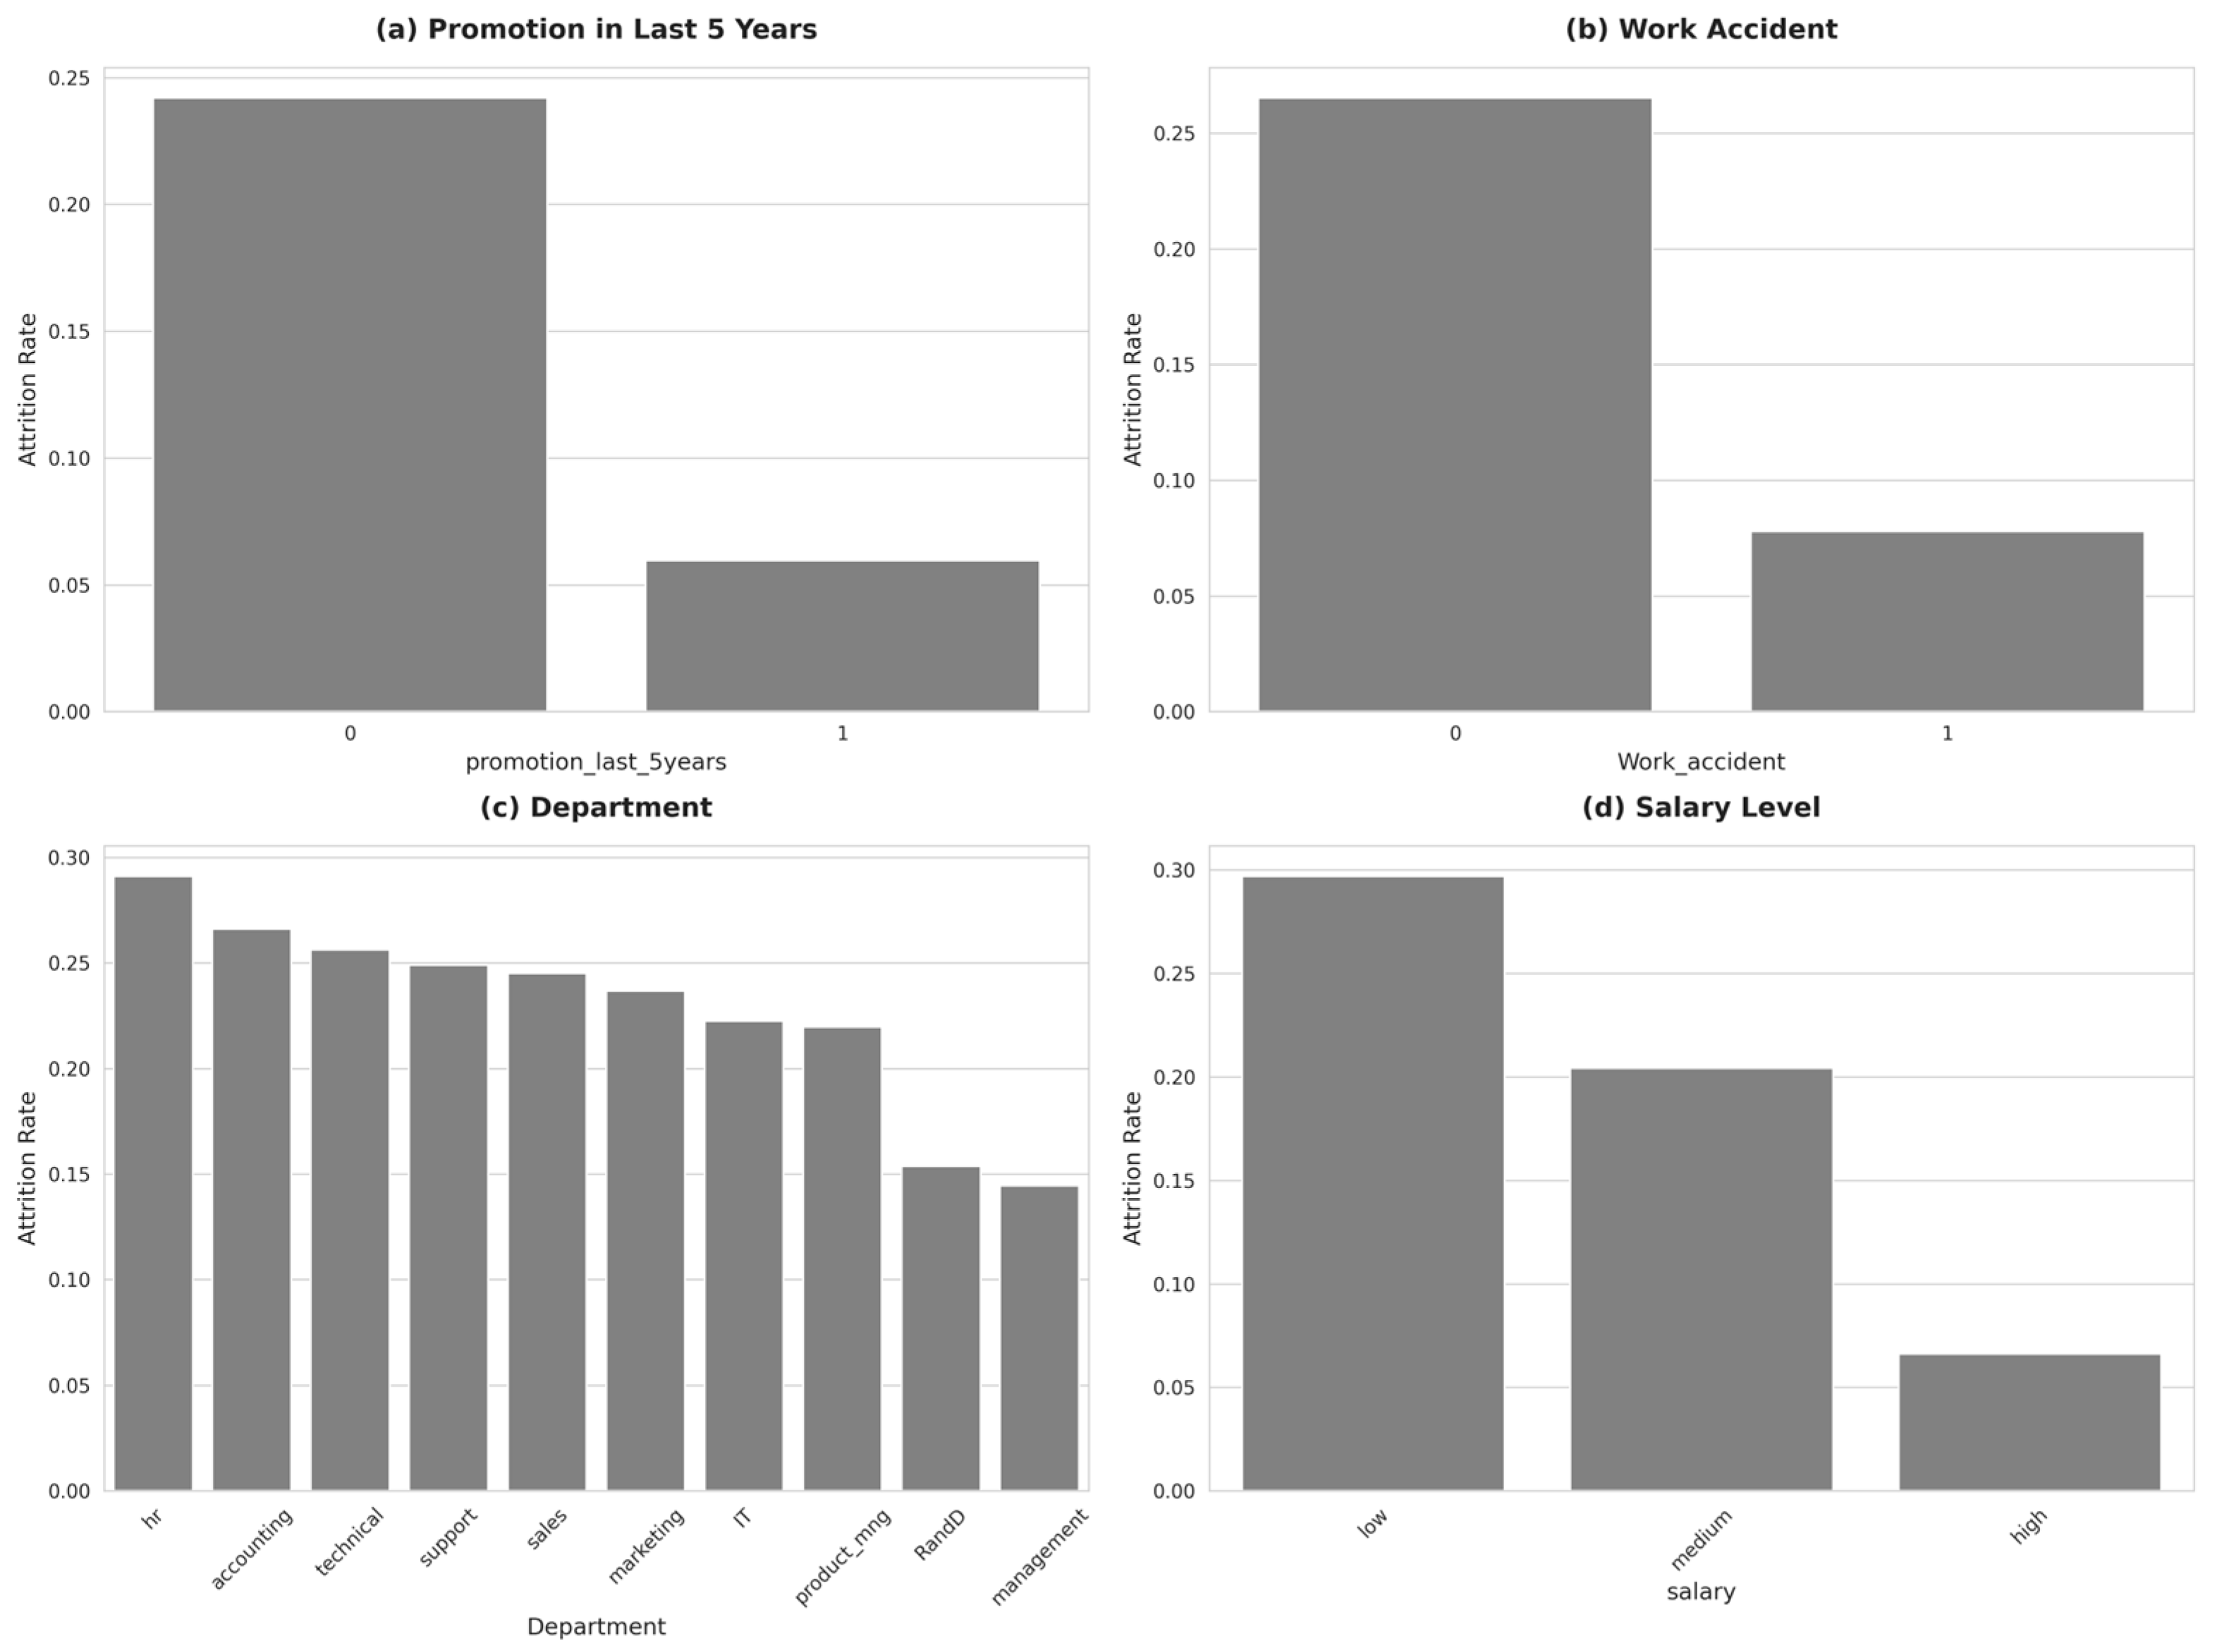
- HR Analytics dataset: The first dataset used in this study is the HR Analytics dataset available on Kaggle, consisting of anonymized HR records from a singular organization [22]. The dataset includes 14,999 employee records, with a binary target variable called “left” (0 = stayed, 1 = left) and a variety of features like satisfaction level (Figure 1a), last evaluation (Figure 1b), number of projects (Figure 1c), average monthly hours (Figure 1d), time spent at company (Figure 1e), promotions in the last five years (Figure 2a), work accidents (Figure 2b), department (Figure 2c), and salary (low, medium, or high) (Figure 2d). The density curves in Figure 1 show different skewness and multimodality patterns that exist between features and employee groups. The data shows that employee satisfaction and time spent at work follow left-skewed and multimodal distributions, indicating different exit patterns from the company at low satisfaction levels and particular points of employment duration. The employee group without attrition demonstrated rightward movement of their modes and showed better stability. The figure shows two distinct patterns in average monthly hours and number projects, as these variables have asymmetric distribution patterns, indicating workload-based segmentation. The last evaluation shows weak skewness and overlapping modes, demonstrating that this variable alone does not provide strong discrimination but becomes more useful when used with additional data points. Figure 2 demonstrates that the financial and professional development of employees shows an opposite relationship with employee retention, as staff members who earn low salaries and have no career progression over five years tend to leave their jobs at rates reaching 25–30%. Additionally, the human resources and accounting departments experience the highest employee departure rates (reaching around 30%); however, the management and R&D departments maintain their staff members for the longest period. The figure also shows that workers who have not experienced any workplace accidents tend to quit their jobs, suggesting that dangerous positions lead to both extended employment and protected employment status.
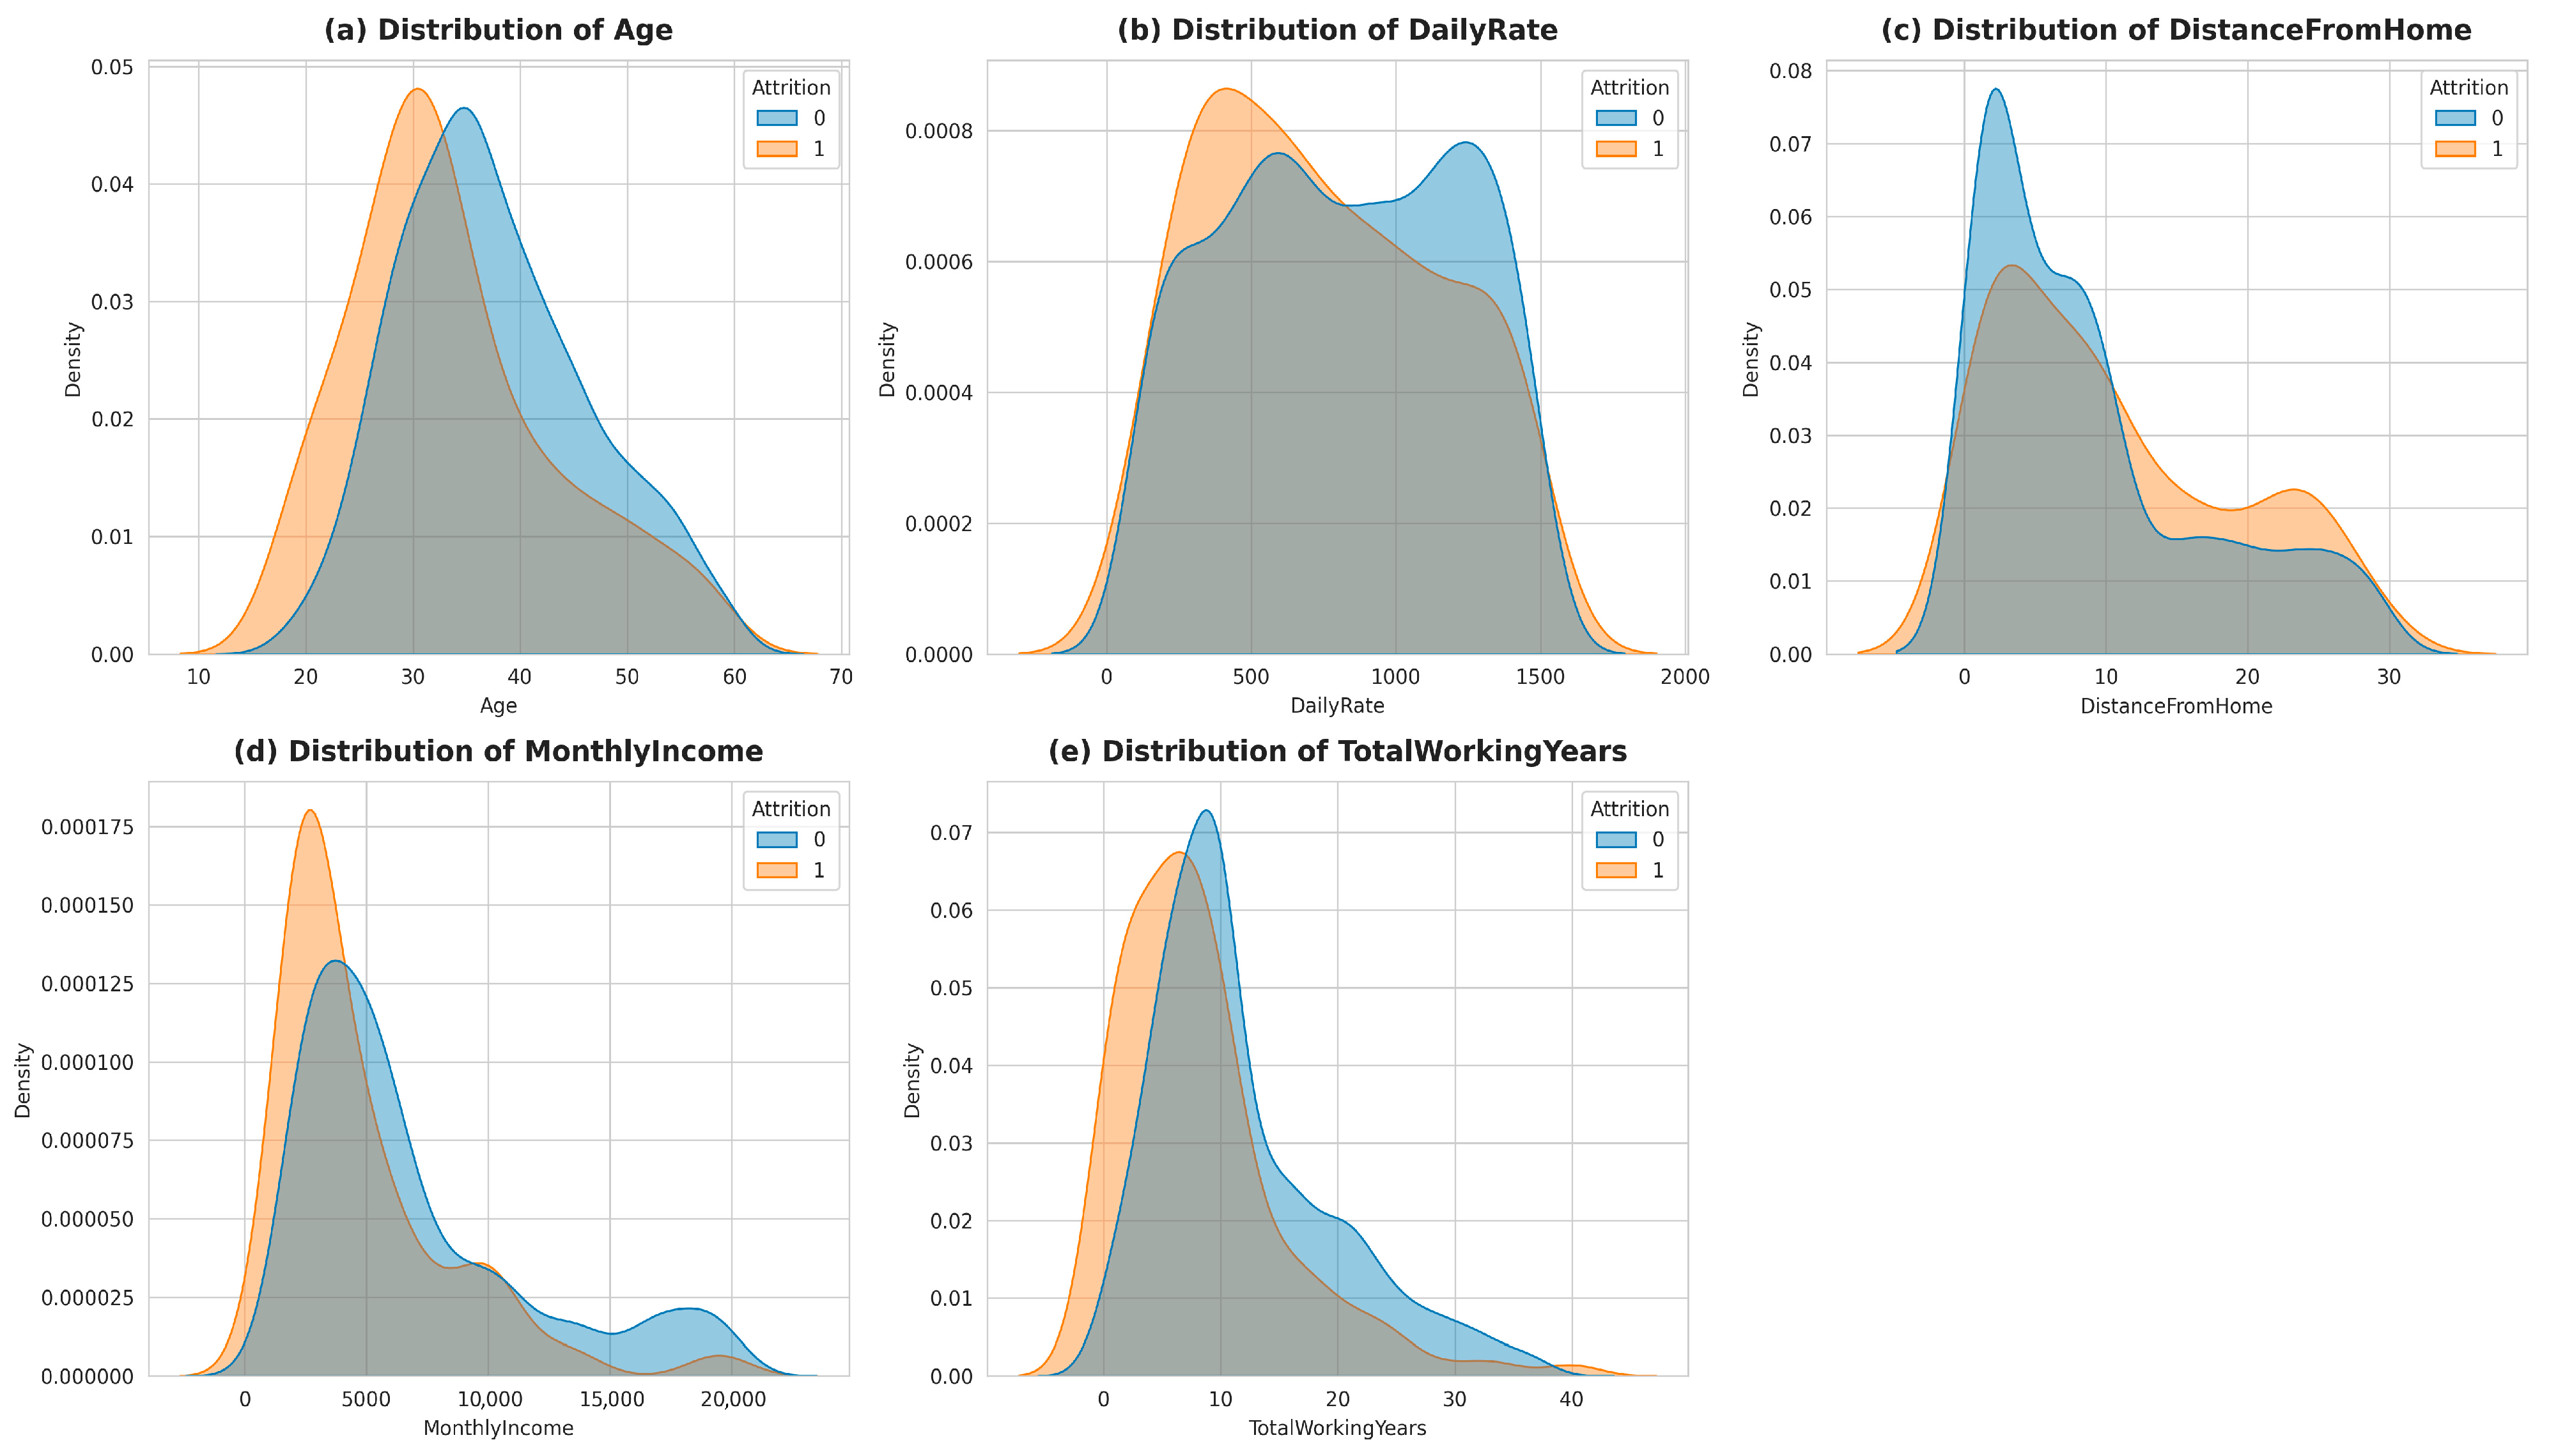
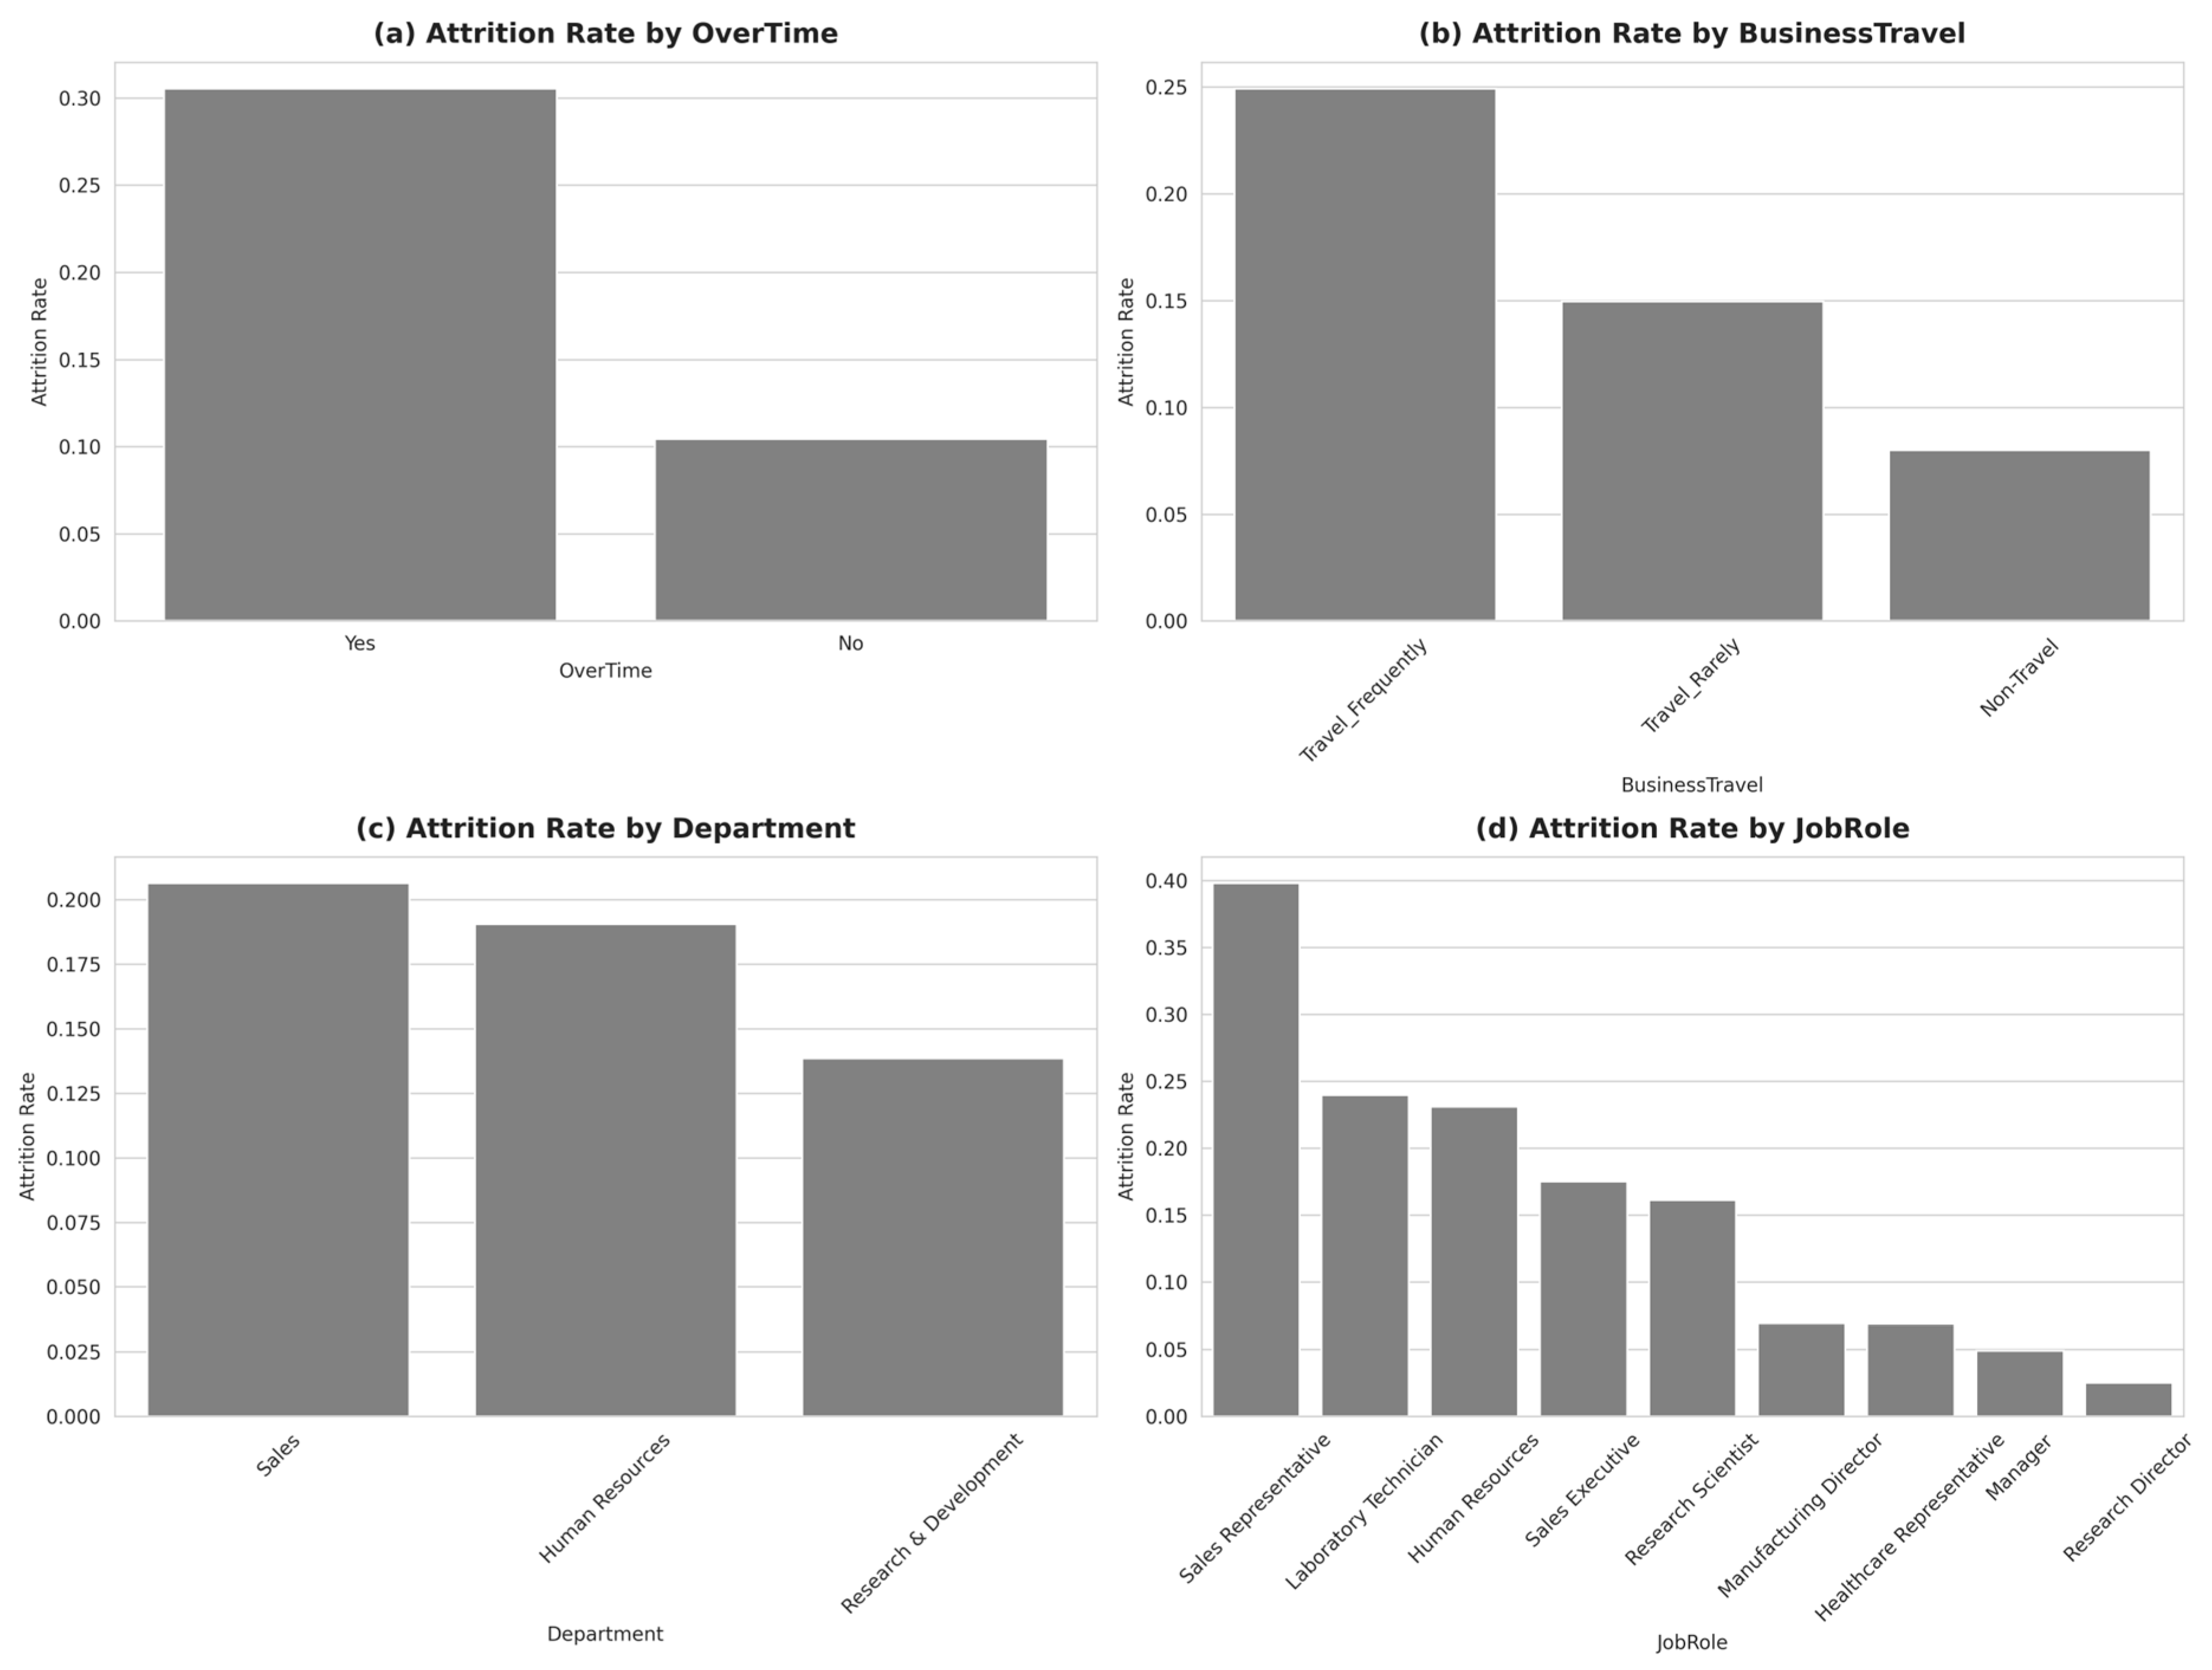
- IBM dataset: The second dataset used in this research is the synthetic employee dataset developed by IBM data scientists. It is employed to replicate authentic HR data and identify the determinants of attrition [23]. The IBM dataset is composed of 1470 records and 35 variables encompassing demographics (age (Figure 3a), gender, marital status, education level, and field), job attributes (job title (Figure 4d), department (Figure 4c), overtime (Figure 4a), business travel frequency (Figure 4b), daily rate (Figure 3b), monthly income (Figure 3d), job level, tenure at the company, total working hours (Figure 3e) and distance from home (Figure 3c)), and performance and satisfaction metrics (performance rating, job involvement, job satisfaction, environment satisfaction, work–life balance, and relationship satisfaction). The target variable is represented by the binary feature, Attrition (Yes/No), which signifies if an employee has departed from the organization or not. Multiple categorical predictors utilize the below ordinal coding:
- ○
- Education is rated from 1 (below college) to 5 (doctorate);
- ○
- Environment satisfaction, job involvement, job satisfaction, and relationship satisfaction range from 1 (low) to 4 (very high);
- ○
- Performance rating extends from 1 (low) to 4 (outstanding);
- ○
- Work–life balance is assessed from 1 (poor) to 4 (excellent), enabling quantitative analysis of satisfaction, involvement, and performance metrics.
Figure 1.
HR Kaggle Analytics dataset: distribution of key numerical features comparing employees with and without attrition.
Figure 2.
HR Kaggle Analytics dataset: distribution of attrition rates across categorical factors.
Figure 3.
IBM dataset: distribution of key numerical features comparing employees with and without attrition.
Figure 4.
IBM dataset: distribution of attrition rates across categorical factors.
This structure makes the dataset appropriate for classification tasks and exploratory data analysis. The kernel density estimation plots in Figure 3 show that younger employees with lower monthly incomes and fewer total working years experience the most attrition, indicating that early-career professionals face the greatest risk of leaving their jobs. The figure shows that workers who work outside the office and earn less than their colleagues tend to leave their jobs at higher rates, proving that workplace location and daily compensation levels affect how long employees stay with their employer. The data in Figure 4 demonstrates that staff members who work extended hours and spend time traveling away from the office tend to leave their jobs at the highest rate. The demographic information shows that workers under the age of thirty who have brief work experience and receive minimal monthly pay often choose to leave their positions.
4.2. Results from HR Kaggle Analytics Dataset
The results obtained using the Kaggle HR Analytics dataset are presented and discussed in this subsection. The results in Table 4 show the impact of different resampling and class-balancing strategies on model performance in terms of accuracy, F1-score, and ROC-AUC, as well as their computational efficiency. Random oversampling (ROS) is considered as the baseline and reveals a higher accuracy (0.986) and F1-score (0.971) with smaller runtime (2.46 s) and moderate memory usage. The advanced resampling techniques like SMOTE, SMOTETomek, and ADASYN also provide strong predictive performance; however, the statistical comparison with ROS indicates that their gains over ROS are significant (p-value = 0.002), although at higher computational costs. Statistical significance is assessed in this table based on 5-fold stratified cross-validation and pairwise Wilcoxon signed-rank tests that were applied to compare each method to ROS techniques using the F1-scores obtained across folds. Unusually, the ClassWeight_XGB approach achieved the highest F1-score (0.973) with low memory consumption (0.12 MB) and a comparable runtime to ROS, showing that algorithm-level balancing can be more resource-efficient than data-level resampling. Combining focal loss with resampling strategies (Focal_SMOTEENN, Focal_ROS) reveals lower performance than ROS but offers alternative strategies for imbalanced scenarios. Table 5 highlights the strong performance of XGBoost, which achieves a high true-negative count (2842) and very low false positives (15), indicating effective discrimination of negative instances. The XGBoost model generated 33 incorrect negative results, but it correctly identified 860 positive cases, proving its capability in detecting positive cases and its ability to maintain specific results.
Table 4.
Comparison of resampling and class-balancing methods on proposed method performance, including computational time, and memory usage applied on HR Kaggle Analytics dataset. ROS is used as the reference, and statistical significance versus ROS is reported (p-value).
Table 5.
Confusion matrix table for ensemble learning models for HR Kaggle Analytics dataset.
Table 6 shows a comparison between different ensemble learning models according to their performance in predicting employee attrition and their processing speed. The stacking model produces the best results for accuracy and F1-score, but it requires high computation cost during execution. XGBoost provides an optimal combination of performance and speed as it reaches the highest accuracy (0.9872), F1-score (0.9729), and ROC-AUC (0.9941) while using minimal resources (0.49 s runtime and 4.31 MB memory). XGBoost achieves the highest green efficiency score, as it performs better than all other models in the evaluation. These results demonstrate that XGBoost produces the best combination of excellent prediction accuracy and deployable solutions, and outperforms complex ensemble methods that need large amounts of computational power.
Table 6.
Comparative performance and green efficiency on HR Kaggle Analytics dataset.
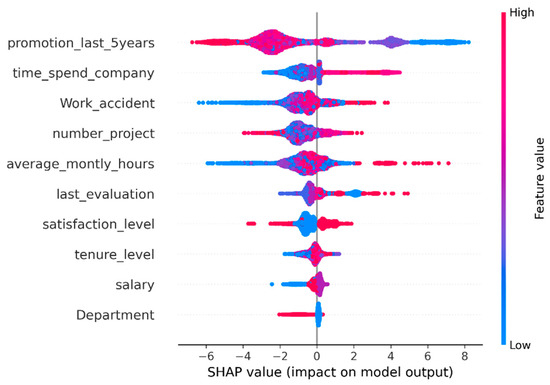
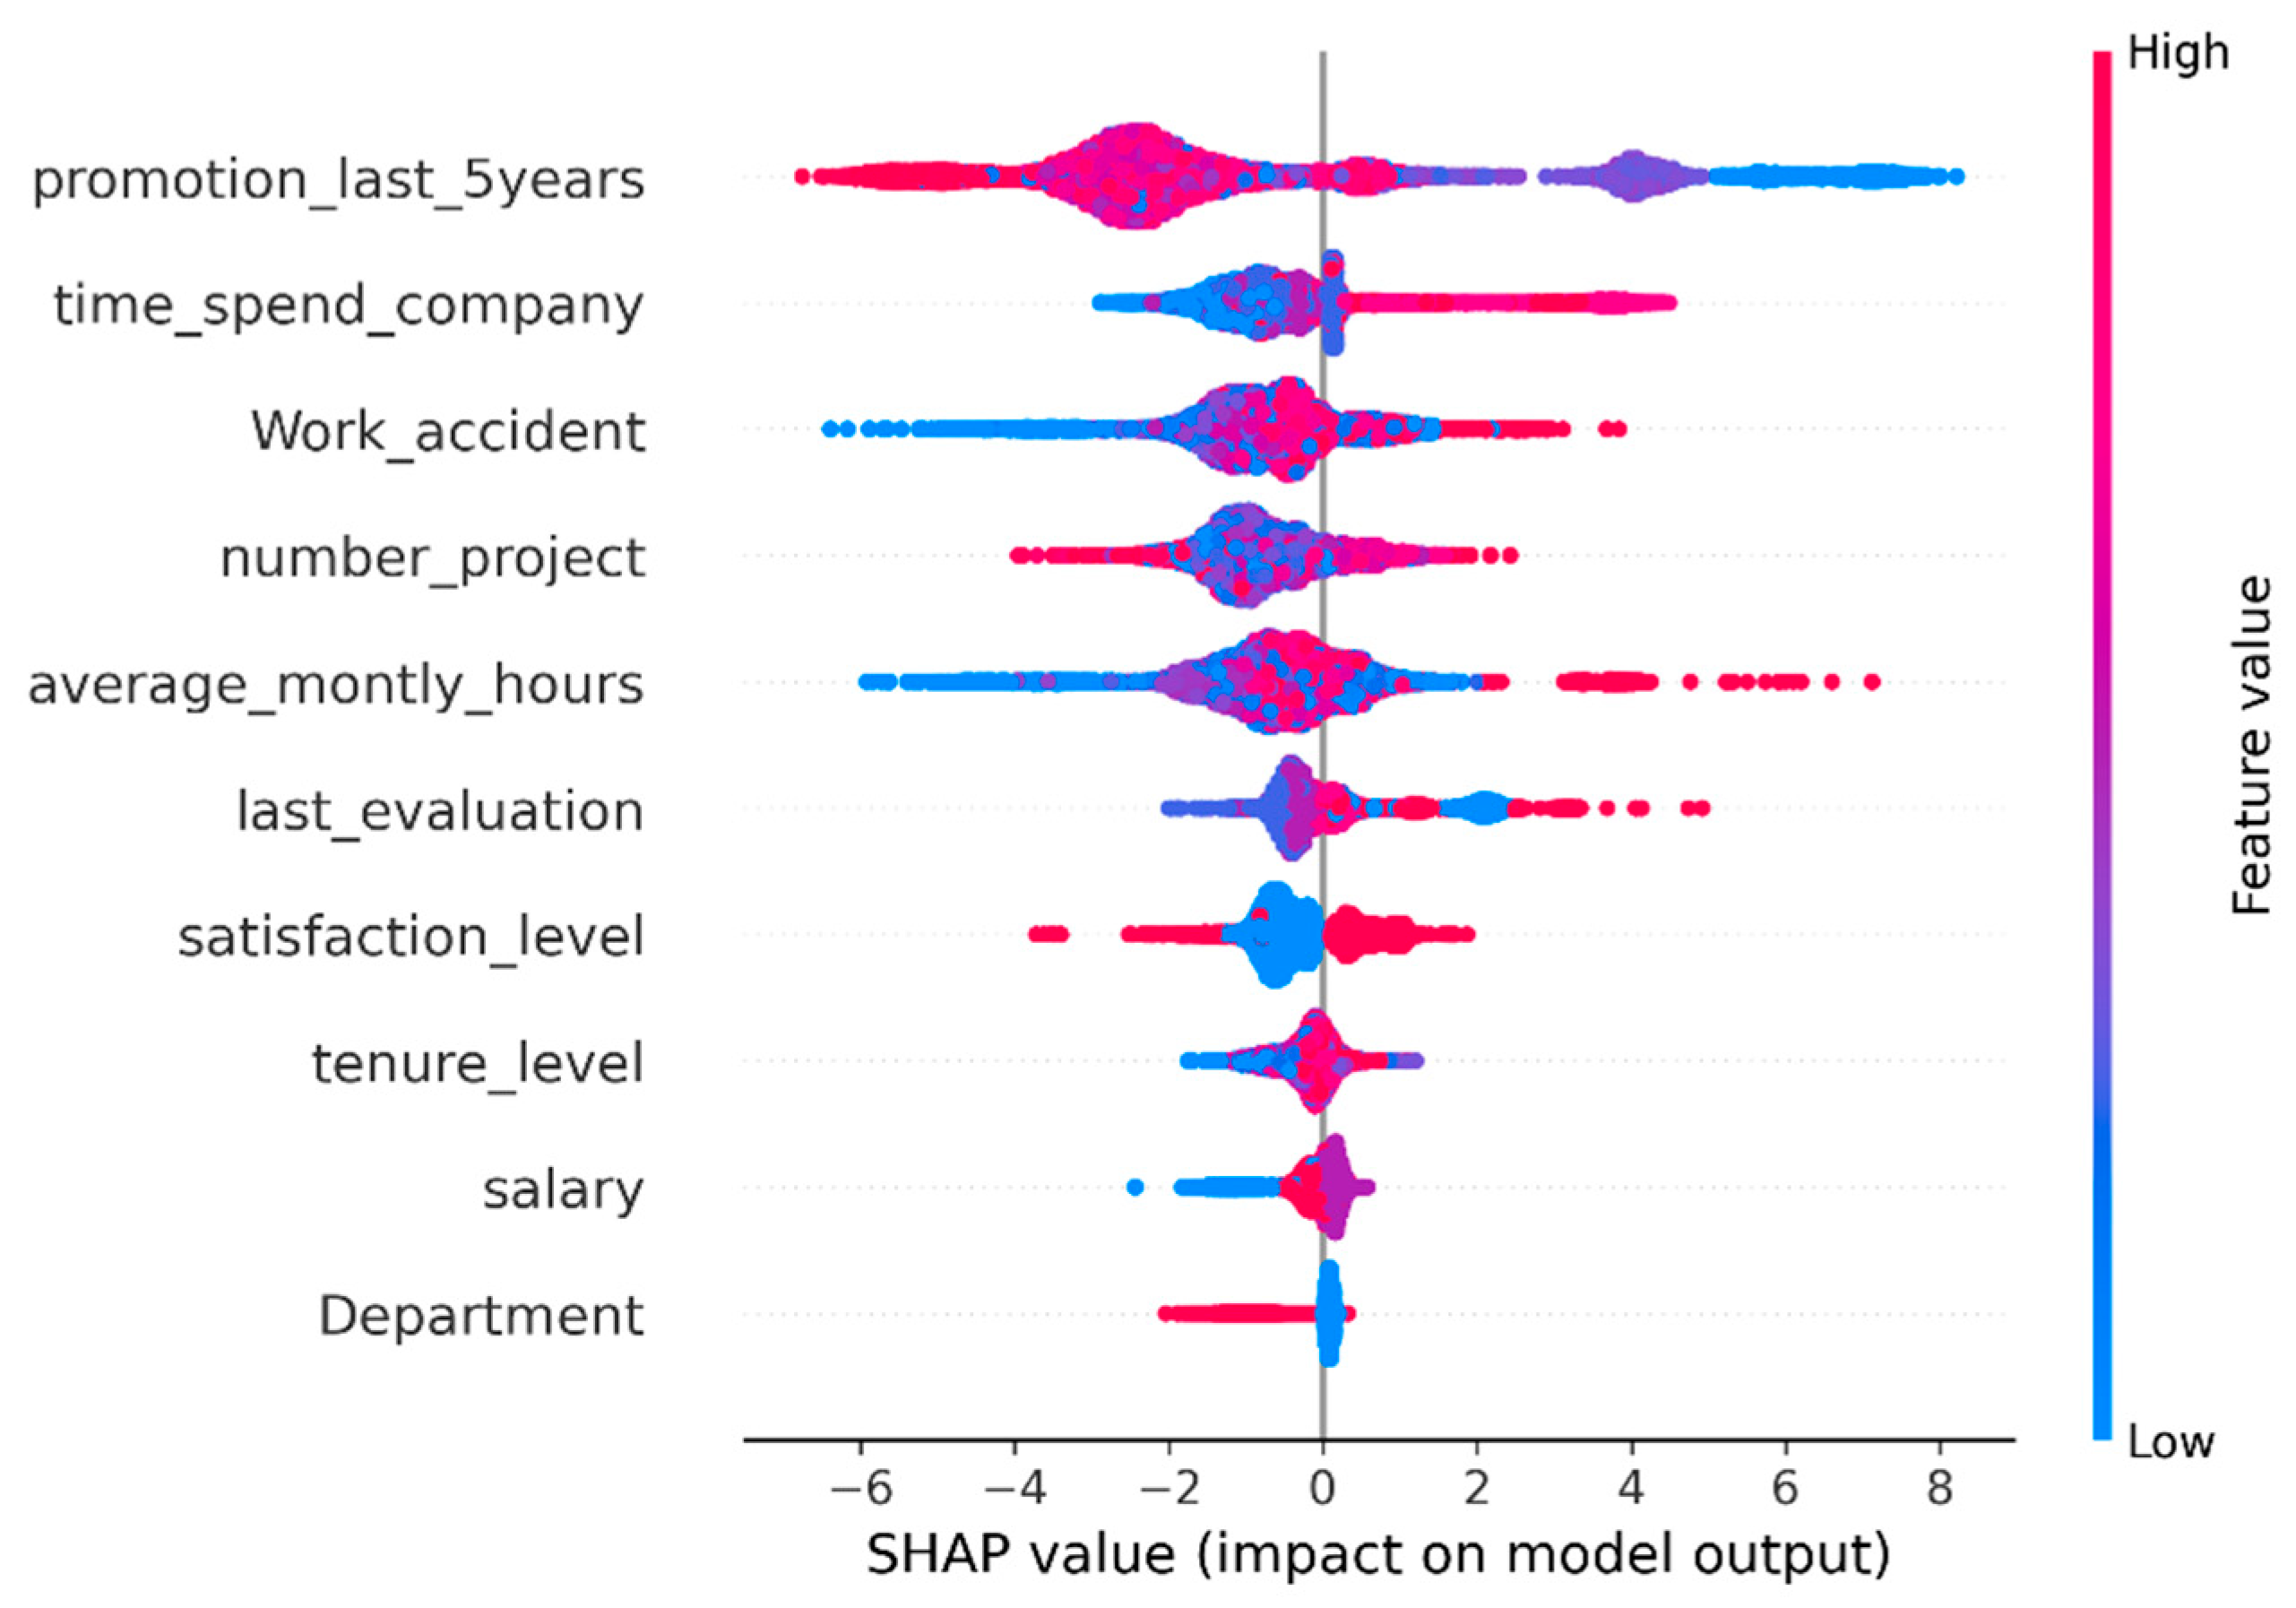
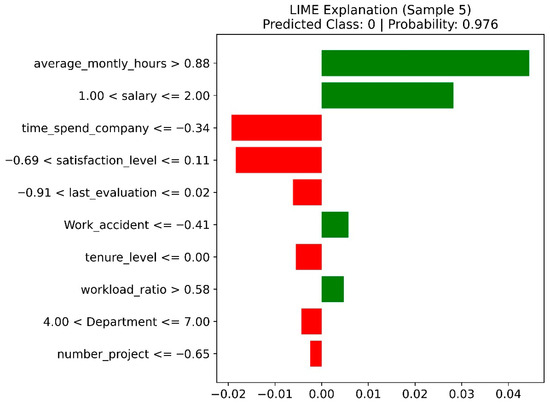
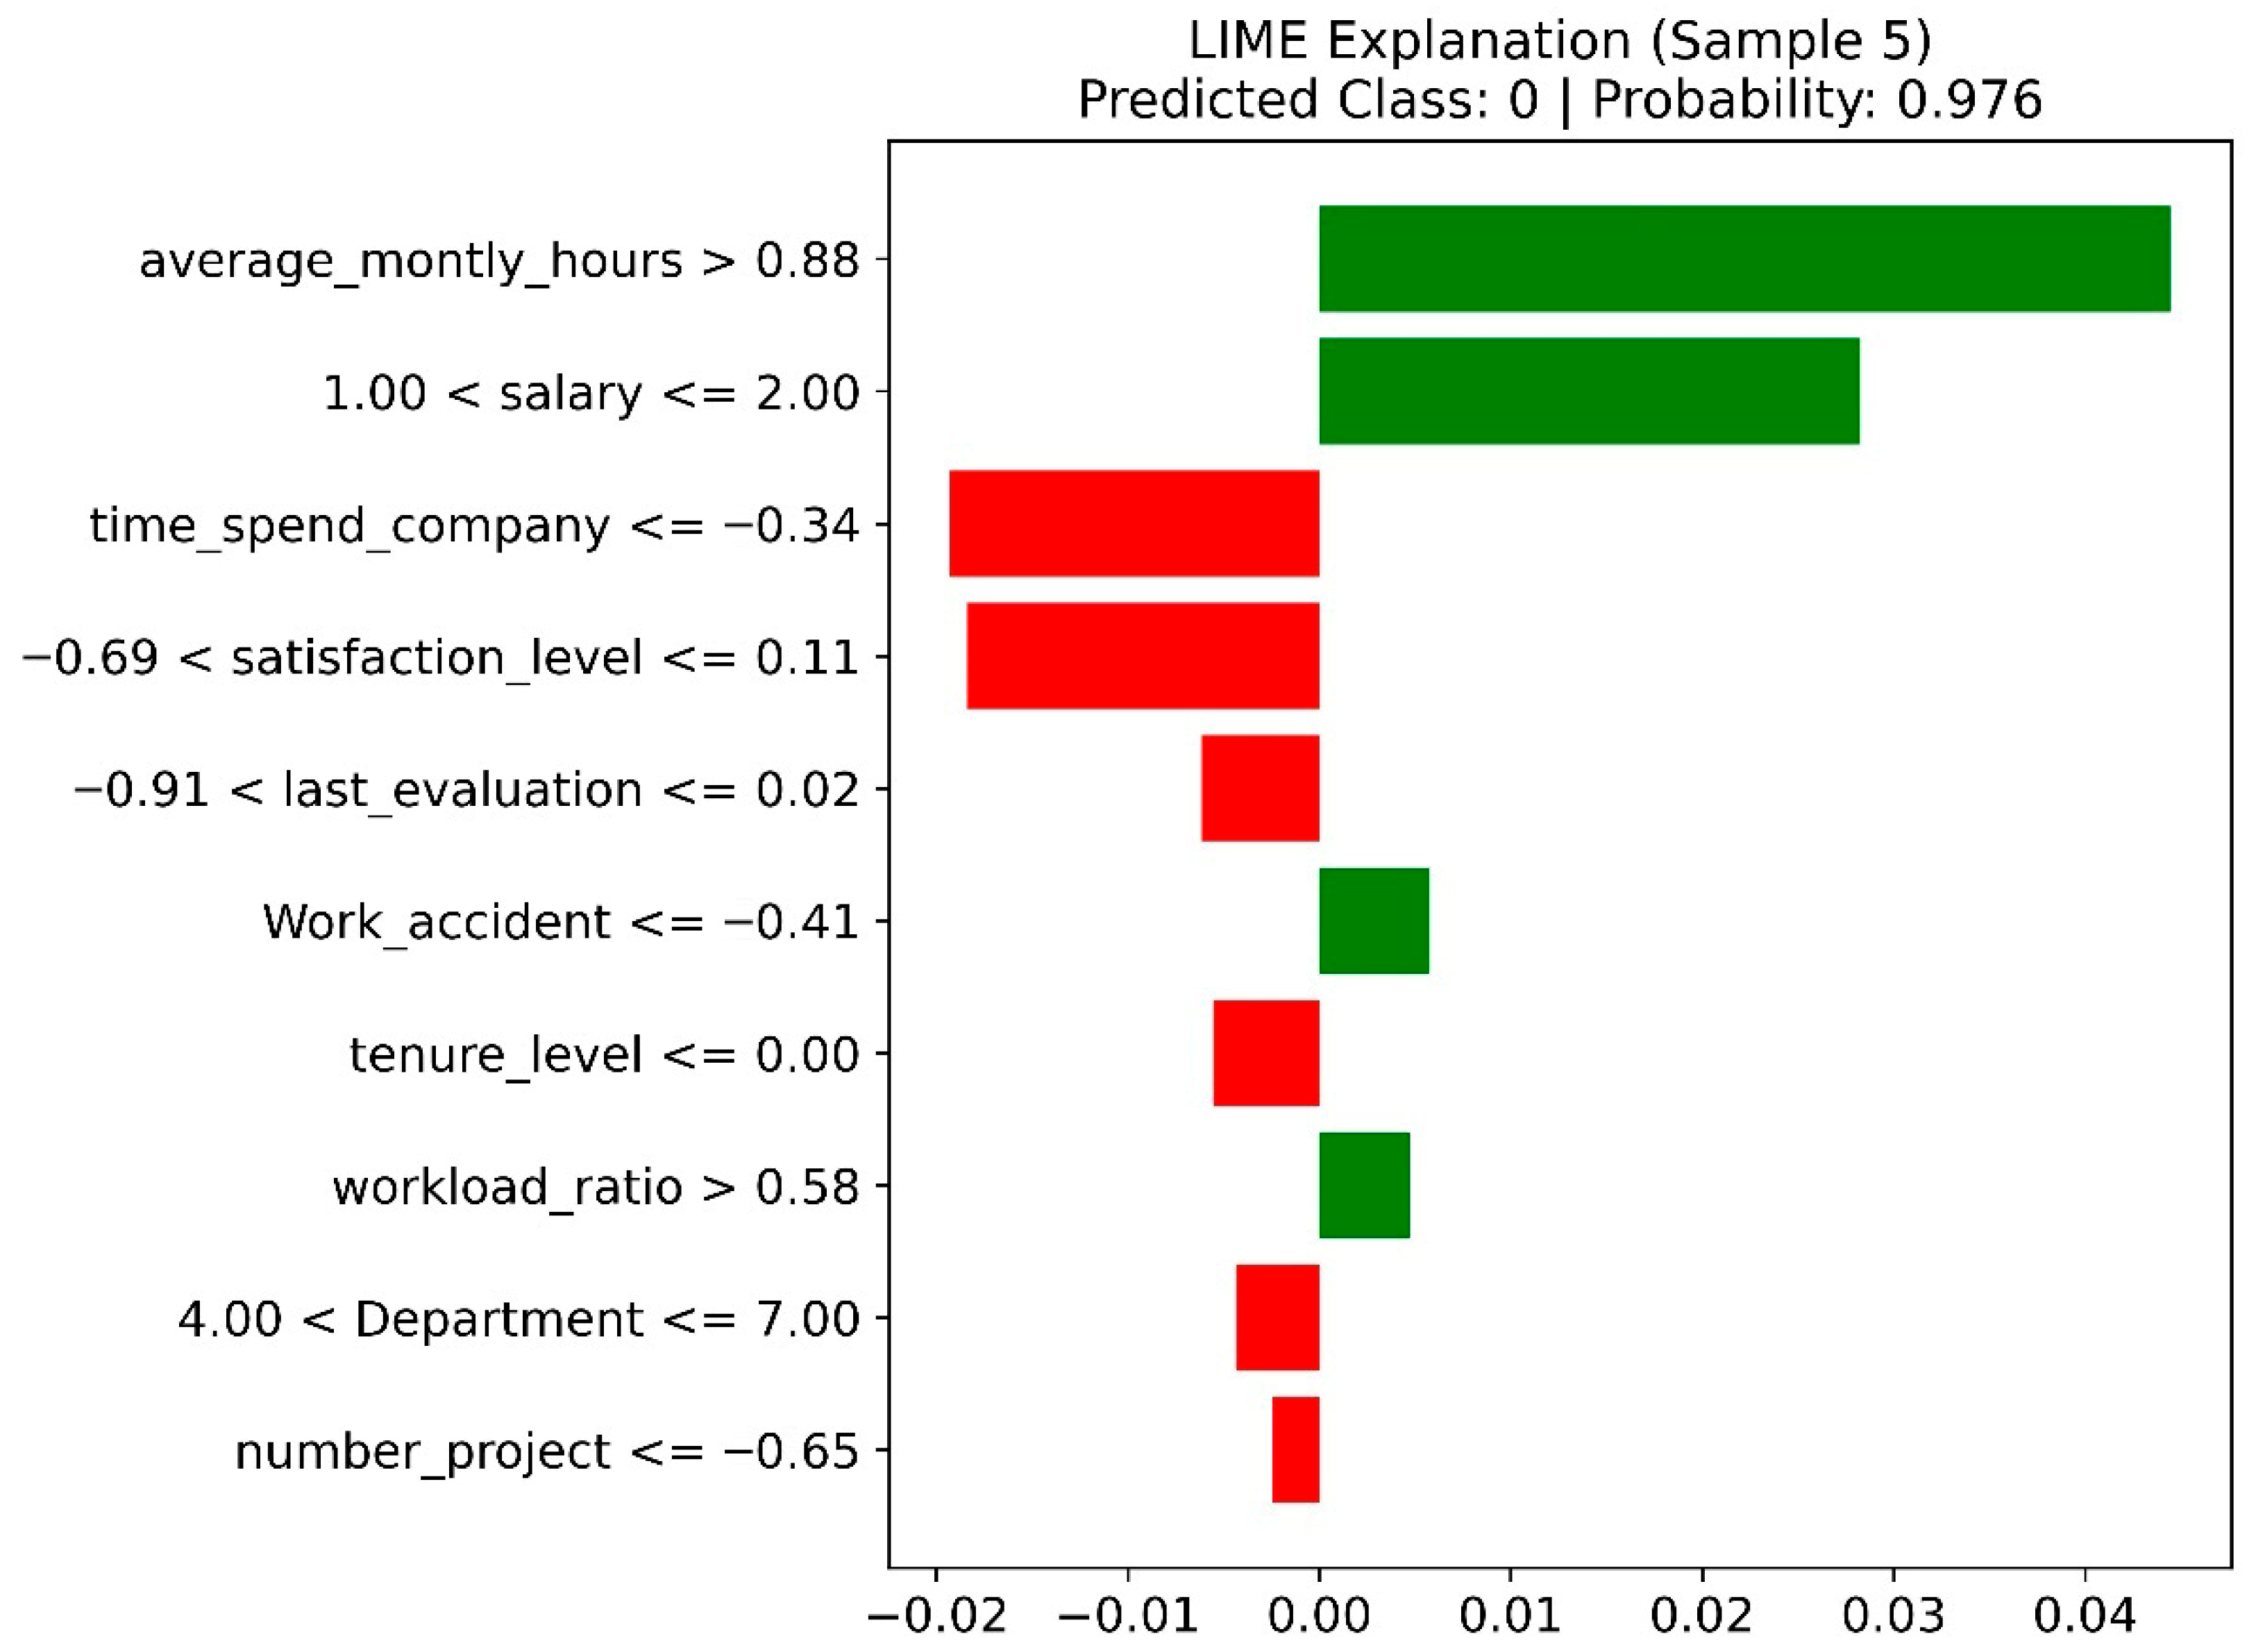
Figure 5 illustrates the global feature importance that reflects the overall effect of each feature on model predictions across the dataset. However, Figure 6 represents the local explanations that show the influence of the feature values on the prediction for a specific instance, which may differ from the global pattern.
Figure 5.
SHAP summary plot for the XGBoost model applied on HR Kaggle Analytics dataset, showing the global importance and directional impact of features on employee attrition predictions. The color indicates feature value (low to high) and SHAP values represent each feature’s contribution to the model output.
Figure 6.
LIME-based local explanation of the XGBoost model prediction applied on HR Kaggle Analytics dataset for a representative employee instance, illustrating the positive and negative feature contributions influencing the classification as non-attrition (Class 0) with high confidence.
The SHAP summary plot shown in Figure 5 offers a global interpretation of the XGBoost model by illustrating the relative importance and directional influence of each feature on employee attrition predictions. Features are arranged by their overall contribution. Promotions in the last five years, time spent at the company, and work accident history are considered as the most impactful variables. Large values of time spent at the company and promotion history generally push predictions to non-attrition, demonstrating greater employee retention. However, lower values increase the possibility of attrition. On the other hand, high average monthly hours and larger numbers of projects tend to push predictions to attrition, showing the negative effect of excessive workload. The color gradient further represents meaningful patterns like lower satisfaction levels being strongly associated with positive SHAP values (higher attrition risk), while higher satisfaction reduces this risk. Features like salary, tenure level, and department reveal comparatively smaller SHAP magnitudes, indicating a more limited influence on the model’s decisions.
The LIME for Sample 5 is illustrated in Figure 6. The plot offers a clear local explication of the XGBoost model’s decision, which predicts Class 0 with a high confidence (probability = 0.976). The factors of average monthly hours and salary level are the most influential features that contribute both positively and with the largest magnitudes. On the other hand, a high average monthly working time and a medium salary range push the prediction sharply toward employee retention (Class 0). However, low satisfaction level and short time spent at the company show negative contributions, demonstrating risk factors typically associated with attrition. However, their influence is small, and they do not overturn the final decision. Other factors, like last evaluation score, tenure level, department, and number of projects, indicate small effects, suggesting a limited local impact for this individual instance. Overall, this plot demonstrates that the model systematically weighs workload- and compensation-related factors against satisfaction and tenure indicators. It offers clear and interpretable insights into its decision-making process and strengthens confidence in the model’s reliability for employee attrition analysis.
4.3. Results from IBM Dataset
In this subsection, the experimental results of applying the proposed method on the IBM HR dataset are illustrated. The results in Table 7 show a comparison between the performance of the proposed method based on different resampling techniques. The comparison is based on the predictive performance (accuracy, F1-score, and ROC-AUC) and methodological complexity represented by memory footprint and running time. This table demonstrates that ROS alone provides higher accuracy, F1-score, and AUC values. Even the running time and memory footprint are lower than other complicated techniques. Indeed, more advanced resampling methods, such as SMOTE-based and hybrid approaches, fail to provide statistically significant gains over ROS, proposing that synthetic data generation may produce noise rather than useful variability. Cost-sensitive learning alone leads to poor performance, indicating that class weighting is insufficient for severe imbalance. Even though focal loss enhances minority-class learning in some cases, it introduces substantial computational overhead and inconsistent benefits, as illustrated in the results of focal integration with SMOTEEN and ROS. Overall, these values indicate that improved performance on a single dataset does not guarantee robustness, and future work should validate these conclusions across diverse datasets and deployment conditions.
Table 7.
Performance comparison of class imbalance handling techniques for employee attrition prediction applied on IBM dataset. Metrics include predictive performance (accuracy, F1-score, ROC-AUC), computational efficiency (execution time and memory usage), and statistical significance of performance differences relative to random oversampling (ROS).
As Table 8 shows, the XGBoost model reaches the highest overall predictive performance as it has the highest accuracy, F1-score, and ROC-AUC and achieves a low computational cost. In addition, its balanced runtime and memory usage make it a higher-green-efficiency model compared to the other models under evaluation, which underscores its ability to offer an accurate and resource-efficient HR analytics application.
Table 8.
Comparative performance and green efficiency of machine learning models applied on IBM dataset.
The CM comparison, illustrated in Table 9, indicates that ensemble-based and Gradient Boosting models (XGBoost, AdaBoost, ExtraTrees, HistGB, and Stacking) provide high TN and TP rates, reflecting their capability to efficiently distinguish employees who stay from those who leave. XGBoost and stacking produce a strong balance between minimizing FPs and FNs, while stacking reveals higher FPs, suggesting a tendency to incorrectly predict employee attrition. Stacking improves overall detection of TPs but slightly increases FPs compared to Gradient Boosting models. These results prove that ROS effectively mitigates class imbalance, permitting advanced ensemble models to provide high predictive performance across both classes.
Table 9.
Model confusion matrices with TPR, FPR, and precision for all models applied on IBM dataset.
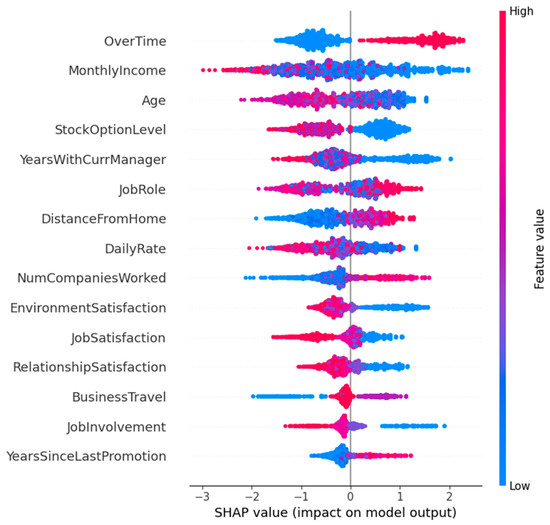
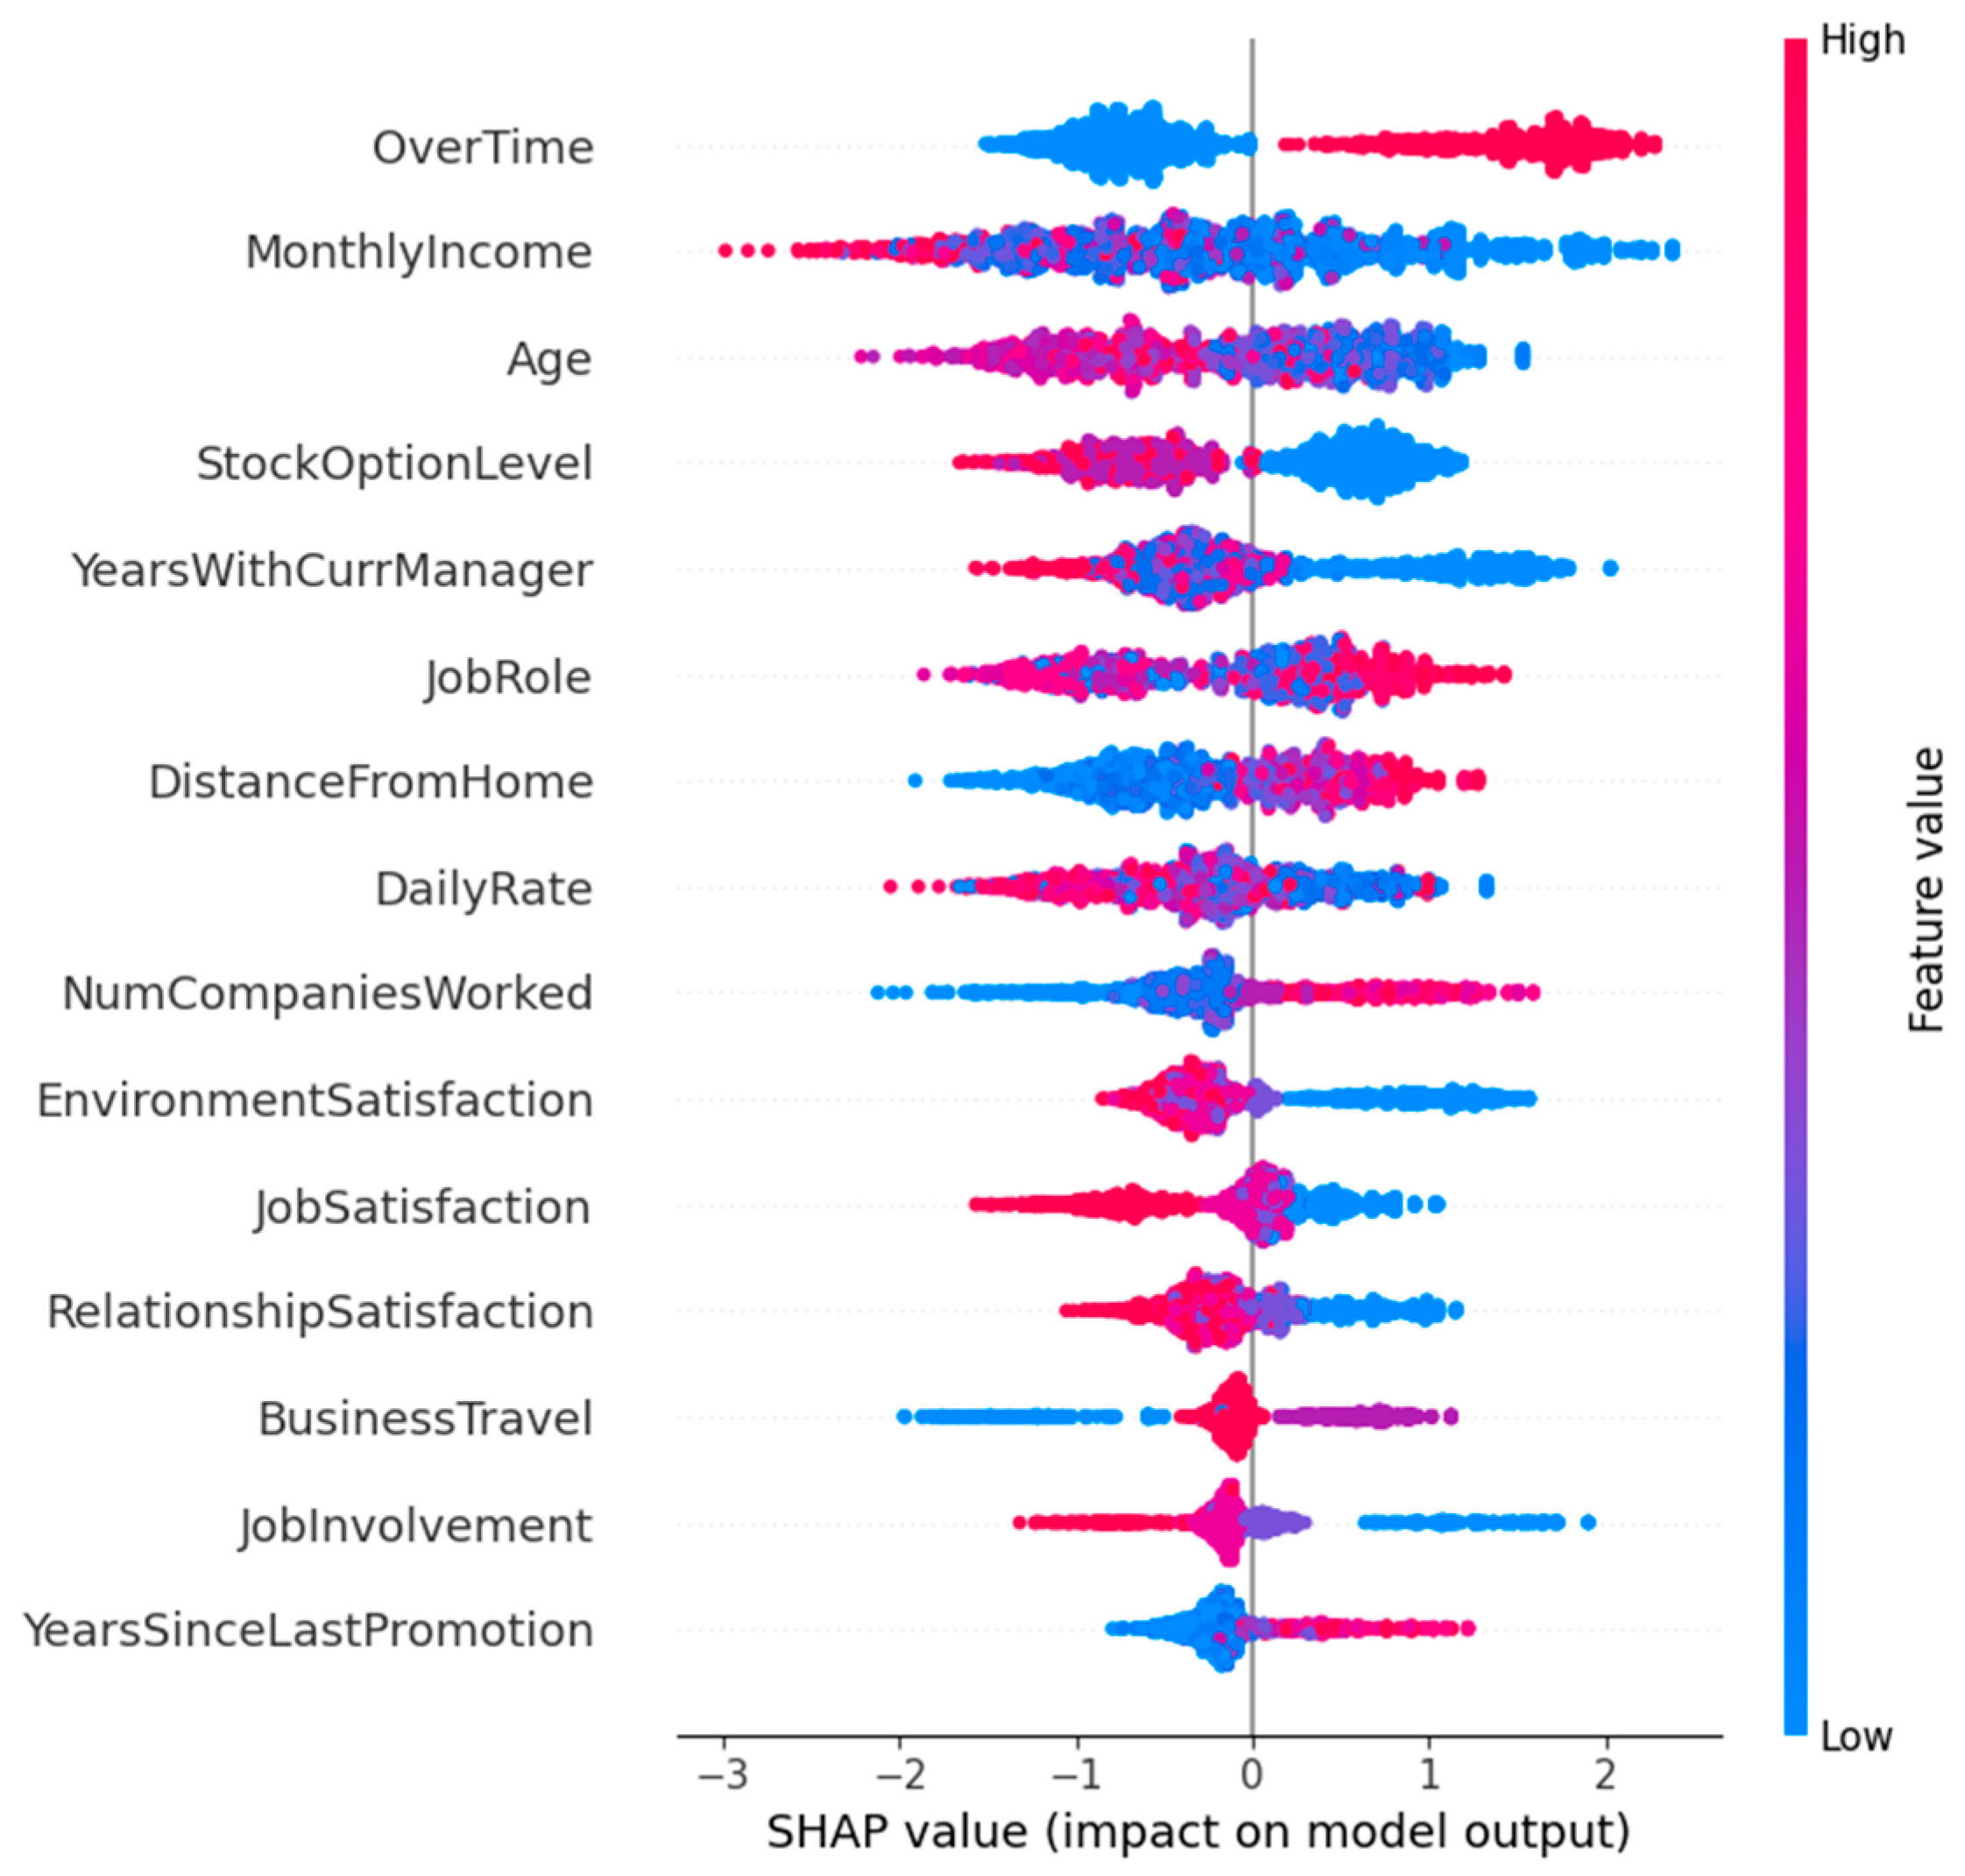
The SHAP summary plot, illustrated in Figure 7, offers more insights into both the importance and directional influence of key factors driving employee attrition. The most significant feature is overtime, as high overtime consistently pushes predictions toward attrition. This result shows the critical role of workload pressure. Additionally, financial and career-related attributes like MonthlyIncome, StockOptionLevel, and YearsWithCurrManager also indicate strong protective effects at higher values, showing that competitive compensation, long-term incentives, and managerial stability significantly reduce attrition risk. Other factors, such as demographic and career-related characteristics, reveal clear patterns in employee behavior. Younger employees and those who have worked for multiple companies tend to be more likely to leave, suggesting greater career mobility and a higher willingness to explore new opportunities. Job-context features like JobRole, DistanceFromHome, and BusinessTravel reveal mixed but meaningful effects, proposing heterogeneity in employee experiences across roles and commuting demands. Satisfaction-related factors, including job satisfaction, work environment, and workplace relationships, generally show a protective effect. Higher satisfaction levels are associated with negative SHAP values, indicating that a positive and engaging work climate helps reduce the likelihood of employee attrition.
Figure 7.
SHAP summary (beeswarm) plot showing the global impact of the top features on employee attrition prediction for IBM dataset. Each point represents an individual record, where the horizontal position shows the SHAP value. Positive values increase the likelihood of attrition, negative values decrease it. The color denotes the corresponding feature value (red = high, blue = low). Features are ranked by their mean absolute SHAP value.
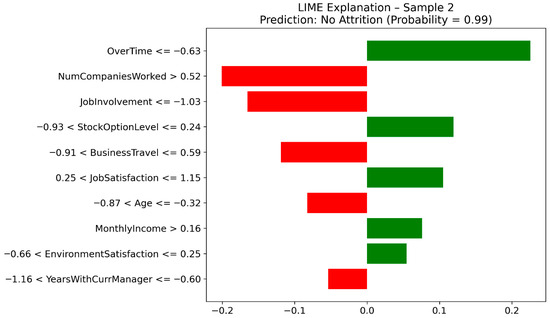
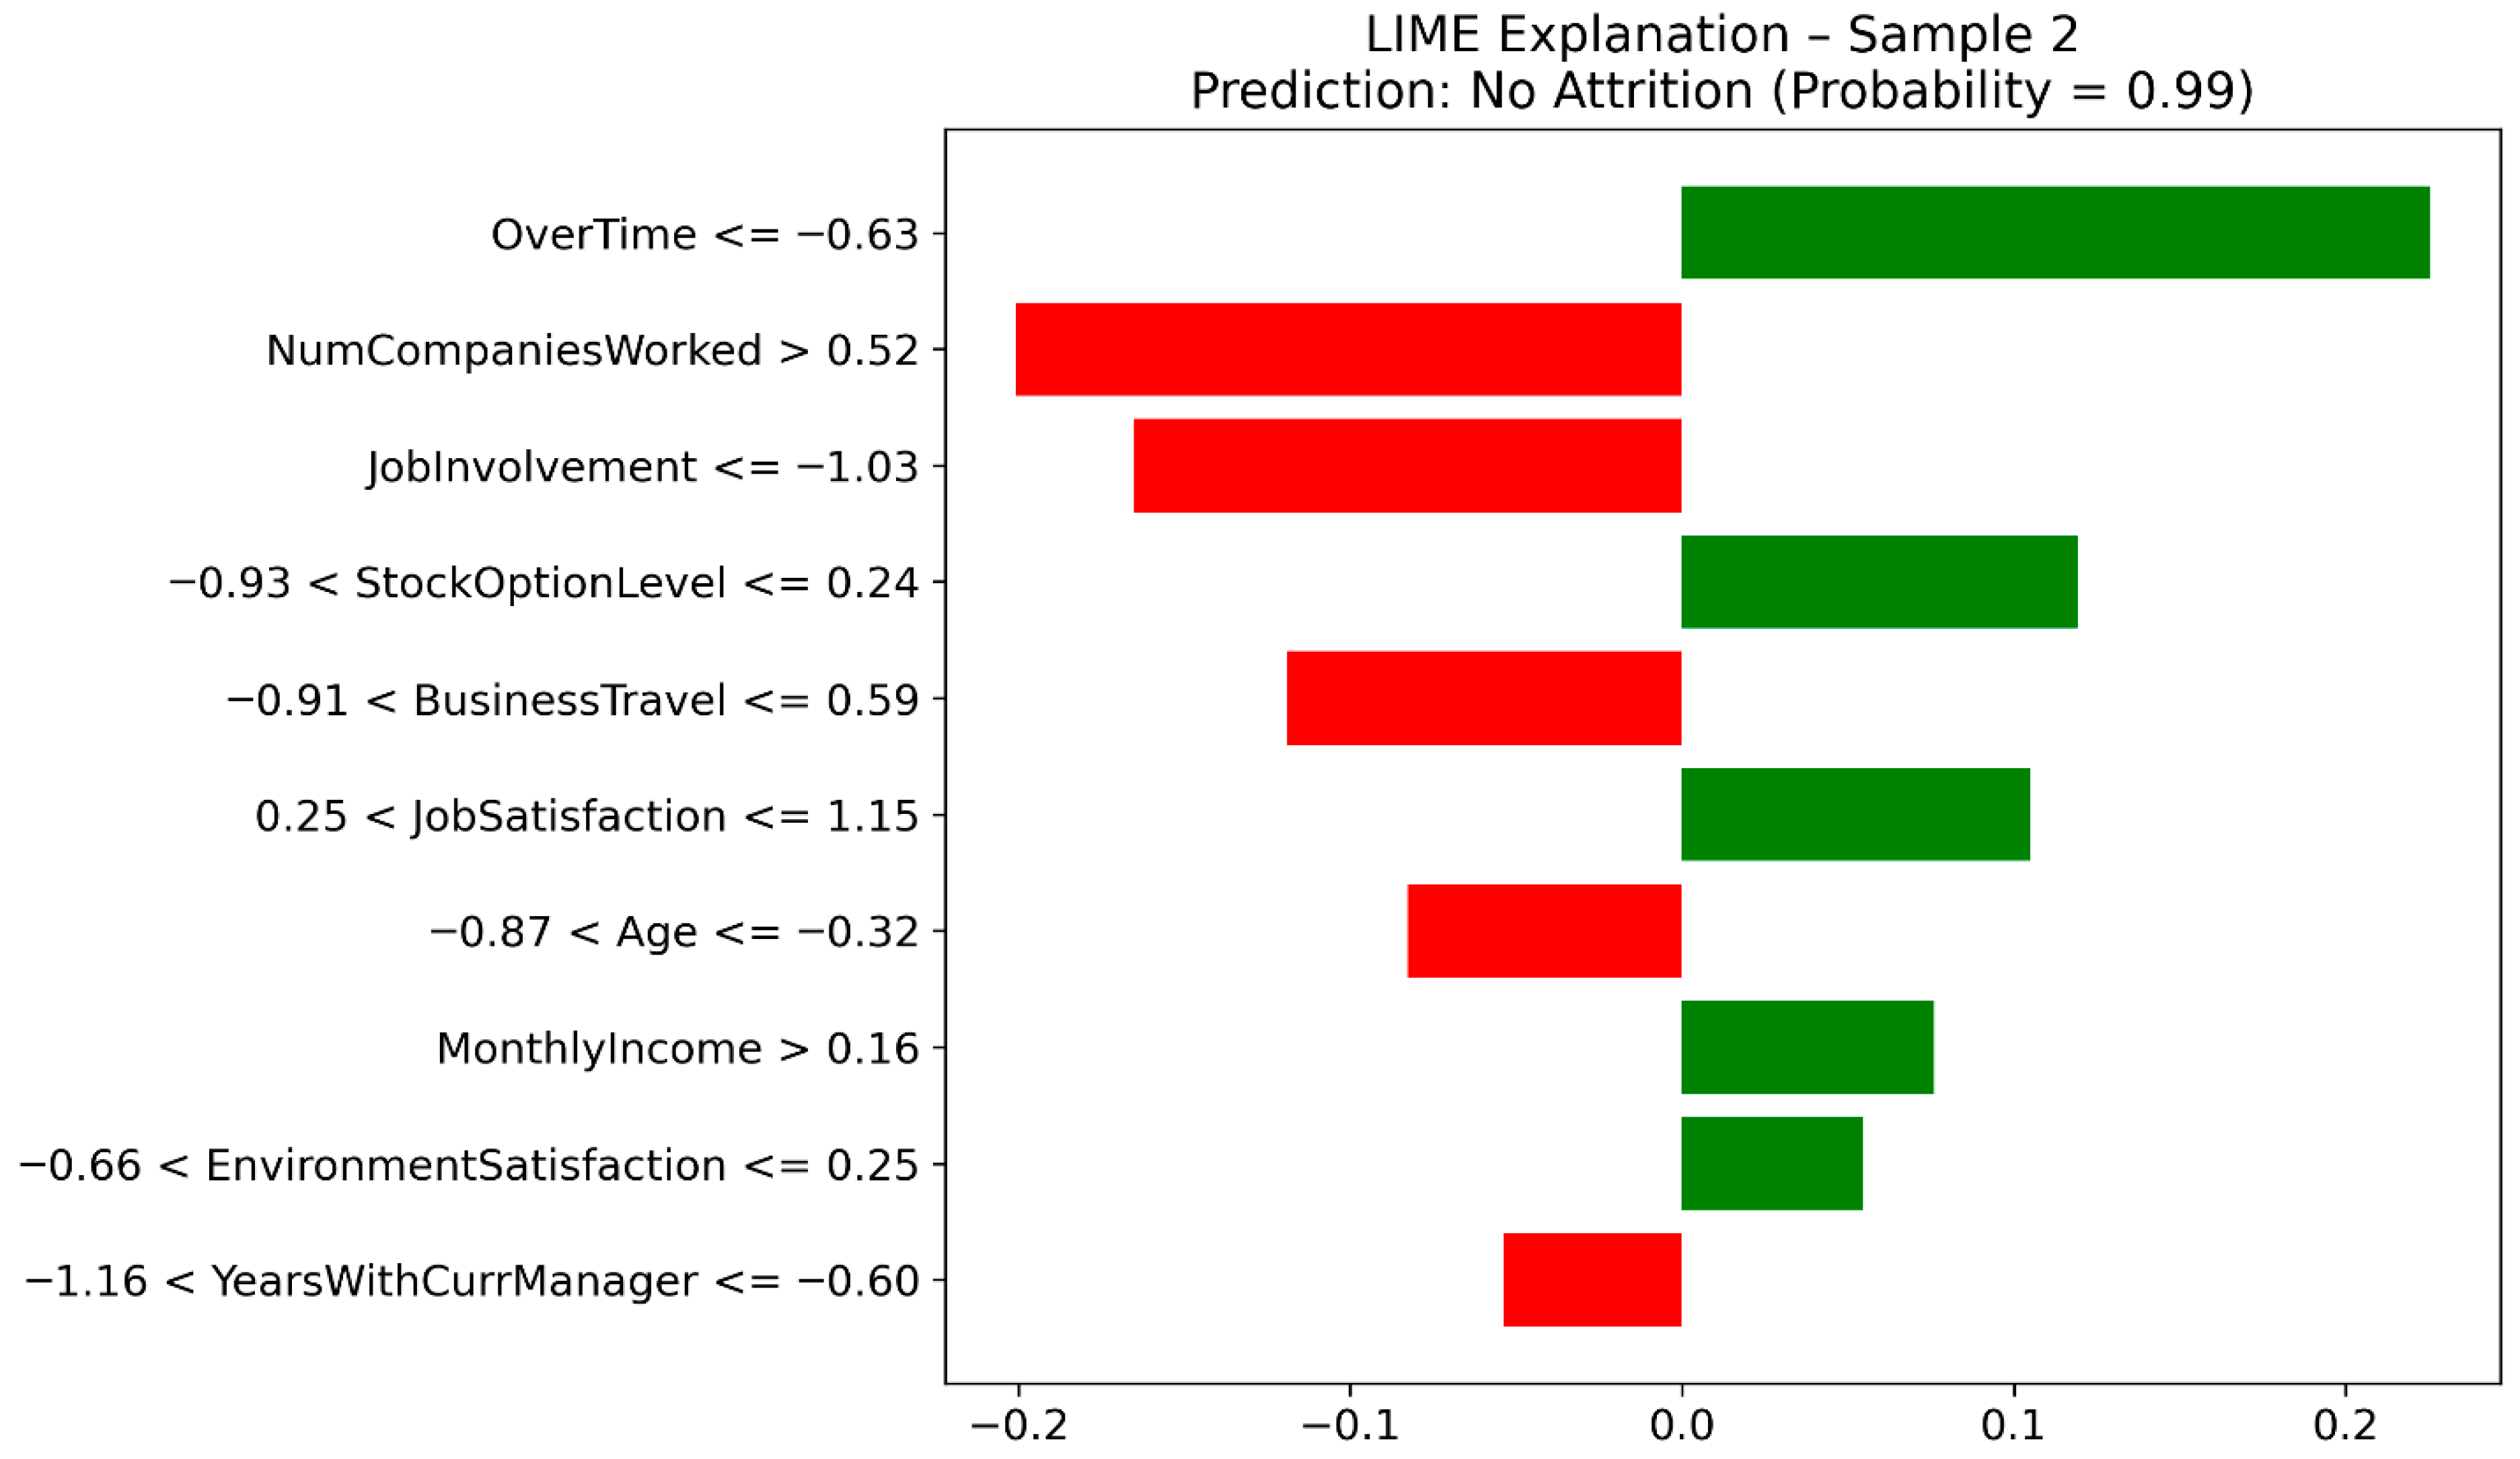
Figure 8 illustrates the LIME for Sample 2, showing the local reasoning behind the model’s no attrition prediction with a very high confidence (probability = 0.99). The absence of overtime is shown to be the most influential positive contributor. It strongly supports employee retention in this instance. More factors, such as a favorable stock option level, moderate to high job satisfaction, higher monthly income, and better environment satisfaction, further support the non-attrition decision. On the other hand, variables like the number of companies previously worked for, job involvement, business travel, and tenure with the current manager contribute negatively by increasing attrition risk. However, their combined influence is outweighed by the dominant retention-related features. Age also indicates a modest negative influence, revealing a limited local impact. Overall, this plot explains how the model incorporates compensation, workload, and satisfaction-related attributes to provide a confident and interpretable non-attrition prediction, thereby improving transparency and trust in the model’s decision-making process.
Figure 8.
LIME-based local explanation of the model’s prediction on IBM dataset for Sample 2, highlighting the positive and negative feature contributions leading to a high-confidence non-attrition (no attrition) outcome.
Table 10 shows a comparison of XGBoost performance of the proposed approach with the XGBoost basic model, XGBoost with ROS, and XGBoost with SHAP as feature selection. This table demonstrates the significant impact of the proposed approach. Indeed, by combining SHAP-based feature selection with random oversampling (ROS), the performance of the XGBoost model for employee attrition prediction increases significantly. The proposed approach reaches the best overall results, with the highest accuracy of 96% and ROC-AUC value of 0.991, while maintaining balanced precision, recall, and F1-scores across both classes. These values indicate the capability of the proposed approach in distinguishing between attrition and non-attrition cases, particularly under class imbalance conditions. Using ROS alone, XGBoost achieves competitive performance; however, the integration of SHAP feature selection further improves discriminative power by eliminating redundant and less informative variables. Additionally, models trained without oversampling show a notable decline in minority-class performance (reduced recall, F1-score, and ROC-AUC values). This result indicates the sensitivity of XGBoost to class imbalance. Overall, this table confirms that the integration of explainability-driven feature selection and imbalance handling is essential for creating robust, accurate, and interpretable employee attrition prediction models.
Table 10.
Performance comparison of XGBoost models applied on IBM dataset with and without SHAP feature selection and ROS.
4.4. Comparison and Discussion
The proposed method shows superior results compared to existing current techniques when applied to IBM HR and Kaggle HR datasets as illustrated in Table 11. The method proposed in [33] achieved an F1-score of 91.00 using DNN with ADASYN, while the method of [34] achieved an F1-score of 93.00 through their implementation of ensemble classifiers with SMOTE in their research. The method based on deep learning models together with Transformer models, which integrate GAN technology with SHAP analysis according to [12], reached F1-scores of 91.58 on IBM HR and 96.94 on Kaggle HR. The proposed SHAP-guided Optuna-optimized XGBoost framework delivered better results than the other approach as it produced F1-scores of 97.74 (IBM) and 97.29 (Kaggle) and ROC–AUC values that reached 0.99.
Table 11.
Comparative performance results.
The proposed model shows two main advantages through its predictive accuracy results and its efficient computational performance. The model shows excellent computational performance because it runs quickly while achieving high green efficiency levels when processing the Kaggle dataset at 0.459. The system achieves better results through its combination of SHAP-based feature selection with imbalance-aware training, automated hyperparameter optimization and dual explainability (SHAP + LIME), which produces better predictive results and improved computational efficiency than previous methods.
Table 12 and Table 13 show an integrated comparison between established turnover main factors delivered by the proposed method from the HR attrition models and the features reported in the literature review. By combining SHAP global importance with LIME local explanations, the tables validate the consistency between theoretical findings and data-driven insights derived from the Kaggle and IBM HR datasets. Indeed, as indicated in Table 12 for the factor “Promotion in the last 5 years,” the literature demonstrates that a lack of promotions increases turnover intention. This aligns with the results provided by the proposed model, where the SHAP analysis shows a “Very High” global impact, and the LIME local explanations confirm that “No promotion” increases the employee attrition. In addition, Table 13 shows that for “Years Since Last Promotion,” the literature demonstrates that a lack of promotion increases turnover intention. This aligns with the results provided by the proposed model, where SHAP identifies it as having a “Very High” global impact, and LIME local explanations show that more years without promotion increase attrition.
Table 12.
Integrated comparison of literature findings and model interpretability results (SHAP global importance and LIME local explanations) for the Kaggle HR attrition dataset. An upward arrow (↑) indicates an increase in employee attrition, whereas a downward arrow (↓) indicates a decrease in employee attrition.
Table 13.
Integrated comparison of literature findings and model interpretability results (SHAP global importance and LIME local explanations) for the IBM dataset. An upward arrow (↑) indicates an increase in employee attrition.
5. Conclusions
Employee attrition is the specific process by which workers voluntarily leave a company without the organization actively seeking a replacement. It highly affects the productivity and operational cost in the organization. Accurately predicting employee attrition permits HR managers to implement proactive interventions by enhancing workforce stability to reduce recruitment expenses. This paper proposed an interpretable and high-accuracy framework for predicting employee attrition based on ensemble learning models, explainable AI, resampling tools, and optimization techniques. The proposed framework incorporated SHAP-based feature selection, XGBoost mode, Optuna hyperparameter optimization, and dual explainability based on SHAP and LIME. In addition, class imbalance was addressed using a random oversampling (ROS) tool. The proposed method was assessed using two benchmark datasets: the Kaggle HR Analytics dataset (14,999 records) and the IBM HR dataset (1470 records). The results show that promotions, tenure, satisfaction levels, workload, overtime, and financial incentives are the most influential factors of attrition. SHAP global explanations indicates that limited promotions, shorter tenure, and high overtime consistently increase attrition risk, while higher satisfaction, compensation, and managerial stability reduce it. LIME-based local explanations confirmed these patterns at the individual level, illustrating that high average monthly hours and low satisfaction push predictions to attrition. However, favorable stock options level, moderate workload, and longer tenure contribute strongly to retention. Furthermore, the proposed model achieved superior predictive performance by producing an accuracy of 98.72%, F1-score of 97.29% and ROC–AUC of 0.994. It also maintains computational efficiency.
In this study, the term “statistically robust” is used to refer to improvements in performance that are statistically consistent across cross-validation folds and statistically significant testing. In addition, the suggested green efficiency measure is supposed to be a practical operational indicator that assesses both the predictive performance and computational efficiency, as opposed to a standardized measure. Additionally, considering the sensitivity of HR analytics, the critical issues of bias awareness, fairness, and transparency should be considered when using predictive models to make organizational decisions. Explainable AI techniques like SHAP and LIME are significant in this regard, as their transparent insights can help HR managers comprehend and review the model prediction better and make responsible data-driven decisions to reduce the likelihood of bias and unintended discrimination.
The proposed method achieved excelent results but encompasses some limitations, such as reliance on anonymized or synthetic datasets, focus on structured HR data only, and the exclusive use of XGBoost. These limitations may reduce the generalizability. Future work will investigate the integration of multi-source HR data (textual and temporal) and hybrid graph-based models to further improve robustness, interpretability, and practical applicability. Finally, the datasets used in this study are structured and curated. They facilitate model deployment but may not fully represent the real world. Future work will focus on assessing the proposed platform using more heterogeneous and real-world datasets to better evaluates its robustness and practical applicability.
Author Contributions
Conceptualization, G.N., O.A.-K. and M.A.M.; methodology, G.N. and J.H.; software, G.N. and O.A.-K.; validation, J.H., M.A.M. and G.N.; formal analysis, G.N.; investigation, O.A.-K.; resources, G.N. and M.A.M.; data curation, M.A.M.; writing—original draft preparation, G.N.; writing—review and editing, O.A.-K. and J.H.; visualization, O.A.-K. and M.A.M.; supervision, J.H. and M.A.M.; project administration, G.N. All authors have read and agreed to the published version of the manuscript.
Funding
This research received no external funding.
Data Availability Statement
Data is contained within the article.
Conflicts of Interest
The authors declare no conflicts of interest.
Abbreviations
The following abbreviations are used in this manuscript:
| HR | Human Resource |
| ML | Machine Learning |
| DL | Deep Learning |
| SVM | Support Vector Machine |
| LR | Logistic Regression |
| ETC | Extra Tree Classifier |
| DTC | Decision Tree Classifier |
| RF | Random Forest |
| KNN | K-Nearest Neighbors |
| DNN | Deep Neural Network |
| BiTCN | Bidirectional Temporal Convolutional Network |
| ROS | Random Oversampling |
| XGBoost | Extreme Gradient Boosting |
| SHAP | SHapley Additive exPlanations |
| LIME | Local Interpretable Model-agnostic Explanations |
| XAI | Explainable AI |
| ROC AUC | Receiver Operating Characteristic–Area Under the Curve |
| SMOTE | Synthetic Minority Over-sampling Technique |
| GAN | Generative Adversarial Network |
| TPE | Tree-structured Parzen Estimator |
| TP | True Positive |
| TN | True Negative |
| FP | False Positive |
| FN | False Negative |
| ADASYN | Adaptive Synthetic Sampling Approach |
| SMOTEENN | Synthetic Minority Over-sampling Technique combined with Edited Nearest Neighbors |
| CatBoost | Categorical Boosting |
| HistGB | Histogram-based Gradient Boosting |
| AdaBoost | Adaptive Boosting |
References
- Kaewwiset, T.; Temdee, P. An Analytical Framework for Employee Promotion Clustering. J. Mob. Multimed. 2025, 21, 1167–1194. [Google Scholar] [CrossRef] [Scilit]
- Zhu, H. Research on Human Resource Recommendation Algorithm Based on Machine Learning. Sci. Program. 2021, 2021, 8387277. [Google Scholar] [CrossRef] [Scilit]
- Shuster, N. Turnover, Exit as Voice, and Quitting Narratives: On the Endless ‘Great Resignation’ of Superstore Workers. In Deserting the Superstore; Springer Nature: Cham, Switzerland, 2025; pp. 209–227. [Google Scholar] [CrossRef] [Scilit]
- Gollapalli, M.; Rahman, A.-U.; Osama, A.; Alfaify, A.; Yassin, M.; Alabdullah, A. Data Mining and Visualization to Understand Employee Attrition and Work Performance. In Proceedings of the 2023 3rd International Conference on Computing and Information Technology (ICCIT); IEEE: Tabuk, Saudi Arabia, 2023; pp. 149–154. [Google Scholar] [CrossRef] [Scilit]
- Younis, S.; Ahsan, A.; Chatteur, F.M. An employee retention model using organizational network analysis for voluntary turnover. Soc. Netw. Anal. Min. 2023, 13, 28. [Google Scholar] [CrossRef] [Scilit]
- Ramos, M.E.; Garza-Rodríguez, J.; Gibaja-Romero, D.E. Automation of employment in the presence of industry 4.0: The case of Mexico. Technol. Soc. 2022, 68, 101837. [Google Scholar] [CrossRef] [Scilit]
- Shah, S.M.A.; Shar, A.K.; Ayoob, M.; Memon, F.G. Implications of Low Compensation, Deteriorated Work Environment, Low Growth in Career and Work-Life Imbalances on Employee Turnover in Microfinance Banks of Larkana, Sindh, Pakistan. Bull. Bus. Econ. BBE 2024, 13, 65–70. [Google Scholar] [CrossRef] [Scilit] [PubMed]
- Hajra, H.; Jayalakshmi, G. Evaluating the Impact of Employee Attrition on Organizational Performance Through MIS Analytics. In Advances in Computational Intelligence and Robotics; Singh, S., Hadoussa, S., Arumugam, T., Rajest, S.S., Eds.; IGI Global: Hershey, PA, USA, 2025; pp. 87–110. [Google Scholar] [CrossRef] [Scilit]
- Talebi, H.; Khatibi Bardsiri, A.; Bardsiri, V.K. Machine Learning Approaches for Predicting Employee Turnover: A Systematic Review. Eng. Rep. 2025, 7, e70298. [Google Scholar] [CrossRef] [Scilit]
- Kiran, P.R.; Chaubey, A.; Shastri, R.K. Role of HR analytics and attrition on organisational performance: A literature review leveraging the SCM-TBFO framework. Benchmarking Int. J. 2024, 31, 3102–3129. [Google Scholar] [CrossRef] [Scilit]
- Fallucchi, F.; Coladangelo, M.; Giuliano, R.; William De Luca, E. Predicting Employee Attrition Using Machine Learning Techniques. Computers 2020, 9, 86. [Google Scholar] [CrossRef] [Scilit]
- Baydili, İ.T.; Tasci, B. Predicting Employee Attrition: XAI-Powered Models for Managerial Decision-Making. Systems 2025, 13, 583. [Google Scholar] [CrossRef] [Scilit]
- Reddy Nalla, N. Machine Learning Models for Predicting Employee Retention and Performance. Int. J. Data Sci. Mach. Learn. 2025, 5, 15–19. [Google Scholar] [CrossRef] [Scilit]
- Ma, D.; Shu, M.; Zhang, H. Feature Selection Optimization for Employee Retention Prediction: A Machine Learning Approach for Human Resource Management. Comput. Sci. Math. 2025, 141, 120–130. [Google Scholar] [CrossRef] [Scilit]
- Barman, S.; Biswas, M.R.; Marjan, S.; Nahar, N.; Imam, M.H.; Mahmud, T.; Kaiser, M.S.; Hossain, M.S.; Andersson, K. A Two-Stage Stacking Ensemble Learning for Employee Attrition Prediction. In Proceedings of Trends in Electronics and Health Informatics; Mahmud, M., Kaiser, M.S., Bandyopadhyay, A., Ray, K., Al Mamun, S., Eds.; Lecture Notes in Networks and Systems; Springer Nature: Singapore, 2025; Volume 1034, pp. 119–132. [Google Scholar] [CrossRef] [Scilit]
- Biswas, A.K.; Seethalakshmi, R.; Mariappan, P.; Bhattacharjee, D. An ensemble learning model for predicting the intention to quit among employees using classification algorithms. Decis. Anal. J. 2023, 9, 100335. [Google Scholar] [CrossRef] [Scilit]
- Veglio, V.; Romanello, R.; Pedersen, T. Employee turnover in multinational corporations: A supervised machine learning approach. Rev. Manag. Sci. 2025, 19, 687–728. [Google Scholar] [CrossRef] [Scilit]
- Duan, L.; Paknejad, J.; Kim, H. Employee attrition prediction with convolutional neural network and synthetic minority over-sampling technique. J. Bus. Anal. 2025, 8, 24–35. [Google Scholar] [CrossRef] [Scilit]
- Manafi Varkiani, S.; Pattarin, F.; Fabbri, T.; Fantoni, G. Predicting employee attrition and explaining its determinants. Expert Syst. Appl. 2025, 272, 126575. [Google Scholar] [CrossRef] [Scilit]
- Narkbunnum, W.; Hinthaw, K. Interpretable Gradient Boosted Modeling of Employee Attrition: A SHAP-Based Framework for HR Analytics. Int. J. Anal. Appl. 2025, 23, 236. [Google Scholar] [CrossRef] [Scilit]
- Alyousef, M.I.; Khan, H.W.; Sattar, M.U. A Hybrid Predictive Model for Employee Turnover: Integrating Ensemble Learning and Feature-Driven Insights from IBM HR Analytics. Information 2026, 17, 208. [Google Scholar] [CrossRef] [Scilit]
- Kaggle. HR Analytics. Available online: https://www.kaggle.com/datasets/giripujar/hr-analytics (accessed on 8 March 2026).
- Subhash, P. IBM HR Dataset. Available online: https://www.kaggle.com/datasets/pavansubhasht/ibm-hr-analytics-attrition-dataset (accessed on 8 March 2026).
- Nassreddine, G.; El Arid, A.; Nassereddine, M.; Al Khatib, O. Fault Detection and Classification for Photovoltaic Panel System Using Machine Learning Techniques. Appl. AI Lett. 2025, 6, e115. [Google Scholar] [CrossRef] [Scilit]
- Nassreddine, G.; El Arid, A.; Nassereddine, M.; Al-Khatib, O.; Arram, A.; El Abed, A. Enhancing the Efficacy of Short-Term Prediction Models for Solar Photovoltaic Systems: An Influence Examination of Chronological and Meteorological Factors. IEEE Access 2025, 13, 66787–66808. [Google Scholar] [CrossRef] [Scilit]
- Araf, I.; Idri, A.; Chairi, I. Cost-sensitive learning for imbalanced medical data: A review. Artif. Intell. Rev. 2024, 57, 80. [Google Scholar] [CrossRef] [Scilit]
- Bukowski, M.; Kurek, J.; Świderski, B.; Jegorowa, A. Custom Loss Functions in XGBoost Algorithm for Enhanced Critical Error Mitigation in Drill-Wear Analysis of Melamine-Faced Chipboard. Sensors 2024, 24, 1092. [Google Scholar] [CrossRef] [Scilit]
- Chowdhury, S.U.; Sayeed, S.; Rashid, I.; Alam, M.G.R.; Masum, A.K.M.; Dewan, M.A.A. Shapley-Additive-Explanations-Based Factor Analysis for Dengue Severity Prediction using Machine Learning. J. Imaging 2022, 8, 229. [Google Scholar] [CrossRef] [Scilit]
- Riski, G.; Hartama, D.; Solikhun. Optimizing Multilayer Perceptron for Car Purchase Prediction with GridSearch and Optuna. J. RESTI Rekayasa Sist. Dan Teknol. Inf. 2025, 9, 266–275. [Google Scholar] [CrossRef] [Scilit]
- Wen, Y.; Guo, R.; Duan, Z.; Tong, Y.; Tang, X.; Pan, T.; Fu, C. Machine learning model optimization with optuna for accurate prediction of strength and crack behavior in prestressed concrete beams. Sci. Rep. 2026, 16, 5822. [Google Scholar] [CrossRef] [Scilit]
- Salih, A.M.; Raisi-Estabragh, Z.; Galazzo, I.B.; Radeva, P.; Petersen, S.E.; Lekadir, K.; Menegaz, G. A Perspective on Explainable Artificial Intelligence Methods: SHAP and LIME. Adv. Intell. Syst. 2025, 7, 2400304. [Google Scholar] [CrossRef] [Scilit]
- Gaspar, D.; Silva, P.; Silva, C. Explainable AI for Intrusion Detection Systems: LIME and SHAP Applicability on Multi-Layer Perceptron. IEEE Access 2024, 12, 30164–30175. [Google Scholar] [CrossRef] [Scilit]
- Al-Darraji, S.; Honi, D.G.; Fallucchi, F.; Abdulsada, A.I.; Giuliano, R.; Abdulmalik, H.A. Employee Attrition Prediction Using Deep Neural Networks. Computers 2021, 10, 141. [Google Scholar] [CrossRef] [Scilit]
- Raza, A.; Munir, K.; Almutairi, M.; Younas, F.; Fareed, M.M.S. Predicting Employee Attrition Using Machine Learning Approaches. Appl. Sci. 2022, 12, 6424. [Google Scholar] [CrossRef] [Scilit]
- Mortezapour Shiri, F.; Yamaguchi, S.; Ahmadon, M.A.B. A Deep Learning Model Based on Bidirectional Temporal Convolutional Network (Bi-TCN) for Predicting Employee Attrition. Appl. Sci. 2025, 15, 2984. [Google Scholar] [CrossRef] [Scilit]
- Atef, M.; Elzanfaly, D.S.; Ouf, S. Early Prediction of Employee Turnover Using Machine Learning Algorithms. Int. J. Electr. Comput. Eng. Syst. 2022, 13, 135–144. [Google Scholar] [CrossRef] [Scilit]
- Hom, P.W.; Kiazad, K. New Directions for Theories for Why Employees Stay or Leave. Annu. Rev. Organ. Psychol. Organ. Behav. 2025, 12, 185–213. [Google Scholar] [CrossRef] [Scilit]
- Chen, X.; Al Mamun, A.; Hoque, M.E.; Hirwani Wan Hussain, W.M.; Yang, Q. Work design, employee well-being, and retention intention: A case study of China’s young workforce. Heliyon 2023, 9, e15742. [Google Scholar] [CrossRef] [Scilit] [PubMed]
- Dea, R.F.; Abrian, Y. Influence of Work-Life Balance and Job Satisfaction on Turnover Intention Among Generation Z Employees at Four Points by Sheraton Jakarta, Thamrin. J. Multidimens. Manag. 2025, 2, 278–283. [Google Scholar] [CrossRef] [Scilit]
- Bai, Y.; Zhou, J. Coworker support, work–family conflict, job satisfaction, and turnover intention: Female employees in post-organizational socialization. Front. Psychol. 2025, 16, 1472977. [Google Scholar] [CrossRef] [Scilit]
- Sun, S.; Chen, H.; He, Y.; Yu, F.; Yang, Y.; Chen, H.; Tung, T.-H. Workplace bullying and turnover intentions among workers: A systematic review and meta-analysis. BMC Public Health 2025, 25, 2394. [Google Scholar] [CrossRef] [Scilit]
- Lin, M.-H.; Yen, Y.-H.; Chuang, T.-F.; Yang, P.-S.; Chuang, M.-D. The impact of job stress on job satisfaction and turnover intentions among bank employees during the COVID-19 pandemic. Front. Psychol. 2024, 15, 1482968. [Google Scholar] [CrossRef] [Scilit] [PubMed]

Disclaimer/Publisher’s Note: The statements, opinions and data contained in all publications are solely those of the individual author(s) and contributor(s) and not of MDPI and/or the editor(s). MDPI and/or the editor(s) disclaim responsibility for any injury to people or property resulting from any ideas, methods, instructions or products referred to in the content. |
© 2026 by the authors. Licensee MDPI, Basel, Switzerland. This article is an open access article distributed under the terms and conditions of the Creative Commons Attribution (CC BY) license.