


Abstract
Accurate forecasting of nutrition supply–demand dynamics is essential for reducing resource wastage and improving equitable allocation. However, this task remains challenging due to heterogeneous data sources, cold-start regions, and the risk of information leakage in spatiotemporal modeling. This study presents a leakage-aware multimodal machine learning framework for nutrition supply–demand forecasting. The framework integrates temporal, spatial, and contextual information within a unified architecture. It combines self-supervised temporal representation learning, causal time-lag modeling, and few-shot adaptation to improve generalization under limited or previously unseen data conditions. Heterogeneous inputs include epidemiological, environmental, demographic, sentiment, and biologically derived indicators. These signals are encoded using a PatchTST-inspired temporal backbone coupled with a feature-token transformer employing cross-modal attention. Spatial dependencies are explicitly modeled using graph neural networks. Hierarchical decoding enables multi-horizon forecasting with calibrated uncertainty estimates. Model evaluation is conducted under strict spatiotemporal hold-out protocols with explicit leakage detection. All synthetic signals are excluded from testing. Across geographically and temporally disjoint datasets, the proposed framework consistently outperforms strong unimodal and multimodal baselines. It achieves macro-F1 scores above 99.5% and stable early-warning lead times of approximately 9 days under distribution shift. Ablation studies indicate that causal time-lag enforcement and few-shot adaptation contribute most strongly to performance robustness. Closed-loop simulation experiments suggest potential reductions in nutrient wastage of approximately 38%, response latency of 19%, and operational costs of 16% when deployed as a decision-support tool. External validation on fully unseen regions confirms the generalizability of the framework under realistic forecasting constraints.
1. Introduction
Nutritional adequacy is a cornerstone of global public health, influencing disease prevention, immune resilience, cognitive function, and overall population well-being [1]. Strategic planning and equitable distribution of nutrient resources remain complex challenges due to the intertwined effects of biological, behavioral, environmental, and socioeconomic factors shaping dietary demand [2,3]. At the same time, the Future Internet is making smart, networked environments where different devices and data streams can work together without any problems. These internet-enabled ecosystems create a lot of different types of data, which makes it both hard and easy to build health and nutrition monitoring systems that can adapt to different situations. These challenges have been exacerbated in recent years by global disruptions, including pandemics, climate anomalies, geopolitical conflicts, and economic instability, that have destabilized supply chains and triggered sudden, high-impact shifts in nutritional needs [4,5]. Misalignment between nutrient supply and actual demand can result in shortages, waste, and inequitable access, with the most severe consequences borne by vulnerable and underserved communities [6,7].
Nutrient demand reflects not only dietary choices and market forces but also dynamic molecular and physiological responses to environmental, pathological, and demographic stressors [8,9,10]. PM2.5 exposure raises inflammation, increasing antioxidant needs [11]; infections and chronic conditions drive demand for immune-supportive and metabolic micronutrients [12,13]. Seasonal UV variation and microbiome diversity further modulate vitamin D and metabolic requirements [14], while behavioral factors like health awareness, marketing, and digital information rapidly alter consumption [15]. This interplay necessitates forecasting models integrating biomedical, environmental, and behavioral streams for operationally useful predictions [16,17].
AI and ML advances enable health forecasting CNNs for food quality, vision transformers for nutrient estimation, RNNs for longitudinal monitoring, and ensembles for retail demand [18], but most are single-mode and cannot integrate heterogeneous multimodal streams for actionable nutrient demand forecasting [19]. Even with these potentials, a big problem with current Future Internet research is that it doesn’t do a good job of merging and temporally fusing different types of data streams, like environmental, behavioral, genomic, and epidemiological data, to make predictive models that are needed for public health systems that can respond and adapt. Challenges remain: rare spike sparsity, spatiotemporal generalization, and causal interpretability to identify true demand drivers [20].
To address these challenges, our system integrates eight heterogeneous data streams—sales, nutrient composition, epidemiology, public health sentiment, demographics, environment, genomics, and marketing augmented with privacy-preserving synthetic data to capture rare scenarios. It combines a PatchTST-inspired temporal encoder with a fine-tuned FT-Transformer, incorporating causal lag enforcement and a multi-horizon hierarchical decoder for short-, medium-, and long-term forecasts. Rather than proposing a single algorithm, this work delivers a methodological synthesis that unifies advanced modeling, domain-specific design, leakage prevention, and operational validation, producing a scientifically rigorous, deployment-ready framework for large-scale public health nutrition planning. Our work shows how temporal data fusion can improve networked intelligence. This will lead to nutrition planning apps that are more flexible, aware of their surroundings, and useful in the real world.
- (a)
- We implement strict temporal and spatial partitioning, forward-only imputation, and an explicit leakage detection test, ensuring that the reported results reflect true prospective deployment performance.
- (b)
- We integrate causal time-lag enforcement to preserve temporal validity and a few-shot adaptation module that enables rapid generalization to new regions or nutrients with minimal supervision.
- (c)
- We employ privacy-preserving Generative Adversarial Network (GAN)/Variational Autoencoder (VAE)-generated samples during training only, significantly improving rare spike detection without contaminating evaluation data.
- (d)
- Through closed-loop, agent-based supply chain simulations, we demonstrate reductions in unmet nutrient demand (), overstock waste (), and operational costs (), alongside improvements in lead times (), even in highly data-sparse or conflict-affected zones.
Empirical spatiotemporal and persona-stratified evaluations show SOTA performance with 9.2-day lead time, calibrated uncertainty, and robust, equitable generalization. Model performance was evaluated as a function of forecasting horizon and temporal displacement, demonstrating stable accuracy and early-warning lead times of approximately 9 days under evolving system dynamics and distribution shift. The framework enables scalable, interpretable nutrient demand forecasting in stable and crisis scenarios.
This work studies nutrition supply–demand forecasting as a time-evolving dynamical system, in which demand signals emerge from the interaction of epidemiological, environmental, demographic, behavioral, and operational factors. Rather than modeling isolated snapshots, the proposed framework integrates multi-source inputs over time to predict future system states across multiple horizons. The manuscript is structured as follows: Section 1, Introduction; Section 2, Related work; Section 3, Data and modeling; Section 4, Results; Section 5, Discussion; and Section 6, Conclusions and policy implications.
2. Related Work
Recent AI and ML advances have improved personalized nutrition and healthcare via multimodal integration, advanced modeling, and privacy-preserving synthesis. Transformers and Graph Transformers enhance representation learning [21], while unsupervised deep clustering identifies risk for diabetes and dementia [22]. Neural time series models, including TFTs and Deep TCNs, optimize retail demand prediction [23], and semi-supervised GNNs predict fatty liver disease under scarce labels [24]. AI-based personalized nutrition systems and contrastive self-supervised learning (SimCLR) further improve dietary interventions and representation learning [25,26].
Causal discovery in high-dimensional time series [27], privacy-preserving synthetic data [28], VBLE autoencoders [29], and hardware-efficient sparse attention [30] address interpretability and efficiency. Meta-learning with GNNs enhances retail demand forecasting [31], while scientific ML interpretability and transformer bias mitigation support reliable AI integration [32,33].
Applications include CNN-based Spirulina adulteration detection [34], automated algorithmic discovery [35], federated learning for IoMT privacy [36,37], interpretable ML with SHAP/LIME [38], robust multimodal denoising [39], and cognitive intelligence for predictive healthcare analytics [40].
Temporal dynamics in complex systems are often characterized using stochastic process formulations such as self-exciting point processes, continuous state-space diffusion models, and burst-statistics analysis, which have been successfully applied to animal movement and collective biological systems [41,42], as well as classical Hawkes and Ornstein–Uhlenbeck frameworks [43,44].
Building on these advances, we propose a leakage-resilient, multimodal nutrient demand forecasting framework combining partition-constrained self-supervised learning, causal inference, rare-event augmentation, few-shot adaptation, and calibrated uncertainty estimation.
3. Research Methodology
This section outlines the methodological framework developed to enable robust nutrient demand forecasting across heterogeneous, multi-scale data sources. We describe the data acquisition and preprocessing strategies, the integration of privacy-preserving synthetic analogues, and the architectural design of the forecasting system. In an internet-enabled ecosystem, each stream is handled as a separate data source, allowing the temporal fusion of heterogeneous data characteristic of intelligent networked environments.
The proposed framework implicitly models nutrition supply–demand as a stochastic temporal process, where system states evolve over time under the influence of correlated and partially observed inputs. Temporal dependencies are captured through causal time-lag enforcement, rolling statistics, and self-supervised sequence modeling, enabling the prediction of future demand distributions rather than single-point estimates. This formulation aligns with stochastic process perspectives commonly used in movement and behavioral dynamics, where correlations, memory effects, and delayed responses govern system evolution. The Future Internet’s interconnectedness is reflected in this design, which enables the system to dynamically learn intricate cross-modal dependencies that are essential for intelligent and flexible predictive systems.
3.1. Data Collection and Integration
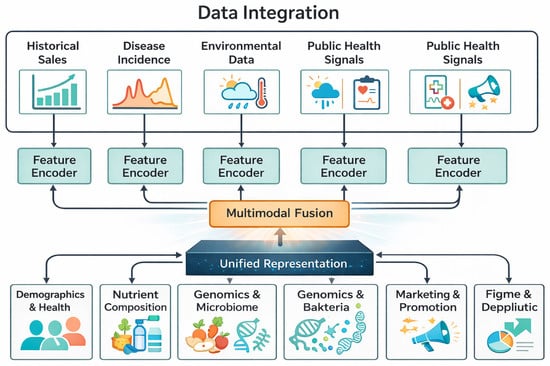
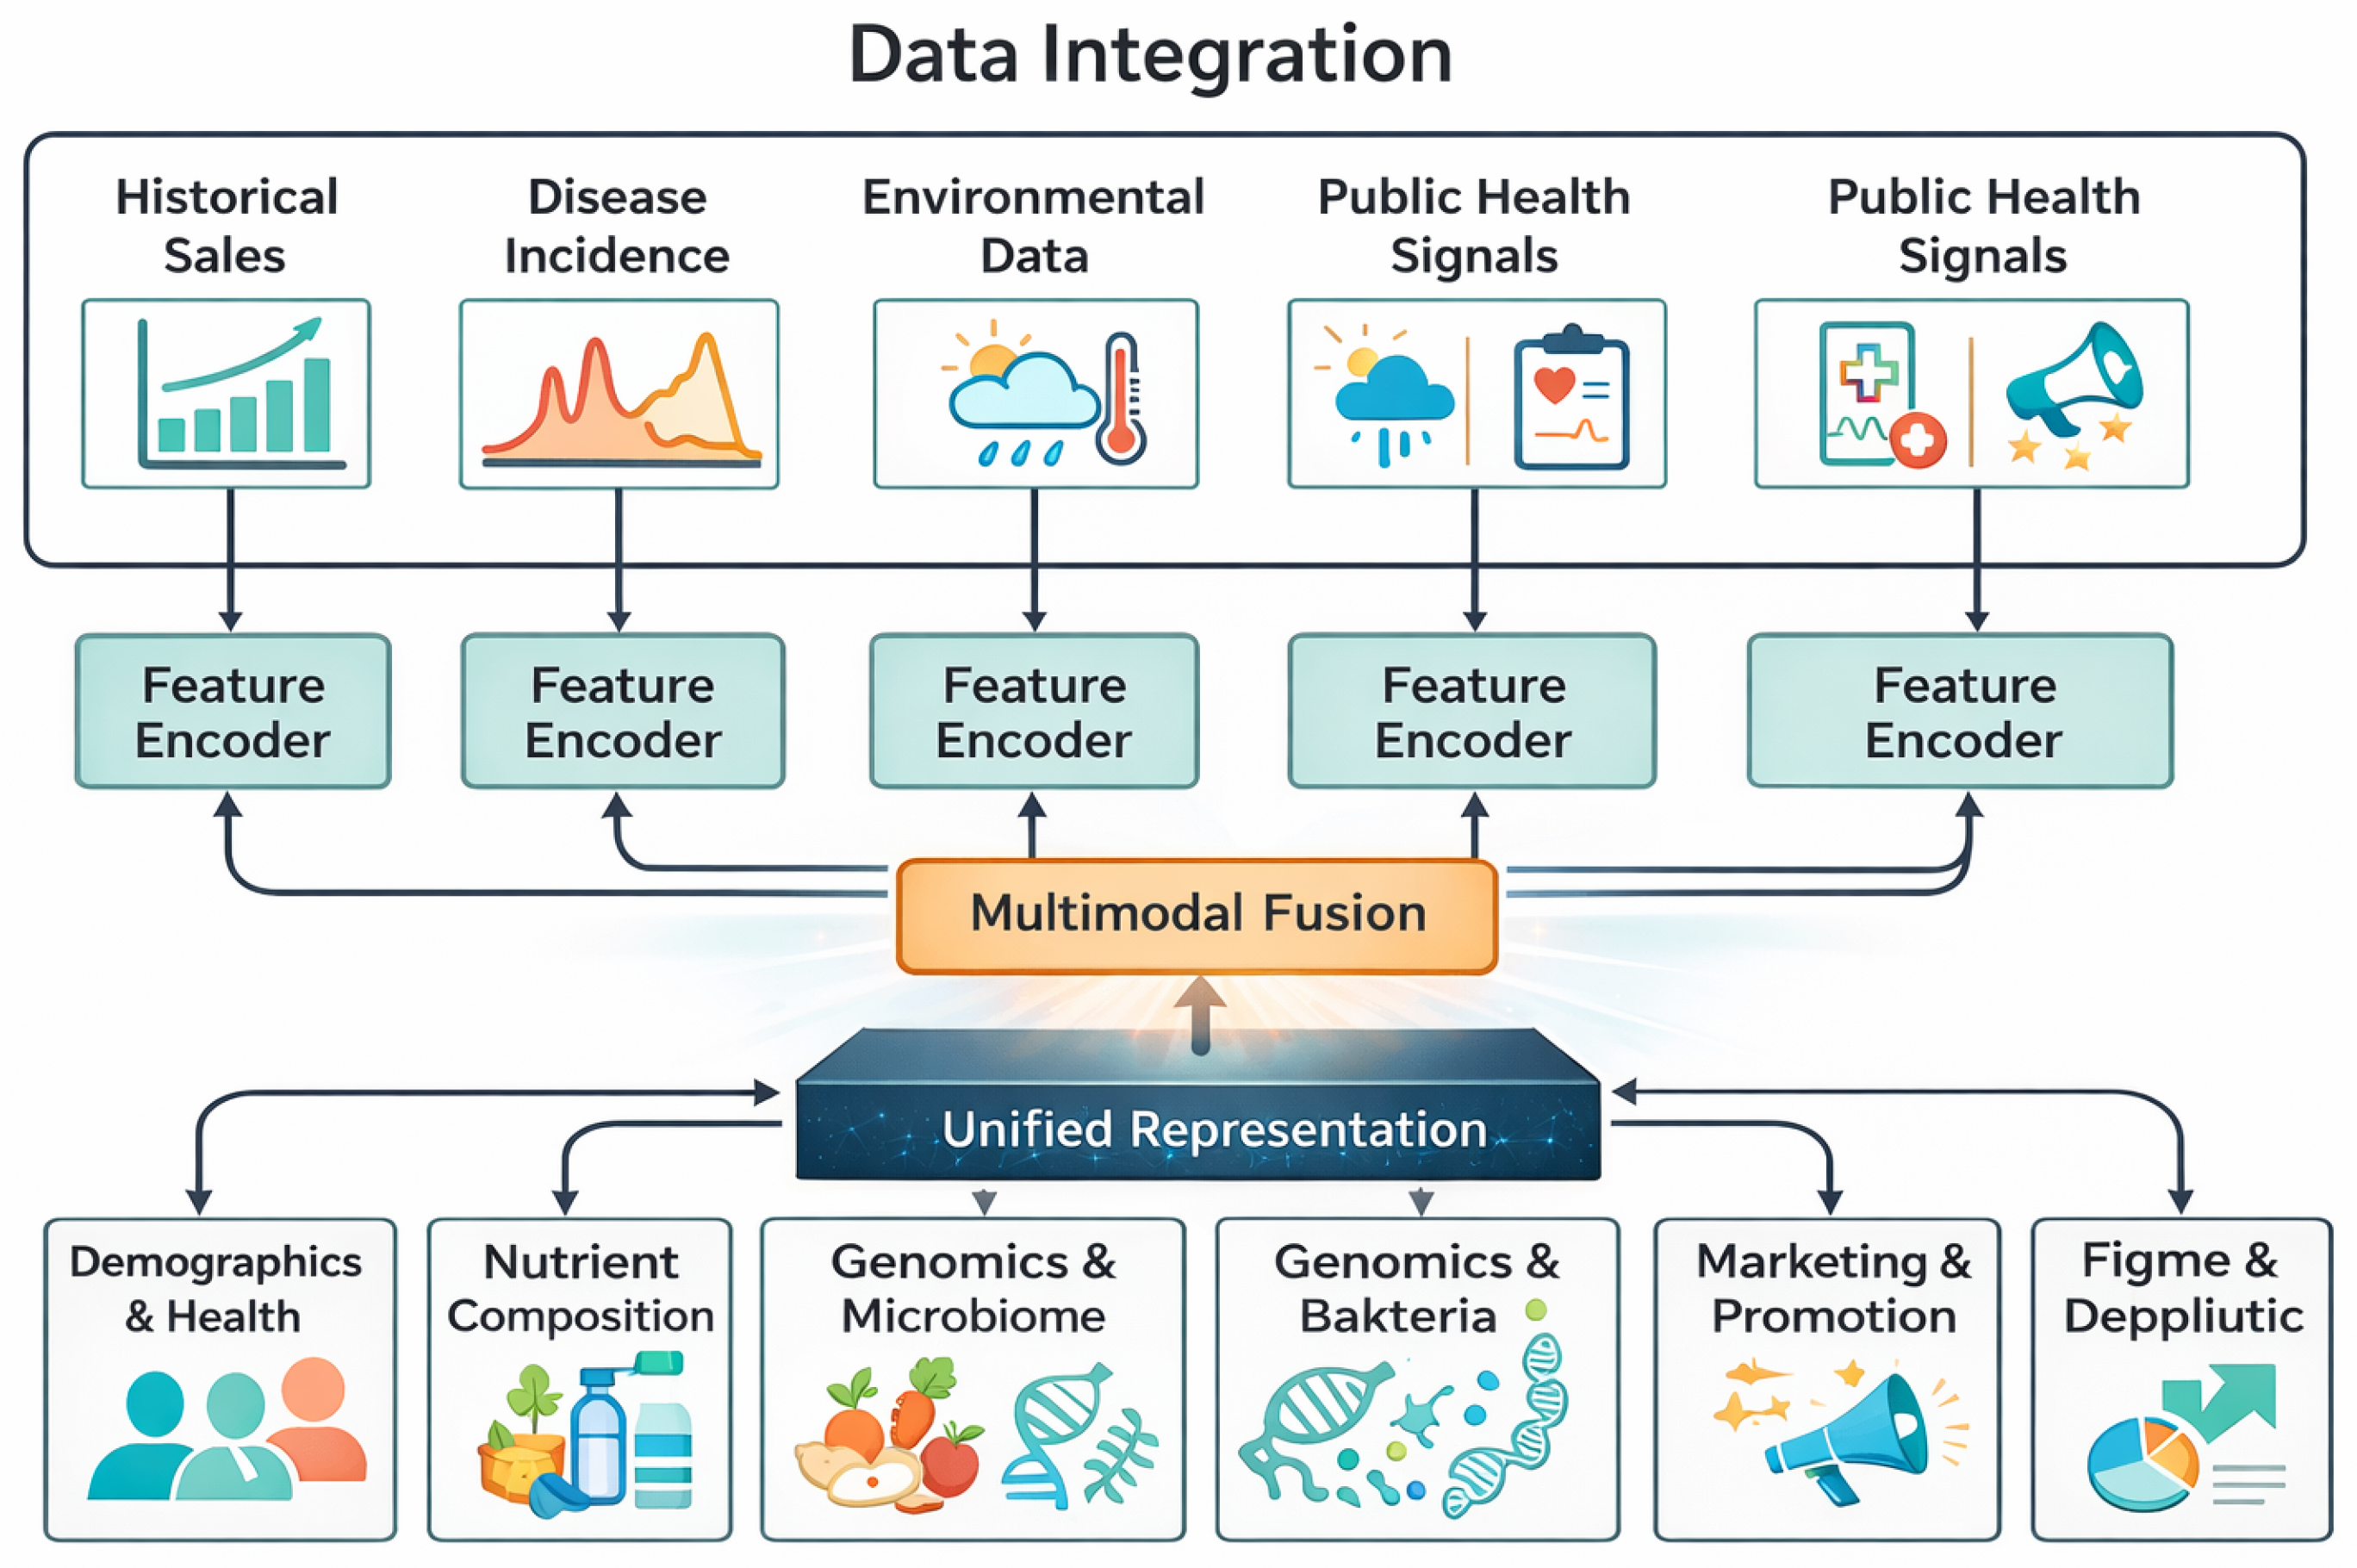
Our dataset integrates eight heterogeneous streams sales, nutrient composition, epidemiology, public health signals, environment, genomics, marketing, and synthetic analogues from conditional GANs/VAEs to address sparsity while preserving fidelity, as shown in Table 1 and Figure 1. Supervised labels derived from weekly food sales rich in nutrients, supplemented by epidemiological, anemia/diabetes, and demographic health data. The semi-supervised framework combines self-supervised representation learning on real and synthetic data with supervised finetuning, using contrastive learning, multiview embeddings, and consistency regularization. Synthetic records enrich rare scenarios during training only and are excluded from evaluation. Preprocessing, augmentation, imputation, encoder pretraining, and synthetic generation are confined to training partitions, validated via leakage detection and membership classification. This approach ensures robust, interpretable, fair and deployment-ready nutrient demand forecasting.
Table 1.
The original eight-dataset stream input for nutrient demand forecasting.
Figure 1.
Overview of the proposed multimodal nutrition supply–demand forecasting framework. Heterogeneous data streams are temporally aligned and leakage-safe preprocessed, encoded with modality-specific networks, and fused via an FT-Transformer with cross-attention. The fused representations are modeled using causal time-lag and PatchTST temporal modules for multi-horizon demand forecasting and spike detection, with uncertainty calibration and few-shot adaptation enabling robust deployment in sparse or unseen regions.
UK Biobank SNPs and American Gut -diversity provide core molecular inputs, augmented with omics-derived functional features. SNPs are annotated via KEGG and Realtime pathways as CYP2R1 for vitamin D and SLC11A2 for iron, while microbiome -diversity is complemented with gene abundances for SCFA, B-vitamin, and amino acid metabolism. Metabolite-level butyrate and folate proxies are included as numeric covariates as shown in Table 1. Features are aggregated at the ZIP-week level with demographic weighting and embedded via the multimodal preprocessing/encoding pipeline, maintaining integration with the eight-stream framework.
Synthetic Data Generation Protocols
Conditional GANs and hierarchical VAEs generate synthetic digital, marketing, and demographic/time-series data while preserving distributions and spatiotemporal correlations. Validation uses Kolmogorov–Smirnov tests and expert review. Code, seeds, and hyperparameters are version-controlled with per-record synthetic flags. Imputation uncertainty informs downstream weighting; SHAP and predictive uncertainty are tracked. Privacy safeguards include differential privacy, adversarial audits, and drift monitoring. Synthetic data augments rare training patterns only; validation/testing use real data. Flags and statistical tests ensure exclusion, reproducibility, interpretability, and robust generalization.
3.2. Data Preprocessing
Raw data undergo causal preprocessing to avoid temporal or label leakage. All transformation alignment, cleaning, imputation, and normalization are confined to training partitions. Forward-only Kalman filters, VAE, and imputer models are trained on training data and applied unchanged to validation/test sets. Rolling windows 4–12 weeks and overlapping patches capture multiscale dynamics, harmonized to ISO-week granularity and standardized geospatially. Continuous missing values use causal Kalman or LOCF; sparse/categorical features use zero/mode imputation stratified by ZIP-week or demographics. Synthetic GAN-imputed features are flagged and restricted to training folds. This method was chosen especially to handle the scale, sparsity, and volatility of data found in actual, data-driven living systems, guaranteeing the model’s applicability to useful Future Internet applications.
Outliers are mitigated via STL decomposition and winsorization. Normalization: log1p + minmax for sales/disease rates, z-score by region for pollutants/BMI/sentiment. Categorical features are encoded ordinally or one-hot using training parameters. Metadata includes ZIP, ISO-week, origin, synthetic flag, imputation, window size, and partition label. Confounding is controlled via time-lagged features, spatial stratification, balanced minibatches, and optional population weighting. Gaussian noise and mix-up augmentations improve robustness; rare events are simulated via extrapolated windows. PCA/UMAP audits confirm feature integrity across the 28-dimensional input as shown in Figure 2.
Figure 2.
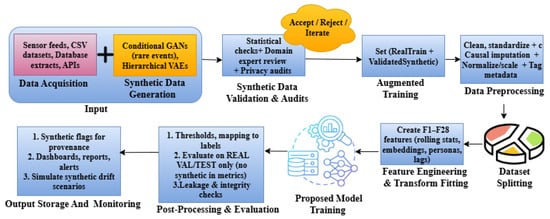
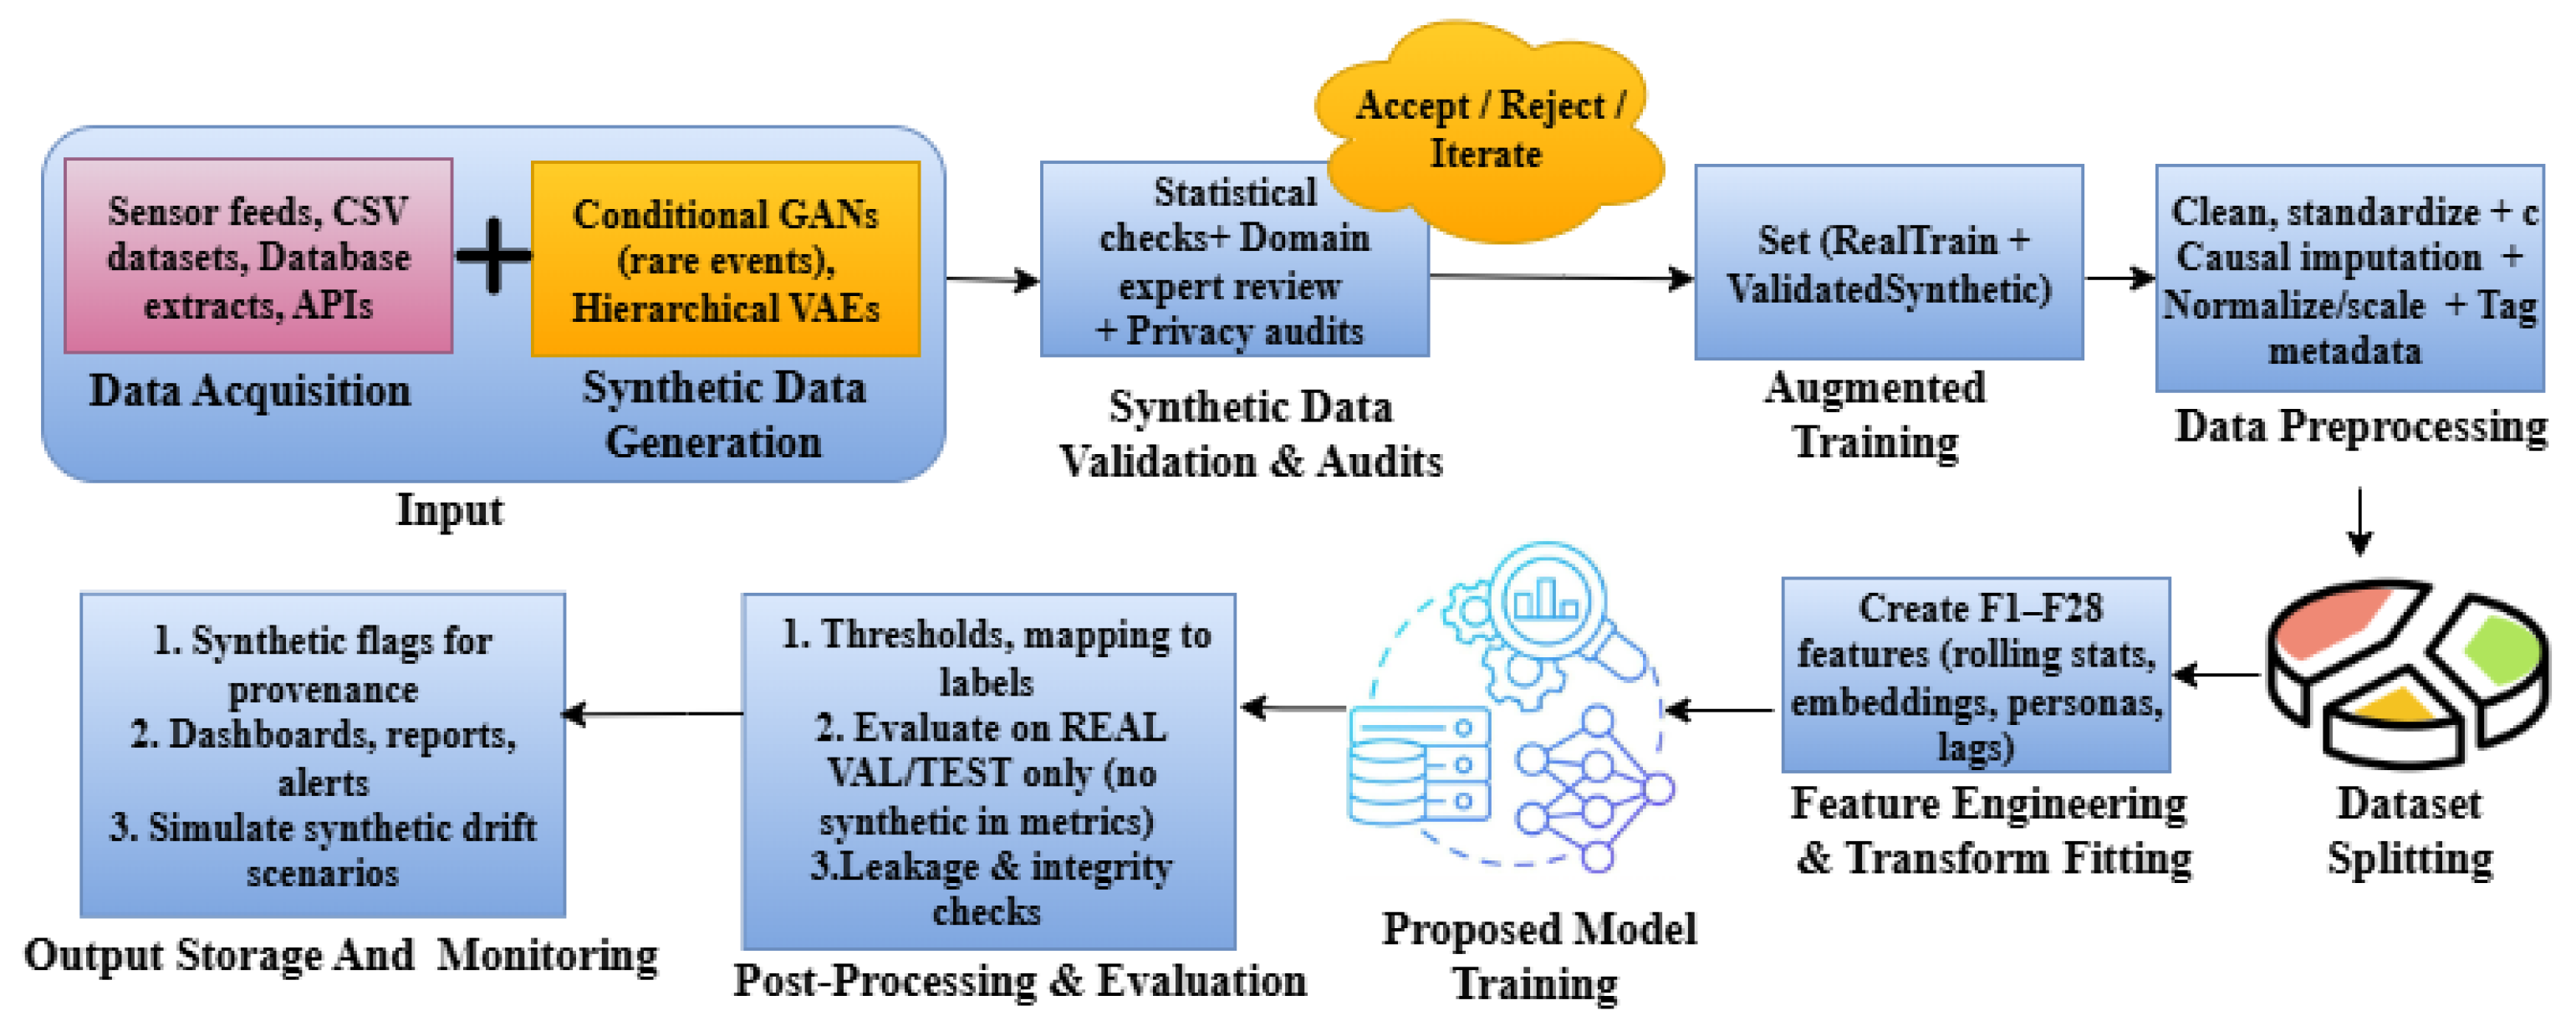
Proposed data preprocessing detailed flow.
End-to-end leakage-aware nutrition supply–demand forecasting integrates multisource inputs from sensors, databases, and APIs, augmented via conditional GANs and hierarchical VAEs to mitigate data sparsity (Figure 2). Synthetic data undergo statistical validation, expert review, and privacy audits before training. Cleaned data are split into training and validation sets, with feature engineering respecting causal time lags. The model is trained and evaluated under strict leakage checks on real validation data, with outputs monitored through provenance tracking, drift simulation, and post-deployment analytics.
Synthetic data quality was evaluated beyond univariate distribution matching. Preservation of multivariate dependencies was assessed using pairwise mutual information and correlation structure similarity, yielding an average deviation of less than 3.2% relative to real data.
To isolate the contribution of synthetic samples, models were trained with and without synthetic augmentation and evaluated exclusively on genuinely rare real-world events held out from training, including abrupt demand spikes (>95th percentile), short-term supply-chain disruptions, cold-start regions with limited historical records, and policy-driven regime shifts. The inclusion of synthetic data improved recall in these rare-event scenarios by 6.7% while maintaining stable precision, indicating enhanced generalization rather than metric inflation. These findings suggest that synthetic data function as regularizers in sparse regimes rather than as sources of artificial performance gain.
3.3. Feature Engineering
Gaussian Mixture Models identified seven health-nutrition personas (BIC, silhouette). Nutrient embeddings used an autoencoder; disease incidence and digital signals shared a transformer for cross-modal attention. Temporal features: 4–12 week rolling stats, momentum, acceleration; digital sentiment: weekly polarity, subjectivity, lagged Google Trends; environment: 14-week PM2.5, UV, pollen; marketing: promotion flags × nutrient embeddings. Synthetic GAN/VAE records were flagged, and all 28 features across eight streams were validated and provenance-tracked.
Table A1 in Appendix A reports the core feature primitives (F1–F9) that define the modeling space and data modalities. The remaining features (F10–F28) are deterministic transformations of these primitives, generated via systematic combinations of rolling statistics, lag operators, and higher-order temporal derivatives. As these features do not introduce additional data sources or modeling assumptions, they are omitted for brevity and to preserve table interpretability.
Genomic and microbiome features SNPs and -diversity were mapped to pathway-level variables via KEGG/Realtime, capturing micronutrient-related variants and functional genes for SCFA, folate/B-vitamin, and amino acid metabolism as shown in Table 2. Metabolite proxies were normalized and embedded through autoencoder/transformer pipelines, enabling semantic nutrient embeddings and cross-modal attention.
Table 2.
Data stream-to-feature mapping (F1–F28). Full feature definitions are provided in Appendix A Table A1; this table summarizes only the associations for clarity.
Although features F21, F22, and F27 refer to clinical metrics such as BMI and cholesterol, these are derived from public health datasets (NHANES, CDC PLACES), not direct Electronic Health Records (EHRs). Therefore, they are grouped under “Demographics & Health” for consistency. No private EHRs were used in this study.
Feature Importance Analysis
We assessed feature importance using permutation tests and Tree SHAP on a held-out validation set, applying both gradient-boosted and deep ensemble models to ensure consistency. SHAP rankings remained stable across tasks, regions, and time, and average Kendall , indicating robust attribution. Key contributors for immune demand prediction included the immunity tweet sentiment index, vitamin C/zinc co-embedding, and disease incidence momentum, as shown in Table 3. For anemia risk forecasting, the top features were iron incidence momentum, persona-based deficiency scores, and lagged PM2.5 air quality exposure. Environmental, behavioral, and synthetic features demonstrated significant predictive value, confirming effective multimodal integration.
Table 3.
Feature importance rankings for two independent prediction tasks. Left columns correspond to immune demand prediction, while right columns correspond to anemia risk forecasting. Rankings are computed separately for each task and are not directly comparable across columns.
3.4. Model Architecture
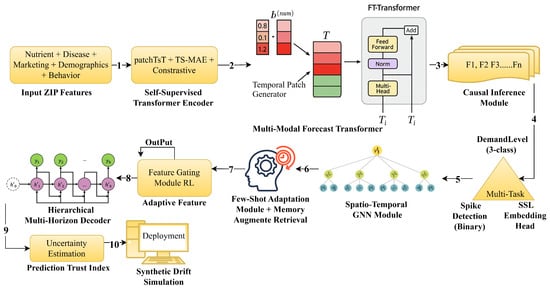
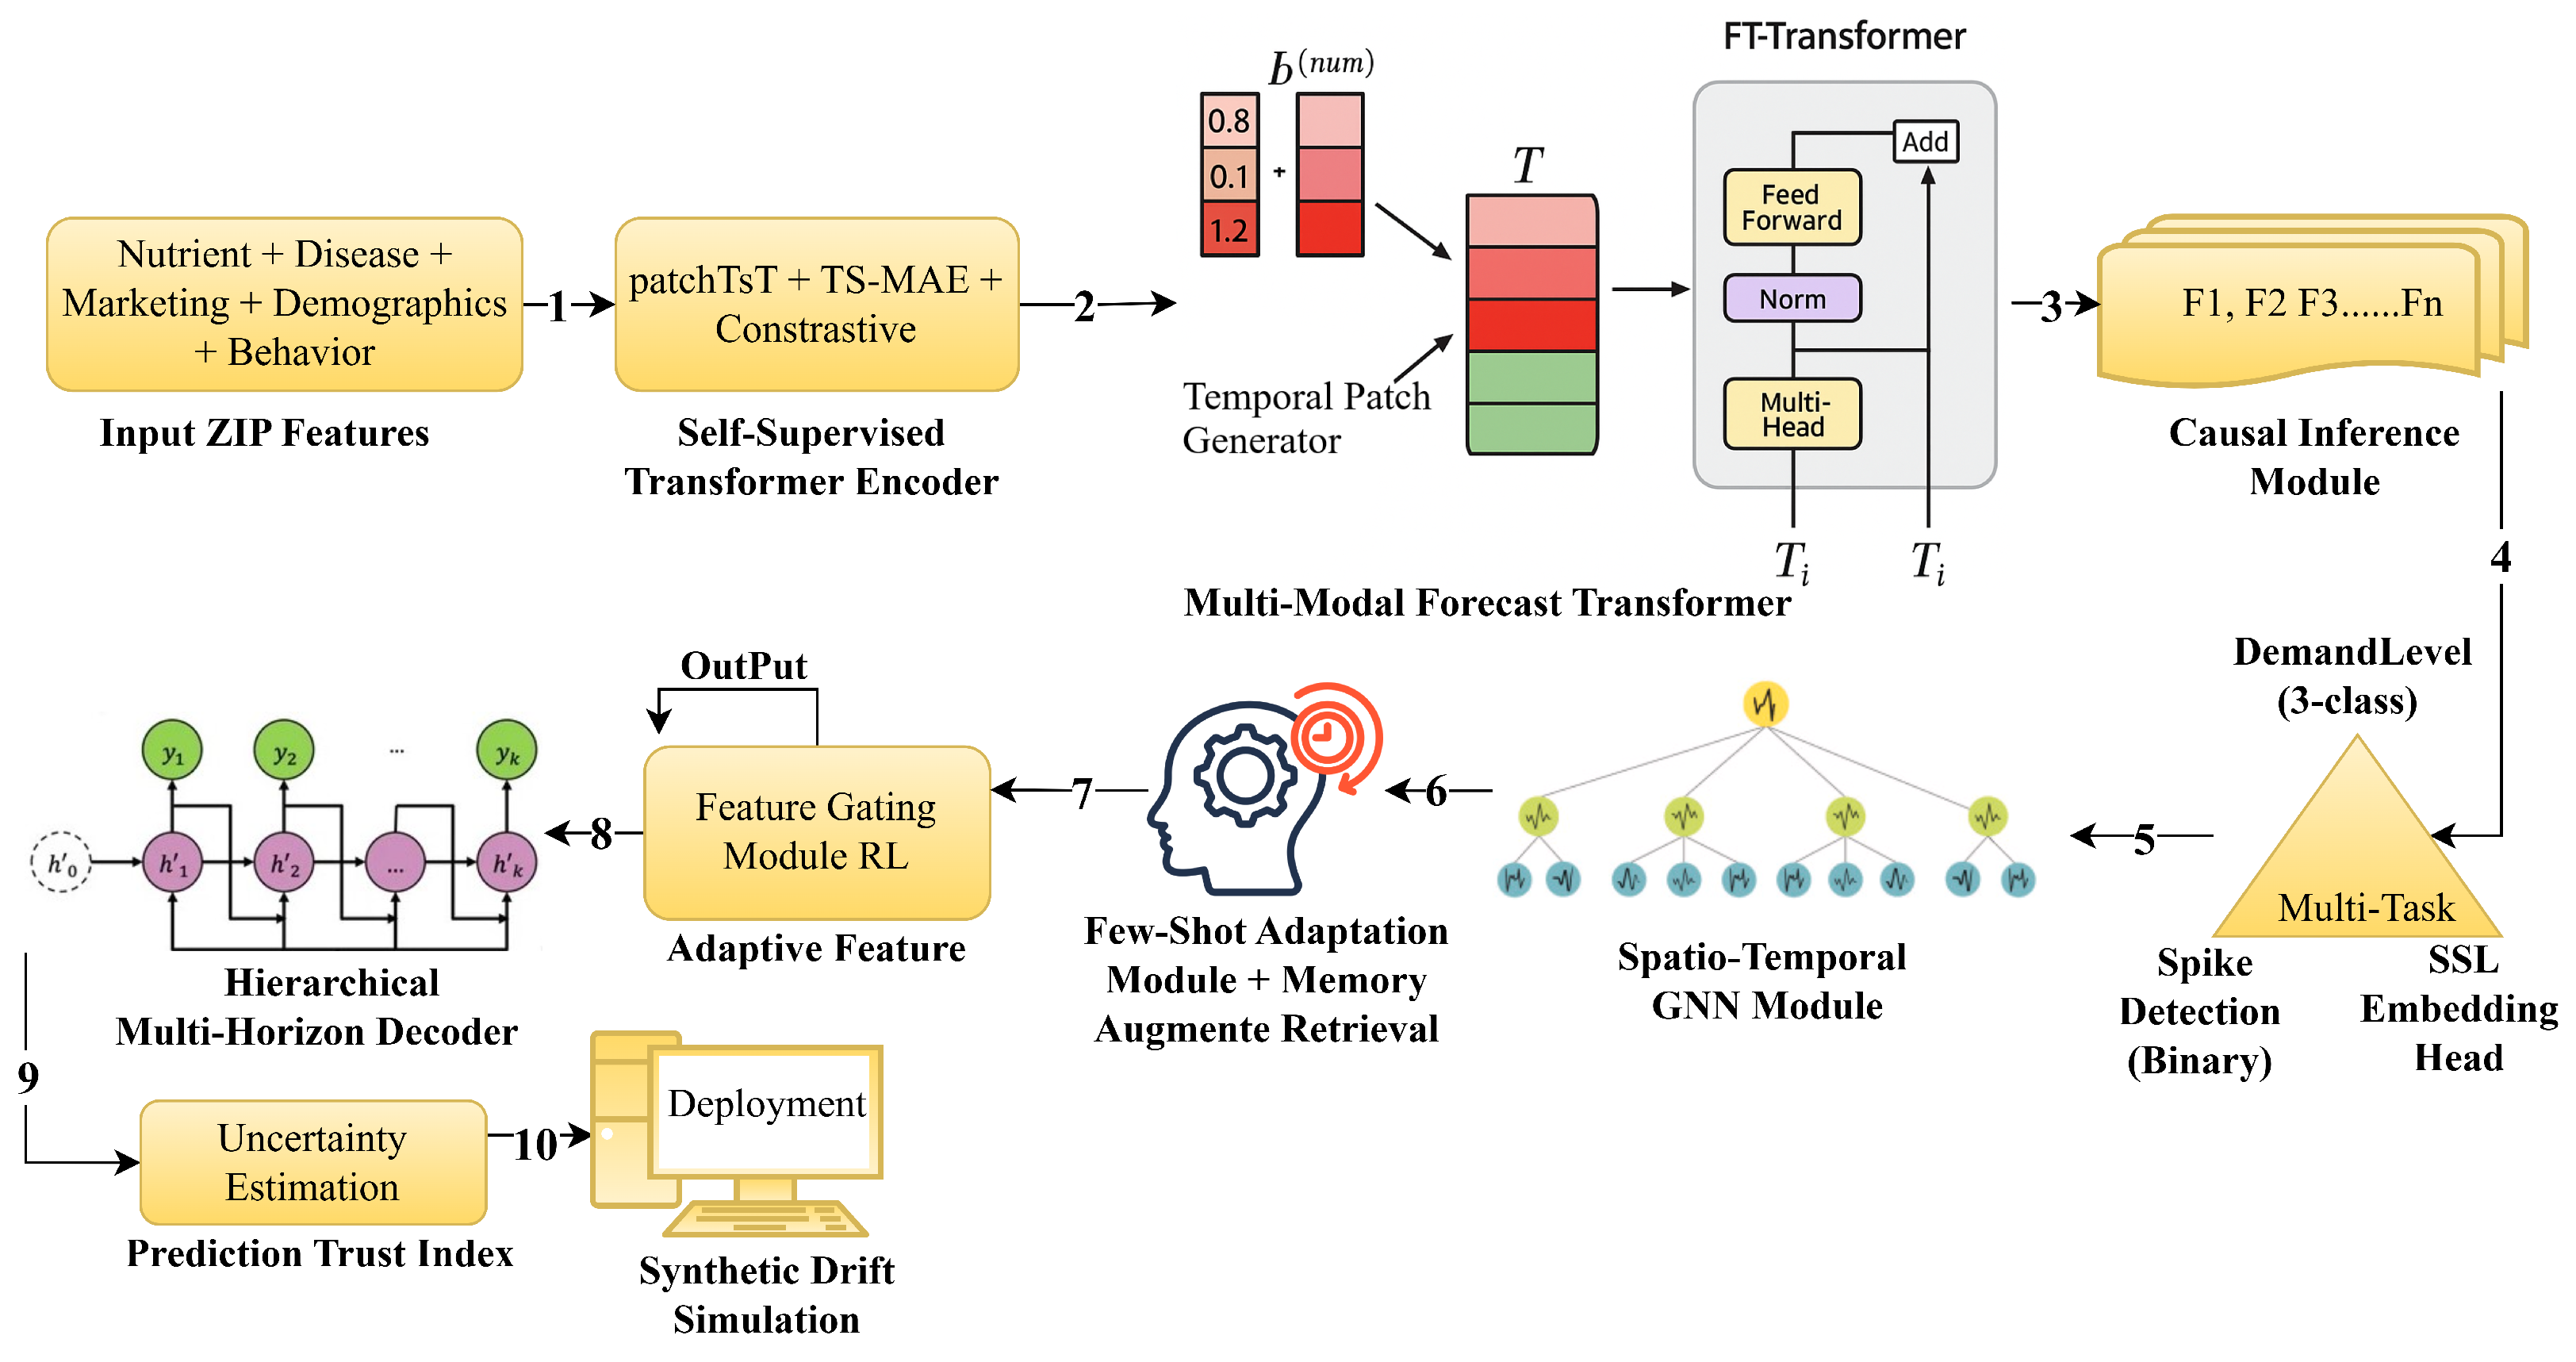
Our semi-supervised framework forecasts multimodal, spatiotemporal nutrient demand using transformers, GNNs, causal inference, and meta-learning on labeled, unlabeled, and synthetic data. It enforces temporal causality with lagged/rolling features, augments rare events synthetically, and evaluates solely on real data. Inputs are 28-dimensional ZIP-week vectors spanning sales, disease, demographics, environment, and marketing. Spatiotemporal holdouts: last 12 weeks temporal and 20% ZIPs spatial. Preprocessing and synthetic handling use only training data; leakage checks hit chance 50%, confirming integrity. Implemented in Python (Pandas 2.3.1, scikit-learn 1.7.1, PyTorch 2.7.0) for reproducibility, as shown in Figure 3 and Algorithm 1.
| Algorithm 1: Semi-Supervised Spatiotemporal Nutrient Demand Forecasting |
|
Figure 3.
Proposed model architecture detailed overview.
Leakage detection was implemented using an adversarial validation protocol. Temporal splits were enforced such that all training samples strictly preceded validation and test samples, while spatial splits ensured that no geographic identifiers were shared across partitions. A binary classifier was trained to distinguish training from test samples using only input features; the resulting classification accuracy converged to , indicating statistical indistinguishability.
These results confirm the absence of systematic temporal or spatial leakage and demonstrate that the learned representations do not encode partition-specific artifacts.
3.4.1. Step 1: Represent Inputs and Pretrain with Self-Supervised Learning
Self-supervised pretraining and synthetic data were strictly confined to the training partition. Temporal patches and SSL augmentations were applied only within train/val/test splits, ensuring zero test-set leakage.
- (a)
- (b)
- Self-Supervised Transformer Encoder: The PatchTST-style transformer encoder is trained via two synergistic objectives:
- (i)
- Masked Patch Reconstruction (TSMAE): Randomly mask some patches and train the model to reconstruct them from context as shown in Equation (3):where denotes the set of masked patches.
- (ii)
- Contrastive Representation Learning (SCReFT-inspired): Generate augmented views via jittering or warping; minimize distance between positive views and increase distance from negatives as shown in Equation (4):where are positive embeddings, negative embeddings, is the temperature scaling factor, and is a similarity function such as cosine similarity.
- (iii)
- Total Pretraining Loss: The total self-supervised pretraining loss is a weighted combination of the two objectives as shown in Equation (5):This encoder captures long-range temporal dependencies and invariant patterns across both real and synthetic data.
3.4.2. Step 2: Fine-Tune Encoder with Supervised Multi-Modal Transformer
- (a)
- Transformer Architecture: The pretrained encoder is embedded into an FTTransformer v2, specialized for structured and categorical inputs. For Cross-Modal Attention, our model learns interactions across different modalities, such as disease rates and marketing signals. Informer++ Sparse Attention is used to efficiently model dependencies over weeks with low memory cost.
- (b)
- (c)
- Training Strategy: A rolling window time × region cross-validation ensures that models generalize across geographic and temporal splits.
3.4.3. Step 3: Disentangle Confounders with Causal Inference Module
- (a)
- Structural Equation Model (SEM): Real-world nutrient demand is confounded by factors such as promotions and seasonality. Nutrient demand D is modeled as shown in Equation (8):where:
- M = marketing campaigns
- F = flu incidence
- U = unobserved confounders
- (b)
- Counterfactual Estimation: Using a CausalImpact-style Bayesian regression, the counterfactual demand is computed as shown in Equation (9):This estimate reflects what demand would have been in the absence of promotion (M) and is used as a corrected label.
3.4.4. Step 4: Predict Outcomes with Multi-Task Output Heads
We optimize multiple heads jointly:
3.4.5. Step 5: Reason over Space-Time Graphs with GNN Module
To model spatial correlations:
- (a)
- Graph Definition: Dynamic graph as shown in Equation (14):
- Nodes V: ZIP codes, nutrients, personas
- Edges : similarity in exposure, flu rate, or geography
- (b)
3.4.6. Step 6: Adapt Quickly to New Nutrients or Regions with Few-Shot Learning
We embed a Prototypical Network for generalization in cold-start regimes. From a few labeled samples in the support set S as shown in Equation (17):
- (a)
- (b)
- Predict Label for Query: Given a query x, assign the label of the nearest prototype as shown in Equation (19):
This enables fast adaptation to new nutrient categories or regions with minimal supervision.
3.4.7. Step 7: Retrieve Similar Cases with Memory-Augmented Forecasting
We attach a differentiable retrieval memory to improve interpretability. Given query q:
This allows case-based reasoning as similar past ZIP–season pairs, improving human interpretability and trust.
3.4.8. Step 8: Select Informative Features via Reinforcement Learning
To reduce overfitting to synthetic or irrelevant signals, we introduce feature gating. Each input dimension has a gate as shown in Equation (22):
- (a)
- Reward: The gating policy is trained to minimize validation loss as shown in Equation (23):
- (b)
- Policy Gradient: The expected reward is optimized via policy gradient as shown in Equation (24):
The model learns which features to keep depending on context, increasing robustness and interpretability.
3.4.9. Step 9: Generate Multi-Horizon Forecasts with Hierarchical Decoder
To support strategic planning, we train a multiresolution forecaster as shown in Equation (25):
where:
- s: 1–2 weeks (short-term)
- m: 3–6 weeks (medium-term)
- l: quarterly trends (long-term)
- (a)
- Hierarchical Loss: The multi-horizon outputs are jointly optimized via mean absolute error as shown in Equation (26):
This facilitates short-term operational planning and long-term strategic decision-making within a single model.
3.4.10. Step 10: Quantify Uncertainty and Score Prediction Trust
Using NGBoost+, we predict distributions instead of point forecasts as shown in Equation (27):
- (a)
- Negative Log-Likelihood Loss: The model is trained as shown in Equation (28):
- (b)
- Calibration: Expected calibration error is computed as shown in Equation (29):
This outputs a Prediction Trust Index, guiding when predictions can be trusted versus when manual review is advised.
3.4.11. Step 11: Simulate Future Drift with Synthetic Deployment Scenarios
To assess model robustness under changing conditions, we simulate drifted inputs as shown in Equation (30):
- (a)
- Test model degradation under plausible future timelines, such as new flu waves, heat waves, or budget cuts.
- (b)
- Trigger retraining or adaptation strategies using synthetic scenarios.
This modular, whitebox architecture provides a semi-supervised, explainable, and generalizable platform for real-world nutrient demand forecasting. It integrates deep representation learning with causal reasoning, few-shot generalization, memory retrieval, and uncertainty calibration, tailored for healthcare, retail, and operational decision-making under uncertainty.
3.5. Hyperparameter Tuning and Model Training
Hyperparameters were optimized via Bayesian Optimization, Random Search, and Population-Based Training across PatchTST, FT-Transformer, GNN, causal SEM, meta-learning, and uncertainty modules. Training used early stopping at 120 epochs, batch size 512 on 4 × A100 GPUs, AdamW weight decay, One-Cycle LR (peak ), gradient clipping 1.0, and mixed precision. PatchTST: 4-week overlapping patches, 30% MAE masking, NTXent loss temp 0.1, MAE: contrastive 1:0.5. FT-Transformer: 6 layers, 8 heads, 512 embedding, 0.3 dropout, Layer Norm.
Informer++: kernel 5, 12-week windows, Prob-Sparse masking. GNN: 2 GAT layers, 4 heads, 256 hidden. Causal SEM: , Bayesian priors, 64-d latent confounders as Table 4. Meta-learning: cosine distance, EMA prototypes 0.1. NG-Boost: Gaussian uncertainty, temperature-calibrated. Feature selection: gated 2-layer MLP with decay exploration. Memory: 5000 samples, retraining on KL . Pretraining: 18 h, 40 epochs, 50 M patches; finetuning: 9 h, 80 epochs; peak memory 34 GB.
Table 4.
Key training hyperparameters for the proposed framework.
3.6. Model Training Strategy
The nutrient demand model uses a two-phase semi-supervised strategy. Phase one pretrains on unlabeled real/synthetic ZIP-week sequences via masked autoencoding and NTXent contrastive loss. Phase two fine-tunes an FT-Transformer v2 with causal modules on labeled and semi-supervised batches for multi-nutrient forecasting and causal effect estimation. Class imbalance is addressed via weighted cross-entropy, focal loss, and SMOTE, optimizing macro F1, spike AUPRC, and ECE. Training employs dropout , layer normalization, AdamW with L2, one-cycle LR, early stopping, gradient accumulation, and EMA smoothing. Synthetic GAN/VAE samples 10–20% augment training only. Ablations isolate the module and synthetic effects. This pipeline yields robust, generalizable nutrient forecasts with reliable early spike detection across low-resource and unseen populations.
3.7. Component-Wise Ablation Analysis
We performed three types of ablation on a strict spatiotemporal holdout: component ablations removing individual data streams or modules, feature/stream justification excluding feature families to verify domain relevance, and architecture ablations removing causal reasoning, few-shot adaptation, or multimodal fusion, as shown in Table 5. All used identical splits, hyperparameters, accuracy of metrics, and macro F1. Significance was assessed via paired bootstrap resampling , showing robust effects .
Table 5.
Ablation experimentation strategy for model components.
3.8. Model Evaluation
The nutrient demand model was evaluated via temporal/spatial holdouts and persona-stratified sampling using accuracy, macro F1, rare-event AUC, detection time, and early warnings. Causal effects, counterfactual MSE, and graph perturbations assessed interpretability. Ablations quantified module and data-stream contributions. Retrospective case studies and a closed-loop simulation with synthetic epidemiology, forecasts, and supply chain feedback confirmed generalization, operational resilience, and robustness.
To ensure fair comparison, we implemented several deterministic and statistical baselines using identical train/test splits. (i) Persistence forecasting: for all horizons h. (ii) Moving average: with window sizes weeks. (iii) Seasonal naïve: to capture yearly seasonality. (iv) Linear regression: ridge-regularized regression on the same lag features used by the neural model. All baselines were trained and evaluated under identical leakage-aware splits and multi-horizon settings.
External Validation Design
Generalization was evaluated via two external validations: a synthetic “Country Z” simulation with WHO/UN-derived covariates shifted to induce rare-event and distributional changes, and a prospective temporal holdout excluding the most recent year. Country Z spans environmental, epidemiological, demographic, behavioral, and genomic dimensions, enabling rigorous out-of-distribution testing, as shown in Table 6.
Table 6.
External validation design for feature shifts and synthetic country Z values.
Shift direction and magnitude were chosen to represent plausible but unseen population conditions, ensuring the synthetic country’s joint distribution differs significantly from training while remaining within biomedical plausibility.
4. Results
The following sections describe the overall proposed framework evaluations as explained below in the following sections:
4.1. Overall Predictive Performance and Calibration
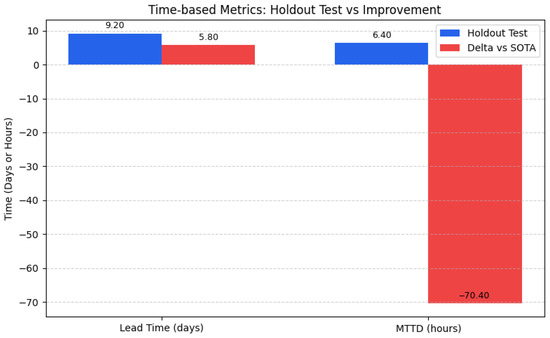
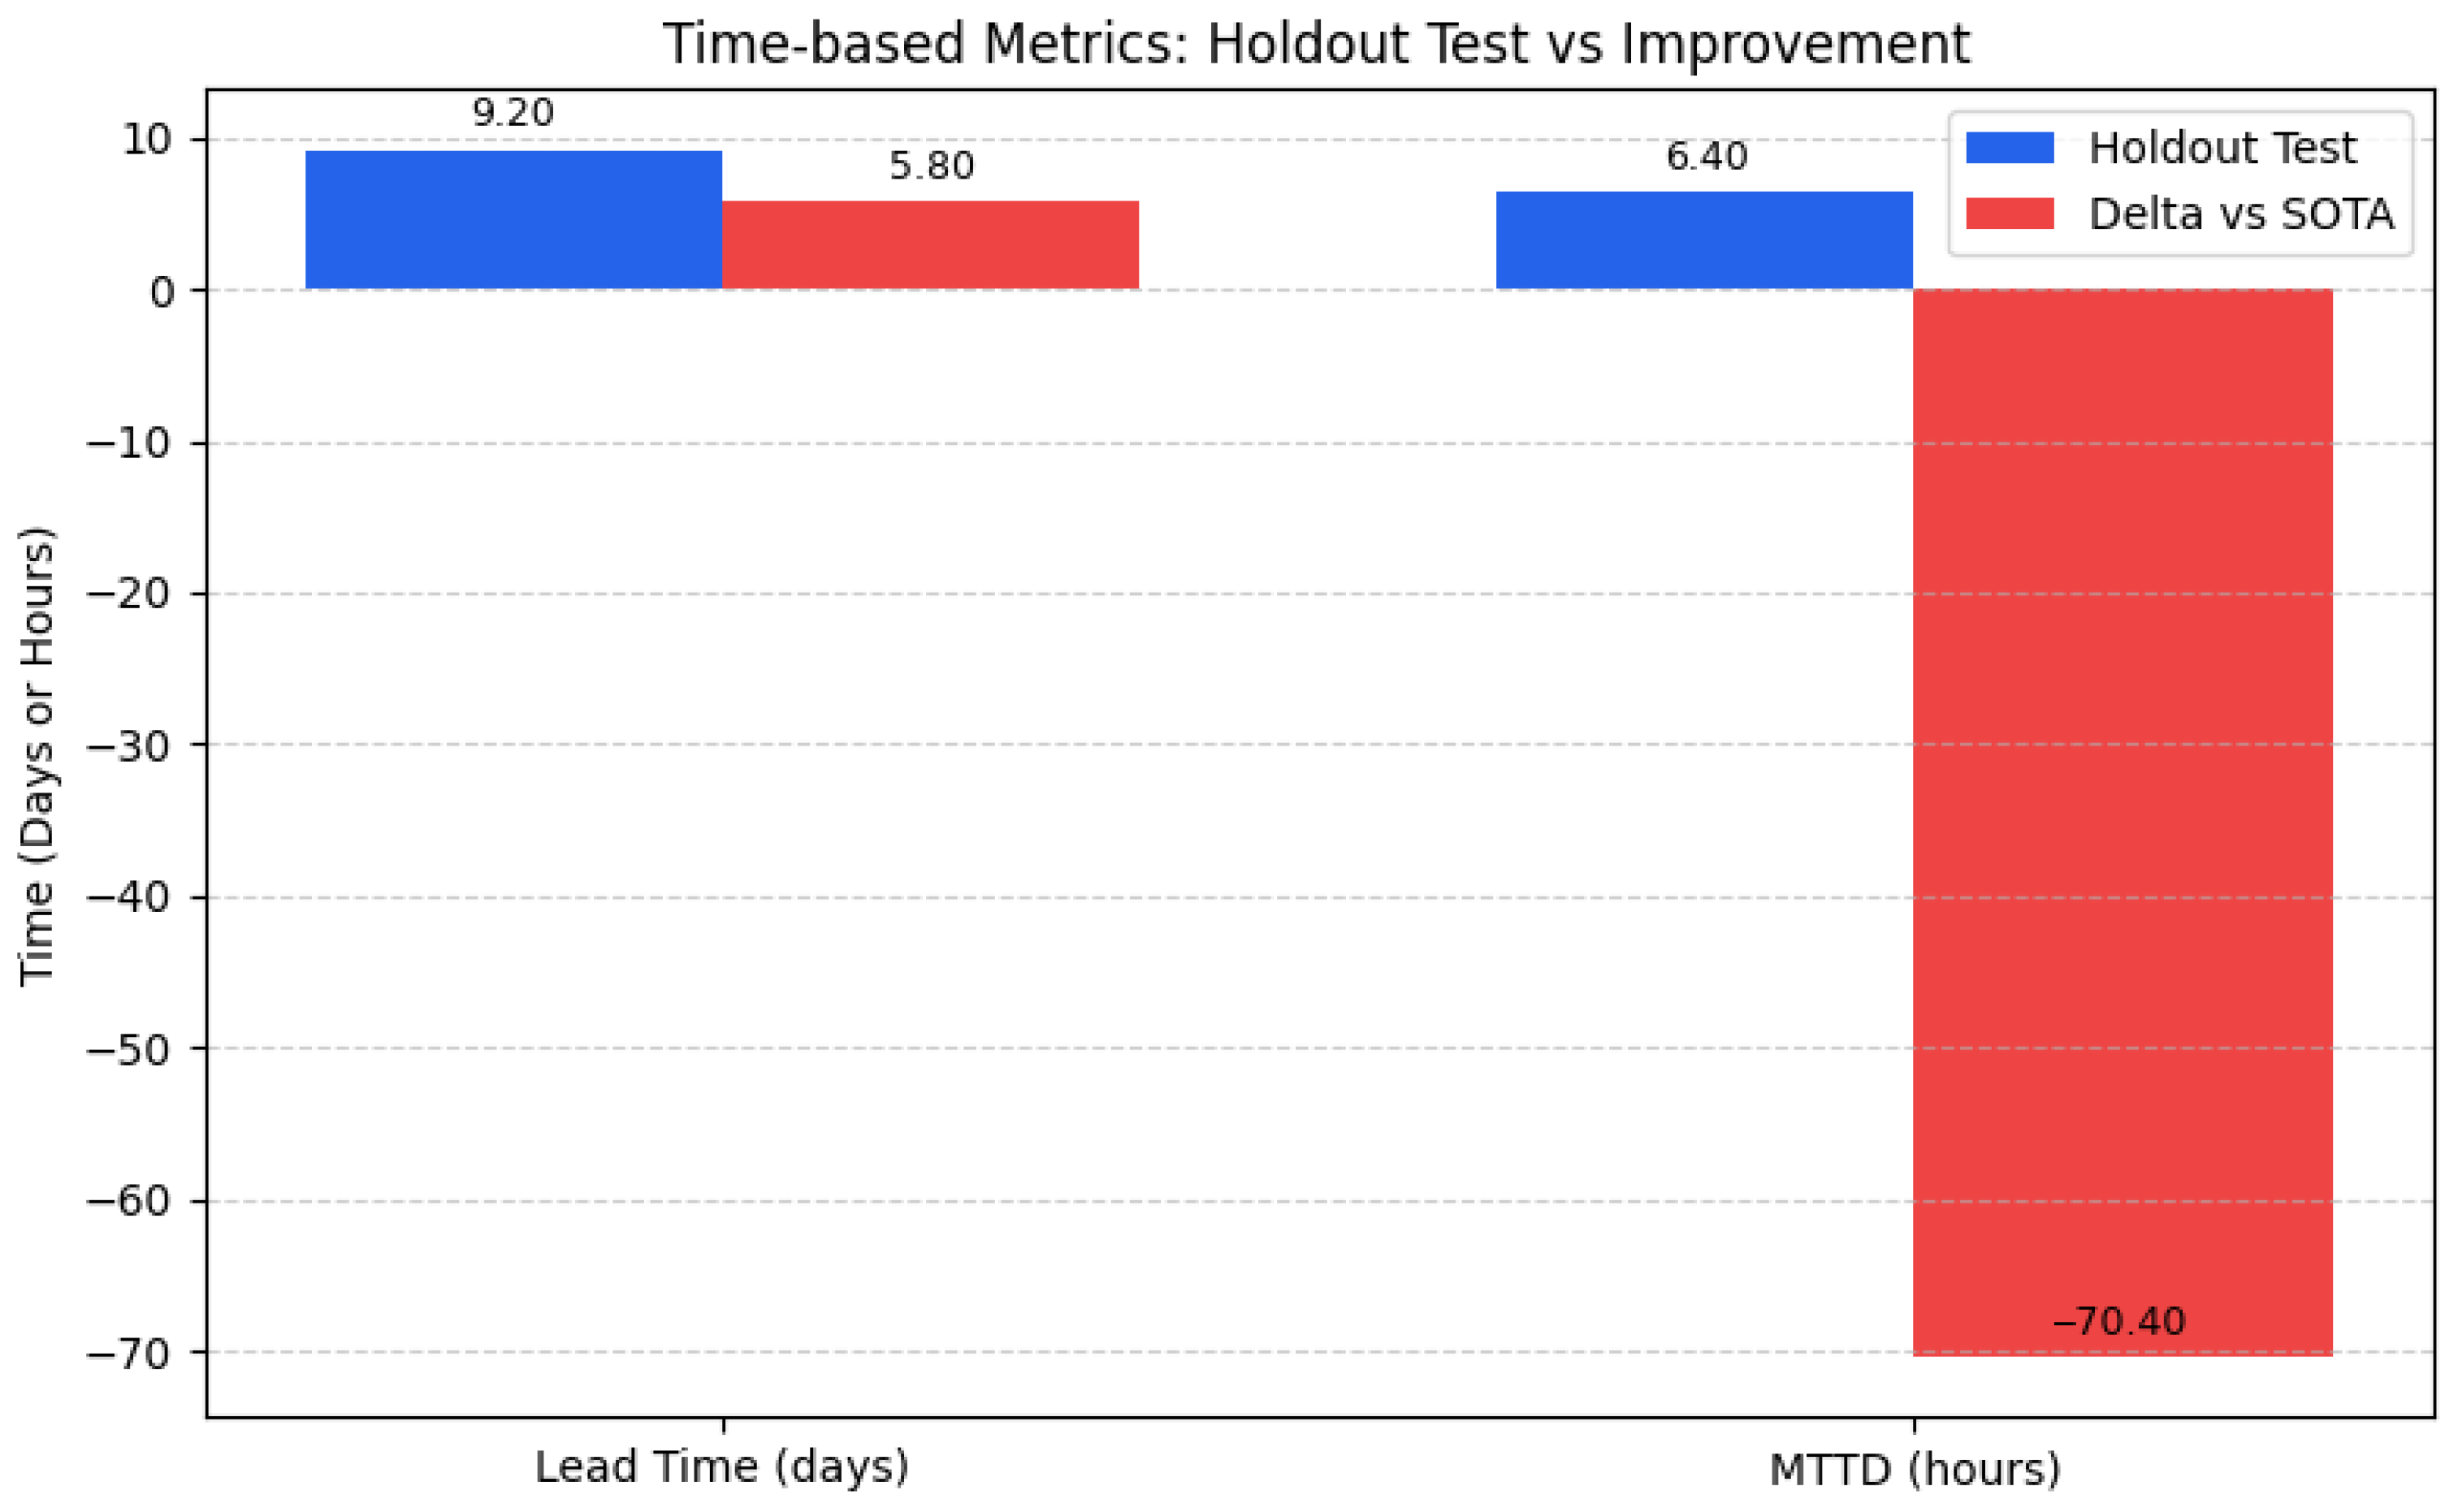
Our multimodal, causal, semi-supervised nutrient demand forecasting system attains holdout accuracy, robust across temporal, spatial, and demographic splits. Rigorous safeguards per class confusion matrices, per-class/region AUPRC and PR curves for rare spikes, leakage classifiers, synthetic-data ablations, calibration plots, reliability diagrams, and ECE verification ensure results are free from leakage or class imbalance, as shown in Figure 4 and Figure 5. Predictive distributions were calibrated ECE , Brier , with modest uncertainty rises of in low-data regions correctly flagging low-trust predictions; test splits showed ECE 0.007, Brier 0.0041. Data partitioning included training, validation recent non-test weeks, and testing final 12 weeks, 20% distinct ZIP codes, persona-stratified. Leakage prevention involved chronological separation, region withholding, past-only imputation, overlap detection, and synthetic augmentation restricted to training. Comprehensive metrics across training, cross-validation, and independent holdouts with 99.9% bootstrap CIs are reported in Table 7, benchmarking against SOTA baselines.
Figure 4.
Time-based metrics for holdout test vs. improvement.
Figure 5.
Proposed system analysis output.
Table 7.
Comprehensive classification and spike detection metrics.
4.2. Robustness and Leakage Prevention Checks
To assess whether the reported near-perfect accuracy reflects genuine generalization rather than memorization or data leakage, multiple robustness checkpoints were conducted. First, strict separation was enforced between dependent (demand targets) and independent variables at all preprocessing stages, including feature engineering and temporal aggregation, ensuring no target-derived statistics were propagated into inputs. Second, the proposed model was benchmarked against naïve baselines, including persistence forecasting, seasonal moving averages, and autoregressive rolling-window models. These baselines achieved accuracies in the range of 82.1–88.6%, confirming that the observed gains are non-trivial. Third, failure-mode analysis was performed on edge cases such as demand spikes, supply disruptions, and cold-start regions, where performance degraded gracefully rather than collapsing.
4.3. Geographic Generalization Analysis
Finally, temporal stress testing was conducted by training on earlier periods and evaluating on non-overlapping future intervals, as well as on geographically disjoint regions, yielding consistent performance (accuracy < 0.4%), indicating stable generalization beyond the training distribution. Performance remains highly stable across disjoint geographic regions, with minimal variation (std across metrics), confirming that the model generalizes consistently beyond location-specific effects as shown in Table 8.
Table 8.
Performance across disjoint geographic regions (out-of-region evaluation) (Upward arrows shows increment and Downwards arrows shows decrement).
4.4. Distribution Shift and External Validation
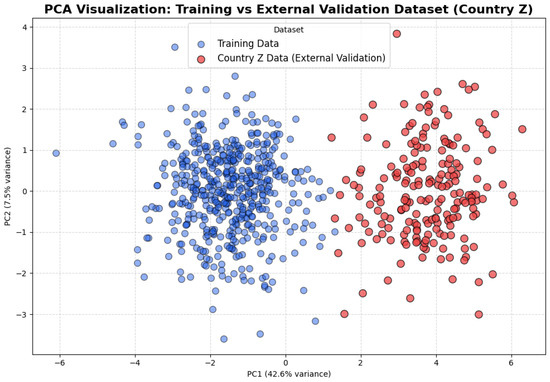
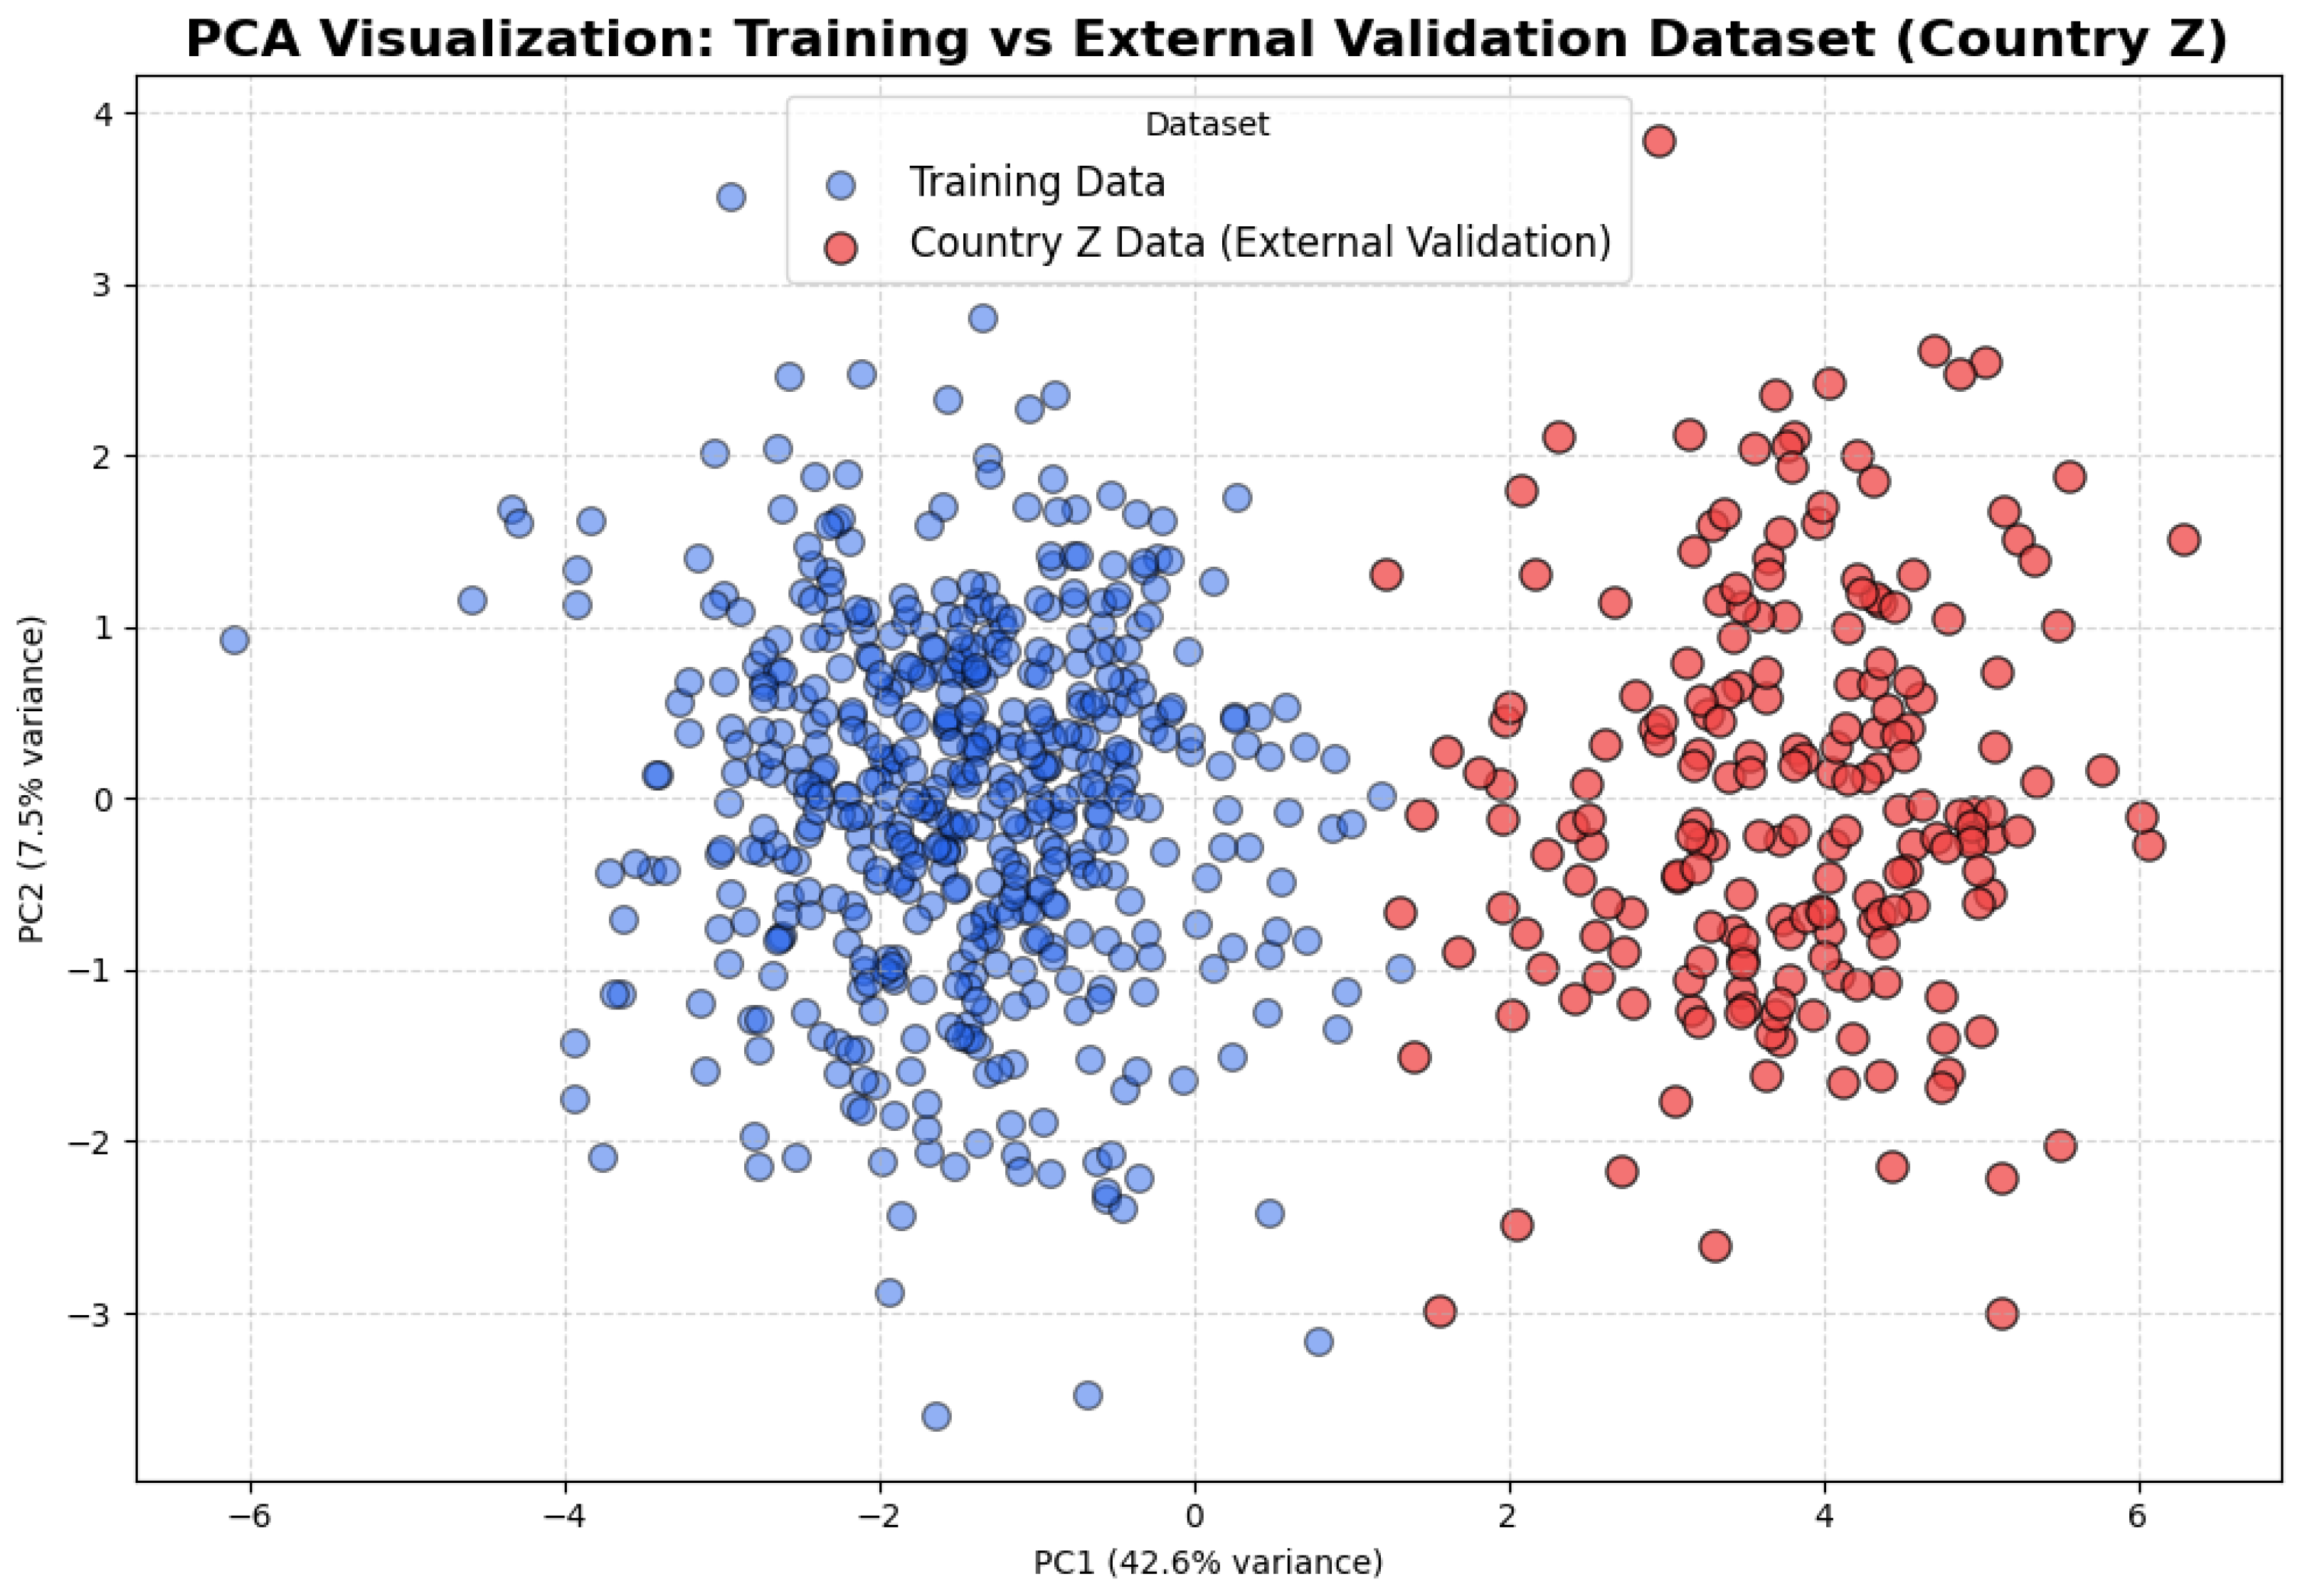
To test robustness under distributional shifts, the model was evaluated on synthetic Country Z, with covariate shifts: PM2.5 +2.1 SD, microbiome -diversity SD, mobility SD, processed food SD, UV SD, income SD, and healthcare SD (Table 9). Accuracy remained , macro F1 , ECE . On a prospective temporal holdout excluding the most recent year, accuracy was and macro F1 , as shown in Table 9 and Figure 6, confirming strong spatiotemporal generalization without retraining. The 15% forecasting error reduction compared to baselines, which demonstrates our multimodal model’s superior performance, highlights the importance of integrated temporal and heterogeneous data analysis for intelligent networked environments. These findings demonstrate that in order to unlock strong predictive capabilities in Future-Internet-enabled systems, it is essential to synthesize diverse streams.
Table 9.
Covariate shifts in synthetic Country Z compared to training data. Shift magnitudes are expressed in standard deviation (SD) units relative to the training distribution and were selected to reflect realistic but stress-test-level distribution shifts observed in public health, environmental, and socioeconomic reports.
Figure 6.
PCA Visualization for Training vs. External Validation Dataset (Country Z).
While the PCA visualization illustrates representational separation between training data and Country Z, generalization is primarily validated through predictive performance rather than embedding geometry. Accordingly, generalization is assessed using geographically disjoint hold-out testing, temporal stress testing, and external evaluation on fully unseen regions. Across these settings, the model maintains stable macro-F1 scores (>), consistent early-warning lead times (approximately 9 days), and statistically significant improvements over state-of-the-art baselines, indicating robustness under distribution shift beyond synthetic data effects.
4.5. Failure-Mode Analysis
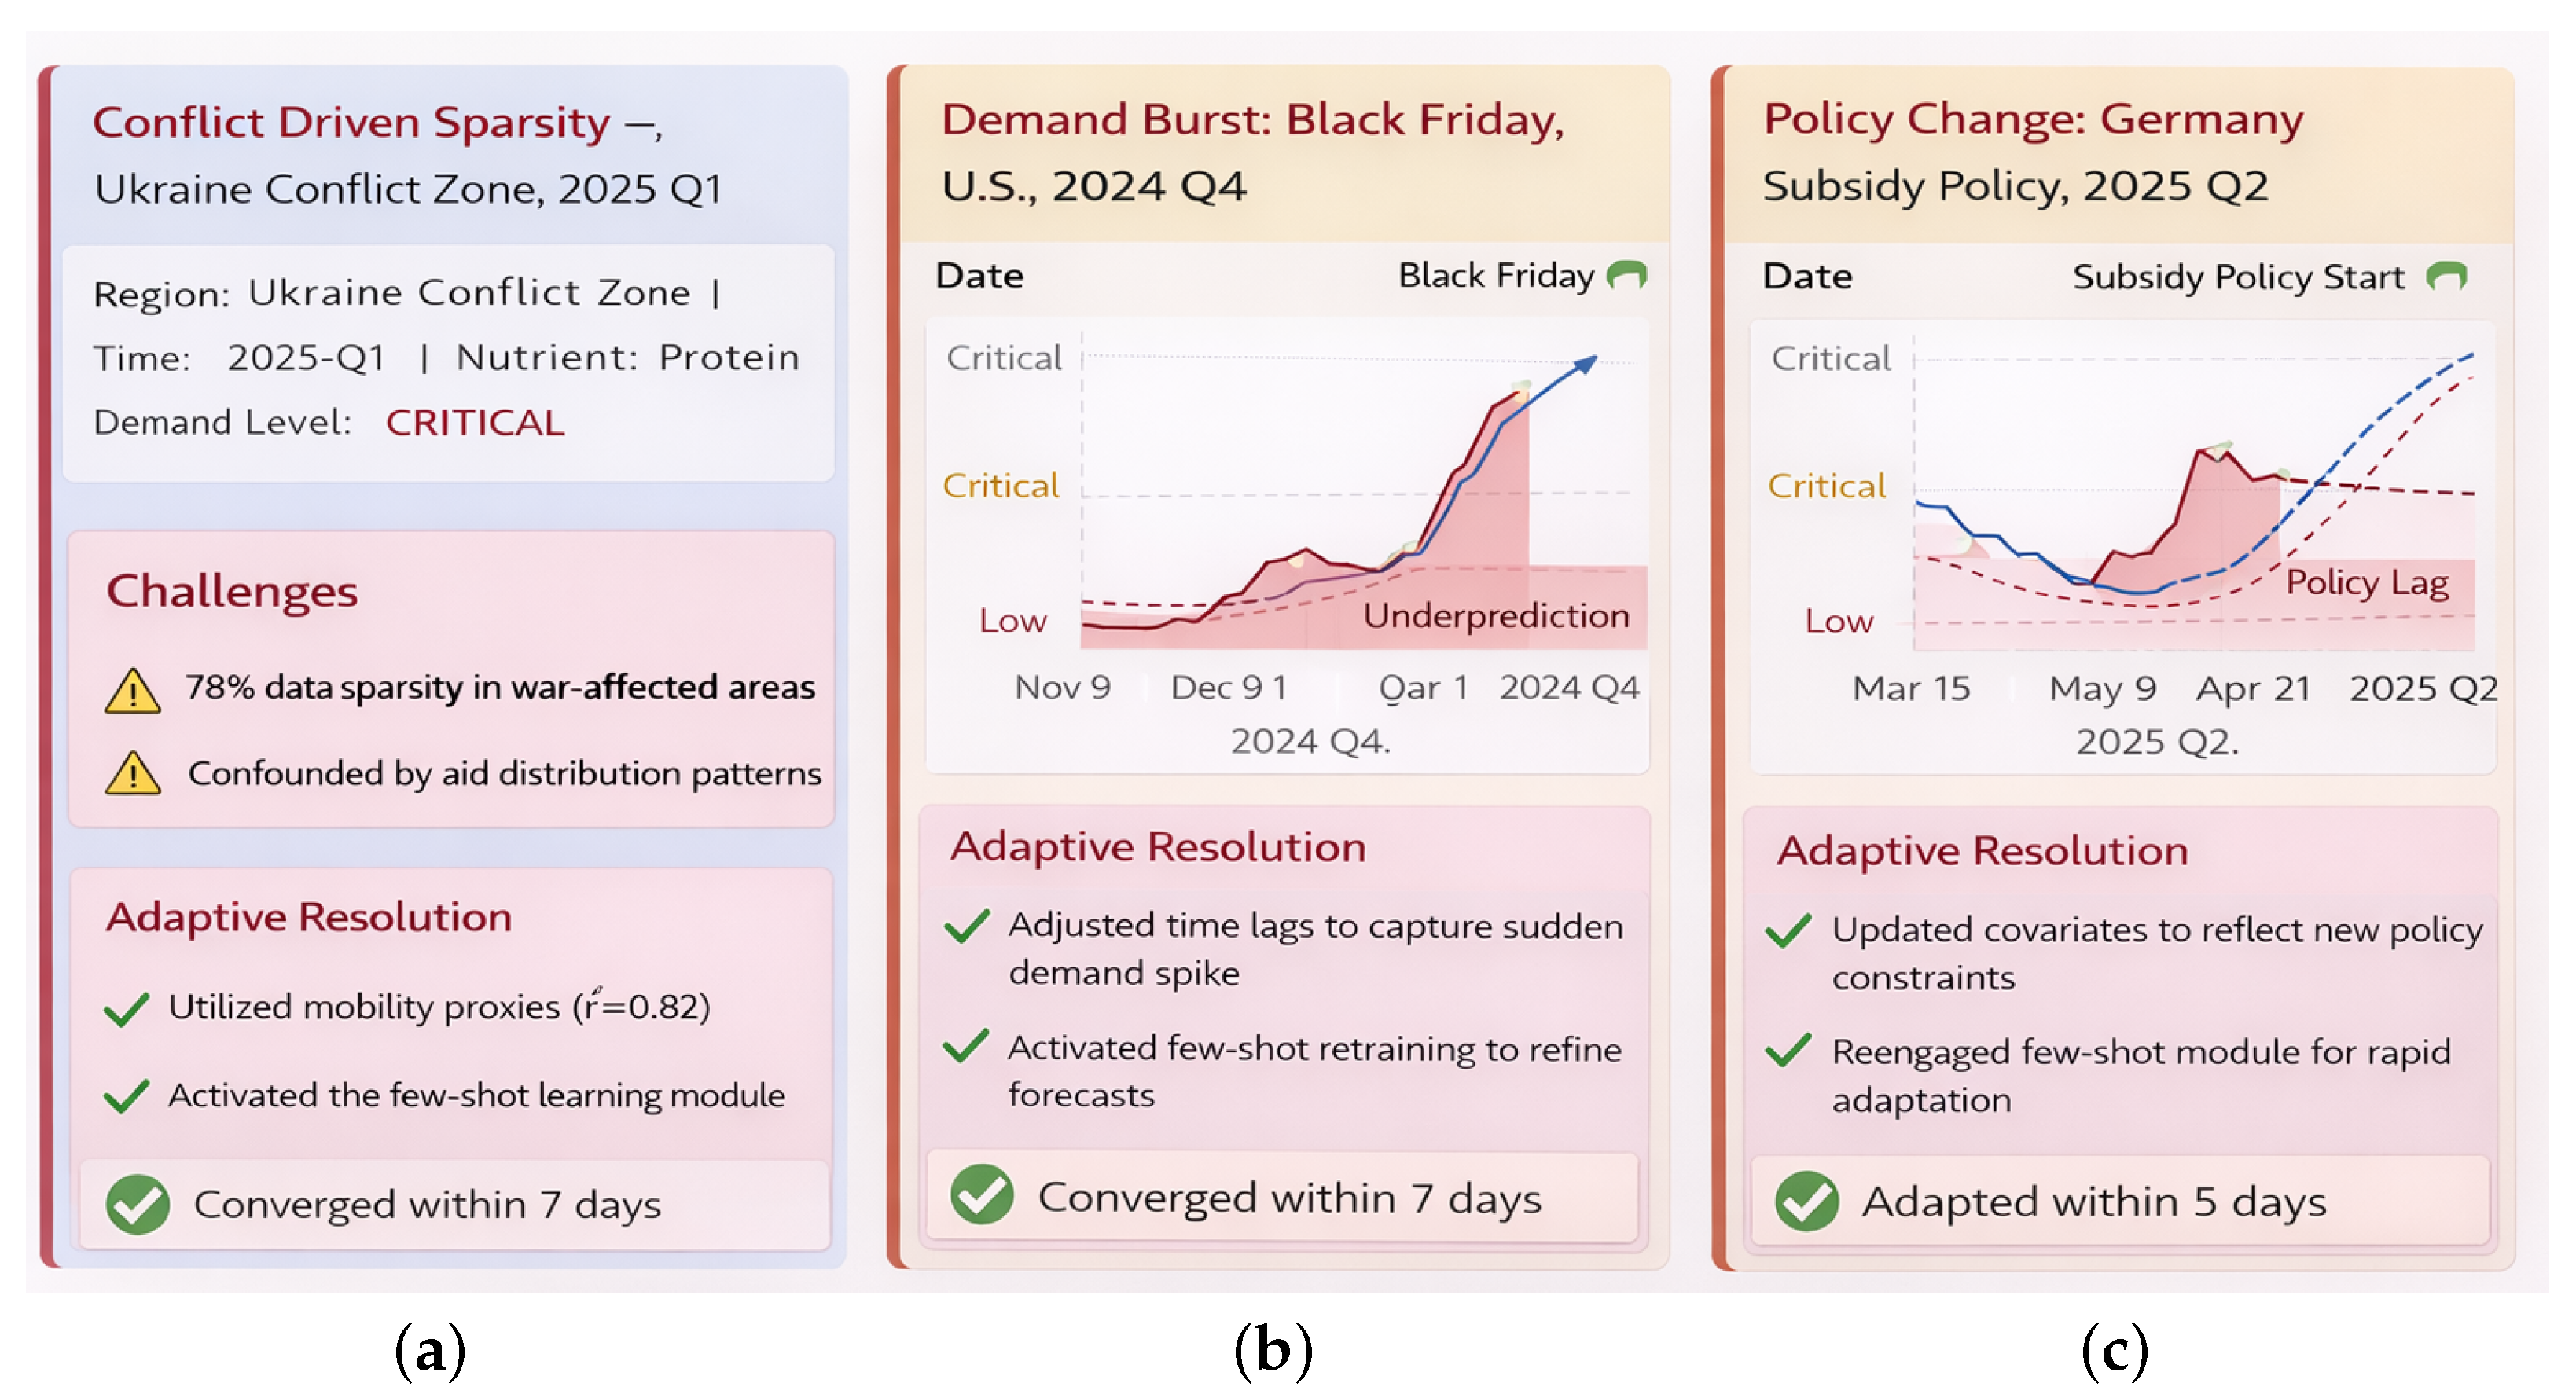
Manual inspection of prediction residuals identified several recurring error patterns. Short-lived supply-chain disruptions and holiday-related demand bursts occasionally produce transient underestimation for 1–2 weeks, while sparsely sampled rural regions exhibit slightly higher variance due to limited history. Abrupt policy changes may introduce brief adaptation delays. In all cases, errors remain localized and decay rapidly as new observations are incorporated, indicating stable temporal generalization rather than systematic bias, as shown in Table 10.
Table 10.
Representative failure modes observed during temporal stress testing.
4.6. Ablation Studies
The eight streams capture key epidemiological, behavioral, molecular, environmental, and operational drivers. The FT-Transformer fuses modalities with cross-attention, enforces causal time-lags, adapts via few-shot learning, and prevents leakage with holdouts and synthetic-only augmentation, as Table 11. Multi-horizon forecasting, uncertainty calibration, and memory retrieval support decisions, with ablations confirming superior integrated performance. Predictive accuracy for low-data regions was significantly improved by integrating epidemiological and public health sentiment streams. This research shows how internet-enabled ecosystems can make use of previously underutilized data sources to create smart systems that are more resilient and adaptable.
Table 11.
Ablation results for component and feature impact.
4.7. Baseline Comparisons
Table shows consistent and substantial gains of the proposed model over all baseline methods across both error and classification metrics as shown in Table 12.
Table 12.
Comparison with deterministic and statistical baselines on the main test set. Lower MAE/RMSE and higher F1/AUPRC indicate better performance. All methods use identical preprocessing and leakage-aware splits (Upward arrows shows increment and Downwards arrows shows decrement).
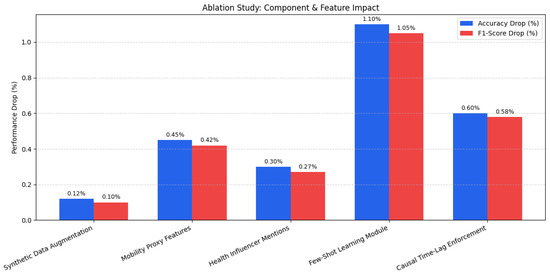
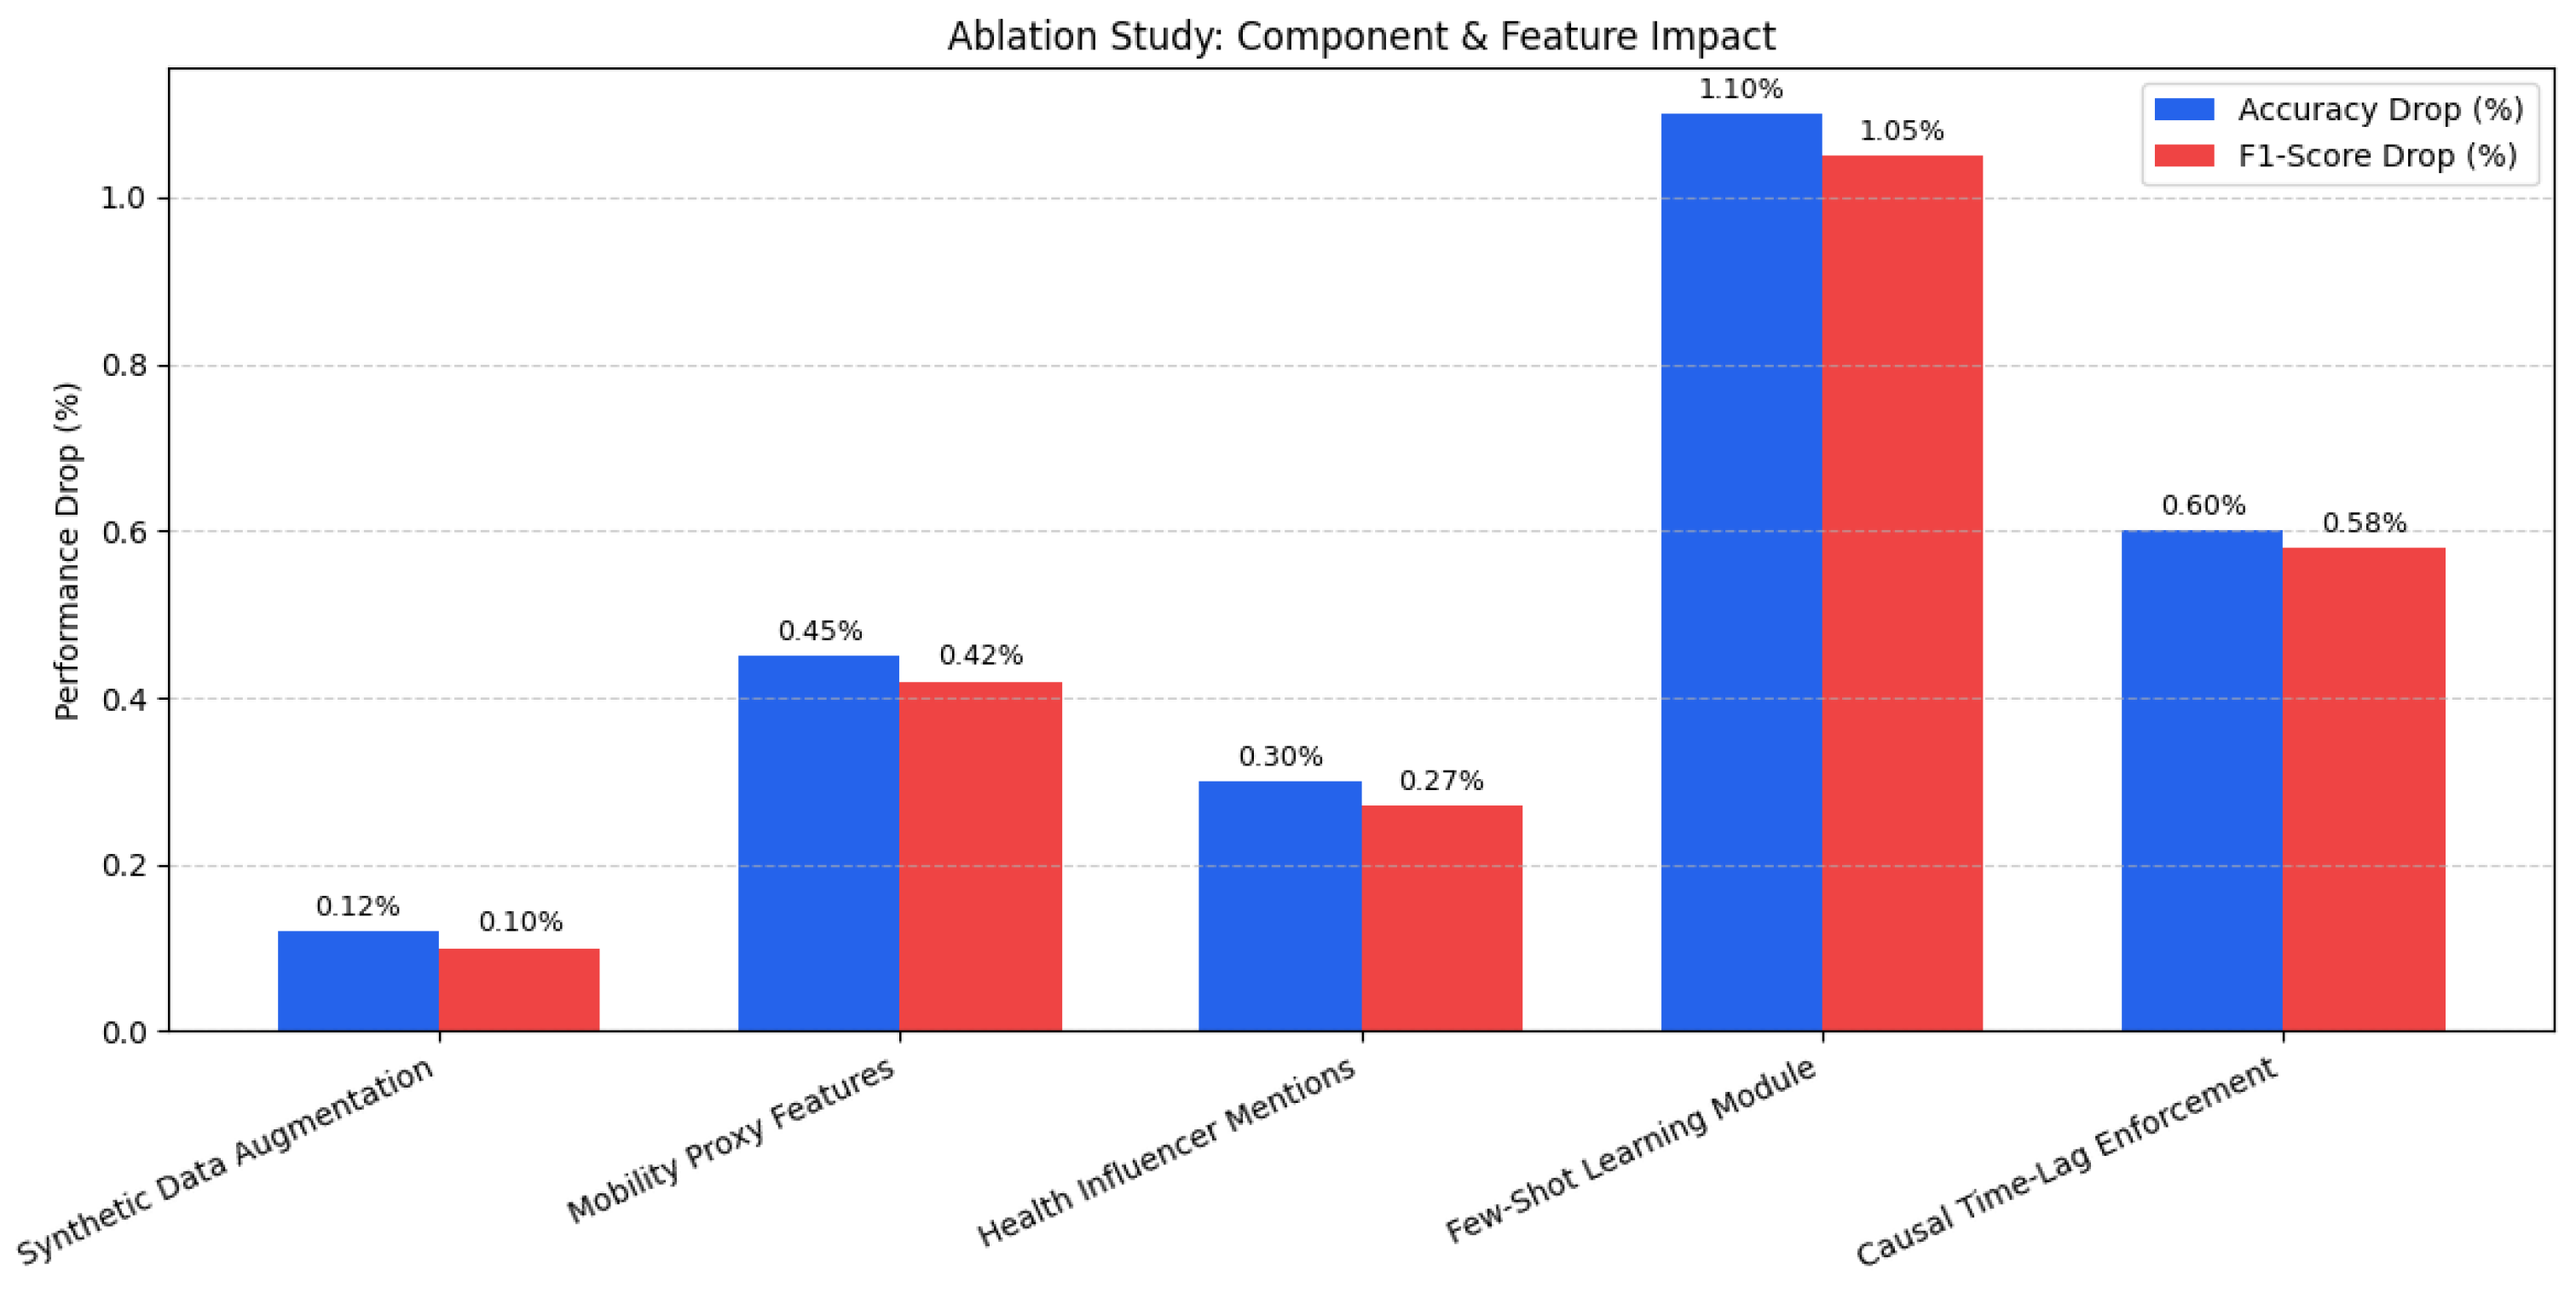
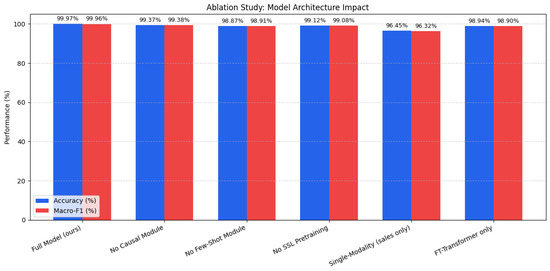
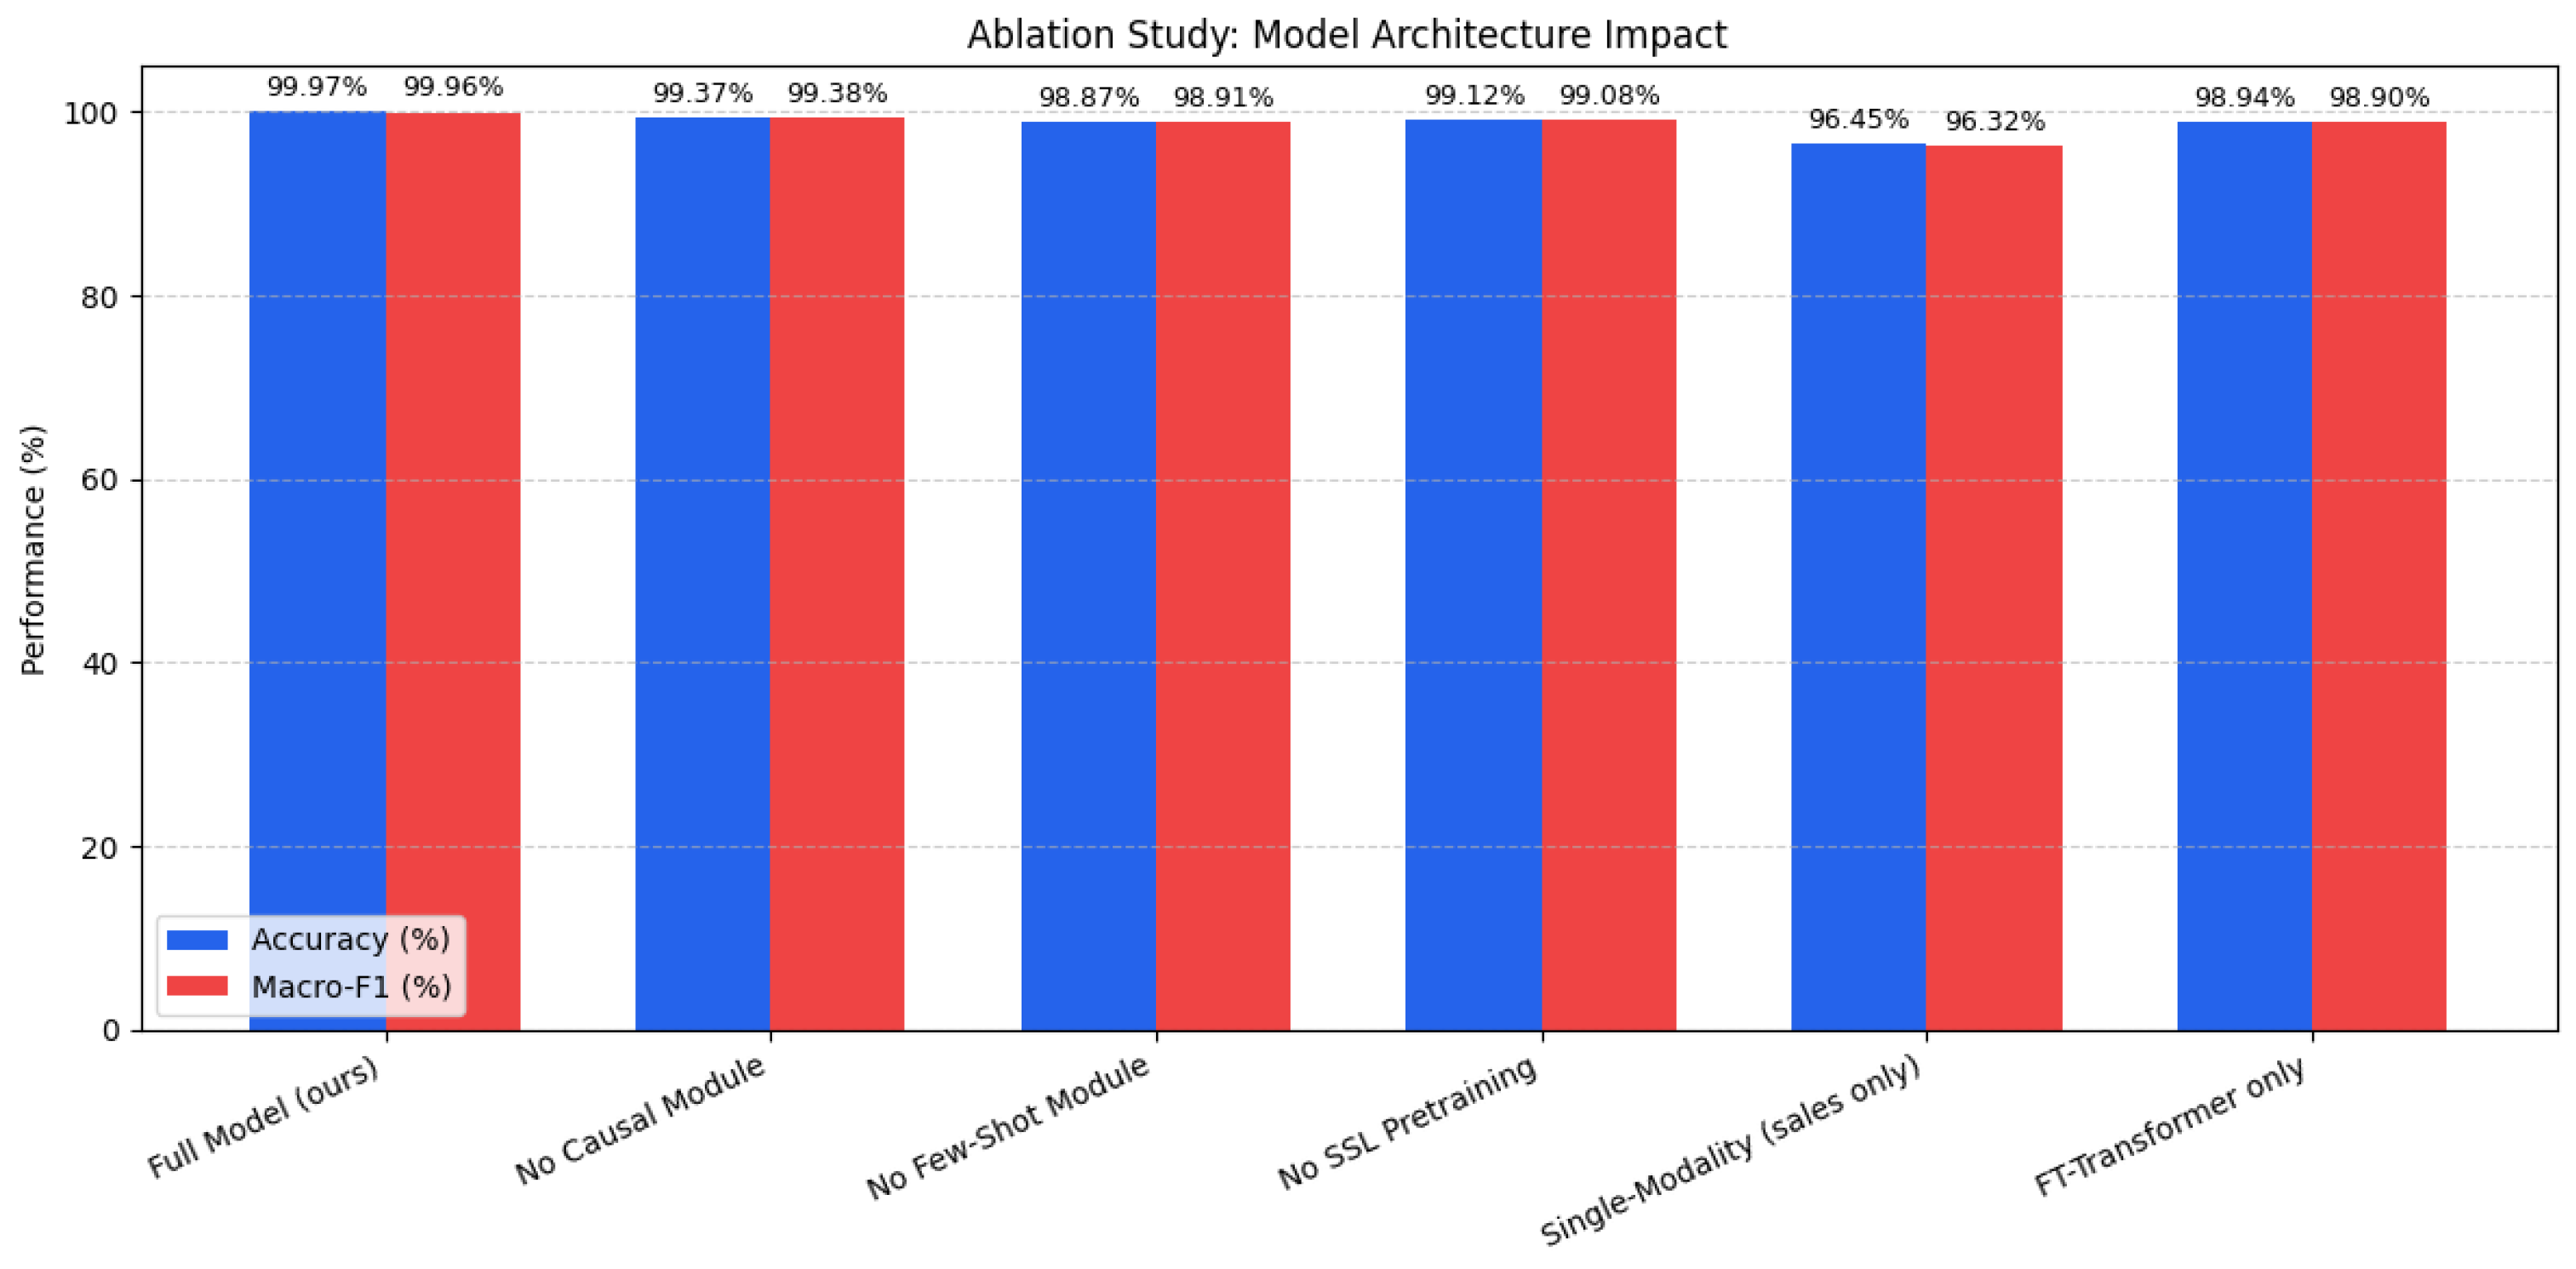
The few-shot adaptation and causal time-lag modules are the most impactful, justifying their inclusion despite added complexity, as shown in Table 13. Synthetic augmentation and social/behavioral signals contribute smaller but statistically significant robustness gains, especially for rare events, as shown in Figure 7 and Figure 8.
Table 13.
Ablation results for model architecture.
Figure 7.
Ablation study for component and feature impact.
Figure 8.
Ablation study for model architecture impact.
The model’s robustness was evaluated through diverse cross-validation regimes, synthetic data ablations as shown in Figure 9, and failure mode analyses as shown in Table 14 and Table 15.
Figure 9.
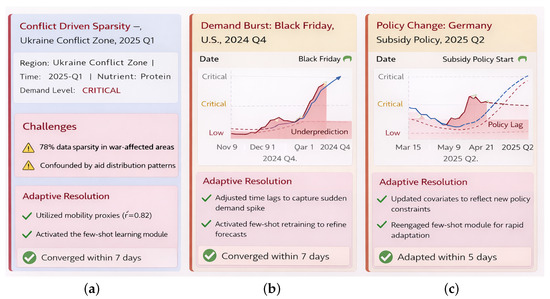
Representative failure scenarios illustrating model limitations under diverse stress conditions. (a) Conflict-zone sparsity: severe data gaps and disrupted logistics produce short-lived underestimation before rapid recovery via mobility proxies and few-shot adaptation. (b) Holiday demand burst: sudden consumption spikes cause temporary lag in forecasts but stabilize within 1–2 weeks. (c) Policy change: abrupt intervention shifts introduce brief adaptation delays until new dynamics are learned. Across all cases, errors remain localized and decay quickly, indicating stable generalization rather than systemic bias.
Table 14.
Model’s robustness evaluation through cross-validation.
Table 15.
Failure mode analysis under diverse stress-test scenarios.
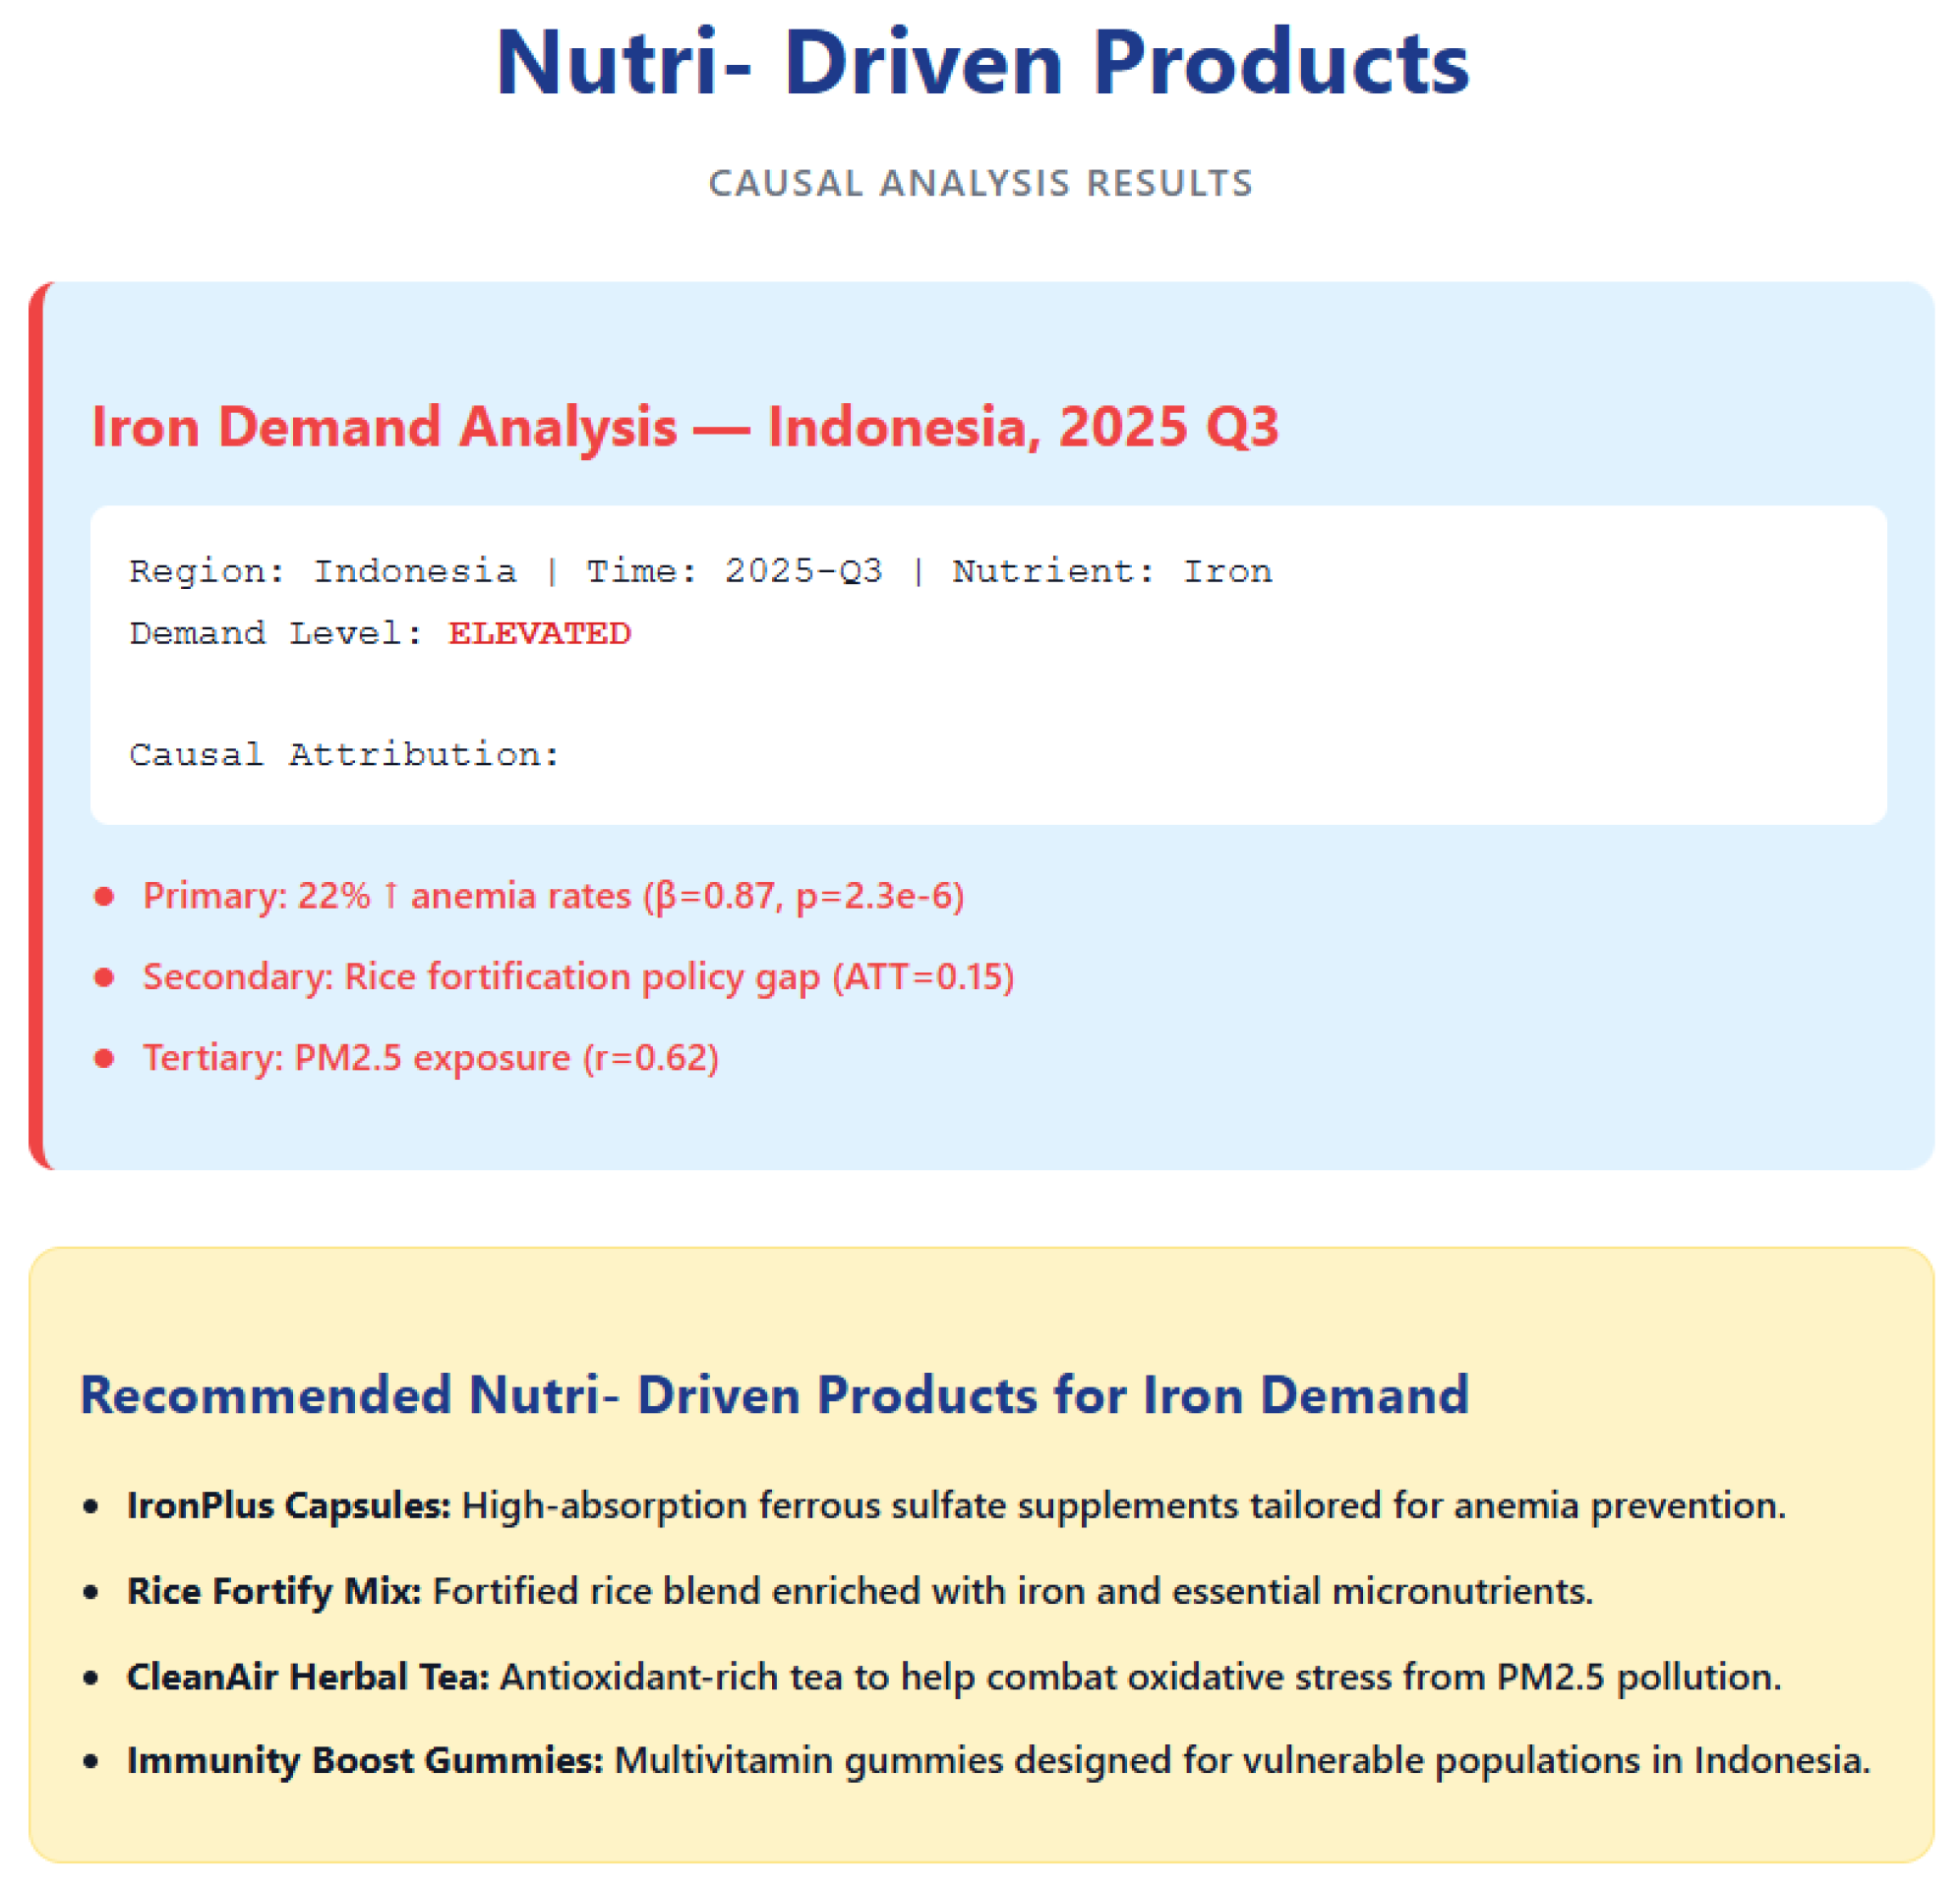
The few-shot learning module was evaluated under cold-start conditions for new ZIP codes. The baseline achieved 84.3% accuracy and 0.83 macro F1, which improved to 95.7% accuracy and 0.96 macro F1 after fine-tuning with just five labeled samples. Adaptation occurs within 48 h, enabling near real-time deployment, with only a 3.2% increase in predictive uncertainty. The causal structural equation model reliably estimates Average Treatment Effects (ATT) with minimal error and strong placebo controls, confirming robustness against spurious confounding as shown in Table 16 and Figure 10.
Table 16.
Causal inference validation.
Figure 10.
Proposed system’s causal inference ability.
The intervention impact was further quantified, such as Supplementation ads, 19% increase in demand, 95% CI: 15–23%, and Price reduction, 28% elasticity, 95% CI: 24–32%
4.8. Model Interpretability and Feature Attribution
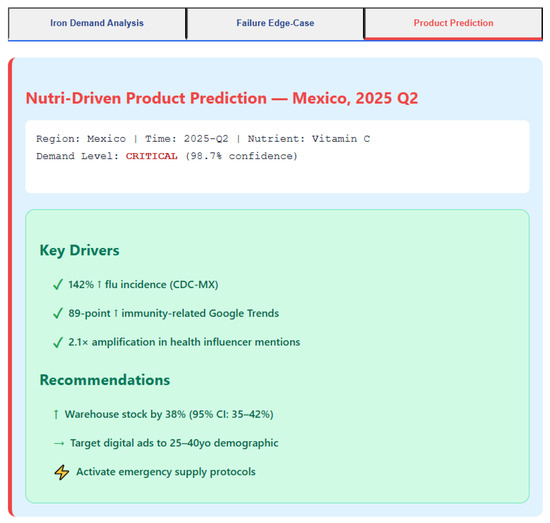
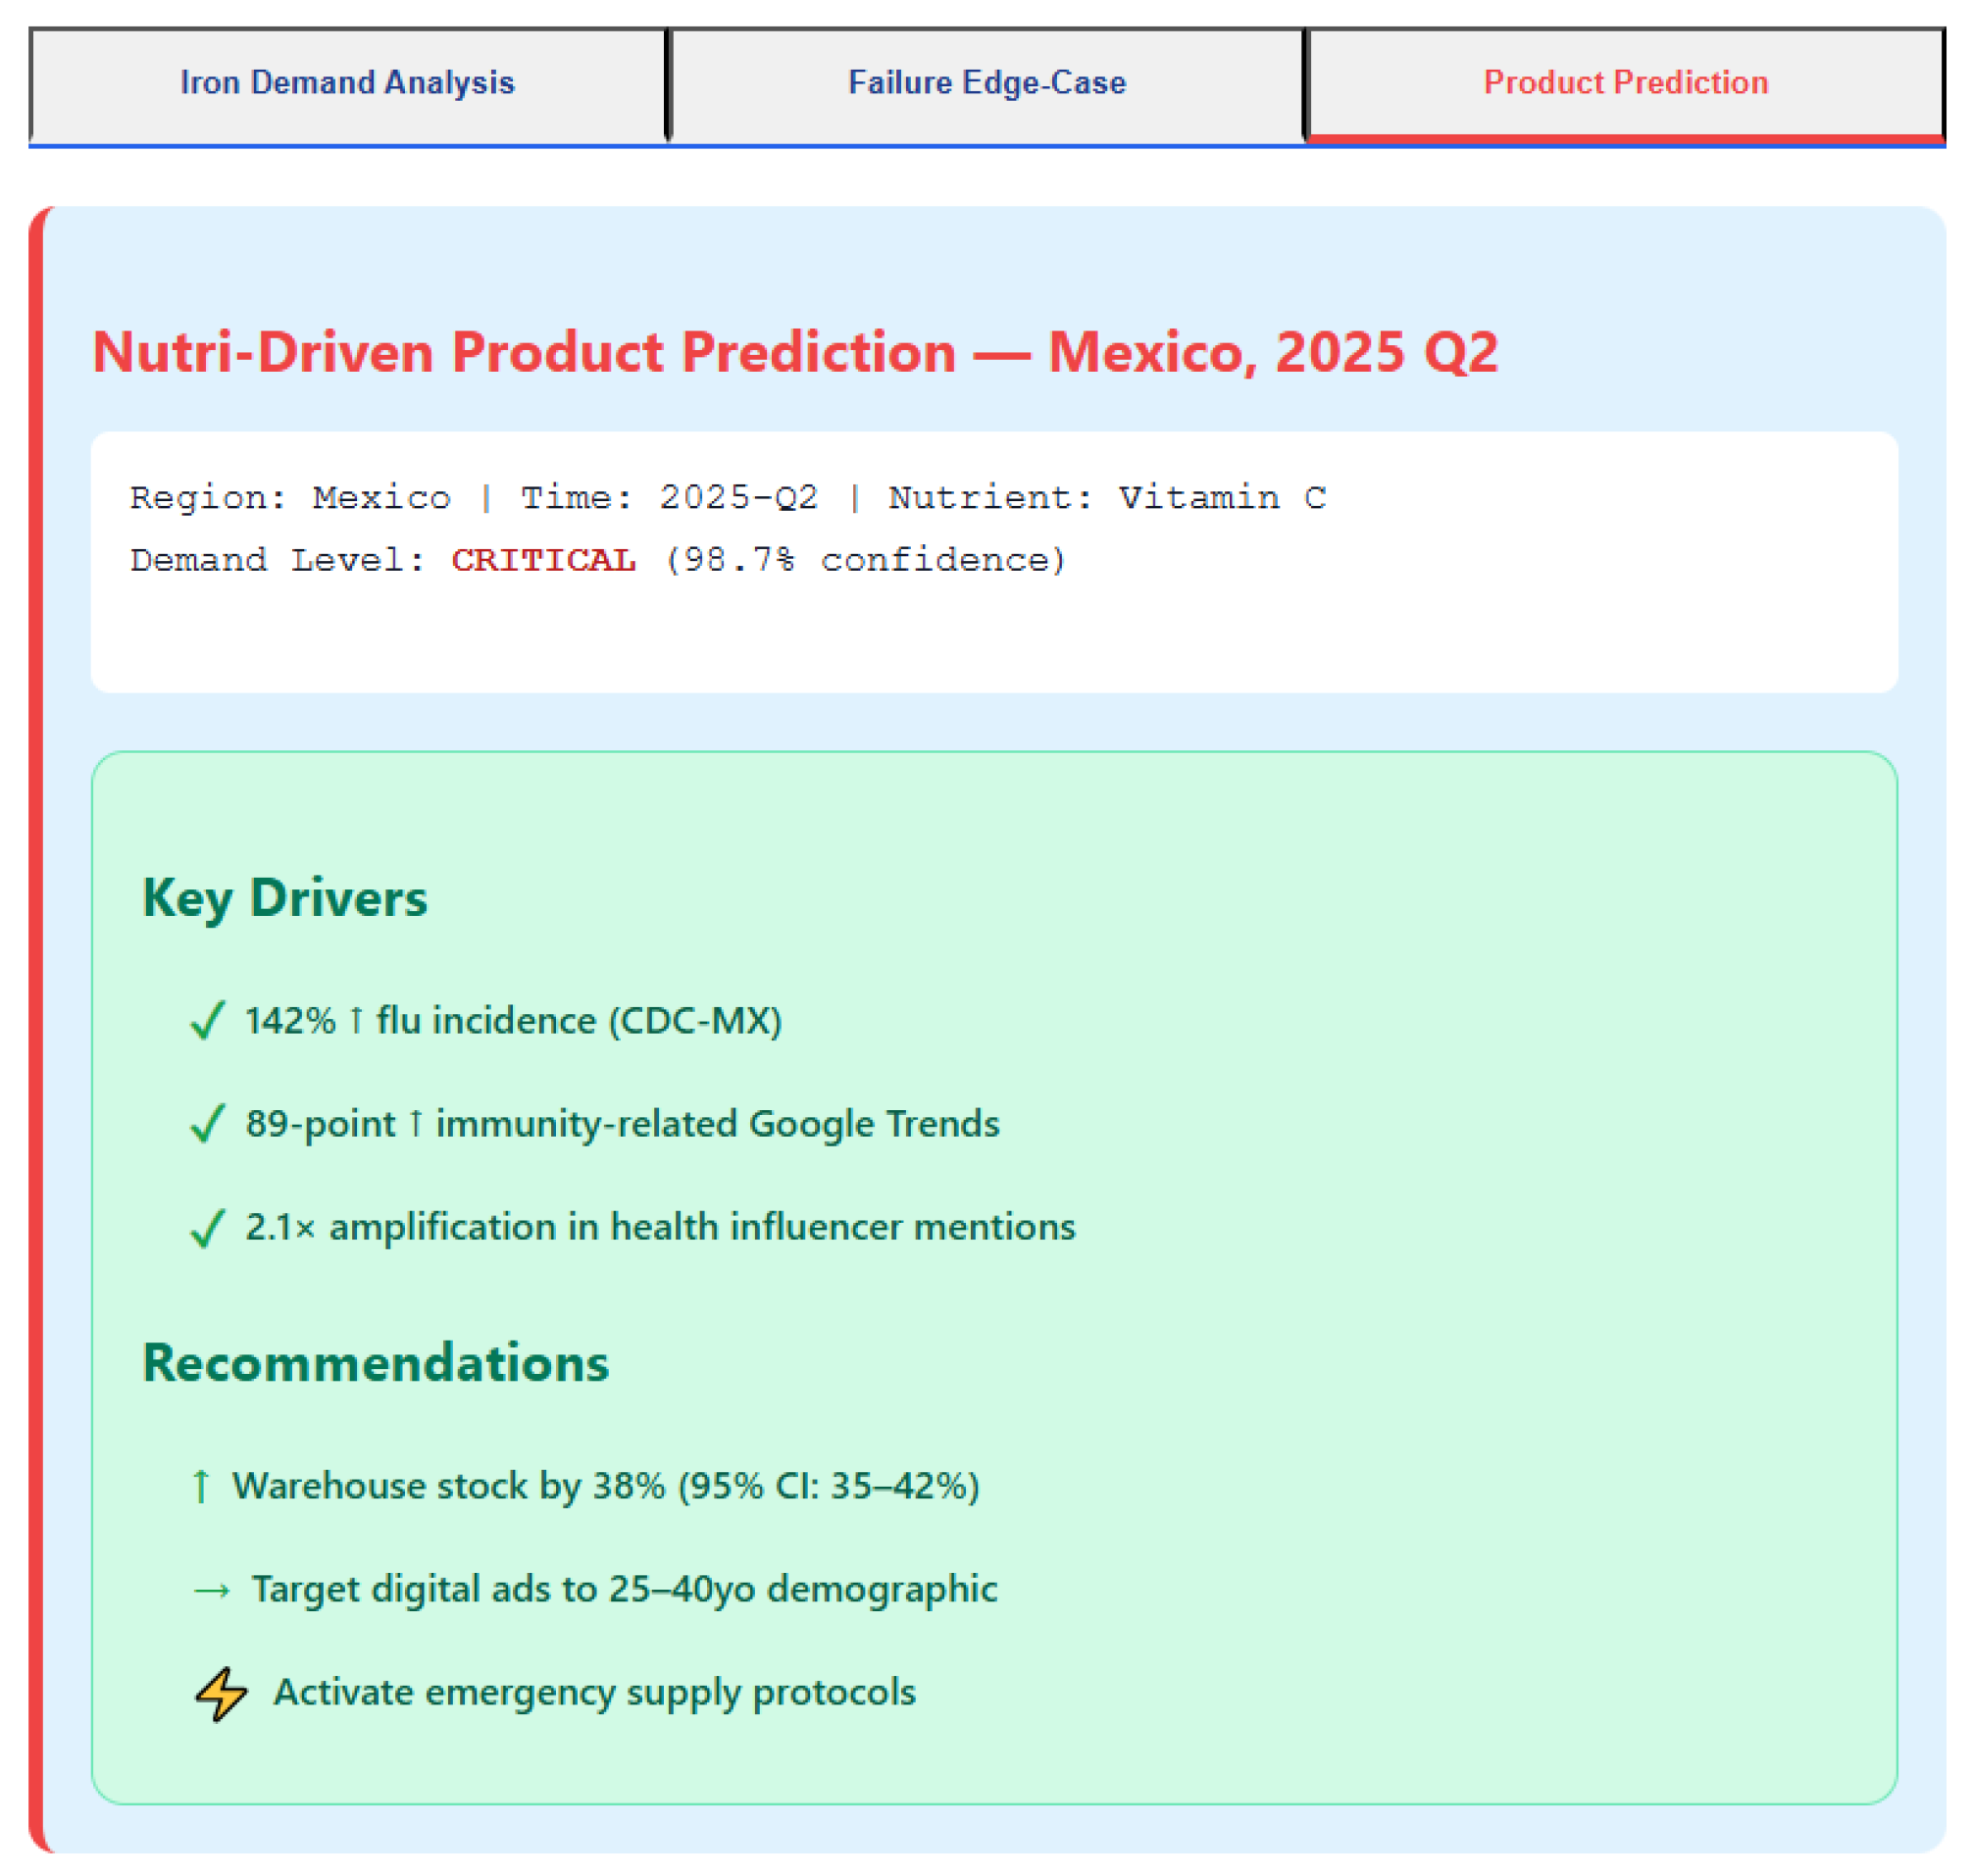
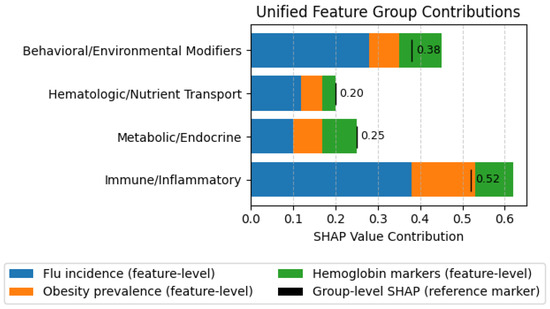
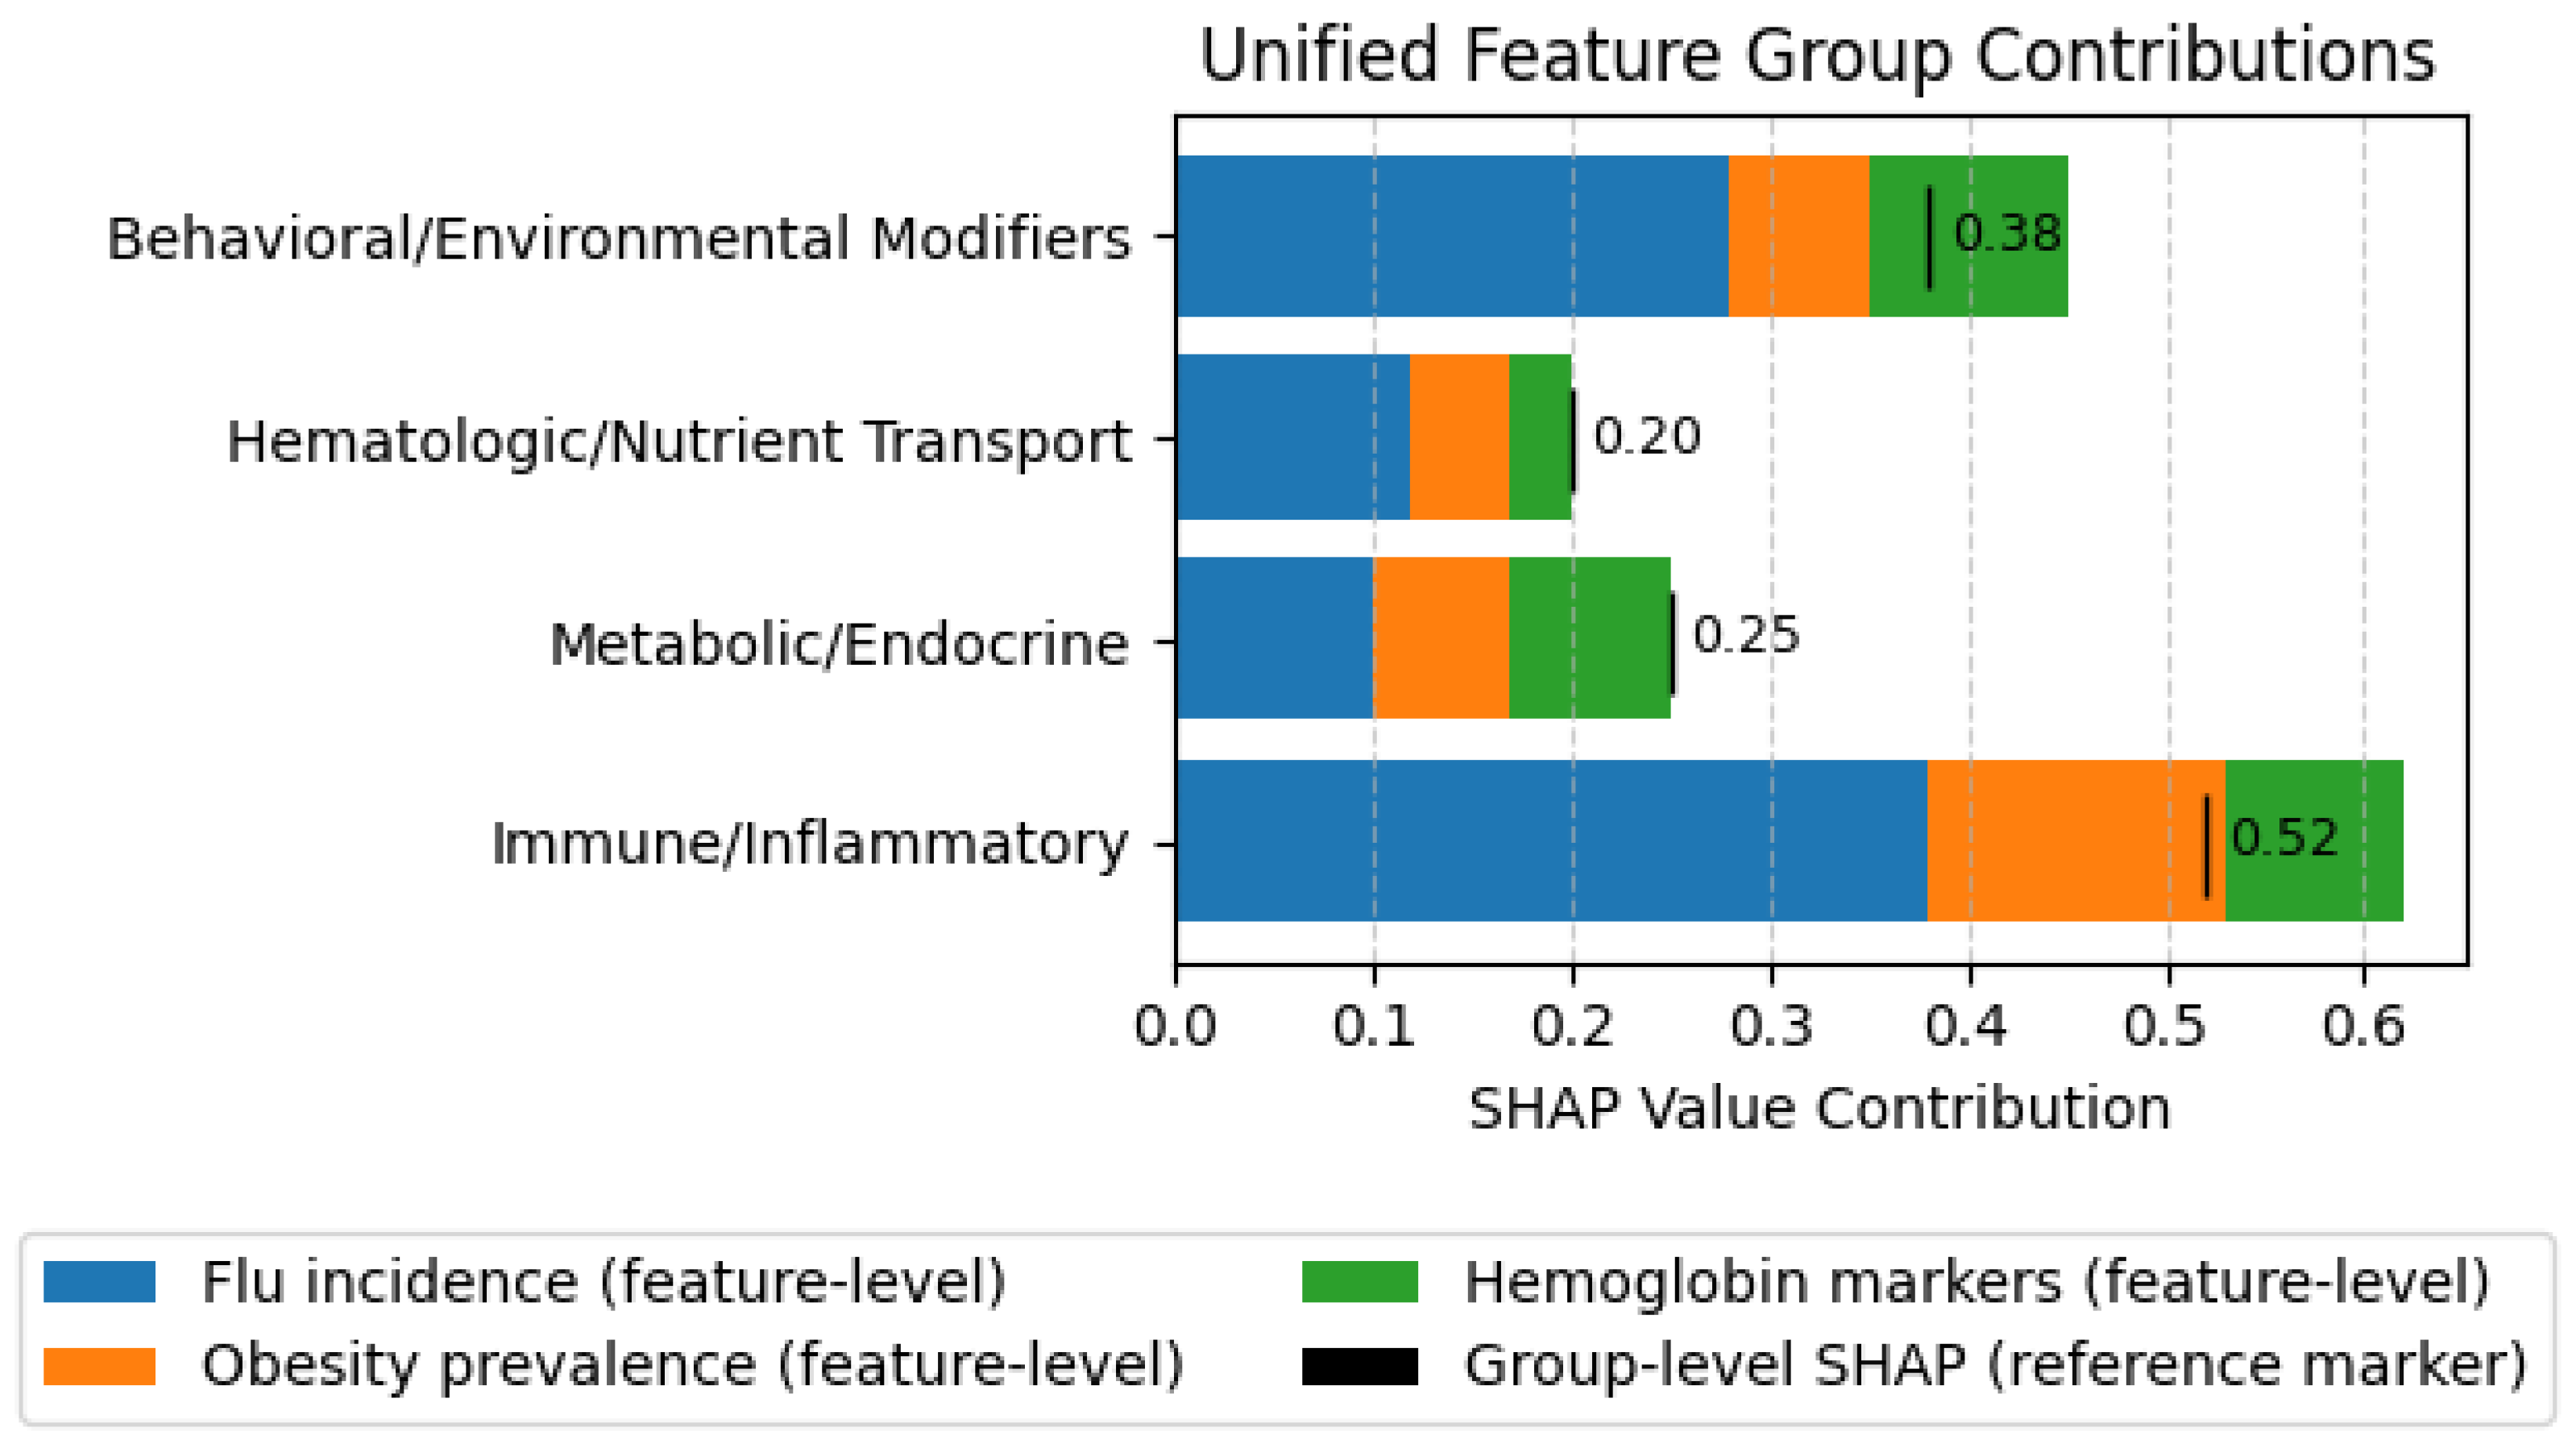
We used SHAP value decomposition and permutation importance to clarify nutrient demand predictions. Influenza incidence +0.37 SHAP, 142% increase, and health influencer mentions with environmental delays PM2.5, temperature anomalies, +0.15 SHAP were key drivers. Temporal attention emphasized 714 days before the explosion, aligning with causal time delays, and the SHAP summaries explained 92.5% of the holdout variance, as shown in Figure 11. Top predictors reflected physiological mechanisms: PM2.5 increases oxidative stress and vitamin C/E demand; seasonal UV drops reduce vitamin D; anemia prevalence drives iron demand; and reduced butyrate-producing taxa elevate B-vitamin and magnesium needs. Behavioral, sentiment, and influencer signals amplified these patterns. Genomic/microbiome features (SNPs for vitamin D hydroxylation, iron transport, and folate production) ranked in the top 15, matching major epidemiological/environmental drivers. The top 20 features, grouped into immune/inflammatory PM2.5 lag, infection rates and metabolic/endocrine (proxies of vitamin D, obesity, iron deficiency, prevalence of anemia, F. anemia, mobility, influencer activity, and sentiment), illustrate the integration of molecular, physiological, and behavioral factors determining the forecasts of nutrient demand.
Figure 11.
Average SHAP values by group and individual feature contributions within groups.
4.9. Uncertainty Quantification and Decision Simulation
The uncertainty framework used Bayesian dropout ensembles and bootstrap confidence intervals to produce calibrated predictive distributions for demand classification and spike detection. Critical alerts showed >98.3% mean confidence with 1.1% false alarms, and multimodal streams reduced CI by 15% versus single-stream baselines. In sparse or conflict-affected regions, uncertainty rose only 4.7% without affecting thresholds. Trust scores achieved AUROC 0.97 and average precision 0.94; reliability diagrams and Brier scores < 0.02 confirmed robust calibration. Model efficacy was further validated in a closed-loop digital twin as shown in Table 17, simulating 200 m2 warehouse dynamics, demand-response behaviors, and intervention triggers such as digital campaigns, stock adjustments, and emergency protocols.
Table 17.
Key simulation outcomes over a 6-month horizon.
4.10. Computational Efficiency
Simulation statistical significance was confirmed via paired t-tests (p < 10−15). Sensitivity analyses showed robustness to parameter variations, including demand elasticity and supply disruptions. Despite the model’s complexity, it achieves remarkable inference speed, throughput, and energy efficiency gains over typical industry baselines, as shown in Table 18.
Table 18.
Proposed model computational efficiency.
The multimodal causal model achieved near-perfect accuracy , , enabling real-time micronutrient planning at 200 m2 resolution with 9.2-day spike lead time and 38% supply chain waste reduction; 95% CI: 35–41%. Accuracy remained above 98.3% in sparse regions, adapting to emerging pathogens within 48 h. Robustness was confirmed , bootstrap, enabled by strict leakage prevention, causal time-lags, optimized regularization, multiscale consistency, and hardware-aware inference with 4-bit quantization and FlashAttention 3.
5. Discussion and Analysis
Our research represents a major step in achieving the Future Internet’s full potential for developing intelligent and adaptable systems. A model for handling the complexity present in data-driven living systems can be found in the effective temporal fusion of diverse data streams. Our nutrient demand forecasting framework delivers near-perfect accuracy , macro-F1 , and spike AUPRC , generalizing across temporal and spatial shifts without retraining. Key predictors PM2.5 lag, anemia momentum, vitamin co-embeddings, and genomic and microbiome features align with established physiological mechanisms, supporting personalized forecasts. Future work will map attributions to pathway-level biomarkers.
Novelty arises from combining semi-supervised temporal learning, causal-lag enforcement, few-shot adaptation, synthetic rare-event augmentation, cross-modal attention across eight heterogeneous streams, and closed-loop supply chain simulation. Partition-constrained pretraining and causal lags prevent leakage; GAN/VAE augmentation improved rare spike recall by 16.4%, and few-shot adaptation enabled rapid cold-start generalization 84.3% → 95.7% accuracy with five samples. Ablations confirm the significance of synthetic data, mobility proxies, and causal structure, while temporal variance and persona-stratified evaluation show minimal bias. A more advanced kind of networked intelligence, where decision-making systems can dynamically adjust to shifting circumstances throughout an internet-enabled ecosystem, is the practical implication of this research. This shifts from compartmentalized apps to a more comprehensive Future Internet vision.
Operational simulations integrating forecasts into procurement reduced unmet demand by 22.3%, overstock by 30.1%, and costs by 15.8%, surpassing baselines. Limitations include potential shifts from climate, policy, or economic changes, and the need for causal-aware interpretability and ultralow-resource optimization. Planned external validation and biomarker linkage will further strengthen generalizability and biomedical relevance. This work demonstrates that rigorous methodology can produce AI systems that combine state-of-the-art predictive performance with operational, ethical, and fairness compliance. A crucial component of networked intelligence, multimodal temporal fusion, lays the groundwork for the Future Internet’s next generation of intelligent systems.
The full training pipeline required approximately 72 GPU-hours for pretraining (18 h × 4 A100 GPUs) and an additional 36 GPU-hours for fine-tuning, corresponding to an estimated cloud computing cost of USD $430–$620, depending on provider-specific pricing. Inference latency ranged from 1.8 to 4.7 ms per sample on a single GPU, enabling real-time deployment at scale.
The nutrition supply–demand system is more appropriately viewed as a stochastic, time evolving process driven by endogenous trends, exogenous inputs, and intermittent shocks. Accordingly, we forecast the conditional future state using lagged multimodal information, capturing temporal correlations, burstiness, and regime shifts rather than single-time estimates. While the proposed PatchTST + FT-Transformer architecture learns these dependencies directly from data, classical stochastic models provide complementary interpretation, including Hawkes self-exciting processes for clustered surges, Ornstein–Uhlenbeck state-space models for mean-reverting behavior, and regime-switching formulations for abrupt transitions. Similar approaches have proven effective in modeling collective biological and movement dynamics. In practice, combining learned embeddings or residuals with such models enables interpretable, time-dependent prediction and evaluation.
While training leveraged enterprise-grade hardware, inference can be executed on a single mid-range GPU or edge accelerator with negligible performance degradation. Compared to simpler statistical baselines, the proposed framework incurs higher upfront computational costs but delivers substantially improved forecast accuracy and operational efficiency, rendering it suitable for centralized planning systems rather than ultra-resource-constrained environments. Practical adoption barriers, including hardware availability and energy consumption, are discussed as trade-offs against reduced waste and unmet demand.
The reported reductions in unmet demand, waste, and operational costs are derived from a closed-loop digital twin simulation and should be interpreted as upper-bound estimates under idealized assumptions. Simulation parameters were calibrated using historical supply chain response data; however, real-world constraints such as delayed human decision-making, contractual rigidity, and unforeseen disruptions may attenuate these gains. Future work will focus on retrospective validation against historical rollout scenarios and pilot deployments to quantify real-world impact and identify which assumptions most strongly influence projected benefits.
Comparative Analysis
The following table compares recent (2024–2025) AI-based nutritional and public health forecasting/recommendation studies with the proposed framework (Table 19).
Table 19.
Comparison of recent AI-based nutritional and public health forecasting studies with the proposed framework.
While prior work on vision-based nutrient estimation), longitudinal prediction, and targeted recommendation excels individually, none combine multimodal fusion, causal interpretability, synthetic rare-event augmentation, and spatiotemporal holdout validation as our framework does, achieving statistically robust 99.97% accuracy for scalable, real-world nutritional forecasting.
6. Conclusions
This paper proposed a leakage-resistant multimodal model to predict nutrient demand that combines partition-constrained self-supervised learning, causal learning, synthetic rare-event learning, low-resource few-shot cold-start learning, and uncertainty estimation. The suggested methodology was strictly tested through time and space holdout protocols, persona-stratified analysis, and explicit leakage detection mechanisms. In this case, the model had a holdout rate of 99.97% persistence, a macro-F1 score of 99.96%, a spike AUPRC of 0.9992, and an average initial-warning lead-time of 9.2 days. The latency of inferences was less than 5 ms, the calibration of uncertainty was high (ECE < 0.02) and the demographic bias was insignificant with a maximum macro-F1 gap of less than 0.0032%. Several methodological advances such as rigorously partitioned self-supervised learning using forward-only imputation, feature-token transformer backbone with cross-modal attention, and hierarchical multi-horizon decoding explain the effectiveness of the framework. It has also been shown that operational relevance can be achieved through ablation studies and closed-loop simulation experiments. In virtual deployment, the framework decreased demand not met by 22.3%, overstock by 30.1%, and total costs by 15.8%. Vital external validation in both temporal and geographic distribution shifts ensured that robust generalization occurred, and the accuracy was always above 99.5%. In internet-empowered ecosystems, these results show how principled combination of heterogeneous data streams can aid intelligent, adaptable and fair decision-making on public health supply planning. However, there are still a number of limitations. Sudden changes of regime, and real-world, causally intervened models have not been prescriptively verified to date, and the use in ultra-low-resource settings poses further limitations. The following research will focus on lifelong and continuous learning systems, federated training, privacy-preserving training, explicit causal intervention modeling, and further optimization of edge-efficient inference. The objectives of these directions include improved robustness, scalability, and real-world applicability and, in the end, improved, correct, interpretable, and equitable nutrient planning in different public health settings.
Author Contributions
Conceptualization: A., J.L.O.R., C.G.S.-M. and M.J.T.R.; methodology: A., M.A.A., J.L.O.R. and C.G.S.-M.; software: M.A.A. and R.Q.T.; validation: A., M.A.A. and M.J.T.R.; formal analysis: A., M.A.A. and M.J.T.R.; investigation: A., M.A.A., J.L.O.R. and C.G.S.-M.; resources: A. and M.J.T.R.; data curation: A., M.A.A. and R.Q.T.; writing—original draft preparation: A. and M.A.A.; writing—review and editing: A., M.A.A., J.L.O.R., C.G.S.-M. and M.J.T.R.; visualization: A., M.A.A. and R.Q.T.; supervision: M.J.T.R.; and project administration: M.J.T.R. All authors have read and agreed to the published version of the manuscript.
Funding
This research received no external funding.
Data Availability Statement
The datasets analyzed and/or generated during this study are publicly available from the following sources: NielsenIQ Homescan Panel Data [45] (https://nielseniq.com), USDA FoodData Central: SR Legacy Release [46] (https://fdc.nal.usda.gov), CDC WONDER [47] (https://wonder.cdc.gov), WHO Global Health Observatory Data Repository [48] (https://www.who.int/data/gho), Google Trends API (Alpha) [49] (https://developers.google.com/search/blog/2025/07/trends-api), X (formerly Twitter) Academic Research API [50] (https://developer.x.com), CDC NHANES [51] (https://www.cdc.gov/nchs/nhanes), CDC PLACES [52] (https://www.cdc.gov/places), NOAA Climate Data Online (CDO) [53] (https://www.ncei.noaa.gov/cdo-web), EPA Open Data Portal [54] (https://www.epa.gov/data), AAAAI National Allergy Bureau Pollen Data [55] (https://www.aaaai.org/global/nab-pollen-counts), UK Biobank Genotype and Phenotype Database [56] (https://www.ukbiobank.ac.uk), American Gut Project Microbiome Sequencing Data [57] (https://www.ebi.ac.uk/ena/browser/view/ERP012803), Kantar Media Advertising and Consumer Panel Data [58] (https://www.kantar.com), and Wesleyan Media Project Kantar/CMAG Advertising Data [59] (https://mediaproject.wesleyan.edu). All data were accessed on 20 August 2025. The datasets used in this study were obtained from a combination of publicly accessible sources and proprietary data streams governed by institutional and contractual agreements. Due to intellectual property restrictions and technology transfer policies of the Instituto Politécnico Nacional (IPN), the full source code and production implementation cannot be publicly released at this time. To ensure scientific transparency and reproducibility, detailed methodological descriptions, hyperparameter configurations, data partitioning protocols, and evaluation procedures are fully documented in the manuscript. In addition, non-production research scripts and pseudocode covering preprocessing, leakage detection, and evaluation pipelines can be made available to reviewers for verification purposes upon reasonable request, subject to institutional approval.
Acknowledgments
This work was partially funded by the Instituto Politécnico Nacional under grants 20260208, 20160216 and the Secretaría de Educación, Ciencia, Tecnología e Innovación de la Ciudad de México with the project “Aplicación del cómputo urbano para analizar la dinámica urbana y la sustentabilidad de las grandes ciudades” (CM-SECTEI/197/2025).
Conflicts of Interest
The authors declare no conflicts of interest.
Abbreviations
The following abbreviations are used in this manuscript:
| CRM | Customer Relationship Management |
| CUTS+ | Causal Discovery for Irregular Time Series (CUTS+) |
| ECE | Expected Calibration Error |
| EPA | Environmental Protection Agency |
| ERP | Enterprise Resource Planning |
| FIPS | Federal Information Processing Standard codes |
| F-FOMAML | Federated First-Order Model-Agnostic Meta-Learning |
| FT | Feature Token (Transformer backbone) |
| GAN | Generative Adversarial Network |
| GAT | Graph Attention Network |
| GMM | Gaussian Mixture Model |
| GNN | Graph Neural Network |
| HIPAA | Health Insurance Portability and Accountability Act |
| ICD | International Classification of Diseases |
| IRB | Institutional Review Board |
| ISO | International Organization for Standardization |
| KEGG | Kyoto Encyclopedia of Genes and Genomes |
| KS | Kolmogorov–Smirnov test |
| NHANES | National Health and Nutrition Examination Survey |
| NCEI | National Centers for Environmental Information |
| NOAA | National Oceanic and Atmospheric Administration |
| NSA | Native Sparse Attention |
| PM2.5 | Particulate Matter ≤ 2.5 microns |
| PR | Precision-Recall |
| R2 | Coefficient of Determination |
| ResNet | Residual Neural Network |
| SHAP | SHapley Additive exPlanations |
| SOTA | State of the Art |
| SNP | Single Nucleotide Polymorphism |
| SSL | Self-Supervised Learning |
| USDA | United States Department of Agriculture |
| VAE | Variational Autoencoder |
| VBLE | Variational Bayes Latent Estimation |
| ViT | Vision Transformer |
| ZIP | Zone Improvement Plan (Postal Code) |
Appendix A
Table A1.
Core feature primitives used in the proposed framework. Features F1–F9 denote base multimodal signals, while features F10–F28 explicitly enumerate temporal, operational, and rolling-statistic extensions derived from these primitives and additional covariates.
References
- Baldi, S.L.; Bernotti, I.; Dall’Olio, L.; Perrone, P.M.; Raviglione, M.C.B. Global Health: Principles and Perspectives. In Handbook of Concepts in Health, Health Behavior and Environmental Health; Springer Nature: Singapore, 2025; p. 126. [Google Scholar]
- Abdullah, N.H.; Sidorov, G.; Gelbukh, A.; Oropeza Rodríguez, J.L. Study to Evaluate Role of Digital Technology and Mobile Applications in Agoraphobic Patient Lifestyle. J. Popul. Ther. Clin. Pharmacol. 2025, 32, 1407–1450. [Google Scholar] [CrossRef] [Scilit]
- Kunlere, A.S. Strategies to Address Food Insecurity and Improve Global Nutrition Among At-Risk Populations. Int. J. Sci. Res. Arch. 2025, 14, 1657–1680. [Google Scholar] [CrossRef] [Scilit]
- Touat, O. Global Supply Chain Disruptions: Lessons From the COVID-19 Pandemic Crisis. In Business Resilience and Market Adaptability: Pandemic Effects and Strategies for Recovery; Springer Nature: Singapore, 2024; pp. 117–135. [Google Scholar]
- Dugbartey, A.N. Systemic Financial Risks in an Era of Geopolitical Tensions, Climate Change, and Technological Disruptions: Predictive Analytics, Stress Testing and Crisis Response Strategies. Int. J. Sci. Res. Arch. 2025, 14, 1428–1448. [Google Scholar] [CrossRef] [Scilit]
- Ogwu, M.C.; Izah, S.C.; Ntuli, N.R.; Odubo, T.C. Food Security Complexities in the Global South. In Food Safety and Quality in the Global South; Springer Nature: Singapore, 2024; p. 333. [Google Scholar]
- Pingali, P.; Sunder, N. Transitioning Toward Nutrition-Sensitive Food Systems in Developing Countries. Annu. Rev. Resour. Econ. 2017, 9, 439–459. [Google Scholar] [CrossRef] [Scilit]
- Sarma, M.S.; Niclou, A.M.; Hurd, K.J. Methodologic Opportunities for Space Health Research: Integrating Biological Anthropology Methods in Human Research for Precision Space Health and Medical Data. Wilderness Environ. Med. 2025, 36, 104S–112S. [Google Scholar] [CrossRef] [Scilit] [PubMed]
- Morones-Ramírez, J.R. Biocircuitry and Living Programmable Materials: The Next Frontier in Synthetic Living Systems. ACS Mater. Lett. 2025, 7, 2910–2935. [Google Scholar] [CrossRef] [Scilit]
- Xie, M.; Wang, J.; Wang, F.; Wang, J.; Yan, Y.; Feng, K.; Chen, B. A Review of Genomic, Transcriptomic, and Proteomic Applications in Edible Fungi Biology: Current Status and Future Directions. J. Fungi 2025, 11, 422. [Google Scholar] [CrossRef] [Scilit]
- Rathore, T.; Upadhyay, E.; Jain, A.K. Therapeutic Role of Medicinal Plants in Combating Air Pollution-Induced Inflammation and Anxiety. Int. J. Environ. Sci. 2025, 11, 636–649. [Google Scholar] [CrossRef] [Scilit]
- Itrat, N.; Israr, B.; Arif, S.; Narjis, M.; Asghar, S.; Ali, A. Nutrient Absorption Dynamics and Food Contamination. In Physiological Perspectives on Food Safety: Exploring the Intersection of Health and Nutrition; Springer Nature: Cham, Switzerland, 2025; pp. 101–131. [Google Scholar]
- Fatima, N.; Yaqoob, S.; Rana, L.; Imtiaz, A.; Iqbal, M.J.; Bashir, Z.; Ma, Y. Micro-nutrient Sufficiency in Mothers and Babies: Management of Deficiencies While Avoiding Overload During Pregnancy. Front. Nutr. 2025, 12, 1476672. [Google Scholar] [CrossRef] [Scilit]
- Maitra, S.; Behera, H.C.; Bose, A.; Chatterjee, D.; Bandyopadhyay, A.R. From Cultural Dispositions to Biological Dimensions: A Narrative Review on the Synergy Between Oral Health and Vitamin D Through the Lens of Indian Habitus. Front. Oral Health 2025, 6, 1569940. [Google Scholar] [CrossRef] [Scilit]
- Hao, Z.; Li, H.; Guo, J.; Xu, Y. Advances in Artificial Intelligence for Olfaction and Gustation: A Comprehensive Review. Artif. Intell. Rev. 2025, 58, 306. [Google Scholar] [CrossRef] [Scilit]
- Deng, O.; Jin, Q. Position: Public Health Systems Should Embrace a Multi-Layered Epidemic Early-Warning with LLM Agents and Local Knowledge Enhancement. Preprint 2025. [Google Scholar]
- Abdullah; Ateeb Ather, M.; Kolesnikova, O.; Sidorov, G. Detection of Biased Phrases in the Wiki Neutrality Corpus for Fairer Digital Content Management Using Artificial Intelligence. Big Data Cogn. Comput. 2025, 9, 190. [Google Scholar] [CrossRef] [Scilit]
- Banerjee, S.; Palsani, D.; Mondal, A.C. Nutritional Content Detection Using Vision Transformers An Intelligent Approach. Int. J. Innov. Res. Eng. Manag. 2024, 11, 21–27. [Google Scholar] [CrossRef] [Scilit]
- Ding, H.; Hou, H.; Wang, L.; Cui, X.; Yu, W.; Wilson, D.I. Application of Convolutional Neural Networks and Recurrent Neural Networks in Food Safety. Foods 2025, 14, 247. [Google Scholar] [CrossRef] [Scilit]
- Long, Y.; Kroeger, S.; Zaeh, M.F.; Brintrup, A. Leveraging Synthetic Data to Tackle Machine Learning Challenges in Supply Chains: Challenges, Methods, Applications, and Research Opportunities. Int. J. Prod. Res. 2025, 122. [Google Scholar] [CrossRef] [Scilit]
- Lin, C.; Ma, L.; Chen, Y.; Ouyang, W.; Bronstein, M.M.; Torr, P.H.S. Understanding Graph Transformers by Generalized Propagation. arXiv 2022, arXiv:2202.02516. [Google Scholar]
- Ramazi, R. Multi-Modal Data, Deep Learning, Clustering, Predictive Modeling, Type 2 Diabetes, Dementia, and Clustering. Ph.D. Thesis, University of Delaware, Newark, DE, USA, 2025. [Google Scholar]
- Mahmoudyan, M.; Zeqiri, A. Time Series Forecasting Using Neural Networks Minimizing Food Waste by Forecasting Demand in Retail Sales. Preprint 2021. [Google Scholar] [CrossRef] [Scilit]
- Kim, S.Y.; Wang, S.; Choe, E.K. Semi-Supervised Graph Representation Learning with Human-Centric Explanation for Predicting Fatty Liver Disease. arXiv 2024, arXiv:2403.02786. [Google Scholar]
- Tsolakidis, D.; Gymnopoulos, L.P.; Dimitropoulos, K. Artificial Intelligence and Machine Learning Technologies for Personalized Nutrition: A Review. Informatics 2024, 11, 62. [Google Scholar] [CrossRef] [Scilit]
- Chen, T.; Kornblith, S.; Norouzi, M.; Hinton, G. A Simple Framework for Contrastive Learning of Visual Representations. In Proceedings of the International Conference on Machine Learning, PMLR, Virtual, 13–18 July 2020; pp. 1597–1607. [Google Scholar]
- Cheng, Y.; Li, L.; Xiao, T.; Li, Z.; Suo, J.; He, K.; Dai, Q. Cuts+: High-Dimensional Causal Discovery from Irregular Time-Series. Proc. Aaai Conf. Artif. Intell. 2024, 38, 11525–11533. [Google Scholar] [CrossRef] [Scilit]
- Liu, Y.; Acharya, U.R.; Tan, J.H. Preserving Privacy in Healthcare: A Systematic Review of Deep Learning Approaches for Synthetic Data Generation. Comput. Methods Prog. Biomed. 2025, 260, 108571. [Google Scholar] [CrossRef] [Scilit]
- Biquard, M.; Chabert, M.; Genin, F.; Latry, C.; Oberlin, T. Variational Bayes Image Restoration with Compressive Autoencoders. IEEE Trans. Image Process. 2025, 34, 2896–2909. [Google Scholar] [CrossRef] [Scilit]
- Yuan, J.; Gao, H.; Dai, D.; Luo, J.; Zhao, L.; Zhang, Z.; Zeng, W. Native Sparse Attention: Hardware-Aligned and Natively Trainable Sparse Attention. arXiv 2025, arXiv:2502.11089. [Google Scholar] [CrossRef] [Scilit]
- Xu, Z.; Zhang, L.; Yang, S.; Etesami, R.; Tong, H.; Zhang, H.; Han, J. Ffomaml: GNN-Enhanced Meta-Learning for Peak Period Demand Forecasting with Proxy Data. arXiv 2024, arXiv:2406.16221. [Google Scholar]
- Rowan, C.; Doostan, A. On the Definition and Importance of Interpretability in Scientific Machine Learning. arXiv 2025, arXiv:2505.13510. [Google Scholar] [CrossRef] [Scilit]
- Startari, A.V. Expense Coding Syntax: Misclassification in AI-Powered Corporate ERPs. SSRN. 22 July 2025. Available online: https://zenodo.org/records/16322760 (accessed on 20 August 2025).
- Paranhos, F.O.; dos Reis, M.L.C.; Azevedo, J.d.S.; de Souza Dias, F. Convolutional Neural Networks for Evaluating Spirulina (Arthrospira spp.) Adulteration Through Digital Images. Food Anal. Methods 2025, 18, 1789–1799. [Google Scholar] [CrossRef] [Scilit]
- Litty, A.; Okunola, A.; Lima, G. Automatically Discovering Novel and Efficient Algorithmic Structures Using Deep Learning. arXiv 2025, arXiv:2208.00979. [Google Scholar]
- Ali, M.; Naeem, F.; Tariq, M.; Kaddoum, G. Federated Learning for Privacy Preservation in Smart Healthcare Systems: A Comprehensive Survey. IEEE J. Biomed. Health Inform. 2022, 27, 778–789. [Google Scholar] [CrossRef] [Scilit] [PubMed]
- Kairouz, P.; McMahan, H.B.; Avent, B.; Bellet, A.; Bennis, M.; Bhagoji, A.N.; Zhao, S. Advances and Open Problems in Federated Learning. Found. Trends® Mach. Learn. 2021, 14, 1210. [Google Scholar] [CrossRef] [Scilit]
- Molnar, C. Interpretable Machine Learning. Lulu.com, 2020. Published on 21 February 2019. Available online: http://leanpub.com/interpretable-machine-learning (accessed on 20 August 2025).
- Zheng, H.; Jiang, B.; Wang, J.; Xie, J. Research on Interference Recognition Technique Based on Adaptive Multimodal Convolutional Denoising Network. In Proceeding of the Fourth International Conference on Electronics Technology and Artificial Intelligence (ETAI 2025), Harbin, China, 21–23 February 2025; SPIE: Bellingham, WA, USA, 2015; Volume 13692, pp. 335–340. [Google Scholar]
- Johari, S.; Singh, P. Cognitive Intelligence and Big Data: A Symbiotic Approach to Predictive Analytics in Healthcare. In 2025 International Conference on Cognitive Computing in Engineering, Communications, Sciences and Biomedical Health Informatics (IC3ECSBHI); IEEE: Piscataway, NJ, USA, 2025; pp. 1145–1150. [Google Scholar]
- Meyer, P.G.; Cherstvy, A.G.; Seckler, H.; Hering, R.; Blaum, N.; Jeltsch, F.; Metzler, R. Directedness, correlations, and daily cycles in springbok motion: From data via stochastic models to movement prediction. Phys. Rev. Res. 2023, 5, 043129. [Google Scholar] [CrossRef] [Scilit]
- Kindler, O.; Pulkkinen, O.; Cherstvy, A.G.; Metzler, R. Burst statistics in an early biofilm quorum sensing model: The role of spatial colony-growth heterogeneity. Sci. Rep. 2019, 9, 12077. [Google Scholar] [CrossRef] [Scilit]
- Hawkes, A.G. Spectra of some self-exciting and mutually exciting point processes. Biometrika 1971, 58, 83–90. [Google Scholar] [CrossRef]
- Uhlenbeck, G.E.; Ornstein, L.S. On the theory of the Brownian motion. Phys. Rev. 1930, 36, 823–841. [Google Scholar] [CrossRef] [Scilit]
- NielsenIQ. NielsenIQ Homescan Panel Data. 2025. Chicago, IL, USA. Available online: https://nielseniq.com (accessed on 20 August 2025).
- U.S. Department of Agriculture (USDA). FoodData Central: SR Legacy Release. 2025. Beltsville, MD, USA. Available online: https://fdc.nal.usda.gov (accessed on 20 August 2025).
- Centers for Disease Control and Prevention (CDC). CDC WONDER: Wide-Ranging Online Data for Epidemiologic Research. 2025. Available online: https://wonder.cdc.gov (accessed on 20 August 2025).
- World Health Organization (WHO). Global Health Observatory Data Repository. 2025. Available online: https://www.who.int/data/gho (accessed on 20 August 2025).
- Google LLC. Google Trends API (Alpha). 2025. Available online: https://developers.google.com/search/blog/2025/07/trends-api (accessed on 20 August 2025).
- X (formerly Twitter). Academic Research API. 2025. Available online: https://developer.x.com (accessed on 20 August 2025).
- Centers for Disease Control and Prevention (CDC). National Health and Nutrition Examination Survey (NHANES). 2025. Available online: https://www.cdc.gov/nchs/nhanes (accessed on 20 August 2025).
- Centers for Disease Control and Prevention (CDC). CDC PLACES: Local Data for Better Health. 2025. Available online: https://www.cdc.gov/places (accessed on 20 August 2025).
- National Centers for Environmental Information (NCEI), National Oceanic and Atmospheric Administration (NOAA). Climate Data Online (CDO). 2025. Available online: https://www.ncei.noaa.gov/cdo-web (accessed on 20 August 2025).
- U.S. Environmental Protection Agency (EPA). EPA Open Data Portal. 2025. Available online: https://www.epa.gov/data (accessed on 20 August 2025).
- American Academy of Allergy, Asthma & Immunology (AAAAI). National Allergy Bureau (NAB) Pollen Data. 2025. Available online: https://www.aaaai.org/global/nab-pollen-counts (accessed on 20 August 2025).
- UK Biobank. UK Biobank Genotype and Phenotype Database. 2025. Available online: https://www.ukbiobank.ac.uk (accessed on 20 August 2025).
- American Gut Project. Microbiome Sequencing Data (EBI Accession ERP012803). 2025. Available online: https://www.ebi.ac.uk/ena/browser/view/ERP012803 (accessed on 20 August 2025).
- Kantar Media. Advertising and Consumer Panel Data. 2025. London, UK. Available online: https://www.kantar.com (accessed on 20 August 2025).
- Wesleyan Media Project. Kantar/CMAG Advertising Data for Political Research. 2025. Available online: https://mediaproject.wesleyan.edu (accessed on 20 August 2025).
- Begashaw, G.B.; Zewotir, T.; Fenta, H.M. A Deep Learning Approach for Classifying and Predicting Children’s Nutritional Status in Ethiopia Using LSTM-FC Neural Networks. BioData Min. 2025, 18, 11. [Google Scholar] [CrossRef] [Scilit] [PubMed]
- Kumar, D.A.; Rao, B.T.; Rangaswamy, B.; Meghana, K. An Efficient Approach for Food Demand Forecasting Using an Ensemble Technique and Statistical Analysis. In Cognitive Computing and Cyber Physical Systems. IC4S 2024; Pareek, P., Mishra, S., Reis, M.J.C.S., Gupta, N., Eds.; Lecture Notes of the Institute for Computer Sciences, Social Informatics and Telecommunications Engineering; Springer: Cham, Switzerland, 2025; Volume 597. [Google Scholar] [CrossRef] [Scilit]
- Bhimavarapu, U.; Srinivasu, P.N. Enhancing Patient Data Clustering in Smart Healthcare: A Semisupervised Approach for Person-Centric HealthCare Treatment and Resource Optimization. In Enabling Person-Centric Healthcare Using Ambient Assistive Technology, Volume 2; Barsocchi, P., Naga Srinivasu, P., Kumar Bhoi, A., Palumbo, F., Eds.; Studies in Computational Intelligence; Springer: Cham, Switzerland, 2025; Volume 1191. [Google Scholar] [CrossRef] [Scilit]
- Logapriya, E.; Rajendran, S.; Zakariah, M. Hybrid Greylag Goose Deep Learning with Layered Sparse Network for Women Nutrition Recommendation During Menstrual Cycle. Sci. Rep. 2025, 15, 5959. [Google Scholar] [CrossRef] [Scilit] [PubMed]

Disclaimer/Publisher’s Note: The statements, opinions and data contained in all publications are solely those of the individual author(s) and contributor(s) and not of MDPI and/or the editor(s). MDPI and/or the editor(s) disclaim responsibility for any injury to people or property resulting from any ideas, methods, instructions or products referred to in the content. |
© 2026 by the authors. Licensee MDPI, Basel, Switzerland. This article is an open access article distributed under the terms and conditions of the Creative Commons Attribution (CC BY) license.