


Abstract
Nowadays, longitudinal data are common—typically high-dimensional, large, complex, and collected using various methods, with repeated outcomes. For example, the growing elderly population experiences health deterioration, including limitations in Instrumental Activities of Daily Living (IADLs), thereby increasing demand for long-term care. Understanding the risk of repeated IADLs and estimating the trajectory risk by identifying significant predictors will support effective care planning. Such data analysis requires a complex modeling framework. We illustrated a regressive modeling framework employing statistical and machine learning (ML) models on the Health and Retirement Study data to predict the trajectory of IADL risk as a function of predictors. Based on the accuracy measure, the regressive logistic regression (RLR) and the Decision Tree (DT) models showed the highest prediction accuracy: 0.90 to 0.93 for follow-ups 1–6; and 0.89 and 0.90 for follow-up 7, respectively. The Area Under the Curve and Receiver Operating Characteristics curve also showed similar findings. Depression scores, mobility score, large muscle score, and Difficulties of Activities of Daily Living (ADLs) score showed a significant positive association with IADLs (p < 0.05). The proposed modeling framework simplifies the analysis and risk prediction of repeated outcomes from complex datasets and could be automated by leveraging Artificial Intelligence (AI).
1. Introduction
With the increase in life expectancy, the older adult population in many developed countries is rising. The estimated global population aged 65 and older is projected to reach 2.2 billion by the late 2070s [1]. Older adults often experience a decline in their health, as well as limitations in performing ADLs and IADLs. This increases demand for long-term care and increases the necessity for health management interventions [2,3,4,5,6]. Providing effective care for this population will be a tremendous challenge. Recent advances in wearable technology encompass electronic devices worn on the body that support various functions, including capturing longitudinal health data for monitoring, facilitating communication, enhancing convenience, and enabling personalized healthcare. A variety of these devices can be used to track health and fitness, enable communication, assist with navigation, deliver entertainment, support workplace tasks, and enhance healthcare services. For example, studies have reported the use of smart homes for remote monitoring of fall detection, prediction of health outcomes, and IADLs in older adults with cognitive impairment [7,8,9,10,11]. Digital technology has become an integral part of IADLs and ADLs for data capturing and analysis [12]. Using such technology, older adults can maintain their independence in their homes, thereby supporting their health management [13]. Aggregated data from various wearable devices in the healthcare and life sciences fields are used by stakeholders, such as researchers, to determine a patient’s condition and provide guidance or remedial recommendations. A recent study reported that mobile electronic devices might motivate patients to seek information on chronic conditions and medications [14]. People are increasingly inclined toward advanced wearable devices that provide greater functionality and support their daily activities [15]. The Internet of Things (IoT) provides connectivity for these devices to the Internet, and data can be stored in databases on central or distributed servers. Using statistical, ML, predictive analytics models, and AI, it is possible to identify patterns in vital signs to predict potential health risks or the future course of disease [16,17,18].
Wearable sensor technology has become increasingly accessible to a wide range of people [15]. Real-time data on a person’s health conditions are available, enabling the management and monitoring of chronic disease progression in older adults during rehabilitation and in individuals with various disabilities [19]. These technologies enable longitudinal data capture, which is useful for identifying complex patterns in diseases of interest. Health systems must first address data management challenges to achieve benefits for patients and providers [20]. Specifically, the areas of use include biosensors, smartwatches, and smart clothing, as well as the integration of AI and ML for data analysis [21]. The increased use of wearable devices will generate a substantial volume of data. Various stakeholders need to use these data for purposes such as patient treatment, patient education, compliance with physicians’ recommendations, and research. A recent study reported that, nowadays, it may be more common to share patient-generated data from wearable devices [22]. However, due to their strict privacy policy, data from wearable devices may not be accessible to researchers or other users.
IADLs require cognitive and motor complexity, and involve interaction with the surrounding social environment. ADLs are survival and self-care activities that play a crucial role in the health status, well-being, and the avoidance of dependence [16,19,23,24]. Because IADLs involve motor, cognitive, or social functions, their performance is considered a direct index of health status. Trajectory analysis and risk prediction for the outcome of interest, using available risk factors, could be used to identify intra- and inter-individual variability in longitudinally collected wearable device data or cohort study datasets. This trajectory can be used to describe the course of an outcome over age or time, given the available risk factors [25,26,27,28,29,30,31,32,33]. By analyzing and identifying significant factors, clinicians can assess whether a patient is at high risk of severe or rapid disease progression and draw informed conclusions about actions and interventions aimed at controlling disease progression risk [34,35,36,37,38].
We are interested in
- (i)
- Predicting the risk of IADLs (yes or no) for a patient at a wave, given the risk factors and the history of IADL status (i.e., estimating conditional probability);
- (ii)
- Predicting the risk of IADLs over a sequence of waves given the risk factors and the history of IADLs observed over various waves (i.e., the joint probability or trajectory risk);
- (ii)
- Examine the relationship between IADLs from previous waves and current waves in terms of risk factors or covariates of interest;
- (iv)
- Predicting the IADL status for the next wave, given the risk factors and the history of IADLs (i.e., predicting future states of the IADLS;
- (v)
- Measuring main and interaction effects of risk factors, between risk factors and historical IADL status, and historical IADL status between waves.
Predicting a patient’s risk of IADLs, given the risk factors, is essential for clinicians. The probability of 0.85 for developing IADLs, compared with 0.51, has a significant consequence: both would classify the IADL status as positive at the 0.50 probability threshold. Therefore, the goal is to identify a model that more accurately predicts the risk of developing IADLs. Using predicted risk at a given wave and across waves, healthcare professionals may screen patients to recommend necessary therapy and preventive measures. This predicted trajectory risk may also inform patients about the future course of the disease [38] and help them adhere to clinicians’ guidance.
The objectives of this research are as follows: Firstly, to propose a modeling framework for analyzing repeated-measures data collected through various methods; we are interested in predicting the trajectory risk of repeated outcomes (e.g., IADLs) based on the significant predictors. Secondly, aiding healthcare professionals in using these data-derived analytical results to guide patients in adhering to the recommendations provided. The remaining sections of this paper are as follows: Section 2 presents the materials and methods, data description, models, and trajectories employed; Section 3 describes the results; Section 4 discusses the findings; Section 5 presents the conclusions; and finally, Section 6 details the limitations.
2. Materials and Methods
2.1. Datasets and Ethics
2.1.1. Data Sources
Our motivation came from the Health and Retirement Study (HRS) dataset, a longitudinal cohort study initiated in 1992. Data on more than 1000 variables are collected every two years from individuals aged 50 and older in 23,000 households in the USA [39]. This longitudinal study was conducted to build a national data resource to examine the changing health and economic circumstances associated with aging at both the individual and population levels [40].
2.1.2. Cohort Characteristics
In the late 1980s, the National Institute on Aging (NIA) recognized the need for a data resource to support research on the necessary adjustments to health policies in response to challenges posed by changes in age composition. The original sample comprises in-home, face-to-face interviews conducted in 1992 with individuals aged 51–61 and their spouses. In the baseline (wave one) data from the HRS cohort, 12,652 subjects were interviewed. Out of all these subjects, 9762 were age-eligible (those with birth years 1931–1941) [39,40].
2.1.3. Disease Course Risk or Trajectory Risk
Regarding disease course risk or trajectory risk, we refer to the probability of specific outcomes and the disease’s progression, as well as the overall severity of a disease/condition in a patient. This involves applying data analysis and modeling techniques to identify potential patterns in disease progression and to predict an individual’s future health outcomes and associated risks. Understanding the temporal sequence of diseases and stratifying patients into risk groups to inform prevention and management strategies are also part of this process.
2.1.4. Institutional Review Board (IRB) Approval
Institutional Review Board Statement: The study was approved by the University of Michigan Health Sciences and Behavioral Sciences Institutional Review Board (IRB Protocol No.: HUM00061128), approved through 18 October 2018. Informed Consent Statement: Informed consent for participation was obtained from all subjects involved in the study.
2.1.5. Missing Data Handling
Missing data are common in follow-up studies due to withdrawal, loss to follow-up, or other reasons. The same is true for the HRS dataset. For simplicity, we used complete cases for each wave. It is clear from Table 1 that the sample size decreases over the waves. However, in our proposed modeling framework, one can readily apply all appropriate techniques for handling missing data. It is natural to include new variables in subsequent follow-ups, as in the HRS study. Our proposed framework can incorporate unequal covariates for each follow-up, which can be accommodated with additional programming tasks.
Table 1.
Frequency distribution (N) of IADLs from wave 1 to wave 7.
2.2. Data Description
The HRS is a large, complex, high-dimensional longitudinal study. The IADLs include a series of questions about limits on IADLs. These yes/no-type measures include using a phone, taking medications, managing money, shopping for groceries, preparing meals, using a map, using a calculator, using a microwave, and using a computer. Summing the results yields a score; for this paper, we converted the score to a binary variable (0 = no limitations; 1 = at least one limitation). We used the IADL variable from seven follow-ups (2002–2014) as the outcome variable to predict patient trajectory risk for specific covariate patterns (i.e., specific values of each risk factor). Though data for more recent waves are available, we did not use those because some of the covariates listed in Table 2 were not present at the earlier waves. Additionally, some were excluded from the questionnaires in later waves. To retain important, consistent covariates across all follow-ups, we used these specific waves of the datasets. First, we predicted both marginal and conditional probabilities, yielding trajectory risks for the conditional probabilities based on patients’ covariate patterns. Then, the sequence of conditional probabilities is linked with the marginal probability to estimate the trajectory of joint probabilities based on patients’ covariate patterns [27].
Table 2.
The name, categories, and description of predictors used in this research.
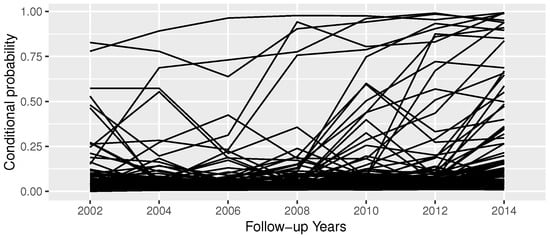
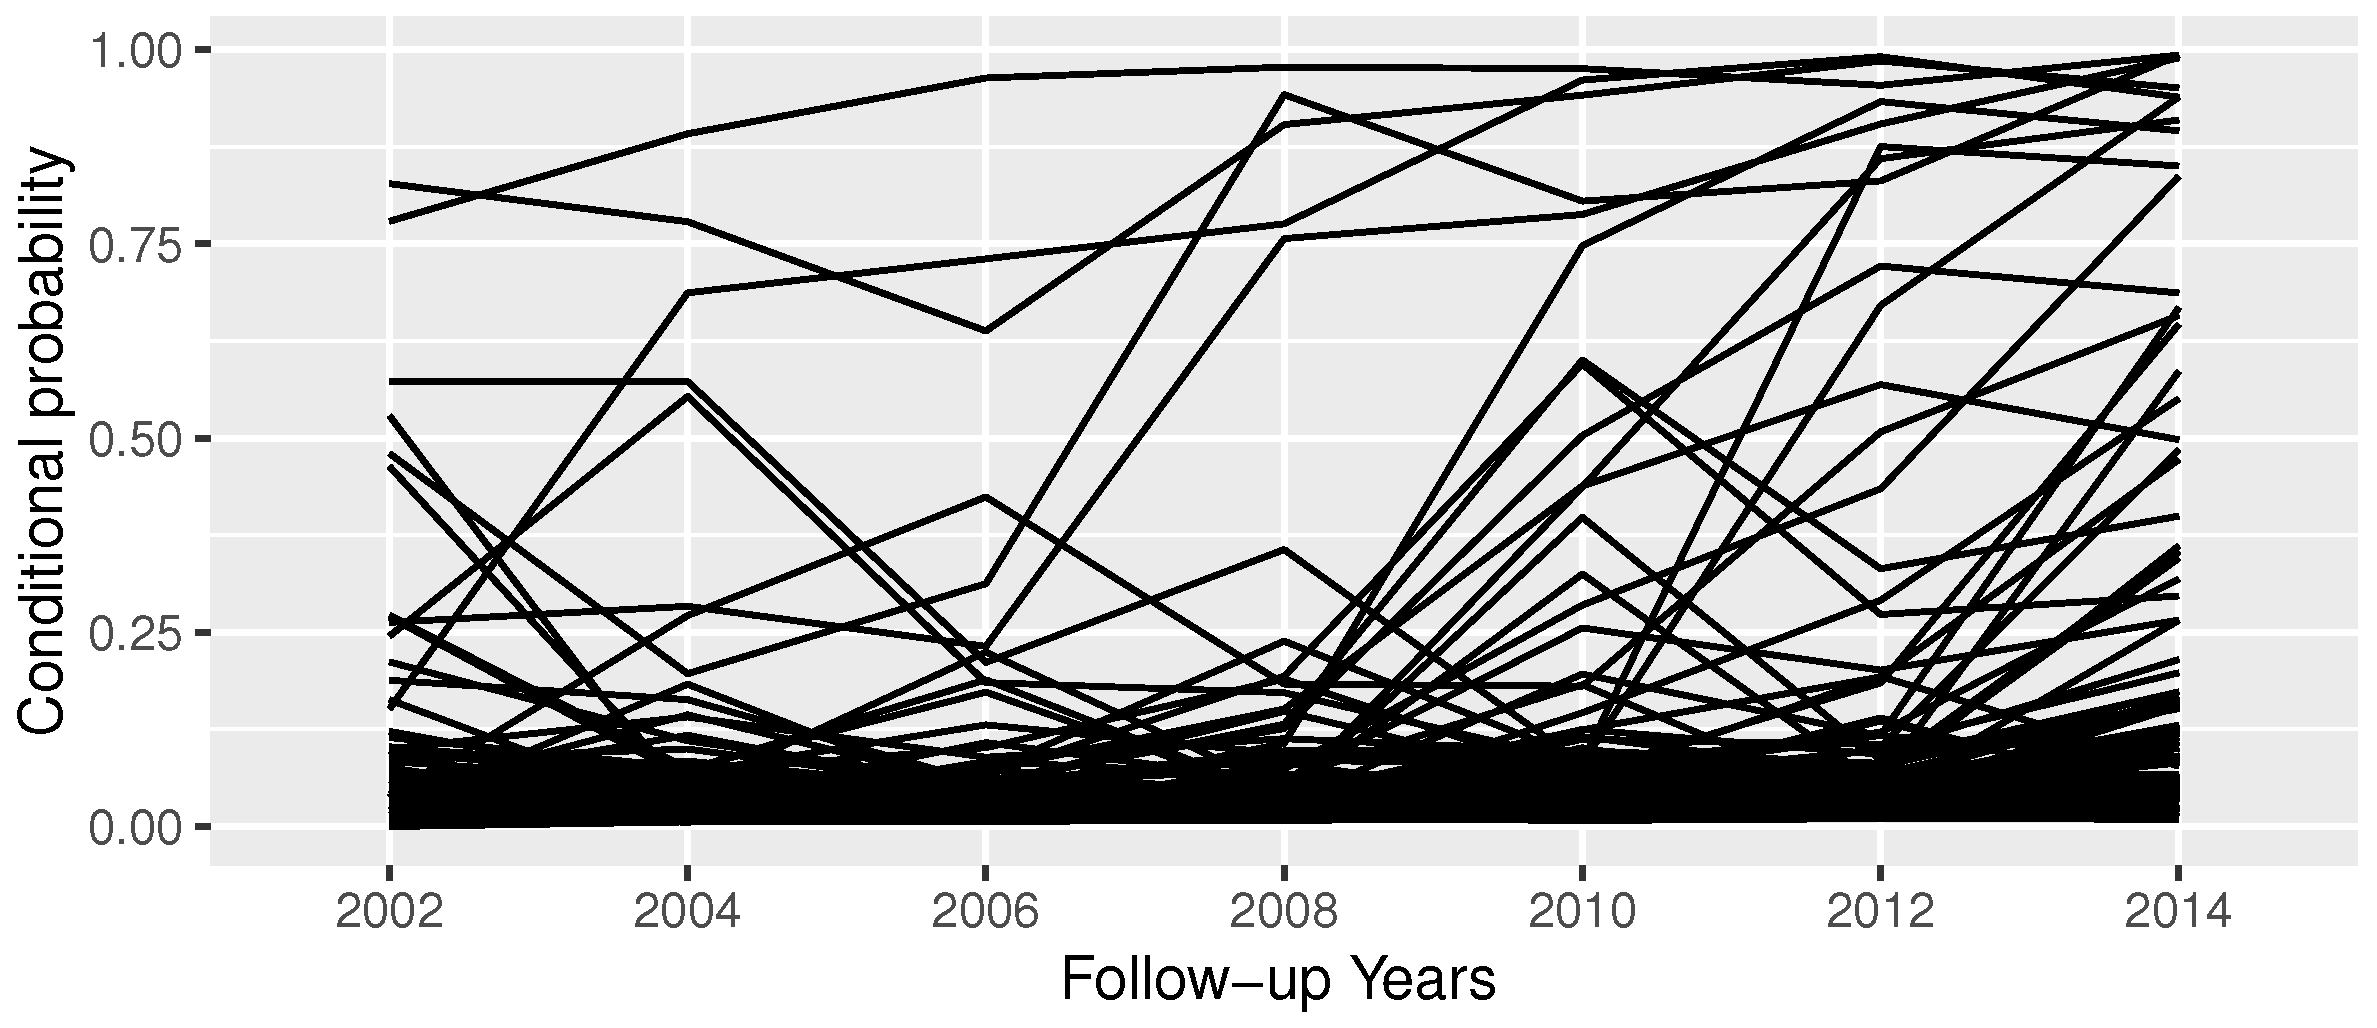
As an illustration, the following two figures present trajectories of conditional and joint probabilities. Figure 1 presents the trajectory risks of the conditional probabilities for several randomly selected respondents in the dataset. This figure answers point (i) posed at the end of the Introduction section: predicting the trajectory risk of conditional probabilities for several elderly individuals. The trajectory risks using conditional probabilities will be useful to understand disease progression within a subgroup. For example, we expect that the trajectory risks would be much higher for a subject who had IADLs in the previous follow-up(s) compared to a subject without any IADLs in previous follow-up(s). It is worth noting that conditional probabilities are estimated using a reduced sample based on the previous follow-up IADL categories, whereas the marginal probability is calculated using the entire sample from the first follow-up.
Figure 1.
Sample trajectory of conditional probabilities for a portion of selected elderly individuals.
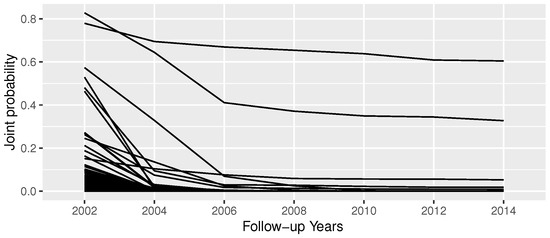
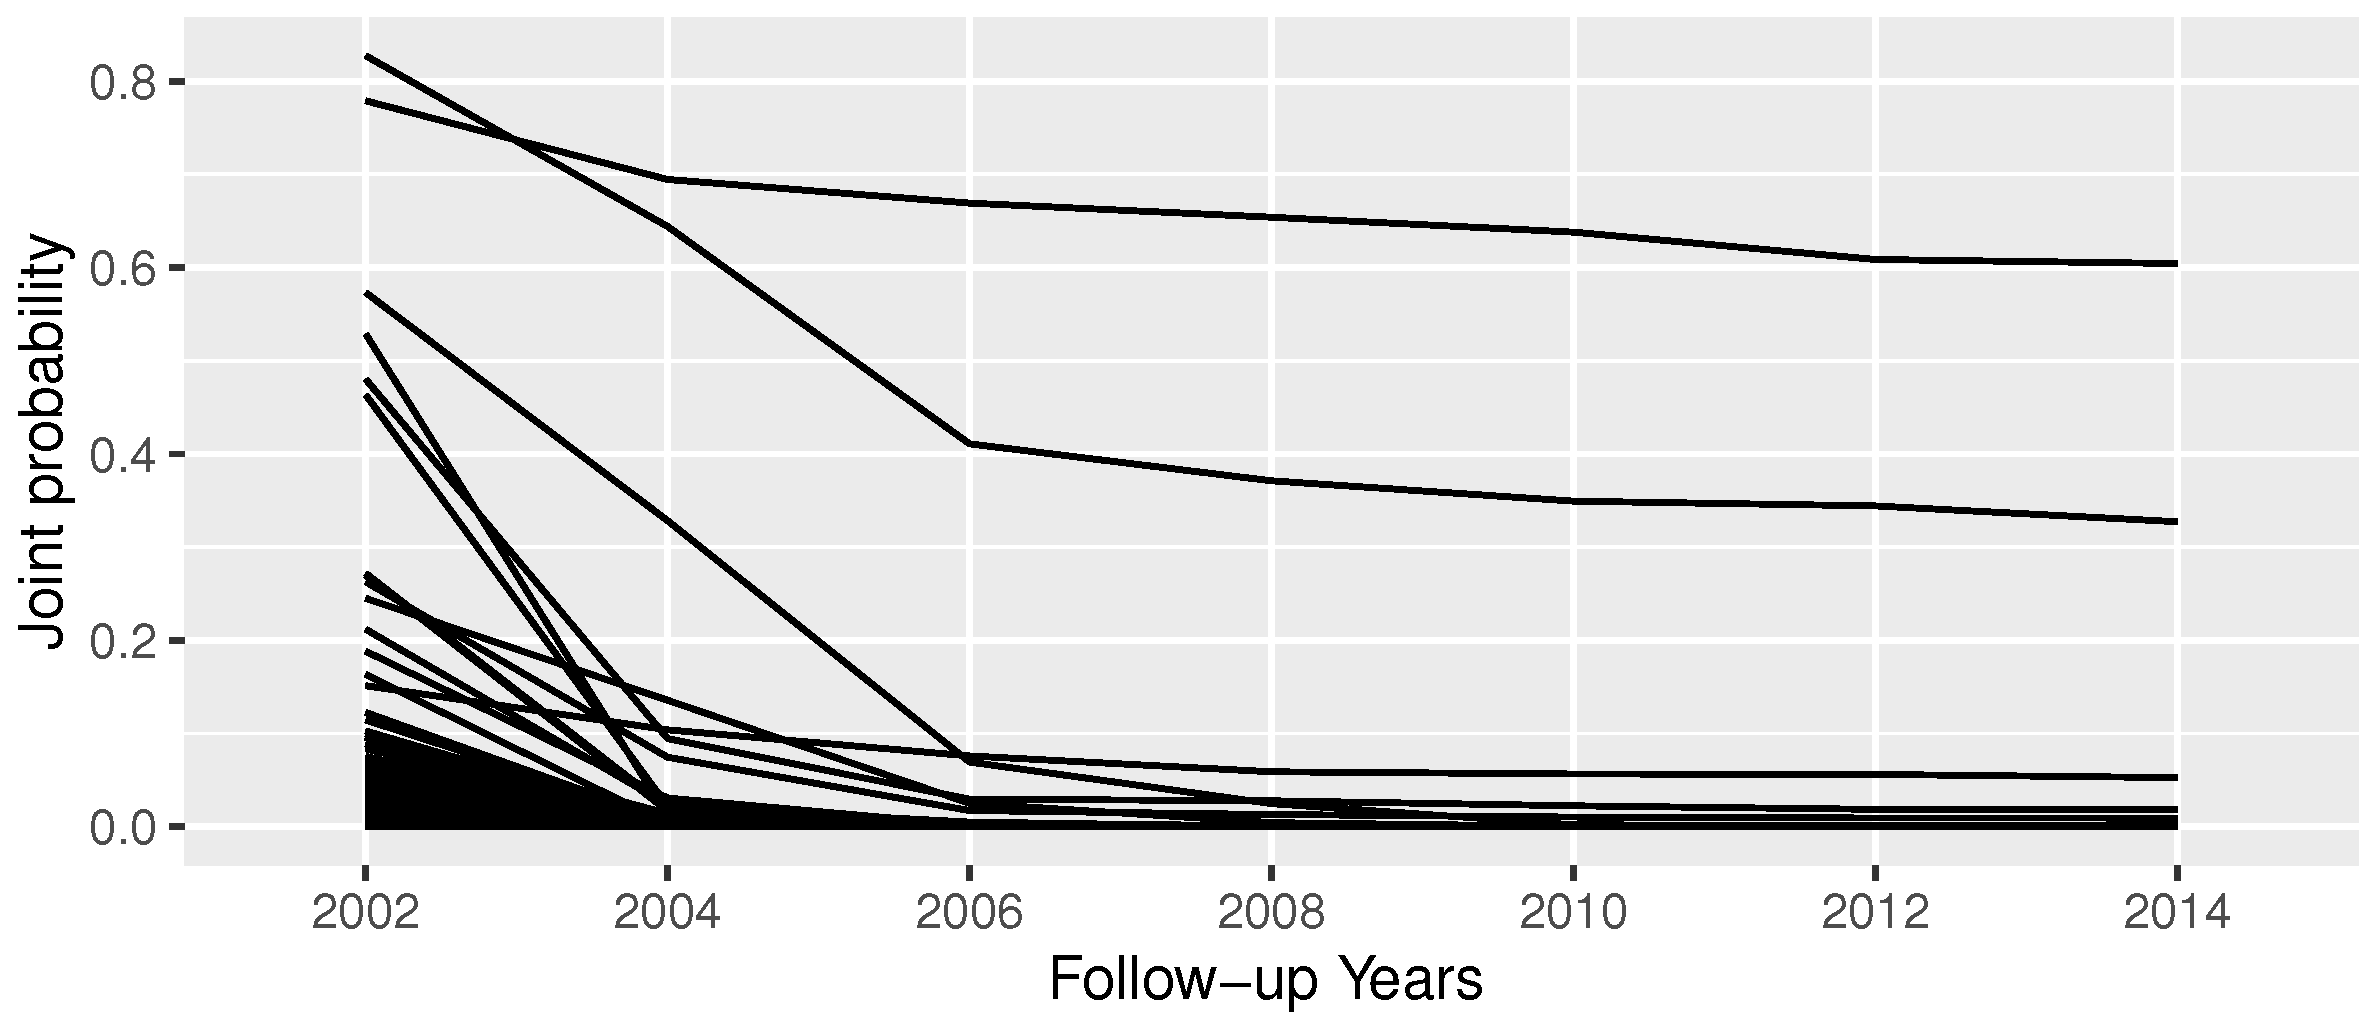
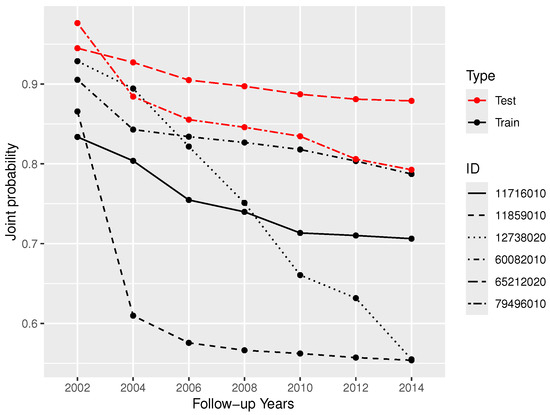
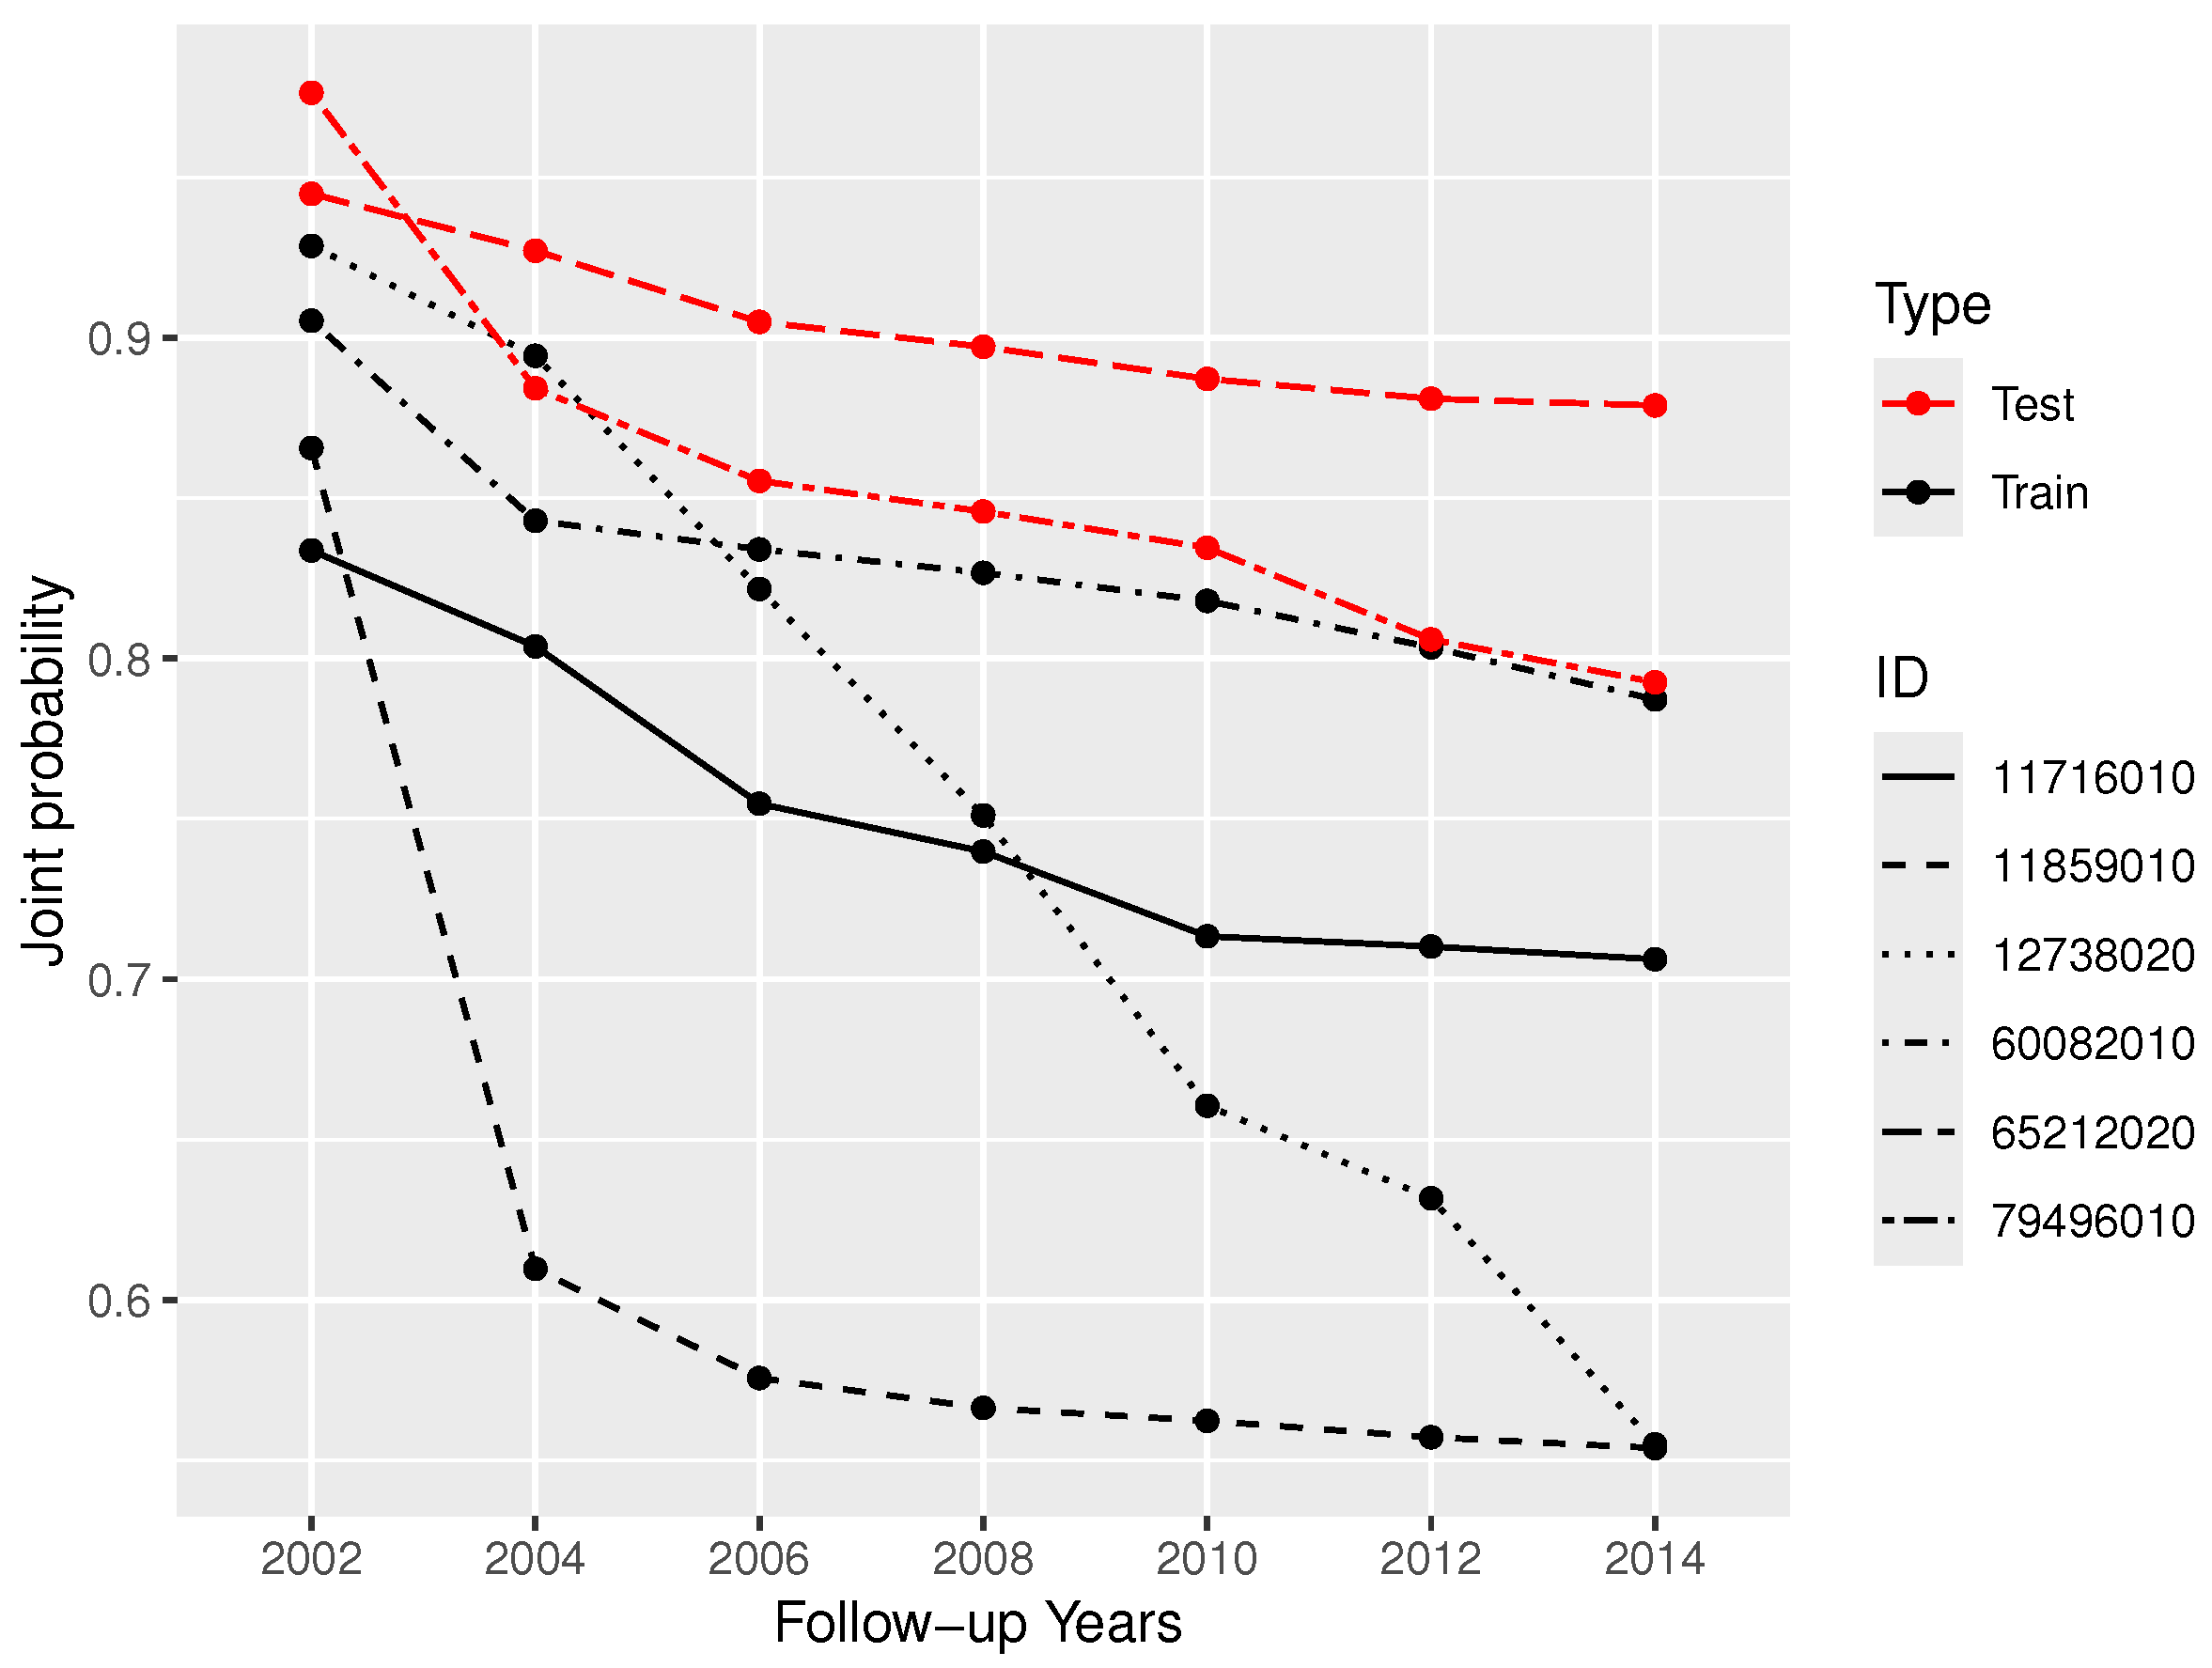
Figure 2 displays the trajectories of joint probabilities of the same set of elderly individuals as shown in Figure 1. This figure provides an answer to point (ii) posed at the end of the Introduction section: predicting the trajectory risk of joint probabilities for the same elderly individuals shown in Figure 1. Naturally, the joint probabilities are smaller than the conditional probabilities because joint probabilities represent the full sample. This is because for an individual, the multiplication of conditional probabilities (proportions) from previous waves with the absence of IADLs will always be less, and the joint probabilities will be reduced.
Figure 2.
Sample trajectory of joint probabilities for a group of selected elderly individuals.
For this research, we used the public longitudinal dataset from the Health and Retirement Study, in the USA, which is produced and distributed by the University of Michigan with funding from the National Institute on Aging [39]. As mentioned earlier, we used the datasets from 2002 to 2014 from seven follow-ups (Waves) designated as Wave 1 to Wave 7. Table 1 presents the frequency distribution of IADLs from all seven follow-ups. The Yes category of IADLs is coded as 1 and the No category as 0. These seven outcomes are denoted as to , respectively. It should be noted that the sample sizes decrease with increasing follow-ups, which is common for follow-up studies, as there could be withdrawals, deaths, and losses to follow-ups.
Table 2 describes the risk factors (features) used in this study. Through a comprehensive review of the recent literature and the availability of the variables in HRS datasets, we selected the covariates for our analysis. The variables name, type, clinical relevance, and related references are summarized in Table 3.
Table 3.
List of clinically relevant references of selected predictors in this research.
Training and Test Data
For model validation purposes and to check the generalizing ability, we divided the data into two sets: training data (70% of the sample) and the remaining 30% as the test data. We then fit the models using only the training data. We expect the fitted models using training data to predict the outcomes using the test data with similar accuracy. If this is the case, then the model generalizability is good for new data that is unseen by the fitted models. The mean age of the respondents, both for training and test data, is shown in Table 4.
Table 4.
Mean age of elderly by training and test data.
2.3. Trajectory and Models
The advantage of longitudinal data is that we can observe how individual responses change over time [59]. It was also concluded that this must generally be conditioned on the previous history of a subject. Lee and Nelder [60] concluded that the conditional models are of fundamental interest, and marginal predictions can be made from conditional models. Subject-specific models can be another alternative by considering the random effects and by allowing random effect terms in the linear predictor [61]. We are interested in estimating the trajectory risk from the repeated binary outcomes with covariates. In other words, we need to estimate the joint probabilities for all the follow-ups. Chowdhury and Islam [27] proposed the prediction of joint probabilities by linking the margin and sequence of conditional probabilities using the Markov chain for multinomial outcomes.
First, we define some notations: let be the response for the i-th subject at j-th follow-up , and be the number of follow-ups for subject i. For simplicity, subscript i will be omitted henceforth unless explicitly specified. Assume follows a binomial distribution where . For the trajectory, the joint probability mass function of in the presence of covariates with is . To estimate all these probabilities, we need a multivariate logistic regression model, which can handle the dependence among the repeated outcomes (i.e., IADLs). However, such models for a large number of repeated outcomes are not available. Alternatively, the above joint probability mass function can be expressed as a product of the marginal and conditional probability mass function for given values of the covariate as follows:
where is the marginal probability function of ;
is the probability function of ;
is the probability function for ,;
is the probability function of .
The joint probabilitiy of the left-hand side of Equation (1) is defined as
The right-hand side of Equation (1) allows us to estimate each of the probabilities as univariate cases without any need for a multivariate model. As the IADLs are binary, we can use logistic regression to measure covariate impact on outcomes. Marginal probabilities can be estimated from the fitted marginal model from the first follow-up. Conditional probabilities can be estimated by fitting univariate models after data stratification. However, as the number of follow-ups increases, the number of models required to fit will increase exponentially. To avoid this problem, we can use the regressive models for multivariate multinomial outcomes proposed by Chowdhury and Islam [27]. The regressive models allow the use of previous outcomes as covariates along with the variables and require fitting only one model for each follow-up. This can be done by using a special data structure (long file format) for the data file. Then the required conditional probabilities can easily be estimated to obtain the joint probabilities for the trajectories. Below is our derived regressive model, which is a special form of the regressive model for multinomial outcomes proposed by Chowdhury and Islam [27].
2.4. Regressive Logistic Model
The general form for the k-th order regressive logistic model using previous outcomes as covariates along with can be shown as
where are the coefficients of covariates and is the coefficient of previous outcomes , respectively.
The regressive logistic model supports standard hypothesis testing and related inferences. The predicted joint probability of a subject with covariate vector for a trajectory can be estimated using fitted regressive logistic models. For details, along with the required data file structure, interested readers are referred to the paper by Chowdhury and Islam [27]. The strength of the regressive modeling framework is that, instead of the regressive logistic model approach, one can easily use any other ML model for classification for a single outcome using the same data structure shown in Table A1. As the previous outcomes are used as a covariate in the regressive logistic models, we can answer question (iii) using the regressive logistic model in Equation (2). As the previous outcomes are used as a covariate in regressive logistic models, we can address point (iii) using the model in Equation (2). To answer the effect of the interaction between the previous outcomes and covariates in the model, one needs to use a fully parameterized model by extending the model in Equation (2). Compared to Markov models, a regressive logistic model fits only one model for each wave. It also reduces the multivariate problem to univariate cases. As this method uses a divide-and-recombine approach, it is very useful for big data that involves a large number of follow-ups and a huge sample size. Any other ML algorithms for classification can easily be used similarly to the regressive logistic regression model.
2.5. Machine Learning Models
Recently, ML models are increasingly used in various fields for classification and prediction. ML models also show high capabilities of increasing predictive power if only risk prediction is of interest. For example, Wu et al. [62] used logistic regression, Lasso, Support Vector Machine (SVM), and Artificial Neural Network (ANN) for predicting IADL trajectory risks. They observed good performance in predicting the IADL trajectory and suggested this could be used to personalize intervention measures. Garcia-Moreno et al. [24] used K-nearest neighbors (KNNs) to analyze IADL dependence in older adults using data from wearable devices during shopping. To determine subgroups within a given population and to better understand intra- and inter-individual variability in health outcomes, longitudinal pattern trajectory modeling was used [25]. ML algorithms for trajectory risk prediction were reported in different research studies [24,30,31,63]. All the available ML models for classification for a single outcome can fit within our regressive modeling framework by replacing logistic regression. Many of the ML models showed impressive classification accuracy in various papers. In the regressive modeling framework, along with logistic regression, we also employed some popularly used ML classifiers such as Decision Tree (DT), KNN, Naive Bayes (NB), Neural Network (NN), Random Forest (RF), and Support Vector Machine (SVM) for trajectory risk prediction and comparisons. We used a 13th Gen Intel(R) Core(TM) i9-13900H 2.60 GHz computer to fit all the models; using parallel programming, we used 12 cores out of 20. Table 5 presents the user, system, and elapsed time to fit all the models for all follow-ups. We can estimate the marginal and conditional probabilities from the fitted ML models needed for the trajectory risk prediction.
Table 5.
Model fitting statistics of CPU time used by different models.
The R Studio 2026.01.0 Build 392 package and the function used for fitting the models are fitted using the default hyperparameter settings of all the learning algorithms, i.e., no hyperparameter tuning was performed, as shown in Table 6. Certainly, the hyperparameter tuning for all the models may help to select the best model and increase prediction accuracy.
Table 6.
Default hyperparameter setting, version of R-libraries used for different models.
2.6. Data Preparation
Table A1 presents the file structure, including data for a subject. The first column in the table is the subject ID, and the second column is the outcome variable IADL, as described earlier. Starting from the third column, X1 up to column 21 (with the heading X19) are the predictors. The variable descriptions are provided in Table 2. The column labels Y1 to Y7 are the previous outcomes added after the predictors. For the first follow-up (Wave 1), there are no data for Y1 to Y7, as there will be no previous follow-up. For the second follow-up, we have the data for Y1. Similarly, for the third follow-up, we have the previous two outcomes’ data (Y1 and Y2) and so on. The estimates of the marginal model are obtained based on the data from the first follow-up. The estimates for the first- and higher-order regressive models are based on the data from the second follow-up onward. The column ’Wave’ identifies the follow-up numbers, and the last column ’Type70’ (Training = 1, Test = 2) is for the training and test sample identification.
Appendix A Table A2 presents the sample R-codes for fitting regressive logistic regression models and risk prediction from all seven follow-ups. A similar structure is used for fitting all other ML models (R-codes not shown).
2.7. Methodological Flowchart for Entire Modeling Pipeline
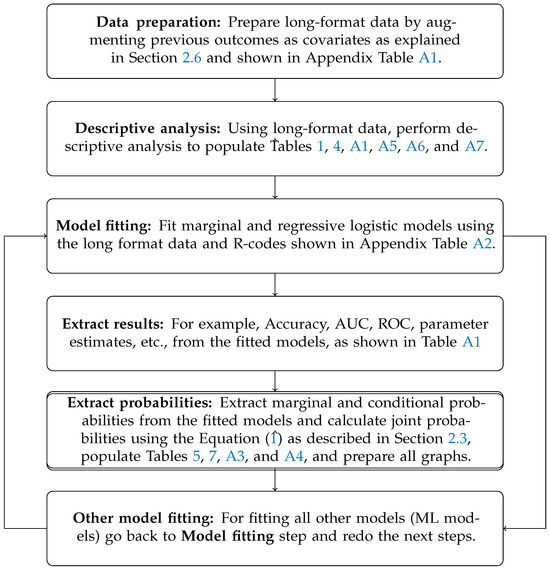
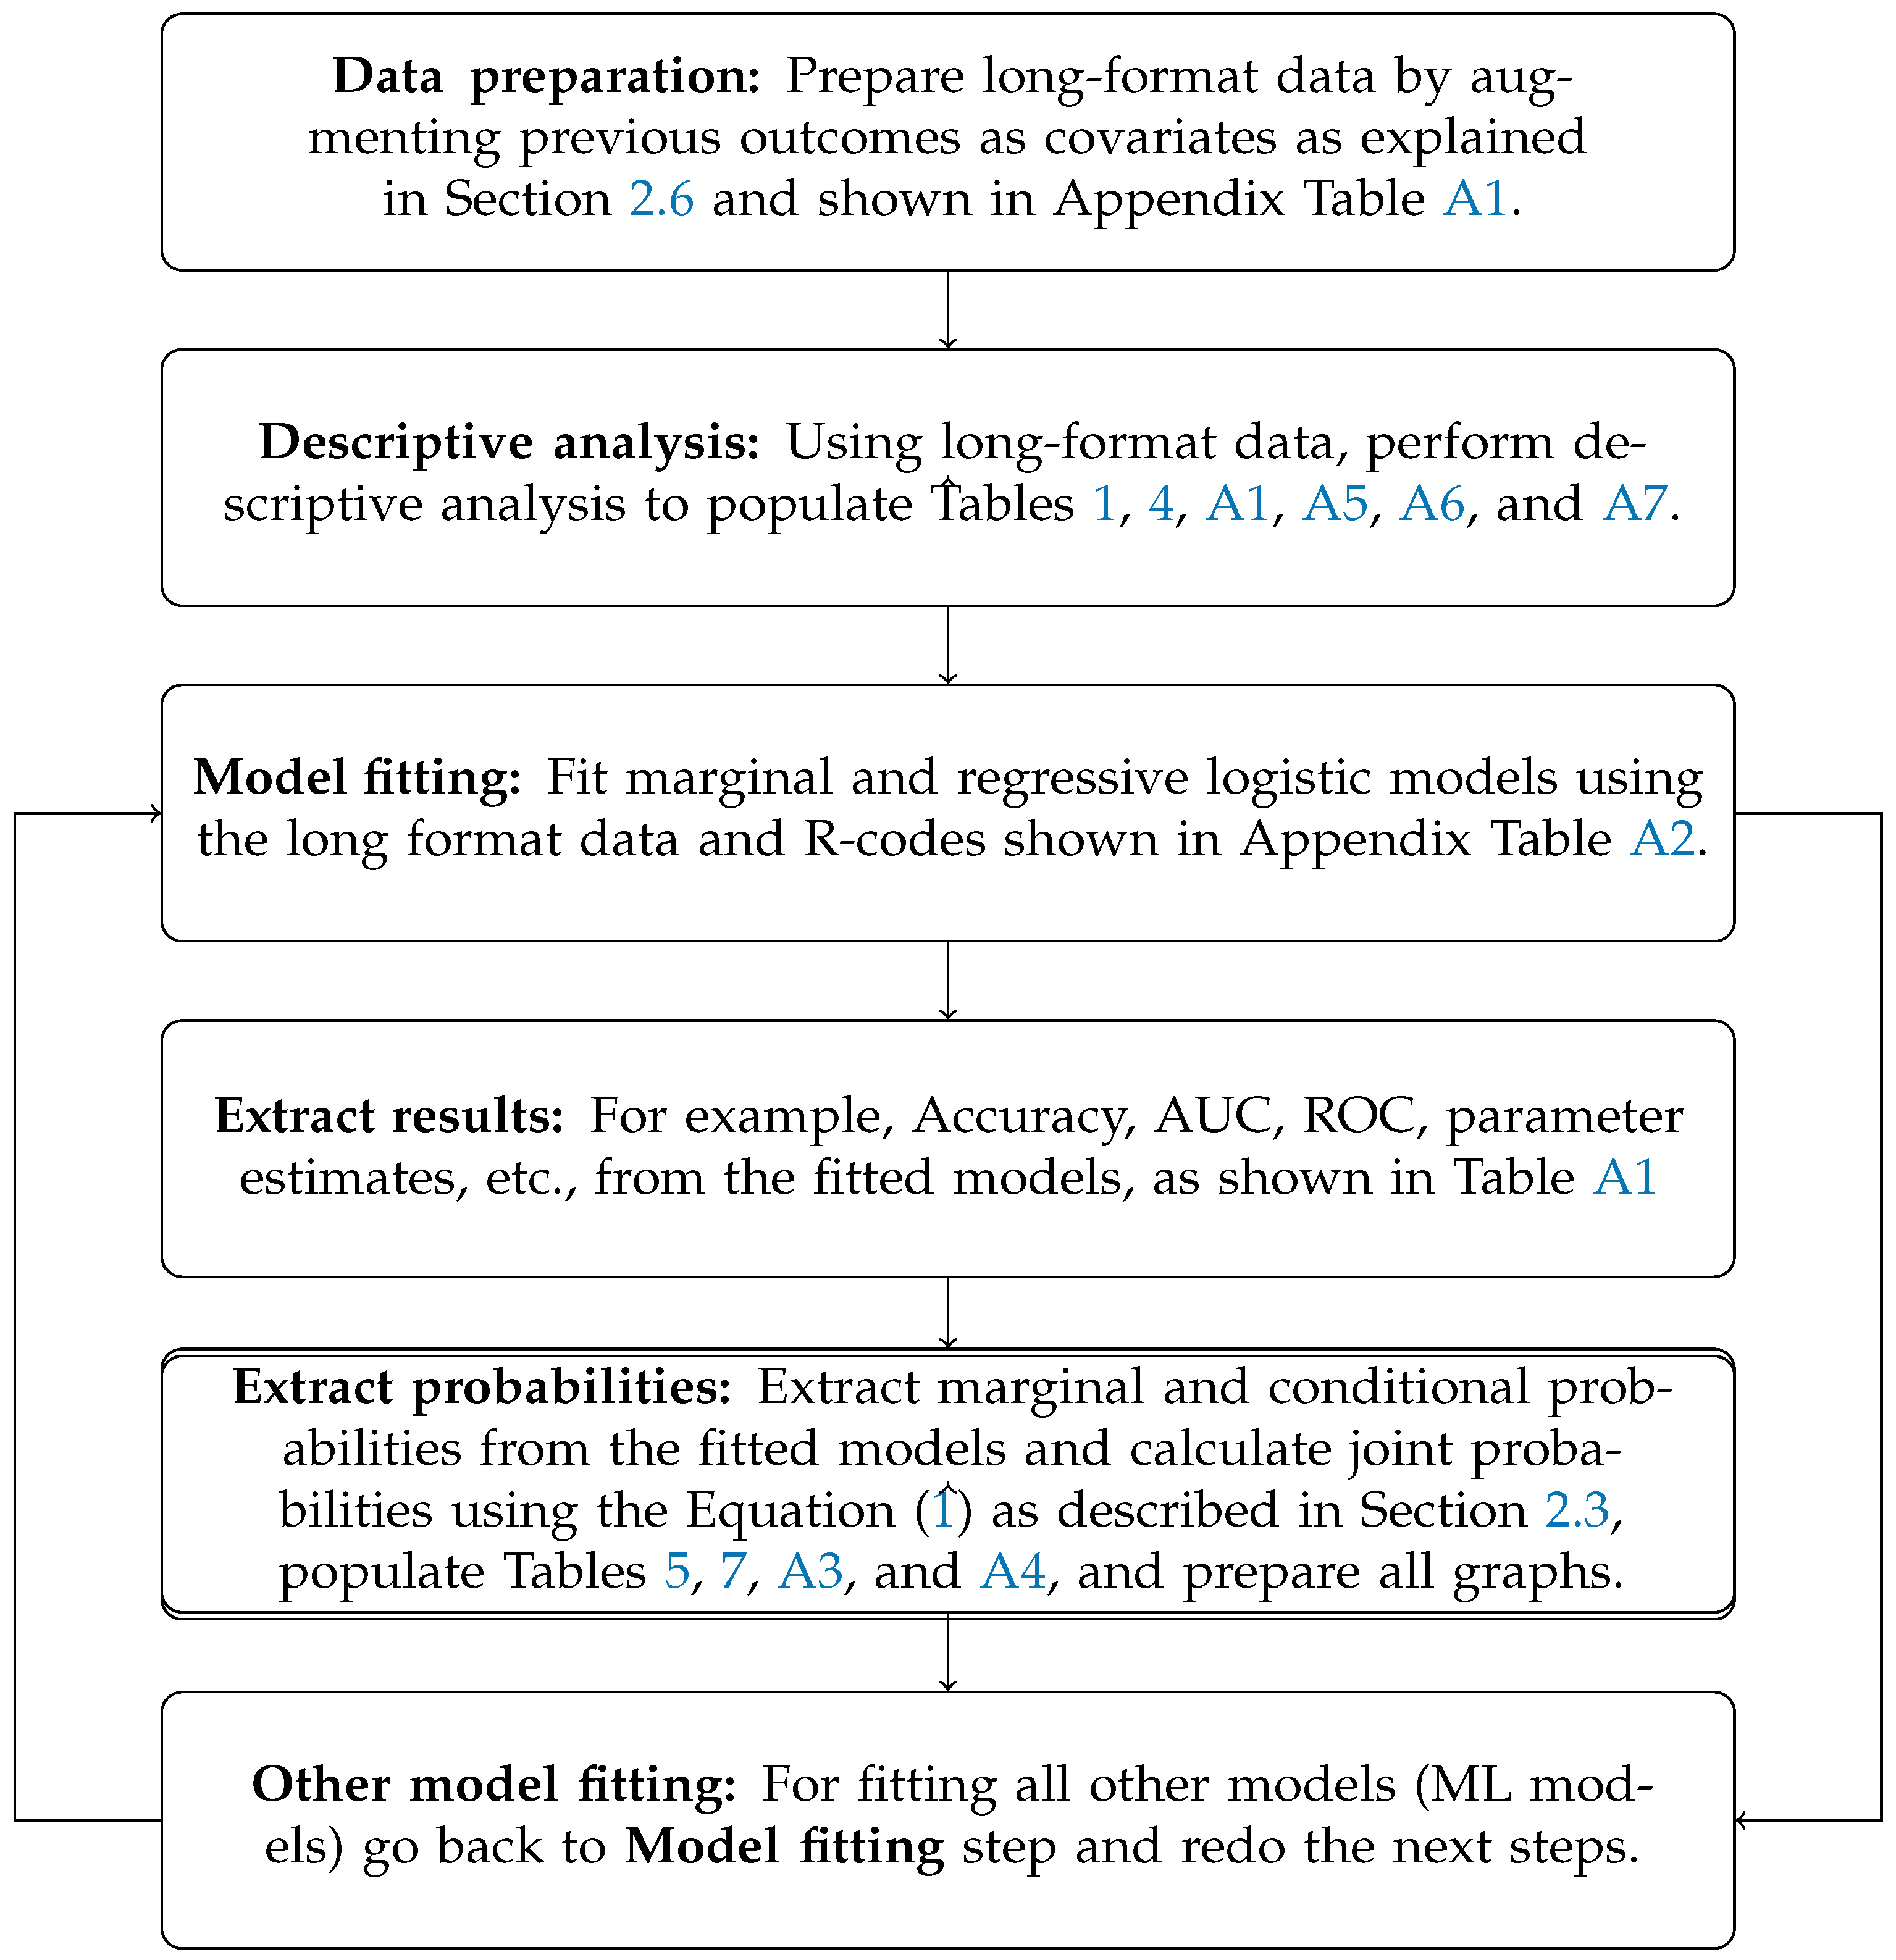
Figure 3 illustrates the entire modeling pipeline from raw data to model fitting, evaluation, and trajectory risk prediction.
Figure 3.
Flowchart for the entire modeling pipeline.
Table 7.
Accuracy and Area Under the Curve (AUC) for different models for Wave 1 to Wave 7 by training and test data.
3. Results
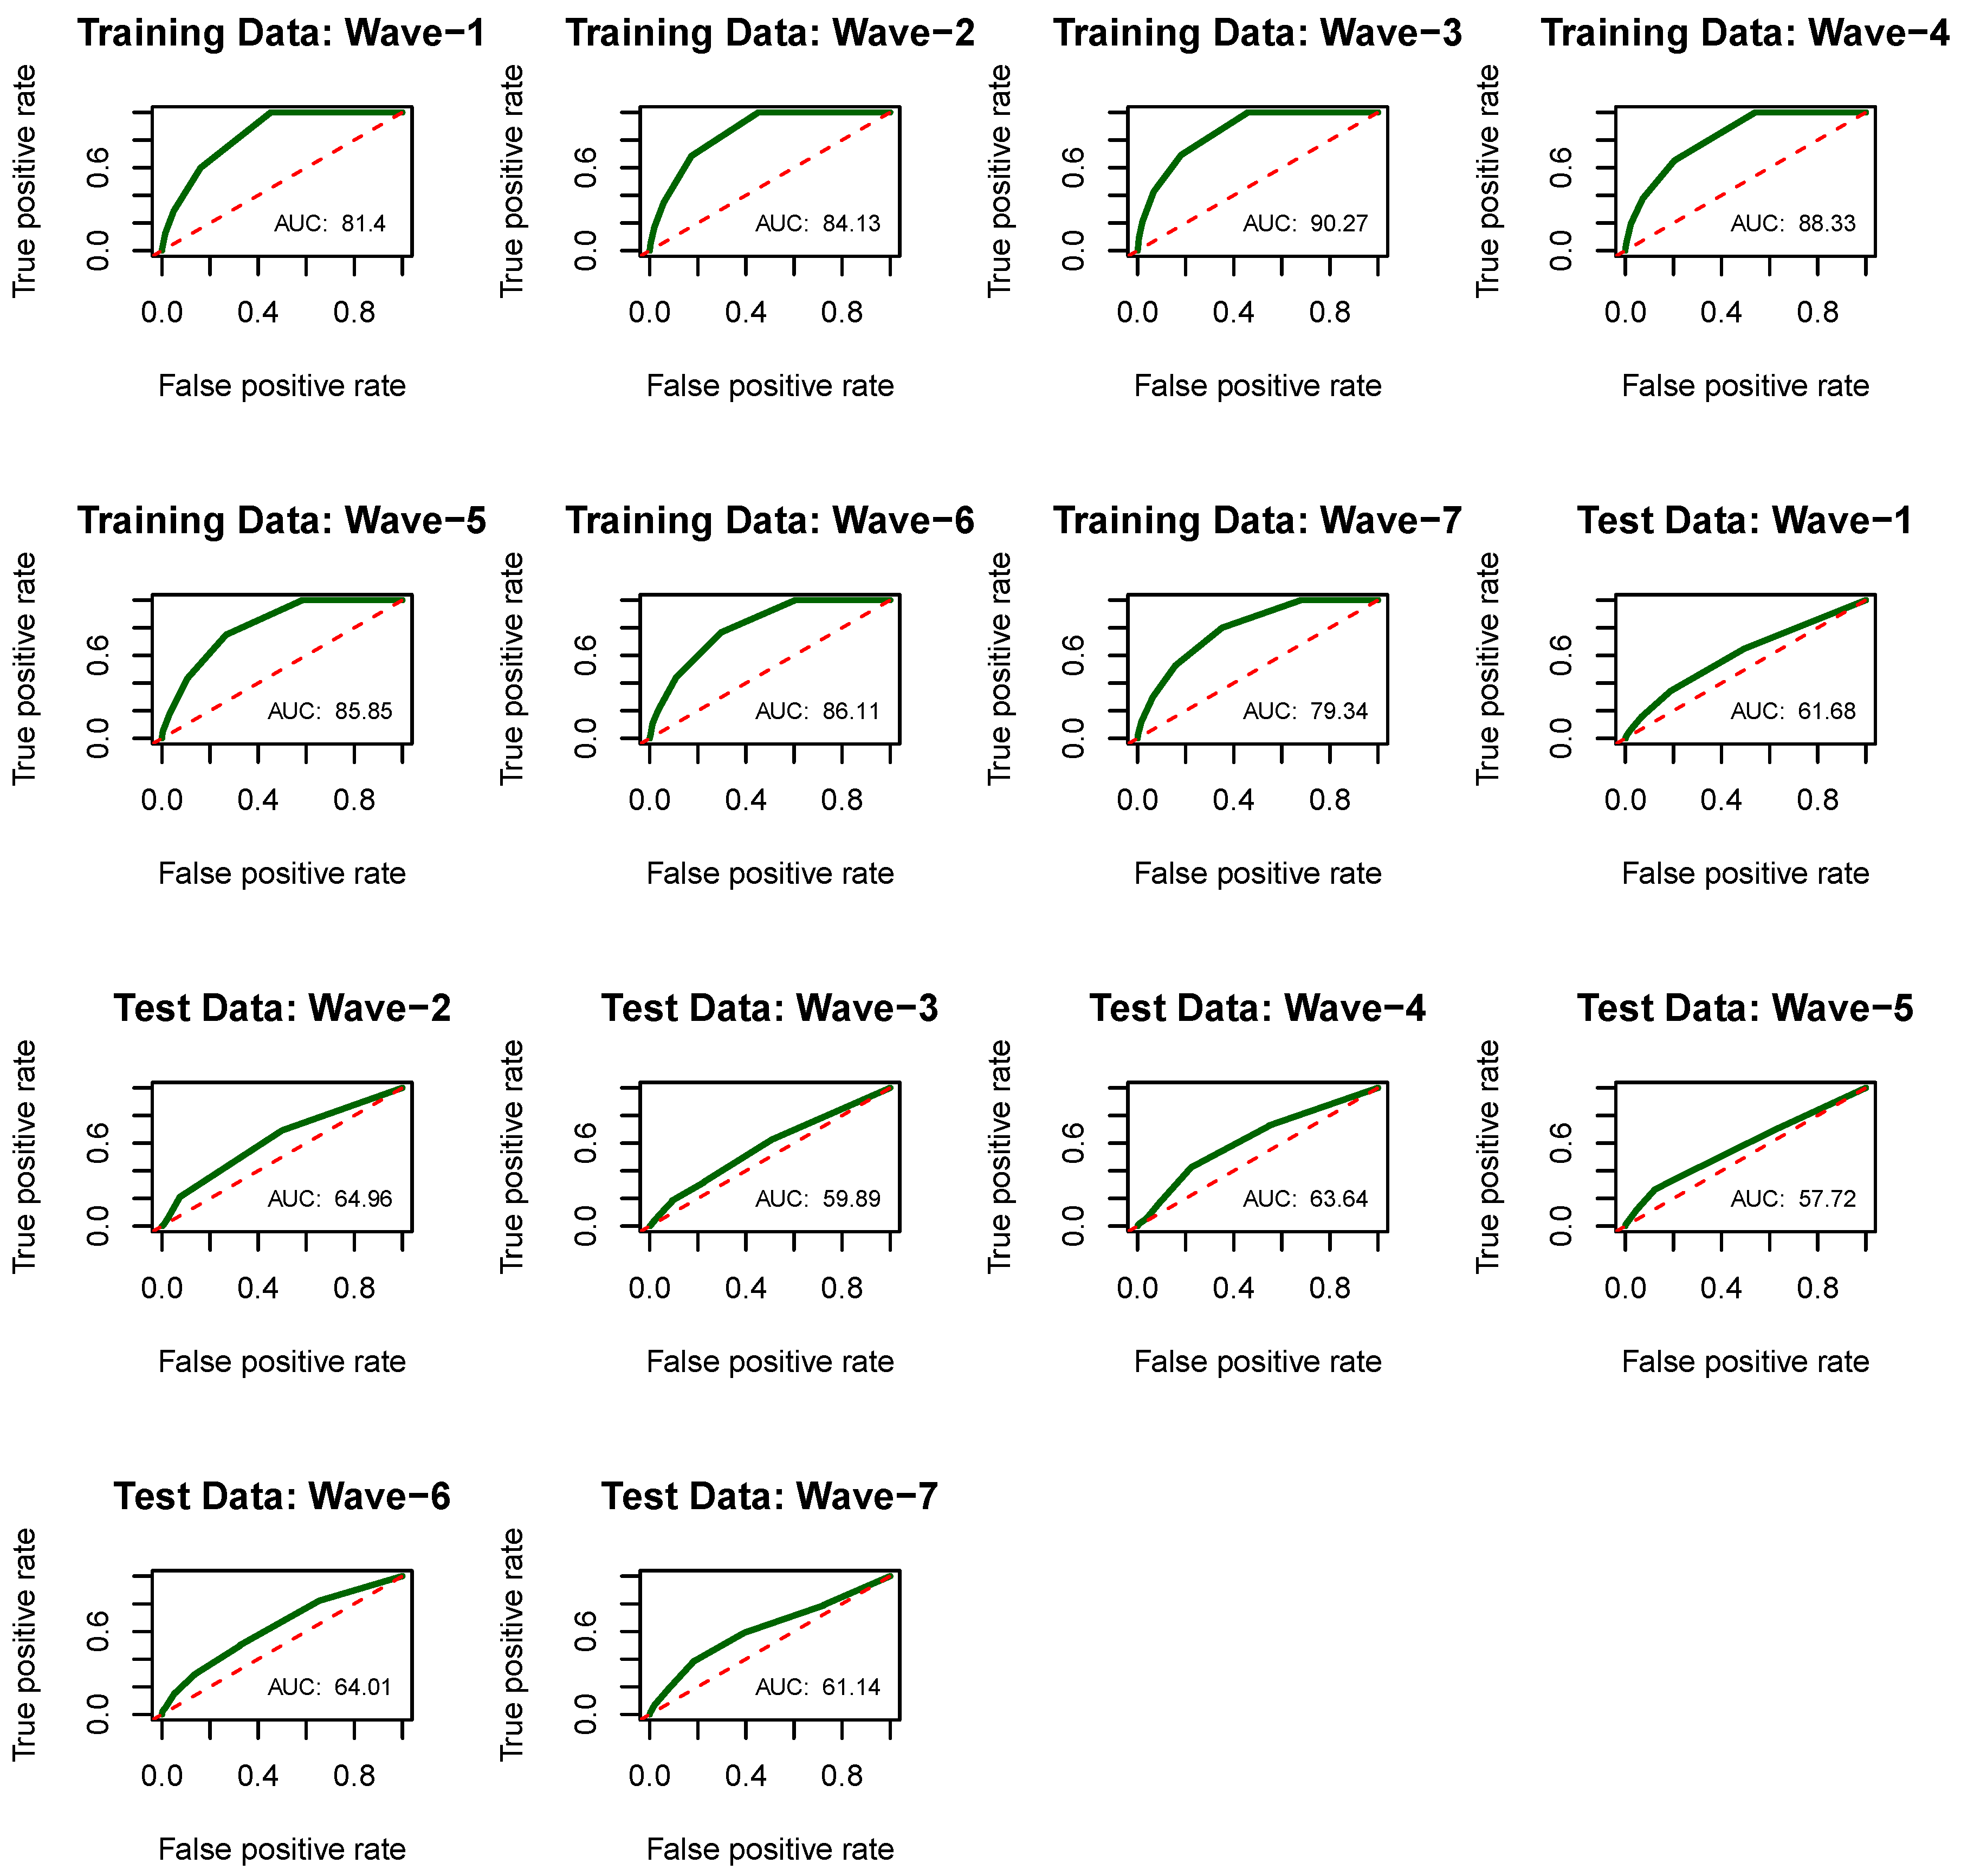
One needs to estimate the test error associated with a given statistical/ML method to evaluate its performance or to select the appropriate level of flexibility [64]. As noted earlier, we used various classifiers, and the data were divided into training (70%) and test (30%) sets for model validation and to assess the models’ generalization ability. Table 7 presents the classification accuracy and the Area Under the Curve (AUC) for all the models and follow-ups. It may be noted that the estimated risk was classified as without IADLs (0) if the predicted risk was less than 0.50 and with IADLs (1) if the predicted risk was ≥0.50. The Receiver Operating Characteristic (ROC) curve for the two highest performing models, such as regressive logistic regression and Decision Tree, and one of the bad performing models, KNN, is shown in Appendix A Figure A1, Figure A2 and Figure A3.
The results in Table 7 indicate that the prediction accuracy for the regressive logistic regression model varies between 0.89 and 0.93 from follow-up 1 to follow-up 7 data for both training and test data, with very close results for DT. Slightly reduced but close-to-equal results are obtained for KNN, NN, and NB in terms of training and test accuracy. Training and test accuracies for SVM and RF were, however, lower, around 0.80. However, training and test errors for SVM on the Wave 6 data were reduced to 0.24 and 0.25. Finally, both training and test accuracies were very close, indicating no over- or underfitting and strong generalization to unseen data.
Parameter estimates along with standard errors and p-values for marginal and first- to third-order regressive logistic models using Wave 1 to Wave 4 data are presented in Appendix A Table A3. Similarly, Appendix A Table A4 presents the fourth- to sixth-order regressive logistic models, using data from Waves 5 to 7. From these two tables, we can see that various covariates such as depression score (X6), difficulties of mobility measures score (X7), difficulties of large muscle measures score (X8), and difficulties of ADLs score (X9) are found to be significant (p < 0.05) and positively associated with the repeated outcomes (IADLs), with very few exceptions. A significant positive effect of variables X6 to X9 indicates that the risk of IADLs increases with higher scores on these covariates. A few other covariates—for example, any healthcare service utilization score (X10), number of previous conditions (X12), whether alcohol drinkers (X14), and immediate word recall score (X16)—showed significant positive or negative association with IADLs for some models.
Our results also indicate that responses from the recent past (e.g., Y1, Y2, Y3, Y4, Y5, Y6) had a significant positive effect on current responses (IADLs). For example, for the first-order regressive model (Wave 2 Model), second-order regressive model (Wave 3 Model), and third-order regressive model (Wave 4 Model), all previous outcomes (Y1, Y2, Y3) showed a significant positive impact on IADLs (Table A3). Our results also indicate that responses from the recent past (e.g., Y1, Y2, Y3, Y4, Y5, Y6) had a significant positive effect on current responses (IADLs). For example, for the first-order regressive model (Wave 2 Model), second-order regressive model (Wave 3 Model), and third-order regressive model (Wave 4 Model), all previous outcomes (Y1, Y2, Y3) showed a significant positive impact on IADLs (Table A3). In Table A4, for all three models (Wave 5 Model, Wave 6 Model, and Wave 7 Model), all three immediately preceding outcomes showed a significant positive association with IADLs, except for the Wave 6 Model, in which Y1 also showed a significant positive association. This means the IADL’s problem from previous follow-up(s) increases the risk of current IADLs significantly. Also, we cannot perform hypothesis testing for the ML algorithms.
3.1. Trajectory
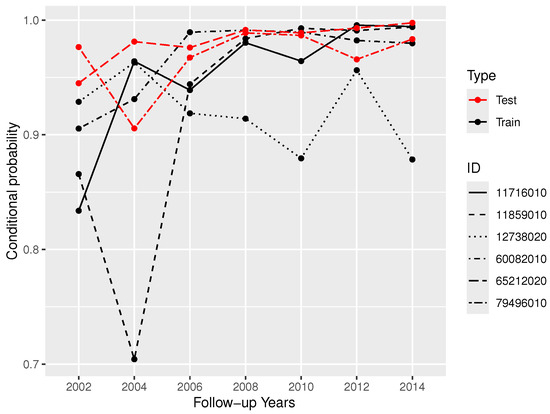
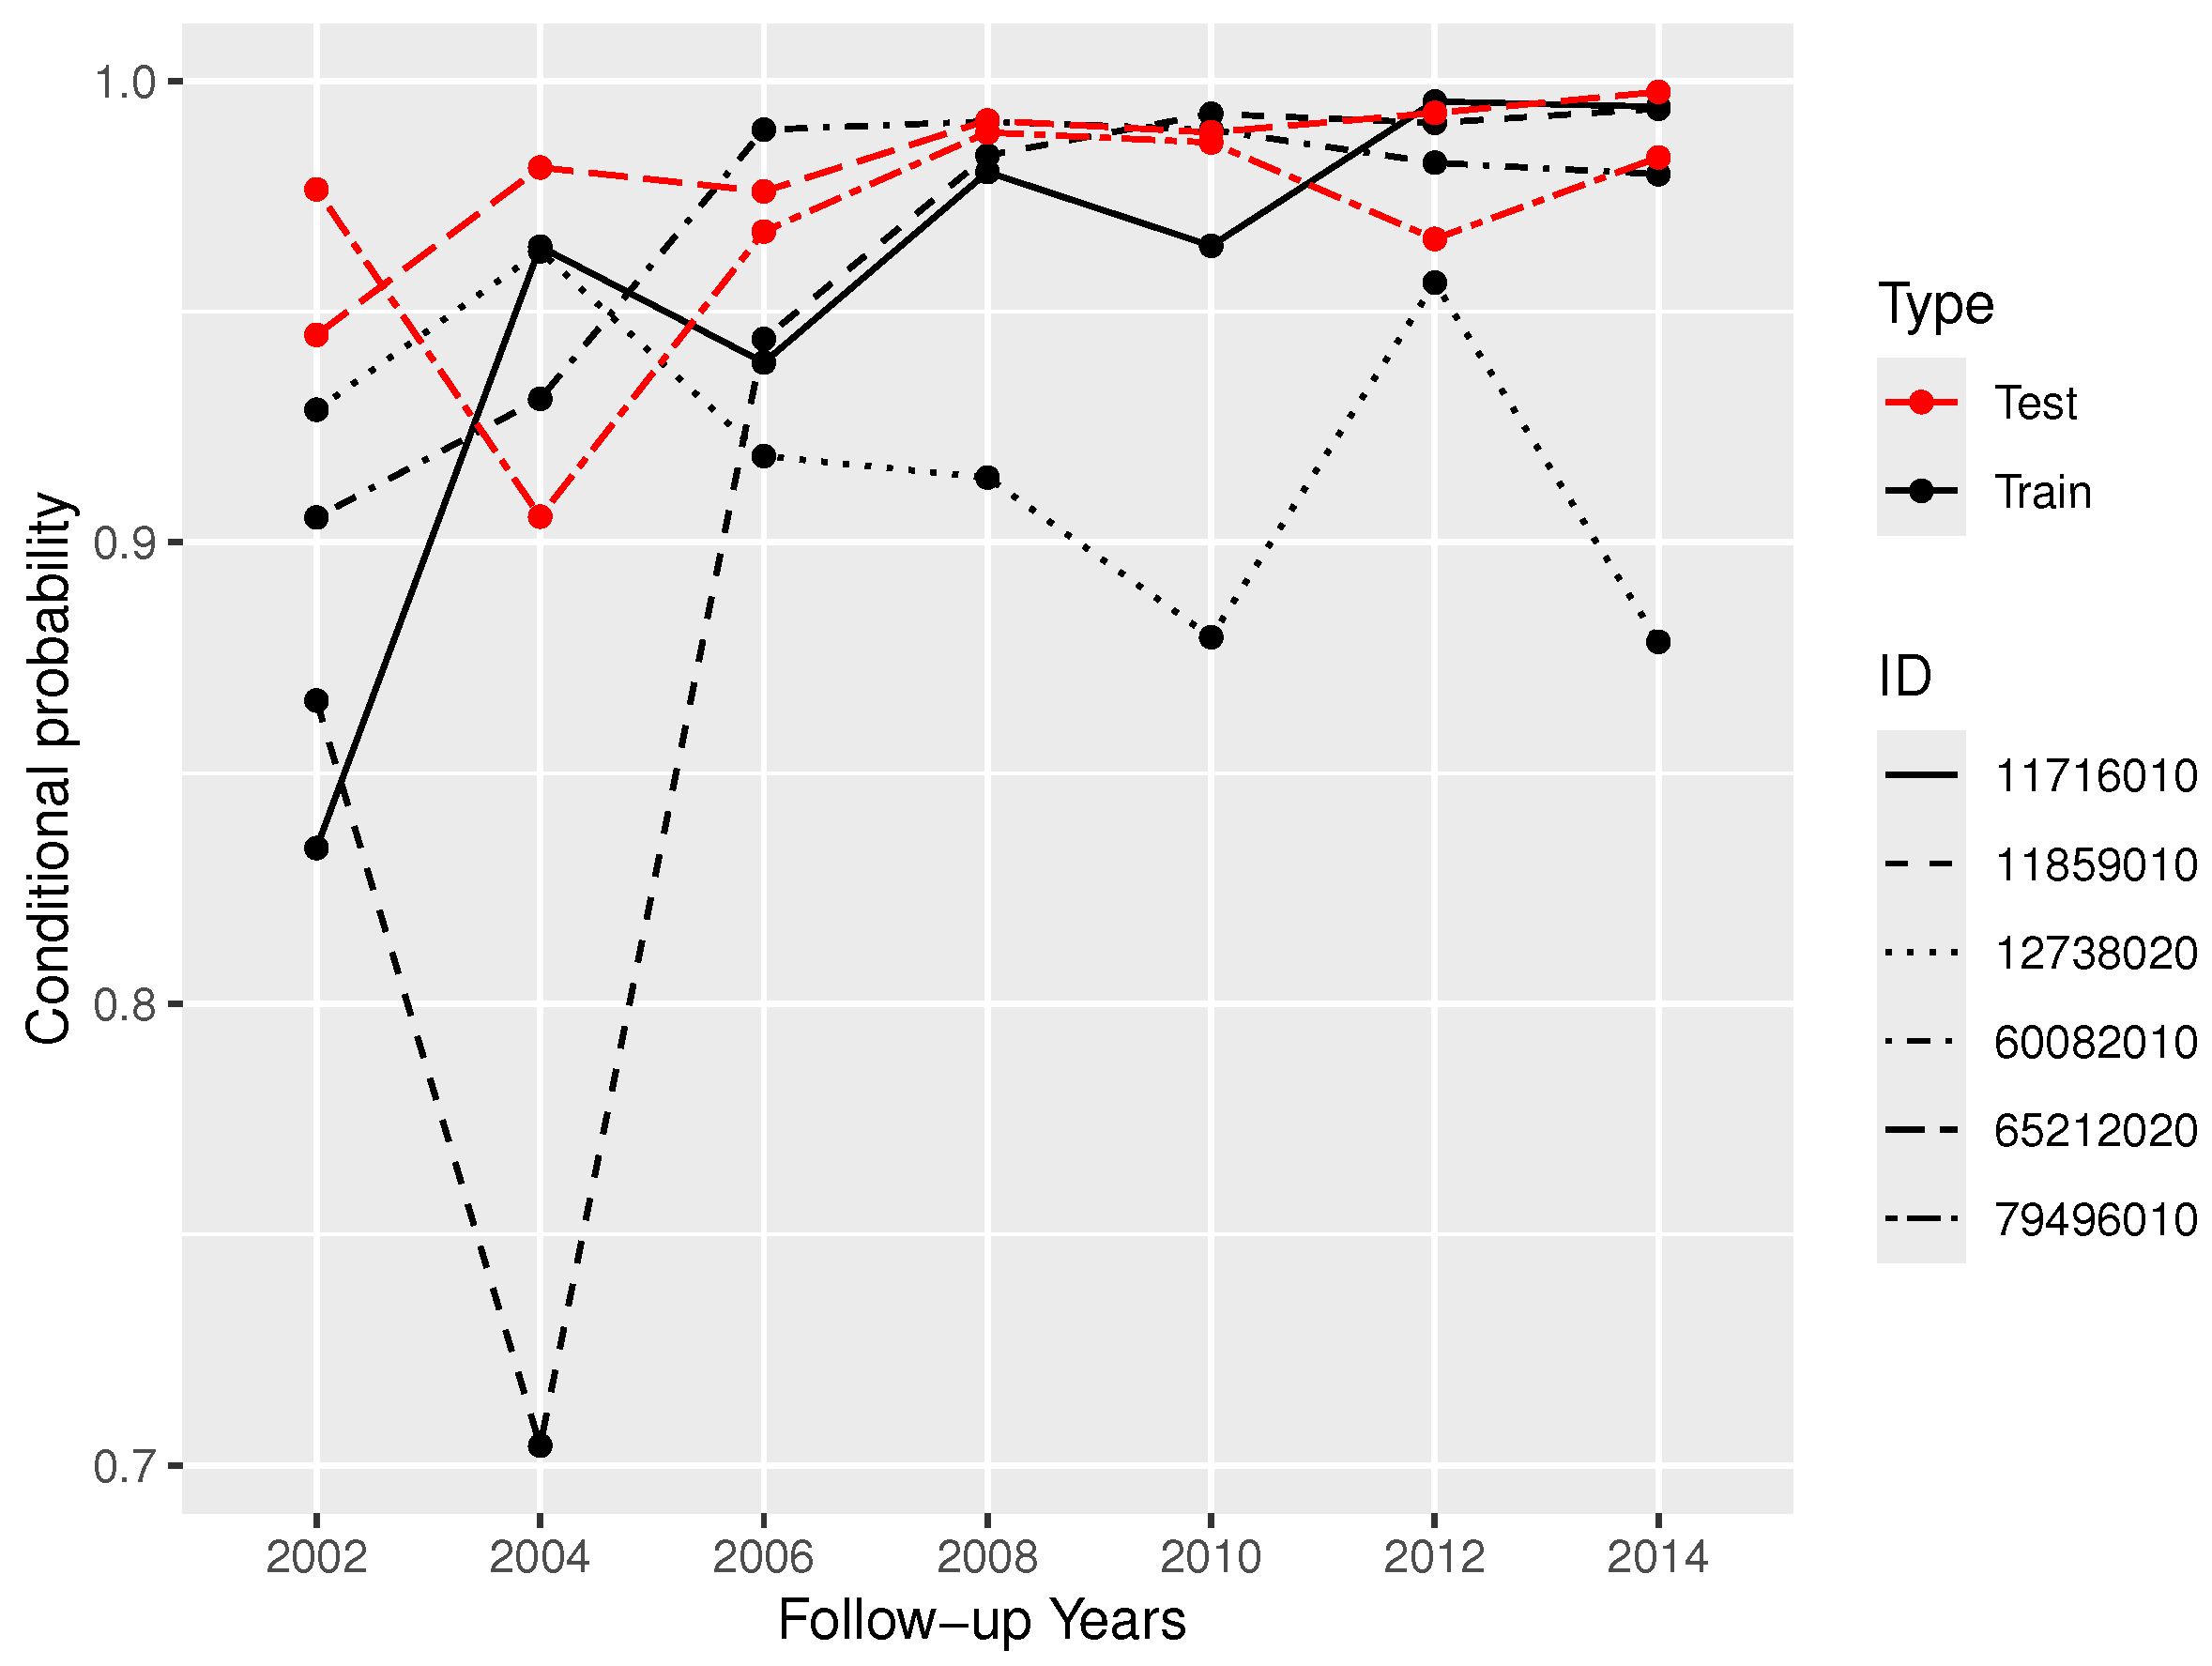
To understand the model-predicted IADL trajectory risks using both conditional and joint probabilities, we estimated risks for several elderly individuals with IADLs across all or most follow-ups. Appendix A Table A5 shows the observed and regressive logistic regression model-predicted IADLs for thirteen elderly individuals. Trajectory risks, using conditional and joint probabilities for six elderly individuals, are displayed in Figure 4 and Figure 5, respectively. There are two tests and four training samples. The trajectories of the two test subjects are represented by the first two lines starting from the top left of Figure 4. From Table A6, we can see that these two subjects had IADLs present for all seven follow-ups; also, the model predicted the presence of IADLs in Table A5, for all the follow-ups.
Figure 4.
Trajectory of conditional probabilities of high IADL risk in selected elderly individuals.
Figure 5.
Trajectory of joint probabilities of high IADL risk in selected elderly individuals.
Trajectories in Figure 4 help us to understand how the risk of IADLs of current follow-up depends on the presence or absence of IADLs of previous follow-up(s). In other words, conditional probabilities are based on reduced sample conditioning on previous outcome(s) or subsamples or subgroups. Lines in black are training data, and lines in red are test data. The dashed line in Figure 4 represents the elderly with ID11859010, who were IADL-free at the beginning, so there was a sudden drop in the trajectory.
The trajectories of joint probabilities for the same elderly group as in Figure 4 are shown in Figure 5. We observe that all lines gradually decrease, although none fall below the threshold probability of 0.50 for the IADLs, indicating that these six elderly individuals have the IADLs. These joint probabilities are estimated by multiplying marginal and higher-order conditional probabilities as shown in Equation (1). We can compare the trajectories of two elderly individuals: the top line (ID 65212020) and the solid line (ID 11716010). The trajectory risks for the subject with the solid line are much lower than those of the subject with the long-dashed line throughout the follow-ups. To understand this, we refer to Appendix A Table A6 and Table A7, which present the independent variable values for the high-risk subjects shown in Appendix A Table A5. The covariate values of X6, X7, X8, and X9 for the subject with the long-dashed line are relatively higher compared to the subject with a solid line. These covariates are generally significant and positively associated with the occurrence of IADLs across all follow-ups (Appendix A Table A3 and Table A4).
3.2. Trajectories Using Different ML Models
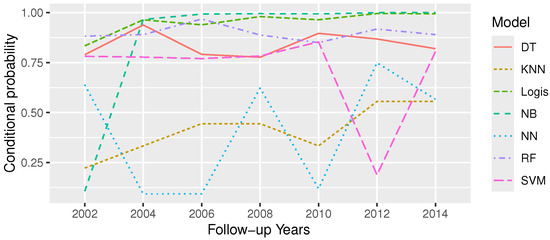
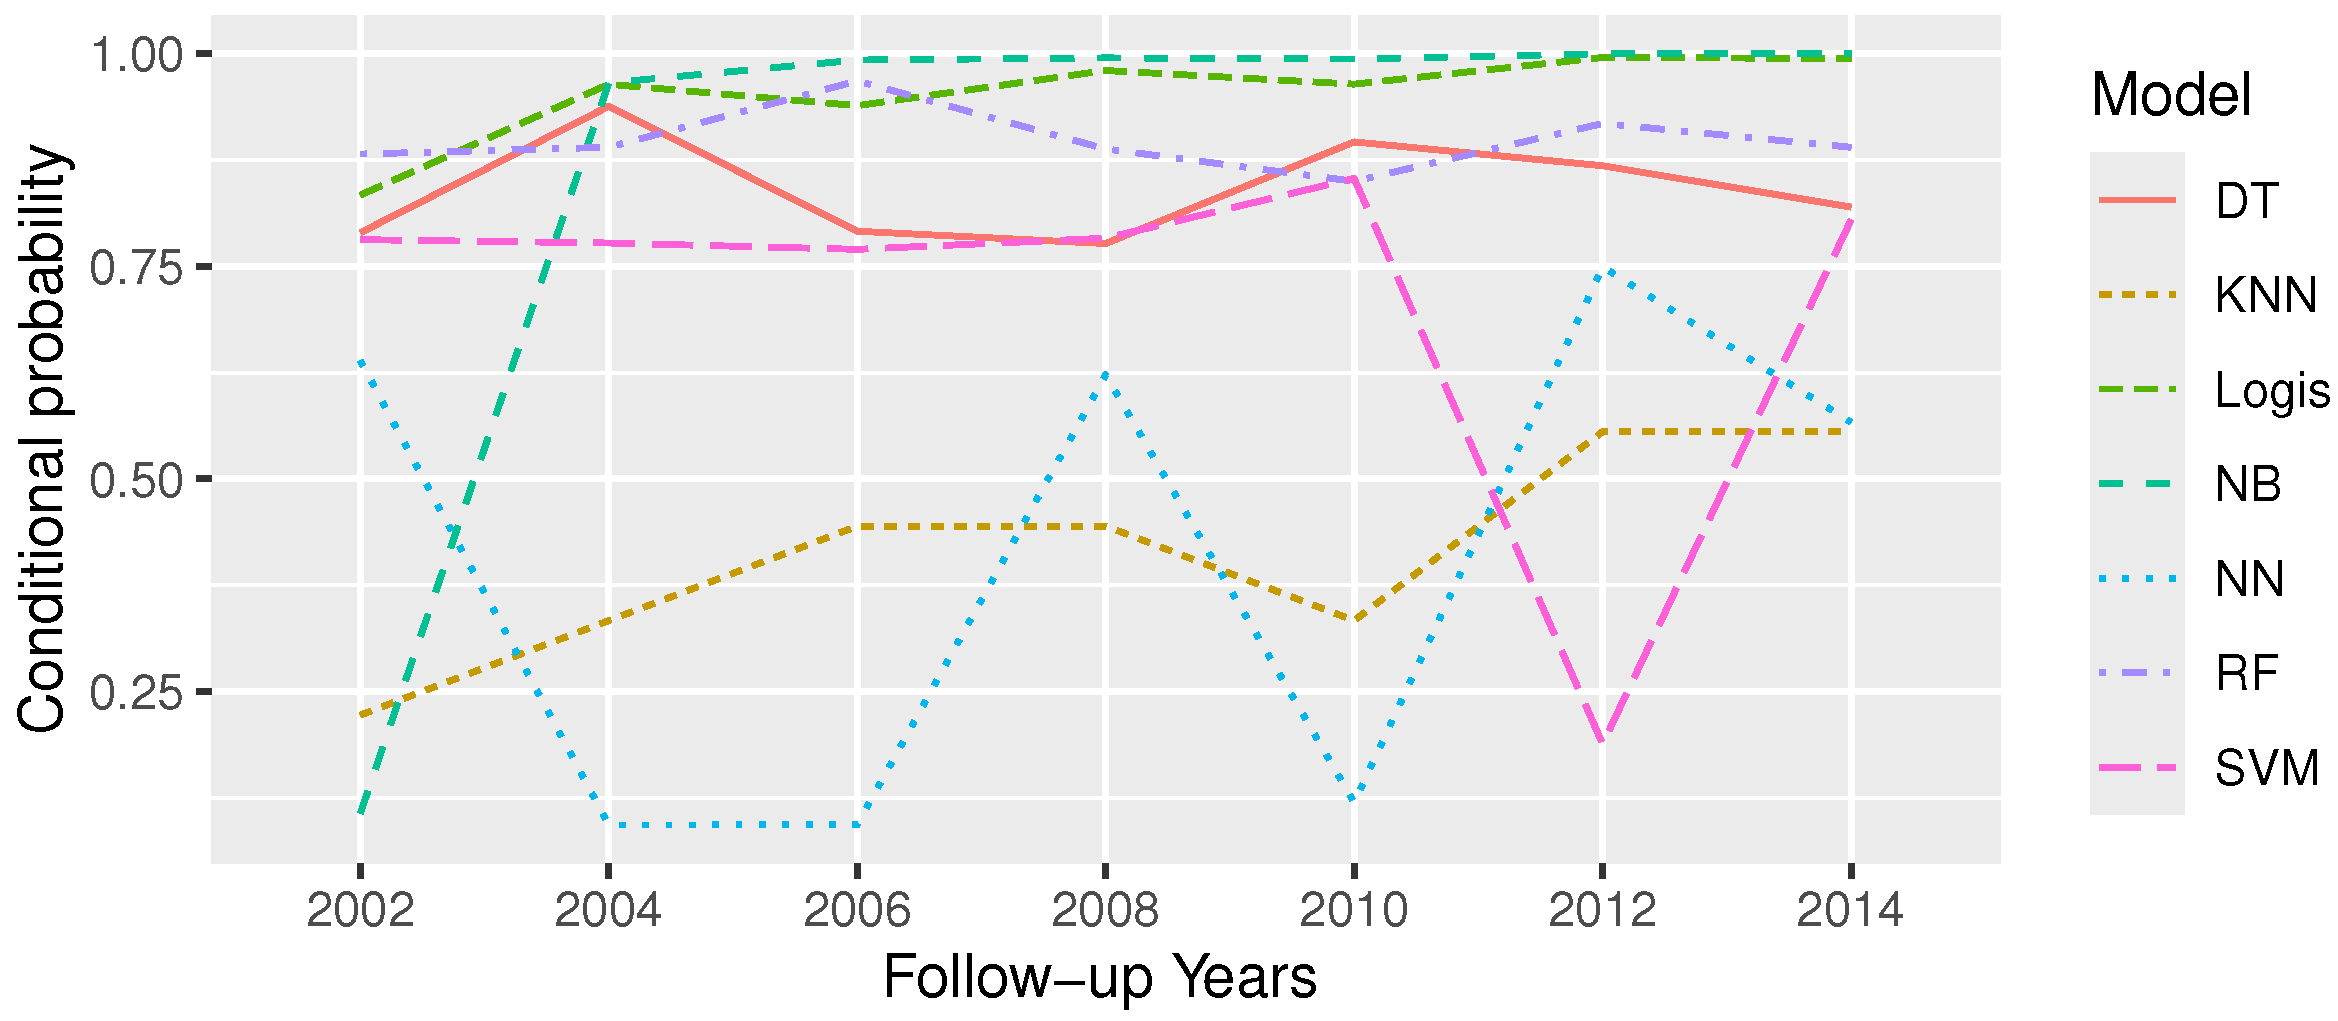
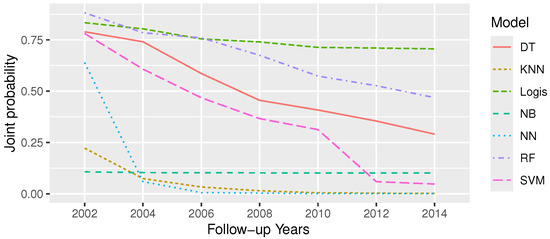
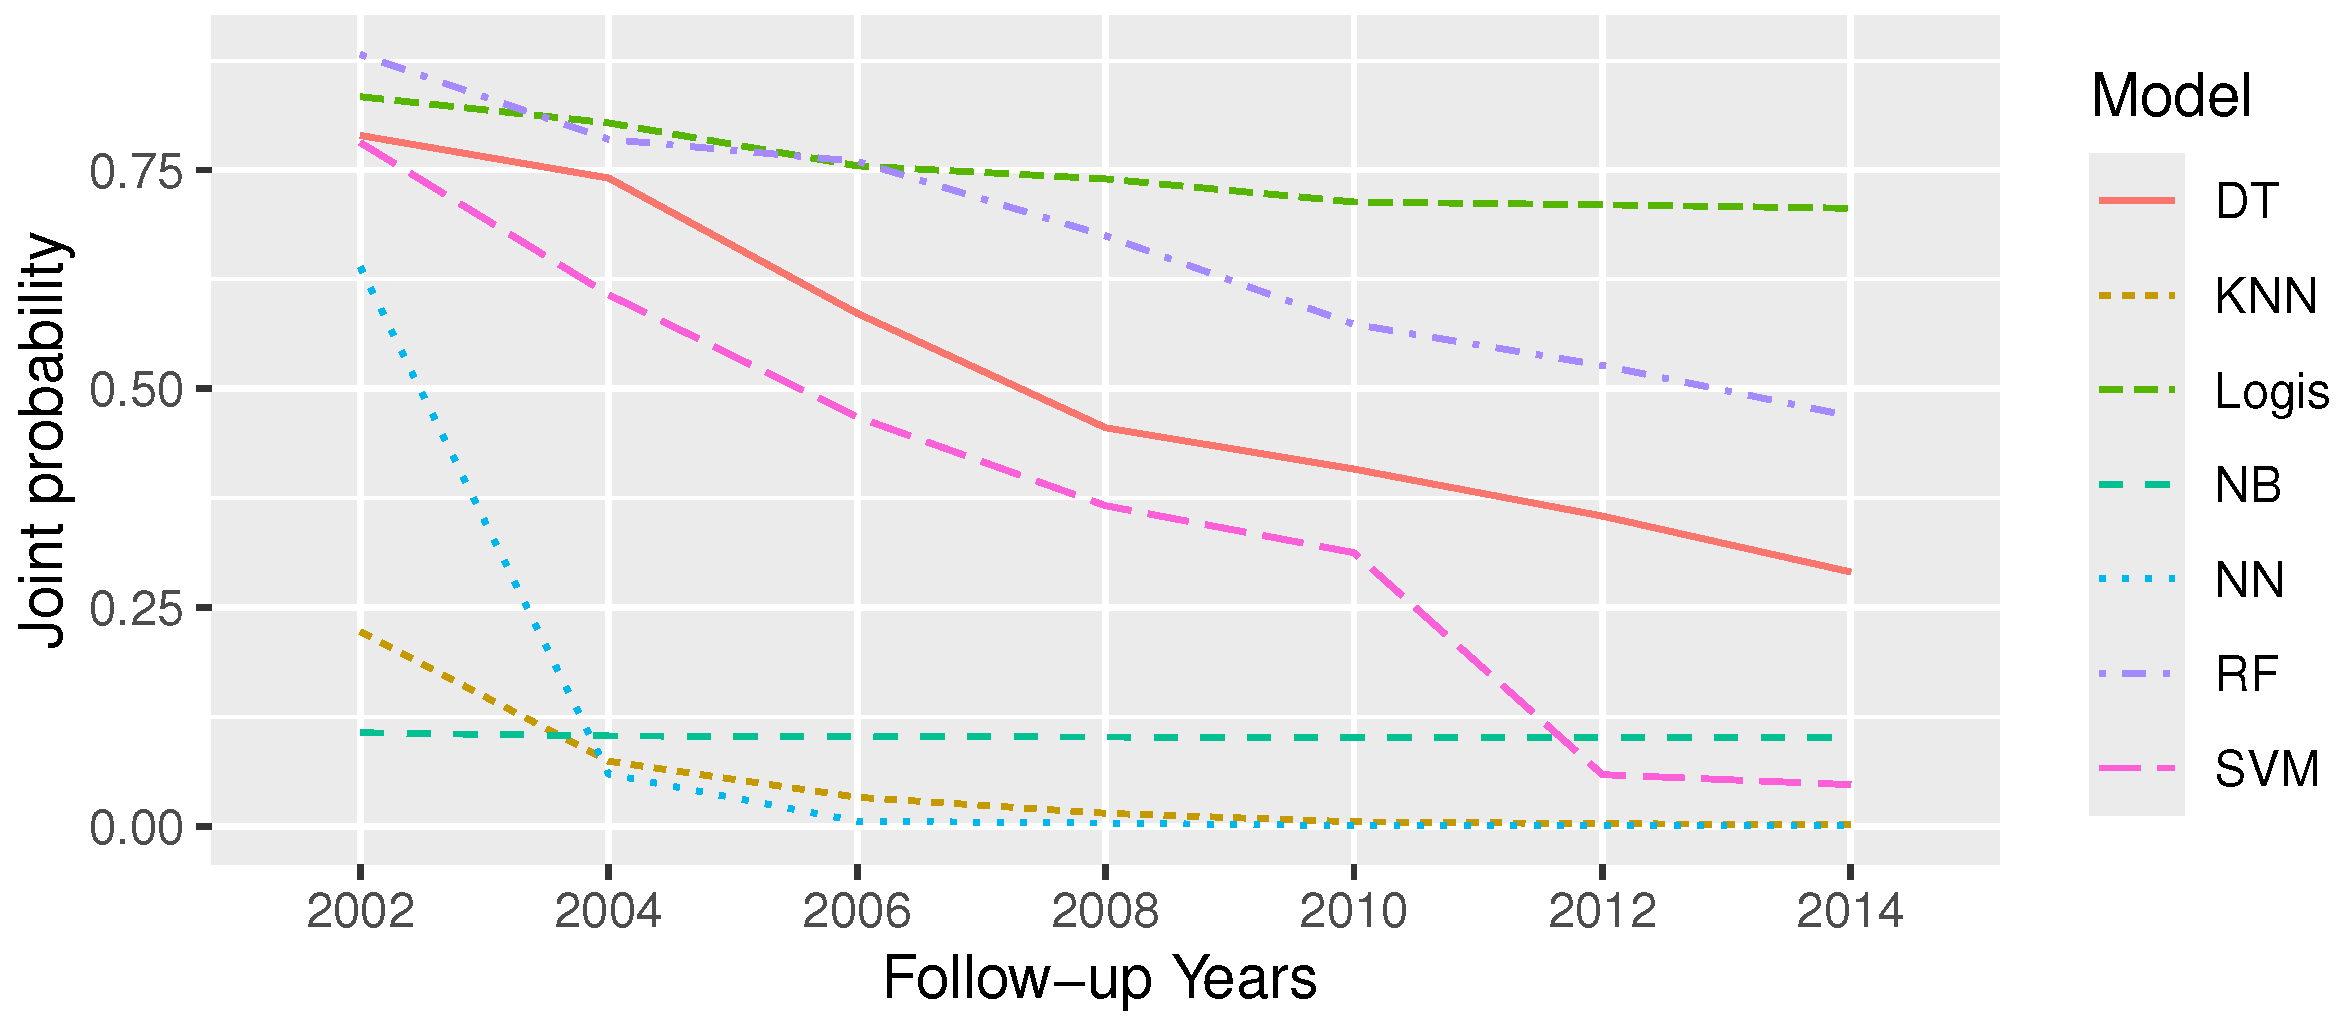
We compared the performance of the trajectory risk predicted using logistic and different ML models. To this end, we used data from an elderly individual with the ID number 11716010. Figure 6 and Figure 7 present the trajectory risks using conditional and joint probabilities, respectively. For this subject, the highest performance in risk prediction was achieved by the regressive logistic regression model, followed closely by NB, DT, and RF; the predicted risk exceeded 0.50 for all follow-ups. This elderly person observed the presence of IADLs across all waves, with correct predictions obtained from regressive logistic regression, NB, and DT, whereas NN, SVM, and KNN predicted the absence of IADLs, i.e., risks less than 0.05 for some of the waves. The predicted trajectory risks, based on joint probabilities (Figure 7) and estimated using regressive logistic regression, were consistent with the observed IADLs. Other ML algorithms predicted the absence of IADLs at later follow-ups.
Figure 6.
Trajectory of conditional probabilities for an elderly individual with ID number 11716010, using all seven models.
Figure 7.
Trajectory of joint probabilities for an elderly individual with ID number 11716010 from all seven models.
3.3. Impacts of Covariates on Trajectories: Clinical Scenarios
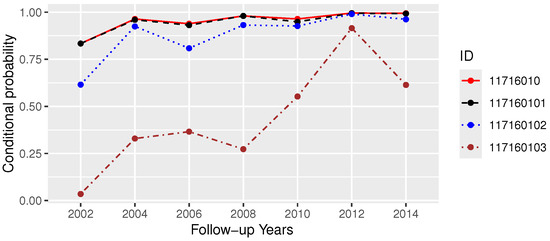
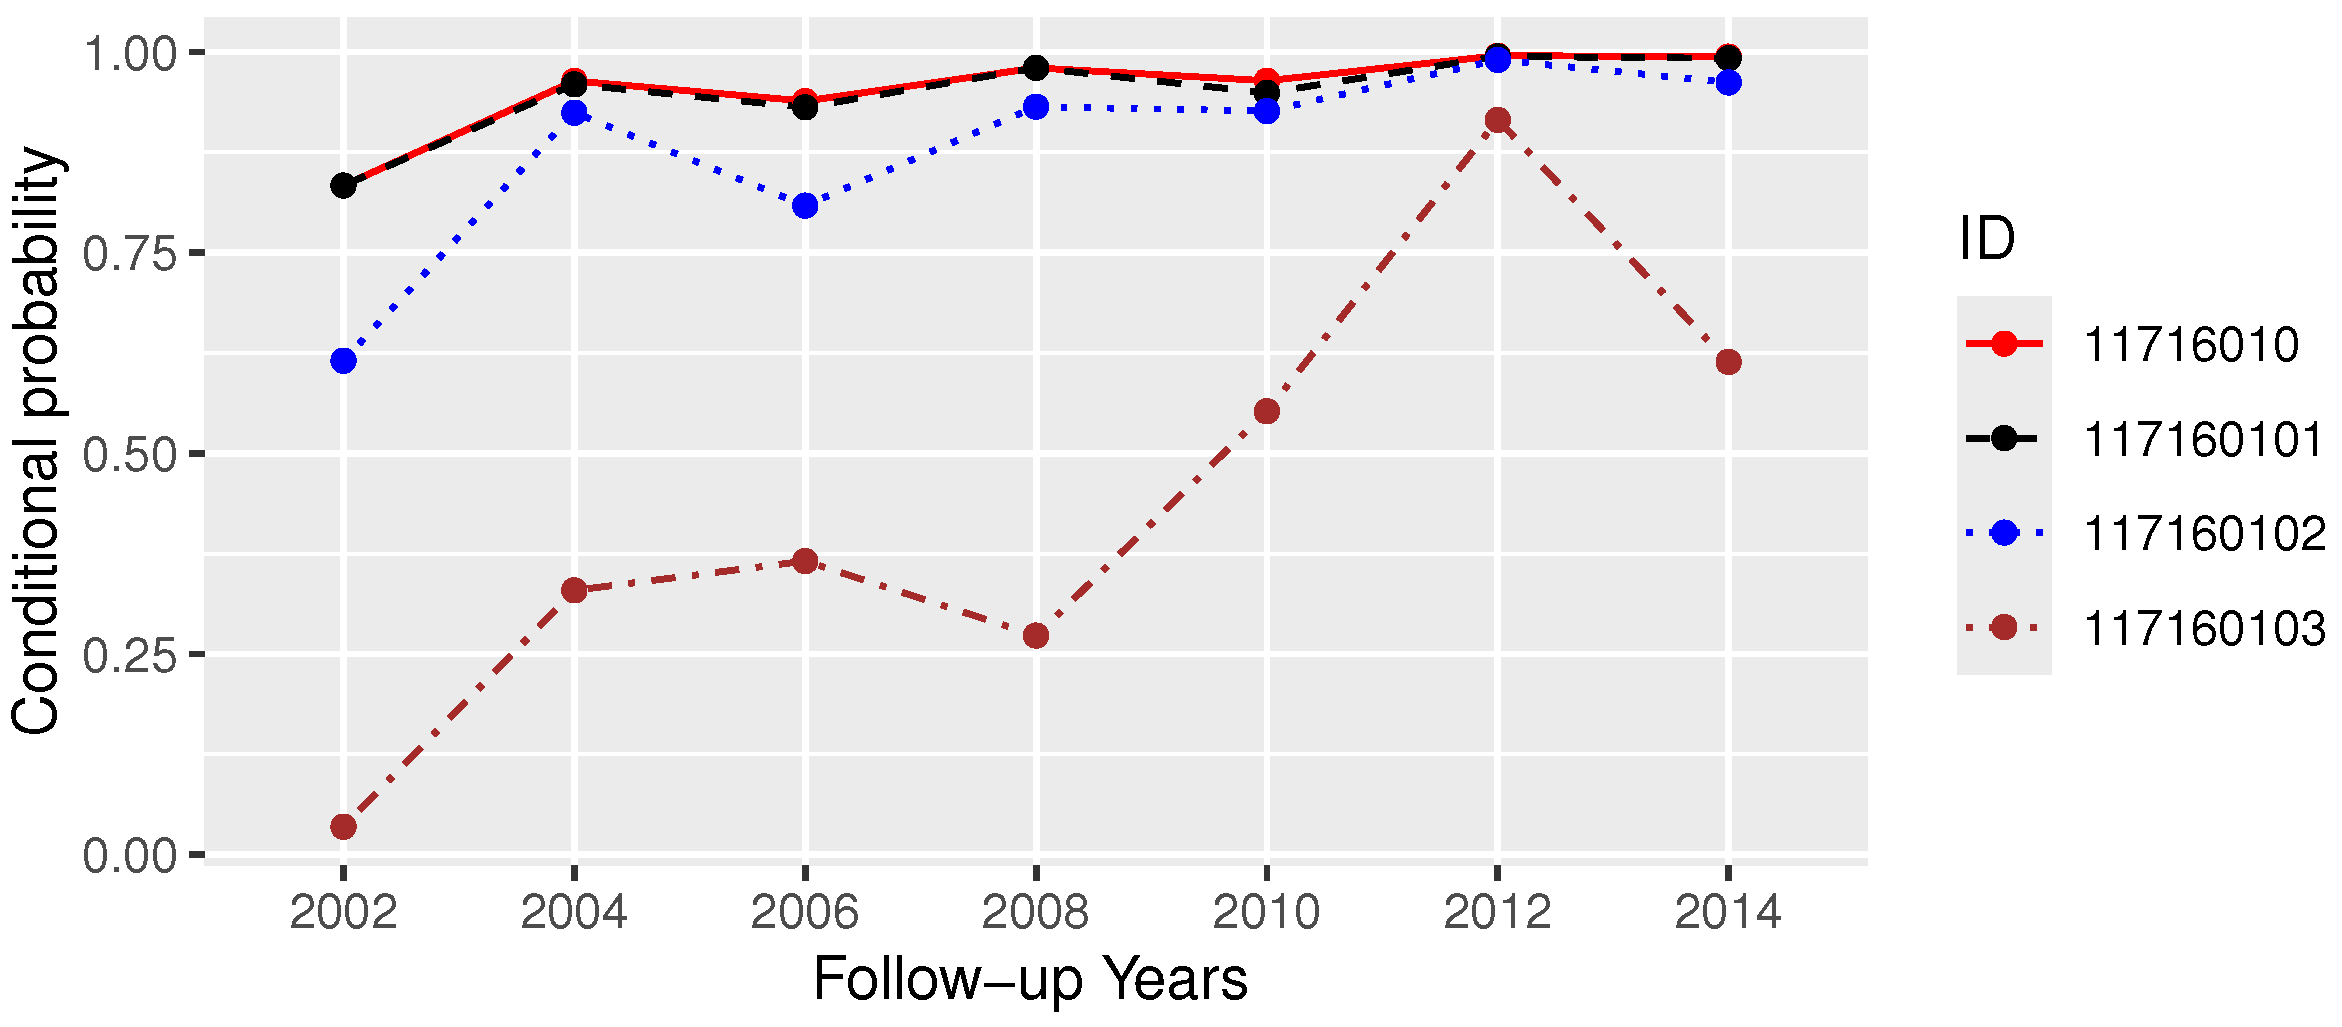
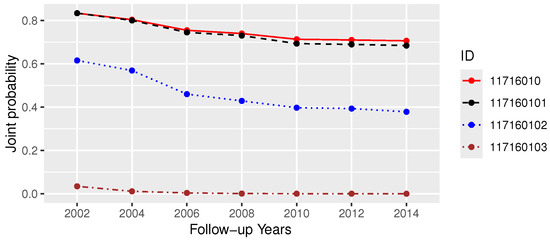
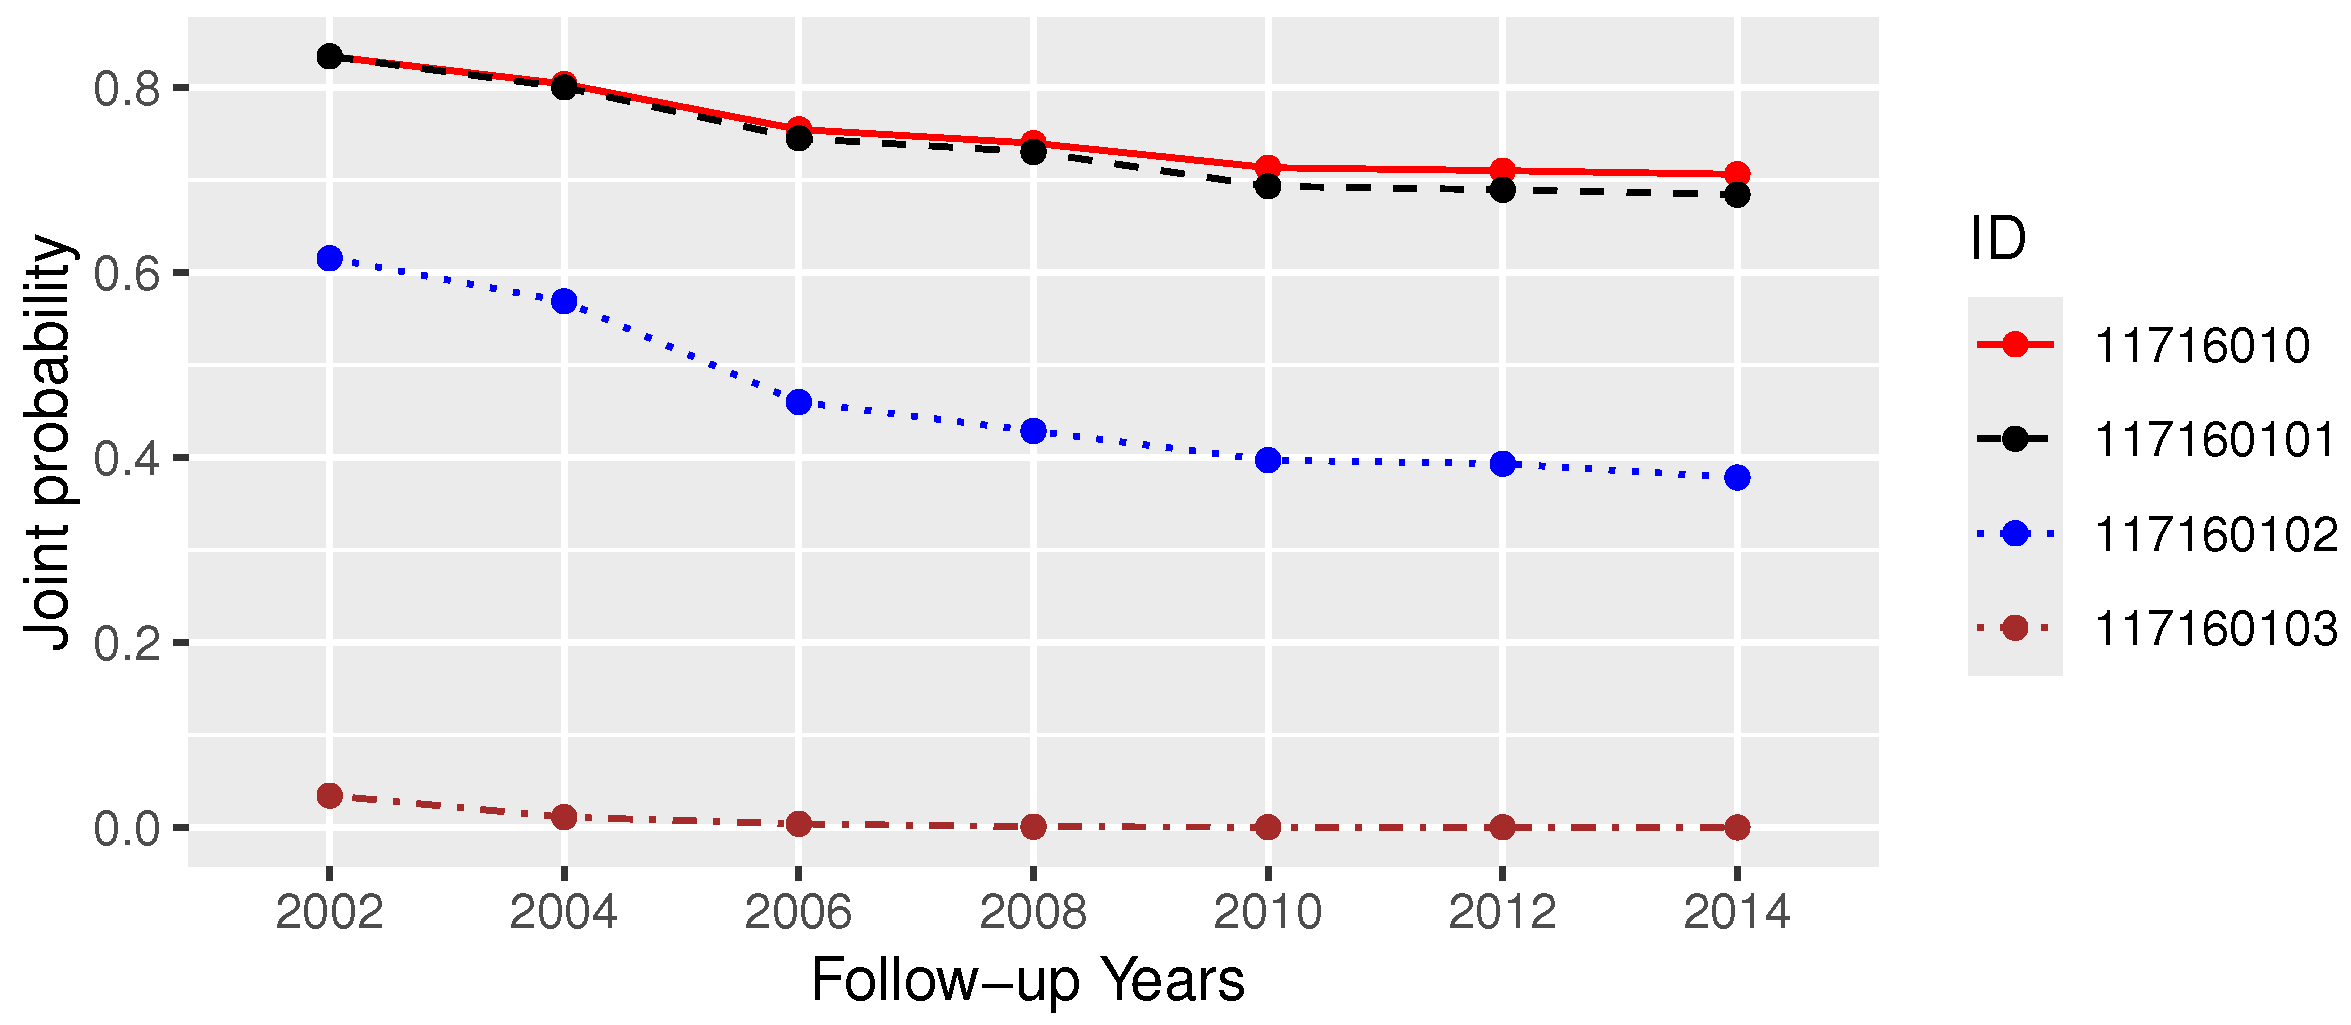
To understand how changes in covariate values affect trajectory risks across follow-ups, we used the elderly individual with ID 11716010 who had an IADL problem at all seven follow-ups (Table A1). We then gathered three new test subjects by varying the values of covariates significantly associated with IADLs across follow-ups. The first new patient, with subject ID 117160101, has covariate values identical to those shown in Appendix A Table A1, except for the CESD (X6: depression score). For CESD, we set values to 0 (no depression) for all follow-ups. For the second new patient with ID 117160102, we set X6 and X7 (mobility index) to 0 for all follow-ups, while keeping all other covariate values unchanged. Finally, for the third new patient with ID 117160103, we set X6, X7, and X9 to 0 and left the values of the remaining covariates unchanged.
Figure 8 and Figure 9 present the trajectories of conditional and joint probabilities for these four subjects. From the trajectory of conditional probabilities (Figure 8), the conditional probability decreases to a very small, non-noticeable amount when we set X6 = 0 for all follow-ups. When we set the values of both X6 and X7 to 0, there is a noticeable reduction in risk across all follow-ups, as indicated by the third dotted line from the top. Finally, when we set X6, X7, and X9 to 0, there are significant reductions in risk. These three covariates showed a significant positive association with IADLs from the logistic model for the follow-ups. In Figure 9, the trajectory of joint probability clearly indicates the impact of covariate on an elderly person’s risk of having IADLs. Once the values of the depression score and mobility index score are reduced to zero, the risk declines, and the risk of curing the IADL problem decreases (the second line in the figure). This reduction is pronounced when a subject can reduce the values of X6, X7, and X9 to zero; the risks of the IADL problem trajectory decrease sharply toward zero, as shown in Figure 9 (the first line from the bottom).
Figure 8.
Trajectory of conditional probabilities for four elderly individuals with varying covariate values for comparison.
Figure 9.
Trajectory of joint probabilities for four elderly individuals with varying covariate values for comparison.
3.4. Trajectories of Joint Probabilities of Three New Test Subjects Using ML Models
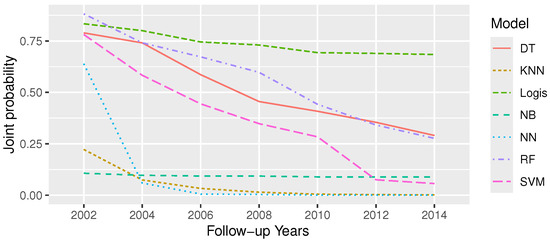
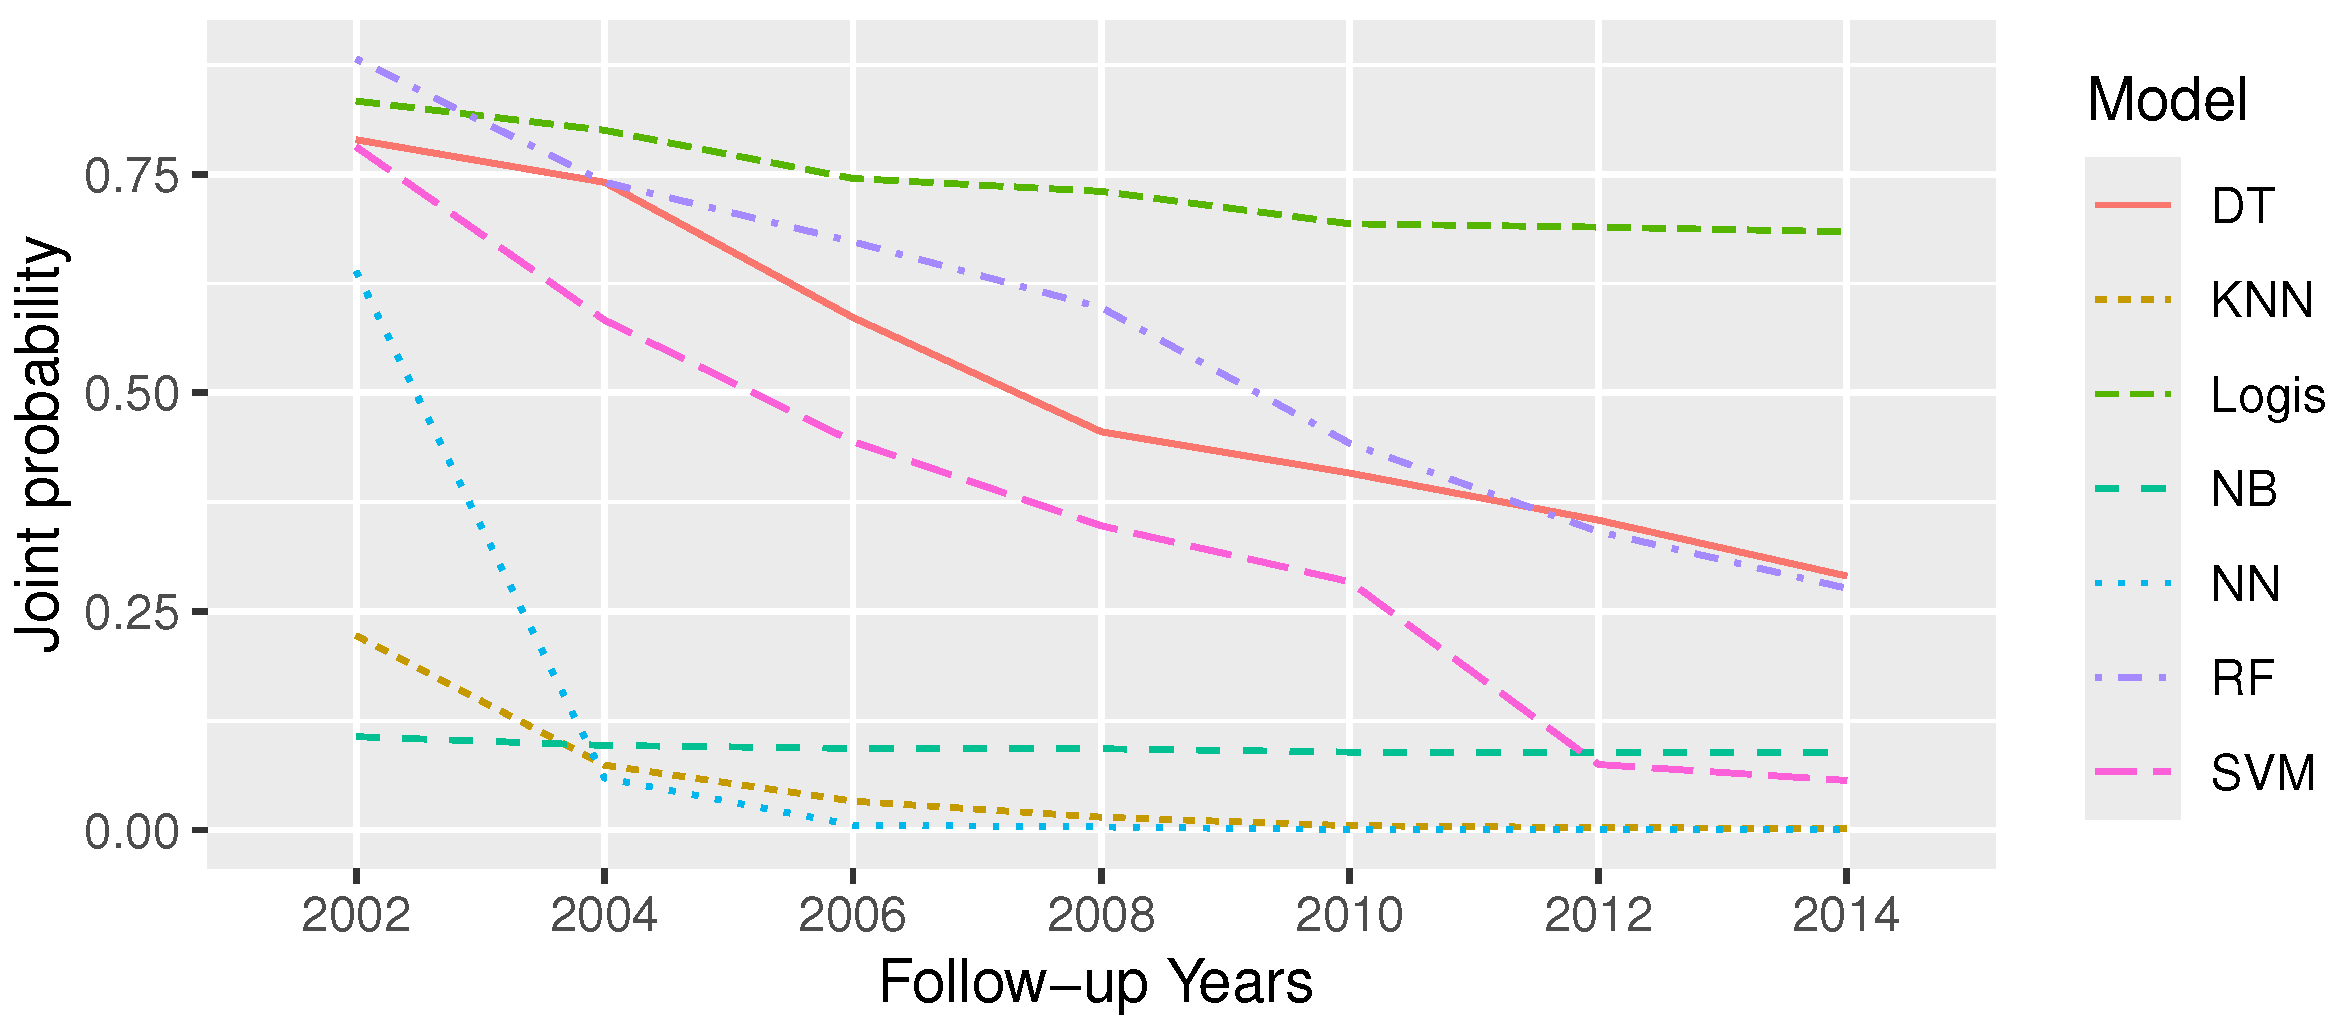
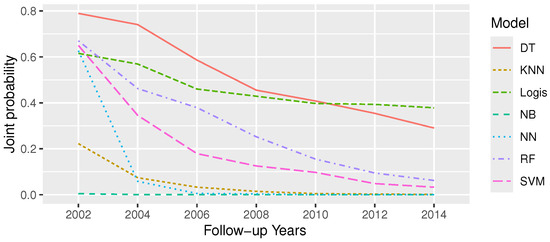
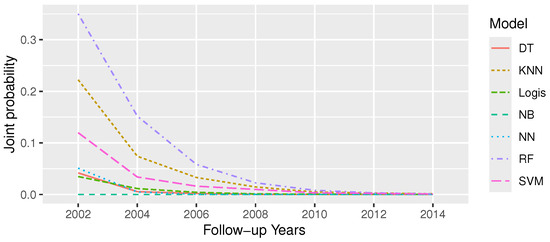
For the three new patients with different covariate settings, the estimated trajectory risks for the conditional and joint probabilities obtained from regressive logistic regression are shown in Figure 8 and Figure 9. For these three elderly, the trajectory risk of joint probabilities from logistic regression is compared with six ML models, as shown in Figure 10, Figure 11 and Figure 12. This is the elderly subject with subject ID 117160101, and this subject’s CESD scores (X6) are 0 across all waves, compared with the elderly subject with ID 11716010. The estimated trajectory risk from regressive logistic regression remains high (>0.50), indicating the presence of IADLs across all follow-ups, although X6 was significantly and positively associated with IADLs at all follow-ups (Figure 10). The remaining ML models showed a change in IADLs from 1 to 0 at later follow-ups. Figure 11 presents the trajectory of the subject with ID 117160102, and the values of covariates X6 and X7 were set to zero for all the follow-ups. All models showed a rapid decline in estimated trajectory risk from the second follow-up onward, and the risk was less than 0.50. For the last subject (ID 117160103), the values for X6, X7, and X9 were set to 0 across all waves. The trajectory risk indicates a sharp decline across all models (Figure 12); in particular, the logistic model showed the largest reduction.
Figure 10.
Comparison of joint probabilities predicted using different models for elderly participant with ID number 117160101.
Figure 11.
Comparison of joint probabilities predicted using different models for elderly individual with ID 117160102.
Figure 12.
Comparison of joint probabilities predicted using different models for elderly individual with ID 117160103.
4. Discussion
A sharp increase in longitudinal data collection through large-scale cohort studies or wearable devices is generating vast, complex, high-dimensional datasets that fall within the realm of big data. To analyze such datasets, a specialized modeling framework needs to be developed. In this study, using longitudinal data, we developed a modeling framework to predict trajectory risks of IADLs and their significant predictors, which could help manage these conditions. We estimated multiple trajectories, controlling for significant covariates, to assess their temporal impact. Depression score (X6), difficulties of mobility measures score (X7), difficulties of large muscle measures score (X8), and difficulties of ADLs score (X9) have a significant (p < 0.05) and positive impact on the IADLs for most of the follow-ups (Appendix A Table A3 and Table A4). Similar associations were observed in other cross-sectional studies [5,44,55,65]. Connolly et al. [53] found a positive association of depression, BMI, single, and self-rated memory with IADLs. Several chronic conditions were found to be associated with IADLs in different studies [49,66]. The dependence between IADLs and ADLs, age, gender, and marital status was reported by [54], similarly to our findings. Moon et al. [55] reported grip strength, age, and dementia as significant predictors of IADLs. A comprehensive list of studies identifying significant predictors of IADLs is presented in Table 3.
The regressive logistic regression model and the Decision Tree showed similar performance on the training and test data; however, the Decision Tree exhibited slight overfitting (Table 7). The remaining ML models (KNN, NN, NB, SVM, and RF) achieved lower accuracy than the regressive logistic regression model. Comparison of varying scores for X6, X7, X8, and X9 reduces the risks of IADL trajectories very sharply, as evident from the Figure 8 and Figure 9.
The controllable risk factors that were found as significant predictors of IADLs could be motivating factors for the elderly to reduce or be free of IADLs. Physicians can introduce to patients the benefits by presenting the graphical trajectory of the impact of useful, controllable risk factors, which could be motivating. The model’s predictive power may depend on the new data over time; models should be updated regularly. These systems will be sophisticated, as many components are involved. Even with continuous data collection, the predictive performance of various learning models can change, and this should be considered. Another major constraint of longitudinal data collection is that new risk factors (variables) may be added due to evolving realities or requirements, resulting in a varying number of covariates across follow-ups. That may substantially increase predictive power, thereby yielding a more refined trajectory risk prediction. Additionally, missing values for various risk factors across follow-ups are common. All of these are barriers to traditional modeling approaches that must be addressed in the development of any new modeling framework.
Clinical Decision Support Systems (CDSSs) support clinicians in using data and modeling techniques to improve decision quality and enhance healthcare delivery [67,68]. An AI-based CDSS may enhance personalized medicine and improve the efficiency of healthcare workers [69]. Among CDSS developers, there is a growing interest in using Artificial Intelligence (AI) to predict outcomes [70]. ML (a subfield of AI) can learn from patients’ past follow-up data and recognize useful patterns [71,72].
Researchers are only beginning to explore AI-assisted ML models for enhancing CDSSs, personalized medicine, and healthcare management [73,74,75]. Recently, AI technology has been applied to facilitate predictive and personalized healthcare by transforming raw, continuous data from wearables into actionable health insights [76,77]. ML and AI can train models to analyze large datasets, recognize patterns in disease conditions and disease progression, and identify the most predictive model to support faster clinical decision-making [78]. Future work should focus on developing a system for automated, AI-assisted data modeling using the framework presented in this paper. This would automate the selection of the best predictive model from a pool of models using real-time data from databases with a dashboard. Our modeling framework could be useful to achieve the above goals.
5. Conclusions
In this paper, a modeling framework is shown to predict the trajectory risks for a sequence of binary outcomes (IADLs—a chronic condition for the elderly) from large, high-dimensional complex datasets. The proposed modeling framework is illustrated, and trajectory risks are estimated for each follow-up, conditional on the process. Then, the model-estimated conditional risks are linked via marginal probabilities and the sequence of conditional probabilities. This provided the joint probabilities needed for a trajectory risk prediction based on specified covariate vectors. The main advantage of the proposed framework is that only one model needs to be fitted for each follow-up, in contrast to Markov models. The number of models required grows exponentially with the number of follow-ups. The outcome variable and covariates in the baseline (Wave 1) data are used to estimate the parameters of the marginal models. The subsequent conditional probabilities are estimated from the parameters of the logistic regression models fitted to the data from successive follow-ups. The proposed regressive model also allows interactions among previous outcomes and between previous outcomes and predictors within a particular wave. The interaction terms may provide a better understanding of the underlying disease process and the relationships between outcomes and related risk factors. In addition, the proposed framework enables the use of any ML model for trajectory risk prediction from repeated-measures data. This would help to identify the best model for more accurate risk prediction.
6. Limitations
We did not use a fully parameterized model that would address point (v) posed in the Introduction section. In other words, we are not able to estimate the interaction between prior outcomes and covariates in the current follow-up. In our framework, it is possible, but a more complex algorithm in R would be required and would be time-consuming to implement. Additionally, we did not address the handling of missing values in our framework. In this framework, it can easily be incorporated. Our modeling framework can accommodate a varying number of covariates at each follow-up, which requires additional programming and framework adjustments. Lastly, we did not assess causality, as it was not our objective. It would be interesting to study whether causal models (for example, structural equation models) could be incorporated into the proposed framework to check the presence of any causal relationship in the data and obtain more refined estimates.
Author Contributions
Conceptualization: R.C. and M.T.H.; methodology: R.C.; software, R.C., M.R. and Z.H.; validation, R.C., W.B., M.T.H. and Z.H.; formal analysis, R.C., M.R. and Z.H.; resources: R.C., M.T.H. and W.B.; data curation, R.C., M.R. and Z.H.; writing—R.C.; writing—review and editing: R.C., M.T.H. and W.B.; visualization: R.C. All authors have read and agreed to the published version of the manuscript.
Funding
This research was partially supported by the Natural Sciences and Engineering Research Council of Canada (RGPIN-2017-04246).
Institutional Review Board Statement
The study was approved by the University of Michigan Health Sciences and Behavioral Sciences Institutional Review Board (IRB Protocol No.: HUM00061128), approved through 18 October 2018.
Informed Consent Statement
Informed consent for participation was obtained from all subjects involved in the study.
Data Availability Statement
The panel data from the Health and Retirement Study (HRS), sponsored by the National Institute of Aging (grant number NIA U01AG09740), conducted by the University of Michigan (HRS, 2014) is used for this research. The datasets are freely available at the HRS website https://hrs.isr.umich.edu/data-products ( accessed on 10 March 2024).
Acknowledgments
The authors also acknowledge the data from the HRS (Health and Retirement Study) that is sponsored by the National Institute of Aging and conducted by the University of Michigan.
Conflicts of Interest
The authors declare no conflicts of interest.
Abbreviations
The following abbreviations are used in this manuscript:
| ADL | Activities of Daily Living |
| AI | Artificial Intelligence |
| DT | Decision Tree |
| AUC | Area Under the Curve |
| HRS | Health and Retirement Study |
| IADL | Instrumental Activities of Daily Living |
| IoT | Internet of Things |
| KNN | K-Nearest Neighbors |
| ML | Machine Learning |
| NN | Neural Network |
| NB | Naive Bayes |
| RF | Random Forest |
| RLR/Logis | Regressive Logistic Regression |
| ROC | Receiver Operating Characteristic |
| SVM | Support Vector Machine |
Appendix A
Table A1.
Example of restructured long-format data file.
Table A2.
R-codes for fitting regressive logistic regression.
Table A3.
Parameter estimates of logistic regression model for Wave 1 to Wave 4.
Table A4.
Parameter estimates of the logistic regression model for Wave 5 to Wave 7.
Table A5.
Observed and regressive logistic-regression-model-predicted IADL status for 13 selected high-risk elderly.
Figure A1.
ROC and AUC using Regressive Logistic Regression (RLR) for all waves for training and test data.
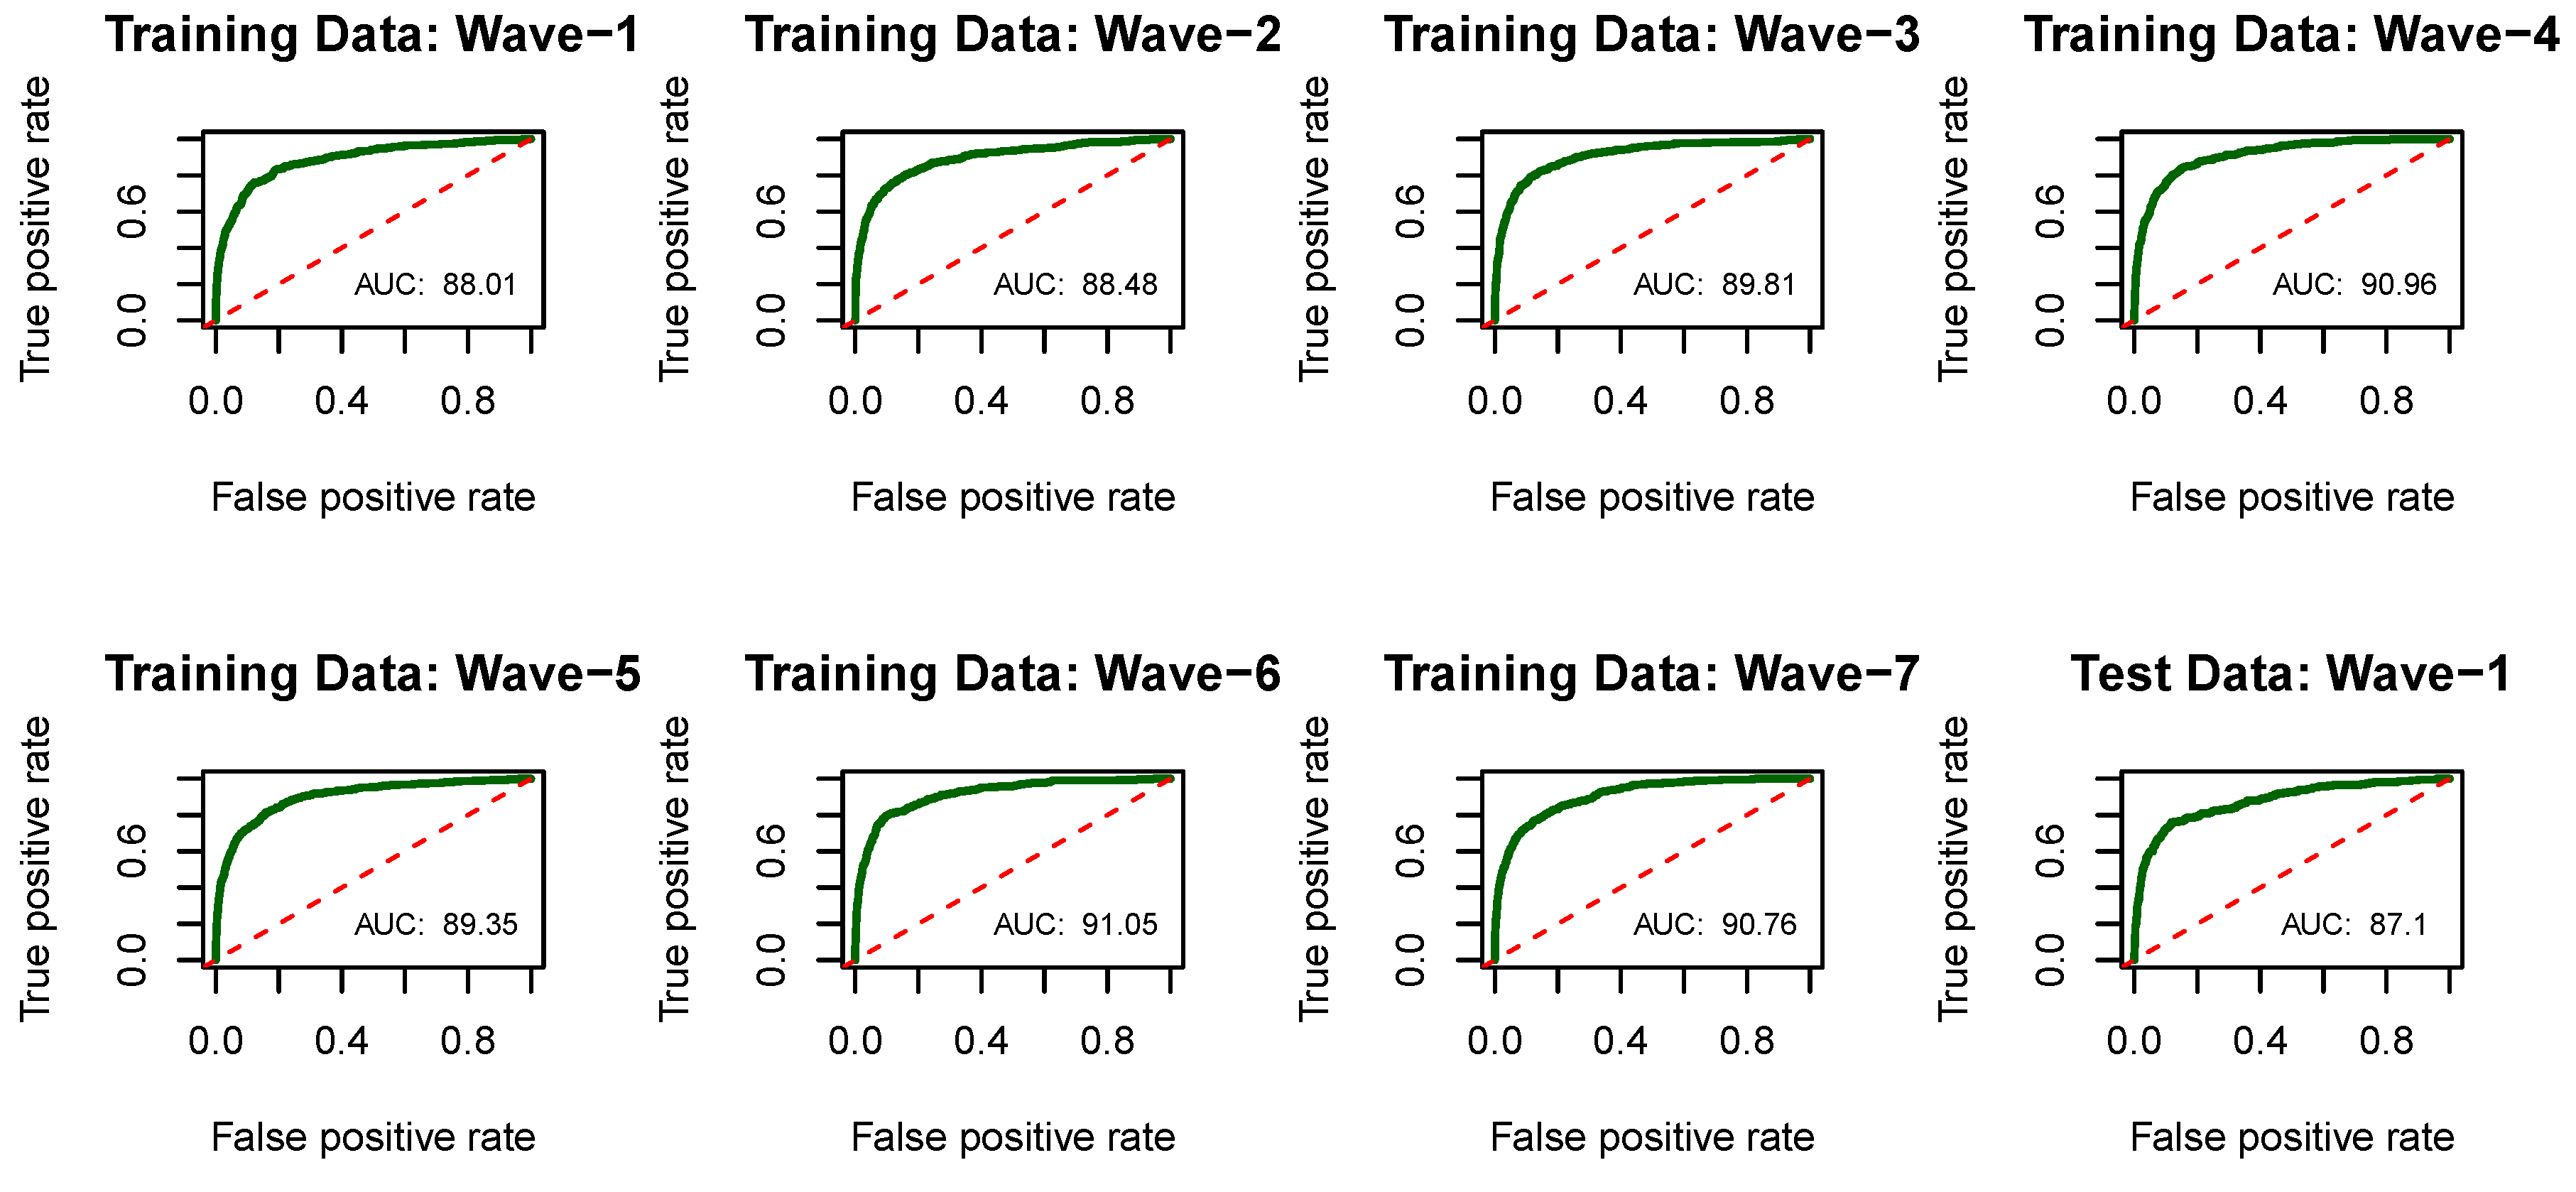
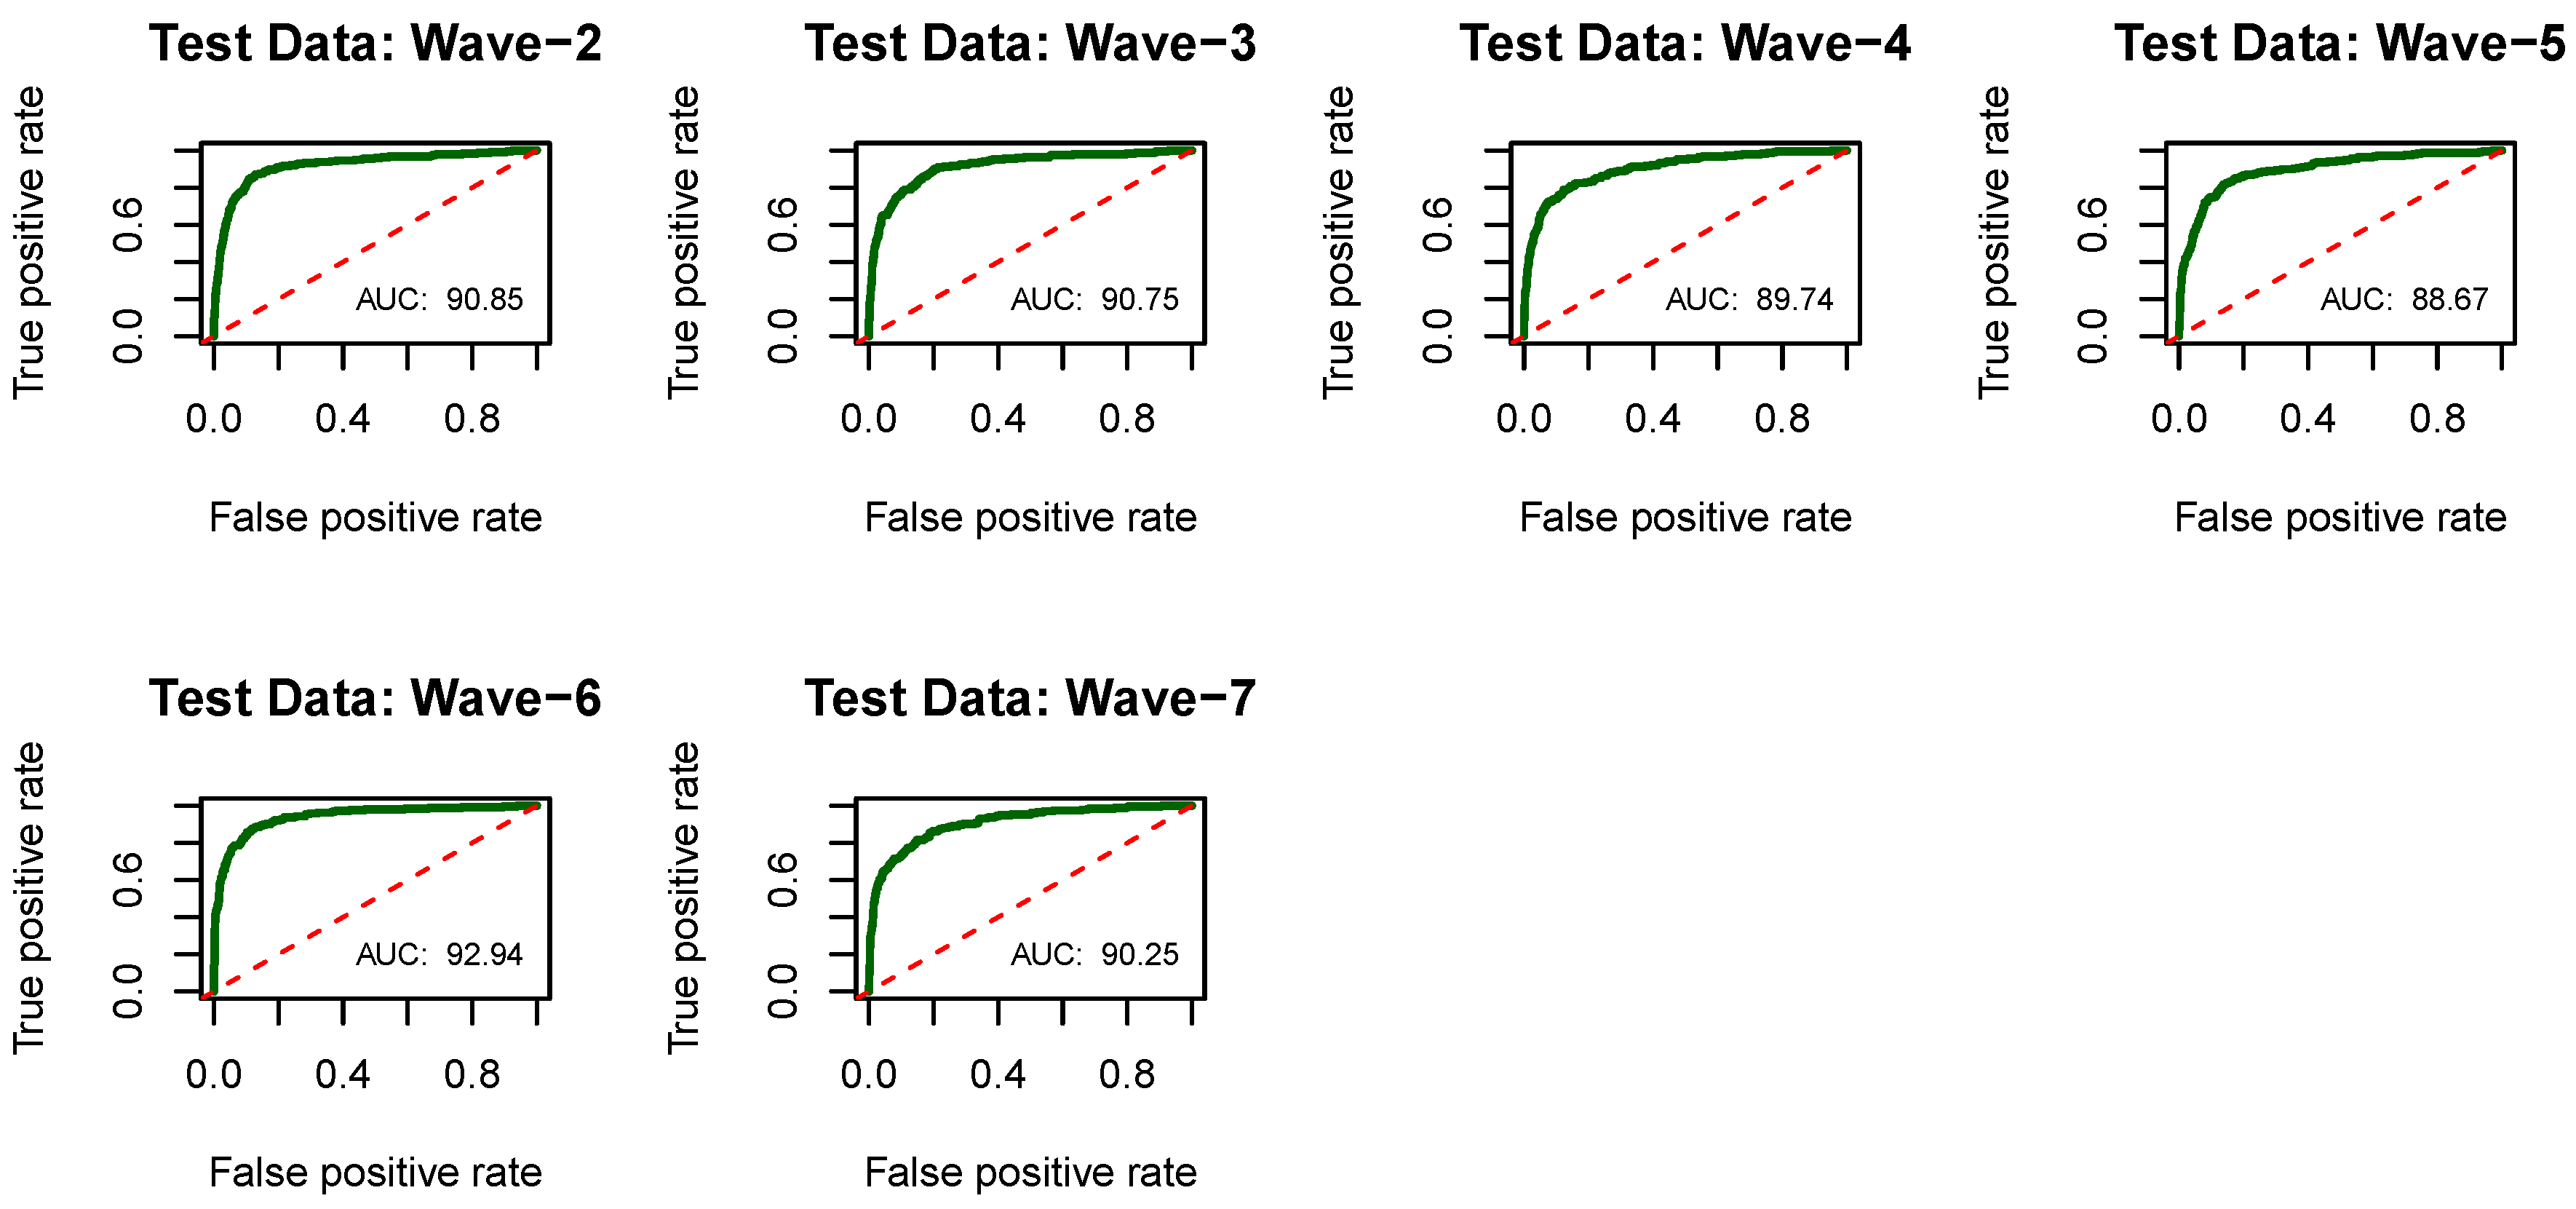
Figure A2.
ROC and AUC using Decision Tree (DT) for all waves for training and test data.
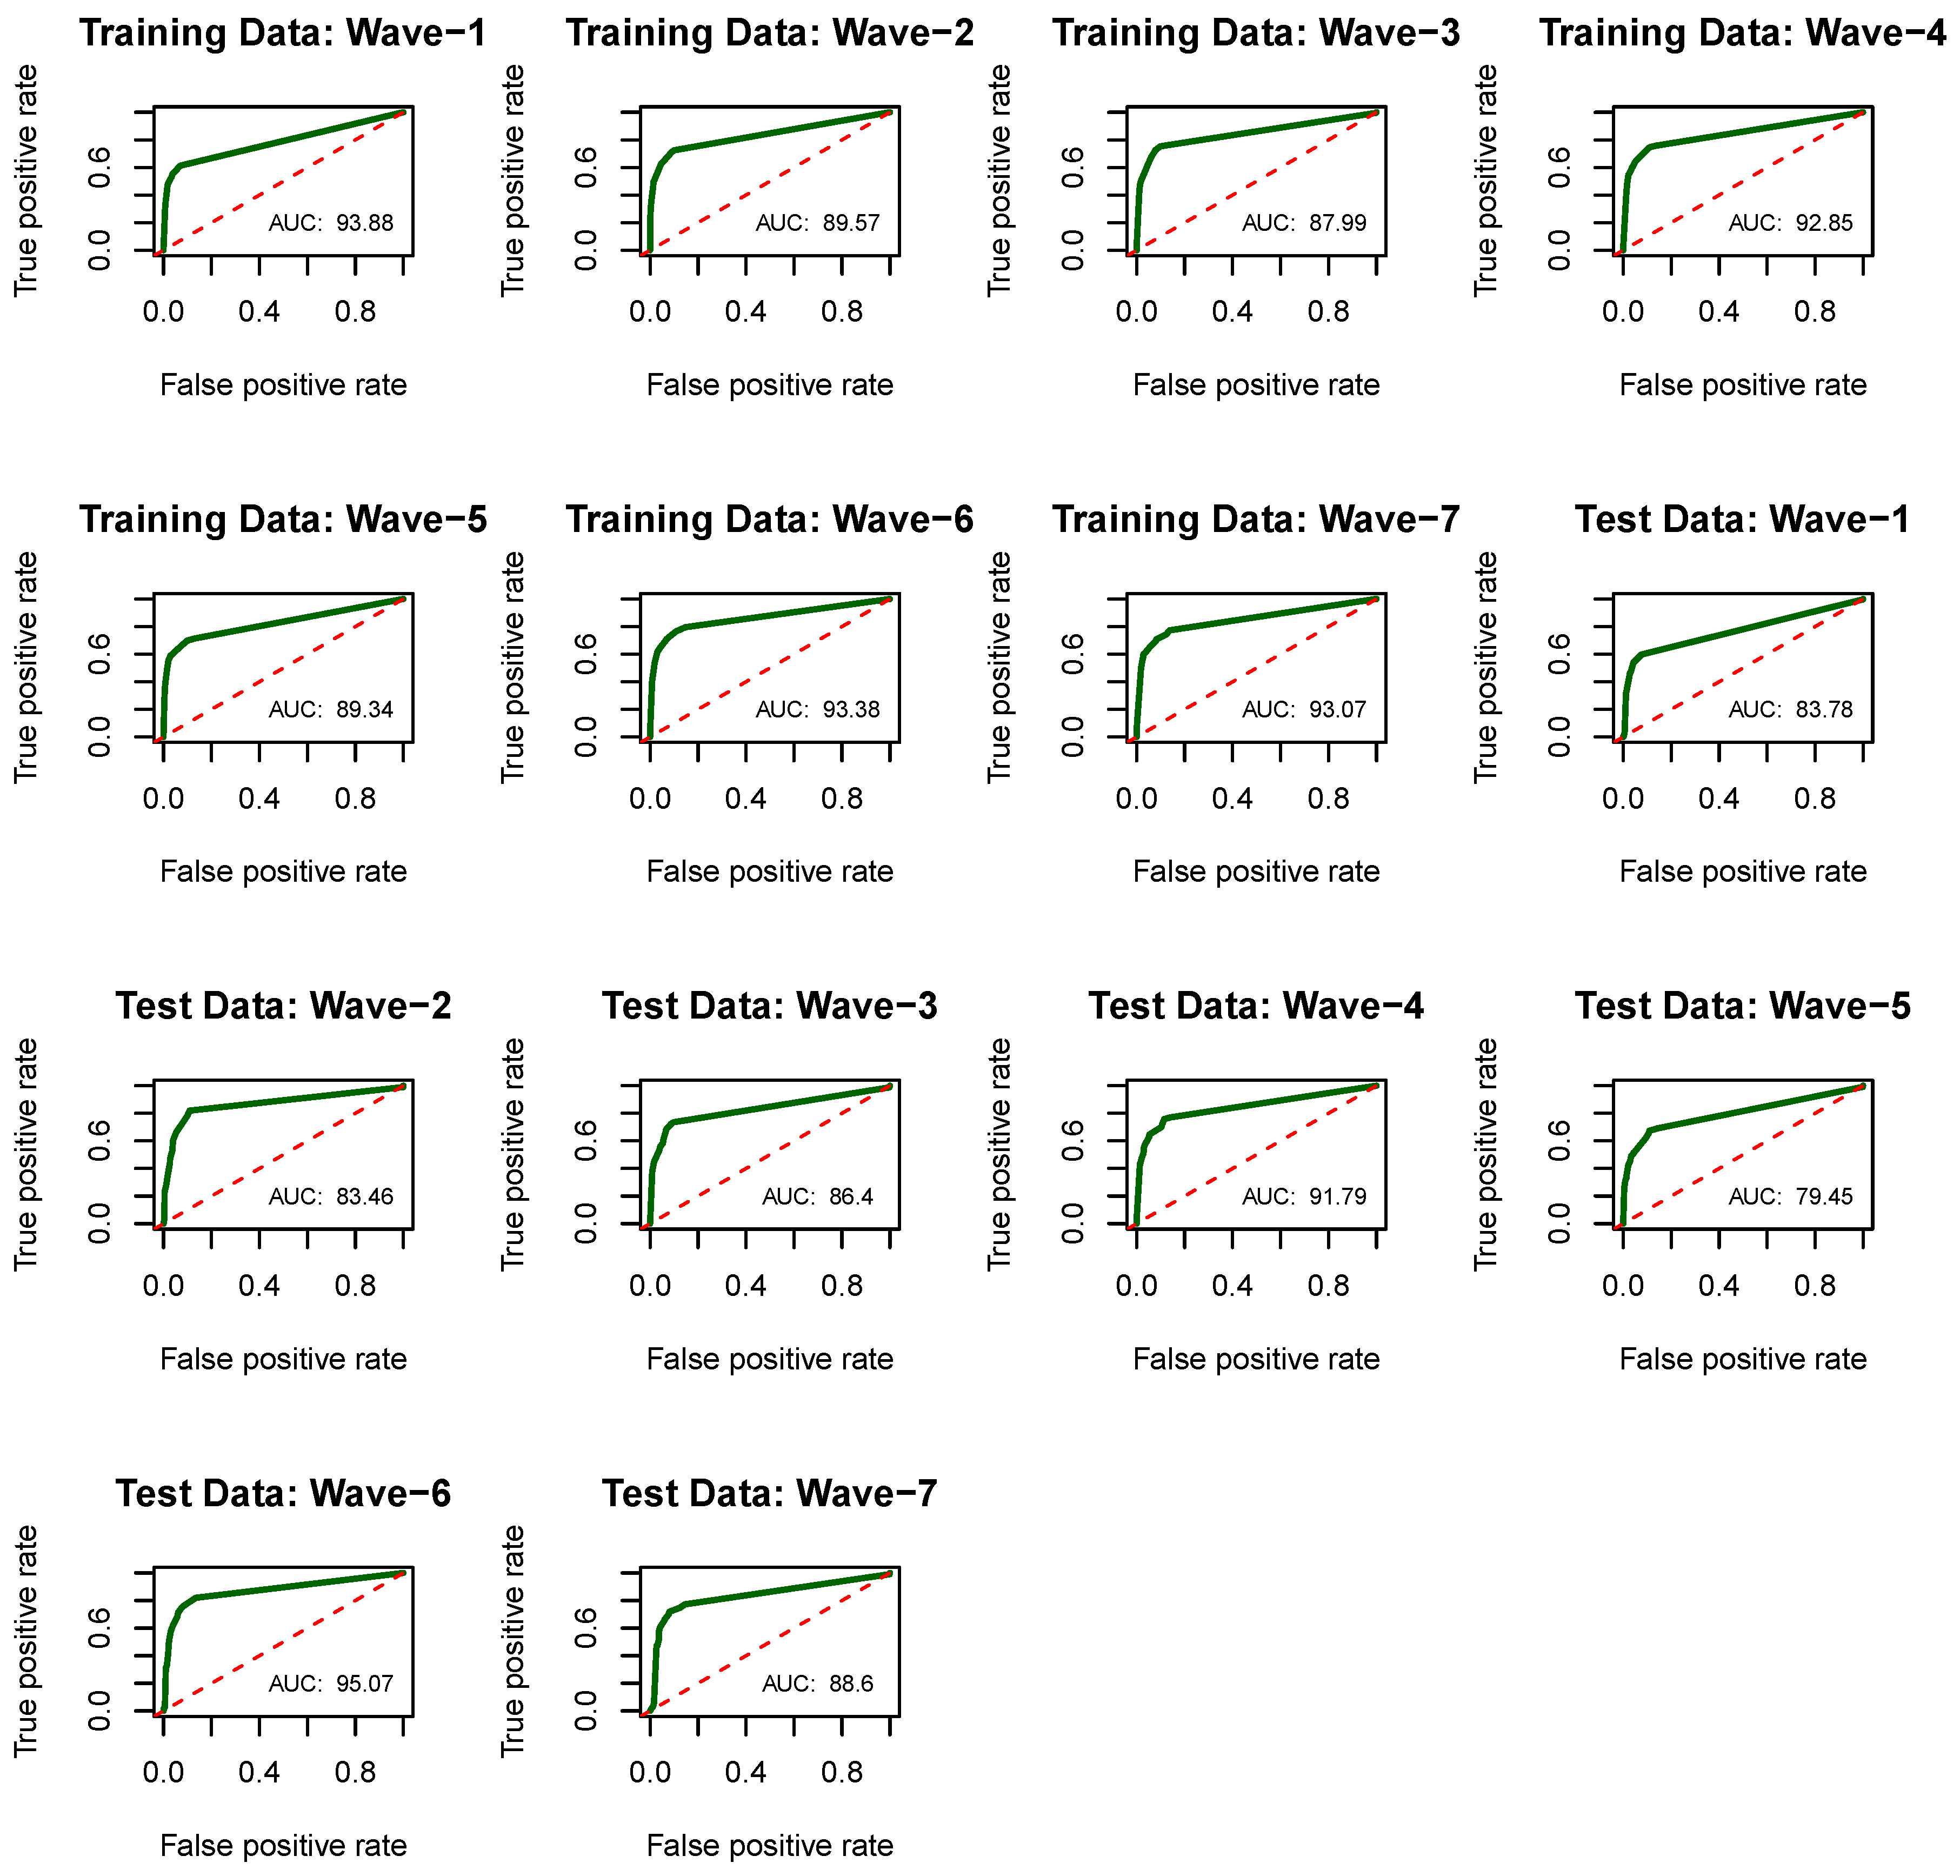
Figure A3.
ROC and AUC using K-Nearest Neighbor (KNN) for all waves for training and test data.
References
- UN. Peace, Dignity, and Equality on a Healthy Planet. 2024. Available online: https://www.un.org/en/global-issues/ageing (accessed on 1 December 2025).
- Cheek, P.; Nikpour, L.; Nowlin, H.D. Aging Well with Smart Technology. Nurs. Adm. Q. 2005, 29, 329–338. [Google Scholar] [CrossRef] [Scilit] [PubMed]
- Gadey, N.; Pataunia, P.; Chan, A.; Ríos, R.A. Technologies for monitoring activities of daily living in older adults: A systematic review. Disabil. Rehabil. Assist. Technol. 2024, 19, 1424–1433. [Google Scholar] [CrossRef] [Scilit] [PubMed]
- Ding, H.; Wang, K.; Li, Y.; Zhao, X. Trends in disability in activities of daily living and instrumental activities of daily living among Chinese older adults from 2011 to 2018. Aging Clin. Exp. Res. 2024, 36, 27. [Google Scholar] [CrossRef] [Scilit]
- Lu, Z.; Leung, J.; Auyeung, T.W.; Lee, J.; Lo, K.; Lai, K.-S.; Lam, K.; Woo, J.; Kwok, T. Trajectories of Instrumental Activities of Daily Living and Their Predictors among Older Men and Women in Hong Kong: A 14-Year Prospective Study. Gerontology 2005, 71, 81–87. [Google Scholar] [CrossRef] [Scilit]
- Liao, W.L.; Chang, Y.H. Age trajectories of disability in instrumental activities of daily living and disability-free life expectancy among middle-aged and older adults in Taiwan: An 11-year longitudinal study. BMC Geriatr. 2020, 20, 530. [Google Scholar] [CrossRef] [Scilit]
- Lee, M.; Mishra, R.K.; Momin, A.; El-Refaei, N.; Bagheri, A.B.; York, M.K.; Kunik, M.E.; Derhammer, M.; Fatehi, B.; Lim, J.; et al. Smart-Home Concept for Remote Monitoring of Instrumental Activities of Daily Living (IADL) in Older Adults with Cognitive Impairment: A Proof of Concept and Feasibility Study. Sensors 2022, 22, 6745. [Google Scholar] [CrossRef] [Scilit]
- Cloutier, S.; Chertkow, H.; Kergoat, M.J.; Gélinas, I.; Gauthier, S.; Belleville, S. Trajectories of decline on instrumental activities of daily living prior to dementia in persons with mild cognitive impairment. Int. J. Geriatr. Psychiatry 2020, 36, 314–323. [Google Scholar] [CrossRef] [Scilit] [PubMed]
- Pulli, P.; Hyry, J.; Pouke, M.; Yamamoto, G. User interaction in smart ambient environment targeted for senior citizens. Med. Biol. Eng. Comput. 2012, 50, 1119–1126. [Google Scholar] [CrossRef] [Scilit] [PubMed]
- Wang, C.; Redmond, S.J.; Lu, W.; Stevens, M.C.; Lord, S.R.; Lovell, N.H. Selecting Power-Efficient Signal Features for a Low-Power Fall Detector. IEEE Trans. Biomed. Eng. 2017, 64, 2729–2736. [Google Scholar] [PubMed]
- Burnham, J.P.; Lu, C.; Yaeger, L.H.; Bailey, T.C.; Kollef, M.H. Using wearable technology to predict health outcomes: A literature review. J. Am. Med. Inform. Assoc. 2018, 25, 1221–1227. [Google Scholar] [CrossRef] [Scilit]
- Sawyer, A.; Brannigan, J.; Spielman, L.; BCI Functional Outcome Measures Group; Putrino, D.; Fry, A. Development of a novel clinical outcome assessment: Digital instrumental activities of daily living. EBioMedicine 2025, 116, 105732. [Google Scholar] [CrossRef] [Scilit]
- Ray, S.J.; Cherian, J.; Liberty, A.M.; Hammond, T.A.; Shireman, P.K. Recognition of Basic Activities of Daily Living Using Wearable Devices for Older Adults: Scoping Review. J. Med. Internet Res. 2025, 27, e67373. [Google Scholar] [CrossRef] [Scilit] [PubMed]
- Imeri, H.; Desselle, S.; Hetemi, D.; Hoti, K. Mobile Electronic Devices as Means of Facilitating Patient Activation and Health Professional Empowerment Related to Information Seeking on Chronic Conditions and Medications: Qualitative Study. JMIR Mhealth Uhealth 2021, 9, e26300. [Google Scholar] [CrossRef] [Scilit] [PubMed]
- Vijayan, V.; Connolly, J.P.; Condell, J.; McKelvey, N.; Gardiner, P. Review of Wearable Devices and Data Collection Considerations for Connected Health. Sensors 2021, 21, 5589. [Google Scholar] [CrossRef] [Scilit]
- Frost, B. Market Research Report. Strategy R 2014, 7215, 1–31. [Google Scholar]
- Pando, A. Wearable Health Technologies and Their Impact on the Health Industry. Forbes. 2019. Available online: https://www.forbes.com/councils/forbestechcouncil/2019/05/02/wearable-health-technologies-and-their-impact-on-the-health-industry/ (accessed on 10 August 2025).
- Tankovska, H. Global Connected Wearable Devices 2016–2022. Statista. 2020. Available online: www.statista.com/statistics/487291/global-connected-wearable-devices/ (accessed on 1 August 2025).
- Pantelopoulos, A.; Bourbakis, N.G. A Survey on Wearable Sensor-Based Systems for Health Monitoring and Prognosis. IEEE Trans. Syst. Man. Cybern. Part C Appl. Rev. 2009, 40, 1–12. [Google Scholar] [CrossRef] [Scilit]
- Patient-Centered Care. The Latest Trends in Wearable Technology for Healthcare. 29 March 2024. Available online: https://healthtechmagazine.net/article/2024/03/trends-wearable-technology-for-healthcare-perfcon (accessed on 25 May 2025).
- Cabanillas-Carbonell, M.; Zapata-Paulini, J. Evaluation of machine learning models for the prediction of Alzheimer’s: In search of the best performance. Brain Behav. Immun. Health 2025, 44, 100957. [Google Scholar] [CrossRef] [Scilit]
- Turner, K.; Jo, A.; Wei, G.; Tabriz, A.A.; Clary, A.; Jim, H.S.L. Sharing patient-generated data with healthcare providers: Findings from a 2019 national survey. J. Am. Med. Inform. Assoc. 2021, 28, 371–376. [Google Scholar] [CrossRef] [Scilit]
- Liu, S. Wearable Technology–Statistics & Facts Statista. 2019. Available online: www.statista.com/topics/1556/wearabletechnology/ (accessed on 9 July 2025).
- Garcia-Moreno, F.M.; Bermudez-Edo, M.; Rodríguez-García, E.; Pérez-Mármol, J.M.; Garrido, J.L.; Rodríguez-Fórtiz, M.J. A machine learning approach for semi-automatic assessment of IADL dependence in older adults with wearable sensors. Int. J. Med. Inform. 2022, 157, 104625. [Google Scholar] [CrossRef] [Scilit] [PubMed]
- Nguena, N.H.L.; Pagé, M.G.; Katz, J.; Choinière, M.; Vanasse, A.; Dorais, M.; Samb, O.M.; Lacasse, A. Trajectory Modelling Techniques Useful to Epidemiological Research: A Comparative Narrative Review of Approaches. Clin. Epidemiol. 2020, 12, 1205–1222. [Google Scholar] [CrossRef] [Scilit]
- Nagin, D.S.; Tremblay, R.E. What Has Been Learned from Group-Based Trajectory Modeling? Examples from Physical Aggression and Other Problem Behaviors. Ann. Am. Acad. Political Soc. Sci. 2005, 602, 82–117. [Google Scholar] [CrossRef] [Scilit]
- Chowdhury, R.I.; Islam, M.A. Regressive models for risk prediction of repeated multinomial outcomes: An illustration using Health and Retirement Study data. Biom. J. 2020, 62, 898–915. [Google Scholar] [CrossRef] [Scilit]
- Chowdhury, R.I.; Islam, M.A. Prediction of risks of sequence of events using multistage proportional hazards model: A marginal-conditional modelling approach. Stat. Methods Appl. 2020, 29, 141–171. [Google Scholar] [CrossRef] [Scilit]
- Chowdhury, R.I.; Islam, M.A. Predictive Models for Trajectory Risks Prediction from Repeated Ordinal Outcomes. Bull. Malays. Math. Sci. Soc. 2022, 45, 161–209. [Google Scholar] [CrossRef] [Scilit]
- Chowdhury, R.I.; Hasan, M.T.; Sneddon, G. Regressive Class Modelling for Predicting Trajectories of COVID-19 Fatalities Using Statistical and Machine Learning Models. Bull. Malays. Math. Sci. Soc. 2022, 45, 235–250. [Google Scholar] [CrossRef] [Scilit]
- Chowdhury, R.I.; Hasan, M.T.; Huda, S.; Sneddon, G. Regressive class models for machine learning algorithms to predict trajectories of repeated multinomial outcomes: An application to the activity of daily living of elderly data. Commun. Stat. Simul. Comput. 2025, 54, 2110–2131. [Google Scholar] [CrossRef] [Scilit]
- Islam, M.A.; Chowdhury, R.I. Prediction of disease status: A regressive model approach for repeated measures. Stat. Methodol. 2010, 7, 520–540. [Google Scholar] [CrossRef] [Scilit]
- Islam, M.A.; Chowdhury, R.I. Analysis of Repeated Measures Data; Springer: Singapore, 2017. [Google Scholar]
- Pollington, F.; Denaxas, S.C.; Li, K.; Thygesen, J.H.; Lyratzopoulos, G.; White, B. Evaluation of trajectory analysis for disease risk assessment: A scoping review. J. Am. Med. Inform. Assoc. 2025, 26, ocaf208. [Google Scholar] [CrossRef] [Scilit]
- Swinckels, L.; Bennis, F.C.; Ziesemer, K.A.; Scheerman, J.F.M.; Bijwaard, H.; de Keijzer, A.; Bruers, J.J. The Use of Deep Learning and Machine Learning on Longitudinal Electronic Health Records for the Early Detection and Prevention of Diseases: Scoping Review. J. Med. Internet Res. 2024, 26, e48320. [Google Scholar] [CrossRef] [Scilit]
- Amirahmadi, A.; Ohlsson, M.; Etminani, K. Deep learning prediction models based on EHR trajectories: A systematic review. J. Biomed. Inform. 2023, 144, 104430. [Google Scholar] [CrossRef] [Scilit]
- Kabore, R.; Haller, M.C.; Harambat, J.; Heinze, G.; Leffondré, K. Risk prediction models for graft failure in kidney transplantation: A systematic review. Nephrol. Dial. Transplant. 2023, 32, ii68–ii76. [Google Scholar] [CrossRef] [Scilit] [PubMed]
- Tripepi, G.; Heinze, G.; Jager, K.J.; Stel, V.S.; Dekker, F.W.; Zoccali, C. Risk prediction models. Nephrol. Dial. Transplant. 2013, 28, 1975–1980. [Google Scholar] [CrossRef] [Scilit]
- Health and Retirement Study (HRS). HRS 2022 Core (Early, Version 2.0) [Data File]. 2024. Available online: https://hrs.isr.umich.edu/news/data-announcements (accessed on 1 November 2024).
- Sonnega, A.; Faul, J.D.; Ofstedal, M.B.; Langa, K.M.; Phillips, J.W.; Weir, D.R. Cohort Profile: The Health and Retirement Study (HRS). Int. J. Epidemiol. 2014, 43, 576–585. [Google Scholar] [CrossRef] [Scilit]
- Rice, K.; Chen, J.; Kakara, R.; Haddad, Y.K. Risk of Diminished Activities of Daily Living (ADLs) and Instrumental Activities of Daily Living (IADLs) After an Older Adult Fall, Medicare Current Beneficiary Survey, 2015–2020. Am. J. Lifestyle Med. 2025. Online ahead of print. [Google Scholar] [CrossRef] [Scilit]
- Yosuke, O.; Takao, S.; Miji, K.; Narumi, K.; Ken, F.; Yuko, Y.; Hirohiko, H.; Hunkyung, K. Association between exercise type and the decline in instrumental activities of daily living in community-dwelling older women: A 4-year prospective study. Prev. Med. 2018, 112, 23–30. [Google Scholar] [CrossRef] [Scilit]
- Wang, K.; Zhu, Z.; Qi, X. Socioeconomic Status Disparities in Cognitive and Physical Functional Impairment among Older Adults: Comparison of Asians with other Major Racial/Ethnic Groups. J. Urban Health 2023, 100, 839–851. [Google Scholar] [CrossRef] [Scilit]
- Escobar-Viera, C.G.; Jones, P.D.; Schumacher, J.R.; Hall, A.G. Association between living alone and physical inactivity among people with and without disability, Florida Behavioral Risk Factor Surveillance System, 2009. Prev. Chronic Dis. 2014, 11, E173. [Google Scholar] [CrossRef] [Scilit] [PubMed]
- Storeng, S.H.; Sund, E.R.; Krokstad, S. Factors associated with basic and instrumental activities of daily living in elderly participants of a population-based survey: The Nord-Trndelag Health Study, Norway. BMJ Open 2018, 8, e018942. [Google Scholar] [CrossRef] [Scilit] [PubMed]
- Meisler, A.W.; Gianoli, M.O.; Na, P.J.; Pietrzak, R.H. Functional disability in US military veterans: The importance of integrated whole health initiatives. Prim. Care Companion CNS Disord. 2023, 25, 22m03461. [Google Scholar] [CrossRef] [Scilit]
- Benge, J.F.; Ali, A.; Chandna, N.; Rana, N.; Mis, R.; González, D.A.; Kiselica, A.M.; Scullin, M.K.; Hilsabeck, R.C. Technology-based instrumental activities of daily living in persons with Alzheimer’s disease and related disorders. Alzheimer’s Dement. 2024, 16, e70022. [Google Scholar] [CrossRef] [Scilit]
- Fauth, E.B.; Schaefer, S.Y.; Zarit, S.H.; Ernsth-Bravell, M.; Johansson, B. Associations Between Fine Motor Performance in Activities of Daily Living and Cognitive Ability in a Nondemented Sample of Older Adults: Implications for Geriatric Physical Rehabilitation. J. Aging Health 2017, 29, 1144–1159. [Google Scholar] [CrossRef] [Scilit]
- Bleijenberg, N.; Zuithoff, N.P.A.; Smith, A.K.; de Wit, N.J.; Schuurmans, M.J. Disability in the Individual ADL, IADL, and Mobility among Older Adults: A Prospective Cohort Study. J. Nutr. Health Aging 2017, 21, 897–903. [Google Scholar] [CrossRef] [Scilit] [PubMed]
- Covinsky, K.E.; Palmer, R.M.; Fortinsky, R.H.; Counsell, S.R.; Stewart, A.L.; Kresevic, D.; Burant, C.J.; Landefeld, C.S. Loss of independence in activities of daily living in older adults hospitalized with medical illnesses: Increased vulnerability with age. J. Am. Geriatr. Soc. 2003, 51, 451–458. [Google Scholar] [CrossRef] [Scilit]
- Guo, H.J.; Sapra, A. Instrumental Activity of Daily Living. [Updated 2022 Nov 14]. In StatPearls [Internet]; StatPearls Publishing: Treasure Island, FL, USA, 2025. Available online: https://www.ncbi.nlm.nih.gov/books/NBK553126/ (accessed on 4 December 2025).
- Loucks, J.; Bucaille, A.; Stewart, D.; Crossan, G. Wearable Technology in Health Care: Getting Better all the Time; Deloitte Insights: New York, NY, USA, 2021; Available online: https://www.deloitte.com/us/en/insights/industry/technology/technology-media-and-telecom-predictions/2022/wearable-technology-healthcare.html (accessed on 6 December 2025).
- Connolly, D.; Garvey, J.; McKee, G. Factors associated with ADL/IADL disability in community dwelling older adults in the Irish longitudinal study on ageing (TILDA). Disabil. Rehabil. 2017, 39, 809–816. [Google Scholar] [CrossRef] [Scilit] [PubMed]
- Ćwirlej-Sozańska, A.; Wiśniowska-Szurlej, A.; Wilmowska-Pietruszyńska, A.; Sozańsk, B. Determinants of ADL and IADL disability in older adults in southeastern Poland. BMC Geriatr. 2019, 19, 297. [Google Scholar] [CrossRef] [Scilit] [PubMed]
- Moon, S.; Oh, E.; Chung, D.; Hong, G.S. Changes in instrumental activities of daily living limitations and their associated factors according to gender in community-residing older adults: A longitudinal cohort study. PLoS ONE 2024, 19, e0296796. [Google Scholar] [CrossRef] [Scilit]
- Fayemiwo, M.A.; Olowookere, T.A.; Olaniyan, O.O.; Ojewumi, T.O.; Oyetade, I.S.; Freeman, S.; Jackson, P. Immediate word recall in cognitive assessment can predict dementia using machine learning techniques. Alzheimers Res. Ther. 2023, 15, 111. [Google Scholar] [CrossRef] [Scilit]
- Kasper, J.D.; Freedman, V.A. National Health and Aging Trends Study User Guide: Rounds 1–8 Final Release; Johns Hopkins University School of Public Health: Baltimore, MD, USA, 2019. [Google Scholar]
- Gao, J.; Kim, H.; Mitra, S. Out-of-Pocket Health Expenditures Associated with Chronic Health Conditions and Disability in China. Int. J. Environ. Res. Public Health 2023, 20, 6465. [Google Scholar] [CrossRef] [Scilit]
- Lindsey, J.K.; Lambert, P. On the appropriateness of marginal models for repeated measurements in clinical trials. Stat. Med. 1998, 17, 447–469. [Google Scholar] [CrossRef]
- Lee, Y.; Nelder, J.A. Conditional and Marginal Models: Another View. Stat. Sci. 2004, 19, 219–238. [Google Scholar] [CrossRef] [Scilit]
- Breslow, N.E.; Clayton, D.G. Approximate Inference in Generalized Linear Mixed Models. J. Am. Stat. Assoc. 1993, 88, 9–25. [Google Scholar] [CrossRef] [Scilit]
- Wu, Y.; Xiang, C.; Jia, M.; Fang, Y. Interpretable classifiers for prediction of disability trajectories using a nationwide longitudinal database. BMC Geriatr. 2022, 22, 627. [Google Scholar] [CrossRef] [Scilit]
- Fernández, D.R.A.; Fernández, D.R.; Jaén, M.G.; Cortell-Tormo, J.M. Recognition of Daily Activities in Adults with Wearable Inertial Sensors: Deep Learning Methods Study. JMIR Med. Inform. 2024, 12, e57097. [Google Scholar] [CrossRef] [Scilit]
- James, G.; Witten, D.; Hastie, T.; Tibshirani, R. An Introduction to Statistical Learning: With Applications in R, 2nd ed.; Springer: New York, NY, USA, 2021. [Google Scholar]
- Jafari-Koulaee, A.; Mohammadi, E.; Fox, M.T.; Rasekhi, A.; Akha, O. Predictors of basic and instrumental activities of daily living among older adults with multiple chronic conditions. BMC Geriatr. 2024, 24, 383. [Google Scholar] [CrossRef] [Scilit]
- Gilmour, H.; Park, J. Dependency, chronic conditions, and pain in seniors. Statistics Canada Catalogue 82-003. Suppl. Health Rep. 2006, 16, 21–31. [Google Scholar]
- Shamout, F.; Zhu, T.; Clifton, D.A. Machine Learning for Clinical Outcome Prediction. IEEE Rev. Biomed. Eng. 2021, 14, 116–126. [Google Scholar] [CrossRef] [Scilit] [PubMed]
- Sutton, R.T.; Pincock, D.; Baumgart, D.C.; Sadowski, D.C.; Fedorak, R.N.; Kroeker, K.I. An overview of clinical decision support systems: Benefits, risks, and strategies for success. npj Digit Med. 2020, 3, 17. [Google Scholar] [CrossRef] [Scilit] [PubMed]
- Tun, H.M.; Rahman, H.A.; Naing, L.; Malik, O.A. Trust in Artificial Intelligence–Based Clinical Decision Support Systems Among Health Care Workers: Systematic Review. J. Med. Internet Res. 2025, 27, e69678. [Google Scholar] [CrossRef] [Scilit]
- Chen, Z.; Liang, N.; Zhang, H.; Li, H.; Yang, Y.; Zong, X.; Chen, Y.; Wang, Y.; Shi, N. Harnessing the power of clinical decision support systems: Challenges and opportunities. Open Heart 2023, 10, e002432. [Google Scholar] [CrossRef] [Scilit]
- Salimparsa, M.; Sedig, K.; Lizotte, D.J.; Abdullah, S.S.; Chalabianloo, N.; Muanda, F.T. Explainable AI for Clinical Decision Support Systems: Literature Review, Key Gaps, and Research Synthesis. Informatics 2025, 12, 119. [Google Scholar] [CrossRef] [Scilit]
- Abbas, Q.; Jeong, W.; Lee, S.W. Explainable AI in Clinical Decision Support Systems: A Meta-Analysis of Methods, Applications, and Usability Challenges. Healthcare 2025, 13, 2154. [Google Scholar] [CrossRef] [Scilit]
- Mahmood, A. The role of AI and wearables in injury prediction and performance optimization. Prem. J. Artif. Intell. 2025, 4, 100019. [Google Scholar] [CrossRef] [Scilit]
- Shi, X.; Mishra, D.K.; Özcan, Ö.Ö.; Karahan, M.; Panpan, T.; Zhongshan, X.; Kumar, P.V. Wearable smart sensors integration with AI and machine learning for tracking human health. Biosens. Bioelectron. X 2025, 27, 100711. [Google Scholar] [CrossRef] [Scilit]
- Sara, S. AI and Machine Learning in Wearable Sensor Technology. 2025, pp. 1–14. Available online: https://medium.com/@sequenex/ai-and-machine-learning-in-wearable-sensor-technology-d17ac626fc8 (accessed on 22 December 2025).
- Mahajan, A.; Heydari, K.; Powell, D. Wearable AI to enhance patient safety and clinical decision-making. npj Digit. Med. 2025, 8, 176. [Google Scholar] [CrossRef] [Scilit] [PubMed]
- Shajari, S.; Kuruvinashetti, K.; Komeili, A.; Sundararaj, U. The Emergence of AI-Based Wearable Sensors for Digital Health Technology: A Review. Sensors 2023, 23, 9498. [Google Scholar] [CrossRef] [Scilit] [PubMed]
- Haick, H.; Tang, N. Artificial Intelligence in Medical Sensors for Clinical Decisions. ACS Nano 2021, 15, 3557–3567. [Google Scholar] [CrossRef] [Scilit] [PubMed]

Disclaimer/Publisher’s Note: The statements, opinions and data contained in all publications are solely those of the individual author(s) and contributor(s) and not of MDPI and/or the editor(s). MDPI and/or the editor(s) disclaim responsibility for any injury to people or property resulting from any ideas, methods, instructions or products referred to in the content. |
© 2026 by the authors. Licensee MDPI, Basel, Switzerland. This article is an open access article distributed under the terms and conditions of the Creative Commons Attribution (CC BY) license.