


Simple Summary
Acute erythroid leukemia (AEL) or AML-M6, an often a fatal type of acute myeloid leukemia, is primarily seen in older adults and rarely in children. AEL is relatively understudied because of its rarity compared to other subtypes. In this report, we describe the establishment and characterization of a new AEL cell line, LS-CHM, with unique features derived from ascitic fluid of a patient with congenital erythroid leukemia. LS-CHM with BCOR mutation, which is very uncommon in the pediatric age group, provides new insights into leukemogenesis as a novel and the first congenital AEL cell line and is a useful tool for further studies with potential therapeutic implications.
Abstract
Background: Acute erythroid leukemia (AEL) or AML-M6 predominantly affects older adults and is rare in childhood. Compared with other AML subtypes, AEL remains relatively understudied because of its rarity. We established LS-CHM, a novel AEL cell line derived from the ascitic fluid of a patient with congenital leukemia. Interestingly, leukemic cells persisted in the ascitic fluid even after successful eradication from the bone marrow and extramedullary sites. Method: Leukemia cells from the ascites fluid exhibited robust proliferation in culture independent of cytokine requirement and were further characterized by flow cytometric immunophenotyping, cytogenetics, cell cycle and doubling time analysis, colony formation, genome and RNA sequencing, myeloid gene next generation sequencing, and cytotoxicity analysis. Results: LS-CHM displayed CD36, partial CD235a, CD31, CD43, and CD71 expression and demonstrated in vitro robust growth and high sensitivity to chemotherapeutic agents. A PDX mouse model showed development of leukemia. Genomic analysis revealed a frameshift BCOR mutation in the absence of additional mutations and downregulated TP53 expression with an exonic non-deleterious mutation. RNA sequencing of LS-CHM cells revealed upregulation of two cohesin complex genes, RAD21 and SMC3, whose high levels are associated with hematopoietic stem cell differentiation into erythroid lineage. Conclusions: LS-CHM represents the first congenital AEL-derived cell line, in contrast to the predominantly adult-origin and often secondary erythroid leukemia cell lines available currently. Thus, LS-CHM provides a unique pediatric and extramedullary AEL model, expanding the existing spectrum of AEL cell lines and offering valuable opportunities for biologic and therapeutic investigations.
1. Introduction
Acute erythroid leukemia (AEL), also referred to as acute myeloid leukemia (AML)-M6, is a rare AML subtype, representing 1–5% of adult AML cases and less than 1% of pediatric AML cases with poor prognosis and a median survival of 2–3 months [1,2,3,4]. AEL results from impaired terminal differentiation and uncontrolled proliferation of dysplastic erythroid progenitor cells [4]. Adult AEL arises from prior myeloid neoplasms or therapy related and nearly all are associated with TP53 mutation. In contrast, pediatric AEL occurs de novo, frequently lacks TP53 mutation and has a different pathogenesis than adult AEL [5,6]. Due to its rarity, AEL is understudied, and the development of novel AEL cell lines is essential to improve research and therapeutic strategies [1,3,7]. Here, we describe LS-CHM, a newly established first congenital AEL cell line with a BCOR mutation derived from ascitic fluid from a patient with congenital AEL. Congenital AML itself is an extremely rare condition with dismal prognosis and an estimated incidence of 1–5 cases per million live births [8]. It frequently presents with prominent extramedullary involvement including hepatosplenomegaly, central nervous system infiltration and skin lesions—leukemia cutis, sometimes occurring in the absence of bone marrow involvement at initial presentation [9]. Skin lesions are seen in 93% of cases and sometimes present as cutaneous myeloid sarcoma prior to the diagnosis of AML with bone marrow involvement [10,11].
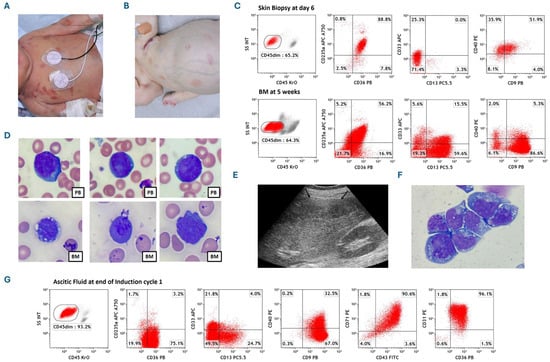
The patient was a female infant born at 36 weeks of gestation with widespread cutaneous/subcutaneous, dusky red maculopapular/nodular lesions (Figure 1A). Initial tests showed a white blood count (WBC) of 9 × 10⁹/L, hemoglobin 12 g/dL, and platelets 92 × 109/L. Peripheral blood (PB) flow cytometry showed 1% immature cells positive for CD235a, CD36, CD33, CD13, CD9, and CD40, and negative for CD34, CD117, CD38, CD41/61, and myeloperoxidase (MPO). Bone marrow (BM), cerebrospinal fluid (CSF), skin biopsies, and PB all showed immature cells with similar immunophenotypes and a normal female karyotype (46, XX). She was diagnosed with congenital AEL defined by differentiation, with only 2% BM involvement but significant extramedullary disease, with skin biopsy showing 65% erythroid blasts by flow cytometry (Figure 1B). Remarkably, there was self-involution of many cutaneous lesions and improved PB counts over three weeks without active therapy.
Figure 1.
Presentation and course of the case. (A) Photograph depicts extensive erythematous cutaneous lesions in the newborn on the second day of life with congenital leukemia. (B) Photograph depicts significant abdominal distention and pallor along with some level of improvement in erythematous cutaneous lesions when the patient returned at 5 weeks of age. (C) Comparison of flow cytometric staining patterns of clonal cells obtained from skin biopsy and bone marrow. Skin biopsy dot-plots displaying leukemic population expressing CD235a, CD36, CD40, partial CD9 and CD33, while marrow cells expressing CD235a, CD36, CD9, CD13, and partial CD40 and CD33, indicating their erythroid lineage with minimal differences in two different tissue microenvironments. (D) Microscopic images of individual immature erythroid cells along with a single dysplastic normoblast in the middle lower row, observed on peripheral blood and bone marrow slides characterized by increased nucleocytoplasmic ratio, deep blue cytoplasm, and cytoplasmic vacuolation stained with Wright–Giemsa 100×. PB denotes peripheral blood; BM denotes bone marrow. (E) Abdominal ultrasound image showing ascites (arrowheads) after the first chemotherapy cycle. (F) Microscopic image of centrifuged ascites fluid leukemic cells characterized by irregular nuclear shape, blue cytoplasm, cytoplasmic vacuolation, and loose nuclear chromatin with several nucleoli with Wright–Giemsa staining 100×. (G) Flow cytometric dot-plots of AEL cells isolated from ascites fluid showing expression of CD36, CD9, CD31, CD43, and CD71, partial expression of CD13, CD33, and CD40, and very scant expression of CD235a.
At five weeks, the patient presented with significant abdominal distension (Figure 1B). An abdominal ultrasound revealed enlarged abdominal lymph nodes. The WBC was elevated and flow cytometry showed BM blasts increased to 64% (Figure 1C) with a normal female karyotype and negative 56-myeloid gene next generation sequencing (NGS). Wright–Giemsa-stained PB and BM smears showed immature erythroid cells along with dysplastic normoblast characterized by increased nucleocytoplasmic ratio, deep blue cytoplasm, and cytoplasmic vacuolation (Figure 1D). At the end of the first induction chemotherapy with cytarabine, daunorubicin, and etoposide, and intrathecal therapy until CSF cleared, the BM was in remission with negative measurable residual disease (MRD). Abdominal ultrasound, however, showed large ascites and calcified lymph nodes (Figure 1E). Microscopic evaluation of Wright–Giemsa-stained ascites fluid leukemic cells displayed irregular nuclear shape, blue cytoplasm, cytoplasmic vacuolation, and loose nuclear chromatin with several nucleoli (Figure 1F). Cytogenetics of ascites fluid showed clonal evolution with trisomy 8 and 12 (47, XX, +8[12]/48, XX, +8, +12(3)/46, XX[5]). NGS panel showed BCOR mutation with three different clones: BCOR frameshift mutation (.c.1962dup,.p.Arg655GInfs*10) with VAF 37.4%, BCOR frameshift mutation (.c.1544_1569del,.p.Ser515Lysfs*33) VAF 2.7% and BCOR nonsense mutation (.c1573_1579del,.p.Met525*) with VAF 4.2%. Immunophenotyping showed 93% CD45-negative blasts that expressed CD36, CD9, CD31, CD71, and CD43, with scant expression of CD235a and partial expression of CD13, CD33 and CD40 (Figure 1G).
At the end of the second induction, the BM showed 2% MRD with karyotype 48, XX, +8, +12[6]/52, idem, +7, +8, +13, +19[5]/46, XX[9]. She could not proceed with the bone marrow transplant due to rapid clinical deterioration, which led to death at 4 months of age.
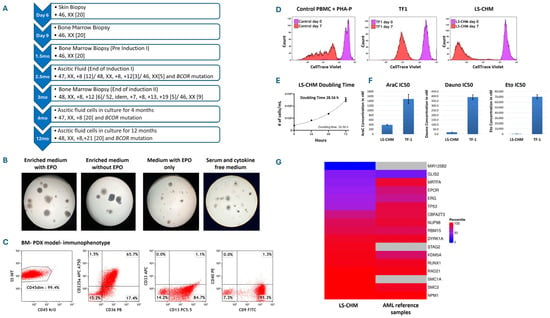
After obtaining written informed consent from parents to use excess diagnostic material for research purposes, as approved by Central Michigan University Institutional Review Board, ascitic fluid cells were cryopreserved and later cultured in RPMI 1640 supplemented with 20% Fetal Bovine Serum (FBS) and gentamycin with and without cytokines at the density of 0.5 × 10⁶/mL at 37 °C and 5% CO2. Leukemia cells demonstrated continued rapid proliferation without cytokine support. The cultures were split every 2–3 days and maintained at the density of 0.5 to 1 × 10⁶/mL. Cytogenetics of cultured cells showed trisomy 8 in all mitoses at 4 months and further clonal evolution to 48, XX, +8, +21 at 12 months. This cytogenetic clonal evolution was acquired in vitro in culture environment (Figure 2A).
Figure 2.
Course of cytogenetic/molecular changes in the primary cells and cultured cells and investigations for the LS-CHM AEL cell line establishment. (A) Comprehensive timeline of cytogenetic and molecular genetic changes in patient samples and culture-maintained leukemia cells. (B) Images of ascites fluid AEL cell colonies grown in different semi-solid culture media; MethoCult H4435-enriched methylcellulose medium for human cells with cytokines and erythropoietin (EPO), MethoCult H4535 enriched with cytokines without EPO, MethoCult H4330 medium with EPO only and Methocult H4236 serum-free methylcellulose medium without cytokines (StemCell Technologies, Vancouver, BC, Canada). Colony assays showed robust growth in cytokines supplemented media with or without EPO, while smaller colonies were observed in EPO-only and cytokine and serum-free media. (C) Flow cytometry dot-plots of bone marrow cells obtained from PDX mouse model developed by injecting ascites fluid AEL cells show similar phenotypic characteristics expressing CD235a, CD36, CD9, and CD13. Minor changes among expression patterns may be associated with the microenvironment leukemia cells. (D) CellTrace™ Violet assay conducted to evaluate proliferative potential of the cell line. Normal peripheral blood control lymphocytes treated with PHA-P exhibited five distinct cell divisions by day 7 compared to day 0. Conversely, both LS-CHM and TF1 cells display a single peak on day 7, indicating synchronized cell division throughout the entire cell population. The lower intensity of CellTrace™ Violet in LS-CHM cells on day 7 indicates a greater number of cell divisions occurred compared with TF1 cells. (E) Ascitic fluid leukemia cell doubling time. The LS-CHM AEL cells exhibited a short doubling time of 28.5 h (F) Evaluation and comparison of IC50 values for Cytarabine (AraC), Daunorubicin (Dauno) and Etoposide (Eto) between LS-CHM and TF1 cells. Lower IC50 values and higher drug sensitivity for all three drugs is seen in LS-CHM cells. (G) Comparison of gene expression rank percentile between LS-CHM sample from 4-week cultured cells RNA sequencing data and 45 pediatric AML reference samples. Each row of the heatmap corresponds to a gene of interest. The left and right columns depict the percentile of gene expression rank for our AEL sample and the average of 45 pediatric AML reference samples, respectively, ranging from blue (low expression) to red (high expression). The three gray boxes indicate that SMC1A, STAG2, and MIR125B2 are not reported in the 45 pediatric reference samples.
Myeloid gene NGS showed a BCOR frameshift mutation (c.1573_1579delATG; p.Met525*) with a variant allele frequency of 50%, reported as likely pathogenic, at 4 and 12 months in culture. The cells retained immunophenotypes consistent with AEL (CD45neg, CD235a partial+, CD36+, CD71+, CD31+) gaining partial CD235a expression and losing CD9, CD13, CD40, and CD33 expression at 12 months in culture compared to the diagnostic pattern and retained this immunophenotype later at different timepoints over 24 months in continuous culturing, confirming the cell type, origin and immunophenotypic stability (Supplementary Figure S1A). The cell line was designated LS-CHM.
2. Materials and Methods
2.1. Immunophenotyping of Cells Obtained from Skin Biopsy, Peripheral Blood, Bone Marrow, Cerebrospinal Fluid, and Ascites Fluid
Immunophenotyping for leukemia panel was performed on skin biopsy, peripheral blood, bone marrow, cerebrospinal fluid, and ascites fluid specimens to establish the diagnosis by staining the cells with an extensive panel of conjugated monoclonal antibodies: CD1a, CD2, CD3, CD4, CD5, CD7, CD8, CD9, CD10, CD11b, CD13, CD14, CD15, CD16, CD19, CD20, CD22, CD23, CD30, CD33, CD34, CD36, CD40, CD41+61, CD56, CD57, CD64, CD117, CD133, HLA-DR, and intracellular CD3, MPO, TdT, and CD79a (Beckman Coulter, Brea, CA, USA). Acquisition and analysis were performed on Beckman Coulter 10-color Gallios flow cytometer (Beckman Coulter, Brea, CA, USA).
2.2. Morphological Characterization of PB, BM and Ascites Fluid AEL Cells
PB and BM smears and cytospin slides of ascites fluid were stained with Wright–Giemsa-stain and examined under microscope for morphological characterization of leukemia cells.
2.3. In Vitro Culture of Leukemic Ascites Fluid Cells
Cryopreserved ascites fluid cells were thawed rapidly in 37 °C water bath. Cells were washed and half of the cells were resuspended in complete culture medium (RPMI +20% Fetal Bovine Serum + gentamycin), while the remaining aliquot was resuspended in complete culture medium supplemented with cytokines Stem Cell Factor (Peprotech, Rocky Hill, NJ, USA) (100 ng/mL), IL3 (10 ng/mL), IL6 (20 ng/mL), TPO (10 ng/mL), FLT3 ligand (10 ng/mL) and Erythropoietin (EPO) (Biolegend, San Diego, CA, USA) in 25 mL cell culture flasks at the concentration 0.5 × 10⁶/mL and allowed to grow in an incubator at 37 °C and 5% CO2 until a sufficient cell number was reached for cytotoxicity assay. Cultures were supplemented with their respective cell culture medium as needed to maintain cell concentration at 0.5 × 10⁶/mL. Cultures were later continued only in complete culture medium without any cytokines after noticing continued cell proliferation independent of cytokines.
2.4. Immunophenotypic Characterization of Culture Grown Leukemic Ascites Fluid Cells
Baseline immunophenotyping for leukemia panel and additional markers CD31, CD43, CD71 (Beckman Coulter, Brea, CA, USA) was performed after thawing the cryopreserved ascites fluid cells. Acquisition and analysis were performed on Beckman Coulter 10-color Gallios flow cytometer (Beckman Coulter, Brea, CA, USA). Immunophenotypic characterization of cultures with and without cytokines was assessed on day 3, 7 and 11. Immunophenotyping was also performed on passage 6 cells of the cultures grown without cytokines to observe any phenotypic changes. A 20% positivity cut-off level was used for individual markers.
2.5. Morphological Characterization of Culture Grown Cells
Cytospin slides were prepared and stained with Wright–Giemsa stain to assess the morphology of the culture grown cells.
2.6. Cytogenetic Analysis
Patient’s diagnostic and 6-week culture-grown ascites fluid cells were submitted to the Detroit Medical Center cytogenetics laboratory for chromosomal analysis. Twenty metaphase cells were analyzed, and karyotyping and Fluorescence In Situ Hybridization (FISH) analysis were performed.
2.7. Colony Forming Assay and Immunophenotypic Characterization of Colonies
Ascites fluid cells were cultured in four different semisolid culture media: MethoCult H4435 Enriched (methylcellulose medium for human cells with cytokines and with EPO), MethoCult H4535 Enriched without Erythropoietin (EPO) (methylcellulose medium for human cells with cytokines and without EPO) and MethoCult H4330 (methylcellulose medium for human cells with EPO only) and Methocult H4236 (serum-free methylcellulose medium without cytokines) for human cells (StemCell Technologies, Vancouver, BC, Canada) to determine colony formations in different growth environments. Cells were plated in 24-well culture plates at 500 cells/well in triplicates and cultured for 14 days at 37 °C and 5% CO2. The cells were then harvested from four different culture media and assessed for surface markers CD9, CD13, CD31, CD33, CD36, CD40, CD43, CD45, CD71, and CD235a. Acquisition and analysis was performed on Beckman Coulter 10-color Gallios flow cytometer (Beckman Coulter, Brea, CA, USA).
2.8. Doubling Time
Ascitic fluid cells were incubated at 2 × 10⁵ cells/mL in complete culture medium at 37 °C and 5% CO2. Cell counts were performed every 24 h to determine the doubling time.
2.9. Cell Trace Violet Assay
CellTrace Violet (Invitrogen, Waltham, MA, USA) 5 mM stock solution was prepared by dissolving the contents of one vial of CellTrace Violet in 20 µL DMSO. A total of 1 µL of 5 mM CellTrace violet was added to 2 × 10⁶ cells suspended in 1 mL PBS. Cells were incubated for 20 min at 37 °C and 5% CO2. After 20 min, 5 mL of complete culture medium was added to the cells and incubated for 5 min to quench any unbound dye. Cells were then centrifuged, pelleted, and resuspended in complete culture medium. Cells were incubated for 10 min before analysis to allow the CellTrace Violet to undergo acetate hydrolysis. Acquisition and analysis were performed on Beckman Coulter 10-color Gallios flow cytometer on days 0, 2, 4 and 7 to track the cell division by monitoring CellTrace Violet fluorescence. Propidium Iodide (PI) (Biolegend, San Diego, CA, USA) was used as a viability dye to gate on live cells.
2.10. Cell Cycle Analysis
Suspension cells grown in complete culture medium were harvested and washed in PBS and fixed in cold 80% ethanol by adding drop wise to the pellet while vortexing to ensure fixation of all cells and prevent clumping. Cells were fixed for at least 30 min at 4 °C. Cells were then washed 2 times in PBS and centrifuged at 1000 g. Supernatant was discarded, and cells were treated with PI/RNase to lyse free RNA and ensure only DNA staining. After 24 h incubation at 4 °C, acquisition and analysis were performed on Beckman Coulter Gallios flow cytometer to measure the PI fluorescence after excluding the doublets to determine percent populations in G0/G1, S and G2/M phase.
2.11. Dose Response Cytotoxicity Assay and IC50 Determination by Annexin V/PI Flow Cytometry Assay
A cytotoxicity assay with Annexin V and PI was performed on LS-CHM cells and established AEL cell line TF-1. LS-CHM cells were maintained in complete culture medium (RPMI-1640 supplemented with 20% fetal bovine serum + Gentamycin). As per growth requirements, TF-1 cells were maintained in complete culture medium supplemented with 2 ng/mL GMCSF (Biolegend, San Diego, CA, USA) at 37 °C and 5% CO2 in a humidified incubator. Cell viability prior to treatment was greater than 90%, as assessed by trypan blue exclusion.
Cytarabine, etoposide and Daunorubicin were prepared as a stock solution in PBS and diluted in complete culture medium immediately before use. Cells were seeded at 1 × 10⁵ cells/mL in 24-well plates and treated with six to eight increasing concentrations of the drug for 24 h. Untreated cells served as controls.
Following 24 h of incubation, cells were harvested, washed with cold PBS, and were stained with Annexin V FITC and PI and incubated for 15 min at room temperature in the dark, followed by the addition of Annexin buffer with counting beads prior to acquisition.
Samples were acquired on a 10-color Beckman Coulter Gallios flow cytometer (Beckman Coulter, Brea, CA, USA) and the absolute count of viable cells (Annexin V-/PI-) was recorded. Percent cytotoxicity was calculated as (control viable cell absolute count—drug-treated viable cell absolute count) × 100/control viable cell absolute count. The experiments were performed in triplicate. IC50 values were calculated with GraphPad Prism (version 10) using nonlinear regression analysis with [Inhibitor] vs. response–variable slope (four parameters) model. IC50 values for each drug were compared between TF-1 and LS-CHM.
2.12. Patient Derived Xenograft (PDX) Mouse Model
Three triple transgenic NSG-SGM3 (NSGS) mice (strain #013062; 6–8 weeks old and 23 g ± 2 g body weight at the time of implant; Jackson Laboratory, Bar Harbor, ME, USA) (1 × 10⁶ cells/mouse) were injected with primary leukemia cells via tail vein. Mice were euthanized when leukemic symptoms progressed (hindleg paralysis, >10–15% weight loss, internal mass > 500 mg), with all outcomes confirmed by necropsy. BM was later harvested for analysis. All mice were provided with food and water and libitum, given supportive fluids and supplements as needed, and housed within an Association for Assessment and Accreditation of Laboratory Animal Care (AAALAC) accredited animal facility with 24/7 veterinary care. In vivo experiments were approved by the Institutional Animal Care and Use Committee at Wayne State University.
2.13. RNA Sequencing
Four-week cultured cells were submitted for bulk RNA sequencing analysis at Genomics Science Core and Myeloid panel to Genetics and Molecular pathology laboratory, Wayne State University, Detroit, MI. Salmon was used to quantify RNA transcript abundance (i.e., expression), and RNA transcripts corresponding to protein-coding genes were used for further analysis [12]. Due to a sample size of one, no normalization was performed. The average gene expression of all genes reported in the 45 samples in the Children’s Oncology Group AML trials with bulk RNA-sequencing data available was used as a reference [13]. Specifically, for each gene reported in (i) our sample and (ii) the 45 pediatric AML reference samples, the rank of the average reported gene expression was computed.
2.14. Whole-Genome Sequencing
Four-week cultured cells were submitted for whole-genome sequencing analysis at the Genomics Science Core and Myeloid panel to Genetics and Molecular pathology laboratory, Wayne State University, Detroit, MI. A Burrows–Wheeler Aligner was used to align reads with the human genome (build 38), and short germline variants were determined using the Genome Analysis Toolkit’s Best Practice Workflow [14,15]. Low-quality variants with either (1) Phred-scaled probability of a homozygous-reference genotype less than 250, (2) Phred-scaled probability that the variant call is incorrect less than 90, (3) root mean square mapping quality of all reads spanning the given variant site less than 50, and/or (4) proportion of alternate allele depth less than 1/6 were removed using bcftools [16]. The tool ANNOVAR (June 2020 version) was used to annotate additional information such as the gene(s); each variant is found in [17].
2.15. Myeloid Next Generation Sequencing
BM at diagnosis and four- and twelve-month cultured cells were submitted for Myeloid gene panel to Genetics and Molecular pathology laboratory, Wayne State University, Detroit, MI. Multiplex PCR of 568 amplicons was performed using the Illumina TruSight Myeloid Panel to target frequently mutated regions of 49 genes implicated in AML, myelodysplastic syndromes, myeloproliferative neoplasms, chronic myelogenous leukemia, chronic myelomonocytic leukemia and juvenile myelomonocytic leukemia. Next generation sequencing was performed on Illumina’s MiSeqDx with 150 bp paired end reads and a mean depth of coverage of ≥1000×. Sequencing data was analyzed with Illumina’s Local Run Manager software using the published human genome build UCSC hg19 as the reference sequence. Agilent’s Alissa Interpret software was used to evaluate sequence changes in this individual. Reported sequence variants with the following features are confirmed by Sanger sequencing or another appropriate method: (1) variants with variant allele fractions less than 10%; (2) variants with variant allele fractions between 10 and 20% and read depth 500×. Mutation nomenclature is based on the recommendations of the Human Genome Variation Society (HGVS). Variants are classified according to the Association for Molecular Pathology, American Society of Clinical Oncology and College of American Pathologists standards and guidelines for the interpretation and reporting of sequence variants in [18].
2.16. Mycoplasma Testing of LS-CHM
Testing for the presence of mycoplasma in cell culture was performed using the PCR method at four weeks in culture [19].
2.17. LS-CHM Authentication
An archived PBMC sample and twenty-seven-month cultured cells were submitted for STR profiling and comparison.
3. Results
3.1. Surface Marker Expression
Immunophenotyping on peripheral blood, bone marrow, skin biopsy revealed CD45 dim blast positive for CD235a, CD36, CD33, CD13, CD9, and CD40, and negative for CD34, CD117, CD38, CD41/61, and myeloperoxidase (MPO) with minimal differences due to different tissue microenvironments. CD40, CD36, and CD235a are expressed in the cell surface of red cell precursors and its predominance in our case, along with negative MPO expression, strongly favored AEL.
3.2. Morphological Characterization of PB, BM and Ascites Fluid Leukemia Cells
Wright–Giemsa-stained PB and BM smears showed immature erythroid cells along with dysplastic normoblast, characterized by increased nucleocytoplasmic ratio, deep blue cytoplasm, and cytoplasmic vacuolation. Microscopic evaluation of Wright–Giemsa-stained ascites fluid leukemic cells also displayed irregular nuclear shape, blue cytoplasm, cytoplasmic vacuolation, and loose nuclear chromatin with several nucleoli consistent with immature erythroblasts.
3.3. In Vitro Culture of Leukemic Ascites Fluid Cells
The in vitro culture grown cells retained an immunophenotype consistent with AEL (CD45neg, CD235a partial+, CD36+, CD71+, and CD31+) gaining partial CD235a expression and losing CD9, CD13, CD40, and CD33 expression at 12 months in culture compared to the diagnostic pattern, and retained this immunophenotype later at different timepoints (over 24 months), confirming the cell type.
3.4. Colony-Forming Assay and Immunophenotypic Characterization of Colonies
LS-CHM cells showed robust colony formation in cytokine-supplemented media with or without EPO compared to media without cytokines, displaying EPO independence for colony formation (Figure 2B). Flow cytometry showed harvested cells from the colonies from different culture conditions expressed similar surface markers to suspension cultures. This indicated that the growth of the colonies was not dependent on the presence of cytokines.
3.5. Cytogenetics Analysis
Twenty to thirty mitotic figures were analyzed. Initial cytogenetic analysis of the peripheral blood and bone marrow sample revealed normal karyotype 46, XX. Cytogenetics of ascites fluid showed clonal evolution with trisomy 8 and 12 (47, XX, +8[12]/48, XX, +8, +12(3)/46, XX[5]). Cytogenetics of cultured cells showed trisomy 8 in all mitoses at 4 months and further clonal evolution to 48, XX, +8, +21 at 12 months.
3.6. PDX Mouse Model
A patient-derived xenograft (PDX) model was developed by injecting primary ascites-derived cells into the tail vain of three triple-transgenic NSG-SGM3 mice. Mice exhibited a significant weight loss by day 36 and a median survival of 41 days. Cells recovered from mouse bone marrow showed immunophenotype similar to patient’s BM leukemia cells with 99.9% involvement (Figure 2C). About ~2% of the cells also exhibited stem cell features with CD45−, CD34+, CD38−, and CD96+ immunophenotypes, supporting tumorigenic potential (Supplementary Figure S1B). The peritoneal space was not involved in the PDX mouse model, reflecting differences in tumor microenvironment.
3.7. Cell Trace Analysis
A Cell Trace Violet assay was performed to track cell proliferation and different generations of the cell population to determine the number of cell divisions in culture over 7 days. Control lymphocytes treated with phytohemagglutinin-P 5 μg/mL underwent five cell divisions at day 7 whereas both LS-CHM and another AEL cell line, TF1, showed a single peak at day 7, indicating synchronized cell division of the entire population (Figure 2D).
3.8. Doubling Time
LS-CHM cells exhibited a rapid doubling time of 28.5 h (Figure 2E). LS-CHM cells collected at 12-month culture period were found to have a similar doubling time of 26.15 h, exhibiting continued robust proliferation.
3.9. Cell Cycle Analysis
Cell cycle analysis by flow cytometry of LS-CHM cells treated with Propidium Iodide (PI)/RNase (Biolegend, San Diego, CA, USA) to determine percent populations in G0/G1, S and G2/M phase by measuring PI fluorescence revealed a high S-phase population (16–28%), consistent with rapid proliferation (Supplementary Figure S2A).
3.10. Cytotoxic Effects of Chemotherapeutic Agents of LS Cell Line
LS-CHM showed significantly higher sensitivity, with lower IC50 values, to all three drugs—Cytarabin, Etoposide and Daunorubicin—compared to the TF-1 cell line. IC50 of Cytarabin was 390 nM for LS-CHM vs. 1487 nM for TF-1. IC50 of Etoposide was 664 nM for LS-CHM vs. 70141 nM for TF-1 and IC50 of Daunorubicin was 21 nM for LS-CHM vs. 391 nM for TF-1. (Figure 2F) [20]. Their sensitivity likely reflects their congenital leukemia origin, being a newly established cell line with a rapid proliferation rate.
3.11. RNA Sequencing
RNA sequencing showed upregulation of two cohesin complex genes, RAD21 and SMC3, compared to the 45 pediatric AML reference samples. The other two cohesion complex genes, SMC1A and STAG2, are among the most highly expressed genes in LS-CHM cells as well. While KDM5A is upregulated, TP53, EPOR, and NUP98 are downregulated compared to average pediatric AML samples. Furthermore, NPM1 is among the most highly expressed genes in both LS-CHM cells and in the average pediatric AML samples (Figure 2G).
3.12. Whole Genome Sequencing
The BCOR gene showed a high number of variants, including three exonic variants, one of which was predicted to be deleterious. Other genes with high variant counts, such as RUNX1, ERG, DYRK1A, STAG2, TET2, DNMT3A, and CBFA2T3, contained only non-coding changes that were not pathogenic. Exonic variants were also detected in TP53, RBM15, MRTFA, GLIS2, and SMC3; however, none were classified as deleterious, highlighting BCOR as the only gene with a pathogenic mutation (Table 1).
Table 1.
LS-CHM whole genome sequencing data showing the number of variants in genes of interest that are commonly mutated in AML.
3.13. Myeloid Next Generation Sequencing
At the end of induction, NGS results of primary ascites fluid cells demonstrated BCOR mutations with three distinct clones at differing variant allele frequencies (VAFs). A dominant clone with frameshift mutation (.c.1962dup, .p.Arg655GInfs*10, VAF 37.4%) and two smaller subclones, frameshift mutation (.c.1544_1569del, .p. Ser515Lysfs*33, VAF 2.7%) and nonsense mutation (.c1573_1579del, .p.Met525*, VAF 4.2%). In contrast, the myeloid NGS of ascites-derived cells maintained in culture at 4 and 12-month showed exclusive persistence of BCOR (c.1573_1579delATG; p.Met525*) with an increased VAF of 50%. There were no other significant mutations found including TP53 variants.
3.14. Mycoplasma Testing
LS-CHM did not show any mycoplasma contamination as per PCR testing.
3.15. Authentication of LS-CHM
STR profiling of culture grown LS-CHM cells at 27 months and primary PBMC showed 100% match showing that the cell line is derived from the patient’s leukemia cells.
3.16. Cell Line Availability
This cell line will be available to the qualified investigators on reasonable request to the corresponding author.
4. Discussion
Establishing cell lines from primary AEL cells has been very challenging. We successfully established an LS-CHM cell line that has continued to proliferate in culture for more than two years while maintaining its morphology, doubling time, immunophenotype and cytogenetic characteristics.
An interesting feature of the LS-CHM cells is their ascitic fluid origin when leukemia cells were successfully eradicated from the bone marrow and several extramedullary sites. This raises the possibilities of the limited diffusion of chemotherapy into the peritoneal fluid, seeding from incomplete response in abdominal lymph nodes, or tissue tropism, as in vitro cytotoxicity assay and determination of IC50 for cytarabine, etoposide and daunorubicin showed LS-CHM having high sensitivity to all three drugs compared to the other established erythroid leukemia cell line TF-1.
LS-CHM and F-36P are both derived from effusion fluids (Table 2), indicating high proliferative and infiltrative behavior. This distinguishes them from other bone marrow-derived cell lines. LS-CHM proliferates faster than most other AEL cell lines, consistent with aggressive in vitro growth without cytokines with a doubling time of 28.5 h. In contrast, other erythroleukemia cell lines, including TF-1, AS-E2 and F-36P, display variable dependence on EPO, GM-CSF, or IL-3 [21,22,23,24,25,26,27,28,29].
Table 2.
Comparison of LS-CHM with commercially available established AEL cell lines.
Immunophenotypically, LS-CHM expresses CD31, CD36, CD43, and CD71, with partial CD235a and absence of lymphoid, myeloid, megakaryocytic, and stem cell markers (CD3, CD13, CD14, CD15, CD19, CD34, CD41, and CD117) defining an erythroid profile. In contrast, most other erythroid leukemia cell lines except AS-E2 express a broader myeloid, megakaryocytic or stem cell marker profile, including expression of the HLA-DR profile in addition to erythroid markers CD36, CD71 and CD235a [21,22,23,24,25,26,28,29]. Similar to the AS-E2 cell line, LS-CHM displays some late erythroid cell characteristics; however, it is highly proliferative and cytokine-independent [26].
RNA sequencing of LS-CHM cells at 4 weeks of culture revealed upregulation of two cohesin complex genes, RAD21 and SMC3, compared to 45 pediatric AML reference samples. High cohesion levels are associated with hematopoietic stem cell differentiation into erythroid lineage [30,31]. The other two cohesion complex genes, SMC1A and STAG2, are among the most highly expressed genes in LS-CHM cells as well (Figure 2G). Furthermore, one of the cohesion complex genes, SMC3, contained exonic mutations and was observed in 50% of the cases with myeloid leukemia of Down syndrome in which the expression of erythroid-specific genes was observed (Table 1) [32,33,34]. While KDM5A is upregulated, TP53, EPOR, and NUP98 are downregulated compared to average pediatric AML samples. Furthermore, NPM1 is among the most highly expressed genes in both LS-CHM cells and the average pediatric AML samples. While these results are noteworthy, we caution against placing too much merit in them and advise they be treated more as preliminary results given our sample size of one.
LS-CHM is the first congenital AEL cell line, with the BCOR mutation suggesting a distinct leukemogenesis mechanism, contrasting with many adult-derived erythroleukemia cell lines, such as HEL, OCI-M1, AS-E2, F-36P, TF1, and a pediatric KMOE-2, which mainly feature TP53 and JAK2/NRAS/KMT2A pathway mutations (Table 2). The BCOR gene is located on the X chromosome and plays a role in the repression of BCL-6 transcription. It is a transcription factor involved in hematopoiesis. BCOR mutations are rarely found in pediatric AML (<2% cases) and are often acquired during disease progression [35]. The clinical significance of BCOR mutations in pediatric AML cases is unknown and requires further investigation [36]. BCOR mutations are detected in 4% of cytogenetically normal AML and are more commonly found in secondary AML than de novo AML in adult patients [37,38]. BCOR deficiency has been implicated in AEL development and associated with adverse outcome [39,40]. Sporotoletti et al. have shown that concomitant BCOR and DNMT3A loss leads to the development of AEL in mice [41]. LS-CHM harbors BCOR mutation alone. At 4 months in culture LS-CHM cells showed exclusive persistence of minor BCOR subclone (c.1573_1579delATG; p.Met525*) from primary ascites cells with an increased VAF of 50%, indicating selective outgrowth of previously minor BCOR mutant subclone in cultured conditions and loss of dominant clone (c.1962dup; p.Arg655Glnfs10, VAF 37.4%) observed in the primary cells. These findings may indicate culture-induced clonal selection in the absence of a native tumor microenvironment. At this time point, the LS-CHM cells cytogenetically showed trisomy 8 in all mitoses (47, XX, +8[20]) and later developed trisomy 21 (48, XX, +8, +21[20]) at 12 months in culture. The BCOR nonsense variant, p.Met525*, seen in LS-CHM, has not been previously reported. However, other genes critical to AML development that are often found concomitant with BCOR mutations, DNMT3A, RUNX1, TET2, and GATA1, were not affected [40]. Downregulation of TP53 and a non-deleterious exonic mutation in TP53 were also found in LS-CHM cells. Because spurious mutations can arise during the culturing process, there is a chance that some of the variants described were not present at the time of diagnosis [42].
5. Conclusions
Our case displayed the aggressive nature of congenital AEL, as the patient died at 4 months despite the treatment. These cases remain poorly understood because of the rarity of the disease and lack of representative experimental models. Pediatric AEL differs from adult-onset AEL in pathogenesis. This highlights an urgent need for developing in vitro translational models of pediatric AEL. The combination of congenital origin, ascitic fluid derivation, robust in vitro cytokine-independent growth, and the presence of a frameshift BCOR mutation with downregulated TP53 expression and absence of co-operating mutations defines LS-CHM as the novel congenital AEL cell line. Distinct from adult-derived AEL cell lines that typically harbor TP53, JAK2, NRAS, or KMT2A alterations, LS-CHM with BCOR mutation and the absence of TP53 mutation constitutes a valuable model for studying the biology of AEL with potential new insights into leukemogenesis and potential therapeutic implications [43,44].
Supplementary Materials
The following supporting information can be downloaded at: https://www.mdpi.com/article/10.3390/cancers18091396/s1, Figure S1: Immunophenotyping of LS-CHM cells after being maintained for 12 months in culture and leukemic stem cell marker profile of LS-CHM and the PDX mouse model; Figure S2: Repeat experiments on LS-CHM cells after being maintained for 12 months in culture for comparison with previous test results. Repeat experiments on LS-CHM cells after being maintained for 12 months in culture to compare with previous test results.
Author Contributions
Conceptualization, S.S.; Methodology, S.S., Y.G., J.W.T. and K.G.; Software, H.D., G.D. and K.G.; Validation, S.S.; Formal Analysis, S.S., M.G., H.D. and G.D.; Investigation, P.S., M.G., H.E., L.P., J.K., S.H.D., K.G., L.P., K.W., D.C. and O.M.; Resources, R.A. and Y.G.; Data Curation, H.D., G.D., M.G. and K.G.; Writing—Original Draft Preparation, P.S. and M.G.; Writing—Review and Editing, M.G., Y.G., J.W.T., K.G., H.D., G.D., R.A., D.C., O.M. and S.S.; Visualization, P.S., M.G., S.S., H.D. and G.D.; Supervision, S.S.; Project Administration, S.S.; Funding Acquisition, S.S. All authors have read and agreed to the published version of the manuscript.
Funding
This research was partially supported by funds from Children’s Foundation, Development of AML Cell lines with Acquired Resistance to Standard Therapies, grant number R1-2021-41.
Institutional Review Board Statement
Central Michigan University Institutional Review Board Leadership has determined this project does not meet the definition of human subject research under the purview of the IRB according to federal regulations. (IRB # 2022-1125, date of determination: 5 July 2022).
Informed Consent Statement
Not applicable since IRB determined this project as not meeting human subject research.
Data Availability Statement
The data that supports the findings of this study are available from the corresponding author upon reasonable request.
Acknowledgments
We would like to thank the family of the patient in their support for this project. We would like to also thank Karin Przyklenk, for her support in this effort.
Conflicts of Interest
The authors declare no conflicts of interest.
Abbreviations
The following abbreviations are used in this manuscript:
| AEL | Acute erythroid leukemia |
| AML | Acute myeloid leukemia |
| WBC | White blood count |
| PB | Peripheral blood |
| BM | Bone marrow |
| MPO | Myeloperoxidase |
| CSF | Cerebrospinal fluid |
| NGS | Next Generation Sequencing |
| MRD | Measurable residual disease |
| EPO | Erythropoietin |
| PI | Propidium Iodide |
| PDX | Patient-derived xenograft |
References
- Bain, B.J. Di Guglielmo and his syndromes. Br. J. Haematol. 2003, 120, 939–943. [Google Scholar] [CrossRef] [Scilit]
- Chisholm, K.M.; Heerema-McKenney, A.E.; Choi, J.K.; Smith, J.; Ries, R.E.; Hirsch, B.A.; Raimondi, S.C.; Alonzo, T.A.; Wang, Y.C.; Aplenc, R.; et al. Acute erythroid leukemia is enriched in NUP98 fusions: A report from the Children’s Oncology Group. Blood Adv. 2020, 4, 6000–6008. [Google Scholar] [CrossRef] [Scilit] [PubMed] [PubMed Central]
- Boddu, P.; Benton, C.B.; Wang, W.; Borthakur, G.; Khoury, J.D.; Pemmaraju, N. Erythroleukemia-historical perspectives and recent advances in diagnosis and management. Blood Rev. 2018, 32, 96–105. [Google Scholar] [CrossRef] [Scilit] [PubMed]
- Arber, D.A.; Orazi, A.; Hasserjian, R.; Thiele, J.; Borowitz, M.J.; Le Beau, M.M.; Bloomfield, C.D.; Cazzola, M.; Vardiman, J.W. The 2016 revision to the World Health Organization classification of myeloid neoplasms and acute leukemia. Blood 2016, 127, 2391–2405. [Google Scholar] [CrossRef] [Scilit]
- Chang-Graham, A.L.; Nguyen, T.; Oak, J.; Silva, O.; Gruber, T.A. CIC-Rearrangements in Pediatric Acute Erythroid Leukemia/Erythroblastic Sarcoma. Pediatr. Blood Cancer 2025, 72, e31848. [Google Scholar] [CrossRef] [Scilit] [PubMed]
- Fitzpatrick, M.J.; Yuan, J.; Capa, I.; Bledsoe, J.R.; Kibler, C.E.; Tucker, C.; Shuai, W.; Matsumoto, N.P.; Zhu, G.G.; Ding, Y.; et al. Erythroblastic Sarcoma in Adults and Children: Different Pathways to the Same Destination. Mod. Pathol. 2025, 38, 100716. [Google Scholar] [CrossRef] [Scilit] [PubMed]
- Iacobucci, I.; Wen, J.; Meggendorfer, M.; Choi, J.K.; Shi, L.; Pounds, S.B.; Carmichael, C.L.; Masih, K.E.; Morris, S.M.; Lindsley, R.C.; et al. Genomic subtyping and therapeutic targeting of acute erythroleukemia. Nat. Genet. 2019, 51, 694–704. [Google Scholar] [CrossRef] [Scilit] [PubMed] [PubMed Central]
- Zhang, Q.; Ren, Z.; Yang, J.; Yin, A. Analysis of 59 cases of congenital leukemia reported between 2001 and 2016. J. Int. Med. Res. 2019, 47, 4625–4635. [Google Scholar] [CrossRef] [Scilit] [PubMed] [PubMed Central]
- Roberts, I.; Fordham, N.J.; Rao, A.; Bain, B.J. Neonatal leukaemia. Br. J. Haematol. 2018, 182, 170–184, Erratum in Br. J. Haematol. 2019, 186, 196. https://doi.org/10.1111/bjh.16040. [Google Scholar] [CrossRef] [Scilit] [PubMed]
- Green, K.; Tandon, S.; Ahmed, M.; Toscano, W.; O’Connor, D.; Ancliff, P.; Vora, A.; Bartram, J.; Samarasinghe, S.; Ghorashian, S.; et al. Congenital acute myeloid leukemia: Challenges and lessons. A 15-year experience from the UK. Leuk. Lymphoma 2021, 62, 688–695. [Google Scholar] [CrossRef] [Scilit] [PubMed]
- Mullen, B.; Sabet, K.; Jacobs, S.; Calleroz, A.T.; Habeshian, K.A.; Cheng, J. Myeloid sarcoma in a newborn: A rare manifestation of congenital acute myeloid leukemia. Pediatr. Dermatol. 2023, 40, 751–752. [Google Scholar] [CrossRef] [Scilit] [PubMed]
- Patro, R.; Duggal, G.; Love, M.I.; Irizarry, R.A.; Kingsford, C. Salmon provides fast and bias-aware quantification of transcript expression. Nat. Methods 2017, 14, 417–419. [Google Scholar] [CrossRef] [Scilit] [PubMed] [PubMed Central]
- Bolouri, H.; Farrar, J.E.; Triche, T., Jr.; Ries, R.E.; Lim, E.L.; Alonzo, T.A.; Ma, Y.; Moore, R.; Mungall, A.J.; Marra, M.A.; et al. The molecular landscape of pediatric acute myeloid leukemia reveals recurrent structural alterations and age-specific mutational interactions. Nat. Med. 2018, 24, 103–112, Erratum in Nat. Med. 2018, 24, 526. https://doi.org/10.1038/nm0418-526b. Erratum in Nat. Med. 2019, 25, 530. https://doi.org/10.1038/s41591-019-0369-7. [Google Scholar] [CrossRef] [Scilit]
- McKenna, A.; Hanna, M.; Banks, E.; Sivachenko, A.; Cibulskis, K.; Kernytsky, A.; Garimella, K.; Altshuler, D.; Gabriel, S.; Daly, M.; et al. The Genome Analysis Toolkit: A MapReduce framework for analyzing next-generation DNA sequencing data. Genome Res. 2010, 20, 1297–1303. [Google Scholar] [CrossRef] [Scilit] [PubMed] [PubMed Central]
- DePristo, M.A.; Banks, E.; Poplin, R.; Garimella, K.V.; Maguire, J.R.; Hartl, C.; Philippakis, A.A.; del Angel, G.; Rivas, M.A.; Hanna, M.; et al. A framework for variation discovery and genotyping using next-generation DNA sequencing data. Nat. Genet. 2011, 43, 491–498. [Google Scholar] [CrossRef] [Scilit]
- Danecek, P.; Bonfield, J.K.; Liddle, J.; Marshall, J.; Ohan, V.; Pollard, M.O.; Whitwham, A.; Keane, T.; McCarthy, S.A.; Davies, R.M.; et al. Twelve years of SAMtools and BCFtools. Gigascience 2021, 10, giab008. [Google Scholar] [CrossRef] [Scilit] [PubMed] [PubMed Central]
- Wang, K.; Li, M.; Hakonarson, H. ANNOVAR: Functional annotation of genetic variants from high-throughput sequencing data. Nucleic Acids Res. 2010, 38, e164. [Google Scholar] [CrossRef] [Scilit] [PubMed] [PubMed Central]
- Li, M.M.; Datto, M.; Duncavage, E.J.; Kulkarni, S.; Lindeman, N.I.; Roy, S.; Tsimberidou, A.M.; Vnencak-Jones, C.L.; Wolff, D.J.; Younes, A.; et al. Standards and Guidelines for the Interpretation and Reporting of Sequence Variants in Cancer: A Joint Consensus Recommendation of the Association for Molecular Pathology, American Society of Clinical Oncology, and College of American Pathologists. J. Mol. Diagn. 2017, 19, 4–23. [Google Scholar] [CrossRef] [Scilit] [PubMed] [PubMed Central]
- Uphoff, C.C.; Drexler, H.G. Detection of mycoplasma contaminations. Methods Mol. Biol. 2005, 290, 13–23. [Google Scholar] [CrossRef] [Scilit] [PubMed]
- Liu, S.; Qiao, X.; Wu, S.; Gai, Y.; Su, Y.; Edwards, H.; Wang, Y.; Lin, H.; Taub, J.W.; Wang, G.; et al. c-Myc plays a critical role in the antileukemic activity of the Mcl-1-selective inhibitor AZD5991 in acute myeloid leukemia. Apoptosis 2022, 27, 913–928. [Google Scholar] [CrossRef] [Scilit] [PubMed]
- Tabilio, A.; Rosa, J.P.; Testa, U.; Kieffer, N.; Nurden, A.T.; Del Canizo, M.C.; Breton-Gorius, J.; Vainchenker, W. Expression of platelet membrane glycoproteins and alpha-granule proteins by a human erythroleukemia cell line (HEL). EMBO J. 1984, 3, 453–459. [Google Scholar] [CrossRef] [Scilit] [PubMed] [PubMed Central]
- Amatruda, T.T., 3rd; Bohman, R.; Ranyard, J.; Koeffler, H.P. Pattern of expression of HLA-DR and HLA-DQ antigens and mRNA in myeloid differentiation. Blood 1987, 69, 1225–1236. [Google Scholar] [PubMed]
- Kitamura, T.; Tange, T.; Terasawa, T.; Chiba, S.; Kuwaki, T.; Miyagawa, K.; Piao, Y.F.; Miyazono, K.; Urabe, A.; Takaku, F. Establishment and characterization of a unique human cell line that proliferates dependently on GM-CSF, IL-3, or erythropoietin. J. Cell. Physiol. 1989, 140, 323–334. [Google Scholar] [CrossRef] [Scilit] [PubMed]
- Okano, H.; Okamura, J.; Yagawa, K.; Tasaka, H.; Motomura, S. Human erythroid cell lines derived from a patient with acute erythremia. J. Cancer Res. Clin. Oncol. 1981, 102, 49–55. [Google Scholar] [CrossRef] [Scilit] [PubMed] [PubMed Central]
- Papayannopoulou, T.; Nakamoto, B.; Kurachi, S.; Tweeddale, M.; Messner, H. Surface antigenic profile and globin phenotype of two new human erythroleukemia lines: Characterization and interpretations. Blood 1988, 72, 1029–1038. [Google Scholar] [CrossRef] [Scilit] [PubMed]
- Miyazaki, Y.; Kuriyama, K.; Higuchi, M.; Tsushima, H.; Sohda, H.; Imai, N.; Saito, M.; Kondo, T.; Tomonaga, M. Establishment and characterization of a new erythropoietin-dependent acute myeloid leukemia cell line, AS-E2. Leukemia 1997, 11, 1941–1949. [Google Scholar] [CrossRef] [Scilit] [PubMed]
- Chiba, S.; Takaku, F.; Tange, T.; Shibuya, K.; Misawa, C.; Sasaki, K.; Miyagawa, K.; Yazaki, Y.; Hirai, H. Establishment and erythroid differentiation of a cytokine-dependent human leukemic cell line F-36: A parental line requiring granulocyte-macrophage colony-stimulating factor or interleukin-3, and a subline requiring erythropoietin. Blood 1991, 78, 2261–2268. [Google Scholar] [CrossRef] [Scilit] [PubMed]
- Bairoch, A. The Cellosaurus, a Cell-Line Knowledge Resource. J. Biomol. Tech. JBT 2018, 29, 25–38. [Google Scholar] [CrossRef] [Scilit]
- German Collection of Microorganisms and Cell Cultures GmbH: Welcome to the Leibniz Institute DSMZ. Available online: www.dsmz.de/ (accessed on 7 April 2026).
- Sasca, D.; Yun, H.; Giotopoulos, G.; Szybinski, J.; Evan, T.; Wilson, N.K.; Gerstung, M.; Gallipoli, P.; Green, A.R.; Hills, R.; et al. Cohesin-dependent regulation of gene expression during differentiation is lost in cohesin-mutated myeloid malignancies. Blood 2019, 134, 2195–2208. [Google Scholar] [CrossRef] [Scilit] [PubMed] [PubMed Central]
- Rao, S. Closing the loop on cohesin in hematopoiesis. Blood 2019, 134, 2123–2125. [Google Scholar] [CrossRef] [Scilit] [PubMed] [PubMed Central]
- Boucher, A.C.; Caldwell, K.J.; Crispino, J.D.; Flerlage, J.E. Clinical and biological aspects of myeloid leukemia in Down syndrome. Leukemia 2021, 35, 3352–3360. [Google Scholar] [CrossRef] [Scilit]
- Boucher, A.; Murray, J.; Rao, S. Cohesin mutations in acute myeloid leukemia. Leukemia 2024, 38, 2318–2328. [Google Scholar] [CrossRef] [Scilit] [PubMed]
- Ito, E.; Kasai, M.; Hayashi, Y.; Toki, T.; Arai, K.; Yokoyama, S.; Kato, K.; Tachibana, N.; Yamamoto, M.; Yokoyama, M. Expression of erythroid-specific genes in acute megakaryoblastic leukaemia and transient myeloproliferative disorder in Down’s syndrome. Br. J. Haematol. 1995, 90, 607–614. [Google Scholar] [CrossRef] [Scilit] [PubMed]
- Fisher-Heath, T.C.; Sharma, A.; Marshall, M.S.; Brown, T.; Batra, S. BCOR, BCORL1, and BCL6 Mutations in Pediatric Leukemias. Cancers 2025, 17, 2443. [Google Scholar] [CrossRef] [Scilit] [PubMed] [PubMed Central]
- De Rooij, J.D.; Van den Heuvel-Eibrink, M.M.; Hermkens, M.C.; Verboon, L.J.; Arentsen-Peters, S.T.; Fornerod, M.; Baruchel, A.; Stary, J.; Reinhardt, D.; de Haas, V.; et al. BCOR and BCORL1 mutations in pediatric acute myeloid leukemia. Haematologica 2015, 100, e194–e195. [Google Scholar] [CrossRef] [Scilit]
- Lindsley, R.C.; Mar, B.G.; Mazzola, E.; Grauman, P.V.; Shareef, S.; Allen, S.L.; Pigneux, A.; Wetzler, M.; Stuart, R.K.; Erba, H.P.; et al. Acute myeloid leukemia ontogeny is defined by distinct somatic mutations. Blood 2015, 125, 1367–1376. [Google Scholar] [CrossRef] [Scilit] [PubMed] [PubMed Central]
- Tiacci, E.; Grossmann, V.; Martelli, M.P.; Kohlmann, A.; Haferlach, T.; Falini, B. The corepressors BCOR and BCORL1: Two novel players in acute myeloid leukemia. Haematologica 2012, 97, 3–5. [Google Scholar] [CrossRef] [Scilit] [PubMed] [PubMed Central]
- Iacobucci, I.; Qu, C.; Varotto, E.; Janke, L.J.; Yang, X.; Seth, A.; Shelat, A.; Friske, J.D.; Fukano, R.; Yu, J.; et al. Modeling and targeting of erythroleukemia by hematopoietic genome editing. Blood 2021, 137, 1628–1640. [Google Scholar] [CrossRef] [Scilit]
- Grossmann, V.; Tiacci, E.; Holmes, A.B.; Kohlmann, A.; Martelli, M.P.; Kern, W.; Spanhol-Rosseto, A.; Klein, H.U.; Dugas, M.; Schindela, S.; et al. Whole-exome sequencing identifies somatic mutations of BCOR in acute myeloid leukemia with normal karyotype. Blood 2011, 118, 6153–6163. [Google Scholar] [CrossRef] [Scilit] [PubMed]
- Sportoletti, P.; Sorcini, D.; Guzman, A.G.; Reyes, J.M.; Stella, A.; Marra, A.; Sartori, S.; Brunetti, L.; Rossi, R.; Papa, B.D.; et al. Bcor deficiency perturbs erythro-megakaryopoiesis and cooperates with Dnmt3a loss in acute erythroid leukemia onset in mice. Leukemia 2021, 35, 1949–1963. [Google Scholar] [CrossRef] [Scilit] [PubMed] [PubMed Central]
- Thompson, O.; von Meyenn, F.; Hewitt, Z.; Alexander, J.; Wood, A.; Weightman, R.; Gregory, S.; Krueger, F.; Andrews, S.; Barbaric, I.; et al. Low rates of mutation in clinical grade human pluripotent stem cells under different culture conditions. Nat. Commun. 2020, 11, 1528. [Google Scholar] [CrossRef] [Scilit] [PubMed] [PubMed Central]
- Fagnan, A.; Bagger, F.O.; Piqué-Borràs, M.R.; Ignacimouttou, C.; Caulier, A.; Lopez, C.K.; Robert, E.; Uzan, B.; Gelsi-Boyer, V.; Aid, Z.; et al. Human erythroleukemia genetics and transcriptomes identify master transcription factors as functional disease drivers. Blood 2020, 136, 698–714. [Google Scholar] [CrossRef] [Scilit] [PubMed] [PubMed Central]
- Di Genua, C.; Nerlov, C. To bi or not to bi: Acute erythroid leukemias and hematopoietic lineage choice. Exp. Hematol. 2021, 97, 6–13. [Google Scholar] [CrossRef] [Scilit] [PubMed]

Disclaimer/Publisher’s Note: The statements, opinions and data contained in all publications are solely those of the individual author(s) and contributor(s) and not of MDPI and/or the editor(s). MDPI and/or the editor(s) disclaim responsibility for any injury to people or property resulting from any ideas, methods, instructions or products referred to in the content. |
© 2026 by the authors. Licensee MDPI, Basel, Switzerland. This article is an open access article distributed under the terms and conditions of the Creative Commons Attribution (CC BY) license.