


Simple Summary
Women with breast cancer may experience changes in body size, blood conditions, and physical function that are not captured by a single test. We examined whether routine measurements taken before and after a surgery-related reference date showed common patterns of change. Among 122 of 473 women, two patterns accounted for about half of the variation: one reflected change shared across multidomain measurements, while the other contrasted changes in body size with changes in hemoglobin and albumin. A separate analysis of 65 women explored relationships with grip strength, but these associations were not statistically significant after accounting for multiple comparisons. These findings may help researchers design studies that assess several aspects of health together. They do not yet provide a validated measure of recovery or predict patient outcomes.
Abstract
Background: Routine clinical measurements may capture multidomain changes around breast cancer surgery but are usually assessed separately. We investigated whether longitudinal changes in these measurements form interpretable statistical dimensions. Methods: In this retrospective single-center study, paired examinations were aligned to a breast-surgery proxy date. Baseline and follow-up windows were −730 to −30 and +91 to +730 days, respectively. Changes in 8 anthropometric and laboratory variables were adjusted for baseline value, age, examination interval, and baseline calendar year, then standardized. Principal component analysis with permutation-based parallel analysis identified dominant dimensions. Spearman correlations were evaluated with false-discovery-rate correction. A separately selected cross-sectional cohort provided an exploratory analysis of grip strength. Results: Of 473 women with breast cancer, 122 had complete longitudinal data. Two components explained 31.7% and 20.3% of the variance, respectively. The first reflected coordinated anthropometric, metabolic, and selected hematologic changes. The second contrasted changes in weight and waist circumference with changes in hemoglobin and albumin. Seventeen of 28 pairwise correlations remained significant after correction. In the cross-sectional cohort (n = 65), grip strength correlated nominally with weight (Spearman ρ = 0.33; p = 0.007) and hemoglobin (ρ = 0.31; p = 0.012), but neither association remained significant after correction. Conclusions: Routine clinical measurements revealed two exploratory dimensions of longitudinal change spanning breast cancer surgery. These findings support further investigation of coordinated and discordant changes across clinical domains. Prospective studies are needed to establish component stability and functional or prognostic relevance.
1. Introduction
Breast cancer survival has improved substantially, shifting clinical attention from disease control alone toward the restoration of health, function, and participation after treatment [1,2,3]. Nevertheless, recovery after breast cancer treatment is highly heterogeneous. Patients may experience persistent fatigue, reduced physical capacity, adverse body-composition changes, metabolic dysfunction, or treatment-related hematologic alterations even after completion of primary therapy. Rehabilitation and survivorship care therefore require repeated assessment of recovery across multiple physiological domains rather than surveillance of cancer recurrence alone [4,5]. However, recovery is commonly evaluated using individual features, such as body weight, muscle strength, fatigue, or a selected marker, despite the likelihood that these measures represent interacting but non-equivalent components of the recovery process.
Routinely collected anthropometric and laboratory measurements offer complementary information regarding post-treatment recovery. Body weight and waist circumference describe body size but do not distinguish muscle, adipose tissue, or fluid [6,7]. Hemoglobin (Hb), white blood cell (WBC) and platelet counts, albumin, glucose, and lipid profiles reflect different aspects of systemic physiology. Albumin is particularly nonspecific because it is influenced by inflammation, hepatic synthesis, and fluid balance as well as nutritional factors. These domains may also interact with physical function, nutritional status, treatment exposure, and systemic inflammation [8]. For example, a prospective study in women with early stage breast cancer documented changes in waist circumference, body composition, and markers of glucose metabolism between assessments before and after chemotherapy [9]. Nevertheless, studies that integrate physical, body-composition, hematologic, immunologic, and metabolic measures remain scarce, and these variables are usually examined separately [10,11,12]. Thus, both the magnitude of multidomain change and the relative balance among physiological domains may be required to characterize recovery of cancer survivors. Identifying these coordinated and discordant patterns requires a multivariate longitudinal approach that does not designate any single measure as the definitive indicator of recovery.
Repeated routine examinations provide an opportunity to examine how these measures change together around breast cancer surgery. Principal component analysis (PCA) can summarize correlated changes as a smaller number of statistical dimensions, helping characterize coordinated and discordant patterns without selecting one measurement as the definitive indicator of recovery. However, the resulting components require clinical interpretation and validation before they can inform patient assessment [13,14].
In this retrospective study, we investigated whether longitudinal changes in 8 routine anthropometric and laboratory measures could be summarized as interpretable dimensions in women with breast cancer. Assessments were aligned to a breast-surgery proxy date, and within-patient changes were adjusted for baseline values, age, examination interval, and calendar year. We used PCA with parallel analysis to identify the dominant dimensions and pairwise correlations to characterize their structure. A separately selected cross-sectional cohort was used to explore concurrent associations between grip strength and routine clinical measures.
2. Methods
2.1. Study Design and Data Sources
This retrospective longitudinal study used de-identified clinical records from women with breast cancer who underwent routine health examinations and laboratory testing at Asan Medical Center during 29 October 1992–20 June 2026. Data were obtained from health examination records, specimen laboratory databases, clinical notes, patient examination reports, and pathology reports. Records from different sources were linked using a common anonymized research identifier during 19–24 June 2026. The investigators had no direct access to identifying personal information.
The primary objective was to characterize patterns of change in routine anthropometric and laboratory measures between examinations selected relative to a documentation-derived surgery proxy date. The study followed the Strengthening the Reporting of Observational Studies in Epidemiology (STROBE) guidelines. Because the study was based on existing records, no prospective sample-size calculation was performed, and all eligible individuals with the required longitudinal measurements were included. The Institutional Review Board approved the study (2026-0332) and waived written informed consent.
2.2. Index Date and Longitudinal Cohort
A documentation-derived surgery-related proxy date was reconstructed from clinical notes and patient examination reports using a rule-based procedure. Candidate dates were retained when both surgery-related and breast/cancer-related terms occurred within 220 characters before or after the date. Surgery-related terms included surgery, operation, mastectomy, lumpectomy, breast-conserving surgery, wide excision, sentinel lymph-node biopsy, and axillary lymph-node dissection. When multiple candidate dates were identified, we selected the most frequently documented date across records and data sources, resolving ties by choosing the earliest candidate. The source was categorized as a clinical note, a patient examination report, or documentation in both sources. The selected proxy date served as the operational index date (Day 0) for selecting examination pairs in the primary analysis. We selected baseline and follow-up examinations within −730 to −30 and +91 to +730 days, respectively, relative to this proxy date. When multiple visits were available, examinations closest to Day −180 and Day +365 were selected. Each participant contributed one pair using the same InBody-derived (InBody 770 or InBody 970; InBody Co., Ltd., Seoul, Republic of Korea) weight variable at both examinations. Laboratory records were matched by participant identifier and examination date, and complete paired data for all eight variables were required.
- Hemoglobin (Hb) [g/dL];
- White blood cell count (WBC) [×103/μL];
- Platelet count [×103/μL];
- Serum albumin [g/dL];
- Body weight [kg];
- Waist circumference [cm];
- Low-density lipoprotein (LDL) cholesterol [mg/dL];
- Fasting glucose [mg/dL].
2.3. Clinical Variables and Adjusted Changes
The 8 variables were Hb, WBC, platelet count, albumin, body weight, waist circumference, low-density lipoprotein (LDL) cholesterol, and fasting glucose. Multiple laboratory results on the same date were summarized by their median. Weight outside 25–200 kg and waist circumference outside 45–160 cm were excluded. Anthropometric measures were not treated as direct measures of muscle or fat, and albumin was not interpreted as a nutrition-specific marker. Raw change was calculated as follow-up minus baseline. For each variable, raw change was regressed on its baseline value, baseline age, inter-examination interval, and baseline calendar year. The residual represented change relative to the fitted expectation and was standardized to a z-score. These standardized residuals formed the longitudinal PCA inputs. A positive value indicated a greater increase or smaller decrease than expected, without implying clinically favorable recovery.
2.4. Calculation and Adjustment of Longitudinal Changes
All data processing and statistical analyses were performed using GraphPad Prism 11 (ver. 11.1.0; GraphPad Software Inc., San Diego, CA, USA) and Python version 3.12.13. For each variable, the raw longitudinal change was calculated as follows:
where i is the patient index, k is the variable index, is the observable value of raw change, is the value of variable k at each follow-up period, and is the value of variable k at the baseline time (the first measurement). Because raw changes may be affected by baseline value, regression to the mean, age, observation interval, and secular changes in clinical practice, each variable-specific change was adjusted using the following linear model [15].
where is the observed raw change from baseline to follow-up, is the intercept of function, is the regression coefficient of baseline value, is the regression coefficient of baseline age (Agei,BL), is the regression coefficient of the observation interval (Intervali), is the regression coefficient of the baseline calendar year (Yeari,BL), and is the residual of variables. Then, is adjusted change (Adjusted change = Observed change − Expected change given baseline, age, interval, and calendar year).
For each variable, a separate linear model was fitted with raw change as the dependent variable and baseline value, baseline age, time between examinations, and baseline calendar year as covariates. The residual from each model represented the participant-specific deviation from the expected change after accounting for these characteristics. Because the variables were measured in different units and had substantially different ranges of variability, the residuals were converted to z-scores by subtracting the variable-specific mean residual and dividing by its standard deviation. Consequently, each adjusted-change variable had a mean of 0 and a standard deviation of 1, allowing the variables to contribute to the multivariate analysis on a comparable scale. A positive adjusted-change z-score indicated a greater increase, or a smaller decrease, than expected given the participant’s baseline characteristics and observation interval. Residuals were standardized by subtracting the variable-specific mean residual and dividing by its standard deviation. These standardized residual changes formed the longitudinal PCA inputs. A positive value indicated a greater increase, or a smaller decrease, than expected under the fitted model; it did not necessarily indicate clinically favorable recovery. Data processing, model fitting, and standardization were performed using Python version 3.12.13 with NumPy version 2.3.5 and Microsoft Excel 2019 (version 2607).
2.5. Principal Component Analysis and Longitudinal Correlation
PCA was performed on the complete-case matrix of eight standardized adjusted changes using GraphPad Prism 11 (version 11.1.0; GraphPad Software, San Diego, CA, USA) and Python with scikit-learn version 1.8.0. Because all inputs were standardized, the analysis was equivalent to PCA based on the correlation matrix [16]. The number of principal components (PCs) to retain was determined using parallel analysis based on 2000 within-variable permutations generated with Prism 11. A component was retained when its observed explained variance exceeded the 95th percentile of the corresponding variance obtained from the permuted datasets. Individual component scores were calculated for each participant. Component labels were assigned after examining the dominant loadings and the corresponding pairwise correlation network.
Pairwise associations among the eight adjusted changes were assessed using two-sided Spearman rank correlations. The 28 p-values were adjusted using the Benjamini–Hochberg procedure to control the false discovery rate (FDR); adjusted p-values are denoted q-values. A q-value < 0.05 was considered statistically significant [17]. Grip strength was not included in the longitudinal PCA or this correlation family. Pairwise correlations were used to describe relationships underlying the PCA patterns. Because both analyses used the same participants and variables, the correlation analysis did not constitute independent validation of the components.
2.6. Secondary Cross-Sectional Analysis
Because grip strength was not consistently available at both time points required for the longitudinal analysis, its relationship with the routinely collected clinical variables was evaluated in a separate cross-sectional analysis. Female participants with breast cancer were eligible when bilateral grip strength, anthropometric measurements, and the selected laboratory variables were available on the same examination date. When multiple eligible examinations were available for the same participant, the most recent complete examination was retained, resulting in a cross-sectional complete-case sample of 65 participants. The cross-sectional feature set consisted of grip strength, hemoglobin, white blood cell count, platelet count, albumin, body weight, waist circumference, LDL cholesterol, and glucose. Unlike the primary longitudinal analysis, this analysis did not use change scores. Each variable was separately adjusted for age at examination and examination calendar year using a linear model. The resulting residuals were standardized as z-scores before correlation and multivariate analyses.
Each of the 9 variables was regressed on examination age and calendar year using its available observations. Residuals were standardized within these variable-specific samples, and participants with complete residuals for all nine variables were included in the cross-sectional analyses. Spearman correlations were calculated for all 36 unique pairs among the nine variables, with Benjamini–Hochberg correction applied across this family. The eight grip-related correlations were reported from that family. Cross-sectional PCA and simple linear regressions of weight or Hb on grip strength provided additional descriptive analyses. Regression R2 values and p-values described contemporaneous, in-sample associations; they were not measures of longitudinal prediction.
2.7. Statistical Analysis
Continuous variables were summarized as medians and interquartile ranges (IQRs), and categorical variables as counts and percentages. Raw paired changes were evaluated using two-sided Wilcoxon signed-rank tests with Benjamini–Hochberg correction across the eight variables. This family was separate from the longitudinal and cross-sectional correlation families. FDR-adjusted q < 0.05 defined significance for corrected analyses; regression p-values were nominal. Analyses were conducted using GraphPad Prism 11. No missing-value imputation was performed for the primary PCA.
2.8. Assessment of Selection Bias and Timing Sensitivity
To assess potential selection bias, we compared the 122 women included in the longitudinal analysis with the 351 excluded women. Each woman’s latest health examination in the extracted dataset served as her reference examination, selected before checking marker availability. We compared approximate age, examination year, available anthropometric and laboratory measurements, record counts, and observation span. Laboratory measurements were matched to the reference examination by date. We report standardized mean differences (SMDs), variable-specific sample sizes, and proportions of unavailable values. In the first sensitivity analysis, we replaced the total inter-examination interval with separate intervals from baseline to the proxy date and from the proxy date to follow-up. The model also included the measure’s baseline value, baseline age, and baseline calendar year. This analysis used the original proxy dates and examination pairs from all 122 women.
For the second sensitivity analysis, we cross-referenced the original cohort with the breast-surgery database during revision. Among women with documented surgery dates, we summarized exact agreement, agreement within 14 days, and the median and interquartile range of the absolute date difference. We assessed whether the originally selected baseline and follow-up examinations fell within −730 to −30 and +91 to +730 days, respectively, relative to the documented surgery date. We restricted this analysis to pairs meeting both windows and used the primary model covariates, including the total inter-examination interval. For each sensitivity analysis, we refitted the change models, standardized the residuals within the analytic sample, and repeated PCA and parallel analysis with 2000 within-variable permutations.
3. Results
3.1. Cohort Construction and Temporal Alignment of Longitudinal Examinations
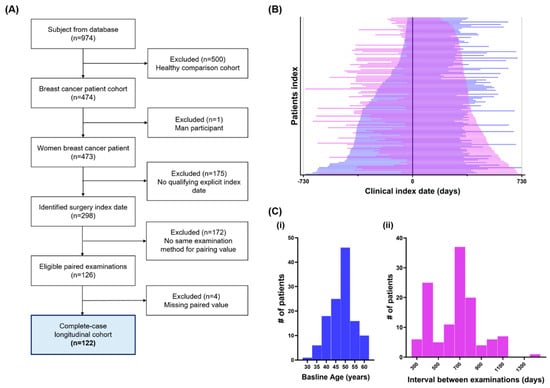
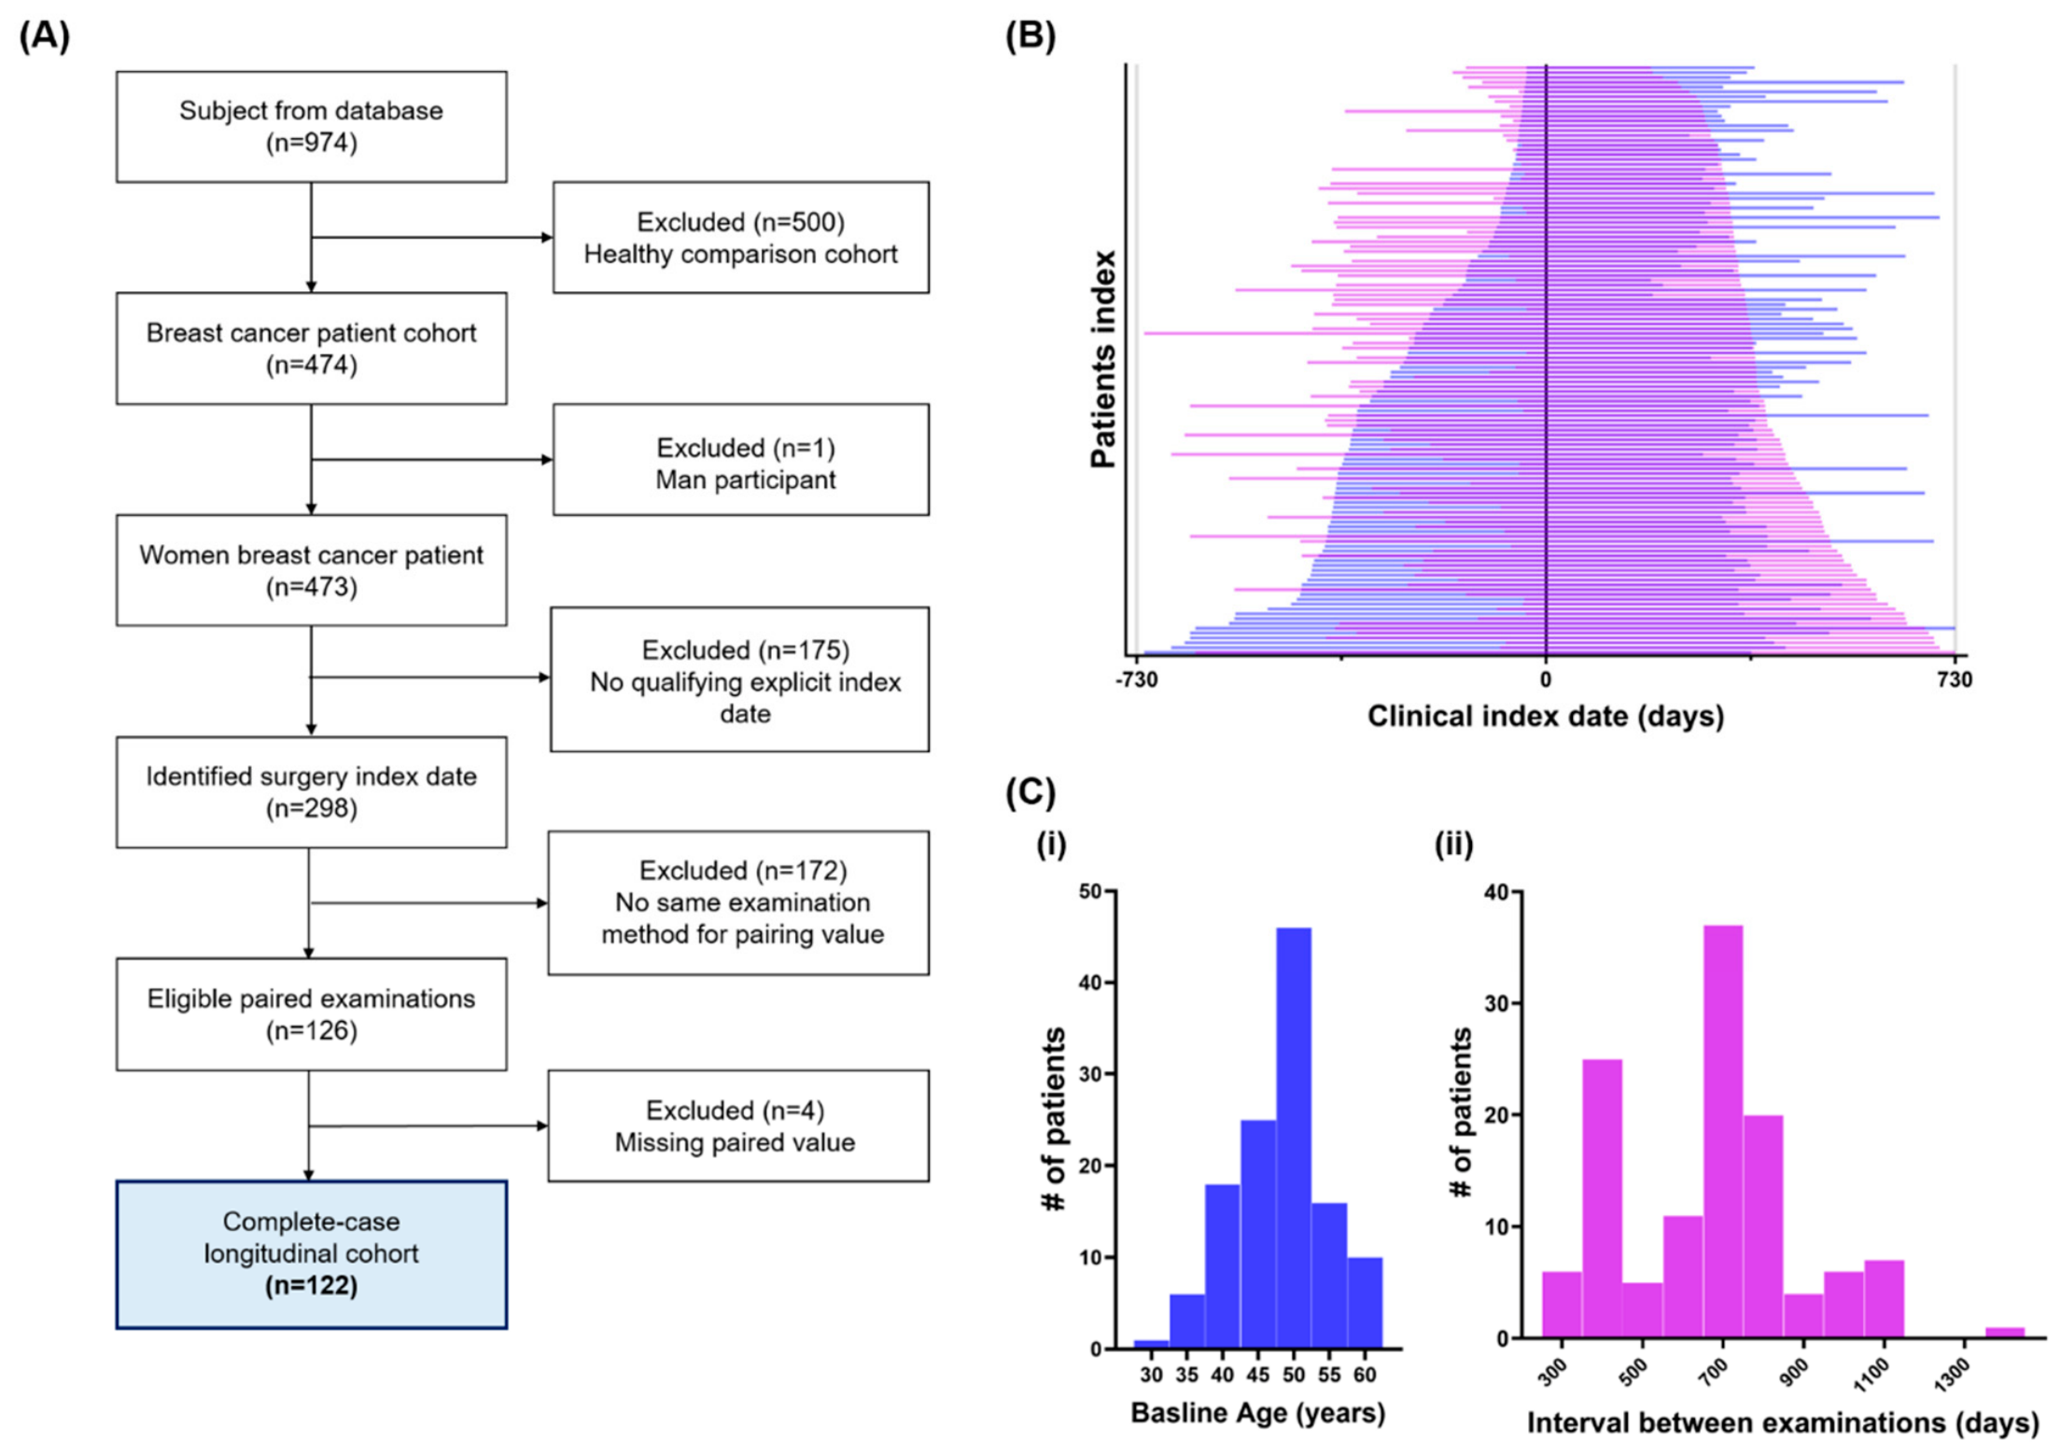
Among 473 women with breast cancer, 175 had no qualifying surgery proxy date. Of the 298 women with a qualifying proxy date, 172 had no eligible examination pair and 126 had an eligible pair. Four women with eligible pairs lacked complete paired measurements, leaving 122 women (25.8%) in the longitudinal cohort (Figure 1A). The 500 healthy participants in the source database were not analyzed. Baseline examinations occurred during 2004–2024 and follow-up examinations during 2005–2026. Median baseline age was 48.7 years (IQR, 43.8–51.6). Baseline examinations occurred a median of 252 days before the proxy date and follow-up examinations 373 days afterward. The median interval between baseline and follow-up examinations was 703.5 days (IQR, 448.8–776.0; Figure 1B,C). Characteristics of both analytic cohorts are summarized in Table 1.
Figure 1.
Cohort construction and temporal alignment of the longitudinal analysis. (A) Flow diagram showing selection of the complete-case longitudinal cohort from the clinical database. Of 974 individuals, 500 healthy comparison participants and one man with breast cancer were excluded. Among 473 women with breast cancer, a breast-surgery proxy index date was identified for 298; 126 had eligible same-method paired examinations, and 122 had complete paired data for all 8 variables. (B) Participant-level examination intervals aligned to the clinical index date (Day 0). The blue graph displays patient indices sorted in descending order by baseline examination time, while the purple graph shows them sorted in descending order by follow-up examination time. Patient indices on the same horizontal segment do not refer to the same individual. (C) Distributions of (i) age at baseline examination (baseline age) and (ii) interval between examinations in the final longitudinal cohort. The baseline window was −730 to −30 days, and the follow-up window was +91 to +730 days relative to the index date. n = 122.
Table 1.
Participant characteristics and clinical measurements in the longitudinal and cross-sectional cohorts.
The assessment of selection bias identified differences between included and excluded women (Supplementary Table S1). Included women had more health examination records, with medians of 11 versus 6 records (standardized mean differences, SMD: 0.822), and a later median reference examination year, 2022 versus 2019 (SMD: 0.559). Standardized differences in WBC and platelet counts were −0.288 and −0.280, respectively. In contrast, absolute SMDs for weight, waist circumference, and BMI were 0.034, 0.004, and 0.018. Measurement availability also differed between groups. Variable-specific sample sizes and unavailable proportions are reported in Supplementary Table S1.
3.2. Raw Longitudinal Changes in Routine Clinical Measures
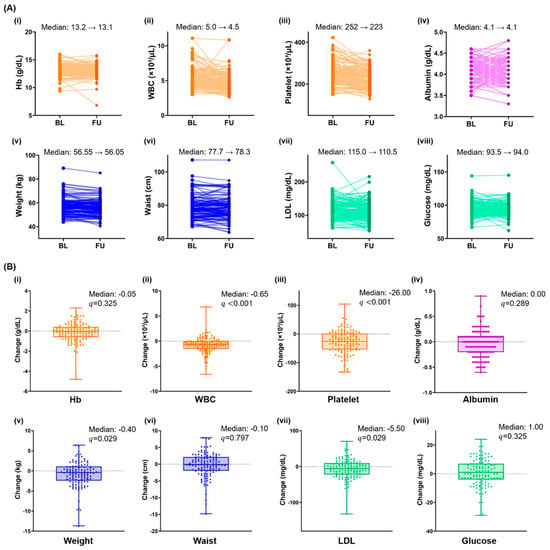
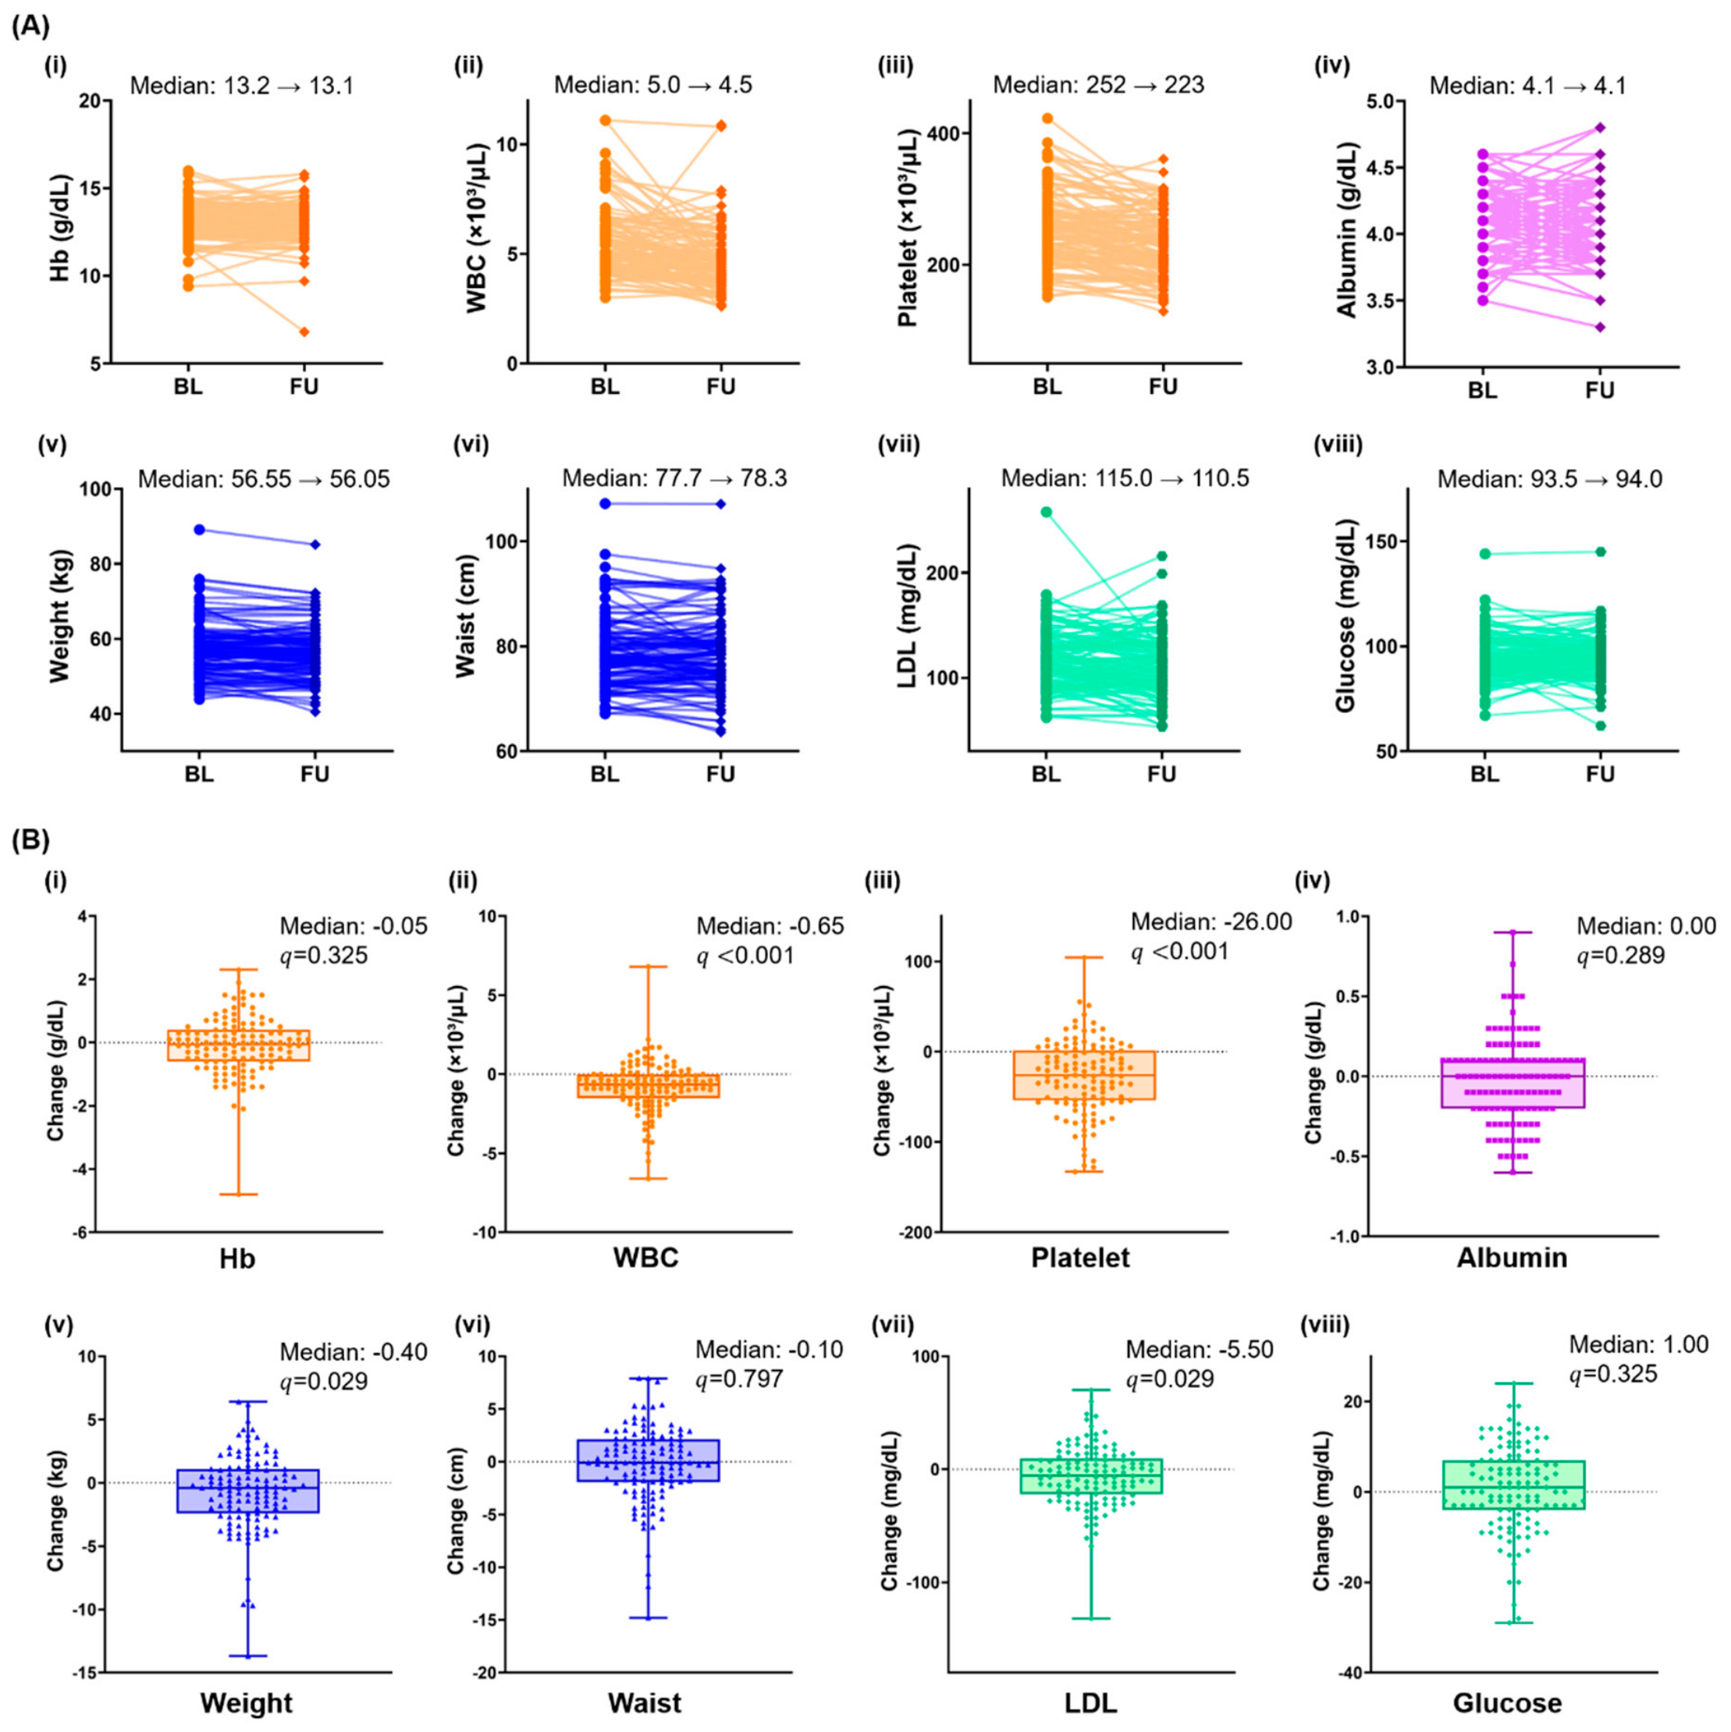
Individual trajectories demonstrated considerable heterogeneity across all 8 variables (Figure 2A). Nevertheless, several variables showed consistent shifts at the cohort level. WBC count decreased from a median of 5.0 to 4.5 × 10³/µL, with a median paired change of −0.65 × 10³/µL (q < 0.001). Platelet count similarly decreased from 252 to 223 × 103/µL, corresponding to a median paired change of −26 × 103/µL (q < 0.001; Figure 2B). Smaller but statistically significant decreases were observed in body weight and LDL cholesterol. Median body weight changed from 56.55 to 56.05 kg, with a median within-participant change of −0.40 kg (q = 0.029). LDL cholesterol decreased from 115.0 to 110.5 mg/dL, with a median change of −5.50 mg/dL (q = 0.029).
Figure 2.
Paired longitudinal changes in eight routinely collected clinical variables. (A) Individual paired values at baseline (BL) and follow-up (FU) for (i) hemoglobin (Hb), (ii) white blood cell (WBC) count, (iii) platelet count, (iv) albumin, (v) weight, (vi) waist circumference, (vii) low-density lipoprotein (LDL) cholesterol, and (viii) glucose. Lines connect repeated measurements from the same participant. (B) Distributions of within-participant changes for the corresponding variables (i–viii). Boxes indicate the median and interquartile range, whiskers indicate the observed range, and individual points represent participants. The dotted horizontal line indicates no change (change = 0). Statistical significance was evaluated using two-sided Wilcoxon signed-rank tests, with Benjamini–Hochberg correction across the eight variables. n = 122.
In contrast, no significant paired changes were detected in hemoglobin (median change, −0.05 g/dL; q = 0.325), albumin (0.00 g/dL; q = 0.289), waist circumference (−0.10 cm; q = 0.797), or glucose (1.00 mg/dL; q = 0.325). Although the marginal median waist circumference changed from 77.7 to 78.3 cm, the median within-participant change was −0.10 cm, illustrating that the difference between cohort-level medians does not necessarily equal the median of paired individual changes (Figure 2).
3.3. Two-Component Structure of Adjusted Longitudinal Changes
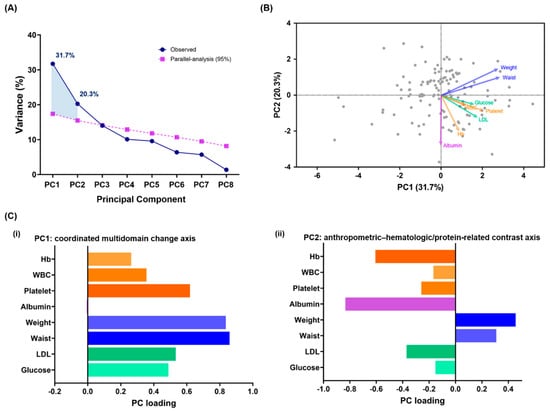
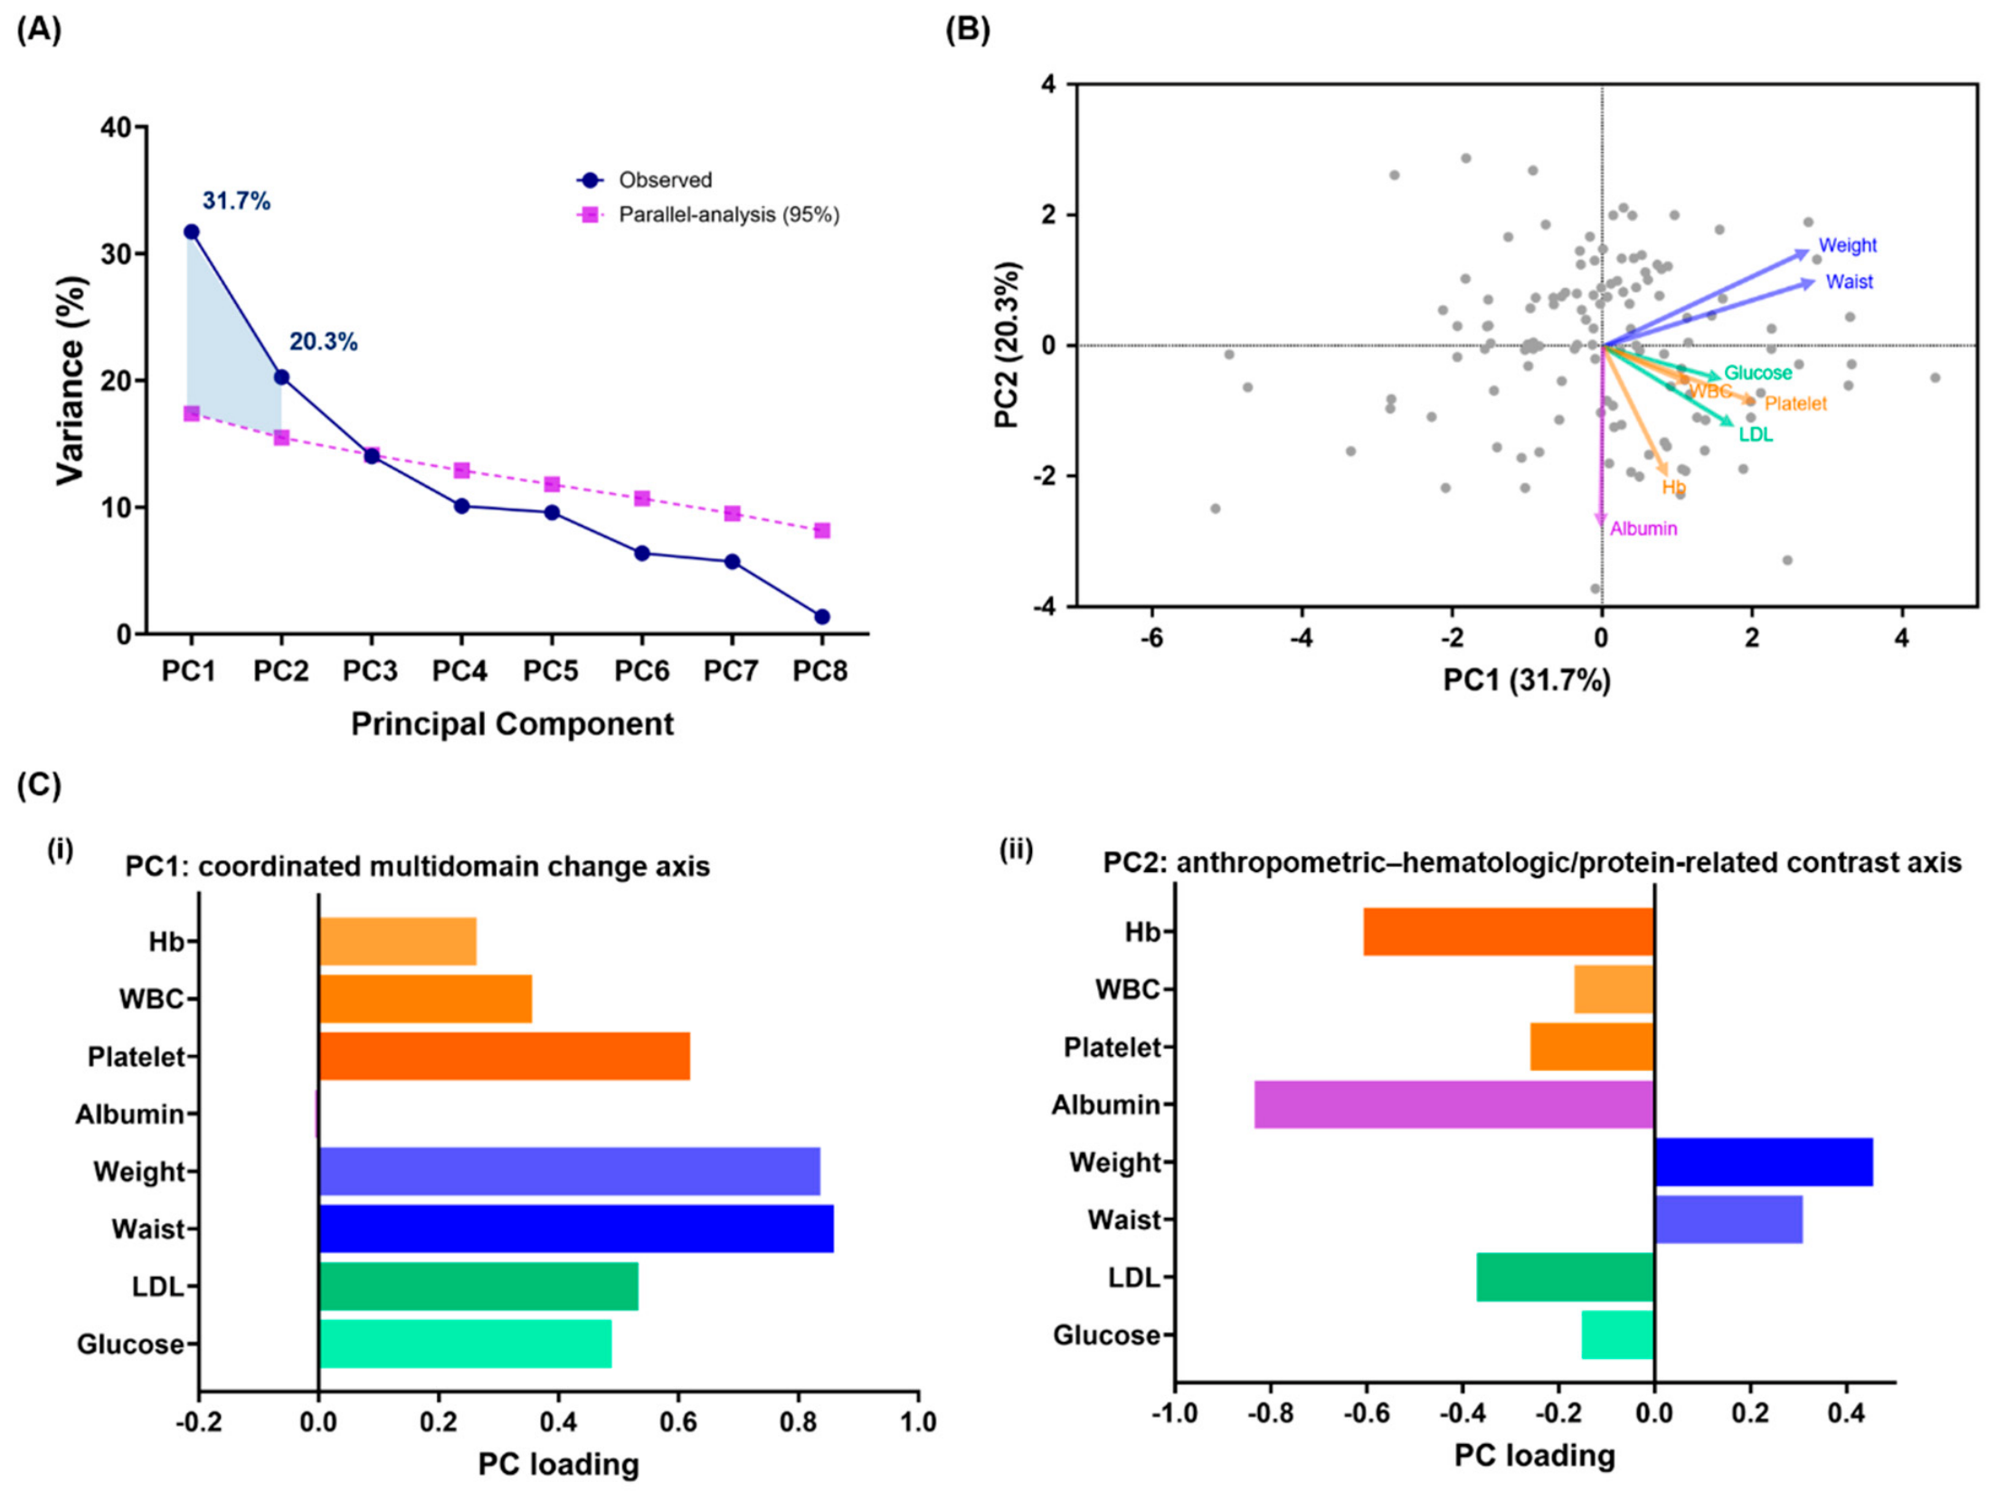
PCA was performed using standardized residual changes after adjustment for the baseline value of each variable, baseline age, interval between examinations, and baseline calendar year. Parallel analysis retained two components whose observed explained variances exceeded the corresponding 95th-percentile random thresholds. PC1 explained 31.7% of the total variance, and PC2 explained 20.3%, together accounting for 52.0% of the multivariable longitudinal variation, leaving approximately 48.00% outside this two-component summary. PC1 and PC2 exceeded their corresponding 95th-percentile permutation thresholds of 19.23% and 16.79%, while PC3 explained 14.92%, below its threshold of 15.03% (Figure 3A).
Figure 3.
Two-component (PC1-PC2) structure of adjusted longitudinal changes. (A) Scree plot comparing the observed proportion of variance explained by each principal component (PC) with the 95th-percentile variance obtained from 2000 column-wise permutation datasets. PC1 and PC2 exceeded their corresponding parallel-analysis thresholds and explained 31.7% and 20.3% of the total variance, respectively. (B) PCA biplot showing participant scores and variable–component correlation vectors for PC1 and PC2. Gray circles represent individual participants, and arrows indicate the direction and relative contribution of each variable. (C) Variable–component correlation loadings for (i) PC1: coordinated multidomain change and (ii) PC2: anthropometric–hematologic/protein-related contrast axis. PCA inputs were standardized residual changes adjusted for the variable-specific baseline value, baseline age, interval between examinations, and baseline calendar year. Component signs were oriented for presentation and are algebraically arbitrary. n = 122.
PC1 was characterized by loadings in the same direction across most variables, with the largest contributions from weight and waist circumference and additional contributions from platelet count, LDL cholesterol, glucose, WBC count, and hemoglobin (Figure 3B,C). Albumin contributed minimally to PC1. PC1 was therefore interpreted as a coordinated multivariable change axis, representing the degree to which anthropometric, metabolic, and selected hematologic changes occurred together (anthropometric–metabolic change axis). PC2 showed a contrasting structure. Weight and waist circumference loaded in one direction, whereas albumin and hemoglobin loaded strongly in the opposite direction. WBC count, platelet count, LDL cholesterol, and glucose showed smaller contributions toward the hematologic–nutritional side of the axis. PC2 was therefore interpreted as an anthropometric–hematologic/nutritional contrast axis (hematologic-nutritional contrast axis). Because the algebraic sign of a PC is arbitrary, the interpretation was based on the relative directions of the loadings rather than whether a loading was positive or negative. Moreover, higher component scores did not necessarily indicate clinically favorable recovery.
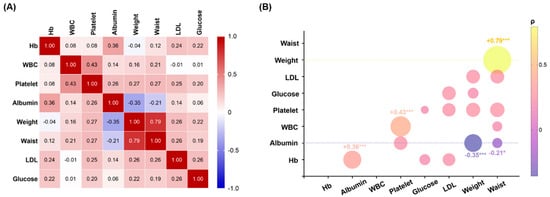
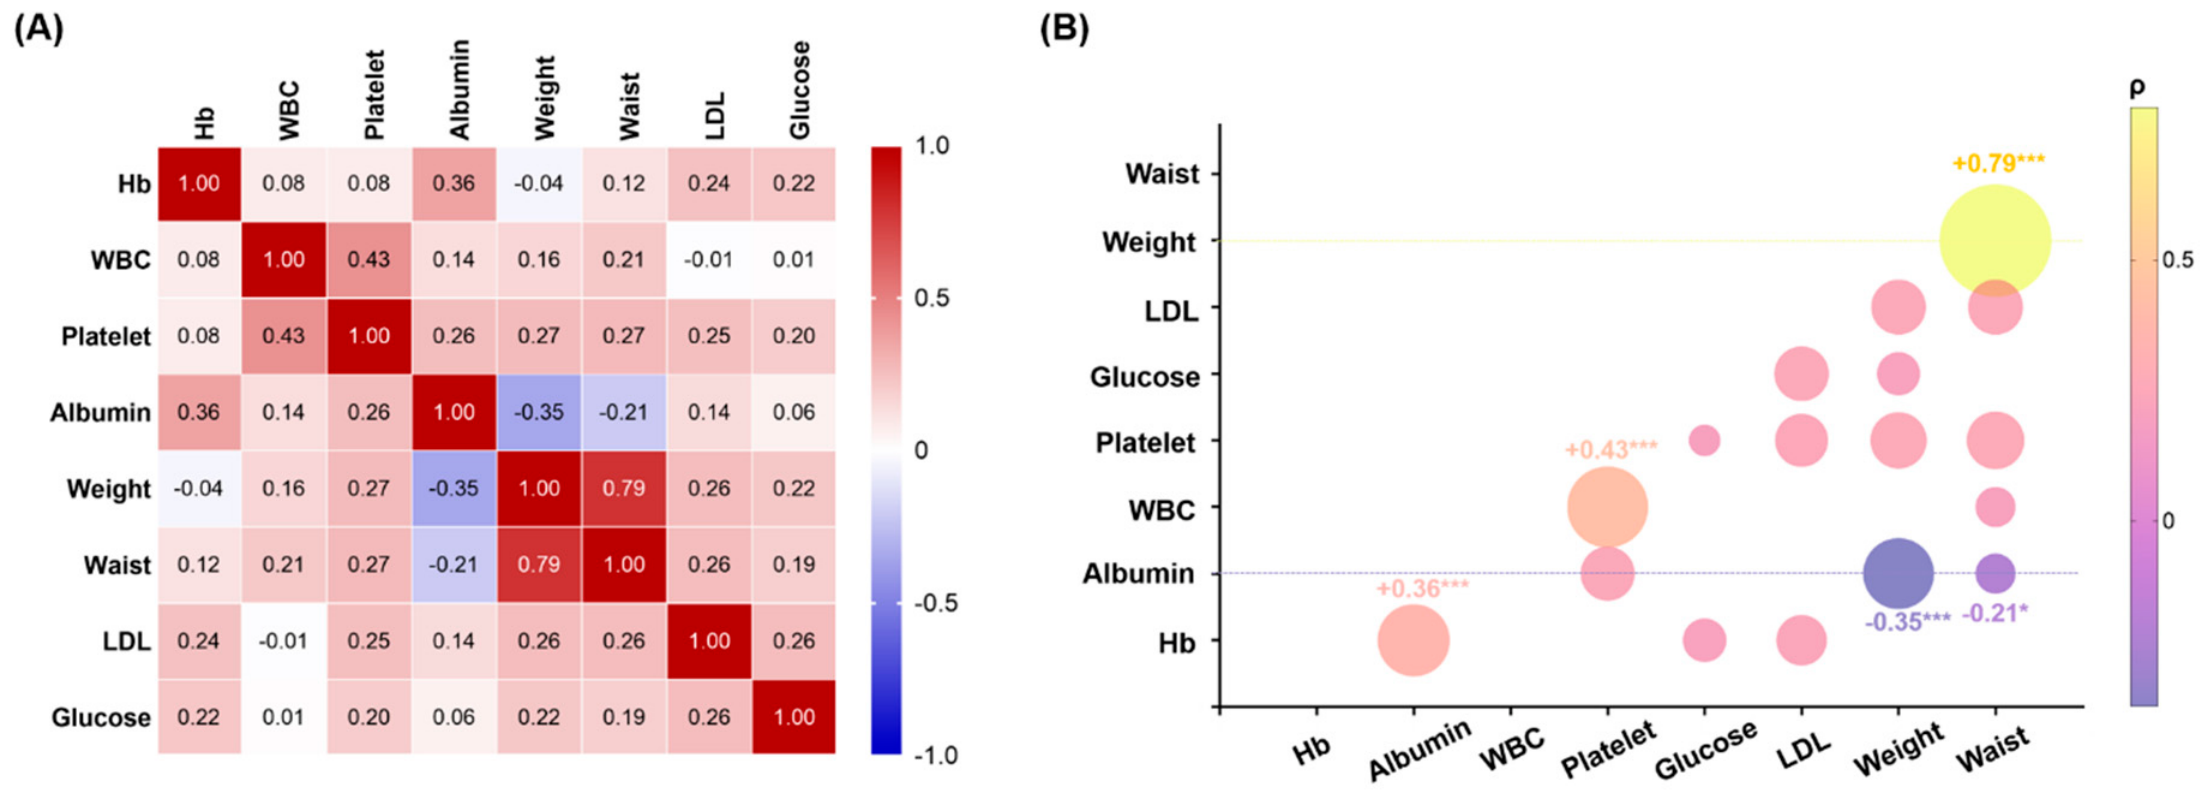
Pairwise Spearman correlation analysis of the adjusted standardized changes showed that 17 of the 28 feature pairs remained significant after Benjamini–Hochberg correction (Figure 4). The strongest relationship was observed between weight and waist circumference (ρ = 0.79, q < 0.001), indicating a dominant anthropometric covariance structure. WBC and platelet changes were also positively correlated (ρ = 0.43, q < 0.001), as were hemoglobin and albumin changes (ρ = 0.36, q < 0.001). Notably, albumin change was inversely associated with both weight change (ρ = −0.35, q < 0.001) and waist change (ρ = −0.21, q = 0.034). Several weaker cross-domain relationships were also identified, including correlations of platelet change with weight and waist change, and correlations of LDL change with weight, waist circumference, platelet count, and glucose.
Figure 4.
Pairwise correlation architecture of adjusted longitudinal changes. (A) Spearman correlation matrix for the 8 adjusted standardized longitudinal changes. Numbers and colors indicate Spearman’s ρ (red represents positive correlation and blue represents negative correlation. (B) Bubble correlogram of the same pairwise relationships. Circle size represents the absolute correlation magnitude, whereas color represents correlation direction and magnitude. Selected structurally informative correlations are annotated. Benjamini–Hochberg correction was applied across all 28 pairwise tests. * q < 0.05 and *** q < 0.001. n = 122. Hb, hemoglobin; WBC, white blood cell count; LDL, low-density lipoprotein cholesterol.
This correlation architecture was consistent with the PCA findings. The strong weight–waist relationship and the broader set of positive cross-domain correlations contributed to the coordinated PC1 structure, whereas the inverse relationships between albumin and anthropometric changes contributed to the contrasting structure of PC2. These findings support the presence of two statistical dimensions within the observed longitudinal changes but do not establish biological independence or causal coupling between the corresponding physiological systems.
3.4. Sensitivity Analyses
When the total examination interval was replaced by separate intervals from baseline to the proxy date and from the proxy date to follow-up, parallel analysis retained two components in the same 122 women. Their cumulative explained variance was 52.14%, compared with 52.00% in the primary analysis (Supplementary Table S2). We documented surgery dates for all 122 women (100%). The proxy and documented dates agreed exactly in 40 women (32.8%) and were within 14 days in 51 (41.8%). The median absolute difference was 29 days (IQR, 0–114). When the original examination pairs were evaluated relative to the documented dates, 97 women (79.5%) met both windows. Both examinations preceded the documented surgery date in 20 women (16.4%).
In the subset of 97 women, the median examination interval was 700 days (IQR, 440–768). Parallel analysis retained two components, which explained 30.0% and 21.4% of the variance, respectively. Their cumulative explained variance was 51.4%, compared with 52.0% in the primary analysis. PC2 continued to contrast changes in weight and waist circumference with changes in hemoglobin and albumin (Supplementary Table S3).
3.5. Secondary Cross-Sectional Functional Linkage with Grip Strength
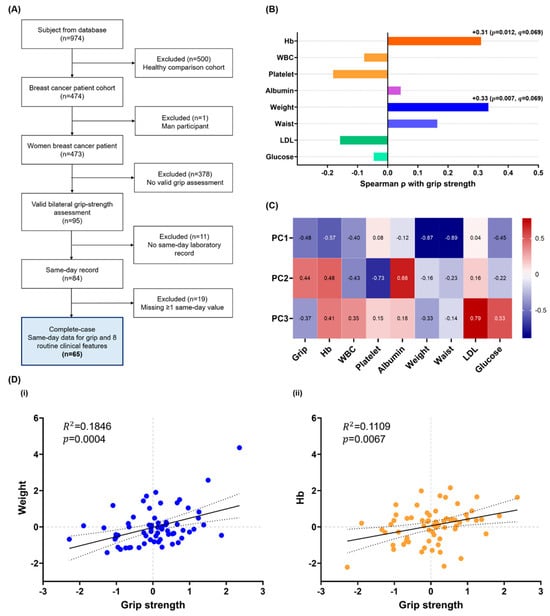
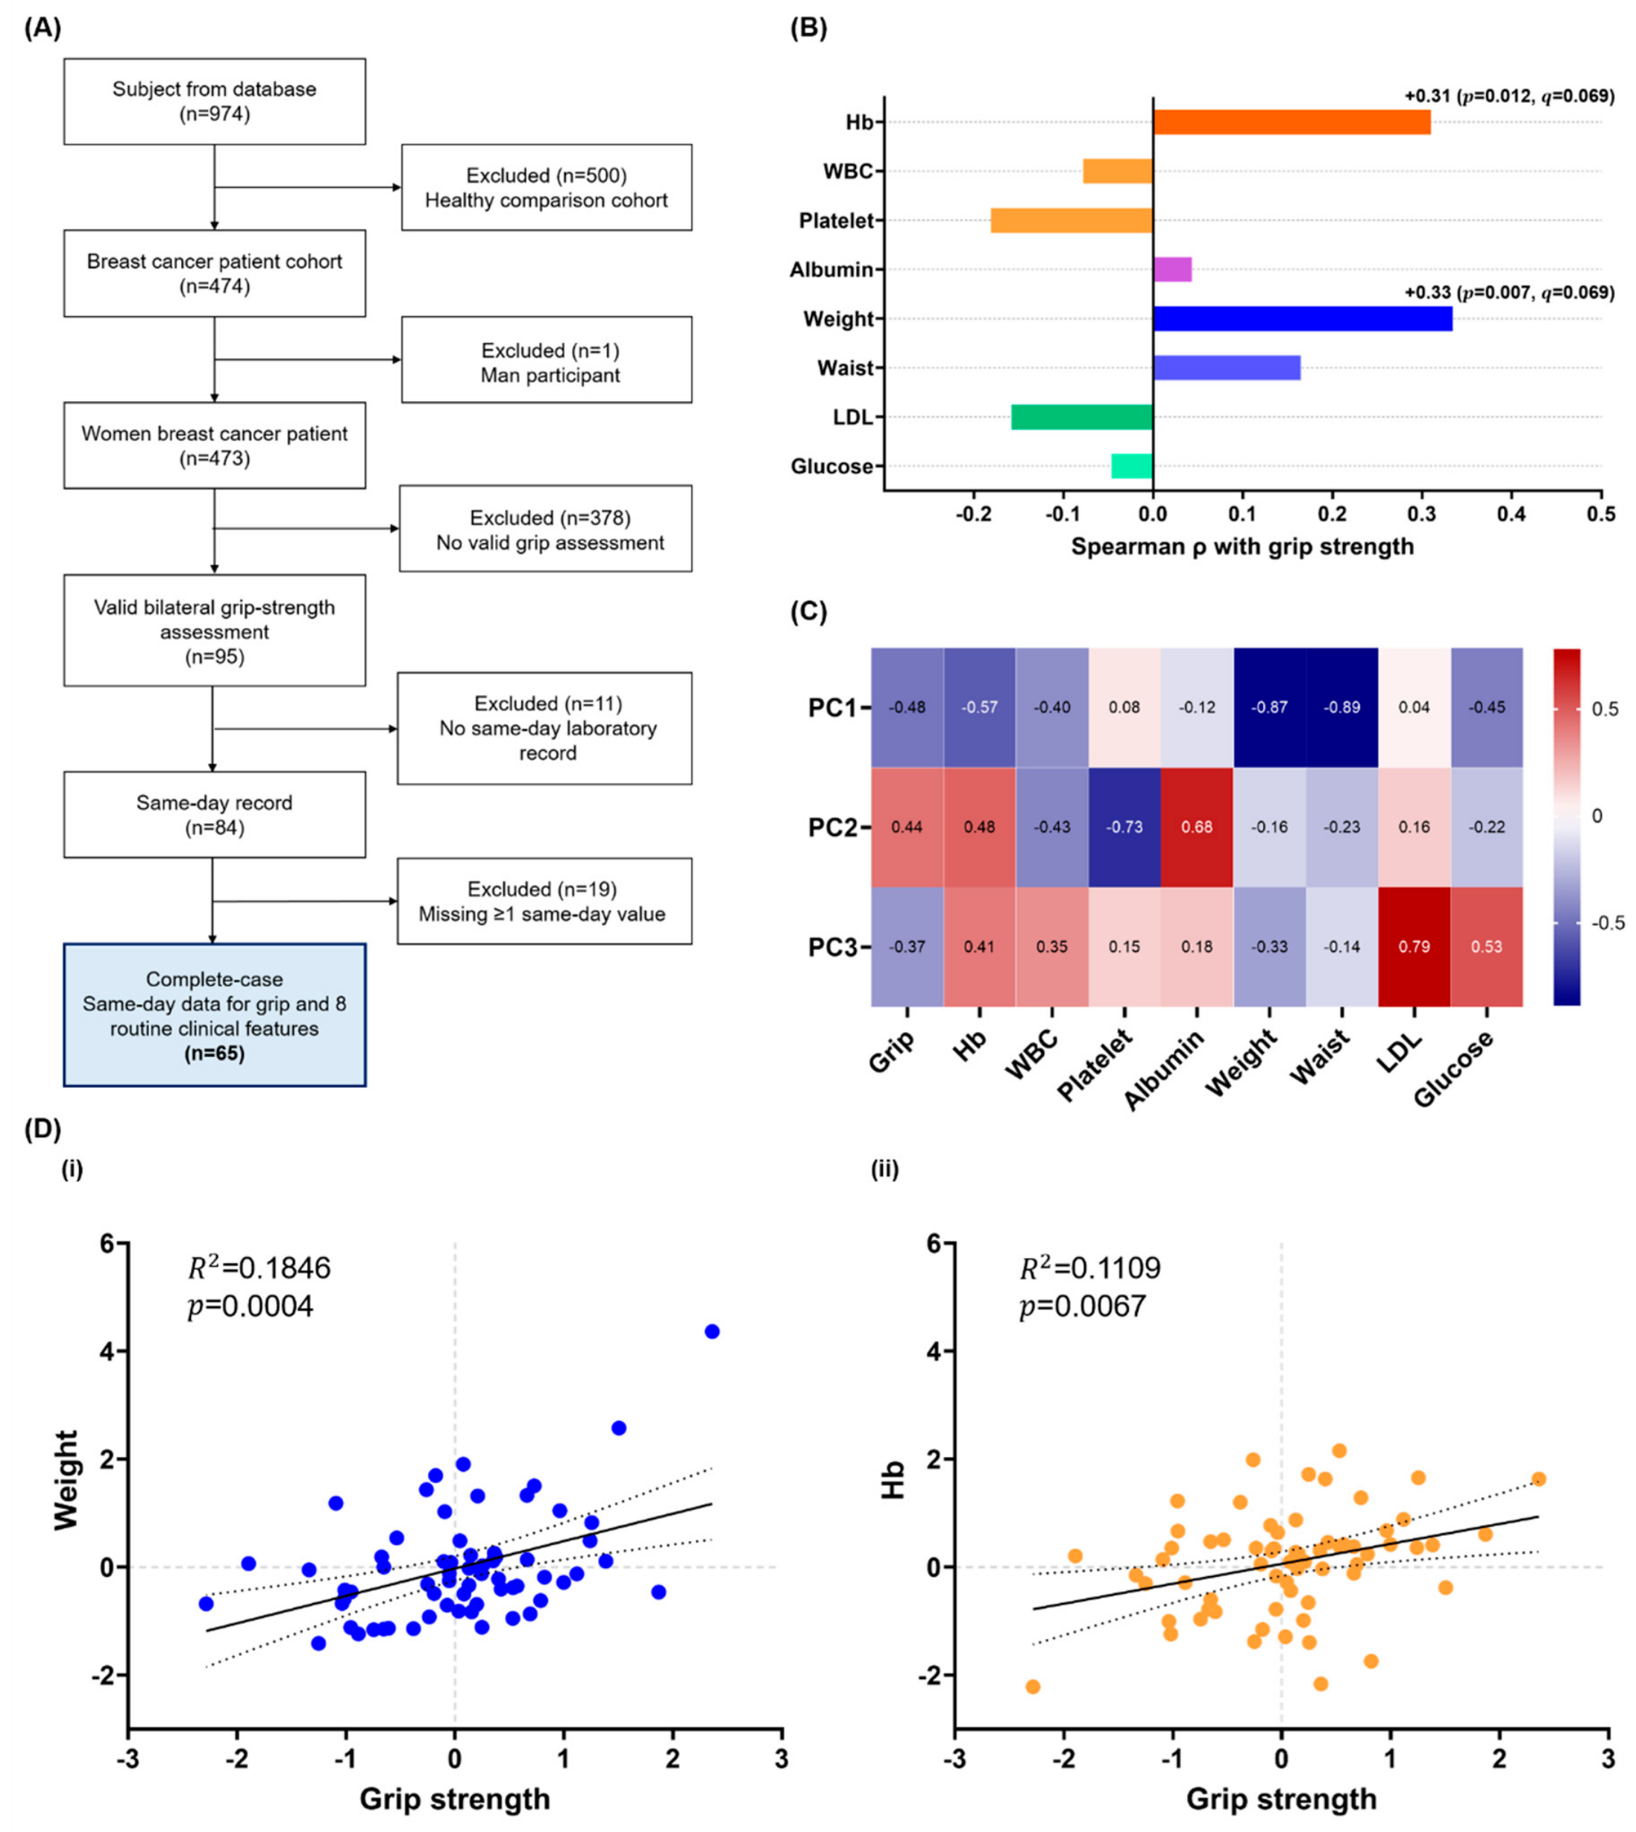
The secondary grip-strength analysis was independently constructed from the 473 women with breast cancer rather than being restricted to the longitudinal cohort. In total, 95 women had a valid bilateral grip-strength assessment, of whom 84 had a same-day laboratory record. After excluding 19 women with at least one missing same-day variable, 65 women were included in the complete-case cross-sectional analysis (Figure 5A). In total, 23 women contributed to both the longitudinal and cross-sectional analytic cohorts associated with grip strength. Grip strength showed nominal positive correlations with weight (ρ = 0.33, p = 0.007) and hemoglobin (ρ = 0.31, p = 0.012; Figure 5B). However, neither association remained statistically significant after Benjamini–Hochberg correction across all 36 cross-sectional pairwise correlations (both q = 0.069). Correlations between grip strength and the other 6 variables were relatively weaker and were not significant before or after correction.
Figure 5.
Secondary cross-sectional functional linkage of grip strength with routine clinical features. (A) Flow diagram for the independently selected cross-sectional grip-strength cohort. Of 473 women with breast cancer, 95 had a valid bilateral grip-strength assessment, 84 had a same-day laboratory record, and 65 had complete same-day data for grip strength and the 8 routine clinical variables. (B) Spearman correlation coefficients between age- and examination-year-adjusted grip strength and the eight adjusted clinical variables. Displayed p-values are nominal. Benjamini–Hochberg correction was applied across all 36 pairwise correlations among the nine variables. None of the eight displayed grip-related correlations remained significant after correction; the weight and hemoglobin associations both had q = 0.069. (C) Variable–component correlation loadings for the first three components of the cross-sectional nine-variable PCA. Component signs are arbitrary. (D) Relationships of adjusted standardized grip strength with (i) adjusted weight and (ii) adjusted hemoglobin. Solid lines indicate linear regression estimates and dotted lines indicate 95% confidence limits. R2 and nominal p-values are shown. n = 65. Hb, hemoglobin; WBC, white blood cell count; LDL, low-density lipoprotein cholesterol.
The cross-sectional PCA loading matrix provided complementary multivariable context (Figure 5C). On PC1, grip strength was oriented in the same direction as hemoglobin, weight, waist circumference, and several additional routine measures. PC2 placed grip strength in the same direction as hemoglobin and albumin and in the opposite direction to WBC and platelet count. PC3 was primarily characterized by LDL and glucose. Thus, grip strength was not confined to a single anthropometric or hematologic component but was distributed across components incorporating both types of information.
In complementary linear analyses of the adjusted standardized residuals, grip strength explained 18.5% of the variance in weight (R2 = 0.1846, p = 0.0004) and 11.1% of the variance in Hb (R2 = 0.1109, p = 0.0067; Figure 5D). Collectively, these exploratory results provide a functional linkage between grip strength and both anthropometric and hematologic dimensions.
4. Discussion
The principal contribution of this study is an exploratory two-axis framework for describing multidomain change spanning breast cancer surgery using routinely collected measurements. In 122 women, two components explained 52.0% of adjusted longitudinal variation: PC1 represented coordinated multidomain change, whereas PC2 contrasted anthropometric with hematologic/protein-related change. These descriptions provide hypotheses about relationships among the measured variables. They do not establish distinct biological recovery processes, clinically defined patient states, or functional and prognostic validity. The accompanying pairwise correlations describe the same dataset and therefore do not constitute independent validation of the components.
Cohort-level changes and participant-level covariance answer different questions. WBC and platelet counts decreased most consistently, whereas weight and LDL cholesterol showed smaller reductions. Other variables showed little net median change but still contributed to multivariable heterogeneity. A stable median can conceal opposing individual trajectories, and a significant reduction does not establish improvement or deterioration. Treatment exposure, medication use, nutritional status, inflammation, and intentional lifestyle change could contribute to these findings, but their respective effects could not be distinguished. For instance, reductions in weight or LDL cholesterol may reflect various changes, such as intentional health improvement, treatment-related loss of body mass, changes in nutritional status, medication use, or other unmeasured clinical factors [18,19]. In addition, reductions in circulating blood cell counts may be related to treatment exposure, marrow recovery, inflammation, or differences in the timing of routine examinations [20,21,22].
In our results, PC1 captured common variation across anthropometric, metabolic, and selected hematologic measures. Its dominant weight and waist contributions suggest that body-size change was a major organizing feature of the observed covariance. However, increases in weight, waist circumference, or glucose can have different clinical implications from preservation of Hb or blood-cell counts. Higher PC1 scores therefore should not be labeled as better recovery or greater physiological reserve. They indicate a particular pattern of change relative to that expected under the adjustment model. PC2 highlighted discordance between body size and hematologic/protein-related measurements. Preserved or increased weight and waist circumference did not necessarily accompany preserved Hb and albumin. This contrast may motivate more detailed assessment when anthropometric and laboratory trajectories diverge. It cannot identify sarcopenia, malnutrition, or fluid retention: weight and waist circumference do not distinguish muscle, fat, and fluid, while albumin is influenced by several non-nutritional processes. Direct body-composition and functional measurements are needed to establish the clinical meaning of this contrast.
The secondary grip-strength analysis provided exploratory functional context for these dimensions. The cross-sectional PCA also placed grip strength within components containing both anthropometric and hematologic information. These findings are physiologically plausible because grip strength depends partly on body and muscle mass, while Hb may influence oxygen delivery and exercise capacity. Previous studies have associated anemia, nutritional status, obesity, sarcopenia, and muscle strength individually with functional status and cancer outcomes [23,24,25]. Another prospective study of upper-limb function assessed grip strength before breast cancer surgery and 2.5 years after treatment [26]. The present analysis extends this framework by suggesting that functional capacity may relate simultaneously to routinely measured anthropometric and hematologic dimensions.
The principal contribution of this study differs from studies that evaluate a single biomarker or construct a supervised prediction model for a predefined clinical outcome. The present analysis synchronized repeated routine measurements to a clinically meaningful index date and used unsupervised multivariable analysis to identify the dominant structure of change. It therefore provides a data-derived framework for organizing heterogeneous clinical trajectories before a direct functional outcome is available. These two axes may help generate testable hypotheses regarding patients who show coordinated preservation across multiple systems and those who show discordance between body-size and hematologic–nutritional changes. Importantly, the current findings support the existence and internal coherence of these statistical axes, but not their prognostic utility. Their potential value lies in using existing clinical data to prompt targeted evaluation when multidomain change or anthropometric–hematologic discordance is observed [27].
Several strengths should be noted. First, repeated measurements were aligned to an explicit clinical index date rather than analyzed solely by calendar time. Second, same-method paired examinations were selected within prespecified temporal windows, reducing measurement heterogeneity. Third, longitudinal changes were adjusted for their respective baseline values, baseline age, examination interval, and baseline calendar year before standardization. Fourth, parallel analysis provided an objective basis for retaining two principal components. Fifth, correlation testing was corrected for multiple comparisons and provided an interpretable network-level ground for the PCA structure. Finally, the independently constructed grip-strength cohort allowed an initial examination of potential functional relevance.
This study also has important limitations. Its retrospective, single-center design is subject to selection bias, incomplete documentation, and informative missingness. Only 122 of 473 women with breast cancer contributed complete longitudinal data, and the cross-sectional grip-strength analysis included 65 women. Participants undergoing repeated health examinations may differ systematically from patients with more severe disease or less regular follow-up. Detailed information on cancer stage, molecular subtype, chemotherapy, endocrine therapy, radiotherapy, recurrence, comorbidities, medications, menopausal status, dietary behavior, and rehabilitation exposure was not uniformly available and could not be incorporated into the primary models. The comparison with breast-surgery records showed that the proxy date could misclassify examination timing relative to the operation. The primary components therefore describe patterns of change between routine examinations selected using the proxy date. A similar two-component structure was observed among the 97 women whose original pairs met both windows relative to documented surgery dates. This sensitivity analysis was conditional on selection into the original longitudinal cohort and the availability of documented dates. The analysis was limited to routine laboratory and anthropometric variables and did not include direct measurements of clinical outcomes. PCA is sample-dependent, and component orthogonality is a mathematical property rather than evidence of biological independence. Although PC1 and PC2 explained a substantial proportion of the total variance, approximately half of the observed variation remained outside these two components. Replication of the loading patterns and validation against direct functional measurements and clinical outcomes are required before clinical interpretation or application. Prospective studies should collect routine measurements, body composition, physical performance, symptoms, and treatment information at predefined intervals. Replication should evaluate component stability and apply prespecified weights in an independent cohort, with explicit assessment of their incremental association with clinically meaningful outcomes. The present study identifies two candidate dimensions of longitudinal clinical change and provides a basis for this evaluation; their value for assessing or predicting recovery remains to be established.
5. Conclusions
Among 122 women with breast cancer, two principal components explained 52.0% of the variance in adjusted changes across eight routine measures from paired examinations selected relative to a surgery-related proxy date. One axis pattern captured coordinated changes across routine measures, and the other axis contrasted changes in body size with those in hemoglobin/albumin. Similar patterns were observed in 97 women whose examination pairs met both windows relative to documented surgery dates. These findings illustrate how routinely collected anthropometric and laboratory measures can be analyzed together to characterize longitudinal changes across clinical domains in women with breast cancer.
Supplementary Materials
The following supporting information can be downloaded at: https://www.mdpi.com/article/10.3390/cancers18223668/s1. Table S1: Available characteristics of women included in and excluded from the longitudinal analysis; Table S2: Sensitivity of longitudinal PCA to separate adjustment for proxy-relative examination intervals; Table S3: Agreement with documented surgery dates and PCA of eligible original examination pairs.
Author Contributions
Conceptualization, H.C. and J.Y.J.; methodology, H.C.; software, H.C. and W.-H.Y.; validation, H.C., W.-H.Y. and J.Y.J.; formal analysis, H.C.; investigation, H.C. and W.-H.Y.; resources, W.-H.Y. and J.Y.J.; data curation, W.-H.Y.; writing—original draft preparation, H.C.; writing—review and editing, H.C., W.-H.Y. and J.Y.J.; visualization, H.C.; supervision, J.Y.J.; project administration, J.Y.J.; funding acquisition, H.C. and J.Y.J. All authors have read and agreed to the published version of the manuscript.
Funding
This work was supported by the National Research Foundation of Korea (NRF) (No. RS-2025-00515862) and the Institute of Information & Communications Technology Planning & Evaluation (IITP) grant funded by the Korean government (MSIT) (No. RS-2025-25441324).
Institutional Review Board Statement
The study was conducted in accordance with the Declaration of Helsinki and approved by the Institutional Review Board (or Ethics Committee) of Asan Medical Center Institutional Review Board (IRB), Seoul, Republic of Korea (protocol code 2026-0332 and 17 March 2026).
Informed Consent Statement
This study was conducted retrospectively using previously collected data. The requirement for obtaining informed consent from individual participants was waived by the Institutional Review Board in accordance with the applicable institutional regulations for retrospective research.
Data Availability Statement
The data that support the findings of this study are available from the corresponding author upon reasonable request.
Acknowledgments
The English editing, typo correction, formatting of the manuscript, and revision of the Python analysis code were conducted using ChatGPT 6 Astra.
Conflicts of Interest
The authors declare no conflicts of interest.
References
- Campbell, K.L.; Pusic, A.L.; Zucker, D.S.; McNeely, M.L.; Binkley, J.M.; Cheville, A.L.; Harwood, K.J. A prospective model of care for breast cancer rehabilitation: Function. Cancer 2012, 118, 2300–2311. [Google Scholar] [CrossRef] [Scilit] [PubMed]
- Stout, N.L.; Binkley, J.M.; Schmitz, K.H.; Andrews, K.; Hayes, S.C.; Campbell, K.L.; McNeely, M.L.; Soballe, P.W.; Berger, A.M.; Cheville, A.L.; et al. A prospective surveillance model for rehabilitation for women with breast cancer. Cancer 2012, 118, 2191–2200. [Google Scholar] [CrossRef] [Scilit] [PubMed]
- Nardin, S.; Mora, E.; Varughese, F.M.; D’Avanzo, F.; Vachanaram, A.R.; Rossi, V.; Saggia, C.; Rubinelli, S.; Gennari, A. Breast Cancer Survivorship, Quality of Life, and Late Toxicities. Front. Oncol. 2020, 10, 854. [Google Scholar] [CrossRef] [Scilit] [PubMed]
- Cho, Y.; Do, J.; Jung, S.; Kwon, O.; Jeon, J.Y. Effects of a physical therapy program combined with manual lymphatic drainage on shoulder function, quality of life, lymphedema incidence, and pain in breast cancer patients with axillary web syndrome following axillary dissection. Support. Care Cancer 2016, 24, 2047–2057. [Google Scholar] [CrossRef] [Scilit] [PubMed]
- Son, W.C.; Kim, S.A.; Kim, A.H.; Cheon, H.; Jeon, J.Y. Effects of Forearm Resistance Exercises on Breast Cancer-Related Lymphedema Using Segmental Bioelectrical Impedance Analysis: A Pilot Randomized Controlled Trial. J. Clin. Med. 2024, 13, 7200. [Google Scholar] [CrossRef] [Scilit] [PubMed]
- Sheean, P.M.; Hoskins, K.; Stolley, M. Body composition changes in females treated for breast cancer: A review of the evidence. Breast Cancer Res. Treat. 2012, 135, 663–680. [Google Scholar] [CrossRef] [Scilit] [PubMed]
- Mendez, V.; Diedrichsen Marstrand, S.; Nielsen, A.; Lund-Jacobsen, T.; Kistorp, C.; Schwarz, P.; Buch-Larsen, K. Body composition changes in women with early breast cancer after adjuvant treatment: A systematic review. Acta Oncol. 2025, 64, 1640–1647. [Google Scholar] [CrossRef] [Scilit] [PubMed]
- Evans, D.C.; Corkins, M.R.; Malone, A.; Miller, S.; Mogensen, K.M.; Guenter, P.; Jensen, G.L. The Use of Visceral Proteins as Nutrition Markers: An ASPEN Position Paper. Nutr. Clin. Pract. 2021, 36, 22–28, Corrigendum in Nutr. Clin. Pract. 2021, 36, 909. [Google Scholar] [CrossRef] [Scilit] [PubMed]
- Dieli-Conwright, C.M.; Wong, L.; Waliany, S.; Bernstein, L.; Salehian, B.; Mortimer, J.E. An observational study to examine changes in metabolic syndrome components in patients with breast cancer receiving neoadjuvant or adjuvant chemotherapy. Cancer 2016, 122, 2646–2653. [Google Scholar] [CrossRef] [Scilit] [PubMed]
- Ballard-Barbash, R.; Friedenreich, C.M.; Courneya, K.S.; Siddiqi, S.M.; McTiernan, A.; Alfano, C.M. Physical Activity, Biomarkers, and Disease Outcomes in Cancer Survivors: A Systematic Review. JNCI J. Natl. Cancer Inst. 2012, 104, 815–840. [Google Scholar] [CrossRef] [Scilit] [PubMed]
- Lee, E.C.; Fragala, M.S.; Kavouras, S.A.; Queen, R.M.; Pryor, J.L.; Casa, D.J. Biomarkers in Sports and Exercise: Tracking Health, Performance, and Recovery in Athletes. J. Strength Cond. Res. 2017, 31, 2920–2937. [Google Scholar] [CrossRef] [Scilit] [PubMed]
- Price, N.D.; Magis, A.T.; Earls, J.C.; Glusman, G.; Levy, R.; Lausted, C.; McDonald, D.T.; Kusebauch, U.; Moss, C.L.; Zhou, Y.; et al. A wellness study of 108 individuals using personal, dense, dynamic data clouds. Nat. Biotechnol. 2017, 35, 747–756. [Google Scholar] [CrossRef] [Scilit] [PubMed]
- Maghsoudi, Z.; Nguyen, H.; Tavakkoli, A.; Nguyen, T. A comprehensive survey of the approaches for pathway analysis using multi-omics data integration. Brief. Bioinform. 2022, 23, bbac435. [Google Scholar] [CrossRef] [Scilit] [PubMed]
- Wieder, C.; Cooke, J.; Frainay, C.; Poupin, N.; Bowler, R.; Jourdan, F.; Kechris, K.J.; Lai, R.P.; Ebbels, T. PathIntegrate: Multivariate modelling approaches for pathway-based multi-omics data integration. PLoS Comput. Biol. 2024, 20, e1011814. [Google Scholar] [CrossRef] [Scilit] [PubMed]
- Jolliffe, I.T.; Cadima, J. Principal component analysis: A review and recent developments. Philos. Trans. R. Soc. A Math. Phys. Eng. Sci. 2016, 374, 20150202. [Google Scholar] [CrossRef] [Scilit] [PubMed]
- Dobriban, E. Permutation methods for factor analysis and PCA. Ann. Stat. 2020, 48, 2824–2847. [Google Scholar] [CrossRef] [Scilit]
- Glickman, M.E.; Rao, S.R.; Schultz, M.R. False discovery rate control is a recommended alternative to Bonferroni-type adjustments in health studies. J. Clin. Epidemiol. 2014, 67, 850–857. [Google Scholar] [CrossRef] [Scilit] [PubMed]
- Schatz, I.J.; Masaki, K.; Yano, K.; Chen, R.; Rodriguez, B.L.; Curb, J.D. Cholesterol and all-cause mortality in elderly people from the Honolulu Heart Program: A cohort study. Lancet 2001, 358, 351–355. [Google Scholar] [CrossRef] [Scilit] [PubMed]
- Kalantar-Zadeh, K.; Block, G.; Humphreys, M.H.; Kopple, J.D. Reverse epidemiology of cardiovascular risk factors in maintenance dialysis patients. Kidney Int. 2003, 63, 793–808. [Google Scholar] [CrossRef] [Scilit] [PubMed]
- Crawford, J.; Dale, D.C.; Lyman, G.H. Chemotherapy-induced neutropenia. Cancer 2004, 100, 228–237. [Google Scholar] [CrossRef] [Scilit] [PubMed]
- Sherman, R.E.; Anderson, S.A.; Dal Pan, G.J.; Gray, G.W.; Gross, T.; Hunter, N.L.; LaVange, L.; Marinac-Dabic, D.; Marks, P.W.; Robb, M.A.; et al. Real-World Evidence—What Is It and What Can It Tell Us? N. Engl. J. Med. 2016, 375, 2293–2297. [Google Scholar] [CrossRef] [Scilit] [PubMed]
- Booth, C.M.; Karim, S.; Mackillop, W.J. Real-world data: Towards achieving the achievable in cancer care. Nat. Rev. Clin. Oncol. 2019, 16, 312–325. [Google Scholar] [CrossRef] [Scilit] [PubMed]
- Caro, J.J.; Salas, M.; Ward, A.; Goss, G. Anemia as an independent prognostic factor for survival in patients with cancer: A systemic, quantitative review. Cancer 2001, 91, 2214–2221. [Google Scholar] [PubMed]
- Prado, C.M.; Lieffers, J.R.; McCargar, L.J.; Reiman, T.; Sawyer, M.B.; Martin, L.; Baracos, V.E. Prevalence and clinical implications of sarcopenic obesity in patients with solid tumours of the respiratory and gastrointestinal tracts: A population-based study. Lancet Oncol. 2008, 9, 629–635. [Google Scholar] [CrossRef] [Scilit] [PubMed]
- Fearon, K.; Strasser, F.; Anker, S.D.; Bosaeus, I.; Bruera, E.; Fainsinger, R.L.; Jatoi, A.; Loprinzi, C.; MacDonald, N.; Mantovani, G.; et al. Definition and classification of cancer cachexia: An international consensus. Lancet Oncol. 2011, 12, 489–495. [Google Scholar] [CrossRef] [Scilit] [PubMed]
- Sagen, A.; Kaaresen, R.; Sandvik, L.; Thune, I.; Risberg, M.A. Upper Limb Physical Function and Adverse Effects After Breast Cancer Surgery: A Prospective 2.5-Year Follow-Up Study and Preoperative Measures. Arch. Phys. Med. Rehabil. 2014, 95, 875–881. [Google Scholar] [CrossRef] [Scilit] [PubMed]
- Caan, B.J.; Cespedes Feliciano, E.M.; Prado, C.M.; Alexeeff, S.; Kroenke, C.H.; Bradshaw, P.; Quesenberry, C.P.; Weltzien, E.K.; Castillo, A.L.; Olobatuyi, T.A.; et al. Association of Muscle and Adiposity Measured by Computed Tomography With Survival in Patients With Nonmetastatic Breast Cancer. JAMA Oncol. 2018, 4, 798. [Google Scholar] [CrossRef] [Scilit] [PubMed]

Disclaimer/Publisher’s Note: The statements, opinions and data contained in all publications are solely those of the individual author(s) and contributor(s) and not of MDPI and/or the editor(s). MDPI and/or the editor(s) disclaim responsibility for any injury to people or property resulting from any ideas, methods, instructions or products referred to in the content. |
© 2026 by the authors. Licensee MDPI, Basel, Switzerland. This article is an open access article distributed under the terms and conditions of the Creative Commons Attribution (CC BY) license.