


Abstract
A sub-microliter silicon microthermocycler platform for rapid point-of-care PCR analytical systems is proposed. To suppress reaction microchamber enzyme adsorption while preserving master mix stoichiometry and amplicon purity, a 24-h bovine serum albumin pre-passivation protocol on developed PDMS–glass microchambers was employed. The system relies on an advanced electro-thermal architecture; it combines a low thermal mass four-tether titanium-on-silicon microheater (Cheater ≈ 8 mJ/K) with an STM32 discrete PID controller and a MAX4211 constant-power regulator. This setup was systematically validated across steady-state plateaus and phase hold time compressions. Thermal characterization revealed a heating rate of 175 °C/s and a cooling rate of 12.5 °C/s (τloaded = 4.04 s). Furthermore, the system maintained sub-degree temperature stability across extended 40-cycle runs (ΔTdrift = +0.001 °C). Optimization of phase thermal parameters (96 °C denaturation, 60 °C annealing, 72 °C extension) and hold times (10 s denaturation, 5 s annealing, 2.5 s extension) enabled successful amplification of a 102-base-pair target within 12 min, achieving 65% runtime reduction compared to conventional benchtop thermocyclers. Lacking real-time fluorescence detection, the prototype currently relies on off-chip secondary qPCR quantification.
1. Introduction
Polymerase chain reaction (PCR) remains a foundational technique for nucleic acid amplification, widely utilized in clinical diagnostics, infectious disease surveillance, food safety, environmental monitoring, and genetic analysis [1,2,3]. Its high analytical sensitivity and specificity have established real-time quantitative PCR (qPCR) as the benchmark for diagnostic workflows requiring accurate pathogen detection and quantitative readout [4,5,6]. However, conventional benchtop PCR remains constrained by bulky instrumentation, centralized operation, high power consumption, and relatively slow thermal ramp rates, with typical runs requiring 1 to 3 h and sample volumes between 10 and 50 µL [1,2,7]. These operational limitations impede the deployment of standard PCR platforms in emergency medicine, point-of-care (POC) testing, and field-based diagnostics, where rapid turnaround times, low power requirements, and system portability are essential [1,2,8].
Microfluidic PCR has emerged as an effective strategy to overcome these constraints by reducing thermal mass, decreasing reagent consumption, and enabling integrated, miniaturized device architectures [9,10,11]. Because sub-microliter reaction volumes undergo rapid thermal equilibration, microfluidic platforms achieve significantly shorter cycle times while lowering total power demand [10,12]. A variety of micro-PCR variations have been developed, including stationary-chamber microreactors, continuous-flow channels, shunting networks, digital microfluidic chips, and droplet-based systems. Each presents distinct performance trade-offs in cycling flexibility, throughput, fluid control, and system complexity [13,14,15,16].
Among candidate substrate materials, silicon is well suited for rapid thermocycling owing to its high thermal conductivity (150 W/(mK)), structural rigidity, and compatibility with standard micro-electromechanical systems (MEMS) thin-film heaters and resistive temperature detectors (RTD) microfabrication [4,17,18]. Early BioMEMS studies have established that etched silicon microchambers capped with glass could support successful on-chip amplification while leveraging high surface-area-to-volume ratios and efficient conductive heat transfer [4,18]. Subsequent designs integrated thin-film metallic microheaters and sensors directly onto suspended silicon membranes or tethered structures, achieving highly localized thermal management and reduced electrical power consumption [10,19]. High-performance silicon microreactors have demonstrated heating and cooling rates exceeding 100 °C/s, thus completing 40-cycle real-time PCR in under six minutes [4]. Complementary non-silicon approaches include glass microchips using discrete chip resistors [2], printed circuit board (PCB) substrates [20,21], flexible circuit films [20], and 3D-printed assemblies [22], further illustrating the broad movement toward miniaturized diagnostic platforms [3,5].
Achieving ultra-fast PCR kinetics requires accurate dynamic temperature control within the micro-reaction volume [6,15,23]. In microscale thermocyclers, low thermal mass enhances ramp rates but also increases susceptibility to thermal overshoot, high spatial temperature gradients, and transient temperature offsets between the integrated sensor and the biological sample [15,23]. Closed-loop dynamic regulation (utilizing proportional-integral-derivative (PID) control, non-linear feedback, or feedforward compensation) is critical to maintain thermal stability and sub-degree accuracy [6,15,19,23]. Sub-degree precision and rapid transient settling are essential prerequisites for stable ultra-short phase durations without compromising enzymatic efficiency [4,15,19].
However, scaling reaction volumes down to the sub-microliter regime introduces substantial bio-interface and fluidic challenges [24,25,26]. High surface-area-to-volume ratios may increase non-specific adsorption of Taq DNA polymerase and target template molecules onto microchamber walls, which can cause up to total PCR inhibition [25,26]. In polydimethylsiloxane (PDMS)-glass hybrid microreactors, surface passivation strategies, such as dynamic additives (e.g., Tween-20, non-ionic surfactants) or static surface pre-passivation with bovine serum albumin (BSA), are necessary to preserve enzyme activity [25,26]. Thermal cycling of sub-microliter samples rapidly induces sample evaporation, phase change, and bubble formation, resulting in the necessity for vapor barriers such as mineral oil overlays, virtual reaction chambers (VRCs), or hermetically sealed cartridges [4,24,27,28].
In this work, we build on our previously established four-tether suspended silicon microheater architecture (modified structure from [4]) and lumped-element thermal modeling [29]. This study presents a sub-microliter silicon microthermocycler (SMTC) platform for rapid PCR amplification. Rather than attempting absolute template copy-number quantification, on-chip amplification performance is evaluated qualitatively in terms of reaction success (successful vs. failed amplification). Because primary thermal cycling drives active microchamber reactions toward the plateau phase (reagent saturation), secondary off-chip qPCR analysis on harvested products is employed to confirm successful amplicon synthesis. Under this qualitative framework, parameter optimizations (e.g., surface passivation protocols, temperature setpoints, and phase hold times) are determined by identifying the most time-efficient operational envelope that consistently yields successful amplification.
While full quantitative monitoring is currently performed by off-chip secondary sampling, this work establishes the critical baseline for thermal control, bio-interface stability, and protocol compression. Integration of a custom optical detection system beneath the microheater central aperture is currently underway to transition this platform toward fully integrated, quantitative real-time diagnostic operation.
By bridging the gap between advanced MEMS thermal engineering and practical biochemical kinetics, this platform addresses critical bottlenecks in Point-of-Care (POC) diagnostics. The ability to perform highly stable, ultra-fast amplification in mass-manufacturable silicon architectures is essential for the future deployment of portable diagnostic tools in emergency medicine, resource-limited settings, and rapid outbreak response.
2. Design, Fabrication and Hardware of SiMQPCR
The system described in this paper extends upon the validated four-tether titanium-on-silicon microthermocycler architecture reported in previous work [29]. A 500 nL PDMS–glass microchamber was fabricated for direct DNA sample loading onto the microthermocycler (MTC), with the future capability of performing in situ DNA analysis using a custom-developed fluorescence detection system. In this study, the efficiency and optimization of DNA amplification on our system were determined indirectly using a commercial quantitative PCR (qPCR) instrument (Roche LightCycler® 480, Basel, Switzerland).
2.1. Silicon Microheater Architecture and Fabrication
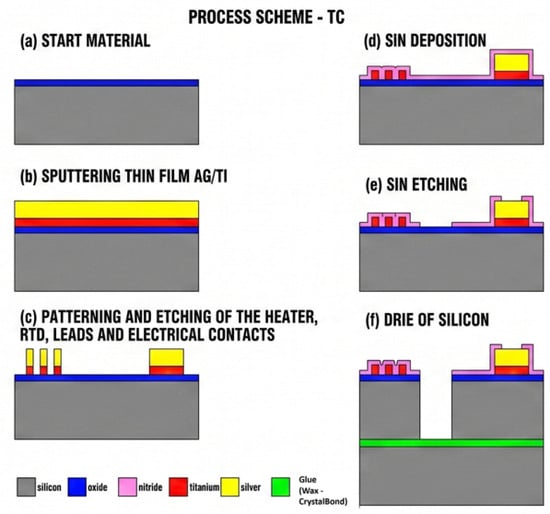
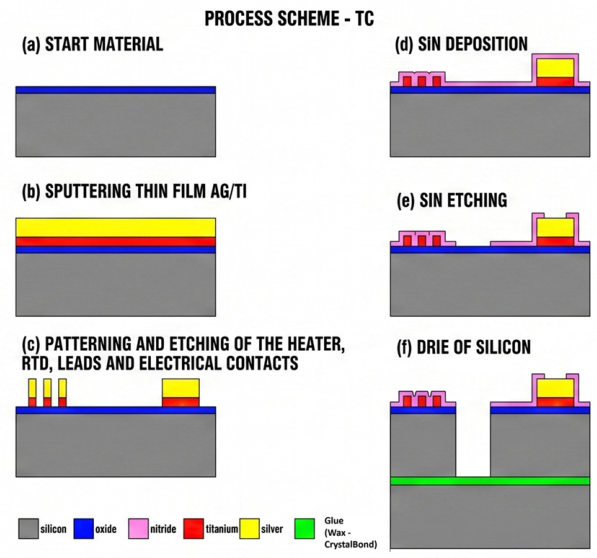
The system comprised a custom microfabricated silicon microheater and sensor engineered for low thermal mass, rapid dynamic response, and localized thermal management. The microheater platform was fabricated on a 200 µm-thick, 100 mm-diameter silicon wafer with a substrate resistivity of 15 Ωcm. Electrical isolation between the conductive silicon substrate and the active metallic layers was provided by a 0.35 µm-thick thermally grown silicon dioxide layer, and metal protection was provided by a 200 nm thick plasma-enhanced chemical vapor deposition (PECVD) silicon nitride layer (Figure 1).
Figure 1.
Fabrication process scheme of the titanium-on-silicon microthermocycler (SMTC). (a) Initial oxidation of the 200 µm silicon substrate to form a 0.35 µm thermal SiO2 insulating layer (blue). (b) Sputter deposition of the active thin-film metal stack (780 nm Ti (red)/800 nm Ag (yellow)). (c) Photolithographic patterning and selective wet etching of the Ti/Ag layer to define the microheater, RTD meanders, interconnect leads, and contact pads. (d) PECVD of a 300 nm Si3N4 passivation layer (pink). (e) Selective dry etching of the Si3N4 layer to reopen contact pads and define through-wafer etch windows. (f) Deep Reactive Ion Etching (DRIE) Bosch process for through-silicon etching to define the suspended 4-tether geometry and central aperture, using a wax/CrystalBond-bonded carrier wafer.
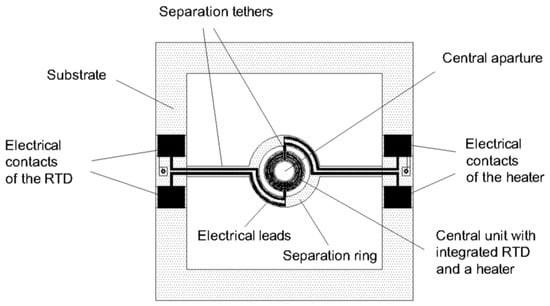
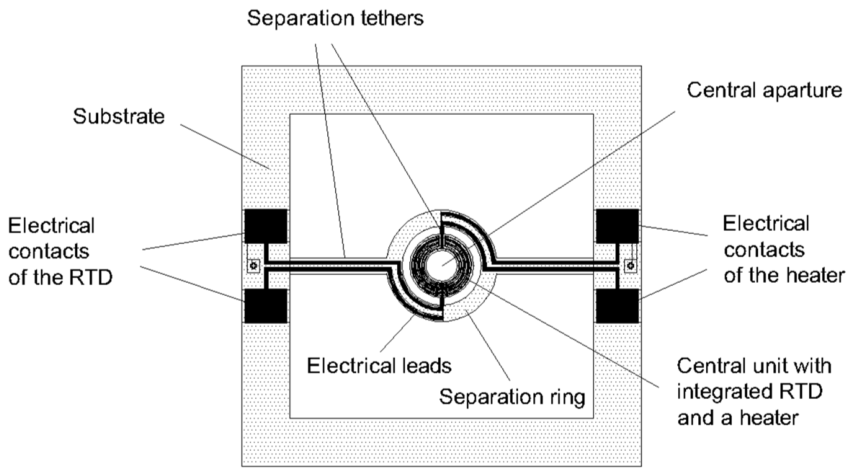
Mechanical and thermal isolation of the 4 mm diameter central reaction unit with integrated RTD and a heater was achieved through an optimized four-tether structural suspension scheme featuring an inner tether width (wti) of 250 µm, an outer tether width (wto) of 1000 µm, and a separation ring width (wr) of 1000 µm. This tethered architecture utilizes a concentric suspension design to physically isolate the central reaction unit in mid-air. A larger outer silicon ring (the separation ring) is connected to the bulk silicon substrate by two outer tethers. Inside this ring lies the smaller central unit—which houses the active heater and RTD—connected to the separation ring by two additional inner tethers. This nested four-tether arrangement effectively isolates the active heating zone and minimizes parasitic conductive heat loss to the bulk substrate. For bottom-side fluorescence excitation, a hollow structure design incorporating a 2000 µm central aperture (da) was implemented. This aperture will be used to integrate the SMTC with a custom fluorescence detection system. Figure 2 shows a schematic of the silicon microthermocycler.
Figure 2.
Schematic of silicon microthermocycler.
Localized heating and temperature sensing were accomplished using thin-film titanium (Ti) meanders co-fabricated on the underside of the central platform. Titanium was selected over conventional platinum to yield a higher sheet resistance within a compact footprint, thereby preventing resistance measurement errors in two-wire sensing and eliminating parasitic power losses in the heater leads [30]. Furthermore, its well-defined Temperature Coefficient of Resistance (TCR) ensures high thermal sensitivity for the integrated RTD. The metallic stack consisted of a 780 nm thick DC magnetron-sputtered titanium layer, overlaid with an 800 nm thick silver (Ag) layer selectively patterned on contact pads and electrical leads to minimize interconnect resistance. The entire thin-film network was passivated with a 300 nm PECVD silicon nitride layer.
The TCR and resistance-temperature response R(T) were calibrated by placing the microthermocycler on a temperature-stabilized hotplate and measuring discrete resistance values across the operational temperature range. Linear regression fitting to the temperature model, RT = R20(1 + TCR(T − 20 °C)), demonstrated excellent linearity (R2 > 0.99). At a reference temperature of 20 °C, the nominal resistance of the titanium microheater was R20 = 98.07 Ω, while the integrated Resistance Temperature Detector (RTD) exhibited a nominal resistance of R20 = 724.76 Ω. TCR was measured at 4400 ppm/°C. Electro-thermal characterization under unloaded conditions confirmed an empirical thermal conductance of G = 0.0055 W/K and a thermal capacitance of H = 0.008 J/K for the hollow structure, yielding an unloaded thermal time constant of τ = 1.46 s. Under actual PCR loading conditions (a 500 nL sample encapsulated under mineral oil on a glass substrate disc), the increased system mass shifted the effective thermal time constant to τ = 4.04 s.
2.2. Thermal Control (Regulation) of the Silicon Microthermocycler
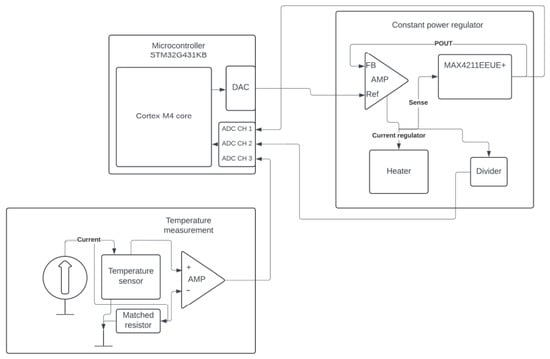
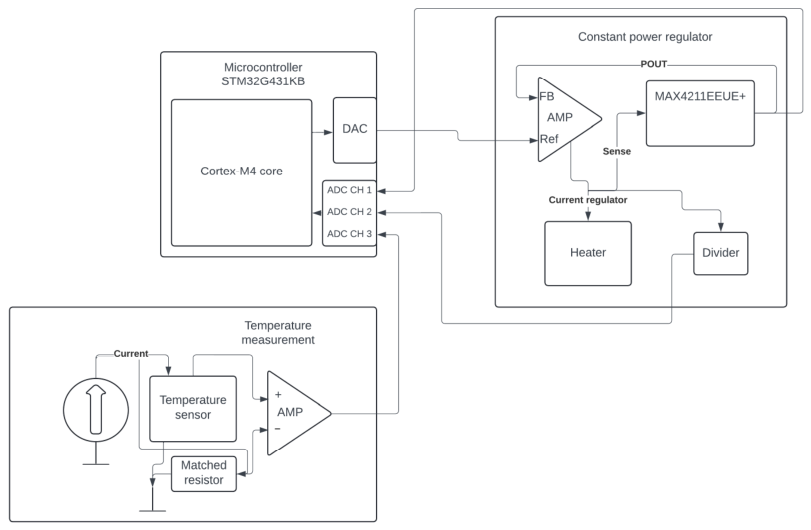
To achieve rapid, high-precision thermal control on the silicon microthermocycler platform, a custom embedded control system was developed around an STM32G431KB 32-bit ARM Cortex-M4 microcontroller. The system architecture separates real-time thermal measurement from local power regulation through a hybrid digital-analog topology comprising a constant power regulator loop and a precision temperature measurement front-end. A block diagram of the electronics architecture is shown in Figure 3.
Figure 3.
Block diagram of the electronic circuit for temperature control and measurement.
The microcontroller samples the RTD temperature and regulates the heater power. The control loop operates at a sampling frequency of 20 Hz, corresponding to a sampling interval Δt = 50 ms. During each interrupt routine, the sensor voltage is digitized, converted to a temperature value, and compared against the target setpoint to calculate the error.
Regulation of the temperature is accomplished using a customized discrete-time PID regulator, optimized for the rapid thermal kinetics of the four-tether structure while maintaining stability in the presence of noise. To tune the PID regulator, the I and D coefficients were first set to zero, the P coefficient was set to 0.05, and it was increased incrementally in steps of 0.05 until it reached 0.5. The best response was observed with the coefficient set to Kp = 0.35. Coefficient values below 0.35 resulted in a sluggish response, while higher coefficient values caused severe temperature oscillations. After that tuning, the integral coefficient was set at KI = 0.1, which removed small steady-state errors, while the derivative coefficient was set at KD = 0.1 to attenuate remaining temperature oscillations. To eliminate the derivative overshoot associated with setpoint transitions, the derivative component is calculated based on the change in measured temperature rather than the error. A first-order low-pass derivative filter is implemented to attenuate high-frequency noise. The integral component uses an averaging window of N = 10 samples to smooth error accumulation. To regulate heat transitions from 60 to 95 °C, the firmware implements an anti-windup mechanism, achieved through dynamic integrator clamping. Unlike static clamping, this method uses dynamic limit thresholds that adjust according to the current state of the thermal cycle, effectively preventing integral saturation during high-power ramps while allowing minor corrections in steady state. The resulting control signal serves as a reference for the MAX4211, which regulates the electrical power delivered to the heater.
2.2.1. Constant Power Regulator
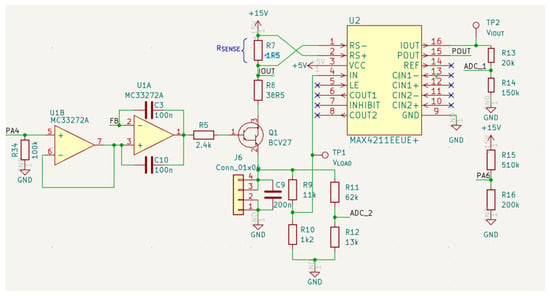
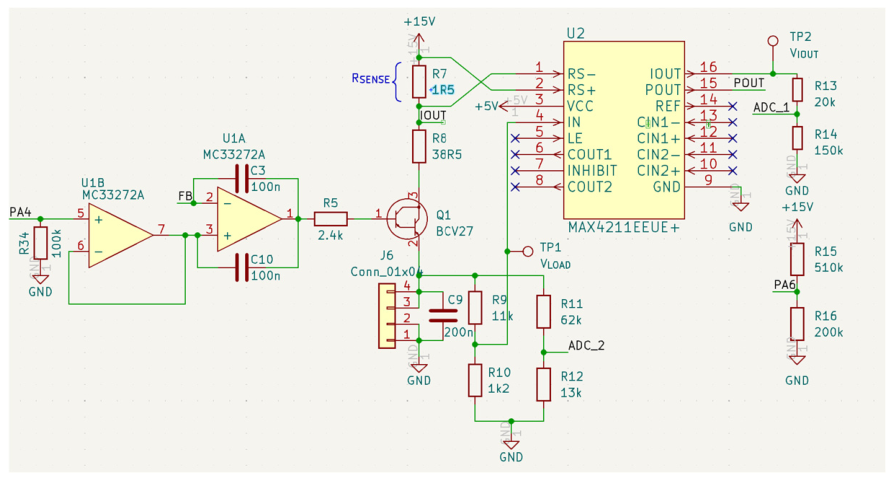
The temperature of the thin-film titanium microheater, connected via interface terminal J6, is regulated through an autonomous analog power feedback loop supplied by a +15 V rail. Current and voltage are continuously monitored using a MAX4211 (U2). The schematic is shown in Figure 4.
Figure 4.
Schematic of the control loop for temperature regulation.
Current sensing is executed across a current sensing resistor R7 (1.5 Ω). The internal analog multiplier of the MAX4211 transforms heater voltage and current into an output voltage VPOUT. The control feedback network incorporates a dual MC33272A operational amplifier (U1). The first stage (U1B) acts as a buffer for the power setpoint (PW) set by the microcontroller digital-to-analog converter (DAC). The second stage (U1A) functions as an analog error amplifier, directly comparing this scaled reference voltage against the real-time feedback voltage FB supplied by VPOUT. The resulting error voltage drives the base of a BCV27 NPN Darlington transistor (Q1) through a 2.4 kΩ base resistor (R5), leveraging the high current gain of the Darlington pair to dynamically modulate the heater current and maintain the exact power setpoint. For closed-loop telemetry and system diagnostics, attenuation resistor networks enable monitoring of the heater voltage and current on the microcontroller analog-to-digital converter channels. Power (ADC_1) is sampled via a voltage divider formed by R13 and R14. Heater voltage (ADC_2) is monitored through a dedicated attenuation network comprising R11 and R12, enabling continuous real-time verification of power delivery.
2.2.2. RTD Temperature Measurement
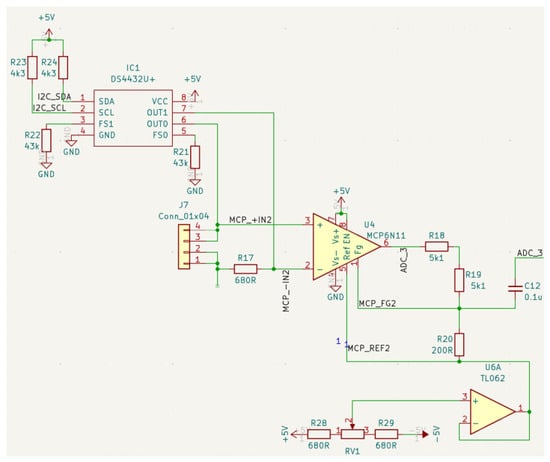
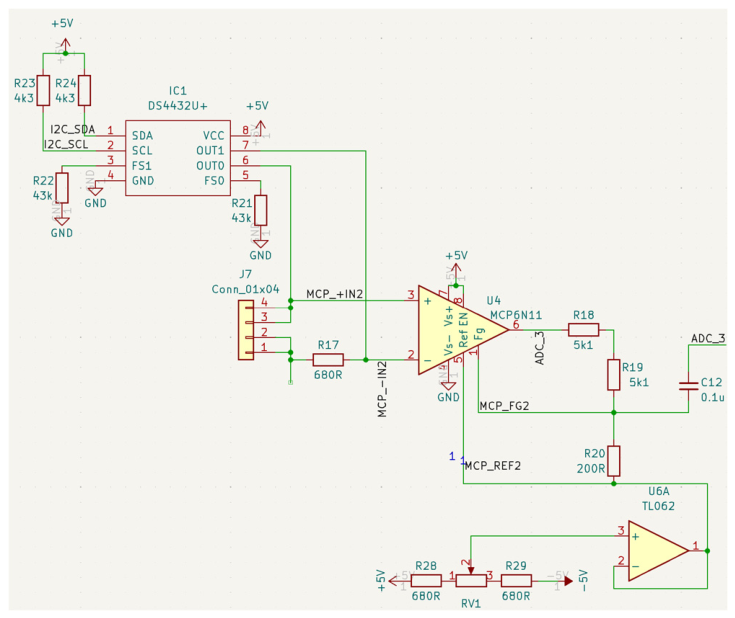
Temperature monitoring across the thin-film titanium RTD, connected via terminal J7, is accomplished using a low-noise, digitally configurable current source and differential signal conditioning topology. The schematic is shown in Figure 5.
Figure 5.
Schematic of RTD temperature measurement.
Sensor excitation is driven by a DS4432U+ dual 7-bit I2C-controlled current DAC (IC1), with full-scale current bounds established by external reference resistors (R21 = R22 = 43 Ω). Interface to the host microcontroller is established via pulled-up I2C bus lines (I2C_SDA and I2C_SCL with R23 and R24); IC1 delivers digitally programmable excitation currents through channels OUT0 and OUT1 directly to the sensor terminal and matched resistor (R17). The differential voltage between the sensor terminal (MCP_+IN2) and a matched resistor terminal (MCP_-IN2) is routed to an MCP6N11 instrumentation amplifier (U4). To remove the offset voltage of ADC_3, an adjustable baseline offset voltage V_REF is injected into the reference terminal MCP_REF2 of U4. This calibration offset is generated via a potentiometer (RV1) bridged between +5 V and −5 V rails with series resistors R28 and R29, and buffered by a TL062 operational amplifier (U6A). The amplified signal from U4 passes through a passive RC low-pass anti-aliasing network consisting of R18, R19 and C12. This output stage effectively suppresses noise and high-frequency ripples prior to digital sampling by ADC_3. The gain of MCP6N11 (52) was set by resistors R18, R19 and R20.
2.3. Microfluidic Reaction Chamber Assembly
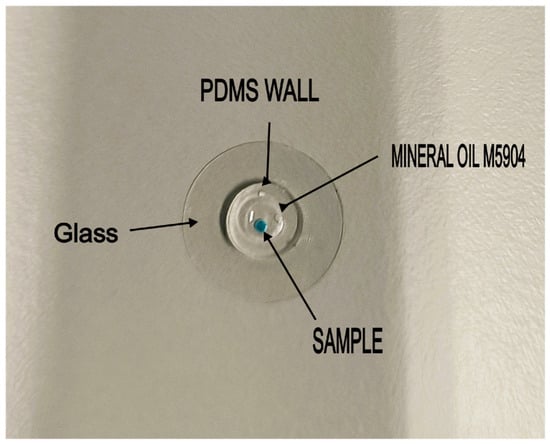
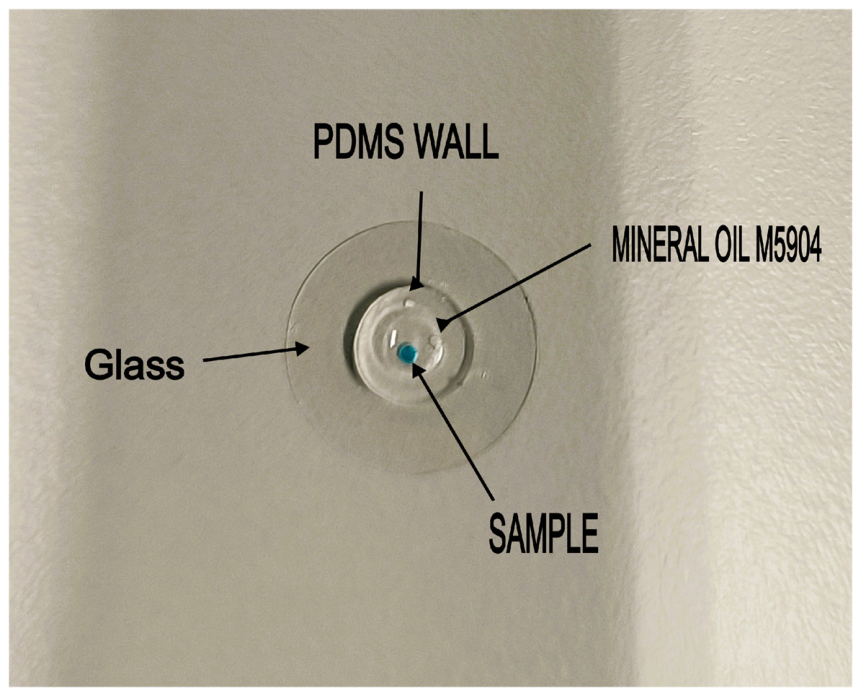
The disposable reaction chamber consists of a hybrid glass–polydimethylsiloxane (PDMS) sandwich architecture designed for low thermal mass and high optical transparency. Borosilicate glass substrates (D 263® M, Assistent, Sondheim vor der Rhön, Germany), 13 mm in diameter and 170 μm thick, were prepared by piranha cleaning, followed by thorough rinsing with deionized water and drying under a nitrogen stream. The upper PDMS housing was fabricated via soft lithography and replica molding. A silicon carrier wafer was first coated with a fluorocarbon polymer (CFx) anti-sticking layer in a deep reactive ion etching (DRIE) system. The wafer was leveled using a water balance prior to pouring a Sylgard® 184 two-part silicone kit (Dow Corning, Midland, MI, USA) prepared at a 10:1 pre-polymer to curing agent ratio. The elastomer was cast to a controlled thickness of 800 μm ± 50 μm, where surface tension was exploited to contain the liquid prepolymer within the wafer boundary without spilling. Following heat-induced polymerization, the cured PDMS membrane was peeled from the carrier wafer. Hollow cylindrical chamber walls were patterned by concentric cutting using 3 mm and 6 mm diameter punches. Lastly, oxygen plasma activation was employed to irreversibly bond the hollow PDMS cylinders onto the piranha-cleaned borosilicate glass substrates, completing the microfluidic reaction chamber assembly. The assembled microfluidic reaction chamber filled with mineral oil and sample (colored drop) is shown in Figure 6.
Figure 6.
Assembled microfluidic reaction chamber with mineral oil and sample.
3. Experimental Setup, Thermal Modeling, and Analytical Methods
3.1. Measurement Setup
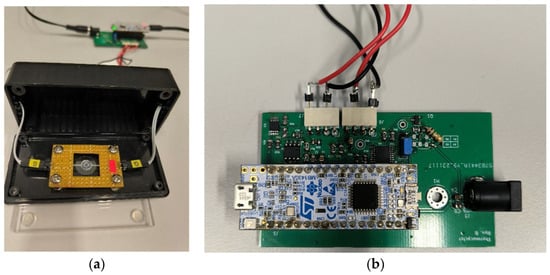
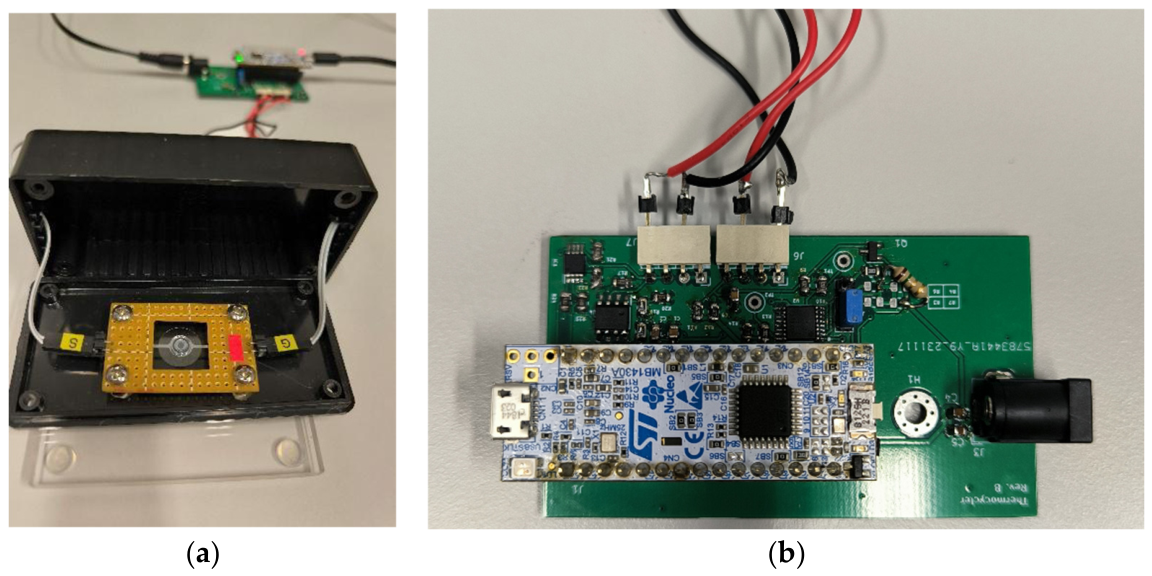
To execute automated PCR thermal cycling, the fabricated silicon microthermocycler PCB (Figure 2) and the PDMS-glass microfluidic reaction chamber (Figure 6) were set up on an experimental test bench (Figure 7a) along with the control electronics PCB (Figure 7b).
Figure 7.
(a) Experimental setup showing microheater platform and loaded PDMS-glass reaction chamber. (b) Control electronics featuring STM32G431.
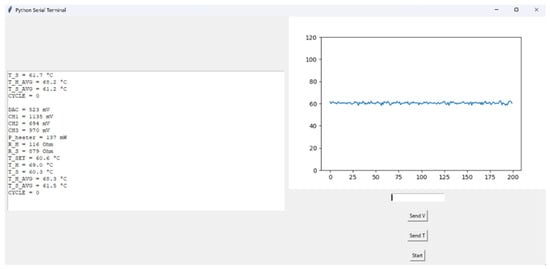
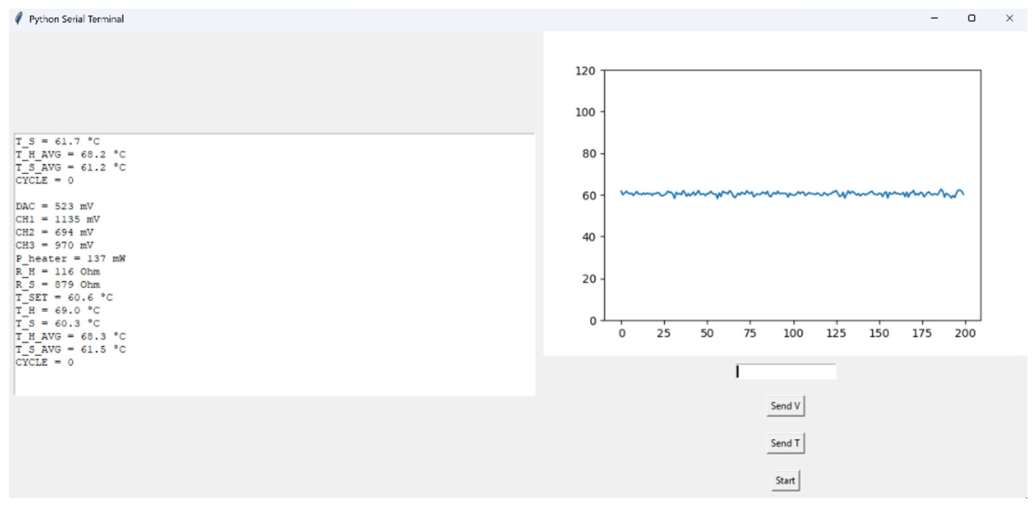
System automation and thermal trajectory logging were driven by a custom Graphical User Interface (GUI) written in Python (version 3.12.0) (Figure 8). The software communicated with the STM32G431KB microcontroller via a UART interface at a rate of 20 Hz (Δt = 50 ms). The Python GUI allowed the user to initiate the start of cycling, to set temperature and power delivered to the heater through voltage on the DAC and to record telemetry (RTD temperature, heater power, supply voltage) in real time.
Figure 8.
Simple GUI to initiate cycling and monitor settings written in Python.
Because the microthermocycler integrated optical detection is still under development, target yield was quantified by performing an off-chip secondary qPCR assay on harvested 500 nL reaction products diluted 200-fold, and comparing the results to the sample before initial amplification. Lower secondary Cq values directly correspond to higher initial amplicon yield generated during on-chip thermocycling.
3.2. System Thermodynamics
A lumped-parameter thermal model based on capacitance (H) and conductance (G) was formulated to evaluate the system’s transient thermal performance under energy conservation principles.
The total thermal behavior is governed by two primary coupled domains: the low-mass silicon microheater (HHEATER, GHEATER) and the fully loaded 500 nL PDMS-glass microchamber assembly (HCHAMBER, GCHAMBER). During a forced temperature step input from ambient temperature (T0 = 25 °C) to the denaturation setpoint (THEATER = 95 °C), the transient heating response of the PDMS-glass chamber follows the standard exponential trajectory:
where CHAMBER = HCHAMBER/GCHAMBER is the time constant of the PDMS-glass chamber. To qualitatively confirm vertical thermal transport through the 170 µm borosilicate glass floor independently of the embedded sensor, an aggressive forced step (115 °C) was applied starting from ambient conditions (25 °C). Rapid power dissipation drove the silicon heater to setpoint within 200 ms. Visual observation confirmed sample boiling inception at 8.5 ± 0.37 s (N = 5), verifying rapid conductive energy transfer through the glass substrate. This method was used to approximate the time needed for a 500 nL sample to reach 100 °C because other methods were not viable; this will be discussed in 4.2.
When the heater is turned off, the active heating mechanism is replaced by passive cooling. This passive cooling is performed simply by leaving the system in ambient air, relying entirely on natural convection and conductive heat dissipation through the silicon tethers without any active cooling components (such as fans or Peltier elements). The heater silicon substrate and PDMS-glass chamber stop acting as two separate subsystems and start acting as a single combined mass that passively releases its stored heat energy back to the ambient (TAMBIENT = 25 °C). Cooling response also follows the standard exponential decay trajectory
The microfabricated silicon tethers of the microthermocycler are designed to provide high thermal isolation, resulting in a low heater thermal conductance (GHEATER). In contrast, the multilayer PDMS-glass chamber containing the sample and mineral oil provides lower thermal isolation, resulting in a significantly higher thermal conductance (GCHAMBER ≫ GHEATER). Consequently, the mathematical balance is heavily dominated by PDMS-glass chamber properties.
3.3. Reducing Chamber Adsorption
To prevent non-specific adsorption of Taq DNA polymerase onto the PDMS-glass microchamber walls during thermal cycling, a dual passivation protocol was tested. High-purity, fatty acid-free BSA (Fraction V; ZellBio GmbH, Lonsee, Germany) served as the primary passivating agent. A 10X concentrated BSA stock solution was prepared in nuclease-free water and passed through a 0.22 µm membrane filter to remove particulate matter and microaggregates prior to application.
The hollow PDMS-glass microchamber was filled with the filtered BSA solution and incubated in the refrigerator for selected time intervals, allowing the protein to form a protective monolayer via hydrophobic and electrostatic adsorption onto the exposed silica and siloxane networks. Following incubation, the passivation solution was aspirated, and the chamber walls were thoroughly flushed with nuclease-free water to remove unbound excess protein. To complement coating, the 10X BSA stock was further incorporated directly into the biological master mix to prevent enzyme depletion over extended thermal cycling (0.5 µL and 1 µL of BSA addition to the 10 µL master mix were tested). In Section 4.5, passivation efficiency is evaluated. Results showed that the best method is to cover the PDMS-glass chamber with BSA for 24 h and then clean it. Results also indicated that avoiding direct BSA addition preserves master mix purity.
3.4. Biological Target Preparation and Off-Chip qPCR Yield Assay
Biological validation of the microthermocycler platform was performed using a cDNA target derived from Caco-2, a human intestinal epithelial cell culture. Total RNA extracted from Caco-2 cells was reverse-transcribed using AffinityScript QPCR cDNA Synthesis Kit (Agilent technologies, Santa Clara, CA, USA) to yield template cDNA. A specific oligonucleotide primer pair was adopted from published literature: F5′-AGGAATTCCCAGTAAGTGCG-3′; 18S-R 5′-GCCTCACTAAACCATCCAA-3′ [31], to amplify a 102-base-pair (bp) target segment within the 18S ribosomal RNA gene (Tm = 75.0 °C). The reaction master mix was formulated using Power SYBR™ Green PCR Master Mix (Thermo Fisher Scientific, Waltham, MA, USA, Cat. No. 4309155) supplemented with forward and reverse primers and template cDNA. To guarantee strict inter-experimental reagent consistency, the complete reaction mix was partitioned into 10 µL working aliquots and frozen at −20 °C. Prior to each thermocycling experiment, an individual aliquot was thawed on ice, gently mixed by manual flicking, settled via short centrifugation, and maintained strictly on ice prior to loading.
The reaction mixture was introduced into the BSA-passivated glass–PDMS microchamber and overlaid with a mineral oil (M5904, Sigma-Aldrich, St. Louis, MO, USA) layer to prevent vapor-phase evaporation during rapid thermal cycling. The custom silicon microthermocycler executed a 40-cycle amplification protocol, initiating with a hot-start polymerase activation and thermal denaturation step at 95 °C for 5 min. Each subsequent thermal cycle comprised a three-step basic profile: thermal denaturation at 95 °C for 40 s, primer annealing at 60 °C for 40 s, and enzymatic extension at 72 °C for 40 s; these hold times and temperatures were varied during the optimization steps.
Following completion of thermal cycling, the reaction product (500 nL) was harvested from the microchamber with a pipette, put into 9.5 µL nuclease-free water for 20x dilution, mixed with gentle manual flicking and frozen to preserve amplicon integrity. Off-chip quantitative verification and melt-curve analysis were subsequently conducted using a Roche LightCycler® 480 qPCR system. Secondary Cq values interpolated at a fixed baseline threshold (Rn = 3.0) were evaluated qualitatively as a binary indicator of primary reaction success. Because 40 primary thermal cycles on-chip may drive active amplification reactions to reagent scarcity (plateau phase), secondary Cq values are used strictly to confirm whether successful target amplification occurred (Cq ≈ 14–20) or failed (Cq > 25). If the reaction mix was used directly in a secondary amplification, the Cq value was about Cq = 29, so it was used as a measure of no primary amplification efficiency. Operational parameters (passivation times, temperature setpoints, hold times) were optimized by determining the most time-efficient protocol that consistently achieved positive amplification. Real-time verification was not possible since the system lacks integrated fluorescence detection.
4. Thermal Characterization and Surface Passivation
This section details the electro-thermal baseline, transient thermodynamics, and surface passivation protocol required to ensure robust, uninhibited amplification on the silicon microthermocycler platform.
4.1. Verification of Numerical Models
Initial thermal characterization was conducted on the unloaded four-tether structure to establish a baseline and verify the accuracy of the numerical models developed in previous studies [29]. A cooling time of approximately 4.5 s was determined for a temperature fall from 90 °C to 25 °C. This resulted in a recorded time of 0.9 s for the unloaded chip to reach approximately 60 °C, which yields an experimental time constant of 1.454 s. This time constant closely matches the simulated value of 1.46 s. This correlation confirms that the chip’s physical fabrication replicates the design parameters and thermal physics predicted by the COMSOL Multiphysics 5.2 models.
4.2. Thermal Validation
Microscale thermal validation represented a significant challenge due to the low sample volume and high surface-to-volume ratio, which cause rapid heat dissipation and render standard thermal sensors impractical. Direct contact temperature measurement methods were deemed nonviable because the thermometer’s thermal mass would significantly alter the temperature of the 500 nL volume and introduce parasitic heat paths. Therefore, contactless verification was performed using a high-resolution FLIR T1020 (Teledyne FLIR, Wilsonville, OR, USA) infrared camera. However, IR thermography primarily captures the surface temperature of the chamber assembly (including the PDMS encapsulation and mineral oil layer), which is further complicated by the differing emissivity coefficients of these materials. Consequently, IR measurements provided only qualitative orientation. The definitive correct sample temperature range and system performance were ultimately confirmed through biological validation by target DNA amplification.
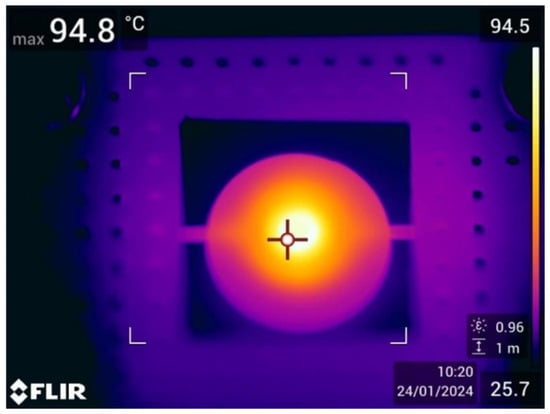
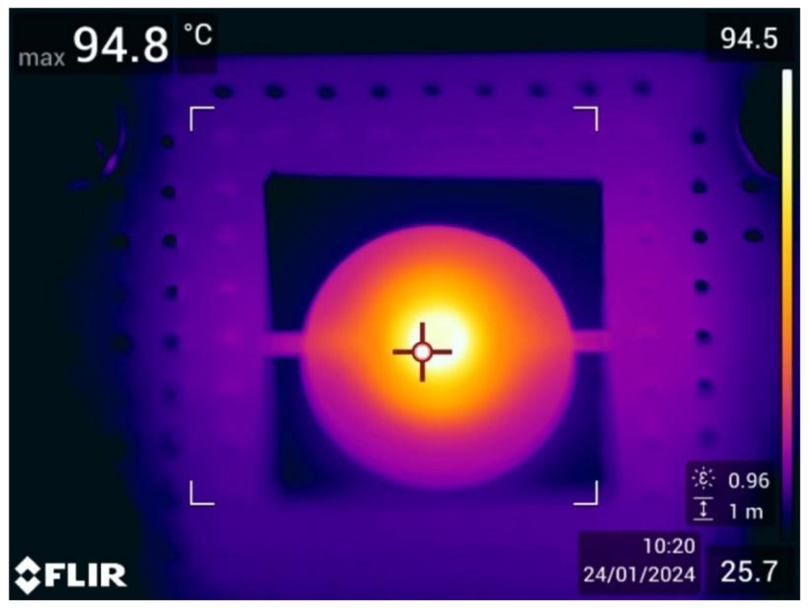
To confirm thermal localization and uniformity, IR thermography was performed using a FLIR camera. As shown in the thermal profiles (Figure 9). Heat is confined to the central zone, verifying that the four-tether design effectively limits parasitic conduction to the silicon frame.
Figure 9.
Thermal profile of the loaded heater. In the active central region where DNA amplification occurs, the average surface temperature is 93 °C with a standard deviation of ±1.7 °C.
Due to the vertical thermal gradient within the chamber, the actual sample temperature lies between the integrated sensor/heater temperature and the surface temperature recorded by the FLIR camera. Although the integrated sensor captures temperature changes instantaneously, a thermal lag exists between the sample and the chamber due to thermal resistance between the chamber and the integrated sensor heater, as well as the thermal capacitance of the chamber and sample. This metrological constraint highlights the importance of the 500 nL sample’s high surface-area-to-volume ratio and its proximity to the heater, which ensures rapid heating towards the target temperature despite the absence of direct internal sensing. Final success of biochemical amplification (discussed in 4.4) serves as functional validation that the sample consistently reaches the required enzymatic temperature window.
4.2.1. Thermal and Structural Stability
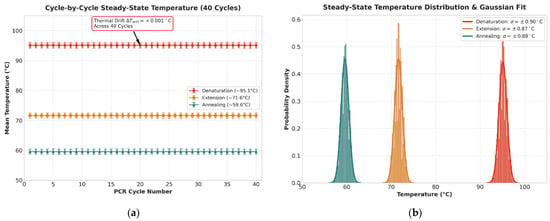
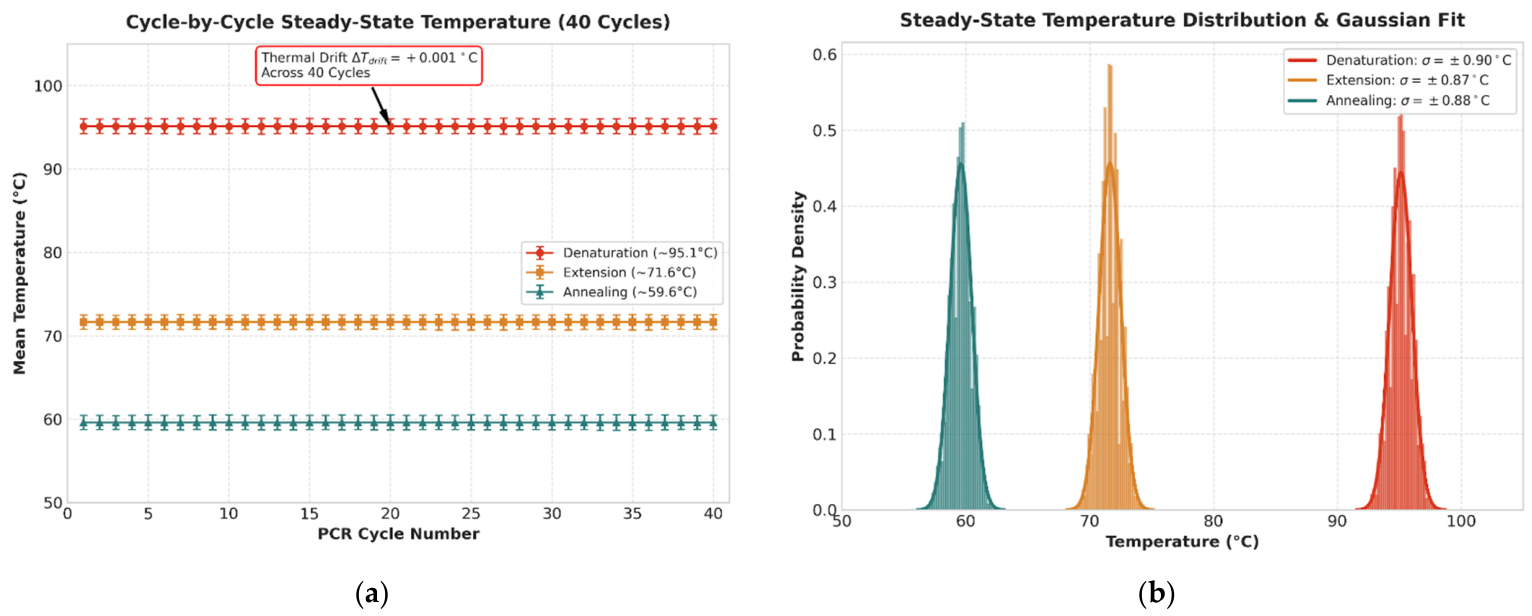
To quantitatively assess long-term thermal stability and exclude transient ramp artifacts, steady-state temperature data across 40 cycles were evaluated for the denaturation, extension, and annealing plateaus (Figure 10a,b). The platform demonstrated exceptional repeatability with negligible thermal drift across the entire run (ΔTdrift = +0.001 °C). During the steady-state hold periods, the RTD temperature maintained a mean of 95.13 °C with a standard deviation of σ = ±0.90 °C for denaturation, 71.63 °C (σ = ±0.87 °C) for extension, and 59.60 °C (σ = ±0.88 °C) for annealing. These quantitative metrics, supported by tight Gaussian distributions, confirm that the titanium-on-silicon microheaters maintain high thermal fidelity without structural fatigue or sensor drift under rapid cycling conditions. Throughout extended PCR cycling, the device exhibited no signs of mechanical fatigue, experimentally testing the structural strength predicted for the four-tether architecture in our prior research.
Figure 10.
(a) This figure presents time series of temperature stability across the 40 cycles, with the error bars representing the standard deviation of each cycle. (b) This figure presents the statistical probability density of the steady-state measurements, showing the fitted Gaussian curves.
4.2.2. Material Characterization
To establish a thermal model for the microthermocycler, the physical properties of each functional component were quantified. As summarized in Table 1, the system exhibits a significant disparity in thermal capacitance between the structural elements and the reaction volume.
Table 1.
Material Parameters of the Integrated Platform.
The glass disc represents the primary thermal load on the system, with a thermal capacitance nearly 20 times greater than that of the sample (45.1 mJ/K vs. 2.1 mJ/K). This confirms that the 500 nL sample temperature is effectively equal to the glass substrate temperature. The high surface-to-volume ratio of the sample ensures near-instantaneous equilibration with the glass substrate, while the thermal oil (415 K/W) provides sufficient thermal resistance to prevent evaporation.
4.3. Measured Time Constants of the System
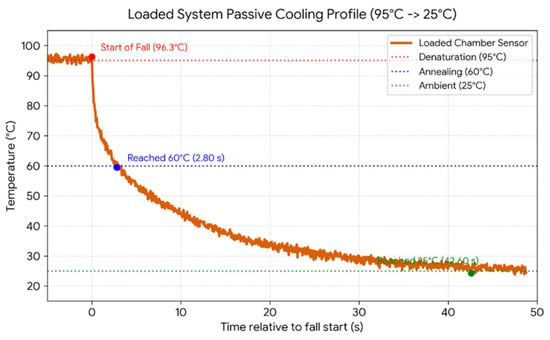
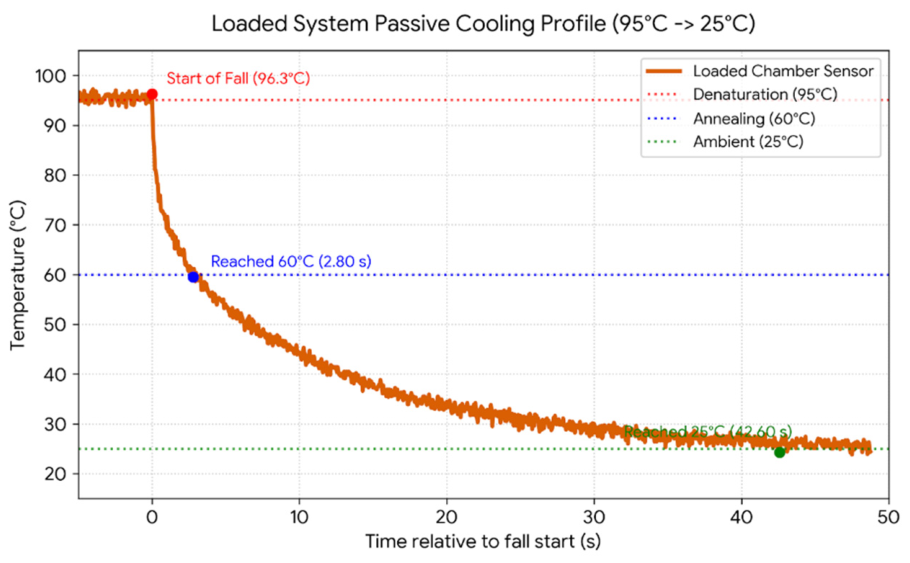
Characterization using the integrated titanium RTD confirmed an unloaded time constant of τunloaded = 1.46 s. When fully loaded with a PDMS-glass chamber filled with the 500 nL sample and a 5 µL mineral oil overlay, the measured passive cooling duration from 95 °C to 60 °C was 2.80 s (Figure 11).
Figure 11.
Loaded system passive cooling profile.
Substituting this into the exponential temperature decay Equation (2) yields τCOMBINED ≈ 4.04 s. Compared to the unloaded chip time constant of 1.46 s, the addition of a 500 nL sample, a PDMS-glass reaction chamber, and 5 µL of mineral oil for encapsulation resulted in approximately a 319% increase in the thermal time constant. This shows that even with a significant increase in thermal capacitance (H), the system maintains a cooling ramp rate of approximately 12.5 °C/s, which is well aligned with the demands of high-speed PCR.
As seen during the active heating and passive cooling phases of the loaded platform. Under a forced heating profile (25 °C to 115 °C), high active power densities allow the sensor to reach the target temperature almost instantaneously. Specifically, it achieves a heating ramp rate of 175 °C/s, reaching the target plateau in just 200 ms. However, the sample exhibits a vertical diffusion lag, taking 8.5 s to reach 100 °C due to internal contact resistance and the glass substrate’s low thermal diffusivity.
During passive cooling from 95 °C to 60 °C, the sensor substrate requires 2.80 s to reach the annealing threshold (τloaded = 4.039 s), relying entirely on passive tether conduction and air convection. This behavior reveals a key physical limitation of the system. Whereas the active heating phase is dictated by vertical conduction through the glass (creating a steep thermal gradient between sensor and sample), passive cooling is limited by system dissipation. Because the glass disc serves as the primary thermal reservoir (Cglass = 45.1 mJ/K), it increases the thermal time constant during substrate cooling.
During cooling, the substrate and the sample decay curve goes down in progressive equilibrium, minimizing internal thermal gradients during the critical primer hybridization window and functioning as a protective low-pass filter that shields the sensitive enzymatic reaction from high-frequency controller jitter.
These measured thermal transitions place the tethered titanium-on-silicon platform among the fastest stationary-chamber microthermocyclers currently reported, matching the 175 °C/s active heating rates demonstrated in state-of-the-art silicon micromachined systems [4]. For context, conventional benchtop thermocyclers are fundamentally limited to ramp rates between 2 and 5 °C/s due to the high thermal mass of metal blocks and tube interfaces, while typical miniaturized glass or PCB platforms plateau between 15 and 50 °C/s [2,20]. By structurally isolating the reaction zone on a suspended silicon microheater with exceptionally low thermal mass (Cheater ≈ 8 mJ/K), parasitic heat loss is minimized. While ultra-thin suspended silicon membranes or emerging photonic heating approaches can achieve passive cooling rates exceeding 50 °C/s, extreme geometric thinning severely compromises mechanical integrity [27]. The four-tether design provides a 460% increase in mechanical strength (reaching a 0.427 N fracture load) and a 57% decrease in thermal time constant, with a trade-off of 22% higher heat loss compared to a similar three-tether geometry [29]. Importantly, the achieved 12.5 °C/s cooling rate remains well beyond the kinetic threshold required to prevent non-specific primer annealing.
4.4. Thermocycler Thermal Coupling
In microfluidic qPCR platforms, the thermal transport behavior between the active heating elements and the sub-microliter chamber volumes directly governs enzymatic stability and primer hybridization specificity. Prior to the optimization of surface passivation (Section 4.5), a systematic temperature calibration was performed on Samples V52–V55. This was carried out to characterize the thermal coupling of the custom microthermocycler and to identify the precise temperatures required for amplification. Fine-tuning of this parameter is described in Section 5.1.
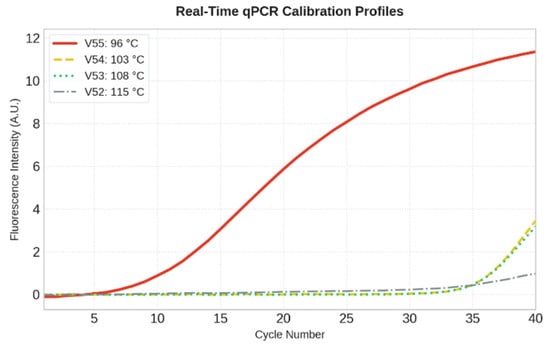
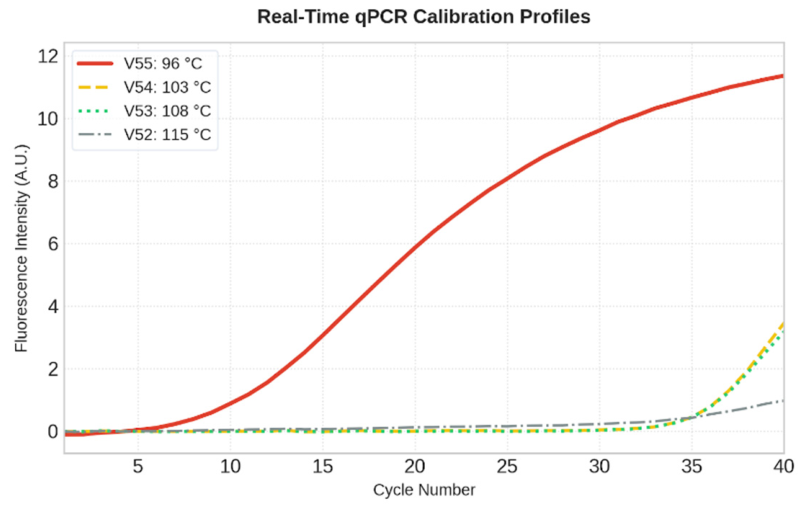
To evaluate the steady-state sample temperature during amplification, the samples were subjected to various denaturation set points. Specifically, denaturation temperatures of 115, 108, 103, and 96 °C were set on the heater as shown in Figure 12 for samples V52 (dash-dot), V53 (dotted), V54 (dashed), and V55 (solid). Figure 12 shows secondary qPCR results of fluorescence intensity versus number of amplification cycles, where the primary PCR product was taken as a template.
Figure 12.
Fluorescence intensity of samples V52, V53, V54, and V55 in the secondary qPCR, with V55 demonstrating the only successful amplification.
During testing, annealing was performed at 60 °C and elongation at 72 °C, with a duration of 40 s for all amplification phases. The results obtained demonstrate that only the amplification of sample V55 was successful (Cq ≈ 14), with the heater temperature set to 96 °C. At 96 °C on the heater, the sample temperature is limited to 96 °C. Due to the thermal time lag, the sample does not reach the setpoint instantly, which filters out noise through the PID regulator, and the sample temperature is around 94–96 °C. This is the optimal temperature window for denaturation, which preserves the integrity of the templates and primers, enabling efficient amplification.
Exceeding a heater set point of 103 °C resulted in rapid sample vaporization and thermal damage to key reaction components (template, primers, and Taq polymerase), resulting in amplification failure in samples V52, V53 and V54 (Cq > 35).
4.5. Surface Passivation with BSA
The efficiency of DNA amplification within sub-microliter PDMS–glass microchambers is governed by boundary-induced surface kinetics. High surface-area-to-volume ratios expose the reaction mixture to wall-induced interactions, where Taq DNA polymerase and reagents may spontaneously adsorb onto the hydrophobic PDMS and glass chamber boundaries [25,26].
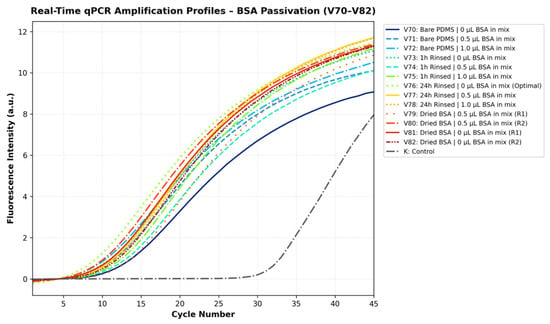
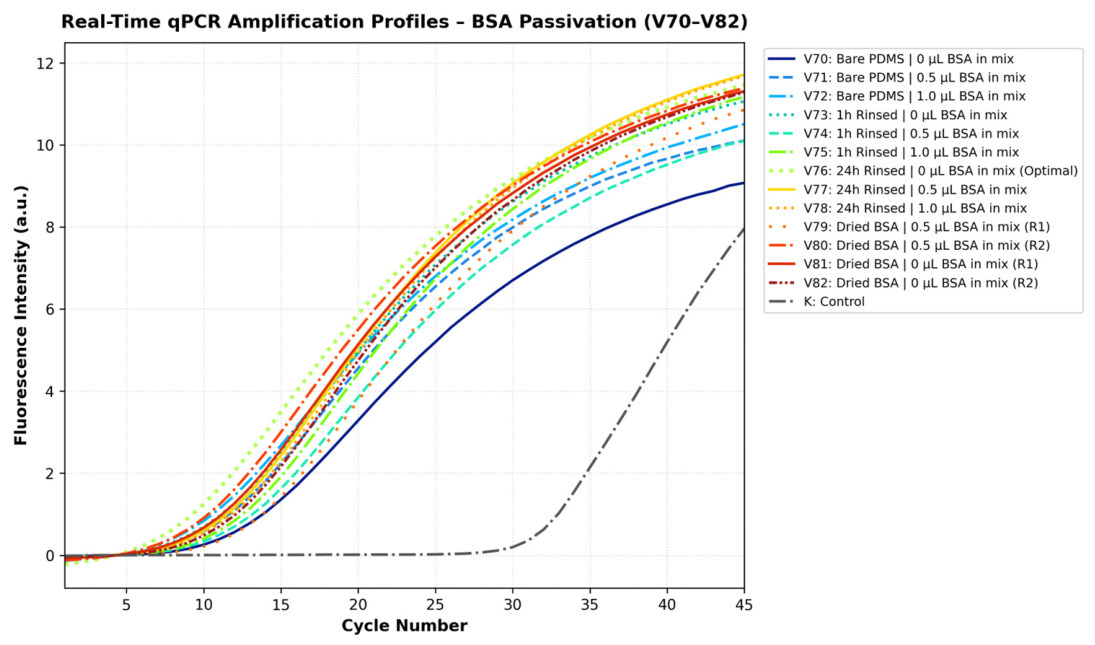
In the unpassivated control chamber (Sample V70, Figure 13), amplification was successfully achieved, but it exhibited a distinctly delayed quantification cycle (CQ) in comparison to all the other samples (Cq ≈ 20.0). In line with prior microfluidic passivation research, this kinetic delay directly suggests that a fraction of the Taq DNA polymerase was sequestered onto untreated chamber walls during early cycling, reducing the concentration of active enzyme available in the bulk solution [25,26].
Figure 13.
Secondary qPCR fluorescence curves of primary qPCR product samples V70–V82. The control indicates the state when the first qPCR amplification is omitted.
To mitigate surface adsorption, several BSA passivation protocols and master-mix configurations were systematically evaluated (Samples V71–V82; Figure 13). All tested BSA passivation strategies provided effective surface protection, consistently showing lower signal take-off cycles (Cq ≈ 14.0–16.0) relative to the unpassivated baseline.
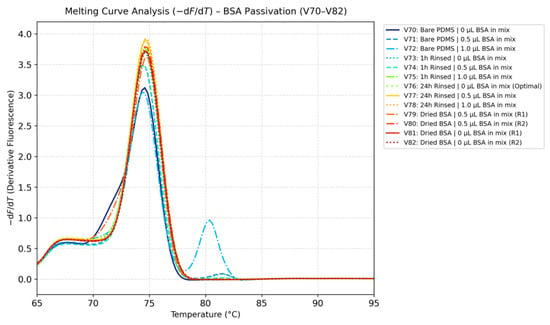
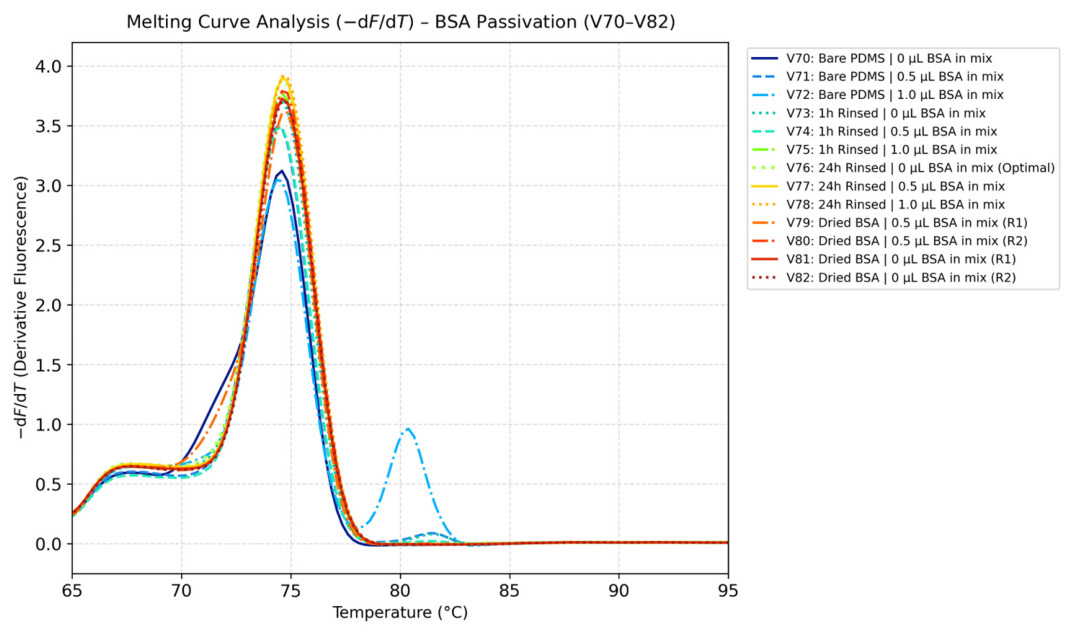
Direct addition of BSA as a dynamic supplement into the PCR master mix (Samples V71 and V72) influenced post-amplification product purity, as revealed by melt curve metrology (-dF/dT across 65 °C to 95 °C, Figure 14), but successfully prevented enzyme adsorption (Cq ≈ 16.0). Melt curve analysis showed that increasing the amount of BSA in the PCR master mix induced a distinct secondary melting peak at 80.37 °C alongside the target amplicon peak (74.59 °C). This bimodal distribution indicates that excess unadsorbed protein fractions remaining free in solution introduce impurities.
Figure 14.
Amplicon melting curve with different passivation methods.
Similarly, in unwashed chambers where BSA was dried directly inside the reaction chamber prior to loading (Samples V79–V82), amplification occurred (Cq ≈ 15.0 − 16.0), but heat-induced protein gelation was visually observed during thermal cycling. This gelation introduced localized physical heterogeneity, leading to run-to-run differences. The protein gelation phenomenon observed in the dry BSA group was strictly a heat-induced artifact occurring only in temperature calibrations when the chamber was unwashed. Proper washing completely eliminates gelation, posing no risk during standard microfluidic operations. Furthermore, our data demonstrated that after a 24-h incubation with a 10 × BSA solution, adding additional BSA directly into the reaction mix did not further improve reaction efficiency. This plateau strongly indicates that the 10× solution completely saturated the potentially adherent microchamber surfaces, requiring no further concentration gradient optimization for effective passivation.
Consequently, dynamic BSA supplementation and unwashed chamber drying were omitted and static surface pre-passivation with a wash step was employed. Implementing a 24-h static pre-incubation with a 10× BSA solution followed by a thorough water rinse (Sample V76) saturated the reactive binding sites on the PDMS and glass walls prior to sample introduction. In accordance with microfluidic literature [25], this pre-passivation strategy establishes a layer that reduces enzyme adsorption while preserving the pristine, additive-free composition of the master mix. As demonstrated by melt curve metrology, 24-h static BSA pre-passivation yielded a single melting peak centered cleanly at 74.59 °C without secondary melting peaks or gelation artifacts. While shorter 1-h static incubation protocols (Samples V73–V75) yielded good results, we opted for the 24-h protocol, where BSA solution has more time to form a protective layer on PDMS and glass. Based on these findings, the 24-h static BSA pre-passivation protocol was selected as the standard operating procedure for all subsequent microfluidic cycling experiments.
5. Thermal Cycling Protocol Optimization
Building upon the physical baseline and passivated microchamber architecture, this section presents the optimization of the thermal cycling profile, focusing on temperature setpoint calibration, annealing selectivity, and hold-time compression for ultra-fast PCR kinetics.
5.1. Denaturation Temperature Optimization
The vertical thermal gradient across the microchamber substrate poses a significant metrological challenge for sub-microliter temperature accuracy, as direct contact tracking within a 500 nL droplet introduces parasitic heat paths and alters the reaction zone’s low thermal mass. To fine-tune a steady-state temperature difference between the heater and the sample, the system was calibrated through biological amplification tracing. To establish this gradient empirically, a systematic test of programmed denaturation heater setpoints spanning from 79 °C to 105 °C (designated samples V83 through V93) was evaluated using the 24-h BSA passivation technique. The quantification cycles across this optimization spectrum are compiled in Table 2.
Table 2.
Qualitative Quantification Cycles (Cq) and Post-Amplification Melt Temperatures Across the Denaturation Setpoint Spectrum (Samples V93 and V94 were omitted due to trapped microbubbles).
Post-amplification specificity tests verified that all evaluated configurations produced an identical, sequence-specific amplicon, with a single-peak melting threshold centered at 74.61 °C in every successful reaction. This convergence suggests that primer hybridization specificity is preserved across a wide temperature range.
At lower programmed temperatures spanning 79 °C to 86 °C (Samples V83–V86), the thermal energy conducted through the silicon substrate and borosilicate glass disc is insufficient to fully separate DNA strands within the short transient hold times. This incomplete strand separation leads to delayed takeoff cycles (Cq ≈ 17.57 − 18.74), indicating compromised denaturation efficiency.
Once this initial energy barrier is crossed, the system enters a reliable operational window spanning from 88 °C to 99 °C (Samples V87–V91). Within this regime, DNA separation is consistently achieved because the heater operating range substantially exceeds the amplicon’s native melting temperature (Tm = 74.61 °C). This zone supports early and stable takeoff cycles (Cq ≈ 14.21 − 15.80), demonstrating stable performance across the entire range. A programmed heater setpoint of 95–96 °C (Sample V90) was selected for the standard protocol because it sits in the center of this functional operational window (88–99 °C). Operating at this midpoint provides a thermodynamic buffer: it supplies sufficient thermal energy to guarantee complete target DNA denaturation without risking the lower-bound kinetic lags observed below 88 °C, while remaining below the upper threshold to prevent heat-induced degradation of Taq DNA polymerase or boiling of the reaction mix.
Elevating the programmed temperature beyond 104 °C (Sample V95) triggers thermal degradation. Excessive heat induces partial thermal inactivation of Taq DNA polymerase and localized microboiling within the 500 nL droplet. This phase change compromises the mineral oil encapsulation barrier, resulting in severe reaction impairment and a delayed quantification cycle (Cq = 29.35).
To evaluate whether transient high-temperature exposure could accelerate heating across the vertical thermal gradient without causing steady-state damage, an active thermal-boosting strategy was tested (Samples V148–V150). In this approach, the thin-film heater was driven to a brief high ceiling of 115 °C before returning to a 95 °C steady-state hold. While all thermal-boosted samples achieved successful target amplification, imposing a 2.8 s pulse at 115 °C (Samples V148 and V149) caused a noticeable takeoff delay (Cq = 25.44 − 27.47) due to partial thermal degradation of active polymerase in early cycles. Restricting the 115 °C overshoot to a 2.0 s burst followed by a 3.0 s hold at 95 °C (Sample V150) also indicated that the reaction was not as successful (Cq = 23.68) compared to the standard 95–96 °C cycling protocol (Cq ≈ 14.21). Active thermal overshooting above 100 °C was omitted, and the denaturation parameter was set to the validated 96 °C setpoint (Sample V90), which provides a reliable baseline for closed-loop control. Calculating the microcontroller derivative term based on measurement change rather than error eliminates derivative spikes during steep heating ramps, while dynamic integrator clamping prevents saturation of the MAX4211 constant-power regulator.
5.2. Primer Annealing Temperature Optimization
Following the calibration of the denaturation threshold, the thermal boundaries governing primer-template hybridization kinetics were systematically tested. Selecting the optimal annealing temperature is required for recognition of specific complementary sequences by primers. To demonstrate the impact of thermal deviations outside the optimal annealing range, heater setpoints spanned from 45 °C to 72 °C (designated samples V97 through V103). Resulting quantification cycles and post-amplification melt temperatures are summarized in Table 3.
Table 3.
Quantification cycles Across Different Annealing Temperatures.
An efficient operational window is established between 45 °C and 60 °C (Samples V97–V99 and V103), where the platform achieves early, robust amplification (Cq ≈ 13.93 − 15.09). Within this functional range, the thermal settings support rapid hybridization kinetics and reliable target synthesis.
In the elevated temperature regime exceeding 62 °C (Samples V100 and V102), the thermal energy delivered to the sub-microliter chamber approaches the native melting temperature of the oligonucleotides (Tm, primer). This thermal stress reduces the probability of stable primer hybridization, creating a kinetic delay that shifts the quantification cycle (Cq = 18.26 for V100 and Cq = 23.57 for V102).
An annealing temperature of 60 °C (Sample V99) was selected for the standard microfluidic protocol (it falls in the 48–60 °C operational window). Choosing 60 °C provides maximum sequence stringency to suppress potential cross-hybridization while actively minimizing the thermal gap between the 95 °C denaturation plateau and the annealing stage. Reducing this temperature difference shortens overall cycle ramp times across a 40-cycle run without introducing the delayed response observed at temperatures above 62 °C. While melting curve analysis did not detect non-specific amplification at lower annealing temperatures (45–54 °C), trace amounts of non-specific products cannot be definitively ruled out with SYBR Green alone. We explored these lower temperatures primarily to demonstrate thermal boundaries and risk. However, our ultimate motivation was to raise the annealing temperature to 60 °C. This maximizes sequence stringency and minimizes the thermal gap to the 95 °C denaturation plateau, which critically shortens overall ramp times.
5.3. Optimization of Hold Times Durations
Following the empirical determination of the operational temperature thresholds, the phase duration hold times required for denaturation, primer annealing and elongation were gradually reduced (40, 20, 10, 5, 2.5 s) to explore the time limits required for successful multiplication. In standard PCR thermal cyclers, each temperature stage is maintained for 20 to 40 s to compensate for the substantial thermal mass of bulk metal blocks, plastic reaction tubes, and large sample volumes. As demonstrated by the thermal characterization results (Section 4), the low thermal mass of the PDMS-glass microchamber combined with the microheater enables rapid thermal transitions, thereby allowing for significantly shorter phase hold times.
To ensure consistent experimental conditions across independent tests, an identical reference baseline configuration consisting of 40 s for denaturation, 40 s for annealing, and 40 s for elongation was evaluated in all tests (designated samples V107, V123 and V143). This shared baseline configuration served as a control to account for possible minor variations in initial starting concentrations of template DNA in reaction mix aliquots and minor master mix chemical aging, which shifts the baseline amplification.
To accurately evaluate the platform response to hold-time compression, amplification performance was assessed across three independent series of experimental runs normalized to their respective controls (V107, V123, and V143), encompassing dedicated tests for denaturation (samples V107 through V111 at 95 °C), annealing (samples V123 through V127 at 60 °C), and elongation hold times (samples V143 through V147 at 72 °C).
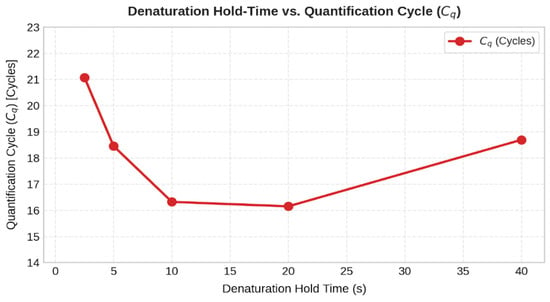
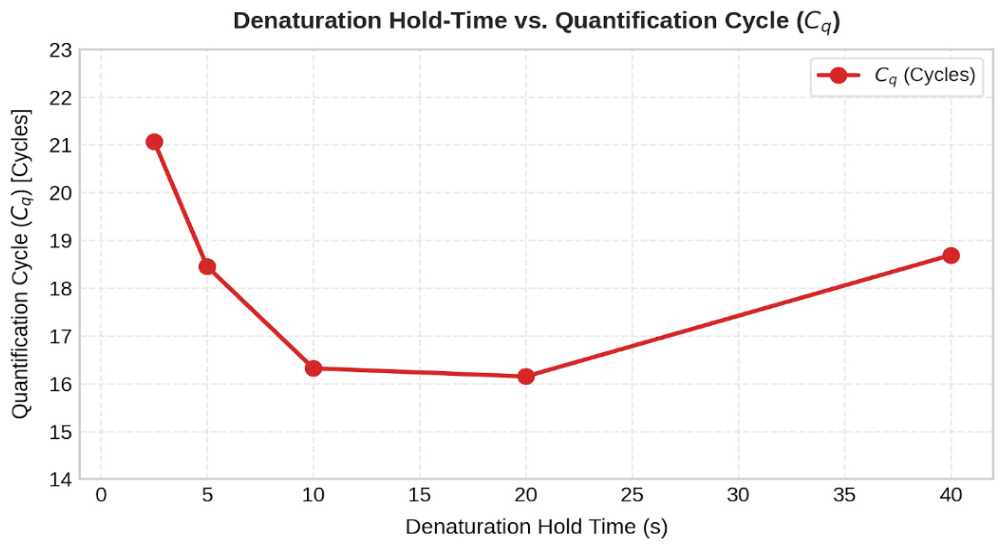
Denaturation hold times at 96 °C were systematically evaluated across 40 s, 20 s, 10 s, 5 s, and 2.5 s (Samples V107–V111). Across the 5-to-40 s range, the platform demonstrates consistent, highly reliable amplification, indicating that complete template strand separation is maintained. While 40 s (V107) and 20 s (V108) holds unnecessarily increase total run times without added benefit, compressing the hold time down to 2.5 s (V111) introduces a kinetic shift (Cq = 21.07) because the sample fails to reach the programmed setpoint before active cooling initiates. Although amplification at 2.5 s suggests high thermal transfer capability, its reduced efficiency (Cq = 21.07) makes it a less viable option. Although a 5 s and 10 s holds (V110 and V109) yield comparable amplification performance, a 10 s denaturation hold was selected for the final protocol. As shown in Figure 15, compressing the hold time down to 5 s results in a kinetic penalty (Cq = 18.4), indicating that the transient thermal lag across the glass substrate prevents the 500 nL sample core from fully reaching the denaturation threshold within such an ultra-short window. The 10 s duration thus provides a necessary thermodynamic safety margin.
Figure 15.
Quantification cycles (Cq) plotted against denaturation hold times (2.5, 5, 10, 20, 40 s).
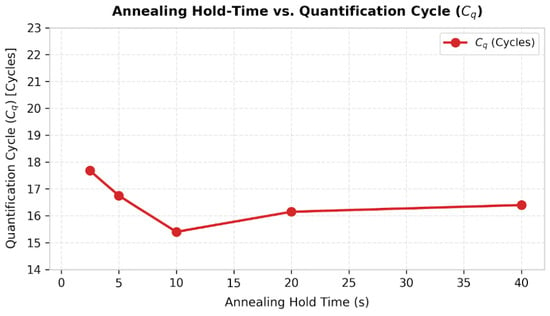
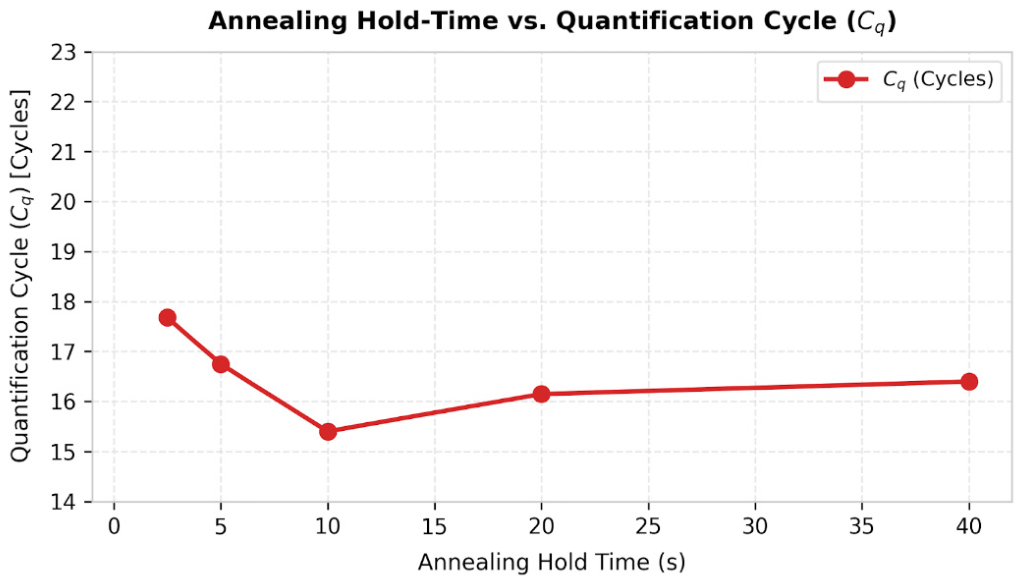
Primer-template hybridization kinetics (Figure 16) at 60 °C were independently evaluated across hold durations of 40 s, 20 s, 10 s, 5 s, and 2.5 s (Samples V123–V127). Across this entire series, the quantification cycles remain tight (Cq ≈ 15.39 − 17.68).
Figure 16.
Quantification cycles (Cq) plotted against annealing hold times (2.5, 5, 10, 20, 40 s).
While the empirical Cq values across annealing hold times from 2.5 to 40 s remain tightly clustered (Figure 16), selecting the optimal operating point requires reconciling biochemical kinetics with system thermodynamics. Given that the loaded system’s passive thermal decay from denaturation to the 60 °C annealing threshold requires approximately 2.80 s (Section 4.3), a 2.5 s hold provides virtually zero stabilization time at the target temperature. Therefore, a 5 s annealing hold (V126) was selected as the optimal compromise, ensuring full thermal settling and hybridization stringency without unnecessary temporal overhead.
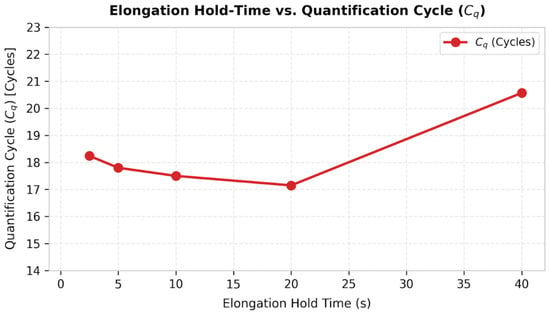
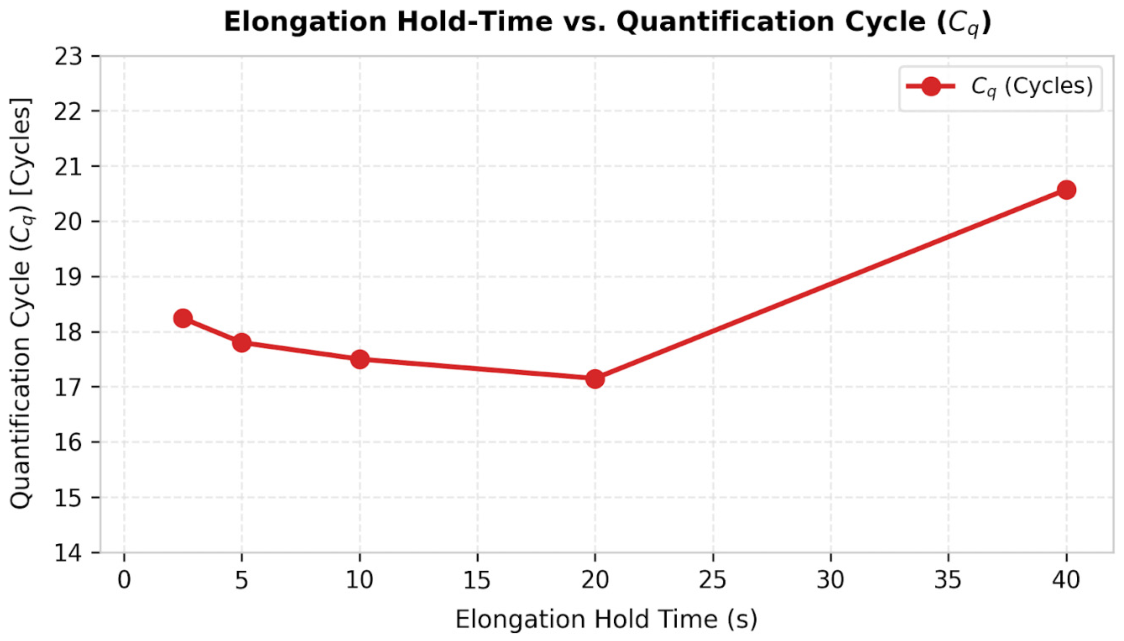
To determine the elongation boundary of Taq DNA polymerase extension along the 102 bp target amplicon, elongation hold times at 72 °C were systematically evaluated at 40 s, 20 s, 10 s, 5 s, and 2.5 s, while denaturation and elongation hold times were set to their optimal hold times (Samples V143–V147, Figure 17).
Figure 17.
Quantification cycles (Cq) plotted against elongation hold times (2.5, 5, 10, 20, 40 s).
Across these hold-time compression tests, the quantification cycle metrics remain clustered (Cq values ranging from 17.15 to0.57), confirming that effective target amplification is achieved across all evaluated durations. Maintaining an extended 40 s elongation hold (V143; Cq = 20.57) provides no analytical or biological benefit over shorter hold periods. Compressing the elongation phase down to a 2.5 s window (V147) yields efficient amplification with Cq = 18.24 and shortens the overall protocol time by 25 min.
Combining the optimized parameters (a 10 s denaturation hold, a 5 s annealing hold, and a 2.5 s elongation hold) reduces the overall runtime for a complete 40-cycle diagnostic assay to approximately 12 min. This represents an ~65% reduction in total process time compared to Roche LightCycler® 480.
6. Conclusions
This study successfully demonstrated a high-performance, sub-microliter microthermocycler (SMTC) platform optimized for rapid nucleic acid amplification. By combining a low thermal mass (Cheater ≈ 8 mJ/K) four-tether titanium-on-silicon microheater with an STM32 digital PID controller and an autonomous MAX4211 analog constant-power regulator, the platform achieved ultra-fast active heating ramp rates up to 175 °C/s, and a loaded passive cooling rate of 12.5 °C/s (τloaded = 4.04 s), effectively accelerating the overall thermal cycling process by up to ~65% compared to conventional benchtop thermocyclers (Roche LightCycler® 480). It should be emphasized that the specific thermal setpoints and compressed hold times established in this study are tailored to the tested 102 bp amplicon and primer pair. While each new target sequence and assay configuration will require dedicated protocol optimization, these empirical results serve as an indicative benchmark, demonstrating the platform’s capacity for substantial runtime reduction and enhanced operational efficiency compared to conventional systems. By systematically solving surface-induced enzyme adsorption and reducing the total diagnostic time to just 12 min, this platform demonstrates the viability of sub-microliter silicon systems for time-critical, field-deployable genetic analysis.
To prevent wall-induced enzyme adsorption, a 24-h static BSA pre-passivation protocol was established for 500 nL PDMS-glass chambers. This surface treatment neutralized Taq polymerase and template surface adsorption. After surface passivation, adding BSA to the reaction mix did not further improve amplification efficiency, suggesting that inhibitory effects were already optimally prevented. Phase compression experiments demonstrated the possibility of substantially reducing the time needed for qPCR amplification. Successful amplification of a 102 bp DNA target even with compressed thermal hold times (10 s denaturation, 5 s annealing and 2.5 s elongation), confirmed that rapid amplification is possible with our thermocycler design. It must be emphasized that this 12-min performance is demonstrated for this specific 102 bp short fragment; longer target sequences may require extended elongation hold times, leading to increase in the total run time. However, our data show that the elongation phase can be compressed the most (down to 2.5 s), suggesting that polymerase speed is not the primary bottleneck dictating total amplification time, and moderately longer amplicons could likely perform within comparable overall amplification time.
While current readout verification relies on secondary off-chip analysis, this work bridges the critical gap between microfluidic thermodynamics and bio-interface stability. Future developments will focus on integrating a photodiode optical detection beneath the central 2 mm silicon aperture, featuring a custom-made PCB for LED excitation and photodiode signal sampling that will be used together with a lock-in amplifier implemented on an FPGA to extract useful signal and connected to a raspberry PI for data visualization. This subsequent work will need to address key engineering bottlenecks in optical integration, primarily the suppression of microcavity spontaneous fluorescence and high-frequency noise filtering. The SYBR Green signal was used in this proof-of-concept to obtain a robust baseline supporting the development of fluorescence detection. In future iterations, we aim to implement TaqMan chemistry, where the addition of a specific probe will definitively enable specific detection and rule out the signal from any trace non-specific products.
Once this real-time optical detection capability is integrated, subsequent studies will systematically evaluate amplification performance across a wider variety of target sequences and fragment lengths to fully establish the generalizability of the platform for diverse diagnostic assays.
The key contributions of this work are
- Hardware & Feedback Optimization: Integration of a custom 4-tether titanium-on-silicon microthermocycler (SMTC) featuring low thermal mass (Cheater ≈ 8 mJ/K) [29] with an STM32-based discrete-time PID controller and a dedicated MAX4211 constant-power regulator to maintain stable loop response and eliminate dynamic thermal drift during rapid transitions.
- Surface passivated PDMS-glass chamber: Implementation of a 24-h static BSA pre-passivation protocol for innovative 500 nL PDMS-glass reaction microchambers, suppressing enzyme sequestration at high SA:V interfaces without altering master mix stoichiometry.
- Ultra-fast PCR Kinetics: Experimental validation of sub-10 s hold times (10 s denaturation, 5 s annealing and 2.5 s elongation) for amplification of a 102 bp target amplicon using fixed-threshold (ΔRn = 3.0) linear interpolation analysis.
Author Contributions
Conceptualization, A.Z., B.P., S.C., D.V. and M.M.; methodology, A.Z., B.P., S.C., D.V. and M.M.; software, A.Z.; validation, S.C.; formal analysis, A.Z. and S.C.; investigation, S.C.; resources, S.C. and D.V.; data curation, A.Z. and S.C.; writing—original draft preparation, A.Z.; writing—review and editing, A.Z., B.P., S.C., D.V. and M.M.; visualization, A.Z. and S.C.; supervision, M.M.; project administration, D.V. and M.M.; funding acquisition, D.V. and M.M. All authors have read and agreed to the published version of the manuscript.
Funding
This work was supported by the Slovenian Research and Innovation Agency ARIS (Grant No. J2-50073 and P2-0244). The doctoral studies of the author A.Z. were funded through ARIS (Contract No. 1000-23-0510).
Institutional Review Board Statement
Not applicable.
Informed Consent Statement
Not applicable.
Data Availability Statement
The original contributions presented in this study are included in the article. Further inquiries can be directed to the corresponding author.
Acknowledgments
The authors would like to thank the Slovenian Research and Innovation Agency and the Ministry of Education, Science and Youth for their support of this work. The authors would also like to thank the National Institute of Chemistry (KI) for providing access to their Roche LightCycler® 480 qPCR system and for providing biological materials. During the preparation of this manuscript, the author(s) used Google Gemini Flash 3.7 for the purposes of drafting assistance and grammar review. The authors have reviewed and edited the output and take full responsibility for the content of this publication.
Conflicts of Interest
The authors declare no conflicts of interest.
Abbreviations
The following abbreviations are used in this manuscript:
| BioMEMS | Biomedical Micro-Electro-Mechanical Systems |
| BSA | Bovine Serum Albumin |
| CQ | Quantification Cycle |
| DAC | Digital-to-Analog Converter |
| DRIE | Deep Reactive Ion Etching |
| FPGA | Field-Programmable Gate Array |
| MEMS | Micro-Electro-Mechanical Systems |
| SMTC | Silicon Microthermocycler |
| PDMS | Polydimethylsiloxane |
| PECVD | Plasma-Enhanced Chemical Vapor Deposition |
| PID | Proportional-Integral-Derivative |
| POC | Point-of-Care |
| qPCR | Quantitative Polymerase Chain Reaction |
| RTD | Resistive Temperature Detector |
| TCR | Temperature Coefficient of Resistance |
| VRC | Virtual Reaction Chamber |
References
- Nouwairi, R.L.; Cunha, L.L.; Turiello, R.; Scott, O.; Hickey, J.; Thomson, S.; Knowles, S.; Chapman, J.D.; Landers, J.P. Ultra-rapid real-time microfluidic RT-PCR instrument for nucleic acid analysis. Lab Chip 2022, 22, 3424–3435. [Google Scholar] [CrossRef] [Scilit] [PubMed]
- Yeom, D.; Kim, J.; Kim, S.; Ahn, S.; Choi, J.; Kim, Y.; Koo, C. A Thermocycler Using a Chip Resistor Heater and a Glass Microchip for a Portable and Rapid Microchip-Based PCR Device. Micromachines 2022, 13, 339. [Google Scholar] [CrossRef] [Scilit] [PubMed]
- An, Y.-Q.; Huang, S.-L.; Xi, B.-C.; Gong, X.-L.; Ji, J.-H.; Hu, Y.; Ding, Y.-J.; Zhang, D.-X.; Ge, S.-X.; Zhang, J.; et al. Ultrafast Microfluidic PCR Thermocycler for Nucleic Acid Amplification. Micromachines 2023, 14, 658. [Google Scholar] [CrossRef] [Scilit] [PubMed]
- Neuzil, P.; Zhang, C.; Pipper, J.; Oh, S.; Zhuo, L. Ultra fast miniaturized real-time PCR: 40 cycles in less than six minutes. Nucleic Acids Res. 2006, 34, e77. [Google Scholar] [CrossRef] [Scilit] [PubMed]
- Zhang, B.; Li, X.; Huang, M.; Jiang, M.; Du, L.; Yin, P.; Fang, X.; Jiang, X.; Qi, F.; Lin, Y.; et al. A Portable Dual-Mode Microfluidic Device Integrating RT-qPCR and RT-LAMP for Rapid Nucleic Acid Detection in Point-of-Care Testing. Biosensors 2026, 16, 51. [Google Scholar] [CrossRef] [Scilit] [PubMed]
- Ji, J.; Hu, C.; Pang, X.; Liang, J.; Huang, Q.; Hu, S.; Mei, Q.; Ma, H. Open Thermal Control System for Stable Polymerase Chain Reaction on a Digital Microfluidic Chip. ACS Omega 2024, 9, 10937–10944. [Google Scholar] [CrossRef] [Scilit] [PubMed]
- Smits, B.M.; Cuppen, E. Rats go genomic. Genome Biol. 2006, 7, 306. [Google Scholar] [CrossRef] [Scilit] [PubMed]
- Shrestha, K.; Farhana, F.Z.; Koo, K.M.; Darwish, N.; Ross, A.G.; Shiddiky, M.J.A. Challenges in the Development and Implementation of Point-of-Care Handheld qPCR Devices. Small 2026, 22, e06233. [Google Scholar] [CrossRef] [Scilit] [PubMed]
- Ahmad, F.; Hashsham, S.A. Miniaturized nucleic acid amplification systems for rapid and point-of-care diagnostics: A review. Anal. Chim. Acta 2012, 733, 1–15. [Google Scholar] [CrossRef] [Scilit] [PubMed]
- Lee, D.-S.; Park, S.H.; Yang, H.; Chung, K.-H.; Yoon, T.H.; Kim, S.-J.; Kim, K.; Kim, Y.T. Bulk-micromachined submicroliter-volume PCR chip with very rapid thermal response and low power consumption. Lab Chip 2004, 4, 401–407. [Google Scholar] [CrossRef] [Scilit] [PubMed]
- Chen, S.; Sun, Y.; Fan, F.; Chen, S.; Zhang, Y.; Zhang, Y.; Meng, X.; Lin, J.-M. Present status of microfluidic PCR chip in nucleic acid detection and future perspective. TrAC Trends Anal. Chem. 2022, 157, 116737. [Google Scholar] [CrossRef] [Scilit]
- Kulkarni, M.B.; Goel, S. Miniaturized DNA amplification platform with soft-lithographically fabricated continuous-flow PCR microfluidic device on a portable temperature controller. Microfluid. Nanofluidics 2021, 25, 69. [Google Scholar] [CrossRef] [Scilit]
- Salman, A.; Carney, H.; Bateson, S.; Ali, Z. Shunting microfluidic PCR device for rapid bacterial detection. Talanta 2020, 207, 120303. [Google Scholar] [CrossRef] [Scilit] [PubMed]
- Lee, N.Y. A review on microscale polymerase chain reaction based methods in molecular diagnosis, and future prospects for the fabrication of fully integrated portable biomedical devices. Microchim. Acta 2018, 185, 285. [Google Scholar] [CrossRef] [Scilit] [PubMed]
- Yang, Z.; Zhang, J.; Tong, X.; Li, W.; Liang, L.; Liu, B.; Chen, C. Simulation of Rapid Thermal Cycle for Ultra-Fast PCR. Sensors 2022, 22, 9990. [Google Scholar] [CrossRef] [Scilit] [PubMed]
- Zhang, J.; Yang, Z.; Liu, L.; Zhang, T.; Hu, L.; Hu, C.; Chen, H.; Ding, R.; Liu, B.; Chen, C. Ultrafast Nucleic Acid Detection Equipment with Silicon-Based Microfluidic Chip. Biosensors 2023, 13, 234. [Google Scholar] [CrossRef] [Scilit] [PubMed]
- Nagai, H.; Murakami, Y.; Yokoyama, K.; Tamiya, E. High-throughput PCR in silicon based microchamber array. Biosens. Bioelectron. 2001, 16, 1015–1019. [Google Scholar] [CrossRef] [Scilit] [PubMed]
- Wilding, P.; Shoffner, M.A.; Kricka, L.J. PCR in a silicon microstructure. Clin. Chem. 1994, 40, 1815–1818. [Google Scholar] [CrossRef] [Scilit]
- Yoon, D.S.; Lee, Y.-S.; Lee, Y.; Cho, H.J.; Sung, S.W.; Oh, K.W.; Cha, J.; Lim, G. Precise temperature control and rapid thermal cycling in a micromachined DNA polymerase chain reaction chip. J. Micromech. Microeng. 2002, 12, 813–823. [Google Scholar] [CrossRef] [Scilit]
- Shen, K.; Chen, X.; Guo, M.; Cheng, J. A microchip-based PCR device using flexible printed circuit technology. Sens. Actuators B Chem. 2005, 105, 251–258. [Google Scholar] [CrossRef] [Scilit]
- Kim, M.; Yun, S.-H.; Kim, S.-H.; Kim, J.-D. A Compact Real-Time PCR System for Point-of-Care Detection Using a PCB-Based Disposable Chip and Open-Platform CMOS Camera. Sensors 2025, 25, 3159. [Google Scholar] [CrossRef] [Scilit] [PubMed]
- Mendoza-Gallegos, R.A.; Rios, A.; Garcia-Cordero, J.L. An Affordable and Portable Thermocycler for Real-Time PCR Made of 3D-Printed Parts and Off-the-Shelf Electronics. Anal. Chem. 2018, 90, 5563–5568. [Google Scholar] [CrossRef] [Scilit] [PubMed]
- Sarbaland, F.b.N.; Kobayashi, M.; Tanaka, D.; Fujita, R.; Tanaka, N.; Furuya, M. Temperature Control in Microfluidic Devices: Approaches, Challenges, and Future Directions. Appl. Sci. 2025, 15, 9902. [Google Scholar] [CrossRef] [Scilit]
- Neuzil, P.; Pipper, J.; Hsieh, T.M. Disposable real-time microPCR device: Lab-on-a-chip at a low cost. Mol. Biosyst. 2006, 2, 292–298. [Google Scholar] [CrossRef] [Scilit] [PubMed]
- Chen, J.J.; Qiu, X.C. The effect of the surface passivation on polymerase chain reaction inside a continuous flow microfluidic chip. Microsyst. Technol. 2024, 31, 25–43. [Google Scholar] [CrossRef] [Scilit]
- Crabtree, H.J.; Lauzon, J.; Morrissey, Y.C.; Taylor, B.J.; Liang, T.; Johnstone, R.W.; Stickel, A.J.; Manage, D.P.; Atrazhev, A.; Backhouse, C.J.; et al. Inhibition of on-chip PCR using PDMS–glass hybrid microfluidic chips. Microfluid. Nanofluidics 2012, 13, 383–398. [Google Scholar] [CrossRef] [Scilit]
- Jalili, A.; Bagheri, M.; Shamloo, A.; Ashkezari, A.H.K. A plasmonic gold nanofilm-based microfluidic chip for rapid and inexpensive droplet-based photonic PCR. Sci. Rep. 2021, 11, 23338. [Google Scholar] [CrossRef] [Scilit] [PubMed]
- Hosokawa, K.; Ohmori, H. Digital PCR using a simple PDMS microfluidic chip and standard laboratory equipment. Anal. Sci. 2023, 39, 2067–2074. [Google Scholar] [CrossRef] [Scilit] [PubMed]
- Pečar, B.; Zadravec, A.; Vrtačnik, D.; Možek, M. Silicon Microthermocycler for Point-of-Care Analytical Systems: Modeling, Design, and Fabrication. Micromachines 2024, 15, 1325. [Google Scholar] [CrossRef] [Scilit] [PubMed]
- Singh, S.; Jejusaria, A.; Singh, J.; Vashishath, M.; Kumar, D. Comparative study of titanium, platinum, and titanium nitride thin films for micro-elecrto mechanical systems (MEMS) based micro-heaters. AIP Adv. 2022, 12, 095202. [Google Scholar] [CrossRef] [Scilit]
- Baranova, A.; Hammarsund, M.; Ivanov, D.; Skoblov, M.; Sangfelt, O.; Corcoran, M.; Borodina, T.; Makeeva, N.; Pestova, A.; Tyazhelova, T.; et al. Distinct organization of the candidate tumor suppressor gene RFP2 in human and mouse: Multiple mRNA isoforms in both species- and human-specific antisense transcript RFP2OS. Gene 2003, 321, 103–112. [Google Scholar] [CrossRef] [Scilit] [PubMed]

Disclaimer/Publisher’s Note: The statements, opinions and data contained in all publications are solely those of the individual author(s) and contributor(s) and not of MDPI and/or the editor(s). MDPI and/or the editor(s) disclaim responsibility for any injury to people or property resulting from any ideas, methods, instructions or products referred to in the content. |
© 2026 by the authors. Licensee MDPI, Basel, Switzerland. This article is an open access article distributed under the terms and conditions of the Creative Commons Attribution (CC BY) license.