


Abstract
To improve the response of LaFeO3 to low concentrations of n-butanol, LaFeO3 co-modified with 3 wt% Au and 5 wt% Pd was prepared by a citrate-assisted sol–gel method. At 180 °C, the resulting sensor exhibited a response of 16.92 to 1 ppm n-butanol, corresponding to 5.90 times the maximum response of pristine LaFeO3. The optimal operating temperature decreased from 200 to 180 °C, and a distinguishable response was observed at the lowest tested concentration of 0.1 ppm. However, selectivity tests revealed a substantial cross-response to formaldehyde (HCHO), motivating further analysis of binary n-butanol/HCHO mixtures. Responses to these mixtures were measured at 160, 180, and 200 °C. The ratio of the response increments at 160 and 180 °C reduced the influence of total concentration while retaining composition-related information. A support vector regression model with a radial basis function kernel was trained using the dataset obtained at a total concentration of 1.0 ppm. Without refitting, the model predicted n-butanol fractions for five predefined mixture compositions at total concentrations of 0.5 and 2.0 ppm. The mean absolute errors were 0.075 and 0.033, with R2 values of 0.921 and 0.981, respectively. These results demonstrate the potential of combining Au-Pd modification with temperature-response normalization for low-concentration n-butanol sensing and binary-mixture composition analysis using a single LaFeO3 sensor.
1. Introduction
N-butanol is widely used as an organic solvent in coatings, resins, and acid-cured paints and is also an important feedstock for the production of plasticizers and various fine chemicals. Owing to its high volatility, n-butanol vapor is readily released into occupational environments during production, coating, and film-curing processes. Exposure can irritate the eyes and respiratory tract and may even cause headache, dizziness, and central nervous system depression [1]. A field investigation involving 557 workplace air samples collected from 27 wood-product and furniture enterprises detected n-butanol in nearly 90% of the samples, with concentrations ranging from 0.02 to 32.6 ppm [2]. Recent studies on coating emissions have further confirmed that n-butanol can be released from waterborne coatings and is widely present in automobile- and ship-coating environments at concentrations ranging from sub-ppm to tens-of-ppm levels [3,4,5]. These findings indicate that n-butanol exposure arises not only from accidental high-concentration releases but also from its continuous low-level emission during routine production. Therefore, developing sensing materials capable of responding effectively to n-butanol in the sub-ppm to low-ppm range is of substantial practical importance for real-time tracking of concentration fluctuations, early warning, and exposure-risk control.
At present, n-butanol is mainly analyzed using gas chromatography, gas chromatography–mass spectrometry, and photoionization detection [6,7,8]. Although these instrumental methods offer high analytical accuracy, their equipment costs and operational requirements limit their implementation for low-cost, distributed, and continuous on-site monitoring. In contrast, chemiresistive metal oxide semiconductor gas sensors offer several advantages, including simple structures, low cost, ease of integration, and suitability for continuous monitoring [9,10,11]. Among metal oxides, ABO3-type perovskites possess stable crystal frameworks, flexible A/B-site compositions, and tunable oxygen nonstoichiometry. These characteristics allow carrier transport, surface defects, and redox activity to be regulated while retaining the structural stability of the host lattice, providing considerable flexibility for optimizing gas-sensing performance [12,13,14]. LaFeO3 is a typical p-type perovskite semiconductor with a stable FeO6 octahedral framework, favorable thermochemical stability, and active surface oxygen exchange. Changes in its hole concentration induced by surface reactions can be directly converted into measurable resistance signals [15]. However, pristine LaFeO3 provides a relatively limited accessible surface area and number of surface active sites, and its response toward low concentrations of n-butanol requires further improvement.
Noble-metal surface modification can effectively enhance the gas-sensing performance of ABO3-type perovskites [16,17,18,19,20]. Noble-metal nanostructures can promote gas adsorption and surface reactions through catalytic activation, surface spillover, and interfacial charge regulation while amplifying the resistance modulation induced by surface reactions. Au nanostructures can enhance the surface adsorption of alcohol molecules and regulate interfacial charge exchange [17,20,21,22], whereas Pd/PdOX species can promote the adsorption and activation of oxygen and alcohol molecules and improve reaction efficiency through surface spillover [18,19,23,24]. Single-noble-metal modification generally emphasizes either catalytic activation or interfacial electrical modulation, whereas Au–Pd co-modification can combine the interfacial regulation of Au with the catalytic activation of Pd, thereby strengthening both the surface reaction and electrical transduction processes [25,26].
N-butanol often coexists with formaldehyde (HCHO) and other volatile organic compounds (VOCs) in coating and furniture-manufacturing environments [2,27,28]. Because both n-butanol and HCHO can change the resistance of LaFeO3 through reactions with surface-adsorbed oxygen, the response magnitude obtained at a single operating temperature cannot distinguish the respective contributions of the two components. Different gases exhibit distinct temperature dependences in their adsorption, activation, and surface-reaction processes. Therefore, combining multi-temperature responses with machine learning provides a feasible route for analyzing mixed-gas compositions using a single sensing material [29,30,31,32,33,34,35].
Based on this rationale, 3 wt% Au and 5 wt% Pd were simultaneously introduced into LaFeO3 following single-metal loading optimization (Figure S1) to prepare Au-Pd/LaFeO3. The material exhibited a response of 16.92 toward 1 ppm n-butanol at 180 °C, approximately 5.90 times the maximum response of LaFeO3, while reducing the optimal operating temperature from 200 °C to 180 °C. It also produced a distinguishable response at the lowest tested concentration of 0.1 ppm. BET and XPS results indicate that Au-Pd/LaFeO3 possesses a larger accessible gas–solid interfacial area and higher proportions of defect-related and adsorbed-oxygen-related surface components, which may provide favorable conditions for the adsorption and surface reactions of oxygen and n-butanol. To address the cross-response induced by HCHO, the responses of Au-Pd/LaFeO3 to binary n-butanol/HCHO mixtures were further recorded at 160 °C, 180 °C, and 200 °C. A temperature-normalized feature F160/180 was constructed using the excess response at 180 °C as the reference. The RBF-SVR model established using the 1.0 ppm dataset quantitatively resolved the n-butanol component at total concentrations of 0.5 and 2.0 ppm, yielding MAE values of 0.075 and 0.033, respectively. By enhancing the gas response through Au-Pd surface regulation and resolving cross-response signals through the temperature dimension, this integrated strategy enables a single LaFeO3 material to perform both low-concentration n-butanol detection and binary-mixture composition analysis, providing a new route to reduce the dependence of VOC sensing systems on multi-material arrays.
2. Experimental
2.1. Material Synthesis
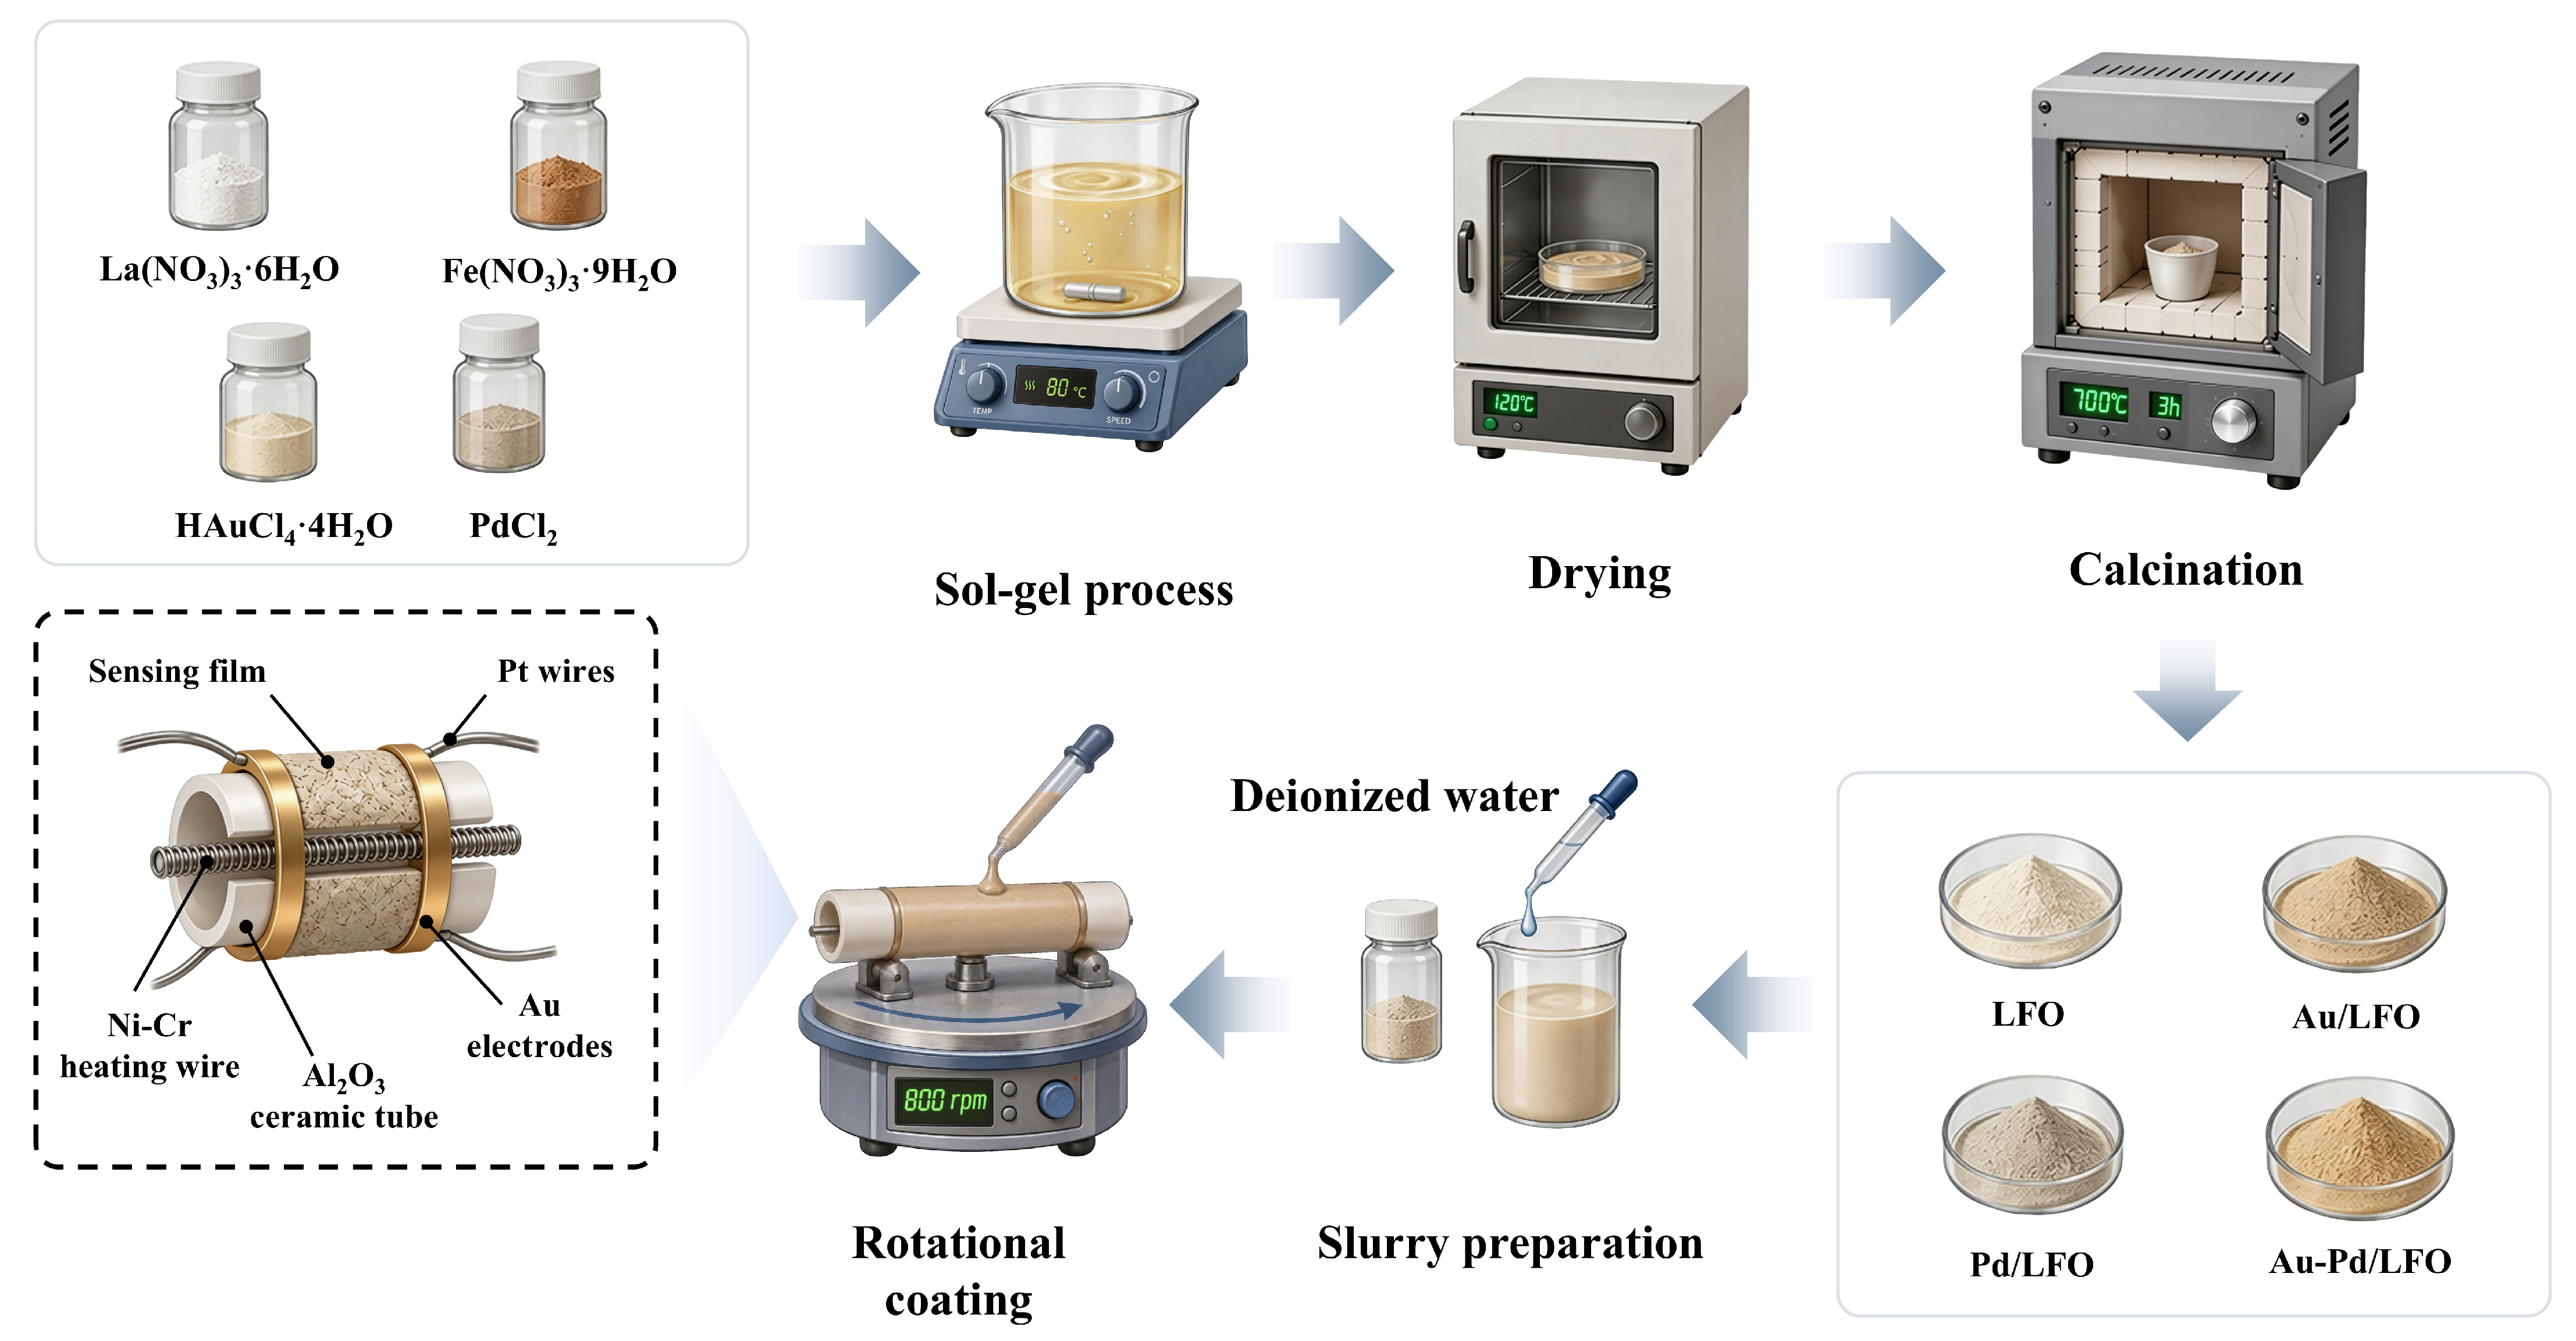
Au- and Pd-modified LaFeO3 powders were synthesized using a citrate-assisted sol–gel method. Stoichiometric amounts of La(NO3)3·6H2O and Fe(NO3)3·9H2O were dissolved in 150 mL of deionized water at a La:Fe molar ratio of 1:1. Citric acid was subsequently added with a citric acid-to-metal-cations molar ratio of 1.5:1.
For samples modified with noble metals, calculated amounts of HAuCl4·4H2O and/or PdCl2 were introduced into the precursor solution to obtain the required nominal Au and Pd loadings. The nominal noble-metal loading was calculated on an elemental-metal basis relative to the mass of LaFeO3 host powder. The resulting solution was stirred for 6 h at 60 °C and then heated at 80 °C under continuous stirring until a homogeneous gel was formed. The gel was dried at 120 °C for 4 h and subsequently calcined in air at 700 °C for 3 h.
For preliminary optimization of the single-metal loadings, Au/LaFeO3 samples containing 2, 3, and 4 wt% Au and Pd/LaFeO3 samples containing 4, 5, and 6 wt% Pd were prepared under identical conditions. Based on the loading-screening results presented in Figure S1, 3 wt% Au and 5 wt% Pd were selected as the optimal single-metal loadings within the tested ranges. These two selected loadings were subsequently combined to prepare LaFeO3 co-modified with 3 wt% Au and 5 wt% Pd.
Four representative materials were selected for systematic characterization and gas-sensing comparison: pristine LaFeO3, LaFeO3 modified with 3 wt% Au, LaFeO3 modified with 5 wt% Pd, and LaFeO3 co-modified with 3 wt% Au and 5 wt% Pd. These samples are hereafter denoted as LFO, Au/LFO, Pd/LFO, and Au-Pd/LFO, respectively.
2.2. Sensor Fabrication
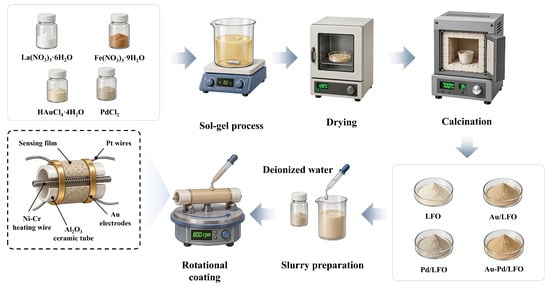
The synthesized powders were mixed with deionized water at a powder-to-water mass ratio of 1:2 to form homogeneous slurries. A fixed amount of each slurry was deposited onto the outer surface of an alumina ceramic tube using a rotational coating process at 800 rpm for 0.5 h. The fabricated sensors were thermally aged in air at 200 °C for 18 h before gas-sensing measurements. All sensors were fabricated under identical conditions. The overall preparation process is illustrated in Figure 1.
Figure 1.
Schematic illustration of the citrate-assisted sol–gel synthesis of LFO, Au/LFO, Pd/LFO, and Au-Pd/LFO and the fabrication of the corresponding gas sensors. The four materials were prepared without noble-metal precursors, with a Au precursor, with a Pd precursor, and with both precursors, respectively.
2.3. Material Characterization Methods
The phase compositions and crystal structures of the prepared materials were characterized by X-ray diffraction (XRD). Surface morphology and elemental distribution were examined using field-emission scanning electron microscopy (FESEM) coupled with energy-dispersive X-ray spectroscopy (EDS). The surface elemental composition and chemical states of Au, Pd, and O were analyzed by X-ray photoelectron spectroscopy (XPS). Nitrogen adsorption–desorption measurements were performed to determine the specific surface areas and pore-size distributions of the materials.
2.4. Gas-Sensing Measurements and Parameter Definitions
Gas-sensing measurements were performed using a WS-30A (Zhengzhou Winsen Electronics Technology Co., Ltd., Zhengzhou, China) gas-sensing test system equipped with an 18 L chamber. The target gases were supplied from standard gas cylinders, with air used as the dilution gas. Gas dilutions were prepared by mixing the standard gases with air at specified volume ratios using a syringe.
The relative humidity in the chamber was adjusted using a dynamic humidity controller and monitored in real time using an associated humidity sensor. After the chamber reached the specified relative humidity, the gas flow was stopped, and the target gas was injected for measurements in the closed chamber. Measurements were conducted at an ambient temperature of 20 °C. The relative humidity was maintained at 20% for the routine measurements and varied from 20% to 90% for the humidity-dependent tests.
Response time and recovery time are used to evaluate the dynamic characteristics of sensors. The response time refers to the time taken for the sensor resistance to reach 90% of its total variation upon introducing the target gas, while the recovery time represents the time required for resistance to return to 90% of the total change after switching back to air atmosphere.
The resistance of sensing layers is derived from the circuit relationship as:
For the p-type sensing materials investigated herein, the sensor response (S) is defined as the resistance ratio under target gas and air atmosphere, as:
In the above expressions, Rg corresponds to the resistance recorded under target-gas exposure, and Ra represents the baseline resistance measured in ambient air.
2.5. Machine-Learning Analysis
For the analysis described in Section 3.3, the 1.0 ppm dataset contained 40 measurement records, with eight repeated measurements for each of the five mixture ratios. The 0.5 and 2.0 ppm datasets each contained 15 records, with three repeated measurements per ratio. The former was used for model development, whereas the latter two were used for concentration-transfer evaluation.
The F160/180 values were standardized by z-score transformation within the model-development procedure. During cross-validation, the scaling parameters were obtained only from the corresponding training fold. The final scaling parameters were then determined from the complete 1.0 ppm dataset and applied unchanged to the 0.5 and 2.0 ppm datasets. Model parameters were selected using repeated four-fold cross-validation stratified by mixture ratio, with 25 repetitions. The final model used C = 30, ε = 0.03 and γ = scale, corresponding to γ = 1.0 for the standardized single-feature input. Predicted fractions were constrained to the range of 0–1 before error calculation.
3. Results and Discussion
3.1. Material Characterization
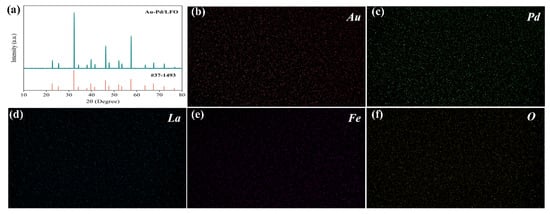
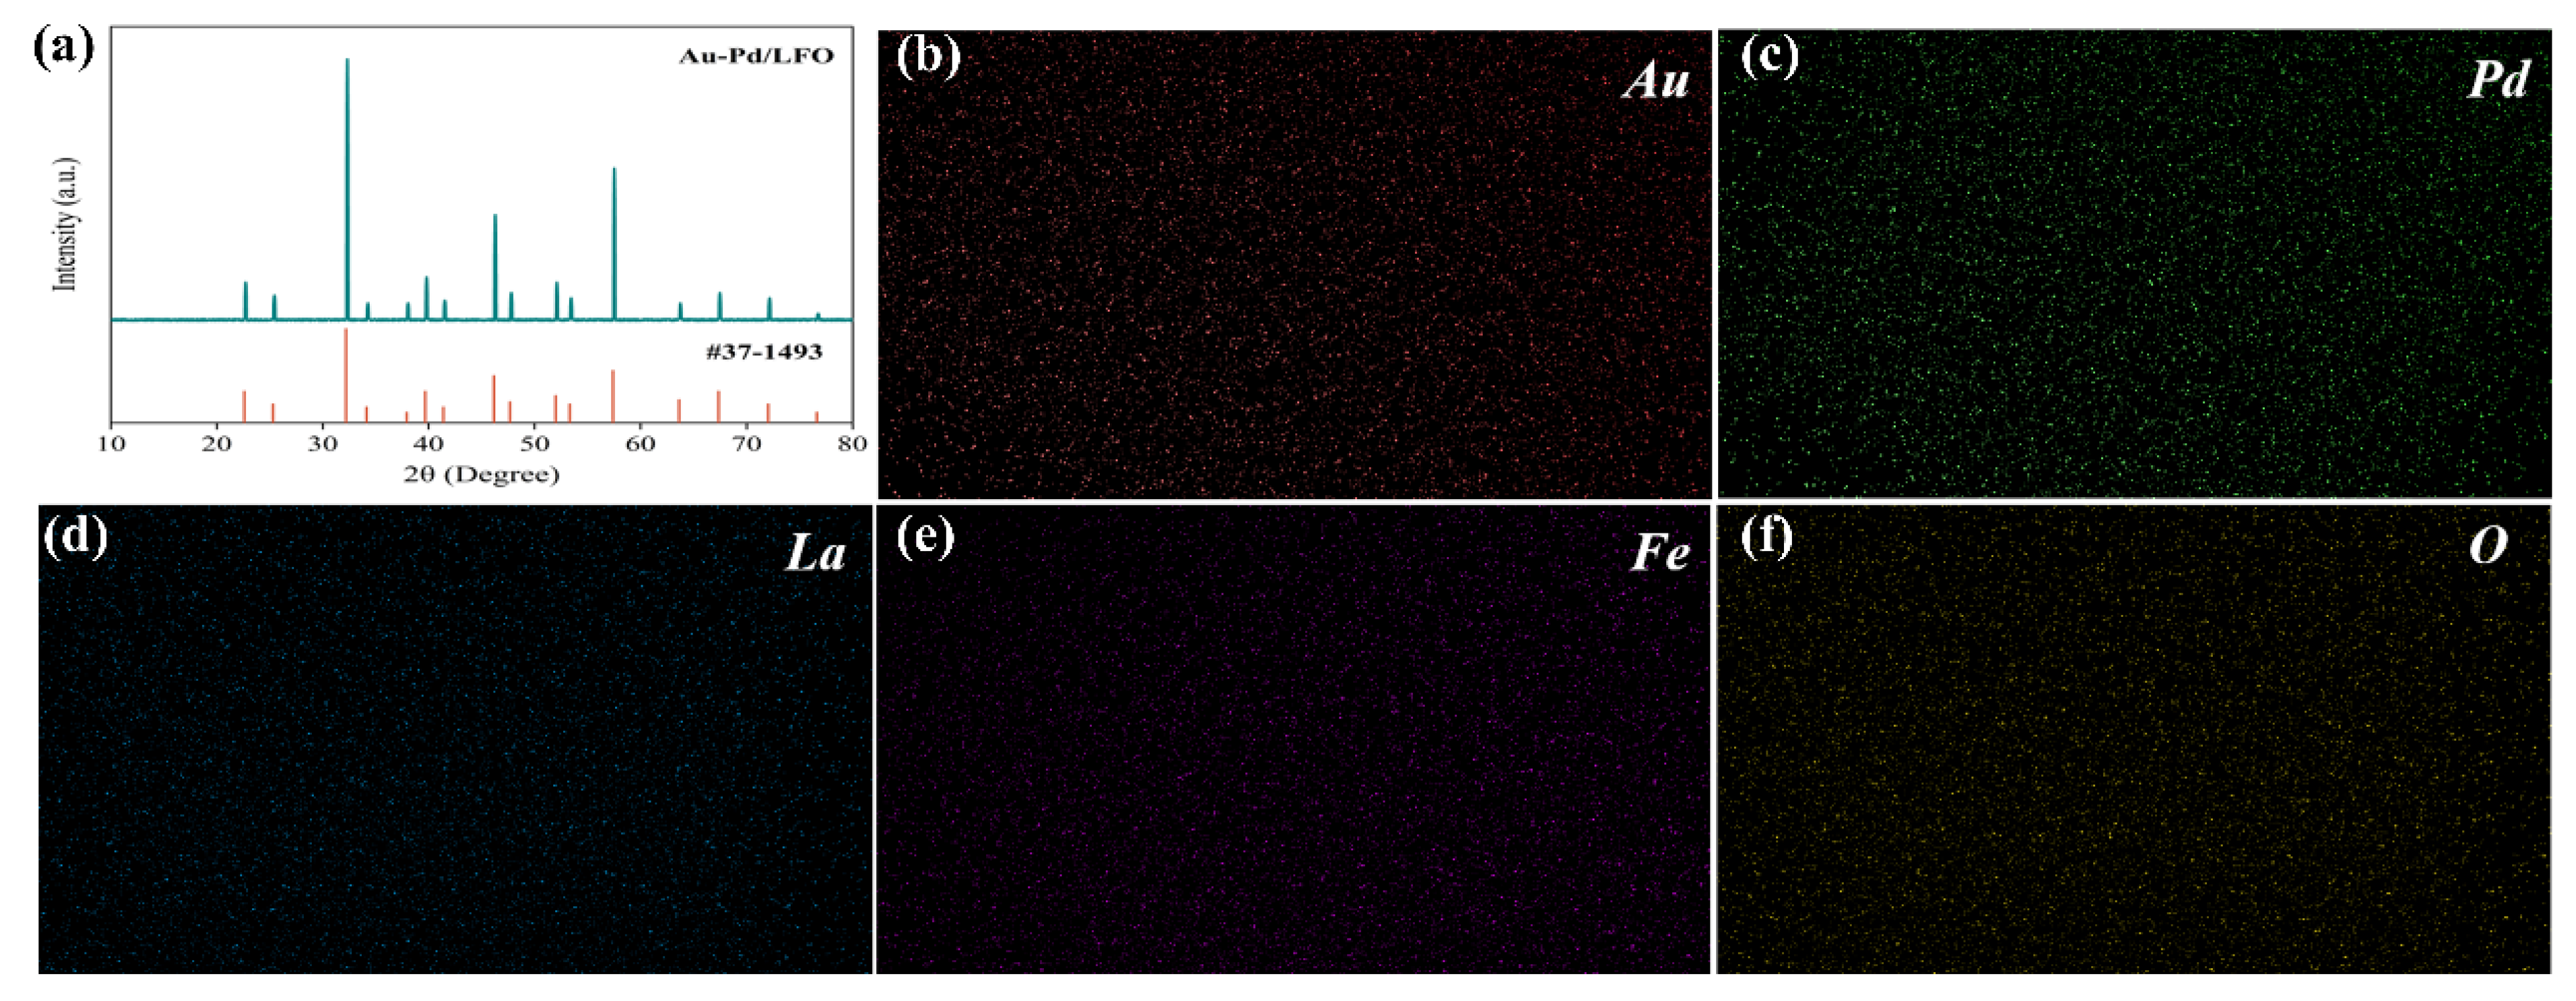
The XRD pattern of Au-Pd/LFO agrees well with the standard pattern of orthorhombic LFO (JCPDS No. 37-1493). All major diffraction peaks can be indexed to LFO, indicating that the orthorhombic perovskite phase remains the dominant crystalline phase after Au-Pd modification (Figure 2a). No distinct reflections attributable to crystalline Au- or Pd-containing phases or other impurity phases are observed, possibly because of their limited contents, small sizes, or high dispersion. The well-defined LFO reflections also indicate good crystallinity. EDS elemental mapping further confirms the presence of Au, Pd, La, Fe, and O (Figure 2b–f). The Au and Pd signals are relatively uniformly distributed throughout the examined region, without obvious large-scale enrichment. Together, these results support the successful modification of LFO with Au and Pd without altering its dominant crystalline phase.
Figure 2.
(a) X-ray diffraction pattern of Au-Pd/LFO; (b–f) EDS elemental mapping images of the corresponding region.
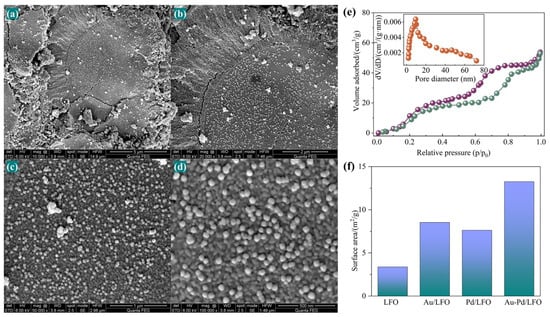
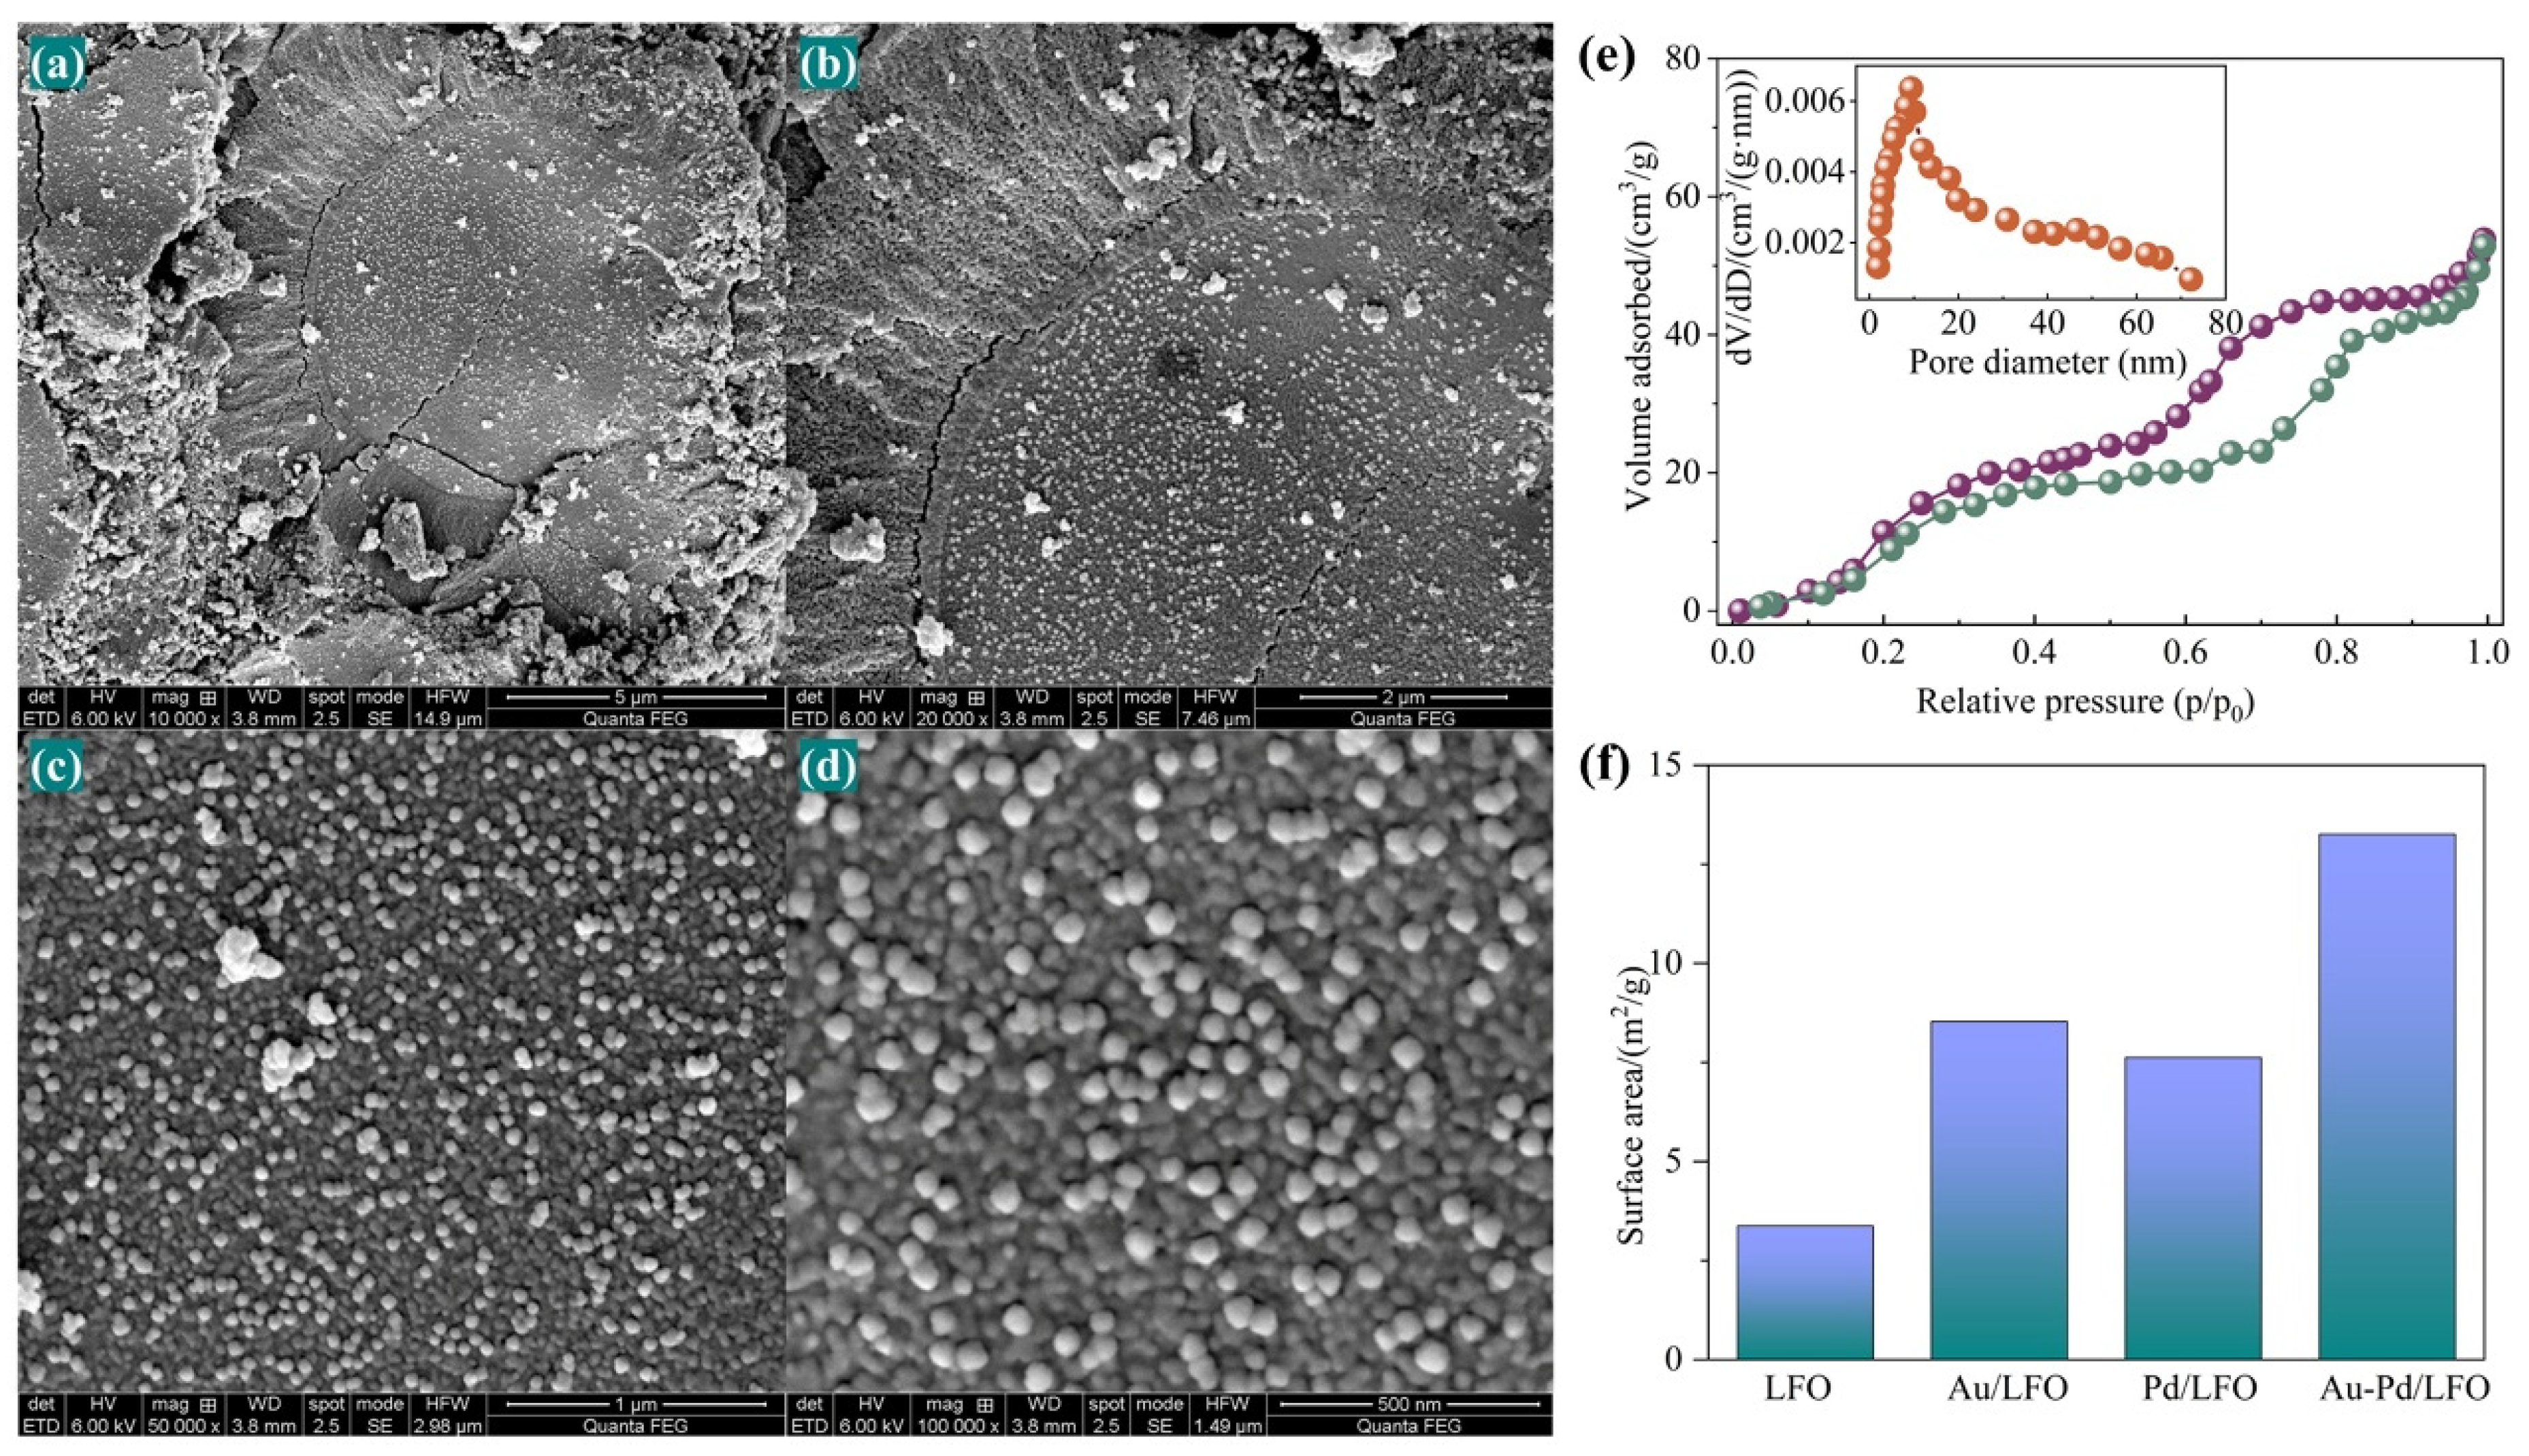
The SEM images in Figure 3a–d show the morphology of Au-Pd/LFO at different magnifications. At low magnification, the material consists of irregular micrometer-scale agglomerates with rough surfaces. Higher-magnification images reveal that these agglomerates are composed of closely packed, quasi-spherical nanograins with apparent sizes mainly in the range of 50–70 nm. Abundant voids are also observed between adjacent grains, providing pathways for gas molecules to penetrate the material and access the reaction surface. The N2 adsorption–desorption isotherm of Au-Pd/LFO exhibits a pronounced hysteresis loop, indicating its mesoporous characteristics (Figure 3e). The BJH pore-size distribution further suggests the presence of larger intergranular pores in addition to mesopores, consistent with the open particulate structure observed by SEM.
Figure 3.
(a–d) SEM images of Au-Pd/LFO at different magnifications; (e) N2 adsorption–desorption isotherms and pore size distributions of Au-Pd/LFO; (f) Specific surface area characterization diagram of four samples.
Figure 3f compares the BET specific surface areas of the four materials. The specific surface area of LFO is below 5 m2 g−1, whereas those of Au/LFO and Pd/LFO reach 8.53 and 7.62 m2 g−1, respectively. Au-Pd/LFO exhibits the largest specific surface area of 13.26 m2 g−1, approximately 1.55 and 1.74 times those of Au/LFO and Pd/LFO, respectively. Au-Pd/LFO therefore provides the largest gas-accessible surface area among the four materials. The combination of a larger specific surface area and abundant intergranular voids facilitates the access of oxygen and n-butanol molecules to the material surface and their subsequent adsorption and reaction, providing a structural basis for the enhanced sensing response.
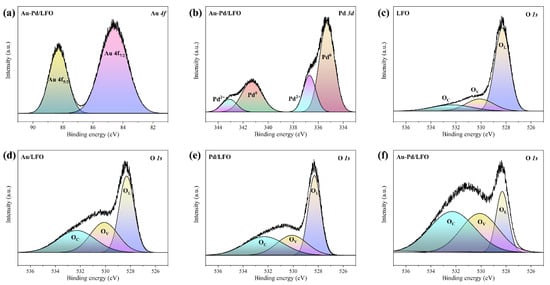
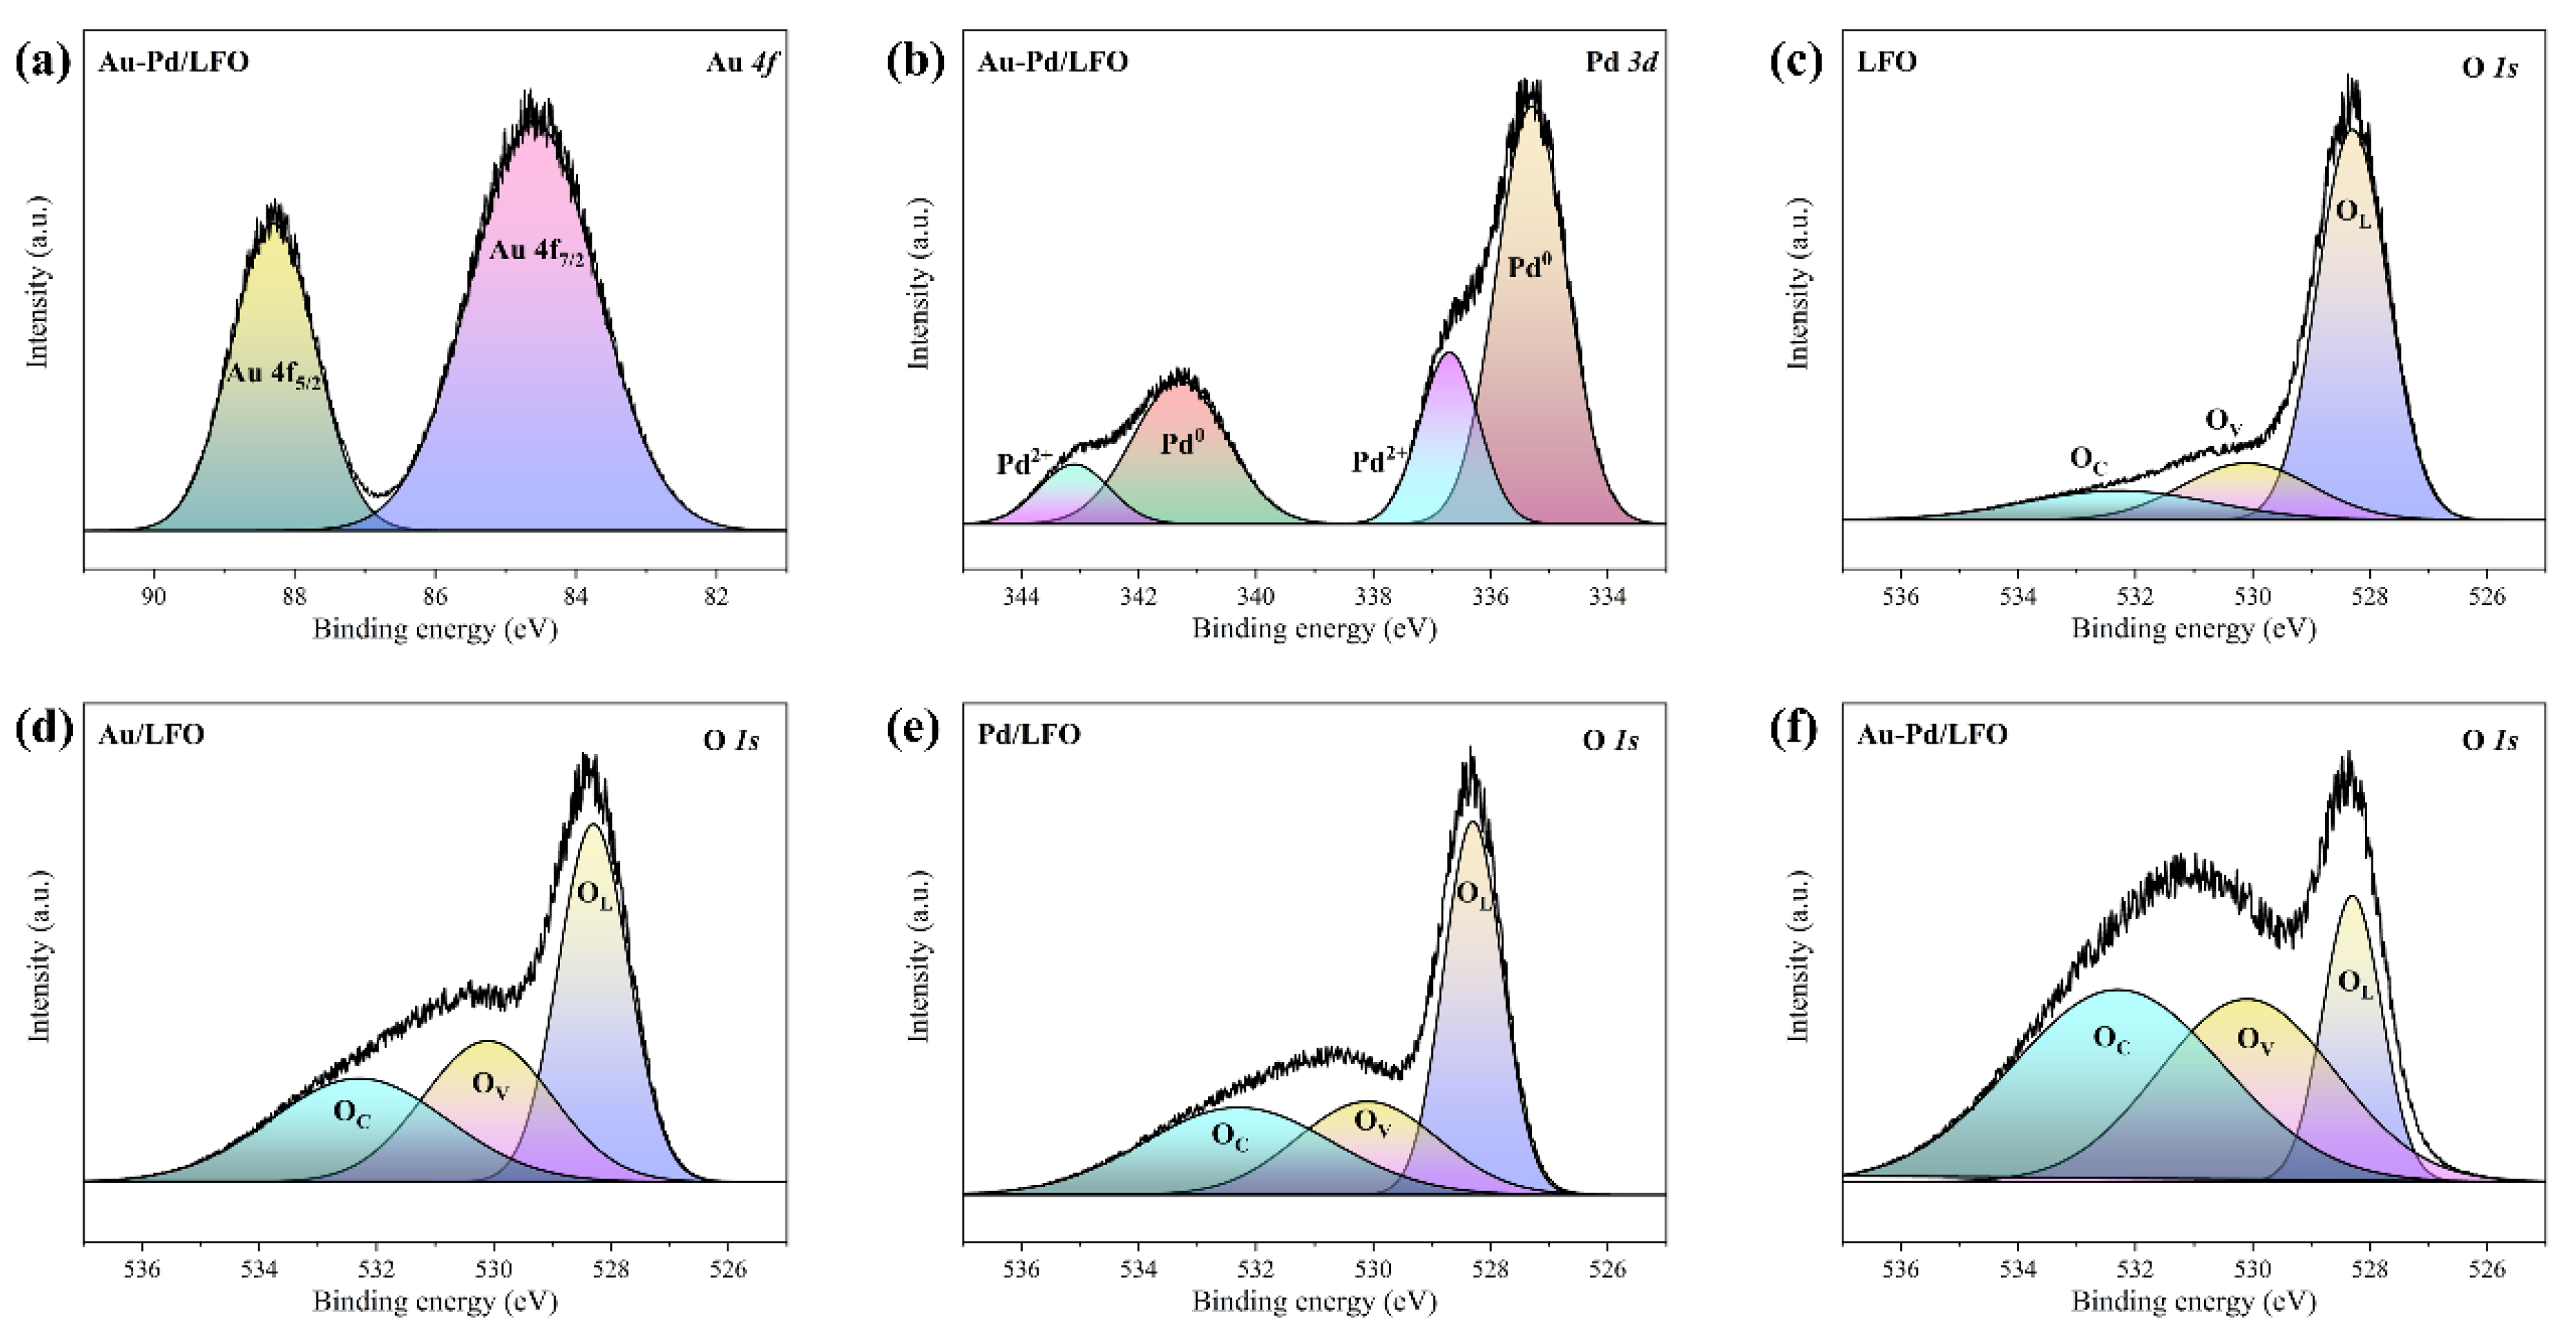
The XPS spectra in Figure 4 provide detailed insights into the chemical states and surface compositions of the prepared samples. Figure 4a shows the Au 4f spin–orbit doublet, with the Au 4f7/2 and Au 4f5/2 peaks centered at approximately 84.7 and 88.3 eV, respectively, confirming that gold exists mainly as metallic and weakly oxidized nanoclusters on the surface. Figure 4b displays mixed Pd0 (335.3, 341.2 eV) and Pd2+ (336.8, 343.4 eV) signals, indicating partial electron transfer from Pd to the lattice-an electronic configuration known to promote low-temperature catalytic activity. The dominant Au0 and Pd0 components indicate that both noble metals remain largely in their metallic state after calcination. Metallic Au acts as an electron sink, forming Schottky contacts with LaFeO3 and accelerating charge transfer, while metallic Pd supplies fast adsorption–desorption sites for oxygen and promotes low-temperature activation of alcohol molecules. Their coexistence therefore builds a dual catalytic/electronic network that favors rapid redox cycling on the material’s surface. Figure 4c–f compare the O 1s spectra of pristine LFO, Au/LFO, Pd/LFO and Au-Pd/LFO, respectively. Three deconvoluted components are evident: lattice oxygen (OL), defect-related oxygen (OV) and chemisorbed oxygen (OC). Compared with pristine LFO, Au/LFO and Pd/LFO show more pronounced contributions from the OV and OC components relative to OL. This trend is more evident in Au-Pd/LFO, suggesting changes in the surface oxygen environment following noble-metal modification. These changes may influence oxygen adsorption and oxygen-mediated surface reactions, thereby contributing to the enhanced n-butanol sensing response.
Figure 4.
High-resolution XPS spectra of the prepared samples. (a) Au 4f spectrum of Au-Pd/LFO; (b) Pd 3d spectrum of Au-Pd/LFO; (c–f) O 1s spectra of LFO, Au/LFO, Pd/LFO and Au-Pd/LFO.
3.2. Gas-Sensing Properties
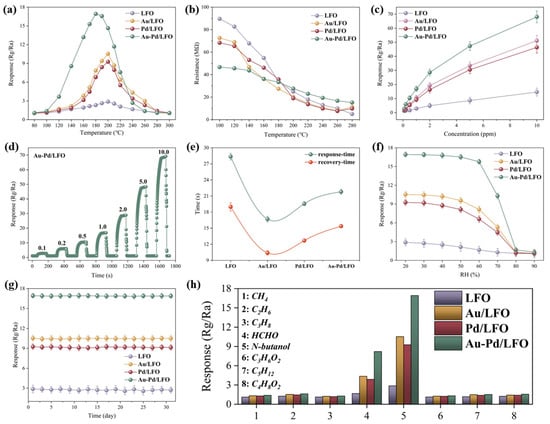
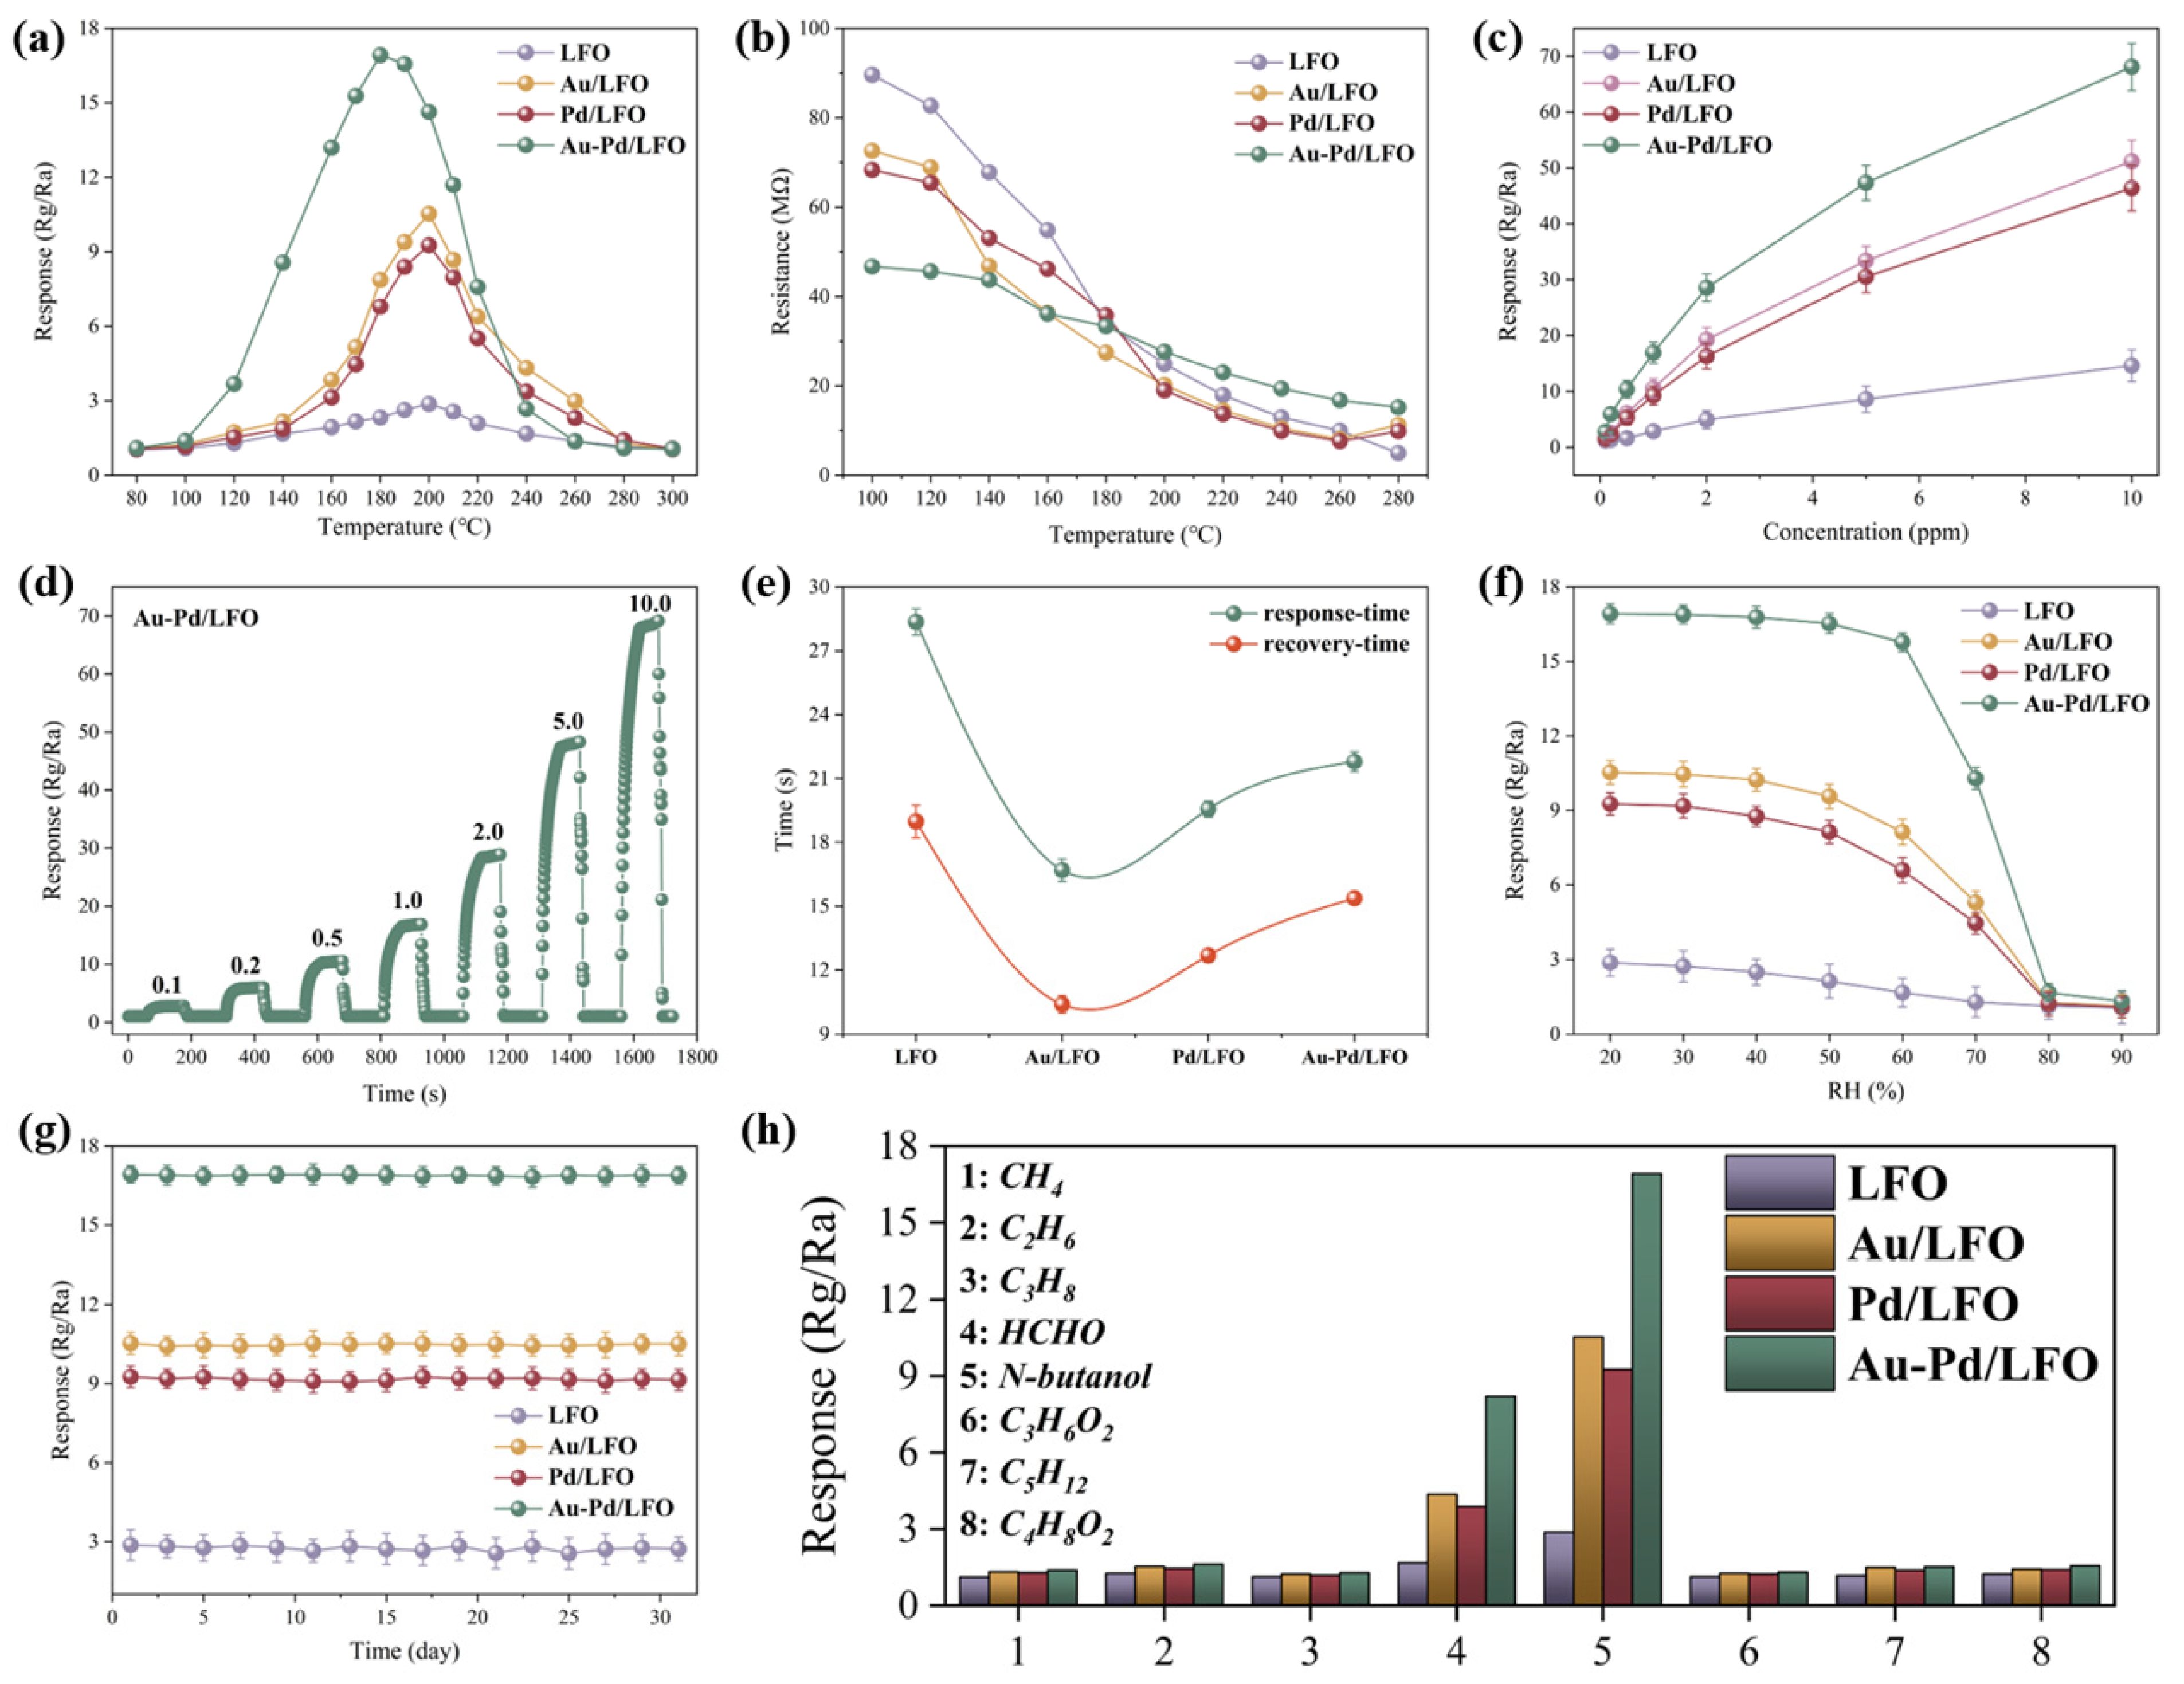
The operating temperature strongly affects gas adsorption, surface reaction, and desorption, resulting in volcano-shaped response–temperature profiles for the four materials (Figure 5a). LFO, Au/LFO, and Pd/LFO reach their maximum responses of approximately 2.87, 10.53, and 9.26 at 200 °C, respectively. In contrast, Au-Pd/LFO reaches a maximum response of 16.92 at a lower temperature of 180 °C, corresponding to approximately 5.90, 1.61, and 1.83 times the respective maximum responses of LFO, Au/LFO, and Pd/LFO. Thus, Au-Pd co-modification not only markedly enhances the response toward n-butanol but also lowers the optimal operating temperature from 200 °C to 180 °C. At relatively low temperatures, insufficient activation of adsorbed oxygen species and n-butanol limits the surface reaction. At temperatures above the optimum, accelerated desorption reduces the effective surface coverage of adsorbed oxygen and n-butanol, leading to a decrease in response.
Figure 5.
Gas-sensing performance of LFO, Au/LFO, Pd/LFO, and Au-Pd/LFO. (a) responses toward 1 ppm n-butanol at different operating temperatures; (b) baseline resistances at different operating temperatures; (c) responses toward 0.1–10 ppm n-butanol; (d) dynamic responses of Au-Pd/LFO toward different n-butanol concentrations; (e) response and recovery times toward 1 ppm n-butanol; (f) responses toward 1 ppm n-butanol under different relative humidities; (g) long-term response stability over 30 days; and (h) responses toward n-butanol and various interfering gases at 1 ppm. Data in panels (c,e–g) are presented as the mean ± standard deviation of three repeated measurements under each test condition.
The baseline resistances of all four materials decrease with increasing operating temperature (Figure 5b). Au-Pd/LFO exhibits a relatively low baseline resistance at lower temperatures, while the resistance values of the four materials gradually become closer near 180 °C. Above 200 °C, the resistance of Au-Pd/LFO changes only slightly, whereas those of LFO, Au/LFO, and Pd/LFO continue to decrease. Overall, Au-Pd/LFO exhibits a weaker dependence of baseline resistance on operating temperature, particularly in the high-temperature region.
The responses of all four materials increase monotonically as the n-butanol concentration increases from 0.1 to 10 ppm (Figure 5c). At 10 ppm, LFO, Au/LFO, Pd/LFO, and Au-Pd/LFO exhibit responses of approximately 14.6, 51.2, 46.4, and 68.1, respectively. Throughout the tested concentration range, Au-Pd/LFO consistently exhibits the highest response. In the low-concentration region, the relatively large response increment may be associated with the numerous unoccupied surface-active sites available for n-butanol adsorption and surface reaction. As the n-butanol concentration further increases, these sites are progressively occupied, reducing the number of available sites and gradually decreasing the response increment. Notably, Au-Pd/LFO exhibits a clearly distinguishable response at the lowest tested n-butanol concentration of 0.1 ppm.
Table 1 summarizes the n-butanol sensing performance of representative metal-oxide materials, with reported gas concentrations ranging from 1 to 100 ppm and operating temperatures from 130 to 262 °C. Au-Pd/LFO exhibits a response of 16.92 to 1 ppm n-butanol at 180 °C and produces a distinguishable response at the lowest tested concentration of 0.1 ppm, demonstrating its capability for low-concentration n-butanol sensing.
Table 1.
Comparison of the n-butanol sensing performance of Au-Pd/LFO with representative metal-oxide sensing materials reported in the literature.
The stepped-concentration response curve further demonstrates the dynamic sensing behavior of Au-Pd/LFO toward n-butanol (Figure 5d). During each exposure, the response increases and gradually approaches a stable level, with the response level increasing as the n-butanol concentration rises. After n-butanol is removed and air is reintroduced, the response returns close to its initial baseline. These consistent response–recovery transitions demonstrate the good reversibility and repeatable sensing behavior of Au-Pd/LFO over successive exposure–purge cycles.
Figure 5e compares the response and recovery times of the four materials toward 1 ppm n-butanol. LFO exhibits the longest response and recovery times, whereas Au/LFO and Pd/LFO show markedly faster response–recovery processes. The response and recovery times of Au-Pd/LFO lie between those of pristine LFO and the two single-metal-modified materials. This behavior may be associated with more extensive n-butanol adsorption and surface reaction, which require a relatively longer desorption and surface re-equilibration process after n-butanol removal. Overall, Au-Pd/LFO achieves a favorable balance between response magnitude and response–recovery characteristics.
The responses of all four materials decrease as the RH increases from 20% to 90%, although the extent of the response loss differs markedly among the materials (Figure 5f). At 50% RH, LFO retains approximately 74.2% of its response measured at 20% RH, whereas Au/LFO and Pd/LFO retain approximately 90.8% and 87.8%, respectively. In comparison, Au-Pd/LFO retains approximately 97.7% of its initial response at 50% RH and 93.2% at 60% RH. A more pronounced response decrease is observed for all four materials when the RH reaches 70%, followed by a sharp decline as RH increases from 70% to 80%. These results demonstrate that Au-Pd co-modification substantially improves humidity tolerance, enabling Au-Pd/LFO to maintain a high response under moderate-humidity conditions and broadening its applicability for practical n-butanol detection under variable-humidity conditions.
Figure 5g evaluates long-term stability by measuring the response toward 1 ppm n-butanol every other day over a 30-day period. LFO exhibits the most pronounced response fluctuations, with the variation exceeding 10%, indicating relatively poor long-term response stability. In comparison, the response variations of Au/LFO and Pd/LFO remain below 2%. Au-Pd/LFO displays an almost unchanged response throughout the test period, with a response variation below 1%, demonstrating the best long-term stability among the four materials. These results indicate that noble-metal modification markedly improves the long-term response stability of LFO, with Au-Pd co-modification providing the greatest improvement.
Figure 5h compares the responses of the four materials toward n-butanol and several interfering gases. All four materials exhibit higher responses toward n-butanol than toward the other tested gases, indicating a preferential response toward the target gas. Among the tested interferents, formaldehyde (HCHO) induces the most pronounced cross-response. Although its response remains lower than that toward n-butanol, the appreciable response induced by HCHO could substantially compromise the reliable identification of n-butanol when the two gases coexist.
These results indicate that the response magnitude of Au-Pd/LFO at a single operating temperature may be insufficient for the unambiguous identification of n-butanol in the presence of HCHO. Therefore, HCHO was selected as a representative interfering gas, and binary n-butanol/HCHO mixtures with different total concentrations and mixing ratios were prepared. The responses of Au-Pd/LFO were recorded at 160 °C, 180 °C, and 200 °C to exploit the different temperature dependences of the two gases and construct a multi-temperature response fingerprint. The resulting responses were subsequently transformed into temperature-normalized features designed to reduce the influence of total concentration and then used with a machine-learning regression model to predict the n-butanol fraction in the binary mixtures.
3.3. Machine-Learning-Assisted Analysis of Binary Mixtures
Binary n-butanol/HCHO mixtures with total concentrations of 0.5, 1.0, and 2.0 ppm were prepared at n-butanol ratios of 100:0, 75:25, 50:50, 25:75, and 0:100. The responses of Au–Pd/LFO were recorded at 160 °C, 180 °C, and 200 °C to extract composition-related information from the different temperature dependences of the two gases. To reduce the influence of total concentration on the absolute response magnitude, the response increment at 180 °C was used as the reference, and a temperature-normalized response feature was defined as:
where ST denotes the response measured at temperature T, and T is 160, 180, or 200 °C. By definition, F180/180 is fixed at 1.
FT/180 = (ST − 1)/(S180 − 1)
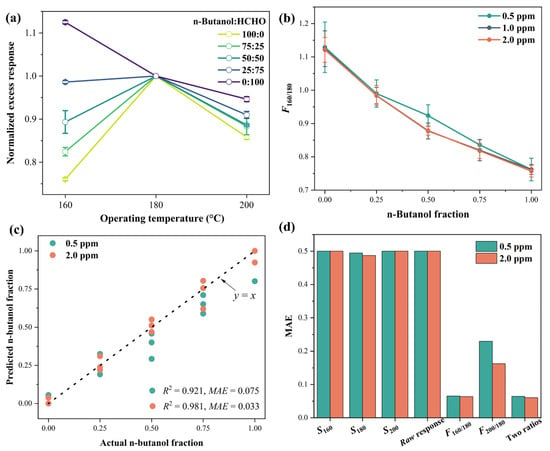
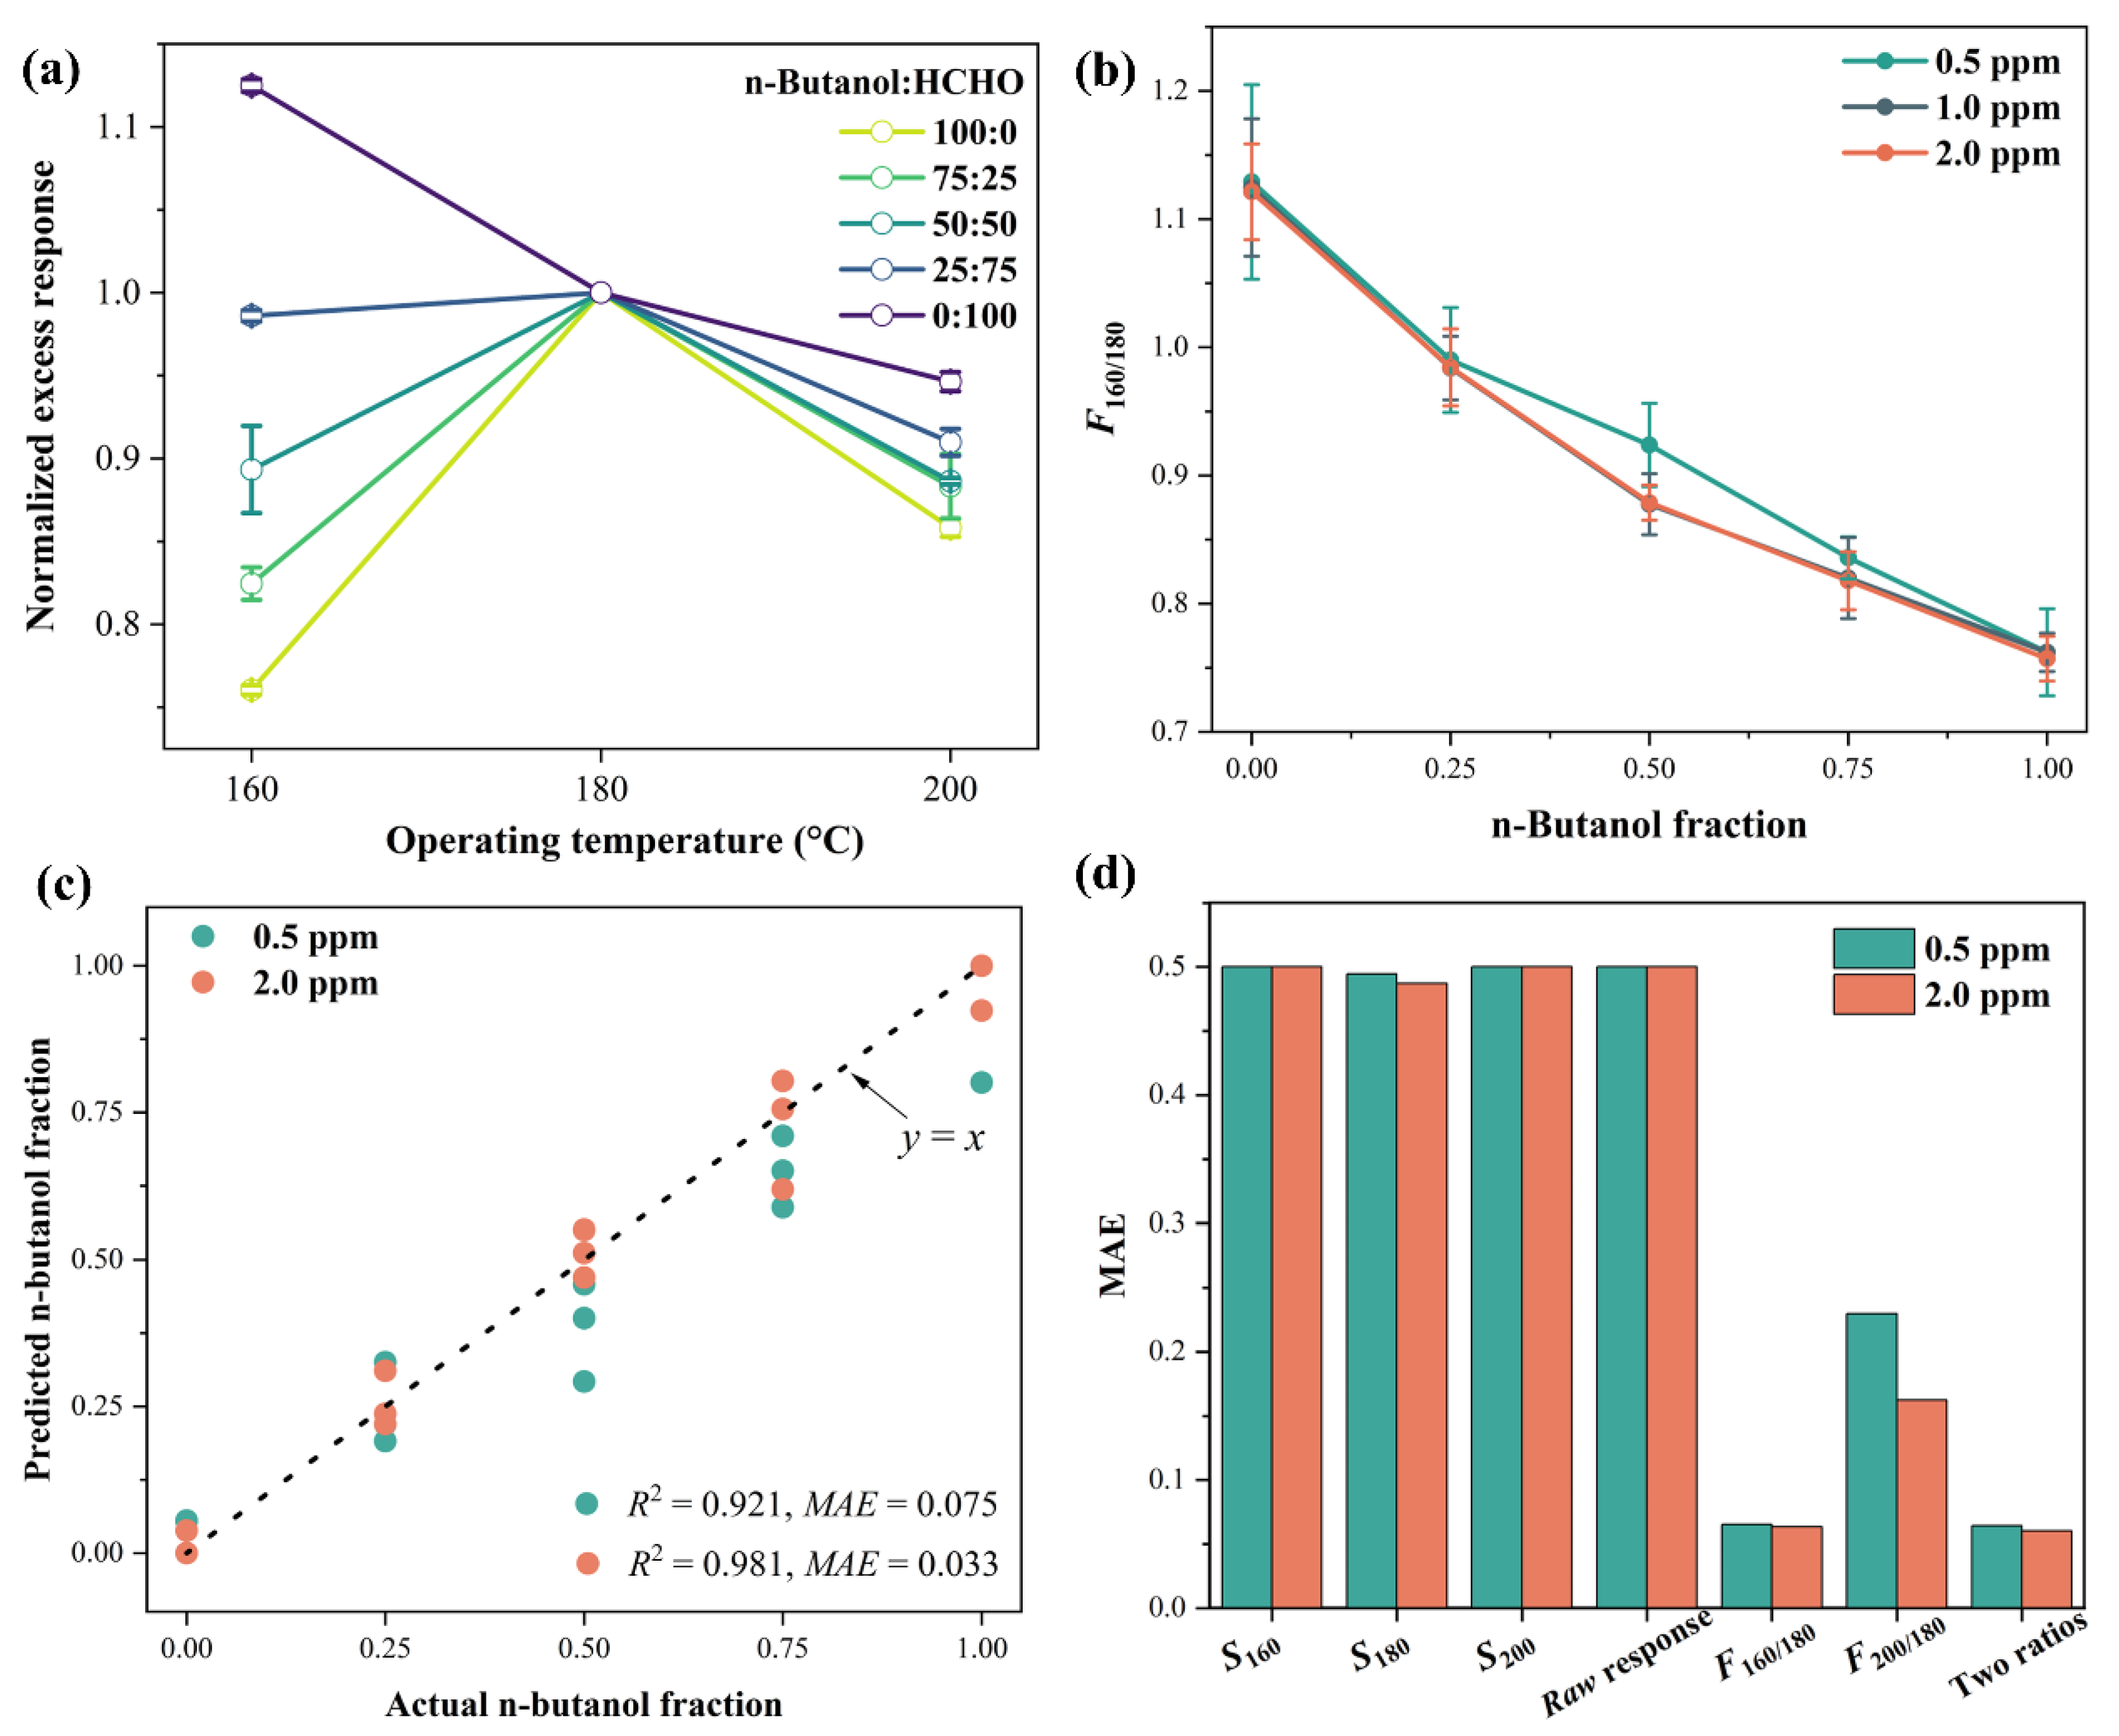
Figure 6a shows the normalized temperature responses obtained at different n-butanol/HCHO ratios. As the n-butanol ratio changed from 0:100 to 100:0, F160/180 decreased from 1.125 to 0.760, corresponding to a variation of approximately 0.365. In comparison, F200/180 decreased from 0.946 to 0.858, with a variation of approximately 0.088. The composition-dependent variation of F160/180 was therefore approximately 4.1 times that of F200/180, providing a more pronounced distinction among the mixture compositions. The maximum standard deviation among the three total concentrations was only 0.026, indicating that the normalized temperature response was only weakly affected by the total concentration. The temperature-response differences among the mixture compositions may be associated with the temperature-dependent adsorption, activation, and surface oxidation of n-butanol and HCHO. F160/180 was therefore used as the input feature for the subsequent composition analysis.
Figure 6.
Composition analysis of binary n-butanol/HCHO mixtures using the multi-temperature response features of Au-Pd/LFO. (a) Normalized excess responses of mixtures with different n-butanol ratios at different operating temperatures; (b) relationship between F160/180 and the n-butanol fraction under different total concentrations; (c) RBF-SVR-predicted versus actual n-butanol fractions; (d) comparison of the MAE values obtained using different input features in concentration-transfer tests.
At total concentrations of 0.5, 1.0, and 2.0 ppm, F160/180 decreased monotonically with increasing n-butanol fraction (Figure 6b). Although the highest total concentration was four times the lowest, the three curves retained similar fraction–feature relationships. This consistent monotonic behavior allowed the same feature mapping to be applied to mixtures with different total concentrations.
The relationship between F160/180 and the n-butanol fraction deviated from a strictly linear trend. A support vector regression model with a radial basis function kernel (RBF-SVR) was therefore employed. Its prediction function is expressed as:
The RBF kernel is given by:
where x is the standardized F160/180 input, xi denotes the corresponding support vectors, is the predicted n-butanol fraction, Ns is the number of support vectors, ai and are the model coefficients, b is the bias term, and γ is the kernel parameter. After training with the 1.0 ppm data, the model was applied directly to predict the n-butanol fractions at 0.5 and 2.0 ppm without refitting or parameter adjustment.
As shown in Figure 6c, the predicted values increased with the actual n-butanol fraction at both total concentrations and were distributed close to the identity line. At 0.5 ppm, the mean absolute error (MAE) and root-mean-square error (RMSE) were 0.075 and 0.099, respectively, and R2 reached 0.921. At 2.0 ppm, the MAE and RMSE decreased to 0.033 and 0.049, respectively, with an R2 of 0.981. The fraction–feature relationship established at 1.0 ppm remained effective at 0.5 and 2.0 ppm, demonstrating the advantage of F160/180 for composition analysis across different total concentrations.
Figure 6d compares the predictive performance of different input features using the same data split and linear-regression model. When the raw response at 160, 180, or 200 °C was used individually, the MAEs for the 0.5 and 2.0 ppm datasets remained approximately 0.49–0.50. Combining the raw responses at all three temperatures did not appreciably reduce the prediction error. When F160/180 was used instead, the MAEs decreased to 0.065 and 0.063 at 0.5 and 2.0 ppm, respectively. Relative to the combination of the three raw responses, these values represent reductions of 86.9% and 87.3%, respectively. The MAEs obtained using F200/180 were 0.230 and 0.162, which were higher than those obtained using F160/180, consistent with its smaller composition-dependent variation in Figure 6a. Combining F160/180 and F200/180 produced MAEs of 0.064 and 0.060, respectively, which were close to those obtained using F160/180 alone. Thus, F160/180 retained most of the composition-related information. The comparison shows that the improvement in concentration-transfer prediction arose primarily from the temperature-normalized feature rather than from simply increasing the number of raw responses or input features.
3.4. Gas-Sensing Mechanism
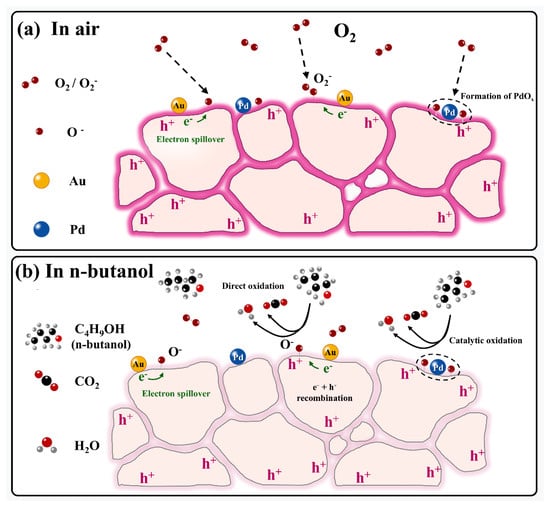
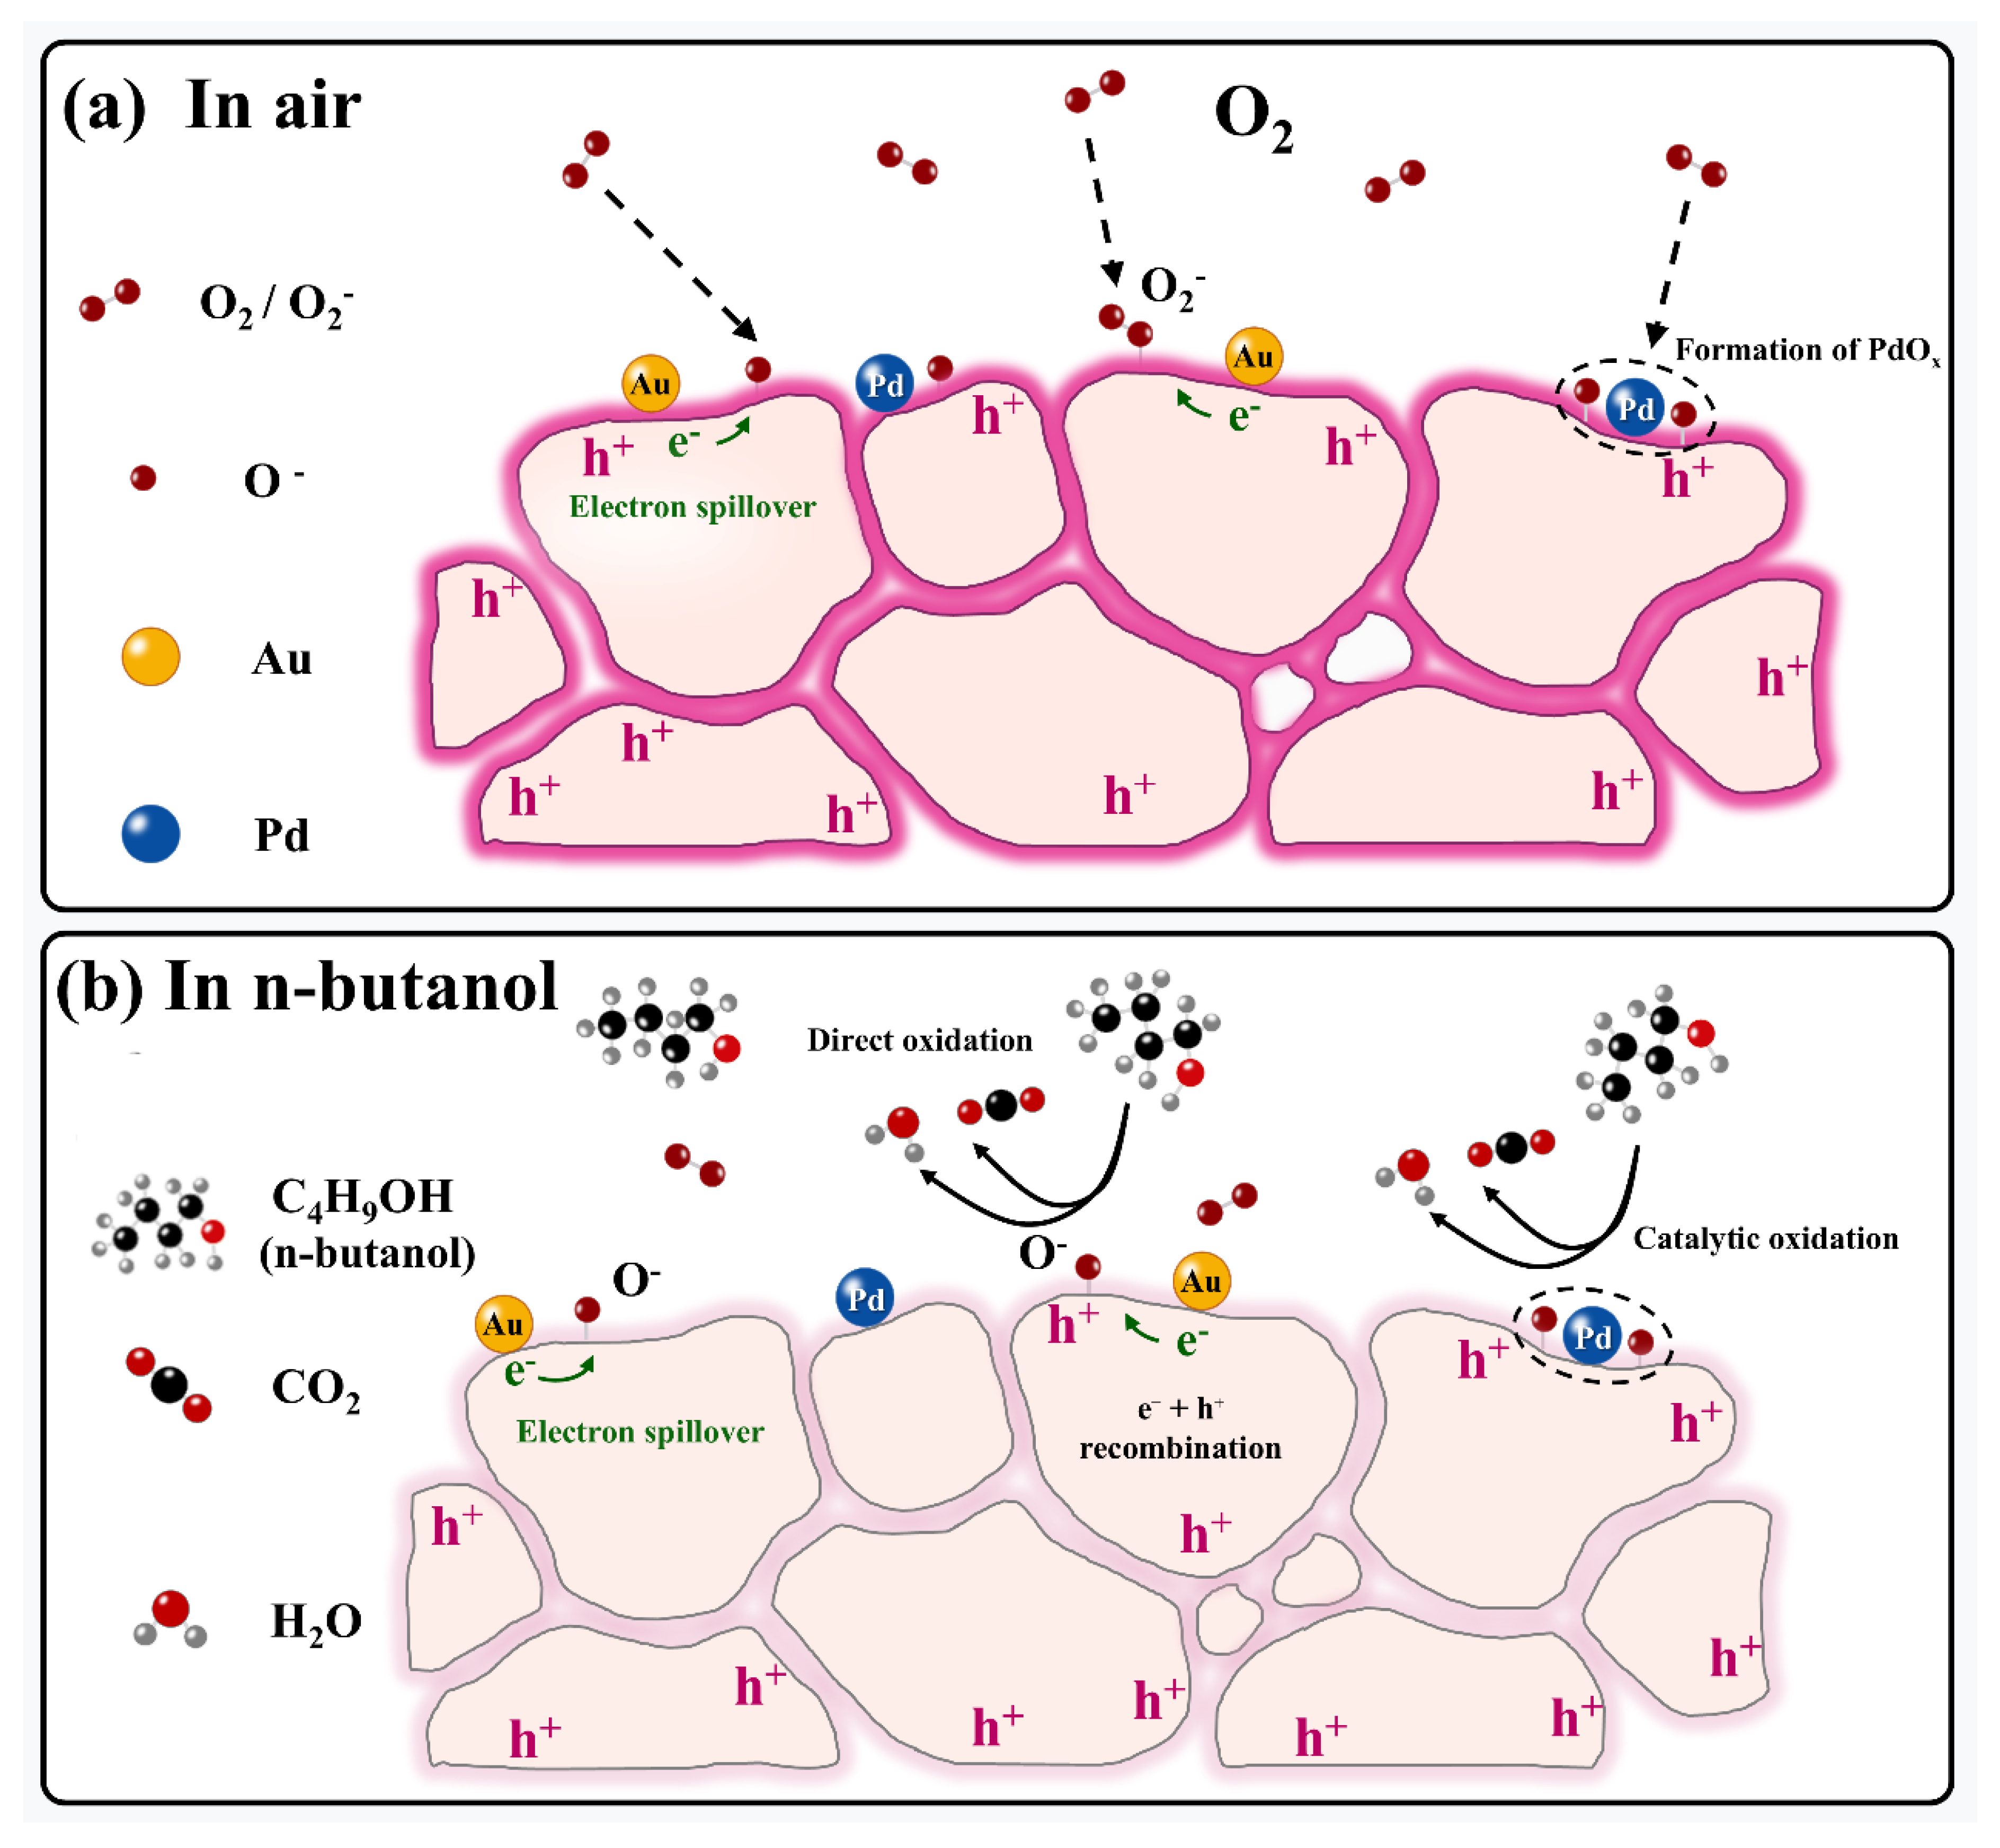
The proposed gas-sensing mechanism of Au-Pd/LFO is schematically illustrated in Figure 7. The resistance variation of Au-Pd/LFO toward n-butanol can be interpreted using the surface-adsorbed oxygen model commonly applied to p-type LFO [11,14,15]. In air, oxygen molecules adsorb on the material surface and capture electrons from LFO, forming ionized adsorbed oxygen species. The corresponding processes can be represented by the following simplified reactions:
O2(g) → O2(ads)
Figure 7.
Schematic illustration of the gas-sensing mechanism of Au-Pd/LFO toward n-butanol.
At 180 °C, O− is commonly considered one of the major reactive oxygen species within the conventional ionosorption model [41]. Electron capture by the adsorbed oxygen species increases the near-surface hole concentration and leads to the formation of a hole accumulation layer. Consequently, the near-surface conductivity increases, resulting in a lower resistance in air than during exposure to n-butanol.
When n-butanol molecules reach the surface of Au-Pd/LFO, they adsorb at available surface sites and subsequently react with the ionized oxygen species. The idealized overall reaction for the complete oxidation of n-butanol can be expressed as [15,17]:
C4H9OH + 12O−(ads) → 4CO2 + 5H2O + 12e−
The electrons released by this reaction enter the sensing material and recombine with holes, thereby decreasing the near-surface hole concentration and weakening the hole accumulation layer. Consequently, the conductivity decreases, and the resistance increases, giving a response greater than 1. After n-butanol is removed, oxygen molecules are re-adsorbed on the material surface and capture electrons. The near-surface hole concentration is gradually restored, and the resistance returns to a value close to its initial baseline. This process is consistent with the reversible response–recovery behavior observed in Figure 5d.
The larger accessible surface area and intergranular voids of Au-Pd/LFO may facilitate gas adsorption and transport, while its surface oxygen-related sites may contribute to oxygen-mediated surface reactions. Pd-containing species may promote the adsorption and activation of oxygen and n-butanol and facilitate the spillover of activated species across the LFO surface [19,24]. Au-related interfaces may modulate the local carrier distribution and the electrical response to these reactions [17,20,21,22]. Together, these structural, catalytic, and interfacial effects enhance the n-butanol response and lower the optimal operating temperature.
HCHO can also induce resistance changes through reactions with surface-adsorbed oxygen, accounting for the cross-response observed in Figure 5h. The different temperature dependences of the n-butanol and HCHO responses may reflect differences in their adsorption, activation, and surface oxidation processes. This contrast provides the basis for the composition-sensitive temperature-normalized feature used in Section 3.3.
4. Conclusions
To address the limited n-butanol response of LFO and the difficulty in resolving mixture composition caused by the cross-response to HCHO, this study enhanced the sensing performance of LFO through Au-Pd co-modification and extracted composition information from binary n-butanol/HCHO mixtures using multi-temperature response analysis. Au-Pd/LFO exhibited a response of 16.92 to 1 ppm n-butanol at 180 °C, approximately 5.90 times the maximum response of pristine LFO, while lowering the optimal operating temperature from 200 °C to 180 °C.
The larger accessible gas–solid interfacial area of Au-Pd/LFO and its higher relative fractions of defect-related and adsorbed-oxygen-related components may provide favorable conditions for the adsorption of oxygen and n-butanol and the subsequent surface reactions. The catalytic and interfacial effects introduced by Au and Pd further strengthen the resistance modulation associated with these reactions. To resolve the cross-response to HCHO, the temperature-normalized feature F160/180 was constructed from the distinct temperature-response behaviors of n-butanol and HCHO as a descriptor of mixture composition. The RBF-SVR model developed using the 1.0 ppm data yielded MAEs of 0.075 and 0.033 at total concentrations of 0.5 and 2.0 ppm, respectively, for the five predefined n-butanol fractions. This work offers a viable strategy for mixed-gas component analysis using a single metal-oxide sensor without resorting to multi-sensor arrays.
Supplementary Materials
The following supporting information can be downloaded at: https://www.mdpi.com/article/10.3390/mi17111301/s1, Figure S1: Effects of Au (2–4 wt%) and Pd (4–6 wt%) loadings on the responses of Au/LFO and Pd/LFO toward 1 ppm n-butanol. The optimal loadings within the investigated ranges were determined to be 3 wt% Au and 5 wt% Pd.
Author Contributions
Methodology, H.Z. and X.Z.; software, Y.Z.; validation, H.Z. and Y.Z.; investigation, H.Z.; data curation, X.Z. and Y.Z.; writing—original draft preparation, H.Z. and X.Z.; writing—review and editing, H.Z., X.Z. and Y.Z.; visualization, Y.Z.; funding acquisition, H.Z., Z.L. and F.C. All authors have read and agreed to the published version of the manuscript.
Funding
This work was supported by the Doctoral Research Fund of Shandong Jianzhu University (X25162); Taishan Scholar Program (tsqn202306238); Shandong Top Talent Special Foundation (0031504).
Institutional Review Board Statement
Not applicable.
Informed Consent Statement
Not applicable.
Data Availability Statement
The original contributions presented in this study are included in the article. Further inquiries can be directed to the corresponding author.
Conflicts of Interest
The authors declare no conflicts of interest.
References
- National Institute for Occupational Safety and Health (NIOSH). NIOSH Pocket Guide to Chemical Hazards: N-Butyl Alcohol; Centers for Disease Control and Prevention: Atlanta, GA, USA, 2019. [Google Scholar]
- Thorud, S.; Gjølstad, M.; Ellingsen, D.G.; Molander, P. Air formaldehyde and solvent concentrations during surface coating with acid-curing lacquers and paints in the woodworking and furniture industry. J. Environ. Monit. 2005, 7, 586–591. [Google Scholar] [CrossRef] [Scilit] [PubMed]
- Pei, Y.; Liu, N.; Liu, S.; Guan, H.; Guo, Z.; Li, Q.; Han, W.; Cai, H. Investigation of odor emissions from coating products: Key factors and key odorants. Front. Environ. Sci. 2022, 10, 1039842. [Google Scholar] [CrossRef] [Scilit]
- Kultan, V.; Thepanondh, S.; Pinthong, N.; Keawboonchu, J.; Robson, M. Comprehensive evaluation of odor-causing VOCs from the painting process of the automobile manufacturing industry and its sustainable management. Atmosphere 2022, 13, 1515. [Google Scholar] [CrossRef] [Scilit]
- Seo, S.J.; Shin, S.M.; Yoon, W.; Byeon, S.H. A health risk assessment of workers exposed to organic paint solvents used in the Korean shipbuilding industry. Toxics 2024, 12, 903. [Google Scholar] [CrossRef] [Scilit] [PubMed]
- National Institute for Occupational Safety and Health (NIOSH). Alcohols, Combined: Method 1405, Issue 1, NIOSH Manual of Analytical Methods, 4th ed.; National Institute for Occupational Safety and Health (NIOSH): Cincinnati, OH, USA, 2003. [Google Scholar]
- Mead, R.N.; Cala, J.M.; Felix, J.D.; Shimizu, M.S.; Casas, M.S.; Lathrope, T.; Avery, G.B.; Kieber, R.J.; Willey, J.D. A static headspace GC–MS/MS method for the determination of ethanol, iso-butanol, and n-butanol at nanomolar concentrations in aqueous environmental samples. Limnol. Oceanogr. Methods 2017, 15, 1007–1014. [Google Scholar] [CrossRef] [Scilit]
- Poirot, P.; Subra, I.; Gérardin, F.; Baudin, V.; Grossmann, S.; Héry, M. Determination of short-term exposure with a direct reading photoionization detector. Ann. Occup. Hyg. 2004, 48, 75–84. [Google Scholar] [CrossRef] [Scilit] [PubMed][Green Version]
- Dey, A. Semiconductor metal oxide gas sensors: A review. Mater. Sci. Eng. B 2018, 229, 206–217. [Google Scholar] [CrossRef] [Scilit]
- Nikolic, M.V.; Milovanovic, V.M.; Vasiljevic, Z.Z.; Stamenkovic, Z. Semiconductor gas sensors: Materials, technology, design, and application. Sensors 2020, 20, 6694. [Google Scholar] [CrossRef] [Scilit] [PubMed]
- Staerz, A.; Weimar, U.; Barsan, N. Current state of knowledge on the metal oxide based gas sensing mechanism. Sens. Actuators B Chem. 2022, 358, 131531. [Google Scholar] [CrossRef] [Scilit]
- Bulemo, P.M.; Kim, I.-D. Recent advances in ABO3 perovskites: Their gas-sensing performance as resistive-type gas sensors. J. Korean Ceram. Soc. 2020, 57, 24–39. [Google Scholar] [CrossRef] [Scilit]
- Baek, J.W.; Kim, I.-D. Advances in perovskite oxides for chemiresistive sensors. Acc. Mater. Res. 2023, 4, 1108–1120. [Google Scholar] [CrossRef] [Scilit]
- Souri, M.; Amoli, H.S. Gas sensing mechanisms in ABO3 perovskite materials at room temperature: A review. Mater. Sci. Semicond. Process. 2023, 156, 107271. [Google Scholar] [CrossRef] [Scilit]
- Patil, S.S.; Babar, B.M.; Nadargi, D.Y.; Shaikh, F.I.; Nadargi, J.D.; Sankapal, B.R.; Mulla, I.S.; Tamboli, M.S.; Truong, N.T.N.; Suryavanshi, S.S. La–Fe–O perovskite based gas sensors: Recent advances and future challenges. ACS Omega 2024, 9, 29994–30014. [Google Scholar] [CrossRef] [Scilit] [PubMed]
- Xiao, C.; Ma, Z.; Gao, X.; Zou, P.; Jia, L. Fabrication of Pt-functionalized LaFeO3 porous structures for highly sensitive detection of formaldehyde. Sens. Actuators B Chem. 2024, 410, 135644. [Google Scholar] [CrossRef] [Scilit]
- Shao, J.; Sun, C.; Liu, H.; He, P.; Liu, Q.; Sun, J.; Li, J.; Pan, G.; Yang, X. Insight into Au functionalization on core–shell LaFeO3 spheres for high-response and selectivity n-butanol gas sensors with DFT study. Sens. Actuators B Chem. 2023, 382, 133506. [Google Scholar] [CrossRef] [Scilit]
- Wang, X.; Qin, H.; Pei, J.; Chen, Y.; Li, L.; Xie, J.; Hu, J. Sensing performances to low concentration acetone for palladium-doped LaFeO3 sensors. J. Rare Earths 2016, 34, 704–710. [Google Scholar] [CrossRef] [Scilit]
- Zhang, H.; Xiao, J.; Chen, J.; Wang, Y.; Zhang, L.; Yue, S.; Li, S.; Huang, T.; Sun, D. Pd-modified LaFeO3 as a high-efficiency gas-sensing material for H2S gas detection. Nanomaterials 2022, 12, 2460. [Google Scholar] [CrossRef] [Scilit] [PubMed]
- Cao, E.; Wu, A.; Wang, H.; Zhang, Y.; Hao, W.; Sun, L. Enhanced ethanol sensing performance of Au and Cl comodified LaFeO3 nanoparticles. ACS Appl. Nano Mater. 2019, 2, 1541–1551. [Google Scholar] [CrossRef] [Scilit]
- Shingange, K.; Swart, H.; Mhlongo, G.H. Ultrafast detection of low acetone concentration displayed by Au-loaded LaFeO3 nanobelts owing to synergetic effects of porous 1D morphology and catalytic activity of Au nanoparticles. ACS Omega 2019, 4, 19018–19029. [Google Scholar] [CrossRef] [Scilit] [PubMed]
- Zhu, L.-Y.; Ou, L.-X.; Mao, L.-W.; Wu, X.-Y.; Liu, Y.-P.; Lu, H.-L. Advances in noble-metal-decorated metal oxide nanomaterials for chemiresistive gas sensors: Overview. Nano-Micro Lett. 2023, 15, 89. [Google Scholar] [CrossRef] [Scilit] [PubMed]
- Chumakova, V.; Marikutsa, A.; Platonov, V.; Khmelevsky, N.; Rumyantseva, M. Distinct roles of additives in the improved sensitivity to CO of Ag- and Pd-modified nanosized LaFeO3. Chemosensors 2023, 11, 60. [Google Scholar] [CrossRef] [Scilit]
- Yuan, G.; Zhong, Y.; Chen, Y.; Zhuo, Q.; Sun, X. Highly sensitive and fast-response ethanol sensing of porous Co3O4 hollow polyhedra via palladium reined spillover effect. RSC Adv. 2022, 12, 6725–6731. [Google Scholar] [CrossRef] [Scilit] [PubMed]
- Zeb, S.; Peng, X.; Shi, Y.; Su, J.; Sun, J.; Zhang, M.; Sun, G.; Nie, Y.; Cui, Y.; Jiang, X. Bimetal Au–Pd decorated hierarchical WO3 nanowire bundles for gas sensing application. Sens. Actuators B Chem. 2021, 334, 129584. [Google Scholar] [CrossRef] [Scilit]
- Han, W.; Yang, J.; Jiang, B.; Wang, X.; Wang, C.; Guo, L.; Sun, Y.; Liu, F.; Sun, P.; Lu, G. Conductometric ppb-level CO sensors based on In2O3 nanofibers co-modified with Au and Pd species. Nanomaterials 2022, 12, 3267. [Google Scholar] [CrossRef] [Scilit] [PubMed]
- Wang, W.; Shen, X.; Zhang, S.; Lv, R.; Liu, M.; Xu, W.; Chen, Y.; Wang, H. Research on very volatile organic compounds and odors from veneered medium density fiberboard coated with water-based lacquers. Molecules 2022, 27, 3626. [Google Scholar] [CrossRef] [Scilit] [PubMed]
- Sherzad, M.; Jung, C. Evaluating the emission of VOCs and HCHO from furniture based on the surface finish methods and retention periods. Front. Built Environ. 2022, 8, 1062255. [Google Scholar] [CrossRef] [Scilit]
- Yaqoob, U.; Younis, M.I. Chemical gas sensors: Recent developments, challenges, and the potential of machine learning—A review. Sensors 2021, 21, 2877. [Google Scholar] [CrossRef] [Scilit] [PubMed]
- Kanaparthi, S.; Singh, S.G. Discrimination of gases with a single chemiresistive multi-gas sensor using temperature sweeping and machine learning. Sens. Actuators B Chem. 2021, 348, 130725. [Google Scholar] [CrossRef] [Scilit]
- Shaposhnik, A.; Moskalev, P.; Sizask, E.; Ryabtsev, S.; Vasiliev, A. Selective detection of hydrogen sulfide and methane by a single MOX-sensor. Sensors 2019, 19, 1135. [Google Scholar] [CrossRef] [Scilit] [PubMed]
- Acharyya, S.; Jana, B.; Nag, S.; Saha, G.; Guha, P.K. Single resistive sensor for selective detection of multiple VOCs employing SnO2 hollowspheres and machine learning algorithm: A proof of concept. Sens. Actuators B Chem. 2020, 321, 128484. [Google Scholar] [CrossRef] [Scilit]
- Thai, N.X.; Tonezzer, M.; Masera, L.; Nguyen, H.; Duy, N.V.; Hoa, N.D. Multi gas sensors using one nanomaterial, temperature gradient, and machine learning algorithms for discrimination of gases and their concentration. Anal. Chim. Acta 2020, 1124, 85–93. [Google Scholar] [CrossRef] [Scilit] [PubMed]
- Amini, A.; Vafaei, M. Identifying binary mixtures of volatile organic compounds with isomeric components using a single thermal shock-induced generic SnO2 gas sensor. IEEE Sens. J. 2020, 20, 13220–13228. [Google Scholar] [CrossRef] [Scilit]
- Lee, B.; Kang, M.; Lee, K.; Chae, Y.; Yoon, K.J.; Lee, D.S.; Park, I. Multigas identification by temperature-modulated operation of a single anodic aluminum oxide gas sensor platform and deep learning algorithm. ACS Sens. 2025, 10, 954–964. [Google Scholar] [CrossRef] [Scilit] [PubMed]
- Zhang, J.; Yue, Y.; Chen, Y.; Xu, H.; Xie, J.; Zhang, G. Enhanced n-butanol sensing performance of Co3O4/LaFeO3 nanocomposites. Mater. Lett. 2024, 377, 137574. [Google Scholar] [CrossRef] [Scilit]
- Shao, J.; Sun, C.; Pan, G.; Yang, X. Conductometric n-butanol sensor based on Pt-loaded LaFeO3 with 3D hierarchical structure. Sens. Actuators B Chem. 2024, 417, 136086. [Google Scholar] [CrossRef] [Scilit]
- Pan, H.; Li, Z.; Lou, C.; Lei, G.; Xie, J.; Zheng, W.; Liu, X.; Zhang, J. Anchoring Fe2O3 nanosheets on NiO nanoprisms to regulate the electronic properties for improved n-butanol detection. Sens. Actuators B Chem. 2022, 354, 131223. [Google Scholar] [CrossRef] [Scilit]
- Qian, X.; Chen, Y.; Tao, Y.; Zhang, J.; Zhang, G.; Xu, H. Facile synthesis of NiFe2O4-based nanoblocks for low-temperature detection of trace n-butanol. RSC Adv. 2024, 14, 2214–2225. [Google Scholar] [CrossRef] [Scilit] [PubMed]
- Yuan, Z.-Y.; Yang, F.; Zhu, H.-M.; Meng, F.-L.; Ibrahim, M. High-response n-butanol gas sensor based on ZnO/In2O3 heterostructure. Rare Met. 2023, 42, 198–209. [Google Scholar] [CrossRef] [Scilit]
- Lei, T.; Rao, Z.; Zhang, S.; Cai, S.; Xie, C. The irreversible R–T curves of metal oxide gas sensor under programmed temperature cycle. Sens. Actuators B Chem. 2016, 235, 481–491. [Google Scholar] [CrossRef] [Scilit]

Disclaimer/Publisher’s Note: The statements, opinions and data contained in all publications are solely those of the individual author(s) and contributor(s) and not of MDPI and/or the editor(s). MDPI and/or the editor(s) disclaim responsibility for any injury to people or property resulting from any ideas, methods, instructions or products referred to in the content. |
© 2026 by the authors. Licensee MDPI, Basel, Switzerland. This article is an open access article distributed under the terms and conditions of the Creative Commons Attribution (CC BY) license.