


Abstract
Improving chemiresistive CO2 sensing in real gas samples requires advances in both material response and signal calibration. Here, Au–Pt co-modified PrFeO3 (Au–Pt/PFO) was prepared by a citric-acid-assisted sol–gel method and evaluated against PFO, Au/PFO, and Pt/PFO to examine the effects of noble-metal modification on CO2 sensing. Au–Pt/PFO exhibited a specific surface area of 16.26 m2/g and an altered surface oxygen chemical environment. At 190 °C, its response (Rg/Ra) to 1000 ppm CO2 reached 9.68, corresponding to 2.61 times that of PFO, with response and recovery times of 22.38 and 16.37 s, respectively. During a 31-day test, it retained 99.38% of its initial response on Day 31. The sensing behavior was interpreted in terms of surface adsorption and interfacial charge modulation using characterization and electrical measurements. Seven features extracted from the response–recovery curves were subsequently used to construct a support vector regression (SVR)-assisted calibration model. Spectroscopic measurements served as references for evaluating CO2 concentration predictions in respiratory gas samples from imbibed rice seeds. Across separate groups comprising two gas-sample batches per method, the mean absolute relative errors were 97.55% for conventional response-based calibration and 33.07% for SVR-assisted calibration, corresponding to a relative reduction of 66.10%. These results demonstrate enhanced CO2 response through Au–Pt co-modification and improved concentration prediction in the investigated real gas samples through multiparameter-assisted calibration.
1. Introduction
Carbon dioxide (CO2) released during respiratory metabolism provides a measurable gaseous signal for investigating biological activity. In processes such as rice seed imbibition, CO2 measurements have been used to monitor respiratory activity and compare metabolic changes under different treatment conditions [1,2]. Such applications require sensors to respond sensitively and reproducibly while enabling the reliable conversion of sensor signals into gas concentrations. The background conditions of real gas samples may differ from those used for calibration with standard gases, altering the relationship between sensor response and concentration and thereby affecting quantitative results [3]. Optimizing the material response alone or relying solely on calibration with standard gases cannot meet the requirements of practical operating environments. Therefore, CO2 detection in gas samples from biological processes requires both an enhanced electrical sensing response to chemically stable CO2 and accurate inference of gas concentrations from sensor signals in the presence of cross-interference from coexisting gas components.
Nondispersive infrared absorption, tunable diode laser absorption spectroscopy, and photoacoustic spectroscopy exploit the characteristic absorption of CO2 for gas identification and concentration measurement, offering good selectivity and quantitative capability [4,5,6,7,8]. However, these measurements still rely on optical matching among the light source, detector, and detection cell. Resistive metal oxide semiconductor (MOS) sensors directly read changes in the electrical resistance of the sensing material, facilitating integration with electronic circuits [9]. Nevertheless, the high chemical stability of CO2 results in relatively small resistance changes induced by surface reactions and charge transfer, leaving detection performance constrained by material composition and surface processes [10].
Rare-earth ferrites constitute a viable class of materials for tuning the gas-sensing response to CO2. These ferrites possess an ABO3 perovskite structure, in which variations in A- and B-site composition and the associated defect states can influence the electronic structure and gas adsorption behavior, providing scope for optimizing gas-sensing performance [11,12,13,14]. Duan et al. enhanced the CO2 response of LaFeO3 through Co substitution at the B site and improved its response–recovery kinetics [15]. Among related materials, Bharati et al. compared the CO2 sensing performance of undoped and Co-doped PrFeO3 and found that Co doping increased the response and shortened the response and recovery times. These findings demonstrated the CO2 sensing capability of PrFeO3 and the potential to improve its gas-sensing performance through compositional modification [16]. These studies established a link between compositional modification and CO2 sensing performance.
Noble-metal modification can alter the gas-sensing behavior of a material through surface catalysis and modulation of metal–oxide interfaces. Sui et al. loaded AuPt nanocrystals onto In2O3 nanofibers, enabling ppb-level detection of ozone and acetone, and linked the improved performance to catalytic activity, spillover effects, and interfacial barrier modulation [17]. Shen et al. modified α-Fe2O3 with Au@Pt nanocrystals, improving its trimethylamine detection performance at low temperatures [18]. By comparing unmodified, single-metal-modified, and bimetallically modified materials, Han et al. demonstrated that Au/Pd co-modification enhanced the CO response of In2O3 nanofibers [19]. Related studies have elucidated how noble-metal composition regulates gas-sensing behavior through surface activity and interfacial charge transport [20,21,22], providing a rationale for comparing the CO2 responses of PrFeO3 modified with Au, Pt, and their combination.
In this study, an Au–Pt/PrFeO3 (Au–Pt/PFO) sensing material was prepared using PrFeO3 as the host material, with PFO, Au/PFO, and Pt/PFO included as control samples. The CO2 response magnitudes and response–recovery behavior of these materials were compared under identical test conditions to determine the performance changes resulting from individual Au and Pt modification and their co-modification. Structural and surface characterization was used to analyze the relationships between these performance differences and the structural, surface, and interfacial states of the materials. Humidity effects, cross-responses, and long-term stability were further investigated to provide an experimental basis for applying the materials to the detection of real gas samples.
The Au–Pt/PFO sensor was further applied to gas samples collected from the short-term respiration of imbibed rice seeds. Cross-responses to coexisting components in these samples altered the relationship between a single steady-state response value and CO2 concentration, making concentration estimation more difficult. Previous studies have employed dynamic response features and modeling methods such as support vector regression to estimate gas concentrations, providing a methodological basis for establishing quantitative relationships by combining steady-state and transient information [23,24,25]. Accordingly, multiple features were extracted from the sensor response–recovery curves to construct a support vector regression (SVR)-assisted calibration model. Using the CO2 concentrations measured by spectroscopy as reference values, the model was compared with conventional calibration based on response values to evaluate its concentration prediction errors and its performance in real gas samples.
2. Experimental Section
2.1. Material Preparation
Pr(NO3)3·6H2O, Fe(NO3)3·9H2O, citric acid, HAuCl4·4H2O, and H2PtCl6·6H2O used for material preparation were purchased from Shanghai Aladdin Biochemical Technology Co., Ltd. (Shanghai, China). PrFeO3 and the noble-metal-modified materials were prepared using a citric-acid-assisted sol–gel method. Pr(NO3)3·6H2O and Fe(NO3)3·9H2O, 0.05 mol each, were dissolved in 150 mL of deionized water, giving a Pr:Fe molar ratio of 1:1. Citric acid was subsequently added at a citric acid-to-metal cation molar ratio of 1.5:1.
For the noble-metal-modified samples, calculated amounts of HAuCl4·4H2O and/or H2PtCl6·6H2O were added to the precursor solution. The nominal loading of each noble metal was calculated as the mass of the corresponding metal element relative to the mass of the PrFeO3 matrix, expressed as a percentage. The resulting solution was stirred at 60 °C for 6 h and then heated to 80 °C under continuous stirring until a homogeneous gel formed. The gel was dried at 120 °C for 4 h and subsequently calcined in air at 800 °C for 6 h to obtain the corresponding powders.
Optimization of the single-metal loadings identified 3 wt% Au and 7 wt% Pt as the optimal loadings within their respective investigated ranges. These two optimal single-metal loadings were then combined to prepare a co-modified material containing 3 wt% Au and 7 wt% Pt. Unmodified PrFeO3, PrFeO3 modified with 3 wt% Au, PrFeO3 modified with 7 wt% Pt, and PrFeO3 co-modified with 3 wt% Au and 7 wt% Pt were selected for systematic characterization and performance comparison. These materials were designated as PFO, Au/PFO, Pt/PFO, and Au–Pt/PFO, respectively.
2.2. Sensor Fabrication
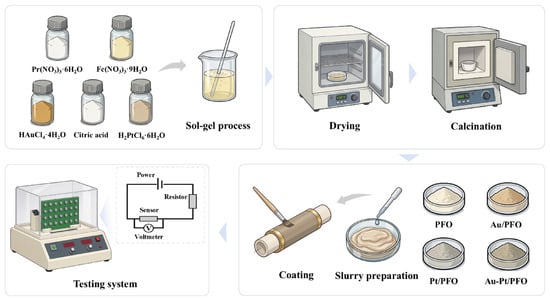
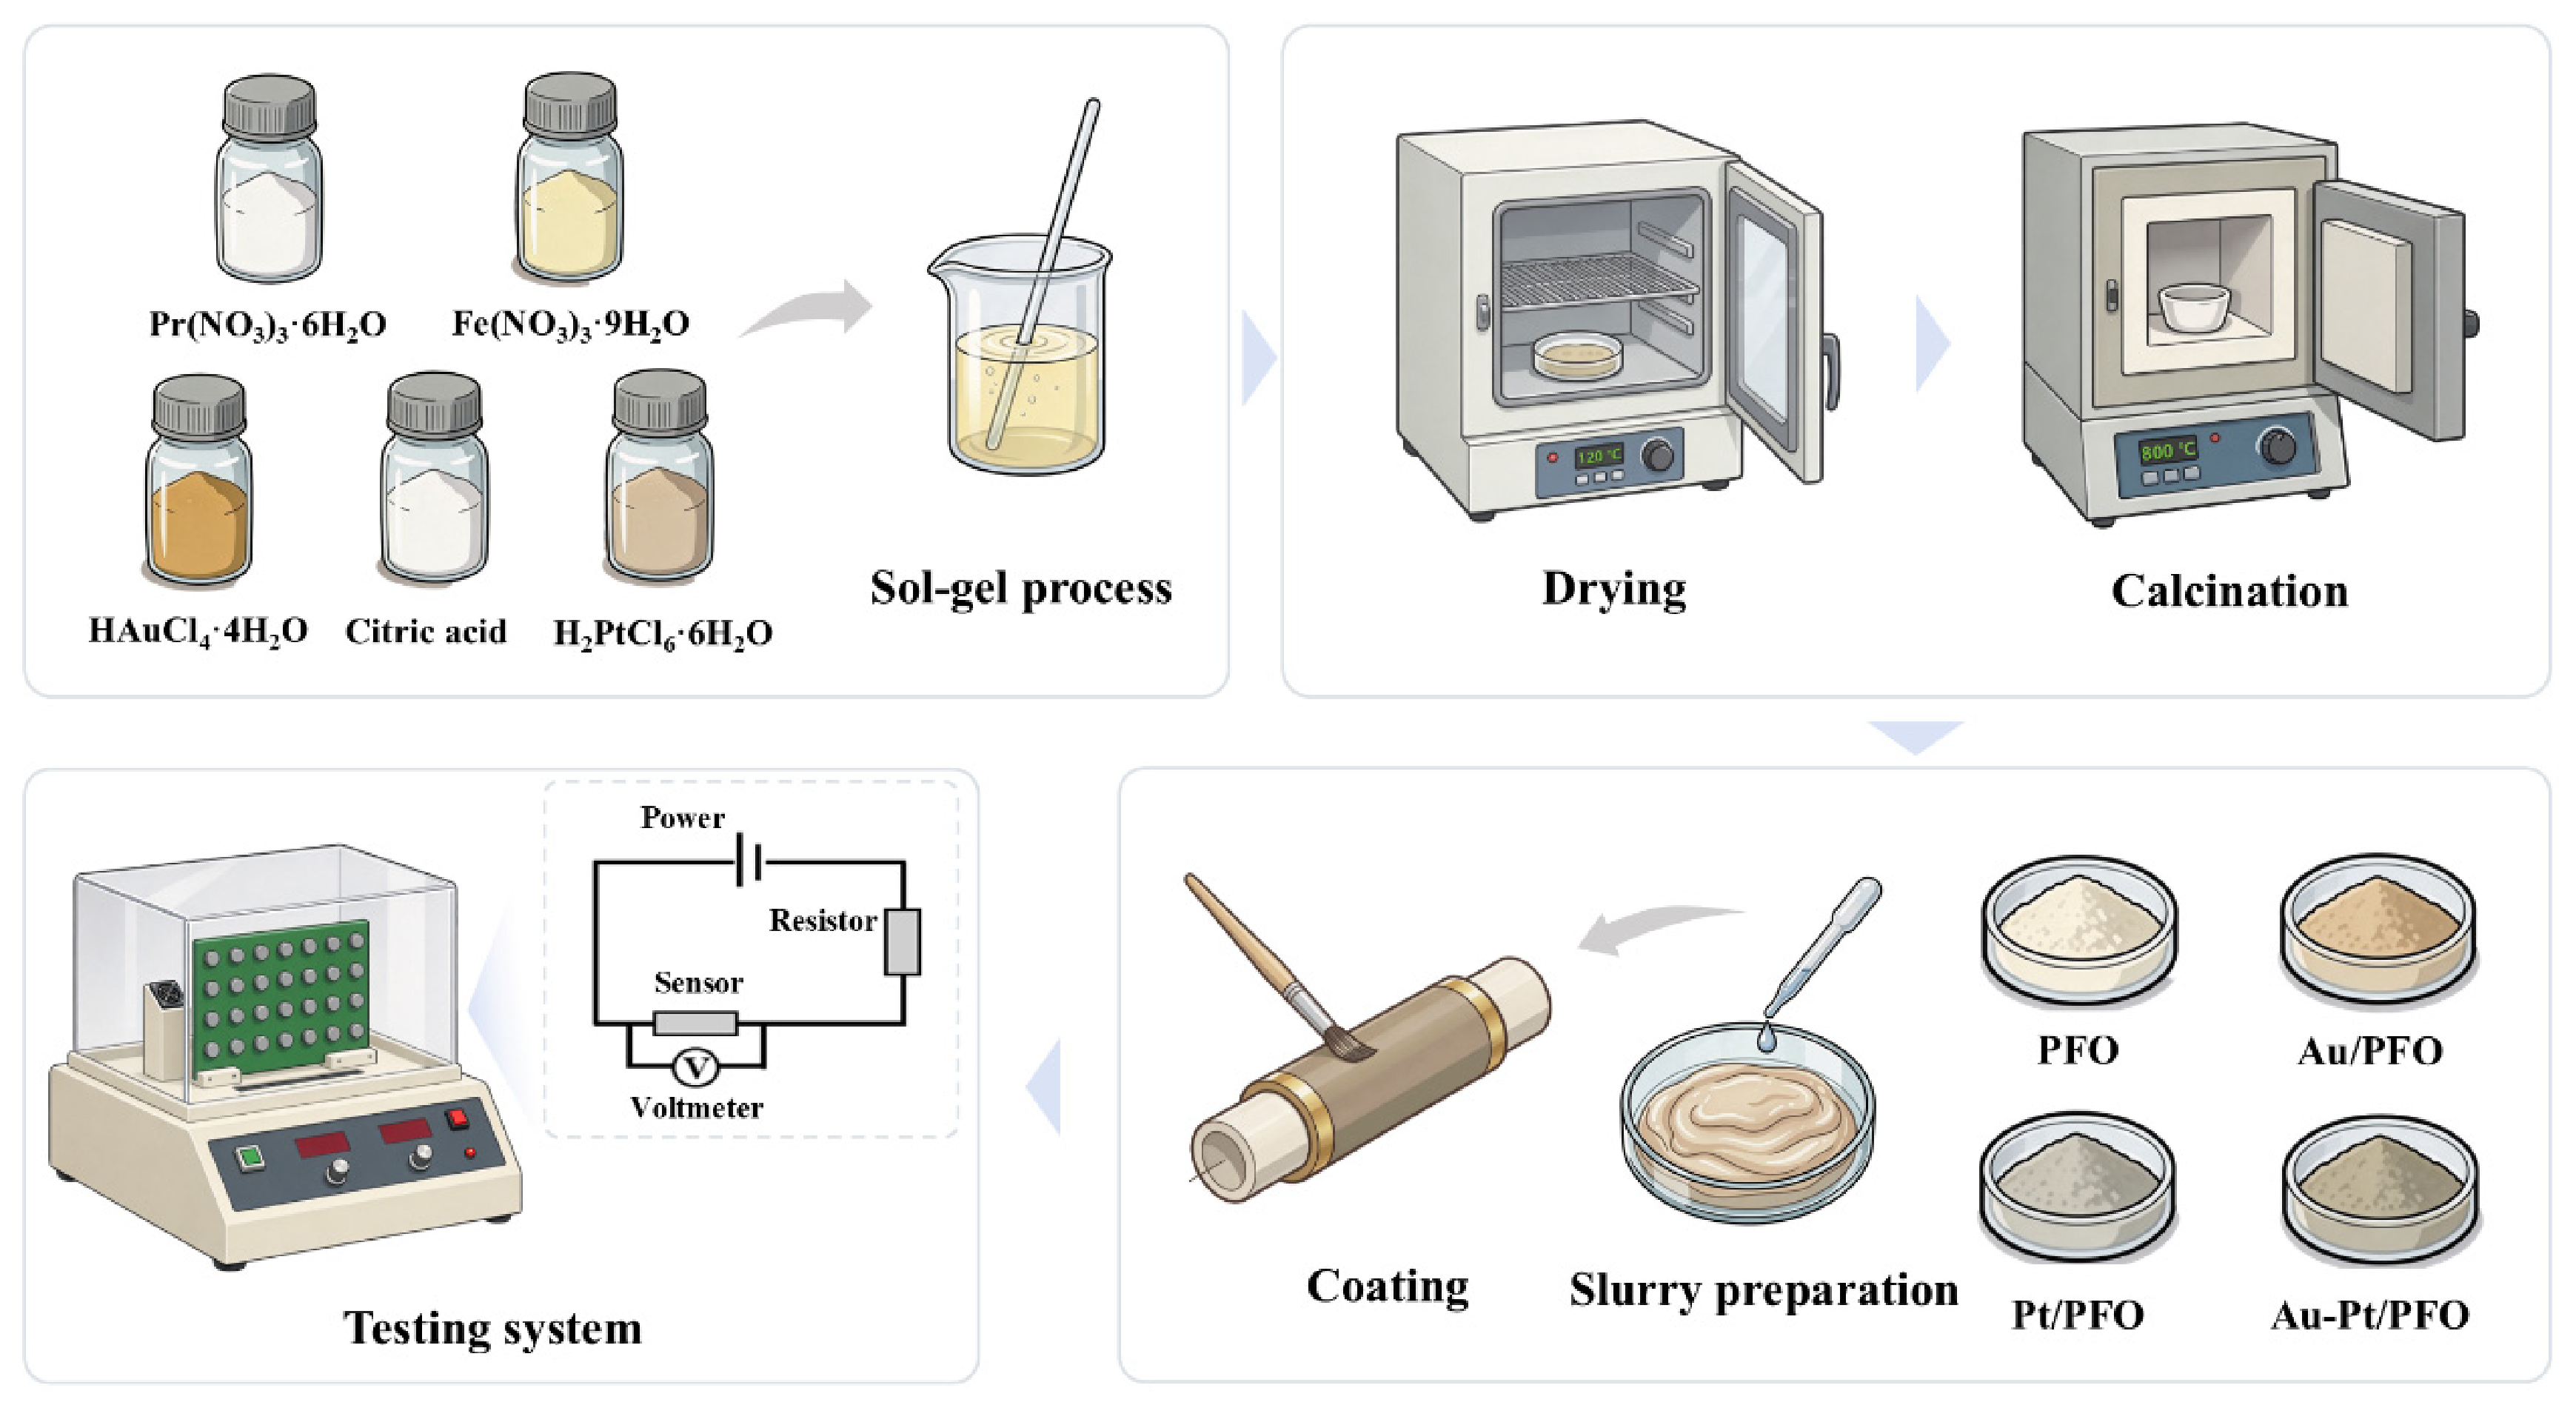
The sensing material powders were mixed with deionized water at a powder-to-water mass ratio of 1:1.5 to form homogeneous slurries, which were uniformly applied to the surfaces of Al2O3 ceramic tubes using a brush. Each ceramic tube was 4 mm in length and 1.2 mm in diameter and was equipped with a pair of prefabricated gold electrodes and platinum lead wires. The resulting sensing films were approximately 300 μm thick and were allowed to dry in air for 4 h after coating. A Ni–Cr heating wire was inserted into each ceramic tube to control the sensor operating temperature. The fabricated sensors were aged in air at 200 °C for 24 h before gas-sensing measurements. All sensors were fabricated and aged under identical conditions. The overall preparation procedure is illustrated in Figure 1.
Figure 1.
Schematic illustration of the sol–gel synthesis of PFO, Au/PFO, Pt/PFO, and Au–Pt/PFO and the fabrication of the corresponding gas sensors. The four materials were prepared without noble-metal precursors, with a Au precursor, with a Pt precursor, and with both precursors, respectively. The resulting powders were formulated into slurries and brush-coated onto the surfaces of alumina ceramic tubes.
2.3. Material Characterization
The phase composition and crystal structure of the materials were analyzed by X-ray diffraction (XRD) using a D8 Advance diffractometer (Bruker, Karlsruhe, Germany) with Cu Kα radiation. The morphology was examined using a Sigma field-emission scanning electron microscope (ZEISS, Oberkochen, Germany), and the elemental distribution was analyzed by energy-dispersive X-ray spectroscopy (EDS). The surface elemental composition and oxidation states were analyzed by X-ray photoelectron spectroscopy (XPS) using an ESCALAB 250Xi spectrometer (Thermo Fisher Scientific, Waltham, MA, USA). All XPS binding energies were charge-corrected by referencing the adventitious carbon C 1s peak to 284.8 eV. Nitrogen adsorption–desorption isotherms were measured using an ASAP 2460 surface area and porosimetry analyzer (Micromeritics, Norcross, GA, USA). Before measurement, the samples were degassed under vacuum at 120 °C for 6 h to remove adsorbed water and volatile impurities. The specific surface areas were calculated using the Brunauer–Emmett–Teller (BET) method, and the pore size distributions were calculated from the adsorption branches of the isotherms using the Barrett–Joyner–Halenda (BJH) method.
2.4. Gas-Sensing Performance Parameters
Gas-sensing measurements were performed using a WS-30A gas-sensing analysis system (Zhengzhou Winsen Electronics Technology Co., Ltd., Zhengzhou, China) equipped with an 18 L test chamber. The measurement circuit supply voltage was set to 5 V. Laboratory air served as the background atmosphere for both baseline measurements and recovery. Routine gas-sensing measurements were conducted at an ambient temperature of 20 °C and a background relative humidity of 20%. Except for the temperature-dependent measurements, the sensor operating temperature was set to 190 °C.
Before each measurement, the sensors were placed in the chamber and preheated at the specified operating temperature until their resistance stabilized, at which point the baseline resistance in air was recorded. CO2 test gas was then introduced into the chamber. After the gas was uniformly mixed and the sensor resistance reached a new steady state, the steady-state resistance in the test atmosphere was recorded. Following gas exposure, the chamber was opened to re-expose the sensors to laboratory air at ambient atmospheric pressure until their resistance stabilized again. The Ni–Cr heating wire remained powered throughout baseline stabilization, gas exposure, and recovery, maintaining the sensors at the same preset operating temperature during each measurement. Resistance changes were continuously recorded throughout the measurements to obtain complete response–recovery curves. Each set of measurements was repeated several times to assess the repeatability of the gas-sensing response.
The sensor response (S) was defined as the ratio of the resistance in the target gas to the baseline resistance in air:
where Rg is the resistance of the sensor when exposed to the target gas, and Ra is its baseline resistance in air.
The response time was defined as the time required for the sensor resistance to complete 90% of the total resistance change following the introduction of the target gas. The recovery time was defined as the time elapsed from chamber opening until 90% of the gas-induced resistance change had been reversed toward the initial baseline in air.
3. Results and Discussion
3.1. Crystal Structure and Elemental Distribution
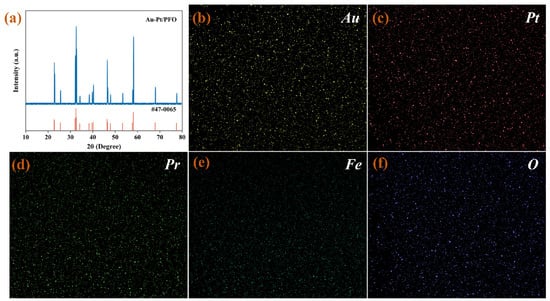
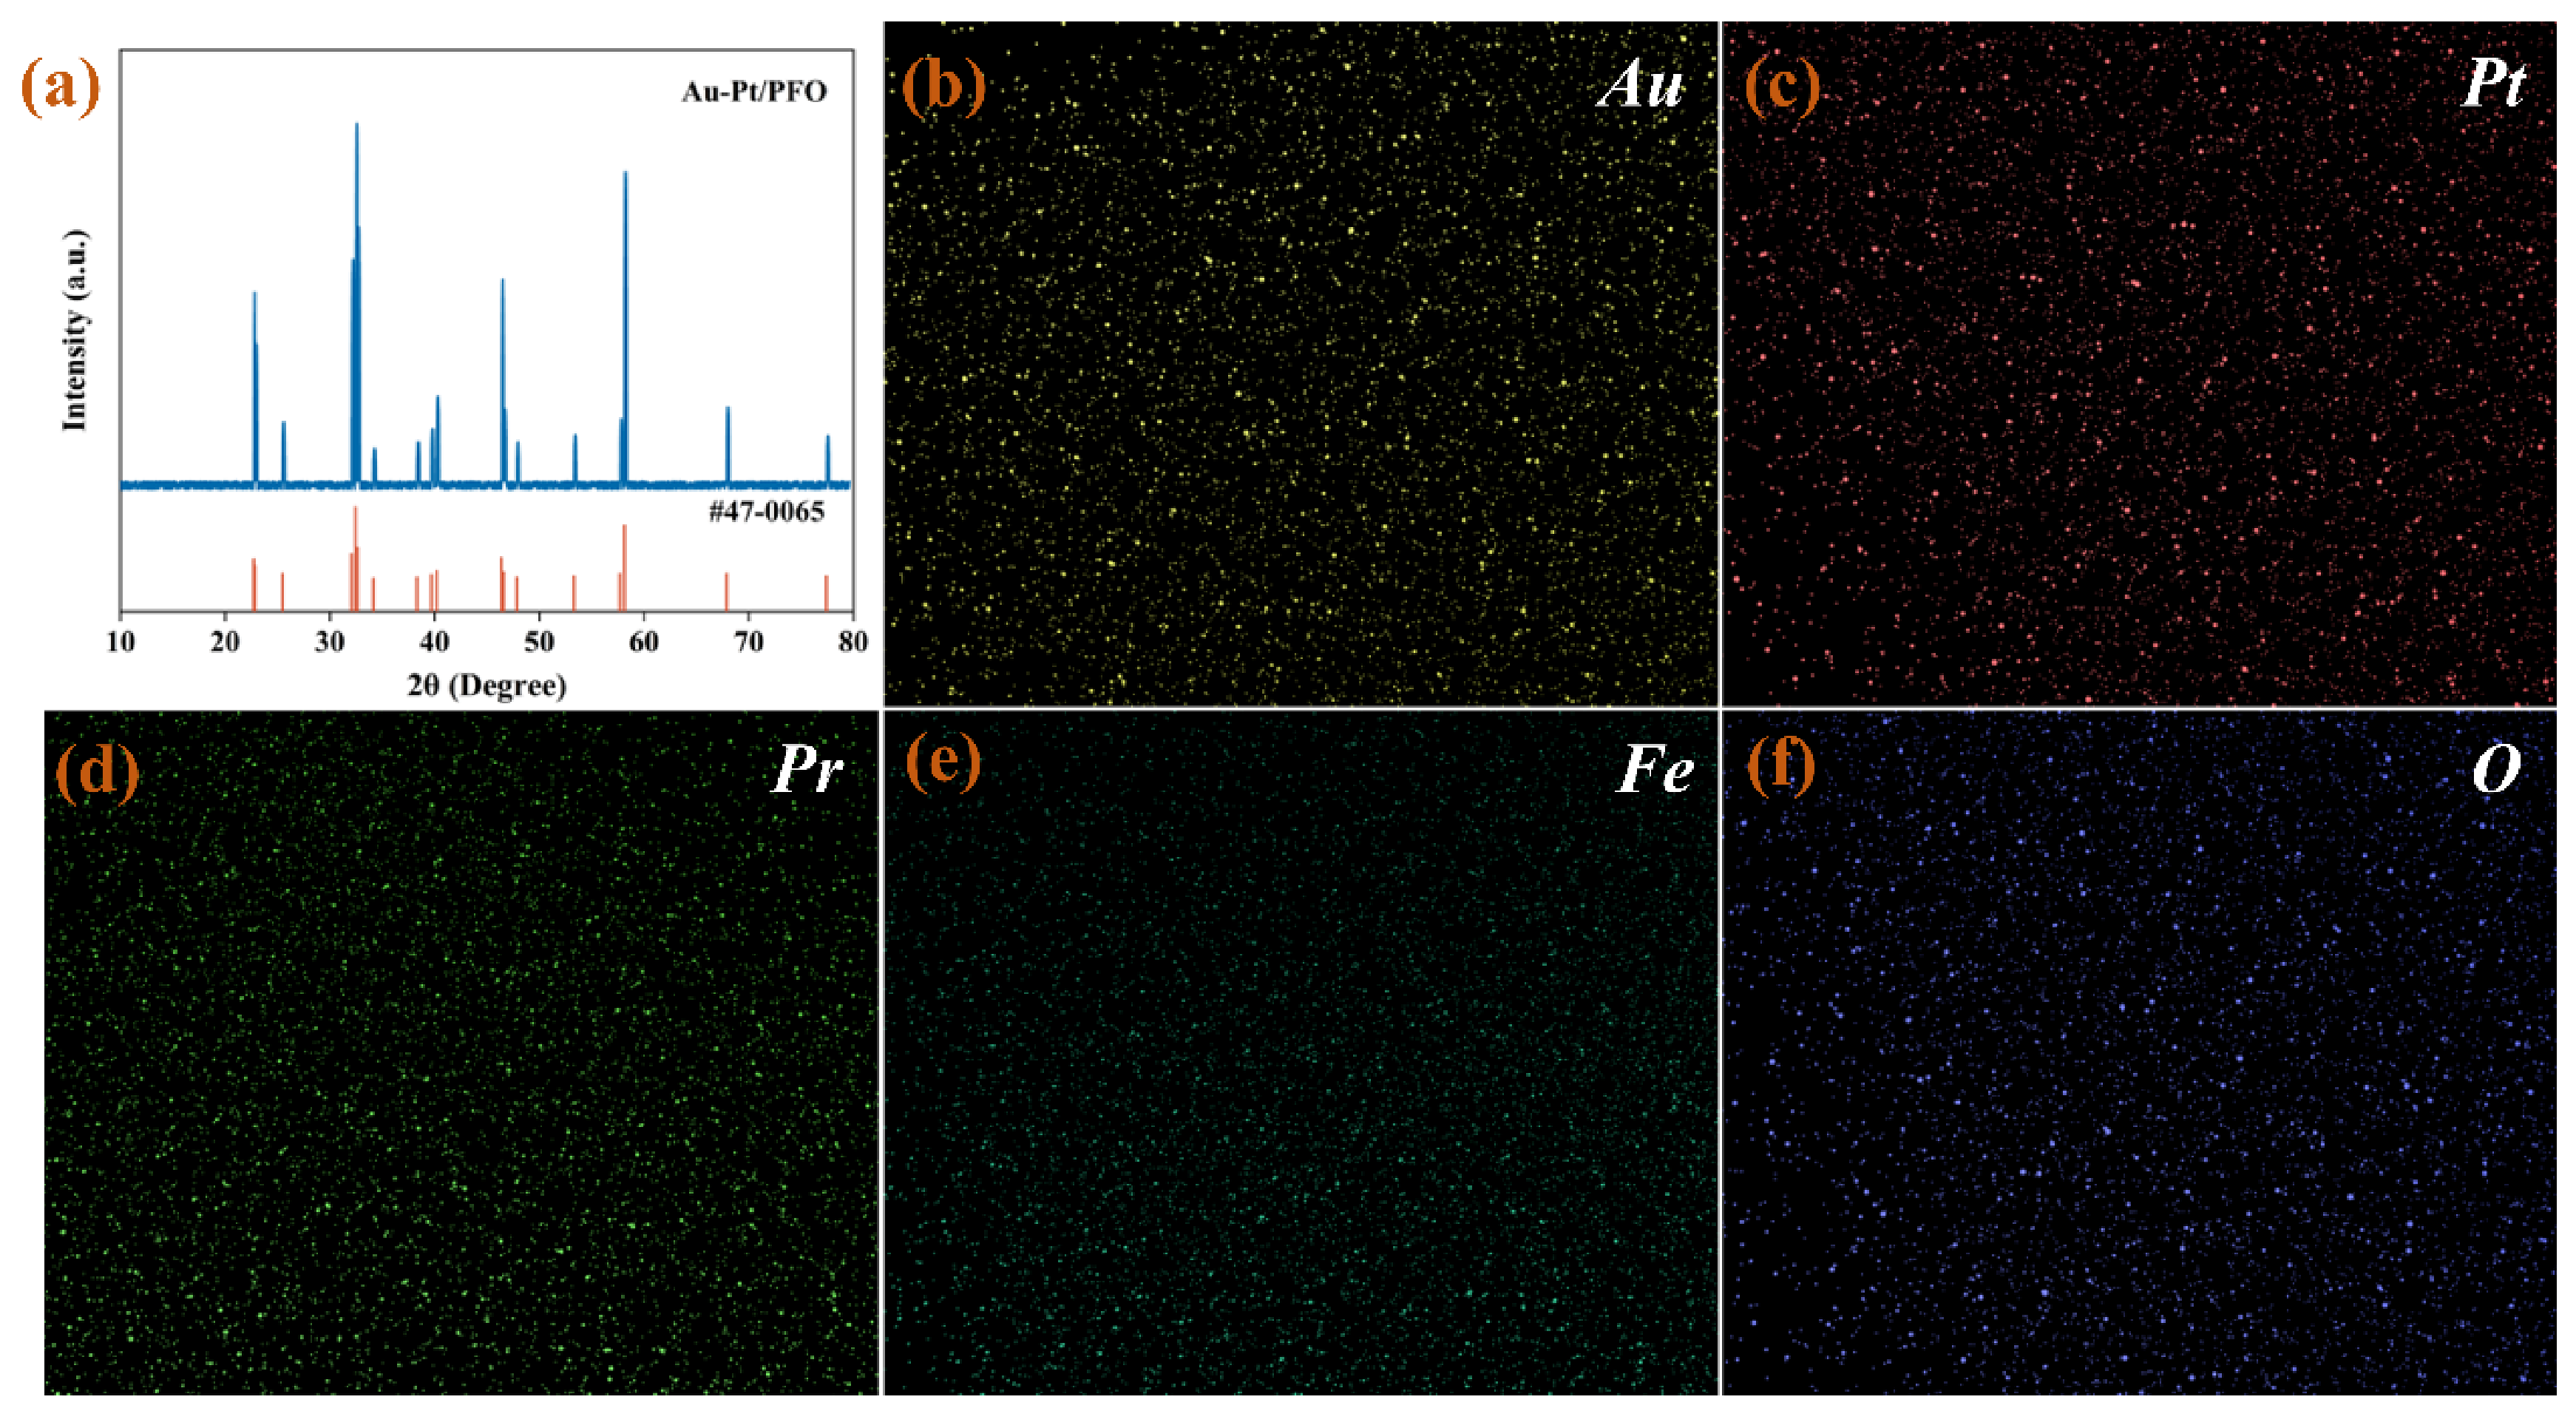
As shown in Figure 2a, the main diffraction peaks of Au–Pt/PFO match the standard diffraction peaks of orthorhombic perovskite PrFeO3 (PDF No. 47-0065), indicating that PrFeO3 is the predominant crystalline phase in the obtained material. The diffraction peaks are well defined and relatively sharp, indicating good crystallinity. No distinct diffraction peaks attributable to Au or Pt were observed, which may be related to the relative contents and dispersion states of the noble-metal species.
Figure 2.
(a) XRD pattern of Au–Pt/PFO and (b–f) EDS elemental maps of Au, Pt, Pr, Fe, and O, respectively.
To further confirm the incorporation of the noble-metal elements, EDS elemental mapping was performed. As shown in Figure 2b–f, Au, Pt, Pr, Fe, and O were detected in the sample. The Au and Pt signals were distributed relatively uniformly throughout the examined region, with no apparent localized enrichment. These results indicate that Au and Pt were successfully introduced into the material, while PrFeO3 remained the predominant crystalline phase.
3.2. Surface Chemical State Analysis
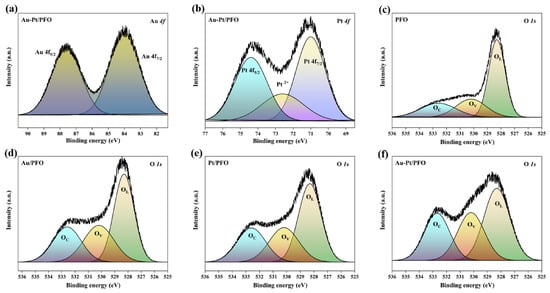
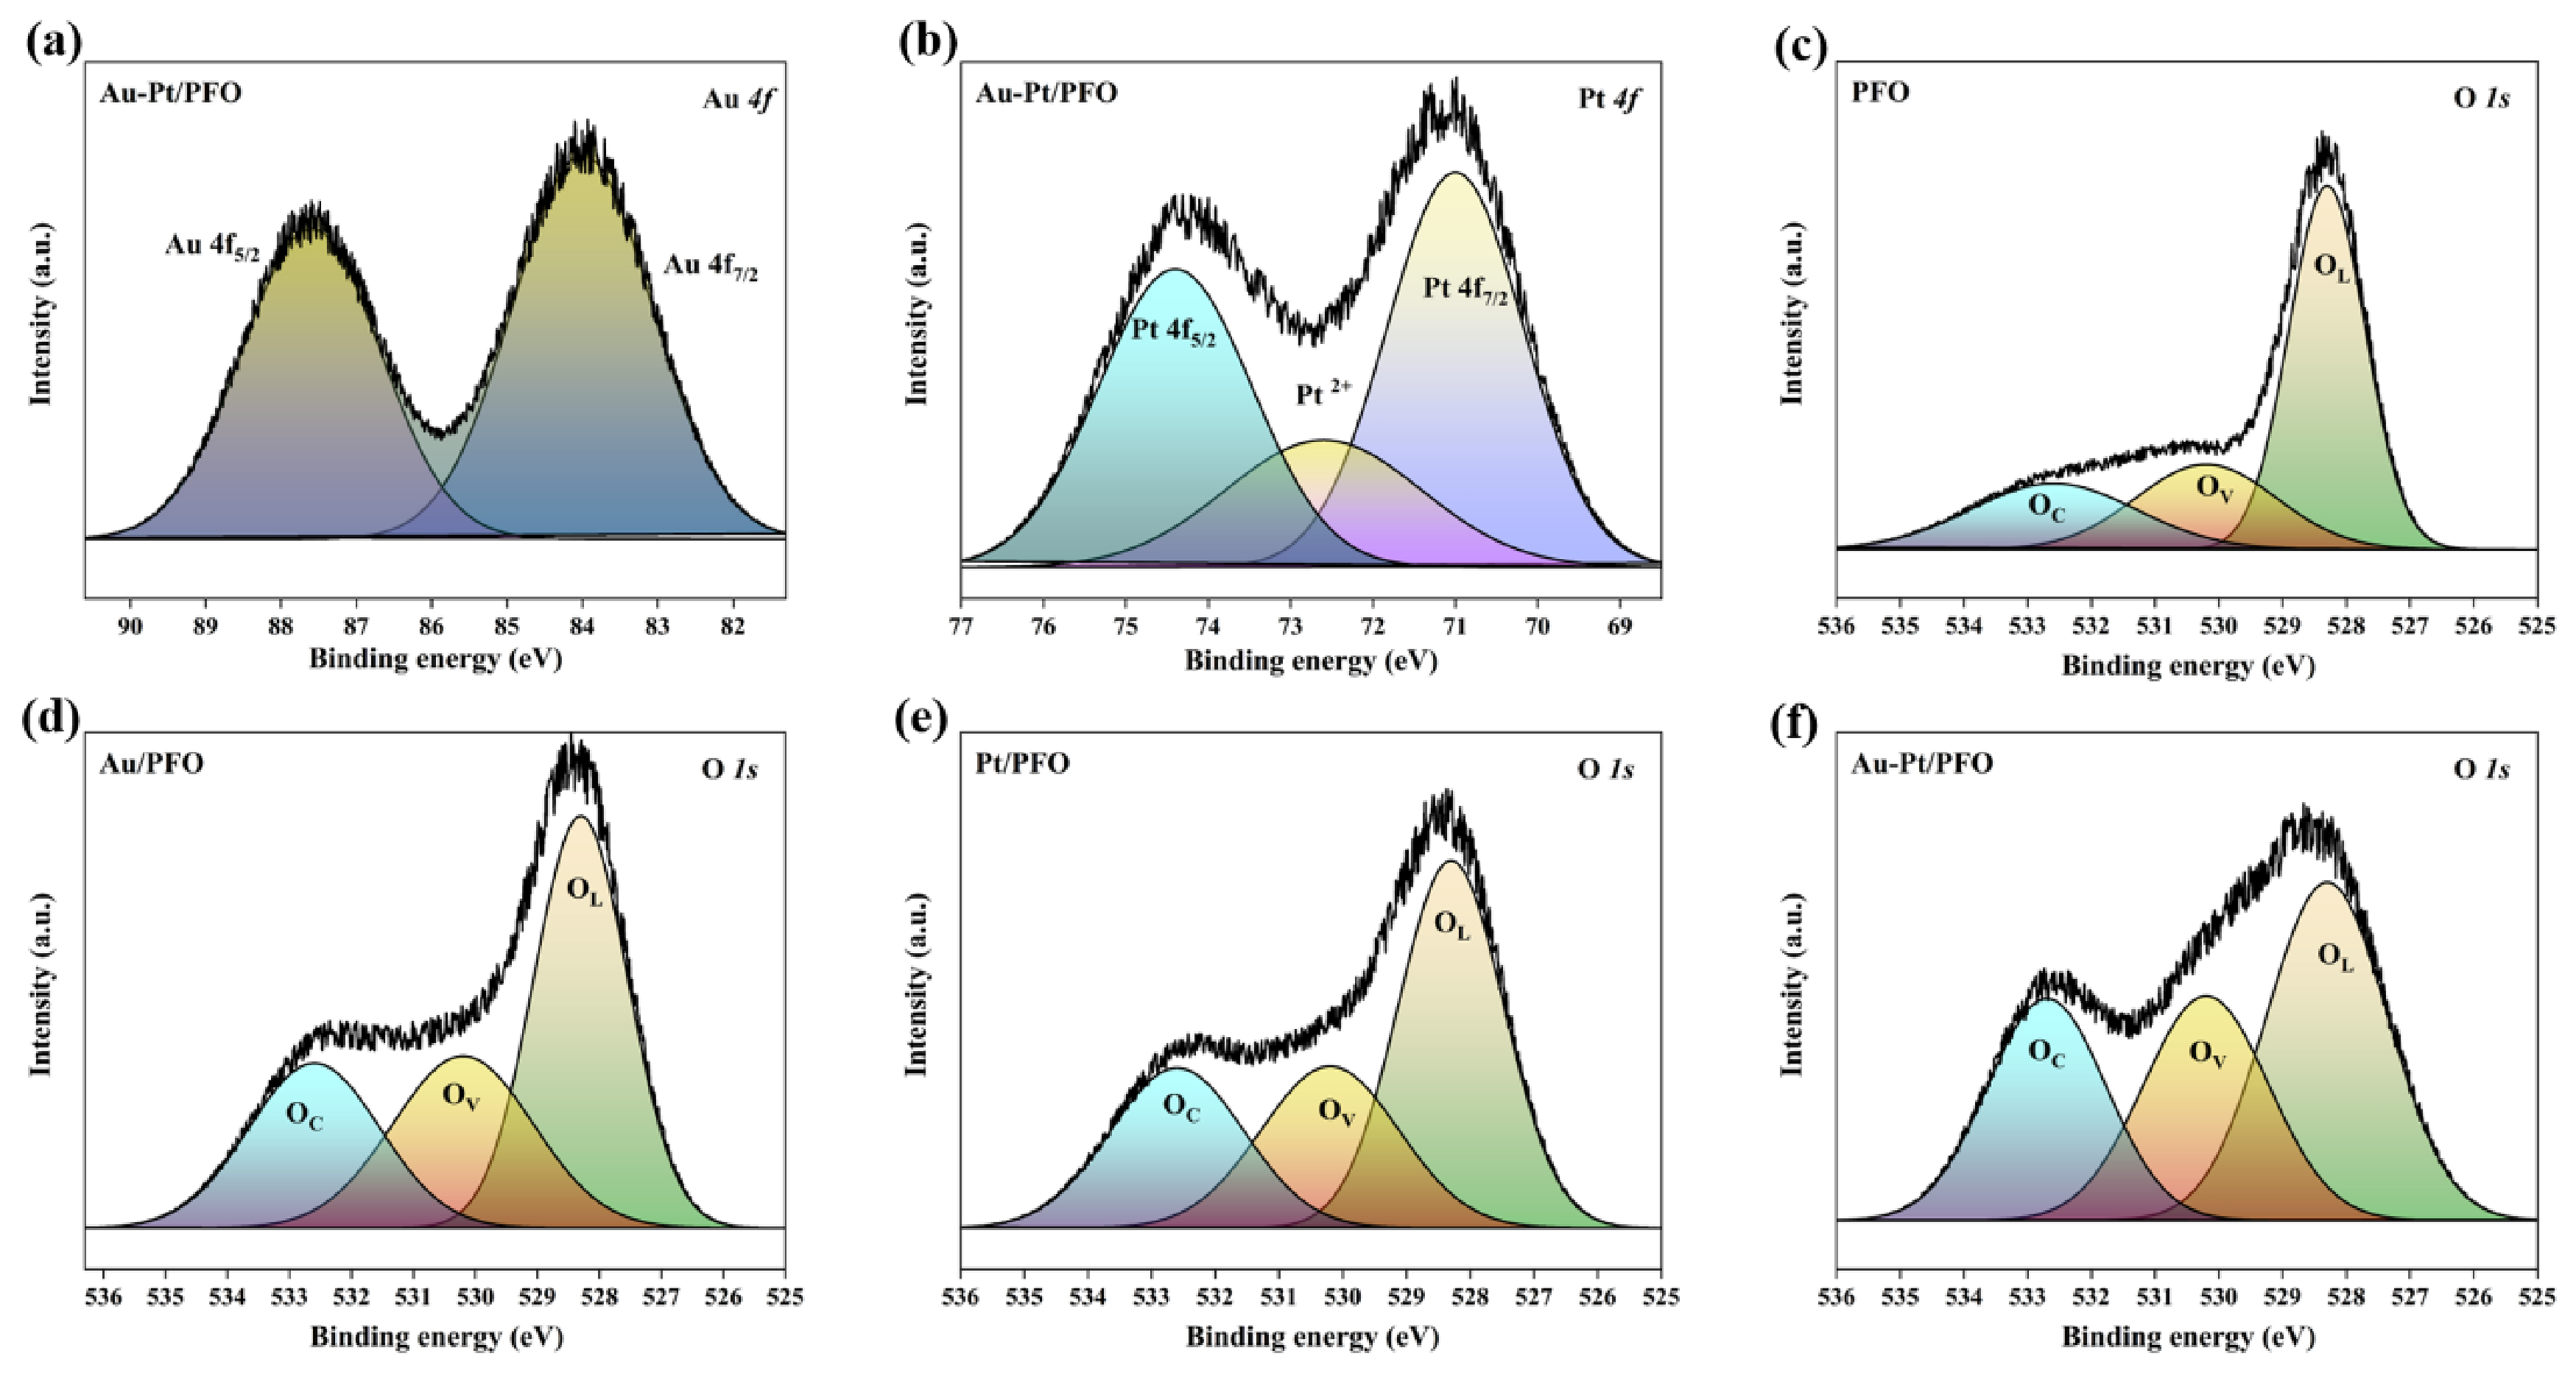
XPS characterization was performed to further examine the effects of noble-metal modification on the surface chemical states of the materials (Figure 3). Distinct signals were observed in the Au 4f and Pt 4f regions of Au–Pt/PFO (Figure 3a,b), consistent with the EDS elemental analysis results.
Figure 3.
High-resolution (a) Au 4f and (b) Pt 4f XPS spectra of Au–Pt/PFO; high-resolution O 1s XPS spectra and the corresponding peak-fitting results for (c) PFO, (d) Au/PFO, (e) Pt/PFO, and (f) Au–Pt/PFO.
Figure 3c–f present the high-resolution O 1s spectra and the corresponding fitting results for PFO, Au/PFO, Pt/PFO, and Au–Pt/PFO. Each spectrum was fitted with three components, designated OL, OV and OC. The low-binding-energy OL component is assigned to lattice O2− in the metal–oxygen framework of PrFeO3, representing oxygen in Fe–O and Pr–O coordination environments [26]. This component dominates the O 1s spectrum of PFO, indicating that its spectral features are primarily contributed by lattice oxygen. Following individual Au or Pt modification and Au–Pt co-modification, the OL component remains clearly identifiable, while the surface-related signals on its higher-binding-energy side become more prominent.
The intermediate-binding-energy component, OV, can be associated with contributions from surface-adsorbed oxygen [12,27]. Oxygen bound at surface sites has local bonding and electronic environments different from those of lattice oxygen, giving rise to a spectral component distinct from OL. The signal associated with OV is relatively weak in PFO. Following modification with Au or Pt alone, this component becomes more pronounced relative to OL, and the change is more evident in Au–Pt/PFO. These differences reflect changes in the surface-adsorbed-oxygen-related signals following noble-metal modification and provide a qualitative basis for comparing the surface oxygen adsorption states of the samples.
The higher-binding-energy component, OC, can include contributions from surface hydroxyl groups, adsorbed water, and related oxygen-containing adsorbates [12,26,27]. Hydroxyl-related oxygen reflects the bonding environments formed through surface hydroxylation, while adsorbed water contributes to signals at higher binding energies. Accordingly, OC primarily describes the spectral features associated with these oxygen-containing surface adsorption layers. Compared with PFO, Au/PFO and Pt/PFO exhibit more pronounced OC shoulders, and this component is also more prominent relative to the lattice-oxygen peak in Au–Pt/PFO. Together with the changes in OV, these observations indicate that the differences in the O 1s spectral profiles following noble-metal modification are mainly associated with changes in adsorption-related components relative to the lattice-oxygen signal, with more pronounced surface oxygen-related signals observed for the Au–Pt-co-modified sample.
3.3. Morphology and Pore Structure Analysis
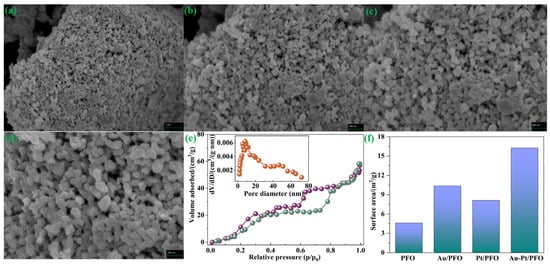
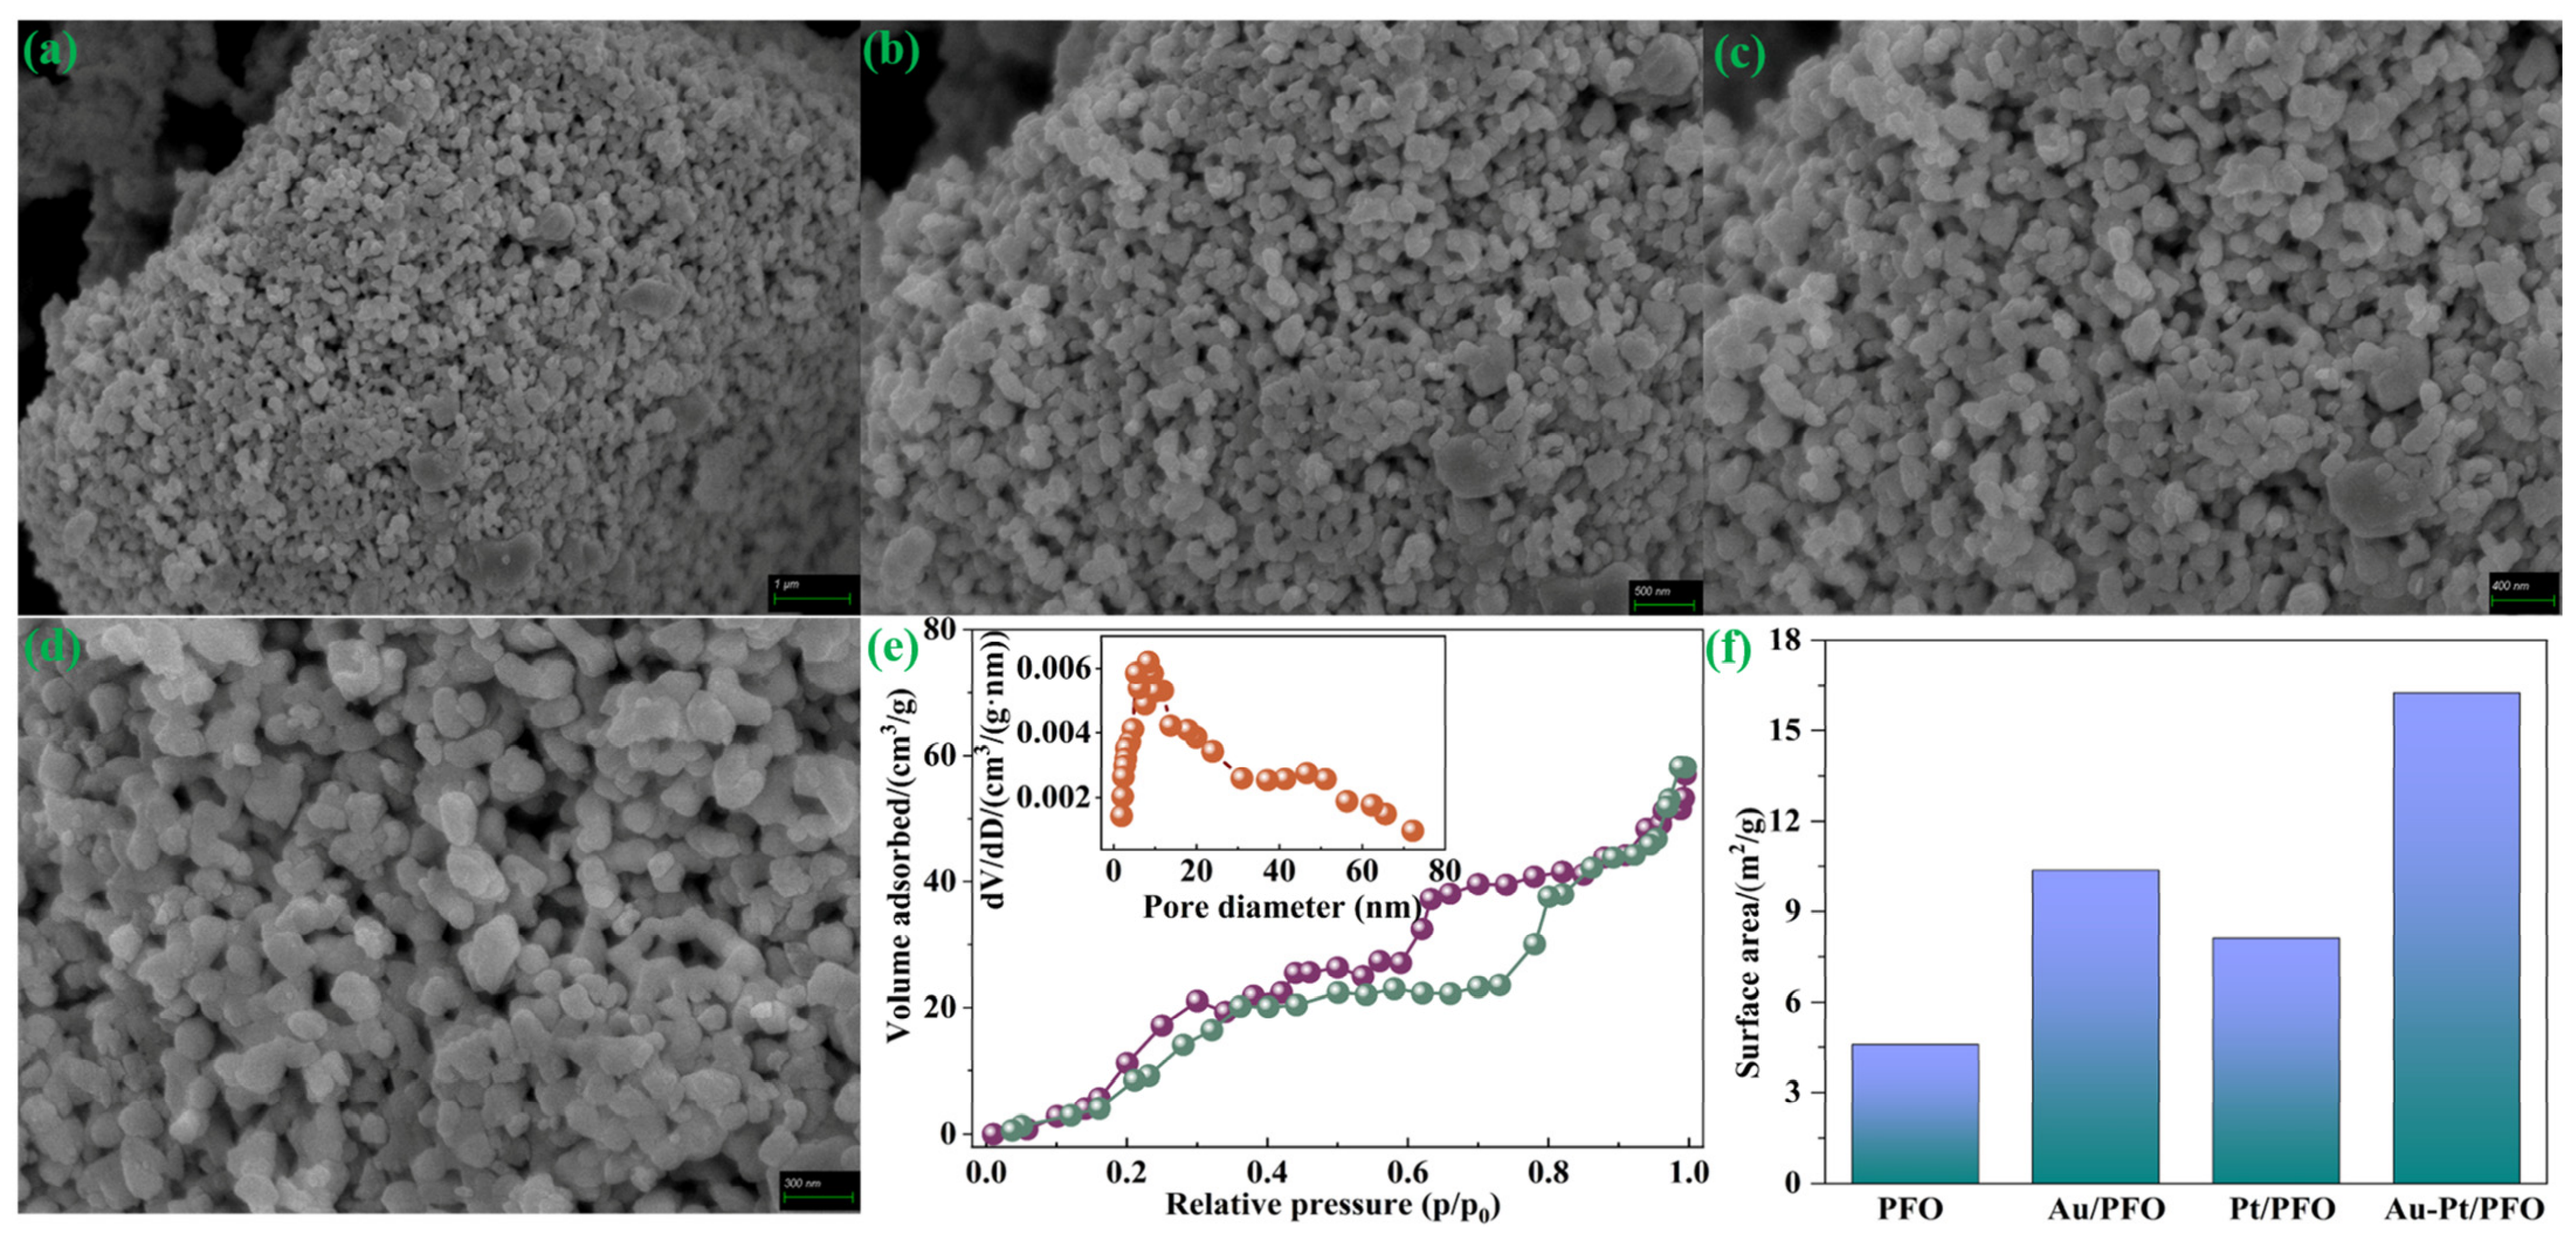
Figure 4a–d show the SEM images of Au–Pt/PFO at different observation scales with scale bars of 1 μm, 500 nm, 400 nm and 300 nm, respectively. The material consists of nearly spherical and irregular particles that contact and stack with one another to form aggregates, possessing a relatively rough overall surface. Further observation reveals abundant interstices between particles, forming a packing structure with interparticle pores, which creates spatial conditions for gas molecules to access the material surface.
Figure 4.
(a–d) SEM images of Au–Pt/PFO with scale bars of 1 μm, 500 nm, 400 nm and 300 nm, respectively; (e) Nitrogen adsorption–desorption isotherm of Au–Pt/PFO, inset: pore size distribution; (f) Comparison of BET specific surface areas of PFO, Au/PFO, Pt/PFO and Au–Pt/PFO.
Figure 4e presents the nitrogen adsorption–desorption isotherm and pore size distribution of Au–Pt/PFO. The adsorption capacity increases with rising relative pressure, and an obvious hysteresis loop exists between the adsorption and desorption branches. The inset shows that the main peak of pore size distribution is located at approximately 8–10 nm and extends toward larger pore sizes, demonstrating the mesoporous nature and broad pore size distribution of the material. Combined with the particle stacking and interparticle pores observed by SEM, these results characterize the porous structure of Au–Pt/PFO.
As shown in Figure 4f, the BET specific surface areas of PFO, Au/PFO, Pt/PFO and Au–Pt/PFO are 4.59, 10.37, 8.12 and 16.26 m2/g, respectively. All noble-metal-modified samples exhibit higher specific surface areas than pristine PFO. Among them, Au–Pt/PFO delivers the highest specific surface area, around 3.54 times that of PFO. The high specific surface area together with interparticle pores facilitates the contact between gas molecules and the material surface, providing structural support for the CO2 gas-sensing response of Au–Pt/PFO.
3.4. CO2 Gas-Sensing Performance
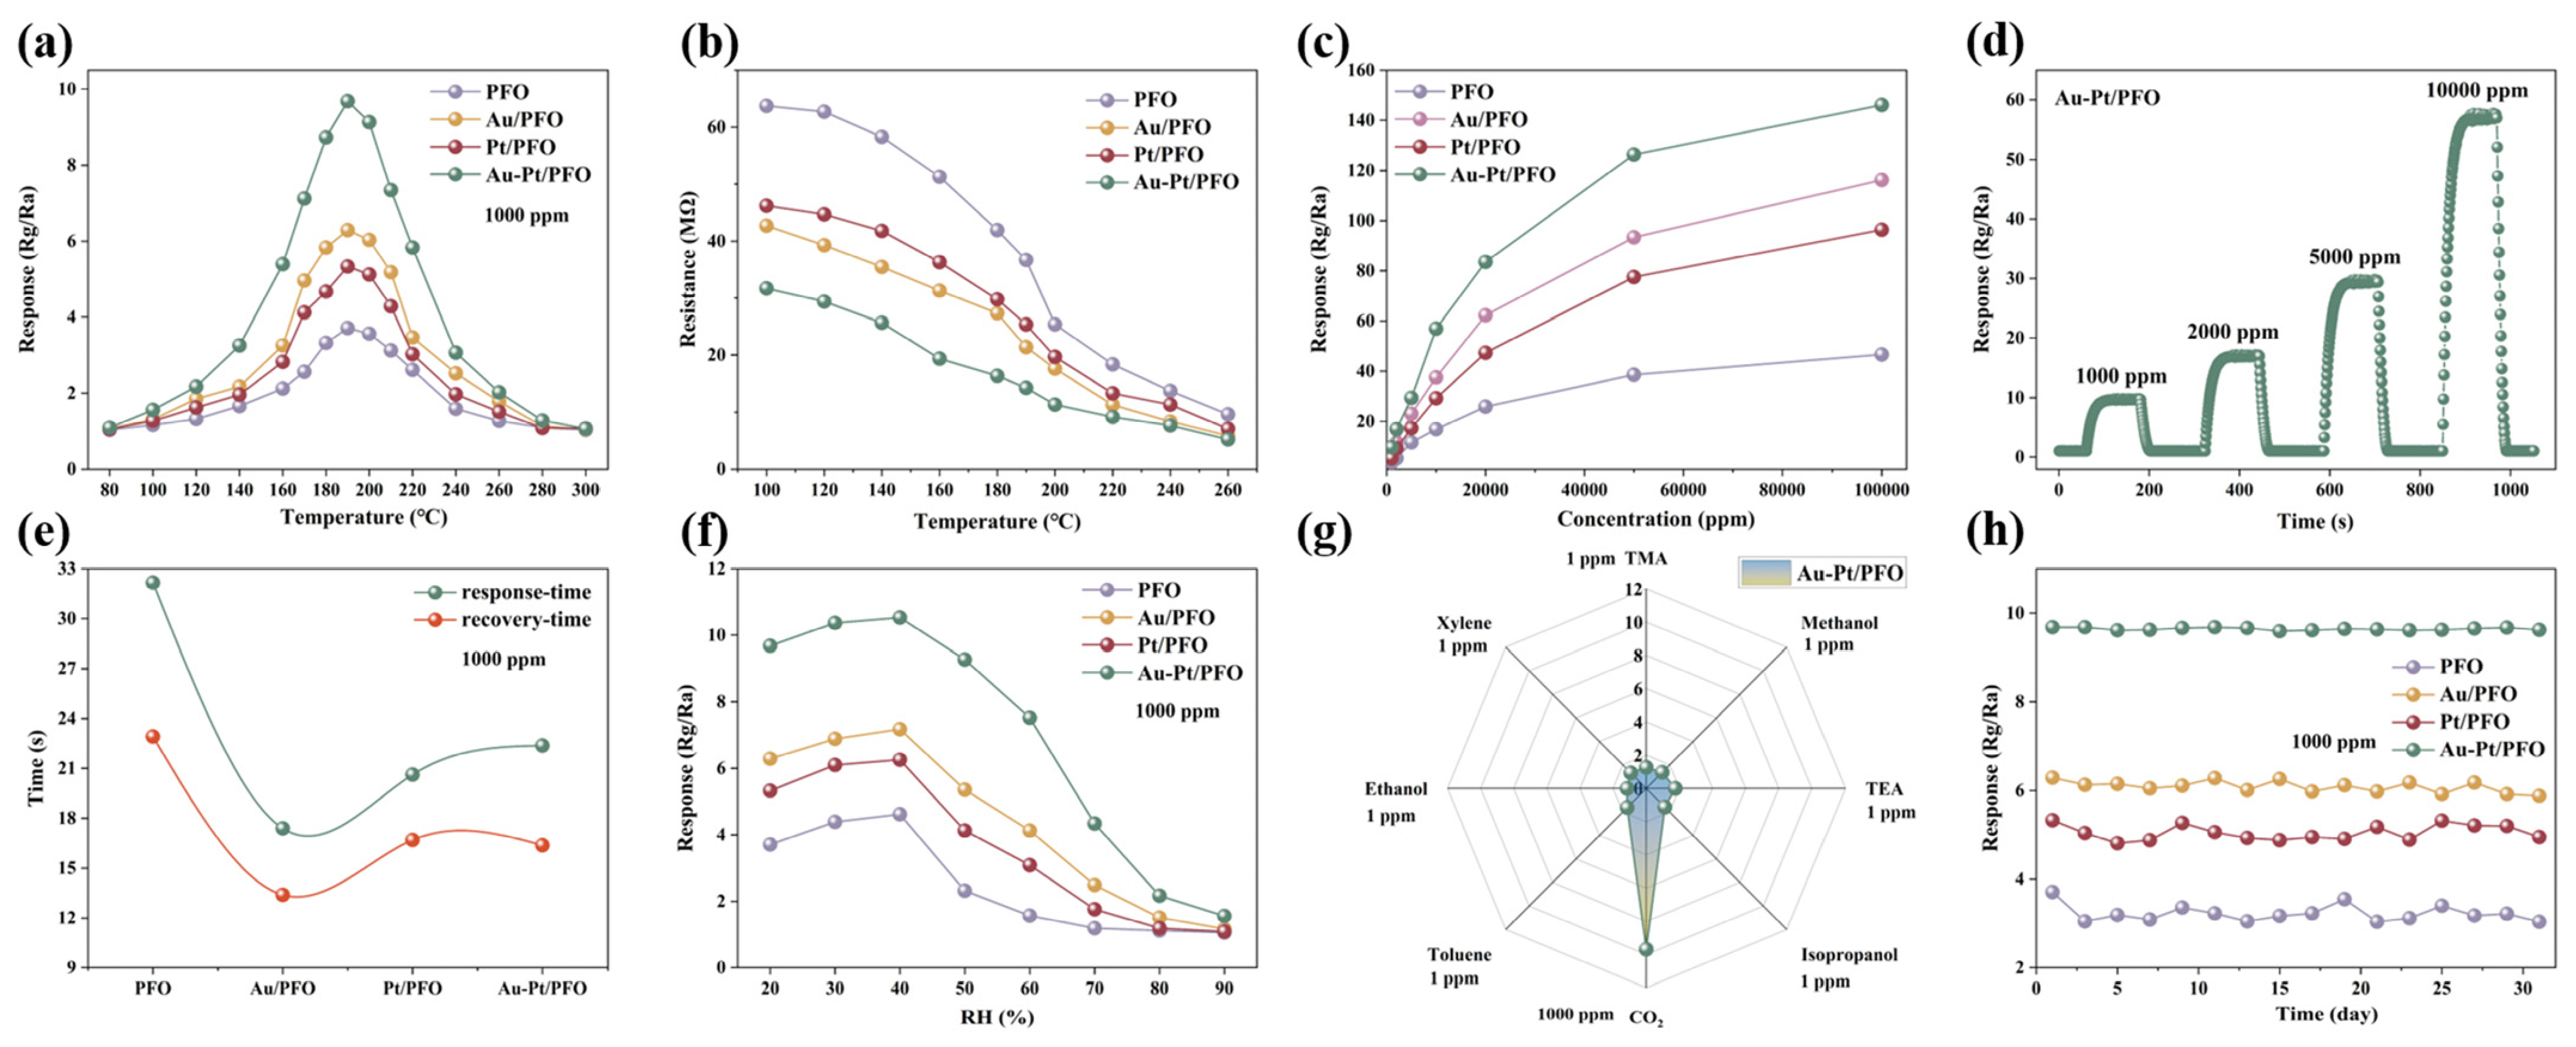
To determine the optimal operating temperature, the responses of the four materials to 1000 ppm CO2 were compared over a temperature range of 80–300 °C. As shown in Figure 5a, the responses of all four sensors initially increased and then decreased with increasing temperature, reaching their maximum values at 190 °C. At this temperature, the response values of PFO, Au/PFO, Pt/PFO, and Au–Pt/PFO were 3.71, 6.29, 5.33, and 9.68, respectively. The response of Au–Pt/PFO was 2.61, 1.54, and 1.82 times those of PFO, Au/PFO, and Pt/PFO, respectively, representing the highest CO2 response among the four materials. These results indicate that modification with Au or Pt alone enhanced the CO2 response of PrFeO3, while bimetallic co-modification further increased the response magnitude. Accordingly, 190 °C was identified as the optimal operating temperature for all four sensors under the investigated conditions.
Figure 5.
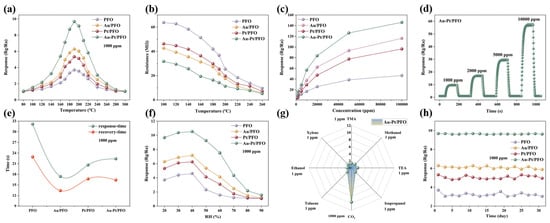
Gas-sensing performance of the PFO, Au/PFO, Pt/PFO, and Au–Pt/PFO sensors: (a) CO2 response as a function of operating temperature; (b) baseline resistance in air as a function of operating temperature; (c) response versus CO2 concentration over the range of 1000–100,000 ppm; (d) dynamic response–recovery curves of Au–Pt/PFO upon exposure to 1000, 2000, 5000, and 10,000 ppm CO2; (e) response and recovery times to CO2; (f) effect of relative humidity on the CO2 response; (g) responses of Au–Pt/PFO to different gases, with CO2 tested at 1000 ppm and all other gases at 1 ppm; and (h) long-term response stability over 31 days. Measurements in (c–h) were performed at 190 °C. The CO2 concentration in (a,e,f,h) was 1000 ppm.
Figure 5b shows the variation in the baseline resistance Ra of the four sensors in air as a function of operating temperature. Over the range of 100–260 °C, the baseline resistance of each sensor decreased continuously with increasing temperature, exhibiting a negative temperature coefficient of resistance consistent with thermally activated conduction in this p-type semiconductor system. At the same operating temperature, the baseline resistances consistently followed the order PFO > Pt/PFO > Au/PFO > Au–Pt/PFO. At 190 °C, the baseline resistances of PFO, Au/PFO, Pt/PFO, and Au–Pt/PFO were 36.69, 21.36, 25.34, and 14.26 MΩ, respectively. These results indicate that both single-metal modification and bimetallic co-modification reduced the baseline resistance of the devices, with the most pronounced change observed for the co-modified sample. Together with the results in Figure 5a, these findings show that Au–Pt co-modification enhanced the CO2 response while also substantially altering the baseline resistance of the sensor.
Figure 5c shows the responses of the four sensors to different CO2 concentrations at 190 °C. As the CO2 concentration increased from 1000 to 100,000 ppm, the responses of all four sensors progressively increased. At each tested concentration, Au–Pt/PFO exhibited a higher response than PFO, Au/PFO, and Pt/PFO. The response values of Au–Pt/PFO at 1000, 2000, 5000, 10,000, 20,000, 50,000, and 100,000 ppm were 9.68, 16.92, 29.37, 56.92, 83.57, 126.36, and 146.09, respectively, indicating that Au–Pt co-modification enhanced the CO2 response of PrFeO3 throughout the investigated concentration range. Furthermore, the slopes of the curves gradually decreased in the high-concentration region, indicating that the responses increased more slowly with further increases in CO2 concentration. This behavior may be associated with the progressive occupation of available surface adsorption sites and a reduction in the additional charge modulation induced by further increases in CO2 concentration. Figure 5d further illustrates the dynamic response–recovery behavior at these four concentrations (1000, 2000, 5000, 10,000 ppm). Upon CO2 introduction, the sensor response increased rapidly and gradually reached a steady state; upon re-exposure to laboratory air, it returned toward its initial baseline.
Figure 5e compares the response and recovery times of the four sensors for 1000 ppm CO2 at 190 °C. The response times of PFO, Au/PFO, Pt/PFO, and Au–Pt/PFO were 32.17, 17.39, 20.62, and 22.38 s, respectively, while their recovery times were 22.92, 13.39, 16.69, and 16.37 s, respectively. Both the response and recovery times of Au–Pt/PFO were shorter than those of PFO, indicating that Au–Pt co-modification improved the response–recovery performance of the material while enhancing its CO2 response magnitude. Compared with Au/PFO, Au–Pt/PFO exhibited longer response and recovery times. Compared with Pt/PFO, it exhibited a longer response time but a slightly shorter recovery time. Considering these results together with the response magnitudes, Au–Pt/PFO combined the highest CO2 response among the four materials with faster response and recovery than unmodified PFO, demonstrating a simultaneous improvement in response magnitude and dynamic performance.
Figure 5f shows the responses of the four sensors to 1000 ppm CO2 at 190 °C as a function of relative humidity (RH). Over the range of 20–90% RH, the responses of all four sensors initially increased and then decreased, reaching their maximum values at 40% RH. Specifically, the response of Au–Pt/PFO increased from 9.68 at 20% RH to 10.53 at 40% RH, before gradually decreasing with further increases in humidity and reaching 1.56 at 90% RH. At all tested humidity levels, Au–Pt/PFO exhibited a higher response than PFO, Au/PFO, and Pt/PFO. This initial increase followed by a decrease may be associated with the dual influence of water on surface processes in the materials. At lower humidity levels, moderate amounts of adsorbed water and the associated surface hydroxyl groups may facilitate CO2 adsorption and surface interactions, thereby enhancing the response. As humidity increases further, competitive adsorption of water may occupy more surface sites, reducing the number of effective sites available for interaction with CO2 and consequently decreasing the response [28]. These results indicate that ambient humidity is an important factor affecting the CO2 response of this material system.
Figure 5g shows the responses of the Au–Pt/PFO sensor to CO2 and other tested gases at 190 °C. CO2 was tested at 1000 ppm, whereas all other gases were tested at 1 ppm. Under these conditions, the response of Au–Pt/PFO to CO2 was 9.68, substantially higher than the responses of 1.16–1.76 obtained for the other tested gases.
Figure 5h presents the response variations in the four sensors to 1000 ppm CO2 measured every other day over the 31-day test period. Taking the response obtained on Day 1 as 100%, the response retention ranges of PFO, Au/PFO, Pt/PFO and Au–Pt/PFO are 81.94–100%, 93.48–100%, 90.24–100% and 99.07–100%, respectively. Au–Pt/PFO maintains minor response fluctuations throughout the entire test period, with a response retention of 99.38% on Day 31. Compared with the other three materials, Au–Pt/PFO exhibits a narrower range of response variation, which demonstrates that the Au–Pt co-modified material delivers favorable long-term stability toward CO2.
To further evaluate the CO2-sensing performance of Au–Pt/PFO, Table 1 compares it with representative materials reported in the literature. At a CO2 concentration of 1000 ppm, Au-Pt/PFO exhibited a response of 9.68, the highest among the compared materials. Combined with the above control results of the unmodified, single-metal modified and bimetallic modified materials, Au–Pt co-modification achieves comprehensive improvements in the response magnitude and response–recovery kinetics of PFO, which provides a material foundation for subsequent CO2 detection in practical gas samples.
Table 1.
Comparison of the CO2 sensing performance of Au–Pt/PFO with representative metal–oxide sensing materials reported in the literature.
3.5. SVR-Assisted Calibration for Practical Gas Samples
To investigate the CO2 detection capability of the Au–Pt/PFO sensor in gas samples from real biological processes, short-term respiratory gas samples generated by imbibed rice seeds were selected for verification in this work. Twenty grams of rice seeds were soaked in clean water at room temperature for 4 h. After draining the free surface water, the seeds were placed in a sealed container for 10 h to accumulate gas, and the gas samples were collected using gas bags. The collected gas samples were measured with the Au–Pt/PFO sensor. The CO2 concentrations were calculated based on the response–concentration calibration relationship established using standard CO2 gas. Meanwhile, the CO2 concentrations in the same batches of gas samples were measured by the spectroscopic method as reference results.
As shown in Rows 1 and 2 of Table 2, the CO2 concentrations of the two batches of gas samples obtained by conventional response calibration were 8653 and 9621 ppm, while the corresponding spectroscopic reference concentrations were 4326 and 4932 ppm. The absolute values of relative error were 100.02% and 95.07%, respectively. The concentrations determined by the sensor for both batches of gas samples were higher than the spectroscopic reference values, demonstrating substantial quantitative deviations when conventional response calibration was applied to real gas sample measurement.
Table 2.
Determination Results and Errors of CO2 Concentration in Gas Samples from Rice Seed Respiration.
To further realize quantitative conversion from sensing signals to CO2 concentrations, multi-parameter information extracted from the response–recovery curves of the Au–Pt/PFO sensor was used to construct a support vector regression (SVR) model, establishing the mapping relationship between sensing features and CO2 concentrations. By comparison with the conventional response calibration method, the improvement in concentration prediction brought by multi-parameter modeling was evaluated. Combined with short-term respiratory gas samples from imbibed rice seeds, the quantitative detection performance of this method was examined in real samples.
Seven features were extracted from the complete response–recovery curves of the Au–Pt/PFO sensor, namely the response value (S), response time (tr), recovery time (td), maximum response rate (Vr,max), maximum recovery rate (Vd,max), normalized response integral area (Jr), and normalized recovery integral area (Jd). The response value characterizes the magnitude of resistance variation induced by gas exposure. The response and recovery times reflect the kinetic features of the sensing process. The maximum rates describe the rapid variation degree during the two stages, and the integral areas characterize the overall curve features of the corresponding stages. The above parameters collectively form the input feature vector of the model:
x = [S, tr, td, Vr,max, Vd,max, Jr, Jd]T
Considering the nonlinear relationship between sensing features and CO2 concentration as well as the sample size in this work, an SVR model with the radial basis function (RBF) kernel was constructed for concentration prediction. SVR uses the kernel function to describe the nonlinear mapping between input features and target concentrations and applies regularization to constrain model complexity, offering a regression approach for multi-parameter assisted calibration. Its prediction function is expressed as
where n is the number of training samples, xi represents the feature vector of the i-th training sample, ai and are Lagrange multipliers obtained during training, and b is the bias term. The RBF kernel function is written as
where γ is the kernel parameter controlling the influence of distances between feature vectors on kernel values.
K(xi,x) = exp[−γ||xi − x||2]
One full response–recovery measurement was treated as one sample. A total of 100 datasets were acquired, including measurement results from standard CO2 gas and practical gas samples. For standard gas samples, the known CO2 concentrations were adopted as labels, while for practical gas samples, the CO2 concentrations determined by the spectroscopic method were used as labels. Seventy datasets were assigned to the training set to build the mapping relationship between sensing features and CO2 concentration, and the remaining thirty datasets formed the test set to evaluate the model’s concentration prediction performance on unseen samples. All features were fed directly into the model using their raw extracted values, and default software settings were adopted for model parameters.
After model training and testing, independently collected gas samples from imbibed rice seeds were used for external validation. Input vectors were obtained following the identical feature extraction procedure. The trained SVR model was applied to predict CO2 concentrations, and the predicted values were compared with spectroscopic reference results of the same batch of gas samples to assess the quantitative detection performance of this assisted calibration method for practical gas samples.
To evaluate the deviation between the sensing measurement results and spectroscopic reference results, the absolute value of relative error was adopted as the evaluation index, and the calculation formula is
where cs is the CO2 concentration obtained by conventional response-based calibration or SVR-assisted calibration, and cref is the spectroscopic reference concentration of gas samples from the same batch.
As shown in Rows 3 and 4 of Table 2, the absolute values of relative error for SVR-assisted calibration were 28.75% and 37.38%, with an average value of 33.07%. The average absolute relative error of the conventional response-based calibration group was 97.55%. Compared with the conventional method, the SVR-assisted calibration reduced the error by approximately 66.10%, demonstrating the error improvement in multi-parameter assisted calibration in the actual gas sample detection in this work.
On the basis of the gas-sensing response signal provided by Au–Pt/PFO, SVR-assisted calibration comprehensively utilizes information including response amplitude, response–recovery time, response rate and integral area to establish the mapping relationship between multi-parameter features and CO2 concentration. The independent gas sample validation results indicate that the strategy combining material sensing and multi-parameter assisted calibration can improve the prediction performance of CO2 concentration for gas samples from rice seed imbibition measured in this study.
3.6. CO2 Gas-Sensing Mechanism
The CO2 sensing behavior of Au–Pt/PFO can be interpreted in terms of surface adsorption, interfacial charge modulation, and changes in hole-conduction pathways. PFO is a p-type semiconductor with holes as the majority charge carriers. Gas–surface interactions can modify surface electronic states and interfacial charge distributions, thereby modulating near-surface conduction and interparticle charge transport to produce a measurable resistance response.
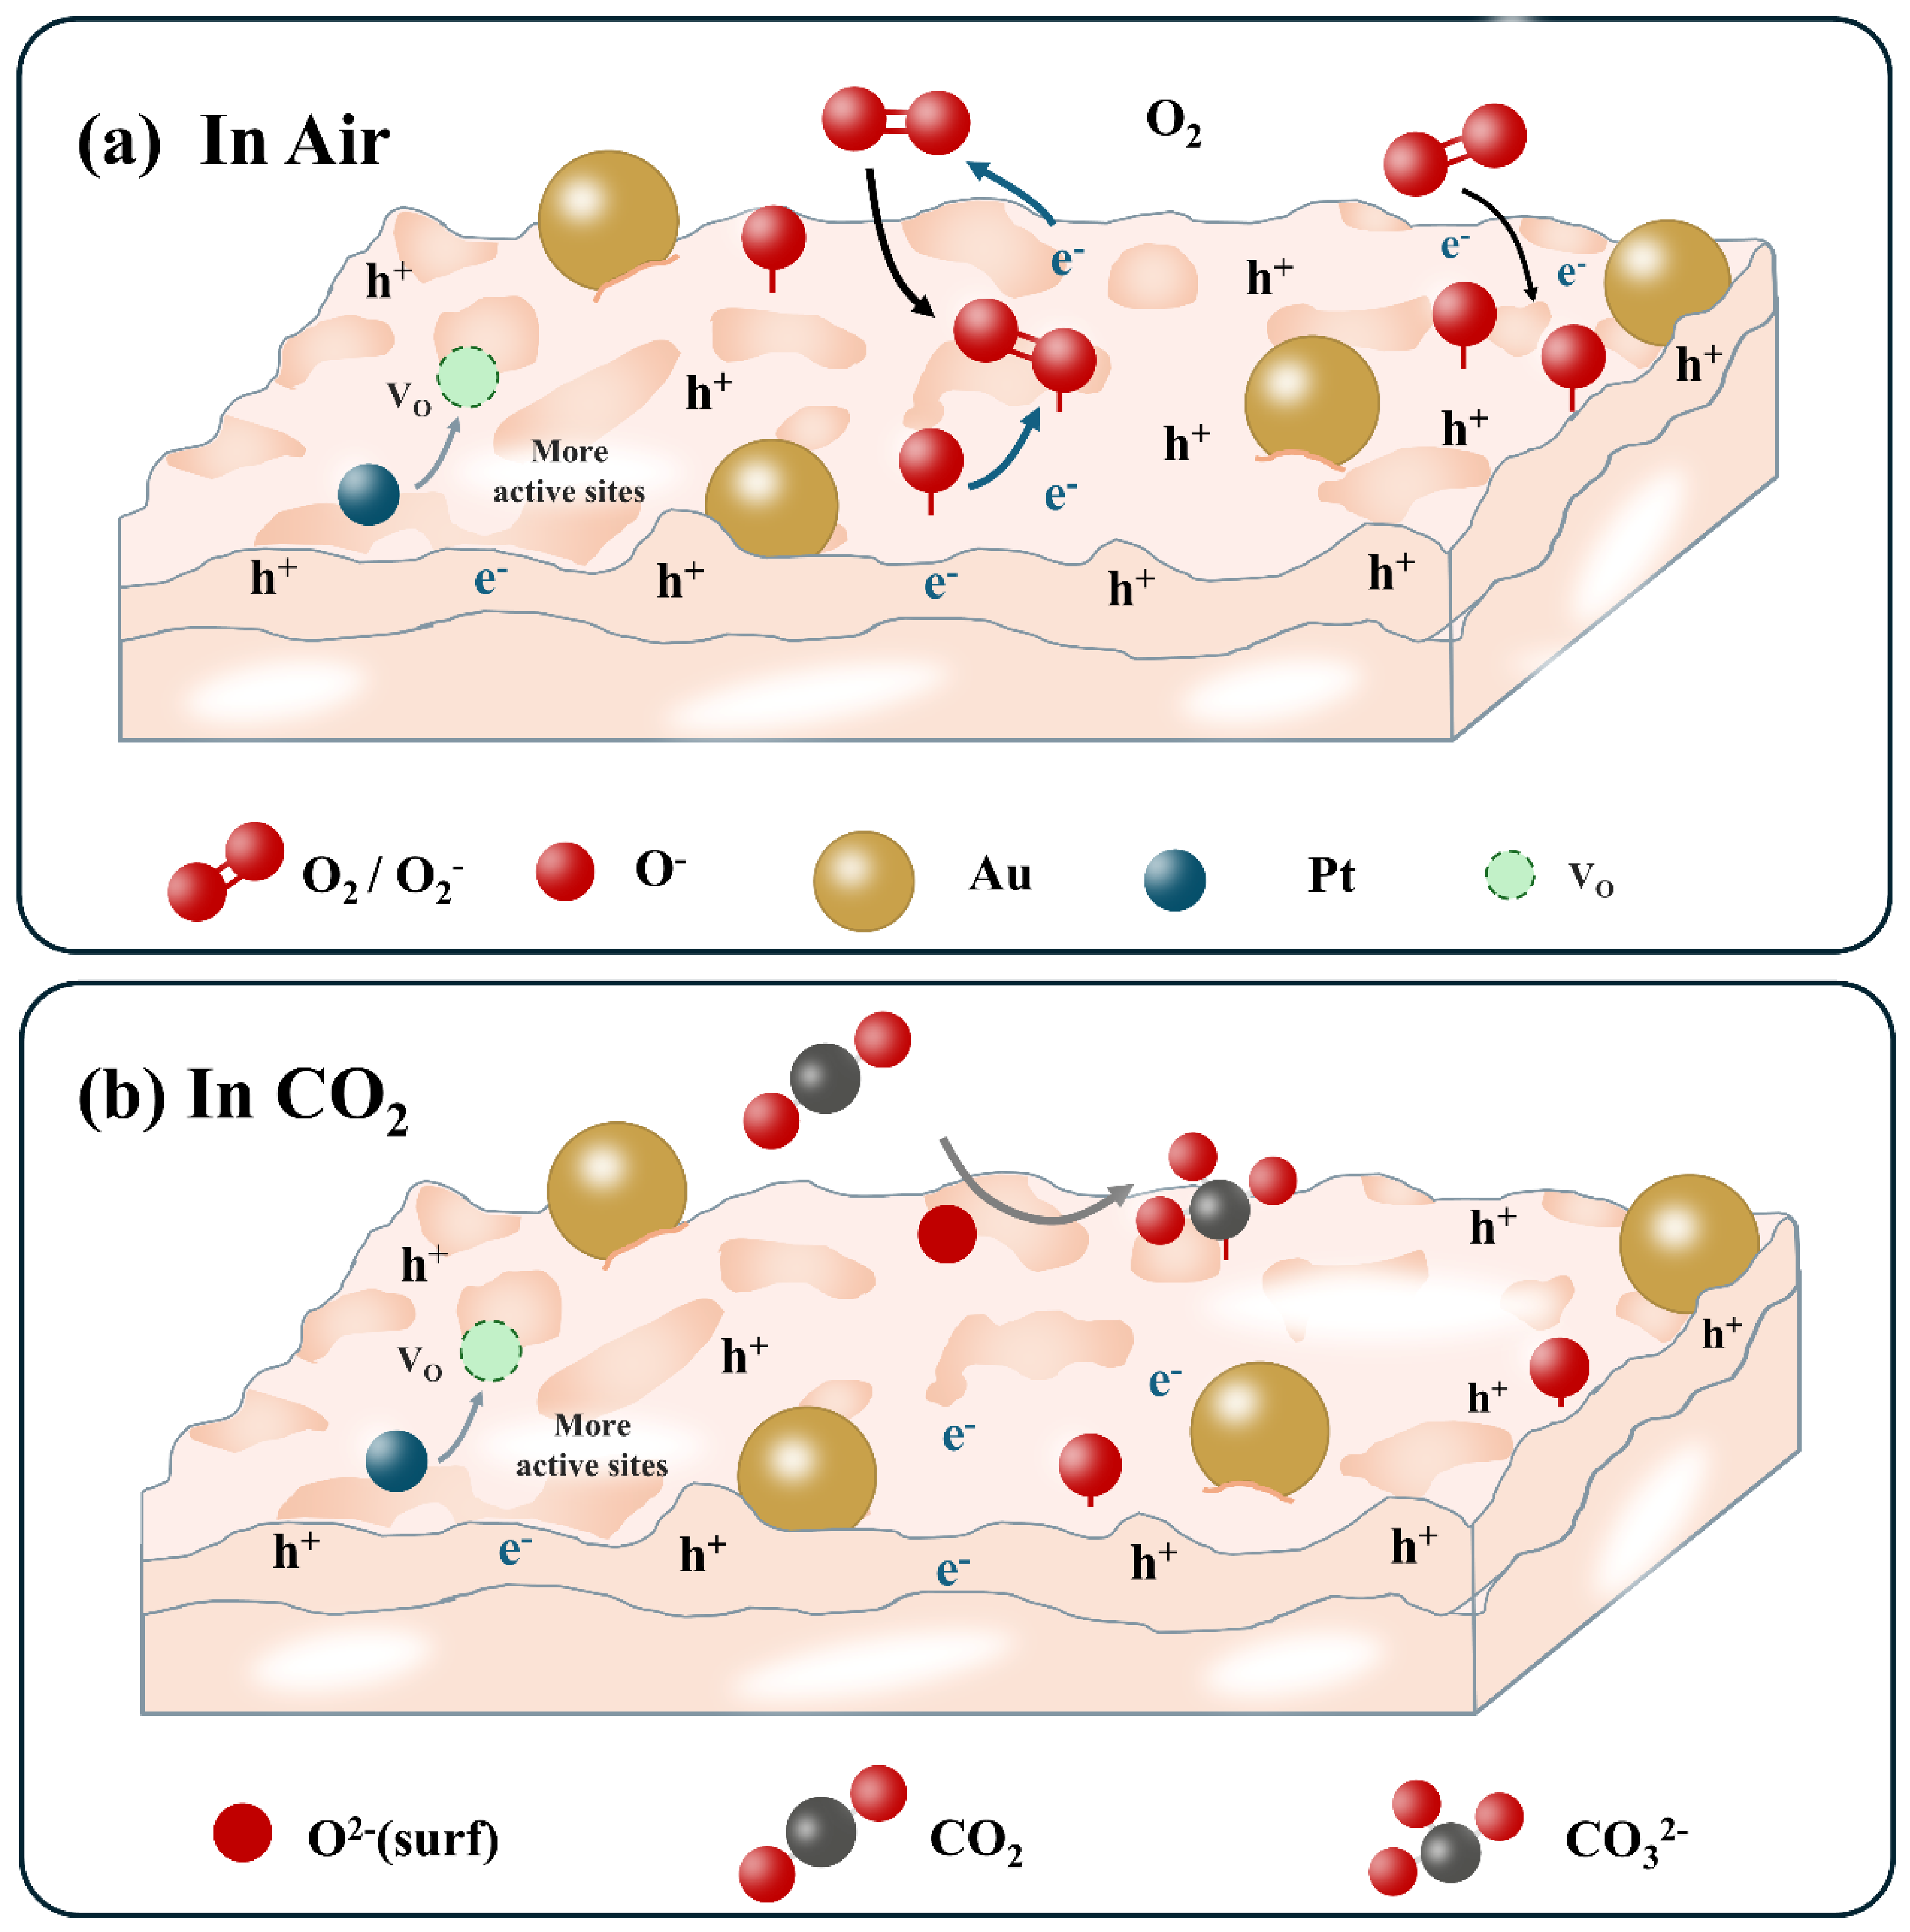
In air, oxygen molecules adsorb on the material surface and capture electrons to form ionized adsorbed oxygen species. The associated processes can be expressed as
O2(gas)⇌O2(ads)
Here, gas and ads denote the gas phase and the adsorbed state, respectively. Electron capture associated with oxygen adsorption increases the near-surface hole concentration in PFO, forming a hole accumulation layer that enhances surface conductivity and contributes to establishing the baseline resistance in air.
Upon CO2 exposure, CO2 can bind to basic oxygen sites on the material surface to form adsorbed carbonate species. The corresponding surface reaction can be expressed as
Here, O2−(surf) denotes a basic surface oxygen site participating in carbonate formation, and (ads) denotes an adsorbed carbonate species. This charge-balanced reaction describes the reversible binding of CO2 at surface oxygen sites, linking gas-phase CO2 to the surface adsorption state.
The formation of carbonate-related adsorption states can modify the chemical environment of surface species, the local electronic structure, and the surface potential, thereby affecting the near-surface hole distribution in PFO and charge transport at particle contacts. Within the p-type surface-conduction model illustrated in Figure 6, this adsorption-induced modulation involves a reduced effective contribution of holes to electrical conduction and changes in interfacial transport conditions, consistent with the experimentally observed decrease in conductance and increase in resistance upon CO2 exposure. Upon re-exposure to air, the surface adsorption equilibrium and charge distribution progressively recover, and the material resistance returns toward its initial level.
Figure 6.
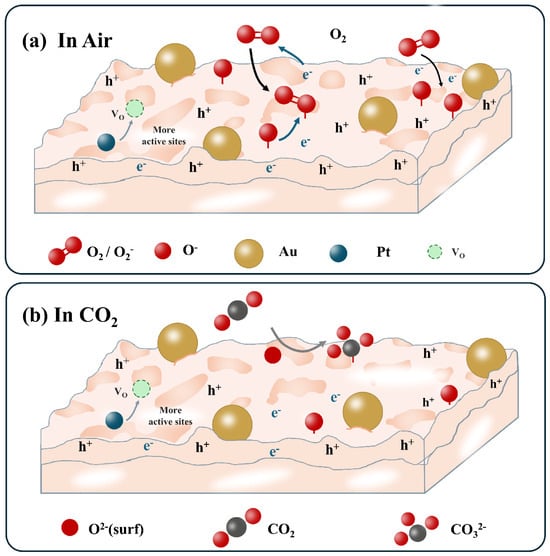
Schematic illustration of the proposed surface adsorption and interfacial charge-modulation mechanism of the Au–Pt/PFO sensor in (a) air and (b) a CO2 atmosphere. The carrier distributions qualitatively illustrate the proposed p-type surface-conduction model.
At 190 °C, Au/PFO exhibits a baseline resistance in air of 21.36 MΩ, lower than the 36.69 MΩ of PFO, indicating that Au modification changes the initial conduction state of the material. Charge redistribution at Au–oxide interfaces can modulate the carrier distribution and transport conditions in adjacent regions, allowing adsorption-induced changes in surface electronic states to further affect the material resistance [20]. This interfacial electronic sensitization provides a basis for interpreting the changes in the baseline resistance and CO2 response of Au/PFO.
Pt active sites can promote oxygen adsorption and dissociation, while activated oxygen species can migrate to the adjacent oxide surface through spillover, modifying surface oxygen coverage and gas–surface interactions [21]. Pt–oxide interfaces can also alter charge-transport conditions and influence gas-sensing behavior together with oxygen adsorption [22]. Within the mechanistic model for Au–Pt/PFO, Pt-assisted oxygen activation and interfacial modulation provide a further explanation for the changes in the CO2 response and response–recovery kinetics.
Interparticle pores in Au–Pt/PFO provide pathways for gas penetration into the sensing layer and access to the material surface. Its BET-specific surface area reaches 16.26 m2/g, approximately 3.54 times that of PFO, providing favorable conditions for contact between the gas and the sensing layer. Changes in the O 1s spectral profile further reflect an altered surface oxygen chemical environment following co-modification. Meanwhile, the baseline resistance of Au–Pt/PFO in air decreases to 14.26 MΩ at 190 °C. The lower baseline resistance in air and the larger response ratio, S = Rg/Ra, jointly reflect the modified initial conduction state and the gas-induced relative resistance change following co-modification. Taken together, the structural and surface characterization results and resistance measurements support an interpretation of the CO2 response of Au–Pt/PFO in terms of concurrent changes in surface accessibility, the state of oxygen-containing species, and interfacial conduction conditions.
4. Conclusions
In this study, Au–Pt/PFO sensing material was synthesized via the citric acid sol–gel method. With PFO, Au/PFO and Pt/PFO as control samples, the effect of noble-metal modification on CO2 gas-sensing performance was investigated. At 190 °C under 1000 ppm CO2, the response value of Au–Pt/PFO reaches 9.68, which is approximately 2.61 times that of pristine PFO. Its response time and recovery time are 22.38 s and 16.37 s, respectively. Meanwhile, Au–Pt/PFO exhibits excellent repeatability and long-term stability toward CO2. Combined with material characterization and gas-sensing results, the enhanced response of Au–Pt/PFO can be interpreted from three aspects: enlarged accessible surface area, surface reactions involving adsorbed oxygen, and charge modulation at the metal–oxide interface.
Furthermore, the Au–Pt/PFO-based sensor was applied to detect short-term respiratory gas samples from rice seeds during imbibition. An SVR-assisted calibration model was constructed by using multi-parameter features extracted from response–recovery curves. Taking spectroscopic measurement results as the reference, among different batches of gas samples in this work, the average absolute relative error of the conventional response-based calibration group is 97.55%, while that of the SVR-assisted calibration group on independent validation gas samples is 33.07%. The relative reduction in average error between the two groups is approximately 66.10%. These results demonstrate that on the basis of improved gas-sensing response signals of Au–Pt/PFO, auxiliary calibration that comprehensively utilizes response amplitude and dynamic characteristics can boost the prediction performance of CO2 concentration for the practical gas samples measured in this study.
Author Contributions
Methodology, H.Z.; software, Y.L. and Y.Z.; validation, Y.L., Y.Z. and Z.L.; formal analysis, H.Z. and F.C.; writing—original draft preparation, H.Z. and Y.Z.; writing—review and editing, H.Z., Y.L., Y.Z. and F.C.; funding acquisition, H.Z., Z.L. and F.C. All authors have read and agreed to the published version of the manuscript.
Funding
This research was funded by Doctoral Research Fund of Shandong Jianzhu University (X25162); Taishan Scholar Program (tsqn202306238); Shandong Top Talent Special Foundation (0031504).
Institutional Review Board Statement
Not applicable.
Informed Consent Statement
Not applicable.
Data Availability Statement
The original contributions presented in this study are included in the article. Further inquiries can be directed to the corresponding author.
Conflicts of Interest
The authors declare that they have no conflicts of interest.
References
- Guo, G.; Li, L.; Zhou, Y.; Gong, T.; Tian, Y.; Sun, X.; Cui, J.; Shi, S.; Guo, Z.; He, X.; et al. High-Sensitivity Differential Helmholtz Photoacoustic System Combined with the Herriott Multipass Cell and Its Application in Seed Respiration. Anal. Chem. 2024, 96, 7730–7737. [Google Scholar] [CrossRef] [Scilit] [PubMed]
- Gao, L.; Xu, Q.; He, J.; Jia, L.; Zhao, G.; Ma, S.; Zhang, X. Correlation between rice (Oryza sativa L.) seed respiration and vigor. Ciênc. Rural 2026, 56, e20240571. [Google Scholar] [CrossRef] [Scilit]
- Yan, M.; Wu, Y.; Hua, Z.; Lu, N.; Sun, W.; Zhang, J.; Fan, S. Humidity compensation based on power-law response for MOS sensors to VOCs. Sens. Actuators B Chem. 2021, 334, 129601. [Google Scholar] [CrossRef] [Scilit]
- Wang, Z.; Zhang, Y.; Huang, X.; Wang, H.; Zhao, J.; Li, C.; Zhu, M.; Chen, K. Miniature mid-infrared photoacoustic gas sensor for detecting dissolved carbon dioxide in seawater. Sens. Actuators B Chem. 2024, 405, 135370. [Google Scholar] [CrossRef] [Scilit]
- Ng, D.K.T.; Xu, L.; Chen, W.; Wang, H.; Gu, Z.; Chia, X.X.; Fu, Y.H.; Jaafar, N.; Ho, C.P.; Zhang, T.; et al. Miniaturized CO2 Gas Sensor Using 20% ScAlN-Based Pyroelectric Detector. ACS Sens. 2022, 7, 2345–2357. [Google Scholar] [CrossRef] [Scilit] [PubMed]
- Xin, F.; Li, J.; Guo, J.; Yang, D.; Wang, Y.; Tang, Q.; Liu, Z. Measurement of Atmospheric CO2 Column Concentrations Based on Open-Path TDLAS. Sensors 2021, 21, 1722. [Google Scholar] [CrossRef] [Scilit] [PubMed]
- El-Safoury, M.; Weber, C.; Yassine, H.; Wöllenstein, J.; Schmitt, K. Towards a Miniaturized Photoacoustic Sensor for Transcutaneous CO2 Monitoring. Sensors 2024, 24, 457. [Google Scholar] [CrossRef] [Scilit] [PubMed]
- Gao, L.; Zang, Y.; Zhao, G.; Qi, H.; Tang, Q.; Liu, Q.; Jia, L. Research on the Seed Respiration CO2 Detection System Based on TDLAS Technology. Int. J. Opt. 2023, 2023, 8017726. [Google Scholar] [CrossRef] [Scilit]
- Xia, Y.; Pan, A.; Su, Y.-Q.; Zhao, S.; Li, Z.; Davey, A.K.; Zhao, L.; Maboudian, R.; Carraro, C. In-situ synthesized N-doped ZnO for enhanced CO2 sensing: Experiments and DFT calculations. Sens. Actuators B Chem. 2022, 357, 131359. [Google Scholar] [CrossRef] [Scilit]
- Kanaparthi, S.; Singh, S.G. Chemiresistive Sensor Based on Zinc Oxide Nanoflakes for CO2 Detection. ACS Appl. Nano Mater. 2019, 2, 700–706. [Google Scholar] [CrossRef] [Scilit]
- Taylor, F.H.; Buckeridge, J.; Catlow, C.R.A. Defects and Oxide Ion Migration in the Solid Oxide Fuel Cell Cathode Material LaFeO3. Chem. Mater. 2016, 28, 8210–8220. [Google Scholar] [CrossRef] [Scilit]
- Platonov, V.; Malinin, N.; Filatova, D.; Sapkov, I.; Rumyantseva, M. Electrospun (La,Ba)FeO3 Nanofibers as Materials for Highly Sensitive VOC Gas Sensors. Sensors 2025, 25, 2790. [Google Scholar] [CrossRef] [Scilit] [PubMed]
- Su, X.; Shan, H.; Tian, Y.; Guo, W.; Zhao, P.; Xue, L.; Zhang, Y. Enhancing the sensitivity of Co-doped LaFeO3 thick-film sensors for low-concentration CO2 detection: Investigating the synergistic effect of complex defects and adsorbed oxygen. J. Environ. Chem. Eng. 2025, 13, 116517. [Google Scholar] [CrossRef] [Scilit]
- Su, X.; Shan, H.; Tian, Y.; Guo, W.; Zhao, P.; Xue, L.; Zhang, Y. Enhanced low-concentration CO2 sensing performance for Sr- and Co-doped LaFeO3 thick film sensors by oxygen-enriched atmosphere after vacuum annealing. Sens. Actuators B Chem. 2025, 437, 137736. [Google Scholar] [CrossRef] [Scilit]
- Duan, X.; Jiang, Y.; Liu, B.; Duan, Z.; Zhang, Y.; Yuan, Z.; Tai, H. Enhancing the carbon dioxide sensing performance of LaFeO3 by Co doping. Sens. Actuators B Chem. 2024, 402, 135136. [Google Scholar] [CrossRef] [Scilit]
- Bharati, K.; Tiwari, P.R.; Singh, R.P.; Bala; Singh, A.; Yadav, B.C.; Kumar, S. Cobalt-doped praseodymium ortho ferrite as a promising nanomaterial for carbon dioxide gas sensing. J. Mater. Chem. C 2023, 11, 15581–15590. [Google Scholar] [CrossRef] [Scilit]
- Sui, N.; Wei, X.; Cao, S.; Zhang, P.; Zhou, T.; Zhang, T. Nanoscale Bimetallic AuPt-Functionalized Metal Oxide Chemiresistors: Ppb-Level and Selective Detection for Ozone and Acetone. ACS Sens. 2022, 7, 2178–2187. [Google Scholar] [CrossRef] [Scilit] [PubMed]
- Shen, J.; Xu, S.; Zhao, C.; Qiao, X.; Liu, H.; Zhao, Y.; Wei, J.; Zhu, Y. Bimetallic Au@Pt Nanocrystal Sensitization Mesoporous α-Fe2O3 Hollow Nanocubes for Highly Sensitive and Rapid Detection of Fish Freshness at Low Temperature. ACS Appl. Mater. Interfaces 2021, 13, 57597–57608. [Google Scholar] [CrossRef] [Scilit] [PubMed]
- Han, W.; Yang, J.; Jiang, B.; Wang, X.; Wang, C.; Guo, L.; Sun, Y.; Liu, F.; Sun, P.; Lu, G. Conductometric ppb-Level CO Sensors Based on In2O3 Nanofibers Co-Modified with Au and Pd Species. Nanomaterials 2022, 12, 3267. [Google Scholar] [CrossRef] [Scilit] [PubMed]
- Rai, P.; Khan, R.; Raj, S.; Majhi, S.M.; Park, K.-K.; Yu, Y.-T.; Lee, I.-H.; Sekhar, P.K. Au@Cu2O core–shell nanoparticles as chemiresistors for gas sensor applications: Effect of potential barrier modulation on the sensing performance. Nanoscale 2014, 6, 581–588. [Google Scholar] [CrossRef] [Scilit] [PubMed]
- Cho, H.-J.; Chen, V.T.; Qiao, S.; Koo, W.-T.; Penner, R.M.; Kim, I.-D. Pt-Functionalized PdO Nanowires for Room Temperature Hydrogen Gas Sensors. ACS Sens. 2018, 3, 2152–2158. [Google Scholar] [CrossRef] [Scilit] [PubMed]
- Shao, J.; Sun, C.; Pan, G.; Yang, X. Conductometric n-butanol sensor based on Pt-loaded LaFeO3 with 3D hierarchical structure. Sens. Actuators B Chem. 2024, 417, 136086. [Google Scholar] [CrossRef] [Scilit]
- De Vito, S.; Castaldo, A.; Loffredo, F.; Massera, E.; Polichetti, T.; Nasti, I.; Vacca, P.; Quercia, L.; Di Francia, G. Gas concentration estimation in ternary mixtures with room temperature operating sensor array using tapped delay architectures. Sens. Actuators B Chem. 2007, 124, 309–316. [Google Scholar] [CrossRef] [Scilit]
- De Vito, S.; Esposito, E.; Salvato, M.; Popoola, O.; Formisano, F.; Jones, R.; Di Francia, G. Calibrating chemical multisensory devices for real world applications: An in-depth comparison of quantitative machine learning approaches. Sens. Actuators B Chem. 2018, 255, 1191–1210. [Google Scholar] [CrossRef] [Scilit]
- Zhang, H.; Li, Z.; Chen, F. Mg-doped and Pt-modified NdFeO3 with machine learning for advanced CO2 detection. Ceram. Int. 2025, 51, 29930–29937. [Google Scholar] [CrossRef] [Scilit]
- Lewis, B.F.; Huang, C.; Itskou, I.; Mallia, G.; Harrison, N.M.; Southouse, J.; Eslava, S. Ca-Doped PrFeO3 Photocathodes with Enhanced Photoelectrochemical Activity. Sol. RRL 2024, 8, 2400308. [Google Scholar] [CrossRef] [Scilit]
- He, J.; Wang, T.; Bi, X.; Tian, Y.; Huang, C.; Xu, W.; Hu, Y.; Wang, Z.; Jiang, B.; Gao, Y.; et al. Subsurface A-site vacancy activates lattice oxygen in perovskite ferrites for methane anaerobic oxidation to syngas. Nat. Commun. 2024, 15, 5422. [Google Scholar] [CrossRef] [Scilit] [PubMed]
- Rossi, A.; Fabbri, B.; Spagnoli, E.; Gaiardo, A.; Valt, M.; Ferroni, M.; Ardit, M.; Krik, S.; Pedrielli, A.; Vanzetti, L.; et al. Functionalization of Indium Oxide for Empowered Detection of CO2 over an Extra-Wide Range of Concentrations. ACS Appl. Mater. Interfaces 2023, 15, 33732–33743. [Google Scholar] [CrossRef] [Scilit] [PubMed]
- Xiong, Y.; Xue, Q.; Ling, C.; Lu, W.; Ding, D.; Zhu, L.; Li, X. Effective CO2 detection based on LaOCl-doped SnO2 nanofibers: Insight into the role of oxygen in carrier gas. Sens. Actuators B Chem. 2017, 241, 725–734. [Google Scholar] [CrossRef] [Scilit]
- Kodu, M.; Avarmaa, T.; Mändar, H.; Saar, R.; Jaaniso, R. Structure-Dependent CO2 Gas Sensitivity of La2O2CO3 Thin Films. J. Sens. 2017, 2017, 9591081. [Google Scholar] [CrossRef] [Scilit]
- Lee, Z.Y.; Hawari, H.F.b.; Djaswadi, G.W.b.; Kamarudin, K. A Highly Sensitive Room Temperature CO2 Gas Sensor Based on SnO2-rGO Hybrid Composite. Materials 2021, 14, 522. [Google Scholar] [CrossRef] [Scilit] [PubMed]
- Kulkarni, A.; Satbhai, M.; Li, W.; Bornare, D.; Syed, K.; Joshi, S. Oleic acid induced tailored morphological features and structural defects in CuO for multifunctional applications. Mater. Adv. 2022, 3, 418–436. [Google Scholar] [CrossRef] [Scilit]
- Soltabayev, B.; Raiymbekov, Y.; Nuftolla, A.; Turlybekuly, A.; Yergaliuly, G.; Mentbayeva, A. Sensitivity Enhancement of CO2 Sensors at Room Temperature Based on the CZO Nanorod Architecture. ACS Sens. 2024, 9, 1227–1238. [Google Scholar] [CrossRef] [Scilit] [PubMed]
- Li, G.; Hilal, M.; Kim, H.; Lee, J.; Chen, Z.; Li, B.; Cui, Y.; Hou, J.; Cai, Z. Selective CO2 Detection at Room Temperature with Polyaniline/SnO2 Nanowire Composites. Coatings 2024, 14, 1590. [Google Scholar] [CrossRef] [Scilit]
- Saad, R.; Abdelkarem, K.; El Sayed, A.M.; Shaban, M.; Ahmed, I.A.; Tammam, M.T.; Hamdy, H. Characterization and enhanced carbon dioxide sensing performance of spin-coated Na- and Li-doped and Co-doped cobalt oxide thin films. RSC Adv. 2024, 14, 36852–36867. [Google Scholar] [CrossRef] [Scilit] [PubMed]
- Mahor, Y.; Koziej, D.; Zito, C.A. Room-Temperature Carbon Dioxide Gas Sensor Based on Co-Ferrite Nanoparticles. ACS Omega 2026, 11, 13676–13683. [Google Scholar] [CrossRef] [Scilit] [PubMed]

Disclaimer/Publisher’s Note: The statements, opinions and data contained in all publications are solely those of the individual author(s) and contributor(s) and not of MDPI and/or the editor(s). MDPI and/or the editor(s) disclaim responsibility for any injury to people or property resulting from any ideas, methods, instructions or products referred to in the content. |
© 2026 by the authors. Licensee MDPI, Basel, Switzerland. This article is an open access article distributed under the terms and conditions of the Creative Commons Attribution (CC BY) license.